UNITED STATES
SECURITIES AND EXCHANGE COMMISSION
Washington, D.C. 20549
FORM N-CSR
CERTIFIED SHAREHOLDER REPORT OF REGISTERED
MANAGEMENT INVESTMENT COMPANIES
Investment Company Act File Number: 811-21055
| T. Rowe Price Institutional Income Funds, Inc. |
|
| (Exact name of registrant as specified in charter) |
| |
| 100 East Pratt Street, Baltimore, MD 21202 |
|
| (Address of principal executive offices) |
| |
| David Oestreicher |
| 100 East Pratt Street, Baltimore, MD 21202 |
|
| (Name and address of agent for service) |
Registrant’s telephone number, including area code: (410) 345-2000
Date of fiscal year end: May 31
Date of reporting period: May 31, 2022
Item 1. Reports to Shareholders
(a) Report pursuant to Rule 30e-1.
| Institutional Long Duration Credit Fund | May 31, 2022 |
| T. ROWE PRICE Institutional Long Duration Credit Fund |
|
HIGHLIGHTS
| ■ | The Institutional Long Duration Credit Fund outperformed its benchmark in the 12-month period ended May 31, 2022. |
| | |
| ■ | In investment-grade (IG) corporates, our greater emphasis on intermediate-maturity bonds helped as longer-dated corporates underper-formed amid increased risk aversion and investor concerns about rising rates. |
| | |
| ■ | Broadly speaking, the fund reduced exposure in IG corporate bonds and taxable municipal debt while adding to U.S. Treasuries. |
| | |
| ■ | The current environment doesn’t yet appear conducive to adding risk; however, we look to earn yield in the portfolio above the bench-mark and to take advantage of the pricing inefficiencies that are prevalent in fixed income markets. |
Log in to your account at troweprice.com for more information.
*Certain mutual fund accounts that are assessed an annual account service fee can also save money by switching to e-delivery.
Market Commentary
Dear Investor
Global stock markets produced mostly negative returns during your fund’s fiscal year, the 12-month period ended May 31, 2022, while rising bond yields weighed on returns for fixed income investors. Positive sentiment surrounding the recovering economy and corporate earnings growth in the first half of the period gave way to fears about new coronavirus variants, rising interest rates, soaring inflation, and geopolitical turmoil in the second half.
Nearly all major global and regional equity benchmarks receded during the period. Value shares outperformed growth stocks as equity investors turned risk averse and rising rates put downward pressure on growth stock valuations. Sector performance diverged widely, with communication services and consumer discretionary companies suffering amid the value rotation. Meanwhile, energy stocks registered exceptional returns as oil prices jumped in response to Russia’s invasion of Ukraine and the ensuing commodity supply crunch.
Financial markets entered the period on an upbeat note as an improving labor market and renewed stimulus efforts were reflected in higher consumer spending. A robust increase in corporate earnings growth also drove markets for much of 2021. However, earnings tailwinds showed signs of fading heading into 2022, as certain high-profile companies issued weaker-than-expected earnings reports or financial projections.
In November 2021, the emergence of the omicron variant of the coronavirus prompted worries about the economic outlook and the potential that a resurgence in cases could lead to further supply chain disruptions. While omicron variant trends and restrictions eased in most regions early in 2022, China continued to pursue a “zero COVID” policy, resulting in large-scale lockdowns and industrial production disruptions.
In February 2022, markets were caught further by surprise when Russia launched a large-scale military offensive into Ukraine. The strong sanctions on Russia that followed raised concerns about supply chains already stressed by the coronavirus. In March, the White House announced that the U.S. was cutting off all oil imports from Russia. As a result, oil prices surged to their highest level in over a decade.
Concerns about inflation intensified over much of the period, driven in part by events in Ukraine and China. Along with supply chain problems, the impact of the fiscal and monetary stimulus enacted during the pandemic and the release of pent-up demand for travel, recreation, and other services also pushed prices higher. In the U.S., consumer prices rose 8.2% in April versus the year before, near multi-decade highs, driven by accelerating energy and food prices. In March, the U.S. Federal Reserve approved its first interest rate hike in more than three years and signaled an accelerating pace of rate increases ahead to combat inflation. In addition, the Fed ended its purchases of Treasuries and agency mortgage-backed securities during the period and announced plans to begin reducing its balance sheet.
Bond indexes were broadly negative as yields rose across the U.S. Treasury yield curve amid surging inflation and expectations of aggressive monetary tightening. (Bond yields and prices move in opposite directions.) Investment-grade corporate bonds fared particularly poorly, experiencing significant losses as concerns over a potential slowdown in economic growth took hold.
The challenges global markets face are complex and could drive market volatility as we enter the second half of the year. Our investment teams will be closely monitoring the Fed’s actions as the central bank attempts to use interest rate hikes to tame inflation without stifling economic growth. Meanwhile, we remain focused on the ongoing geopolitical and humanitarian crisis in Ukraine, which continues to disrupt supply chains, increase inflationary pressures, and dampen consumer confidence.
During challenging times like these, I am heartened by our firm’s long-term focus and time-tested investment approach. I also recognize that market volatility and sector rotation historically have presented attractive opportunities for active investors. I remain confident in the ability of our global research organization to uncover compelling investment ideas that can help deliver strong long-term risk-adjusted performance as market conditions normalize.
Thank you for your continued confidence in T. Rowe Price.
Sincerely,

Robert Sharps
CEO and President
Management’s Discussion of Fund Performance
INVESTMENT OBJECTIVE
The fund seeks to provide high income.
FUND COMMENTARY
How did the fund perform in the past 12 months?
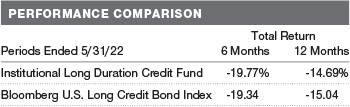
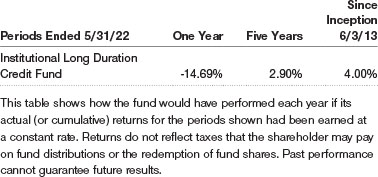
The Institutional Long Duration Credit Fund returned-14.69% in the 12 months ended May 31, 2022, outperforming its benchmark, the Bloomberg U.S. Long Credit Bond Index. (Past performance cannot guarantee future results.)
What factors influenced the fund’s performance?
The U.S. long duration credit market, as measured by the Bloomberg U.S. Long Credit Bond Index, produced a deeply negative return for the reporting period as sharply rising U.S. Treasury yields and rising credit spreads over the past six months significantly weighed on the long duration credit space. (Credit spreads measure the additional yield that investors demand for holding a bond with credit risk over a similar‑maturity, high‑quality government security.) Treasury yields spiked as investors priced in increasingly hawkish sentiment from the Federal Reserve in response to rising inflation. Rising rates weighed on total returns for all the major sectors in the benchmark, while credit spreads generally widened as the Russian invasion of Ukraine and growing fears of a hard economic landing exacerbated already weakening risk sentiment.
Both security selection and sector allocations contributed for the period. In investment-grade (IG) corporates, our greater emphasis on intermediate-maturity bonds helped as longerdated corporates underperformed amid increased risk aversion and investor concerns about rising rates.
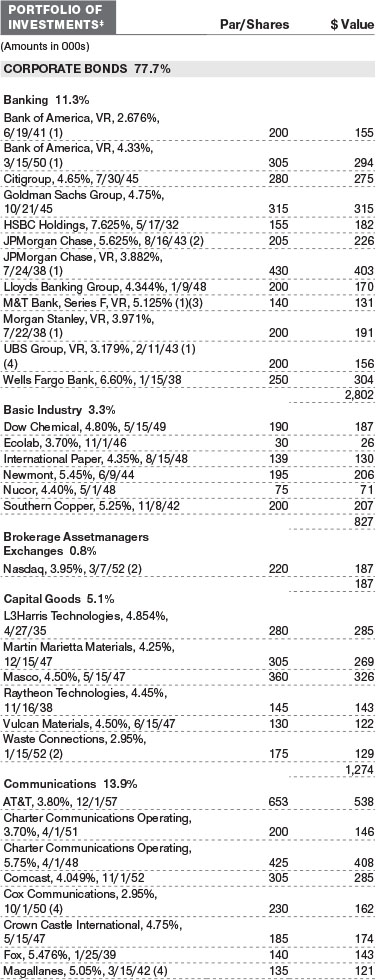
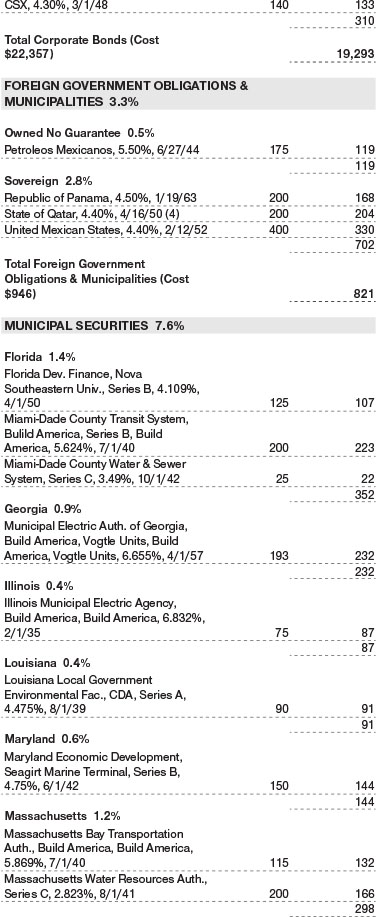
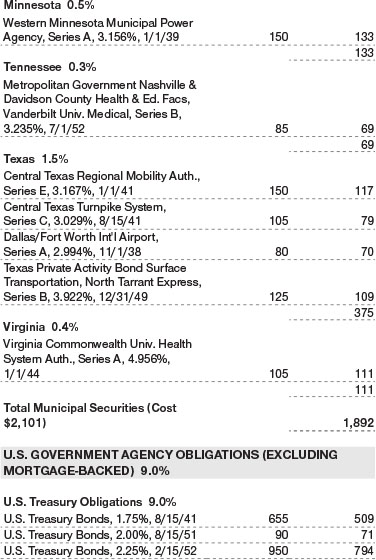
Credit selection within the government-related sector was also positive. Some taxable municipal bonds aided performance as lighter issuance provided technical support to the sector. Some investors were attracted to taxable munis as a higher-quality source of yield. Additionally, some emerging markets exposure in sovereign and quasi-sovereign debt helped, especially in issuers that benefited from the rise in oil prices, such as Mexico and Mexico’s state-owned oil firm Pemex, along with Qatar. (Please refer to the portfolio of investments for a complete list of holdings and the amount each represents in the portfolio.)
The fund’s duration positioning was positive. The portfolio started the fiscal year with a longer duration posture relative to the benchmark when yields were more stable and/or falling. However, we shifted to a shorter-than-benchmark duration positioning in late 2021 when yields started climbing.
The fund held material exposure to credit derivatives during the period, which had a marginally negative effect on both relative and absolute returns.
How is the fund positioned?
Broadly speaking, the fund reduced exposure in investment-grade corporate bonds and taxable municipal debt. However, we added to index-level credit default swaps as these highly liquid positions can be more easily traded as risk sentiment changes. IG corporate credit spreads widened throughout most of 2022. While spreads were at more attractive levels, we felt it was imprudent to add more exposure to credit risk with the Fed intent on tightening policy, economic growth expected to slow in coming quarters, and geopolitical risks having the potential to keep investors on edge. We continued to moderate our holdings in taxable municipal securities as well.
As volatility increased, we rotated assets into long-term U.S. Treasuries. We maintained an ample position in Treasuries to provide the portfolio with liquidity and enable us to quickly take advantage of any price dislocations in the long duration credit space that may develop. With increasing concerns for slowing economic growth beginning to overshadow worries about inflation, Treasuries could hold up well if there is a flight to quality.
We also added to a basket of U.S. dollar-denominated emerging market sovereign names that our internal analysts identified as potentially representing attractive value after recent underperformance.
Portfolio duration ended the period marginally longer than the benchmark after being slightly shorter, on average, over the past six months. We believe upward pressure on rates from tighter Fed policy is balanced with expectations for a deceleration in economic growth and a gradual easing of inflation pressures
What is portfolio management’s outlook?
Treasury yields have significantly increased in reaction to signals from the Fed that it will be aggressive in tightening policy to fight still-elevated inflation, and we believe rates could remain volatile as investors adjust to central bank policy that appears intent on expeditiously tightening financial conditions that remain too loose for the current environment.
In our view, the path of interest rates is likely to follow the path of growth going forward. Tight labor markets and stubbornly high inflation are likely to keep the Fed on pace for a steeper tightening cycle than investors have seen in decades. With rate hikes now expected at every upcoming meeting this year, even after the 75-basis-point hike at the June meeting held shortly after period-end, investors are struggling to assess how far the Fed can go before policy becomes overly restrictive.
While the economy should be able to weather rate hikes given strong consumer balance sheets, recession risk has increased, and volatility in both Treasury rates and risk assets is likely to continue as financial conditions turn more restrictive. That said, yields and spreads have risen to more compelling levels that may provide some cushion against further price declines. Volatility could help generate opportunities in credit sectors to buy bonds at relatively attractive valuations, and we are maintaining ample liquidity so that we can add to these opportunities as they arise. The current environment doesn’t yet appear conducive to adding risk; however, we look to earn yield in the portfolio above the benchmark and to take advantage of the pricing inefficiencies that are prevalent in fixed income markets. We remain confident in our investment approach, which is built on a foundation of quantitative portfolio construction elements, augmented with fundamental insights from our deep global credit research platform.
The views expressed reflect the opinions of T. Rowe Price as of the date of this report and are subject to change based on changes in market, economic, or other conditions. These views are not intended to be a forecast of future events and are no guarantee of future results.
RISKS OF INVESTING IN FIXED INCOME SECURITIES
Funds that invest in fixed income securities are subject to price declines due to rising interest rates, with long-term securities generally most sensitive to rate fluctuations. Other risks include credit rating downgrades and defaults on scheduled interest and principal payments. High yield corporate bonds could have greater price declines than funds that invest primarily in high-quality bonds. Companies issuing high yield bonds are not as strong financially as those with higher credit ratings, so the bonds are usually considered speculative investments. International investments can be riskier than U.S. investments because of the adverse effects of currency exchange rates and differences in market structure and liquidity, as well as specific country, regional, and economic developments.
BENCHMARK INFORMATION
Note: Bloomberg® and the Bloomberg U.S. Long Credit Bond Index are service marks of Bloomberg Finance L.P. and its affiliates, including Bloomberg Index Services Limited (“BISL”), the administrator of the index (collectively, “Bloomberg”) and have been licensed for use for certain purposes by T. Rowe Price. Bloomberg is not affiliated with T. Rowe Price, and Bloomberg does not approve, endorse, review, or recommend its products. Bloomberg does not guarantee the timeliness, accurateness, or completeness of any data or information relating to its products.
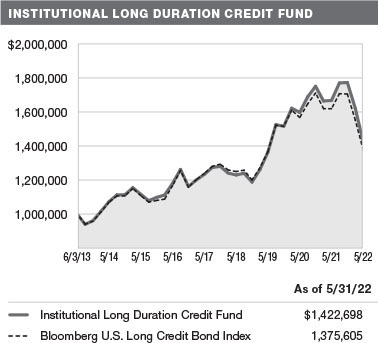
GROWTH OF $1 MILLION
This chart shows the value of a hypothetical $1 million investment in the fund over the past 10 fiscal year periods or since inception (for funds lacking 10-year records). The result is compared with benchmarks, which include a broad-based market index and may also include a peer group average or index. Market indexes do not include expenses, which are deducted from fund returns as well as mutual fund averages and indexes.
AVERAGE ANNUAL COMPOUND TOTAL RETURN
FUND EXPENSE EXAMPLE
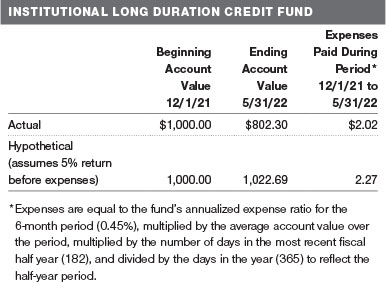
As a mutual fund shareholder, you may incur two types of costs: (1) transaction costs, such as redemption fees or sales loads, and (2) ongoing costs, including management fees, distribution and service (12b-1) fees, and other fund expenses. The following example is intended to help you understand your ongoing costs (in dollars) of investing in the fund and to compare these costs with the ongoing costs of investing in other mutual funds. The example is based on an investment of $1,000 invested at the beginning of the most recent six-month period and held for the entire period.
Actual Expenses
The first line of the following table (Actual) provides information about actual account values and actual expenses. You may use the information on this line, together with your account balance, to estimate the expenses that you paid over the period. Simply divide your account value by $1,000 (for example, an $8,600 account value divided by $1,000 = 8.6), then multiply the result by the number on the first line under the heading “Expenses Paid During Period” to estimate the expenses you paid on your account during this period.
Hypothetical Example for Comparison Purposes
The information on the second line of the table (Hypothetical) is based on hypothetical account values and expenses derived from the fund’s actual expense ratio and an assumed 5% per year rate of return before expenses (not the fund’s actual return). You may compare the ongoing costs of investing in the fund with other funds by contrasting this 5% hypothetical example and the 5% hypothetical examples that appear in the shareholder reports of the other funds. The hypothetical account values and expenses may not be used to estimate the actual ending account balance or expenses you paid for the period.
You should also be aware that the expenses shown in the table highlight only your ongoing costs and do not reflect any transaction costs, such as redemption fees or sales loads. Therefore, the second line of the table is useful in comparing ongoing costs only and will not help you determine the relative total costs of owning different funds. To the extent a fund charges transaction costs, however, the total cost of owning that fund is higher.
QUARTER-END RETURNS


The accompanying notes are an integral part of these financial statements.
May 31, 2022


The accompanying notes are an integral part of these financial statements.
May 31, 2022

The accompanying notes are an integral part of these financial statements.

The accompanying notes are an integral part of these financial statements.
The accompanying notes are an integral part of these financial statements.
| NOTES TO FINANCIAL STATEMENTS |
T. Rowe Price Institutional Income Funds, Inc. (the corporation) is registered under the Investment Company Act of 1940 (the 1940 Act). The Institutional Long Duration Credit Fund (the fund) is a diversified, open-end management investment company established by the corporation. The fund seeks to provide high income.
NOTE 1 - SIGNIFICANT ACCOUNTING POLICIES
Basis of Preparation The fund is an investment company and follows accounting and reporting guidance in the Financial Accounting Standards Board (FASB) Accounting Standards Codification Topic 946 (ASC 946). The accompanying financial statements were prepared in accordance with accounting principles generally accepted in the United States of America (GAAP), including, but not limited to, ASC 946. GAAP requires the use of estimates made by management. Management believes that estimates and valuations are appropriate; however, actual results may differ from those estimates, and the valuations reflected in the accompanying financial statements may differ from the value ultimately realized upon sale or maturity.
Investment Transactions, Investment Income, and Distributions Investment transactions are accounted for on the trade date basis. Income and expenses are recorded on the accrual basis. Realized gains and losses are reported on the identified cost basis. Premiums and discounts on debt securities are amortized for financial reporting purposes. Income tax-related interest and penalties, if incurred, are recorded as income tax expense. Dividends received from mutual fund investments are reflected as dividend income; capital gain distributions are reflected as realized gain/loss. Dividend income and capital gain distributions are recorded on the ex-dividend date. Non-cash dividends, if any, are recorded at the fair market value of the asset received. Distributions to shareholders are recorded on the ex-dividend date. Income distributions are declared daily and paid monthly. A capital gain distribution may also be declared and paid by the fund annually.
Capital Transactions Each investor’s interest in the net assets of the fund is represented by fund shares. The fund’s net asset value (NAV) per share is computed at the close of the New York Stock Exchange (NYSE), normally 4 p.m. ET, each day the NYSE is open for business. However, the NAV per share may be calculated at a time other than the normal close of the NYSE if trading on the NYSE is restricted, if the NYSE closes earlier, or as may be permitted by the SEC. Purchases and redemptions of fund shares are transacted at the next-computed NAV per share, after receipt of the transaction order by T. Rowe Price Associates, Inc., or its agents.
New Accounting Guidance In March 2020, the FASB issued Accounting Standards Update (ASU), ASU 2020–04, Reference Rate Reform (Topic 848) – Facilitation of the Effects of Reference Rate Reform on Financial Reporting, which provides optional, temporary relief with respect to the financial reporting of contracts subject to certain types of modifications due to the planned discontinuation of the London Interbank Offered Rate (LIBOR) and other interbank-offered based reference rates as of the end of 2021. In March 2021, the administrator for LIBOR announced the extension of the publication of a majority of the USD LIBOR settings to June 30, 2023. Management expects that the adoption of the guidance will not have a material impact on the fund’s financial statements.
Indemnification In the normal course of business, the fund may provide indemnification in connection with its officers and directors, service providers, and/or private company investments. The fund’s maximum exposure under these arrangements is unknown; however, the risk of material loss is currently considered to be remote.
NOTE 2 - VALUATION
Fair Value The fund’s financial instruments are valued at the close of the NYSE and are reported at fair value, which GAAP defines as the price that would be received to sell an asset or paid to transfer a liability in an orderly transaction between market participants at the measurement date. The T. Rowe Price Valuation Committee (the Valuation Committee) is an internal committee that has been delegated certain responsibilities by the fund’s Board of Directors (the Board) to ensure that financial instruments are appropriately priced at fair value in accordance with GAAP and the 1940 Act. Subject to oversight by the Board, the Valuation Committee develops and oversees pricing-related policies and procedures and approves all fair value determinations. Specifically, the Valuation Committee establishes policies and procedures used in valuing financial instruments, including those which cannot be valued in accordance with normal procedures or using pricing vendors; determines pricing techniques, sources, and persons eligible to effect fair value pricing actions; evaluates the services and performance of the pricing vendors; oversees the pricing process to ensure policies and procedures are being followed; and provides guidance on internal controls and valuation-related matters. The Valuation Committee provides periodic reporting to the Board on valuation matters.
Various valuation techniques and inputs are used to determine the fair value of financial instruments. GAAP establishes the following fair value hierarchy that categorizes the inputs used to measure fair value:
Level 1 – quoted prices (unadjusted) in active markets for identical financial instruments that the fund can access at the reporting date
Level 2 – inputs other than Level 1 quoted prices that are observable, either directly or indirectly (including, but not limited to, quoted prices for similar financial instruments in active markets, quoted prices for identical or similar financial instruments in inactive markets, interest rates and yield curves, implied volatilities, and credit spreads)
Level 3 – unobservable inputs (including the fund’s own assumptions in determining fair value)
Observable inputs are developed using market data, such as publicly available information about actual events or transactions, and reflect the assumptions that market participants would use to price the financial instrument. Unobservable inputs are those for which market data are not available and are developed using the best information available about the assumptions that market participants would use to price the financial instrument. GAAP requires valuation techniques to maximize the use of relevant observable inputs and minimize the use of unobservable inputs. When multiple inputs are used to derive fair value, the financial instrument is assigned to the level within the fair value hierarchy based on the lowest-level input that is significant to the fair value of the financial instrument. Input levels are not necessarily an indication of the risk or liquidity associated with financial instruments at that level but rather the degree of judgment used in determining those values.
Valuation Techniques Debt securities generally are traded in the over-the-counter (OTC) market and are valued at prices furnished by independent pricing services or by broker dealers who make markets in such securities. When valuing securities, the independent pricing services consider the yield or price of bonds of comparable quality, coupon, maturity, and type, as well as prices quoted by dealers who make markets in such securities.
Investments in mutual funds are valued at the mutual fund’s closing NAV per share on the day of valuation. Futures contracts are valued at closing settlement prices. Swaps are valued at prices furnished by an independent pricing service or independent swap dealers. Assets and liabilities other than financial instruments, including short-term receivables and payables, are carried at cost, or estimated realizable value, if less, which approximates fair value.
Investments for which market quotations or market-based valuations are not readily available or deemed unreliable are valued at fair value as determined in good faith by the Valuation Committee, in accordance with fair valuation policies and procedures. The objective of any fair value pricing determination is to arrive at a price that could reasonably be expected from a current sale. Financial instruments fair valued by the Valuation Committee are primarily private placements, restricted securities, warrants, rights, and other securities that are not publicly traded. Factors used in determining fair value vary by type of investment and may include market or investment specific considerations. The Valuation Committee typically will afford greatest weight to actual prices in arm’s length transactions, to the extent they represent orderly transactions between market participants, transaction information can be reliably obtained, and prices are deemed representative of fair value. However, the Valuation Committee may also consider other valuation methods such as market-based valuation multiples; a discount or premium from market value of a similar, freely traded security of the same issuer; discounted cash flows; yield to maturity; or some combination. Fair value determinations are reviewed on a regular basis and updated as information becomes available, including actual purchase and sale transactions of the investment. Because any fair value determination involves a significant amount of judgment, there is a degree of subjectivity inherent in such pricing decisions, and fair value prices determined by the Valuation Committee could differ from those of other market participants.
Valuation Inputs The following table summarizes the fund’s financial instruments, based on the inputs used to determine their fair values on May 31, 2022 (for further detail by category, please refer to the accompanying Portfolio of Investments):

NOTE 3 - DERIVATIVE INSTRUMENTS
During the year ended May 31, 2022, the fund invested in derivative instruments. As defined by GAAP, a derivative is a financial instrument whose value is derived from an underlying security price, foreign exchange rate, interest rate, index of prices or rates, or other variable; it requires little or no initial investment and permits or requires net settlement. The fund invests in derivatives only if the expected risks and rewards are consistent with its investment objectives, policies, and overall risk profile, as described in its prospectus and Statement of Additional Information. The fund may use derivatives for a variety of purposes and may use them to establish both long and short positions within the fund’s portfolio. Potential uses include to hedge against declines in principal value, increase yield, invest in an asset with greater efficiency and at a lower cost than is possible through direct investment, to enhance return, or to adjust portfolio duration and credit exposure. The risks associated with the use of derivatives are different from, and potentially much greater than, the risks associated with investing directly in the instruments on which the derivatives are based. The fund at all times maintains sufficient cash reserves, liquid assets, or other SEC-permitted asset types to cover its settlement obligations under open derivative contracts.
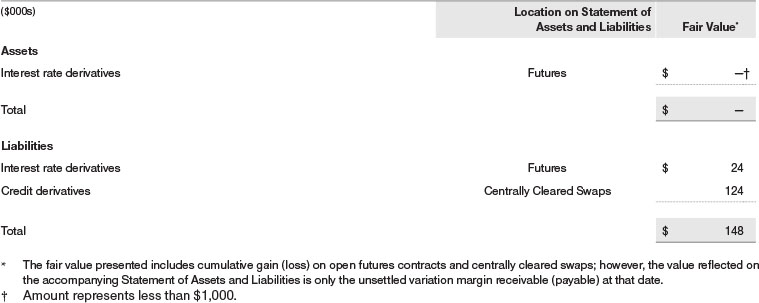
The fund values its derivatives at fair value and recognizes changes in fair value currently in its results of operations. Accordingly, the fund does not follow hedge accounting, even for derivatives employed as economic hedges. Generally, the fund accounts for its derivatives on a gross basis. It does not offset the fair value of derivative liabilities against the fair value of derivative assets on its financial statements, nor does it offset the fair value of derivative instruments against the right to reclaim or obligation to return collateral. The following table summarizes the fair value of the fund’s derivative instruments held as of May 31, 2022, and the related location on the accompanying Statement of Assets and Liabilities, presented by primary underlying risk exposure:
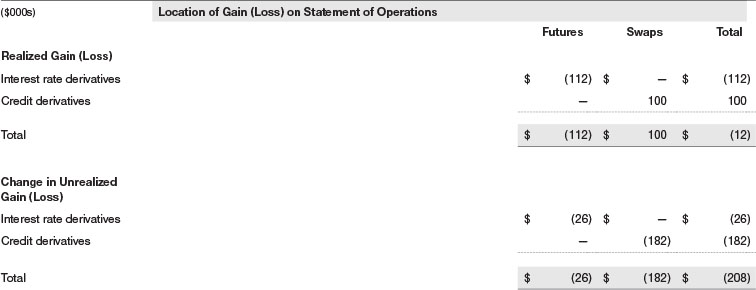
Additionally, the amount of gains and losses on derivative instruments recognized in fund earnings during the year ended May 31, 2022, and the related location on the accompanying Statement of Operations is summarized in the following table by primary underlying risk exposure:
Counterparty Risk and Collateral The fund invests in exchange-traded and/or centrally cleared derivative contracts, such as futures, exchange-traded options, and centrally cleared swaps. Counterparty risk on such derivatives is minimal because the clearinghouse provides protection against counterparty defaults. For futures and centrally cleared swaps, the fund is required to deposit collateral in an amount specified by the clearinghouse and the clearing firm (margin requirement), and the margin requirement must be maintained over the life of the contract. Each clearinghouse and clearing firm, in its sole discretion, may adjust the margin requirements applicable to the fund.
Collateral may be in the form of cash or debt securities issued by the U.S. government or related agencies. Cash posted by the fund is reflected as cash deposits in the accompanying financial statements and generally is restricted from withdrawal by the fund; securities posted by the fund are so noted in the accompanying Portfolio of Investments; both remain in the fund’s assets. While typically not sold in the same manner as equity or fixed income securities, exchange-traded or centrally cleared derivatives may be closed out only on the exchange or clearinghouse where the contracts were cleared. This ability is subject to the liquidity of underlying positions. As of May 31, 2022, cash of $282,000 had been posted by the fund for exchange-traded and/or centrally cleared derivatives.
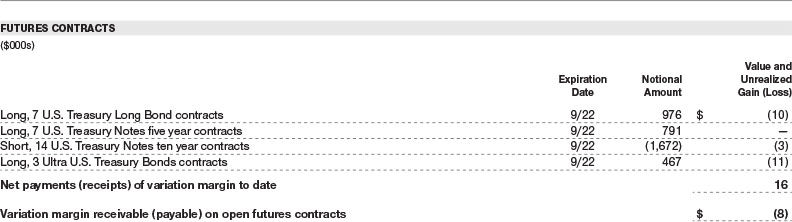
Futures Contracts The fund is subject to interest rate risk in the normal course of pursuing its investment objectives and uses futures contracts to help manage such risk. The fund may enter into futures contracts to manage exposure to interest rate and yield curve movements, security prices, foreign currencies, credit quality, and mortgage prepayments; as an efficient means of adjusting exposure to all or part of a target market; to enhance income; as a cash management tool; or to adjust portfolio duration and credit exposure. A futures contract provides for the future sale by one party and purchase by another of a specified amount of a specific underlying financial instrument at an agreed-upon price, date, time, and place. The fund currently invests only in exchange-traded futures, which generally are standardized as to maturity date, underlying financial instrument, and other contract terms. Payments are made or received by the fund each day to settle daily fluctuations in the value of the contract (variation margin), which reflect changes in the value of the underlying financial instrument. Variation margin is recorded as unrealized gain or loss until the contract is closed. The value of a futures contract included in net assets is the amount of unsettled variation margin; net variation margin receivable is reflected as an asset and net variation margin payable is reflected as a liability on the accompanying Statement of Assets and Liabilities. Risks related to the use of futures contracts include possible illiquidity of the futures markets, contract prices that can be highly volatile and imperfectly correlated to movements in hedged security values and/or interest rates, and potential losses in excess of the fund’s initial investment. During the year ended May 31, 2022, the volume of the fund’s activity in futures, based on underlying notional amounts, was generally between 12% and 21% of net assets.
Swaps The fund is subject to credit risk in the normal course of pursuing its investment objectives and uses swap contracts to help manage such risk. The fund may use swaps in an effort to manage both long and short exposure to changes in interest rates, inflation rates, and credit quality; to adjust overall exposure to certain markets; to enhance total return or protect the value of portfolio securities; to serve as a cash management tool; or to adjust portfolio duration and credit exposure. Swap agreements can be settled either directly with the counterparty (bilateral swap) or through a central clearinghouse (centrally cleared swap). Fluctuations in the fair value of a contract are reflected in unrealized gain or loss and are reclassified to realized gain or loss upon contract termination or cash settlement. Net periodic receipts or payments required by a contract increase or decrease, respectively, the value of the contract until the contractual payment date, at which time such amounts are reclassified from unrealized to realized gain or loss. For bilateral swaps, cash payments are made or received by the fund on a periodic basis in accordance with contract terms; unrealized gain on contracts and premiums paid are reflected as assets and unrealized loss on contracts and premiums received are reflected as liabilities on the accompanying Statement of Assets and Liabilities. For bilateral swaps, premiums paid or received are amortized over the life of the swap and are recognized as realized gain or loss in the Statement of Operations. For centrally cleared swaps, payments are made or received by the fund each day to settle the daily fluctuation in the value of the contract (variation margin). Accordingly, the value of a centrally cleared swap included in net assets is the unsettled variation margin; net variation margin receivable is reflected as an asset and net variation margin payable is reflected as a liability on the accompanying Statement of Assets and Liabilities.
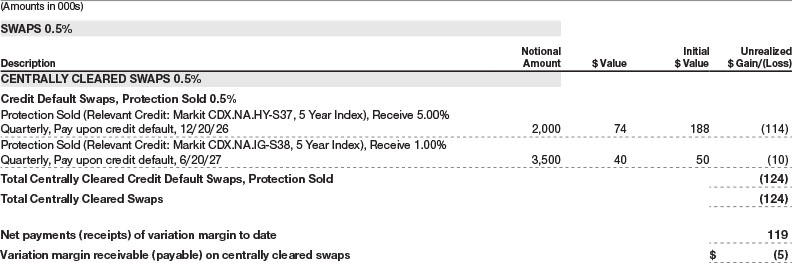
Credit default swaps are agreements where one party (the protection buyer) agrees to make periodic payments to another party (the protection seller) in exchange for protection against specified credit events, such as certain defaults and bankruptcies related to an underlying credit instrument, or issuer or index of such instruments. Upon occurrence of a specified credit event, the protection seller is required to pay the buyer the difference between the notional amount of the swap and the value of the underlying credit, either in the form of a net cash settlement or by paying the gross notional amount and accepting delivery of the relevant underlying credit. For credit default swaps where the underlying credit is an index, a specified credit event may affect all or individual underlying securities included in the index and will be settled based upon the relative weighting of the affected underlying security(ies) within the index. Generally, the payment risk for the seller of protection is inversely related to the current market price or credit rating of the underlying credit or the market value of the contract relative to the notional amount, which are indicators of the markets’ valuation of credit quality. As of May 31, 2022, the notional amount of protection sold by the fund totaled $5,500,000 (22.1% of net assets), which reflects the maximum potential amount the fund could be required to pay under such contracts. Risks related to the use of credit default swaps include the possible inability of the fund to accurately assess the current and future creditworthiness of underlying issuers, the possible failure of a counterparty to perform in accordance with the terms of the swap agreements, potential government regulation that could adversely affect the fund’s swap investments, and potential losses in excess of the fund’s initial investment.
During the year ended May 31, 2022, the volume of the fund’s activity in swaps, based on underlying notional amounts, was generally between 13% and 23% of net assets.
NOTE 4 - OTHER INVESTMENT TRANSACTIONS
Consistent with its investment objective, the fund engages in the following practices to manage exposure to certain risks and/or to enhance performance. The investment objective, policies, program, and risk factors of the fund are described more fully in the fund’s prospectus and Statement of Additional Information.
Restricted Securities The fund invests in securities that are subject to legal or contractual restrictions on resale. Prompt sale of such securities at an acceptable price may be difficult and may involve substantial delays and additional costs.
LIBOR Transition The fund may invest in instruments that are tied to reference rates, including LIBOR. Over the course of the last several years, global regulators have indicated an intent to phase out the use of LIBOR and similar interbank offered rates (IBOR). While publication for most LIBOR currencies and lesser-used USD LIBOR settings ceased immediately after December 31, 2021, remaining USD LIBOR settings will continue to be published until June 30, 2023. There remains uncertainty regarding the future utilization of LIBOR and the nature of any replacement rate. Any potential effects of the transition away from LIBOR on the fund, or on certain instruments in which the fund invests, cannot yet be determined. The transition process may result in, among other things, an increase in volatility or illiquidity of markets for instruments that currently rely on LIBOR, a reduction in the value of certain instruments held by the fund, or a reduction in the effectiveness of related fund transactions such as hedges. Any such effects could have an adverse impact on the fund’s performance.
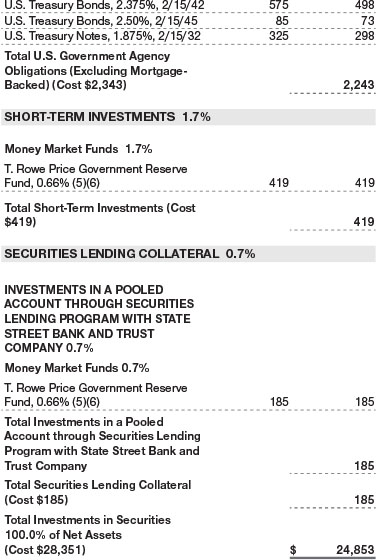
Securities Lending The fund may lend its securities to approved borrowers to earn additional income. Its securities lending activities are administered by a lending agent in accordance with a securities lending agreement. Security loans generally do not have stated maturity dates, and the fund may recall a security at any time. The fund receives collateral in the form of cash or U.S. government securities. Collateral is maintained over the life of the loan in an amount not less than the value of loaned securities; any additional collateral required due to changes in security values is delivered to the fund the next business day. Cash collateral is invested in accordance with investment guidelines approved by fund management. Additionally, the lending agent indemnifies the fund against losses resulting from borrower default. Although risk is mitigated by the collateral and indemnification, the fund could experience a delay in recovering its securities and a possible loss of income or value if the borrower fails to return the securities, collateral investments decline in value, and the lending agent fails to perform. Securities lending revenue consists of earnings on invested collateral and borrowing fees, net of any rebates to the borrower, compensation to the lending agent, and other administrative costs. In accordance with GAAP, investments made with cash collateral are reflected in the accompanying financial statements, but collateral received in the form of securities is not. At May 31, 2022, the value of loaned securities was $178,000; the value of cash collateral and related investments was $185,000.
Other Purchases and sales of portfolio securities other than short-term and U.S. government securities aggregated $16,924,000 and $7,019,000, respectively, for the year ended May 31, 2022. Purchases and sales of U.S. government securities aggregated $11,509,000 and $8,699,000, respectively, for the year ended May 31, 2022.
NOTE 5 - FEDERAL INCOME TAXES
Generally, no provision for federal income taxes is required since the fund intends to continue to qualify as a regulated investment company under Subchapter M of the Internal Revenue Code and distribute to shareholders all of its taxable income and gains. Distributions determined in accordance with federal income tax regulations may differ in amount or character from net investment income and realized gains for financial reporting purposes.
The fund files U.S. federal, state, and local tax returns as required. The fund’s tax returns are subject to examination by the relevant tax authorities until expiration of the applicable statute of limitations, which is generally three years after the filing of the tax return but which can be extended to six years in certain circumstances. Tax returns for open years have incorporated no uncertain tax positions that require a provision for income taxes.
Capital accounts within the financial reporting records are adjusted for permanent book/tax differences to reflect tax character but are not adjusted for temporary differences. The permanent book/tax adjustments, if any, have no impact on results of operations or net assets. The permanent book/tax adjustments relate primarily to the character of income on swaps.
The tax character of distributions paid for the periods presented was as follows:

At May 31, 2022, the tax-basis cost of investments (including derivatives, if any) and gross unrealized appreciation and depreciation were as follows:

At May 31, 2022, the tax-basis components of accumulated net earnings (loss) were as follows:

Temporary differences between book-basis and tax-basis components of total distributable earnings (loss) arise when certain items of income, gain, or loss are recognized in different periods for financial statement purposes versus for tax purposes; these differences will reverse in a subsequent reporting period. The temporary differences relate primarily to the deferral of losses from wash sales and the realization of gains/losses on certain open derivative contracts. The loss carryforwards and deferrals primarily relate to post-October loss deferrals, late-year ordinary loss deferrals and straddle deferrals. The fund has elected to defer certain losses to the first day of the following fiscal year for post-October capital loss deferrals and late-year ordinary loss deferrals.
NOTE 6 - RELATED PARTY TRANSACTIONS
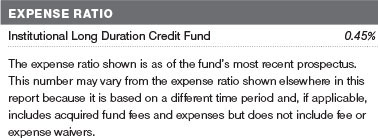
The fund is managed by T. Rowe Price Associates, Inc. (Price Associates), a wholly owned subsidiary of T. Rowe Price Group, Inc. (Price Group). The investment management and administrative agreement between the fund and Price Associates provides for an all-inclusive annual fee equal to 0.45% of the fund’s average daily net assets. The fee is computed daily and paid monthly. The all-inclusive fee covers investment management services and ordinary, recurring operating expenses but does not cover interest expense; expenses related to borrowing, taxes, and brokerage; or nonrecurring expenses.
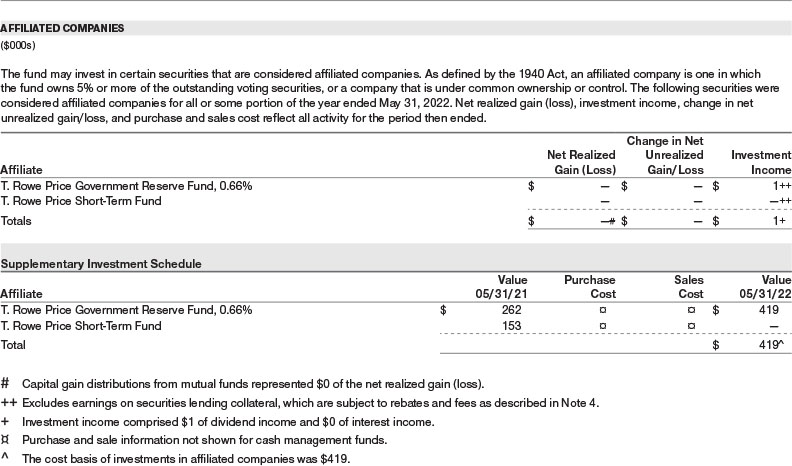
The fund may invest its cash reserves in certain open-end management investment companies managed by Price Associates and considered affiliates of the fund: the T. Rowe Price Government Reserve Fund or the T. Rowe Price Treasury Reserve Fund, organized as money market funds, or the T. Rowe Price Short-Term Fund, a short-term bond fund (collectively, the Price Reserve Funds). The Price Reserve Funds are offered as short-term investment options to mutual funds, trusts, and other accounts managed by Price Associates or its affiliates and are not available for direct purchase by members of the public. Cash collateral from securities lending, if any, is invested in the T. Rowe Price Government Reserve Fund; prior to December 13, 2021, the cash collateral from securities lending was invested in the T. Rowe Price Short-Term Fund. The Price Reserve Funds pay no investment management fees.
The fund may participate in securities purchase and sale transactions with other funds or accounts advised by Price Associates (cross trades), in accordance with procedures adopted by the fund’s Board and Securities and Exchange Commission rules, which require, among other things, that such purchase and sale cross trades be effected at the independent current market price of the security. During the year ended May 31, 2022, the fund had no purchases or sales cross trades with other funds or accounts advised by Price Associates.
NOTE 7 - OTHER MATTERS
Unpredictable events such as environmental or natural disasters, war, terrorism, pandemics, outbreaks of infectious diseases, and similar public health threats may significantly affect the economy and the markets and issuers in which a fund invests. Certain events may cause instability across global markets, including reduced liquidity and disruptions in trading markets, while some events may affect certain geographic regions, countries, sectors, and industries more significantly than others, and exacerbate other pre-existing political, social, and economic risks. Since 2020, a novel strain of coronavirus (COVID-19) has resulted in disruptions to global business activity and caused significant volatility and declines in global financial markets. In February 2022, Russian forces entered Ukraine and commenced an armed conflict. Economic sanctions have since been imposed on Russia and certain of its citizens, including the exclusion of Russia from the SWIFT global payments network. As a result, Russian-related stocks and debt have since suffered significant declines in value. The duration of the coronavirus outbreak and the Russian-Ukraine conflict, and their effects on the financial markets, cannot be determined with certainty. The fund’s performance could be negatively impacted if the value of a portfolio holding were harmed by these and such other events. Management is actively monitoring these events.
Report of Independent Registered Public Accounting Firm
To the Board of Directors of T. Rowe Price Institutional Income Funds, Inc. and
Shareholders of T. Rowe Price Institutional Long Duration Credit Fund
Opinion on the Financial Statements
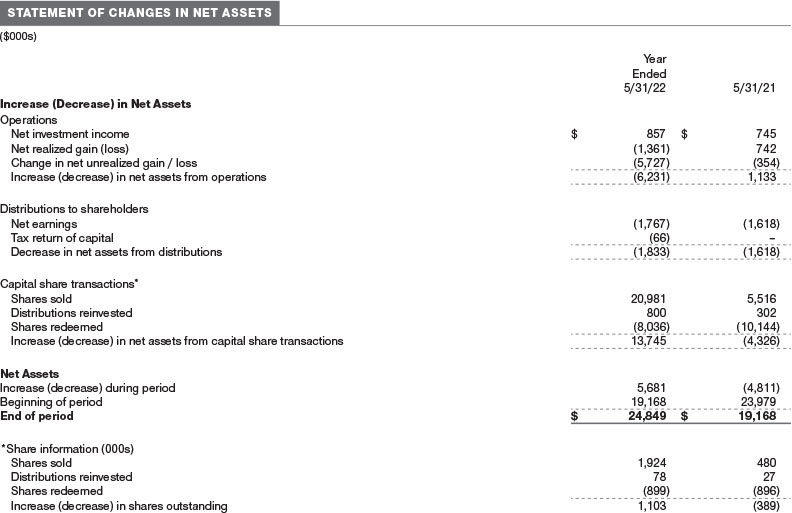
We have audited the accompanying statement of assets and liabilities, including the portfolio of investments, of T. Rowe Price Institutional Long Duration Credit Fund (one of the funds constituting T. Rowe Price Institutional Income Funds, Inc., referred to hereafter as the “Fund”) as of May 31, 2022, the related statement of operations for the year ended May 31, 2022, the statement of changes in net assets for each of the two years in the period ended May 31, 2022, including the related notes, and the financial highlights for each of the five years in the period ended May 31, 2022 (collectively referred to as the “financial statements”). In our opinion, the financial statements present fairly, in all material respects, the financial position of the Fund as of May 31, 2022, the results of its operations for the year then ended, the changes in its net assets for each of the two years in the period ended May 31, 2022 and the financial highlights for each of the five years in the period ended May 31, 2022 in conformity with accounting principles generally accepted in the United States of America.
Basis for Opinion
These financial statements are the responsibility of the Fund’s management. Our responsibility is to express an opinion on the Fund’s financial statements based on our audits. We are a public accounting firm registered with the Public Company Accounting Oversight Board (United States) (PCAOB) and are required to be independent with respect to the Fund in accordance with the U.S. federal securities laws and the applicable rules and regulations of the Securities and Exchange Commission and the PCAOB.
We conducted our audits of these financial statements in accordance with the standards of the PCAOB. Those standards require that we plan and perform the audit to obtain reasonable assurance about whether the financial statements are free of material misstatement, whether due to error or fraud.
Our audits included performing procedures to assess the risks of material misstatement of the financial statements, whether due to error or fraud, and performing procedures that respond to those risks. Such procedures included examining, on a test basis, evidence regarding the amounts and disclosures in the financial statements. Our audits also included evaluating the accounting principles used and significant estimates made by management, as well as evaluating the overall presentation of the financial statements. Our procedures included confirmation of securities owned as of May 31, 2022 by correspondence with the custodians, transfer agent and brokers; when replies were not received from brokers, we performed other auditing procedures. We believe that our audits provide a reasonable basis for our opinion.
PricewaterhouseCoopers LLP
Baltimore, Maryland
July 20, 2022
We have served as the auditor of one or more investment companies in the T. Rowe Price group of investment companies since 1973.
TAX INFORMATION (UNAUDITED) FOR THE TAX YEAR ENDED 5/31/22
We are providing this information as required by the Internal Revenue Code. The amounts shown may differ from those elsewhere in this report because of differences between tax and financial reporting requirements.
The fund’s distributions to shareholders included:
| ■ | $301,000 from short-term capital gains |
| | |
| ■ | $483,000 from long-term capital gains, subject to a long-term capital gains tax rate of not greater than 20% |
For shareholders subject to interest expense deduction limitation under Section 163(j), $873,000 of the fund’s income qualifies as a Section 163(j) interest dividend and can be treated as interest income for purposes of Section 163(j), subject to holding period requirements and other limitations.
INFORMATION ON PROXY VOTING POLICIES, PROCEDURES, AND RECORDS
A description of the policies and procedures used by T. Rowe Price funds to determine how to vote proxies relating to portfolio securities is available in each fund’s Statement of Additional Information. You may request this document by calling 1-800-225-5132 or by accessing the SEC’s website, sec.gov.
The description of our proxy voting policies and procedures is also available on our corporate website. To access it, please visit the following Web page:
https://www.troweprice.com/corporate/us/en/utility/policies.html
Scroll down to the section near the bottom of the page that says, “Proxy Voting Guidelines.” Click on the links in the shaded box.
Each fund’s most recent annual proxy voting record is available on our website and through the SEC’s website. To access it through T. Rowe Price, visit the website location shown above, and scroll down to the section near the bottom of the page that says, “Proxy Voting Records.” Click on the Proxy Voting Records link in the shaded box.
HOW TO OBTAIN QUARTERLY PORTFOLIO HOLDINGS
The fund files its complete schedule of portfolio holdings with the Securities and Exchange Commission (SEC) each month on Form N-MFP. The fund’s reports on Form N-MFP are available on the SEC’s website (sec.gov). In addition, most T. Rowe Price funds disclose their portfolio holdings information on troweprice.com.
APPROVAL OF INVESTMENT MANAGEMENT AGREEMENT
Each year, the fund’s Board of Directors (Board) considers the continuation of the investment management agreement (Advisory Contract) between the fund and its investment adviser, T. Rowe Price Associates, Inc. (Adviser). In that regard, at a meeting held on March 7–8, 2022 (Meeting), the Board, including all of the fund’s independent directors, approved the continuation of the fund’s Advisory Contract. At the Meeting, the Board considered the factors and reached the conclusions described below relating to the selection of the Adviser and the approval of the Advisory Contract. The independent directors were assisted in their evaluation of the Advisory Contract by independent legal counsel from whom they received separate legal advice and with whom they met separately.
In providing information to the Board, the Adviser was guided by a detailed set of requests for information submitted by independent legal counsel on behalf of the independent directors. In considering and approving the Advisory Contract, the Board considered the information it believed was relevant, including, but not limited to, the information discussed below. The Board considered not only the specific information presented in connection with the Meeting but also the knowledge gained over time through interaction with the Adviser about various topics. The Board meets regularly and, at each of its meetings, covers an extensive agenda of topics and materials and considers factors that are relevant to its annual consideration of the renewal of the T. Rowe Price funds’ advisory contracts, including performance and the services and support provided to the funds and their shareholders.
Services Provided by the Adviser
The Board considered the nature, quality, and extent of the services provided to the fund by the Adviser. These services included, but were not limited to, directing the fund’s investments in accordance with its investment program and the overall management of the fund’s portfolio, as well as a variety of related activities such as financial, investment operations, and administrative services; compliance; maintaining the fund’s records and registrations; and shareholder communications. The Board also reviewed the background and experience of the Adviser’s senior management team and investment personnel involved in the management of the fund, as well as the Adviser’s compliance record. The Board concluded that it was satisfied with the nature, quality, and extent of the services provided by the Adviser.
Investment Performance of the Fund
The Board took into account discussions with the Adviser and reports that it receives throughout the year relating to fund performance. In connection with the Meeting, the Board reviewed the fund’s total returns for various periods through December 31, 2021, and compared these returns with the performance of a peer group of funds with similar investment programs and a wide variety of other previously agreed-upon comparable performance measures and market data, including relative performance information as of September 30, 2021, supplied by Broadridge, which is an independent provider of mutual fund data.
On the basis of this evaluation and the Board’s ongoing review of investment results, and factoring in the relative market conditions during certain of the performance periods, the Board concluded that the fund’s performance was satisfactory.
Costs, Benefits, Profits, and Economies of Scale
The Board reviewed detailed information regarding the revenues received by the Adviser under the Advisory Contract and other direct and indirect benefits that the Adviser (and its affiliates) may have realized from its relationship with the fund. In considering soft-dollar arrangements pursuant to which research may be received from broker-dealers that execute the fund’s portfolio transactions, the Board noted that the Adviser bears the cost of research services for all client accounts that it advises, including the T. Rowe Price funds. The Board received information on the estimated costs incurred and profits realized by the Adviser from managing the T. Rowe Price funds. While the Board did not review information regarding profits realized from managing the fund in particular because the fund had either not achieved sufficient portfolio asset size or not recognized sufficient revenues to produce meaningful profit margin percentages, the Board concluded that the Adviser’s profits were reasonable in light of the services provided to the T. Rowe Price funds.
The Board also considered whether the fund benefits under the fee levels set forth in the Advisory Contract or otherwise from any economies of scale realized by the Adviser. Under the Advisory Contract, the fund pays the Adviser a single fee, or all-inclusive management fee, which is based on the fund’s average daily net assets. The all-inclusive management fee includes investment management services and provides for the Adviser to pay all of the fund’s ordinary, recurring operating expenses except for interest, taxes, portfolio transaction fees, and any nonrecurring, extraordinary expenses that may arise. The Adviser has generally implemented an all-inclusive management fee structure in situations where a fixed total expense ratio is useful for purposes of providing certainty of fees and expenses for the investors in these funds and has historically sought to set the initial all-inclusive management fee rate at levels below the expense ratios of comparable funds to take into account potential future economies of scale. In addition, the assets of the fund are included in the calculation of the group fee rate, which serves as a component of the management fee for many T. Rowe Price funds and declines at certain asset levels based on the combined average net assets of most of the T. Rowe Price funds (including the fund). Although the fund does not have a group fee component to its management fee, its assets are included in the calculation because certain resources utilized to operate the fund are shared with other T. Rowe Price funds. The Board concluded that, based on the profitability data it reviewed and consistent with this all-inclusive management fee structure, the advisory fee structure for the fund continued to be appropriate.
Fees and Expenses
The Board was provided with information regarding industry trends in management fees and expenses. Among other things, the Board reviewed data for peer groups that were compiled by Broadridge, which compared: (i) contractual management fees, actual management fees, nonmanagement expenses, and total expenses of the fund with a group of competitor funds selected by Broadridge (Expense Group) and (ii) actual management fees, nonmanagement expenses, and total expenses of the fund with a broader set of funds within the Lipper investment classification (Expense Universe). The Board considered the fund’s contractual management fee rate, actual management fee rate, and total expenses (all of which generally reflect the all-inclusive management fee rate and do not deduct the operating expenses paid by the Adviser as part of the overall management fee) in comparison with the information for the Broadridge peer groups. Broadridge generally constructed the peer groups by seeking the most comparable funds based on similar investment classifications and objectives, expense structure, asset size, and operating components and attributes and ranked funds into quintiles, with the first quintile representing the funds with the lowest relative expenses and the fifth quintile representing the funds with the highest relative expenses. The information provided to the Board indicated that the fund’s contractual management fee ranked in the first quintile (Expense Group), the fund’s actual management fee rate ranked in the fifth quintile (Expense Group and Expense Universe), and the fund’s total expenses ranked in the first quintile (Expense Group) and second quintile (Expense Universe).
The Board also reviewed the fee schedules for other investment portfolios with similar mandates that are advised or subadvised by the Adviser and its affiliates, including separately managed accounts for institutional and individual investors; subadvised funds; and other sponsored investment portfolios, including collective investment trusts and pooled vehicles organized and offered to investors outside the United States. Management provided the Board with information about the Adviser’s responsibilities and services provided to subadvisory and other institutional account clients, including information about how the requirements and economics of the institutional business are fundamentally different from those of the proprietary mutual fund business. The Board considered information showing that the Adviser’s mutual fund business is generally more complex from a business and compliance perspective than its institutional account business and considered various relevant factors, such as the broader scope of operations and oversight, more extensive shareholder communication infrastructure, greater asset flows, heightened business risks, and differences in applicable laws and regulations associated with the Adviser’s proprietary mutual fund business. In assessing the reasonableness of the fund’s management fee rate, the Board considered the differences in the nature of the services required for the Adviser to manage its mutual fund business versus managing a discrete pool of assets as a subadviser to another institution’s mutual fund or for an institutional account and that the Adviser generally performs significant additional services and assumes greater risk in managing the fund and other T. Rowe Price funds than it does for institutional account clients, including subadvised funds.
On the basis of the information provided and the factors considered, the Board concluded that the fees paid by the fund under the Advisory Contract are reasonable.
Approval of the Advisory Contract
As noted, the Board approved the continuation of the Advisory Contract. No single factor was considered in isolation or to be determinative to the decision. Rather, the Board concluded, in light of a weighting and balancing of all factors considered, that it was in the best interests of the fund and its shareholders for the Board to approve the continuation of the Advisory Contract (including the fees to be charged for services thereunder).
ABOUT THE PORTFOLIO’S DIRECTORS AND OFFICERS
Your fund is overseen by a Board of Directors (Board) that meets regularly to review a wide variety of matters affecting or potentially affecting the fund, including performance, investment programs, compliance matters, advisory fees and expenses, service providers, and business and regulatory affairs. The Board elects the fund’s officers, who are listed in the final table. The directors who are also employees or officers of T. Rowe Price are considered to be interested directors because of their relationships with T. Rowe Price and its affiliates. The business address of each director and officer is 100 East Pratt Street, Baltimore, Maryland 21202. The Statement of Additional Information includes additional information about the fund directors and is available without charge by calling a T. Rowe Price representative at 1-800-638-5660.
INDEPENDENT DIRECTORS(a)
Name
(Year of Birth)
Year Elected
[Number of T. Rowe Price
Portfolios Overseen] | | Principal Occupation(s) and Directorships of Public Companies and
Other Investment Companies During the Past Five Years |
| | | |
Teresa Bryce Bazemore
(1959)
2018
[204] | | President and Chief Executive Officer, Federal Home Loan Bank of San Francisco (2021 to present); President, Radian Guaranty (2008 to 2017); Chief Executive Officer, Bazemore Consulting LLC (2018 to 2021); Director, Chimera Investment Corporation (2017 to 2021); Director, First Industrial Realty Trust (2020 to present); Director, Federal Home Loan Bank of Pittsburgh (2017 to 2019) |
| | | |
Ronald J. Daniels(b)
(1959)
2018
[0] | | President, The Johns Hopkins University and Professor, Political Science Department, The Johns Hopkins University (2009 to present); Director, Lyndhurst Holdings (2015 to present); Director, BridgeBio Pharma, Inc. (2020 to present) |
| | | |
Bruce W. Duncan
(1951)
2013
[204] | | President, Chief Executive Officer, and Director, CyrusOne, Inc. (2020 to 2021); Chief Executive Officer and Director (2009 to 2016), Chair of the Board (2016 to 2020), and President (2009 to 2016), First Industrial Realty Trust, owner and operator of industrial properties; Chair of the Board (2005 to 2016) and Director (1999 to 2016), Starwood Hotels & Resorts, a hotel and leisure company; Member, Investment Company Institute Board of Governors (2017 to 2019); Member, Independent Directors Council Governing Board (2017 to 2019); Senior Advisor, KKR (2018 to present); Director, Boston Properties (2016 to present); Director, Marriott International, Inc. (2016 to 2020) |
| | | |
Robert J. Gerrard, Jr.
(1952)
2013
[204] | | Advisory Board Member, Pipeline Crisis/Winning Strategies, a collaborative working to improve opportunities for young African Americans (1997 to 2016); Chair of the Board, all funds (July 2018 to present) |
| | | |
Paul F. McBride
(1956)
2013
[204] | | Advisory Board Member, Vizzia Technologies (2015 to present); Board Member, Dunbar Armored (2012 to 2018) |
| | | |
Kellye L. Walker(c)
(1966)
2021
[204] | | Executive Vice President and Chief Legal Officer, Eastman Chemical Company (April 2020 to present); Executive Vice President and Chief Legal Officer, Huntington Ingalls Industries, Inc. (NYSE: HIl) (January 2015 to March 2020); Director, Lincoln Electric Company (October 2020 to present) |
| | | |
| (a)All information about the independent directors was current as of December 31, 2021, unless otherwise indicated, except for the number of portfolios overseen, which is current as of the date of this report. |
| (b)Effective April 27, 2022, Mr. Daniels resigned from his role as an independent director of the Price Funds. |
| (c)Effective November 8, 2021, Ms. Walker was appointed as an independent director of the Price Funds. |
INTERESTED DIRECTORS(a)
Name
(Year of Birth)
Year Elected
[Number of T. Rowe Price
Portfolios Overseen] | | Principal Occupation(s) and Directorships of Public Companies and
Other Investment Companies During the Past Five Years |
| | | |
David Oestreicher
(1967)
2018
[204] | | Director, Vice President, and Secretary, T. Rowe Price, T. Rowe Price Investment Services, Inc., T. Rowe Price Retirement Plan Services, Inc., and T. Rowe Price Services, Inc.; Director and Secretary, T. Rowe Price Investment Management, Inc. (Price Investment Management); Vice President and Secretary, T. Rowe Price International (Price International); Vice President, T. Rowe Price Hong Kong (Price Hong Kong), T. Rowe Price Japan (Price Japan), and T. Rowe Price Singapore (Price Singapore); General Counsel, Vice President, and Secretary, T. Rowe Price Group, Inc.; Chair of the Board, Chief Executive Officer, President, and Secretary, T. Rowe Price Trust Company; Principal Executive Officer and Executive Vice President, all funds |
| | | |
Robert W. Sharps, CFA, CPA
(1971)
2019
[0] | | Director and Vice President, T. Rowe Price; Director, Price Investment Management; Chief Executive Officer and President, T. Rowe Price Group, Inc.; Vice President, T. Rowe Price Trust Company |
| | | |
Eric L. Veiel, CFA
(1972)
2022
[204] | | Director and Vice President, T. Rowe Price; Vice President, T. Rowe Price Group, Inc., and T. Rowe Price Trust Company |
| | | |
| (a)All information about the interested directors was current as of January 1, 2022, unless otherwise indicated, except for the number of portfolios overseen, which is current as of the date of this report. |
OFFICERS
Name (Year of Birth)
Position Held With Institutional Income Funds | | Principal Occupation(s) |
| | | |
Jason A. Bauer (1979)
Vice President | | Vice President, T. Rowe Price and T. Rowe Price Group, Inc. |
| | | |
Steven E. Boothe, CFA (1977)
Vice President | | Vice President, T. Rowe Price and T. Rowe Price Group, Inc. |
| | | |
Armando (Dino) Capasso (1974)
Chief Compliance Officer | | Chief Compliance Officer and Vice President, T. Rowe Price and Price Investment Management; Vice President, T. Rowe Price Group, Inc.; formerly, Chief Compliance Officer, PGIM Investments LLC and AST Investment Services, Inc. (ASTIS) (to 2022); Chief Compliance Officer, PGIM Retail Funds complex and Prudential Insurance Funds (to 2022); Vice President and Deputy Chief Compliance Officer, PGIM Investments LLC and ASTIS (to 2019); Senior Vice President and Senior Counsel, Pacific Investment Management Company LLC (to 2017) |
| | | |
Maria H. Condez (1962)
Vice President | | Vice President, T. Rowe Price and T. Rowe Price Group, Inc. |
| | | |
Michael F. Connelly, CFA (1977)
Vice President | | Vice President, T. Rowe Price and T. Rowe Price Group, Inc. |
| | | |
Michael Patrick Daley (1981)
Vice President | | Vice President, T. Rowe Price and T. Rowe Price Group, Inc. |
| | | |
Alan S. Dupski, CPA (1982)
Principal Financial Officer, Vice President, and Treasurer | | Vice President, Price Investment Management, T. Rowe Price, T. Rowe Price Group, Inc., and T. Rowe Price Trust Company |
| | | |
Justin T. Gerbereux, CFA (1975)
Vice President | | Vice President, T. Rowe Price, T. Rowe Price Group, Inc., and T. Rowe Price Trust Company |
| | | |
Gary J. Greb (1961)
Vice President | | Vice President, Price Investment Management, T. Rowe Price, Price International, and T. Rowe Price Trust Company |
| | | |
Michael J. Grogan, CFA (1971)
Vice President | | Vice President, T. Rowe Price and T. Rowe Price Group, Inc. |
| | | |
Cheryl Hampton (1969)
Vice President | | Vice President, T. Rowe Price |
| | | |
Benjamin Kersse (1989)
Vice President | | Vice President, T. Rowe Price |
| | | |
Paul J. Krug, CPA (1964)
Vice President | | Vice President, T. Rowe Price, T. Rowe Price Group, Inc., and T. Rowe Price Trust Company |
| | | |
Michael Lambe, CFA (1977)
Vice President | | Vice President, T. Rowe Price Group, Inc., and Price International |
| | | |
Robert M. Larkins, CFA (1973)
Executive Vice President | | Vice President, T. Rowe Price, T. Rowe Price Group, Inc., and T. Rowe Price Trust Company |
| | | |
Yongheon Lee (1975)
Vice President | | Vice President, T. Rowe Price and T. Rowe Price Group, Inc. |
| | | |
Paul M. Massaro, CFA (1975)
President | | Vice President, T. Rowe Price, T. Rowe Price Group, Inc., and T. Rowe Price Trust Company |
| | | |
Michael J. McGonigle (1966)
Vice President | | Vice President, T. Rowe Price and T. Rowe Price Group, Inc. |
| | | |
Cheryl A. Mickel, CFA (1967)
Vice President | | Director and Vice President, T. Rowe Price Trust Company; Vice President, T. Rowe Price and T. Rowe Price Group, Inc. |
| | | |
Samy B. Muaddi, CFA (1984)
Vice President | | Vice President, T. Rowe Price, T. Rowe Price Group, Inc., and T. Rowe Price Trust Company |
| | | |
Alexander S. Obaza (1981)
Vice President | | Vice President, T. Rowe Price, T. Rowe Price Group, Inc., and T. Rowe Price Trust Company |
| | | |
Miso Park, CFA (1982)
Vice President | | Vice President, T. Rowe Price and T. Rowe Price Group, Inc. |
| | | |
Fran M. Pollack-Matz (1961)
Vice President and Secretary | | Vice President, T. Rowe Price, T. Rowe Price Group, Inc., T. Rowe Price Investment Services, Inc., and T. Rowe Price Services, Inc. |
| | | |
Rachel Protzman (1988)
Assistant Vice President | | Assistant Vice President, T. Rowe Price |
| | | |
Shannon H. Rauser (1987)
Assistant Secretary | | Assistant Vice President, T. Rowe Price |
| | | |
Rodney M. Rayburn, CFA (1970)
Executive Vice President | | Vice President, T. Rowe Price, T. Rowe Price Group, Inc., and T. Rowe Price Trust Company |
| | | |
Theodore E. Robson, CFA (1965)
Vice President | | Vice President, T. Rowe Price, T. Rowe Price Group, Inc., and T. Rowe Price Trust Company |
| | | |
Brian A. Rubin, CPA (1974)
Vice President | | Vice President, T. Rowe Price, T. Rowe Price Group, Inc., and T. Rowe Price Trust Company |
| | | |
Chen Shao (1980)
Vice President | | Vice President, T. Rowe Price and T. Rowe Price Group, Inc. |
| | | |
Jeanny Silva (1975)
Vice President | | Vice President, T. Rowe Price and T. Rowe Price Group, Inc. |
| | | |
Douglas D. Spratley, CFA (1969)
Executive Vice President | | Vice President, T. Rowe Price, T. Rowe Price Group, Inc., and T. Rowe Price Trust Company |
| | | |
Michael J. Trivino (1981)
Vice President | | Vice President, T. Rowe Price and T. Rowe Price Group, Inc. |
| | | |
Lauren T. Wagandt (1984)
Vice President | | Vice President, T. Rowe Price and T. Rowe Price Group, Inc. |
| | | |
Megan Warren (1968)
Vice President | | OFAC Sanctions Compliance Officer and Vice President, Price Investment Management; Vice President, T. Rowe Price, T. Rowe Price Group, Inc., T. Rowe Price Retirement Plan Services, Inc., T. Rowe Price Services, Inc., and T. Rowe Price Trust Company |
| | | |
Bineesha Wickremarachchi, CFA (1980)
Vice President | | Vice President, T. Rowe Price Group, Inc., and Price International |
| | | |
Rebecca Willey (1987)
Vice President | | Vice President, T. Rowe Price |
| | | |
James Woodward, CFA (1974)
Vice President | | Vice President, T. Rowe Price Group, Inc., and Price International |
| | | |
| Unless otherwise noted, officers have been employees of T. Rowe Price or Price International for at least 5 years. |
Item 1. (b) Notice pursuant to Rule 30e-3.
Not applicable.
Item 2. Code of Ethics.
The registrant has adopted a code of ethics, as defined in Item 2 of Form N-CSR, applicable to its principal executive officer, principal financial officer, principal accounting officer or controller, or persons performing similar functions. A copy of this code of ethics is filed as an exhibit to this Form N-CSR. No substantive amendments were approved or waivers were granted to this code of ethics during the period covered by this report.
Item 3. Audit Committee Financial Expert.
The registrant’s Board of Directors has determined that Ms. Teresa Bryce Bazemore qualifies as an audit committee financial expert, as defined in Item 3 of Form N-CSR. Ms. Bazemore is considered independent for purposes of Item 3 of Form N-CSR.
Item 4. Principal Accountant Fees and Services.
(a) – (d) Aggregate fees billed for the last two fiscal years for professional services rendered to, or on behalf of, the registrant by the registrant’s principal accountant were as follows:
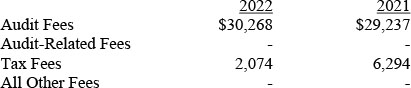
Audit fees include amounts related to the audit of the registrant’s annual financial statements and services normally provided by the accountant in connection with statutory and regulatory filings. Audit-related fees include amounts reasonably related to the performance of the audit of the registrant’s financial statements and specifically include the issuance of a report on internal controls and, if applicable, agreed-upon procedures related to fund acquisitions. Tax fees include amounts related to services for tax compliance, tax planning, and tax advice. The nature of these services specifically includes the review of distribution calculations and the preparation of Federal, state, and excise tax returns. All other fees include the registrant’s pro-rata share of amounts for agreed-upon procedures in conjunction with service contract approvals by the registrant’s Board of Directors/Trustees.
(e)(1) The registrant’s audit committee has adopted a policy whereby audit and non-audit services performed by the registrant’s principal accountant for the registrant, its investment adviser, and any entity controlling, controlled by, or under common control with the investment adviser that provides ongoing services to the registrant require pre-approval in advance at regularly scheduled audit committee meetings. If such a service is required between regularly scheduled audit committee meetings, pre-approval may be authorized by one audit committee member with ratification at the next scheduled audit committee meeting. Waiver of pre-approval for audit or non-audit services requiring fees of a de minimis amount is not permitted.
(2) No services included in (b) – (d) above were approved pursuant to paragraph (c)(7)(i)(C) of Rule 2-01 of Regulation S-X.
(f) Less than 50 percent of the hours expended on the principal accountant’s engagement to audit the registrant’s financial statements for the most recent fiscal year were attributed to work performed by persons other than the principal accountant’s full-time, permanent employees.
(g) The aggregate fees billed for the most recent fiscal year and the preceding fiscal year by the registrant’s principal accountant for non-audit services rendered to the registrant, its investment adviser, and any entity controlling, controlled by, or under common control with the investment adviser that provides ongoing services to the registrant were $2,959,000 and $3,481,000, respectively.
(h) All non-audit services rendered in (g) above were pre-approved by the registrant’s audit committee. Accordingly, these services were considered by the registrant’s audit committee in maintaining the principal accountant’s independence.
Item 5. Audit Committee of Listed Registrants.
Not applicable.
Item 6. Investments.
(a) Not applicable. The complete schedule of investments is included in Item 1 of this Form N-CSR.
(b) Not applicable.
Item 7. Disclosure of Proxy Voting Policies and Procedures for Closed-End Management Investment Companies.
Not applicable.
Item 8. Portfolio Managers of Closed-End Management Investment Companies.
Not applicable.
Item 9. Purchases of Equity Securities by Closed-End Management Investment Company and Affiliated Purchasers.
Not applicable.
Item 10. Submission of Matters to a Vote of Security Holders.
There has been no change to the procedures by which shareholders may recommend nominees to the registrant’s board of directors.
Item 11. Controls and Procedures.
(a) The registrant’s principal executive officer and principal financial officer have evaluated the registrant’s disclosure controls and procedures within 90 days of this filing and have concluded that the registrant’s disclosure controls and procedures were effective, as of that date, in ensuring that information required to be disclosed by the registrant in this Form N-CSR was recorded, processed, summarized, and reported timely.
(b) The registrant’s principal executive officer and principal financial officer are aware of no change in the registrant’s internal control over financial reporting that occurred during the period covered by this report that has materially affected, or is reasonably likely to materially affect, the registrant’s internal control over financial reporting.
Item 12. Disclosure of Securities Lending Activities for Closed-End Management Investment Companies.
Not applicable.
Item 13. Exhibits.
(a)(1) The registrant’s code of ethics pursuant to Item 2 of Form N-CSR is attached.
(2) Separate certifications by the registrant's principal executive officer and principal financial officer, pursuant to Section 302 of the Sarbanes-Oxley Act of 2002 and required by Rule 30a-2(a) under the Investment Company Act of 1940, are attached.
(3) Written solicitation to repurchase securities issued by closed-end companies: not applicable.
(b) A certification by the registrant’s principal executive officer and principal financial officer, pursuant to Section 906 of the Sarbanes-Oxley Act of 2002 and required by Rule 30a-2(b) under the Investment Company Act of 1940, is attached.
SIGNATURES
Pursuant to the requirements of the Securities Exchange Act of 1934 and the Investment Company Act of 1940, the registrant has duly caused this report to be signed on its behalf by the undersigned, thereunto duly authorized.
T. Rowe Price Institutional Income Funds, Inc.
| By | | /s/ David Oestreicher |
| | | David Oestreicher |
| | | Principal Executive Officer |
| |
| Date | | July 20, 2022 | | | | |
Pursuant to the requirements of the Securities Exchange Act of 1934 and the Investment Company Act of 1940, this report has been signed below by the following persons on behalf of the registrant and in the capacities and on the dates indicated.
| By | | /s/ David Oestreicher |
| | | David Oestreicher |
| | | Principal Executive Officer |
| |
| Date | | July 20, 2022 | | | | |
| |
| |
| By | | /s/ Alan S. Dupski |
| | | Alan S. Dupski |
| | | Principal Financial Officer |
| |
| Date | | July 20, 2022 | | | | |