
Exhibit 99.1 Banc of California Reports First Quarter 2019 Earnings SANTA ANA, Calif., (April 23, 2019) – Banc of California, Inc. (NYSE: BANC) today reported net income available to common stockholders of $2.7 million, for the first quarter of 2019, resulting in diluted earnings per common share of $0.05 for the quarter. Highlights for the first quarter included: Core Deposits: Core deposit balances were up to $6.3 billion from $6.2 billion in the prior quarter and $5.7 billion a year ago. o Wholesale funding mix is 24% in the first quarter, down from 30% at the end of 2018. o Noninterest bearing deposits increased by $97 million. HFI Loan Balances: Held for investment loans decreased by $144 million during the quarter to $7.6 billion. o Gross loan commitment originations totaled $521 million for the first quarter at an average production yield of 5.29%. o Sales of single family loans totaled $243 million. Asset Re-Mix: Investment securities balance declined by $521 million during the quarter and represented 15% of total assets at quarter end, down from 19% at the end of the prior quarter and 23% from a year ago. Noninterest Expenses: First quarter noninterest expenses totaled $61.8 million, up from $49.6 million for the fourth quarter, driven by a seasonal increase in salaries and benefits combined with increased professional fees and restructuring expenses. Credit Performance: Non-performing assets to total assets at quarter end were 0.29% and total delinquent loans to total loans at quarter end were 0.79%, compared to 0.21% and 0.53%, respectively, at the prior quarter end. Net charge-offs during the quarter totaled $1.1 million, compared with $2.5 million during the prior quarter. The ALLL / total loan ratio was 0.85% at quarter end, up from 0.81% at the prior quarter end and 0.79% a year ago. Strong Capital Ratios: Common equity tier 1 capital ratio at quarter end of 9.72%, compared to 9.53% at the prior quarter end and 9.80% a year ago. Capital actions: Dividend Reduction: The Company’s Board of Directors approved a plan to reduce the quarterly dividend from $0.13 to $0.06 per common share. The Company’s first quarter results included $11.0 million of legal and professional fees and $2.8 million in restructuring expenses, offset by a $4.7 million insurance recovery related to ongoing indemnification expenses. “The first quarter results, and particularly actions taken at the end of the quarter, reflect continued effort toward our strategic transformation,” said Jared Wolff, President and Chief Executive Officer of Banc of California. “We increased our core deposits during the quarter by $58 million and more importantly, increased our noninterest bearing deposits by $97 million. Additionally, we decreased our wholesale funding balance to 24% of total funding. Credit quality remained strong with non-performing assets to total assets at 0.29% at quarter end.” Mr. Wolff continued “This will be my first quarterly earnings call as the company’s President and CEO, and I am honored to be leading Banc of California at such an exciting time for the company. We have a great brand, very talented people at all levels and are located in one of the best banking markets in the country with the expertise, products and platform necessary to be one of the premier community banking franchises in California. I look forward to accelerating the company’s transformation and continuing to build long term value for our stockholders.” 3 MacArthur Place Santa Ana, CA 92707 (949) 236-5250 www.bancofcal.com
The Company will host a conference call to discuss its first quarter 2019 financial results at 10:00 a.m. Pacific Time (PT) on Tuesday, April 23, 2019. Interested parties are welcome to attend the conference call by dialing 888-317-6003, and referencing event code 4703060. A live audio webcast will also be available and the webcast link will be posted on the Company’s Investor Relations website at www.bancofcal.com/investor. The slide presentation for the call will also be available on the Company's Investor Relations website prior to the call. About Banc of California, Inc. Banc of California, Inc. (NYSE: BANC) is a bank holding company with approximately $10 billion in assets and one wholly- owned banking subsidiary, Banc of California, N.A. (the “Bank”). The Bank has 43 offices including 32 full-service branches located throughout Southern California. Through our 750+ dedicated professionals, we provide customized and innovative banking and lending solutions to businesses, entrepreneurs and individuals throughout California. We help our clients grow their businesses, purchase a home, create jobs, transform neighborhoods, enrich communities and empower their dreams. We also help to improve the communities where we live and work, by supporting organizations that provide financial literacy and job training, small business support and affordable housing. With a commitment to service and building enduring relationships, we provide a higher standard of banking. We look forward to helping you achieve your goals. For more information, please visit us at www.bancofcal.com. Forward-Looking Statements This press release includes forward-looking statements within the meaning of the "Safe-Harbor" provisions of the Private Securities Litigation Reform Act of 1995. These statements are necessarily subject to risk and uncertainty and actual results could differ materially from those anticipated due to various factors, including those set forth from time to time in the documents filed or furnished by Banc of California, Inc. with the Securities and Exchange Commission. You should not place undue reliance on forward-looking statements and Banc of California, Inc. undertakes no obligation to update any such statements to reflect circumstances or events that occur after the date on which the forward-looking statement is made. Source: Banc of California, Inc. INVESTOR RELATIONS INQUIRIES: Banc of California, Inc. John A. Bogler, (855) 361-2262 - 2 -
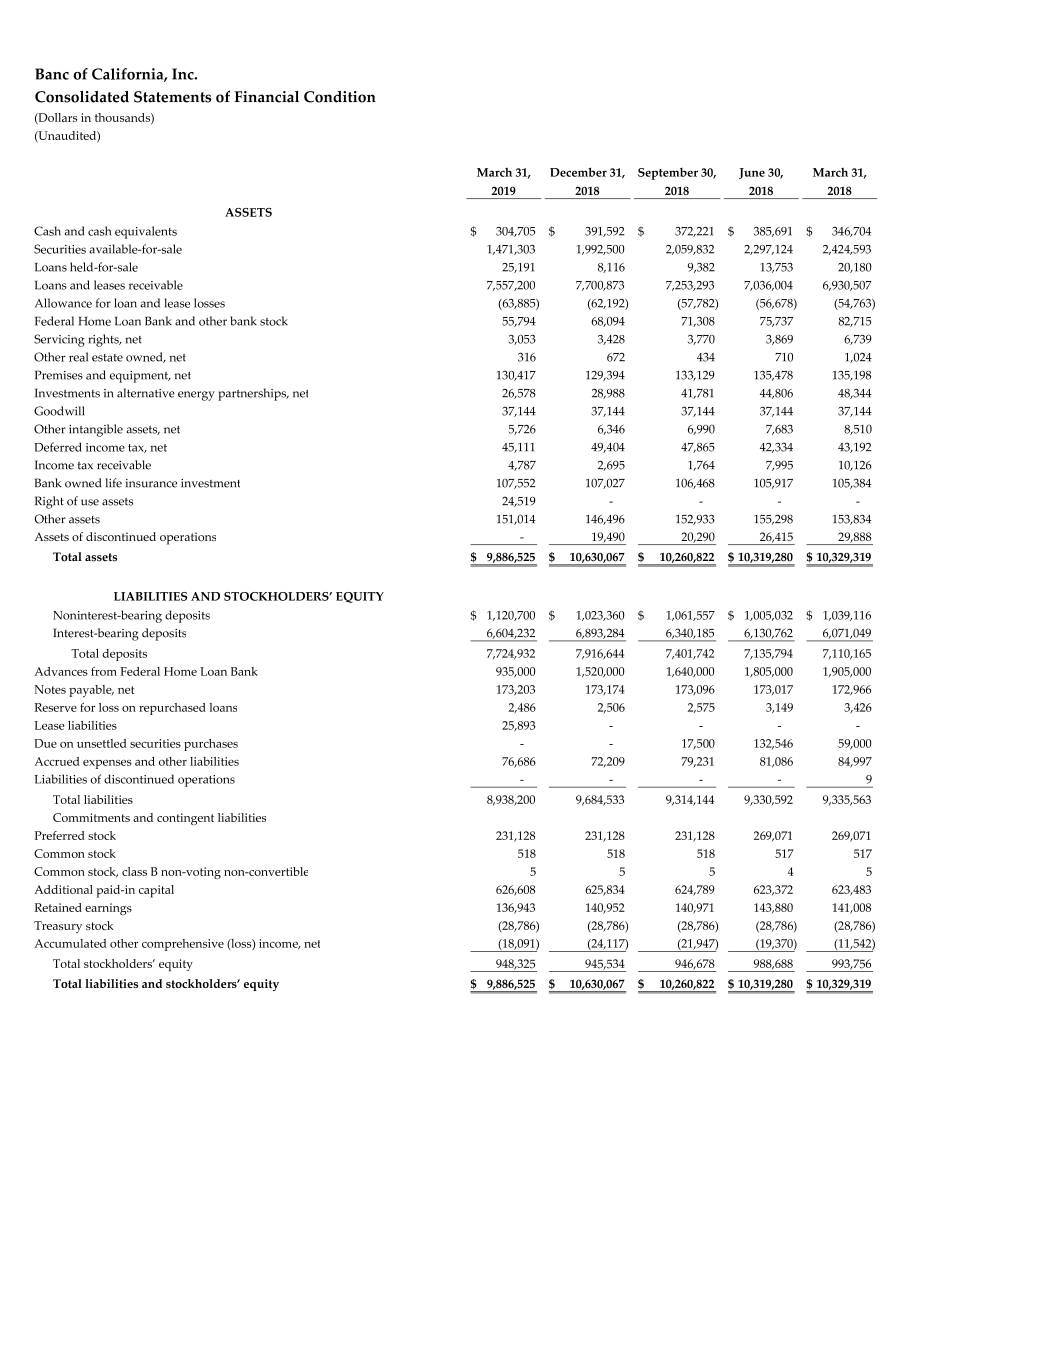
Banc of California, Inc. Consolidated Statements of Financial Condition (Dollars in thousands) (Unaudited) March 31, December 31, September 30, June 30, March 31, 2019 2018 2018 2018 2018 ASSETS Cash and cash equivalents $ 304,705 $ 391,592 $ 372,221 $ 385,691 $ 346,704 Securities available‐for‐sale 1,471,303 1,992,500 2,059,832 2,297,124 2,424,593 Loans held‐for‐sale 25,191 8,116 9,382 13,753 20,180 Loans and leases receivable 7,557,200 7,700,873 7,253,293 7,036,004 6,930,507 Allowance for loan and lease losses (63,885) (62,192) (57,782) (56,678) (54,763) Federal Home Loan Bank and other bank stock 55,794 68,094 71,308 75,737 82,715 Servicing rights, net 3,053 3,428 3,770 3,869 6,739 Other real estate owned, net 316 672 434 710 1,024 Premises and equipment, net 130,417 129,394 133,129 135,478 135,198 Investments in alternative energy partnerships, net 26,578 28,988 41,781 44,806 48,344 Goodwill 37,144 37,144 37,144 37,144 37,144 Other intangible assets, net 5,726 6,346 6,990 7,683 8,510 Deferred income tax, net 45,111 49,404 47,865 42,334 43,192 Income tax receivable 4,787 2,695 1,764 7,995 10,126 Bank owned life insurance investment 107,552 107,027 106,468 105,917 105,384 Right of use assets 24,519 ‐ ‐ ‐ ‐ Other assets 151,014 146,496 152,933 155,298 153,834 Assets of discontinued operations ‐ 19,490 20,290 26,415 29,888 Total assets $ 9,886,525 $ 10,630,067 $ 10,260,822 $ 10,319,280 $ 10,329,319 LIABILITIES AND STOCKHOLDERS’ EQUITY Noninterest‐bearing deposits $ 1,120,700 $ 1,023,360 $ 1,061,557 $ 1,005,032 $ 1,039,116 Interest‐bearing deposits 6,604,232 6,893,284 6,340,185 6,130,762 6,071,049 Total deposits 7,724,932 7,916,644 7,401,742 7,135,794 7,110,165 Advances from Federal Home Loan Bank 935,000 1,520,000 1,640,000 1,805,000 1,905,000 Notes payable, net 173,203 173,174 173,096 173,017 172,966 Reserve for loss on repurchased loans 2,486 2,506 2,575 3,149 3,426 Lease liabilities 25,893 ‐ ‐ ‐ ‐ Due on unsettled securities purchases ‐ ‐ 17,500 132,546 59,000 Accrued expenses and other liabilities 76,686 72,209 79,231 81,086 84,997 Liabilities of discontinued operations ‐ ‐ ‐‐ 9 Total liabilities 8,938,200 9,684,533 9,314,144 9,330,592 9,335,563 Commitments and contingent liabilities Preferred stock 231,128 231,128 231,128 269,071 269,071 Common stock 518 518 518 517 517 Common stock, class B non‐voting non‐convertible 5 5 5 4 5 Additional paid‐in capital 626,608 625,834 624,789 623,372 623,483 Retained earnings 136,943 140,952 140,971 143,880 141,008 Treasury stock (28,786) (28,786) (28,786) (28,786) (28,786) Accumulated other comprehensive (loss) income, net (18,091) (24,117) (21,947) (19,370) (11,542) Total stockholders’ equity 948,325 945,534 946,678 988,688 993,756 Total liabilities and stockholders’ equity $ 9,886,525 $ 10,630,067 $ 10,260,822 $ 10,319,280 $ 10,329,319
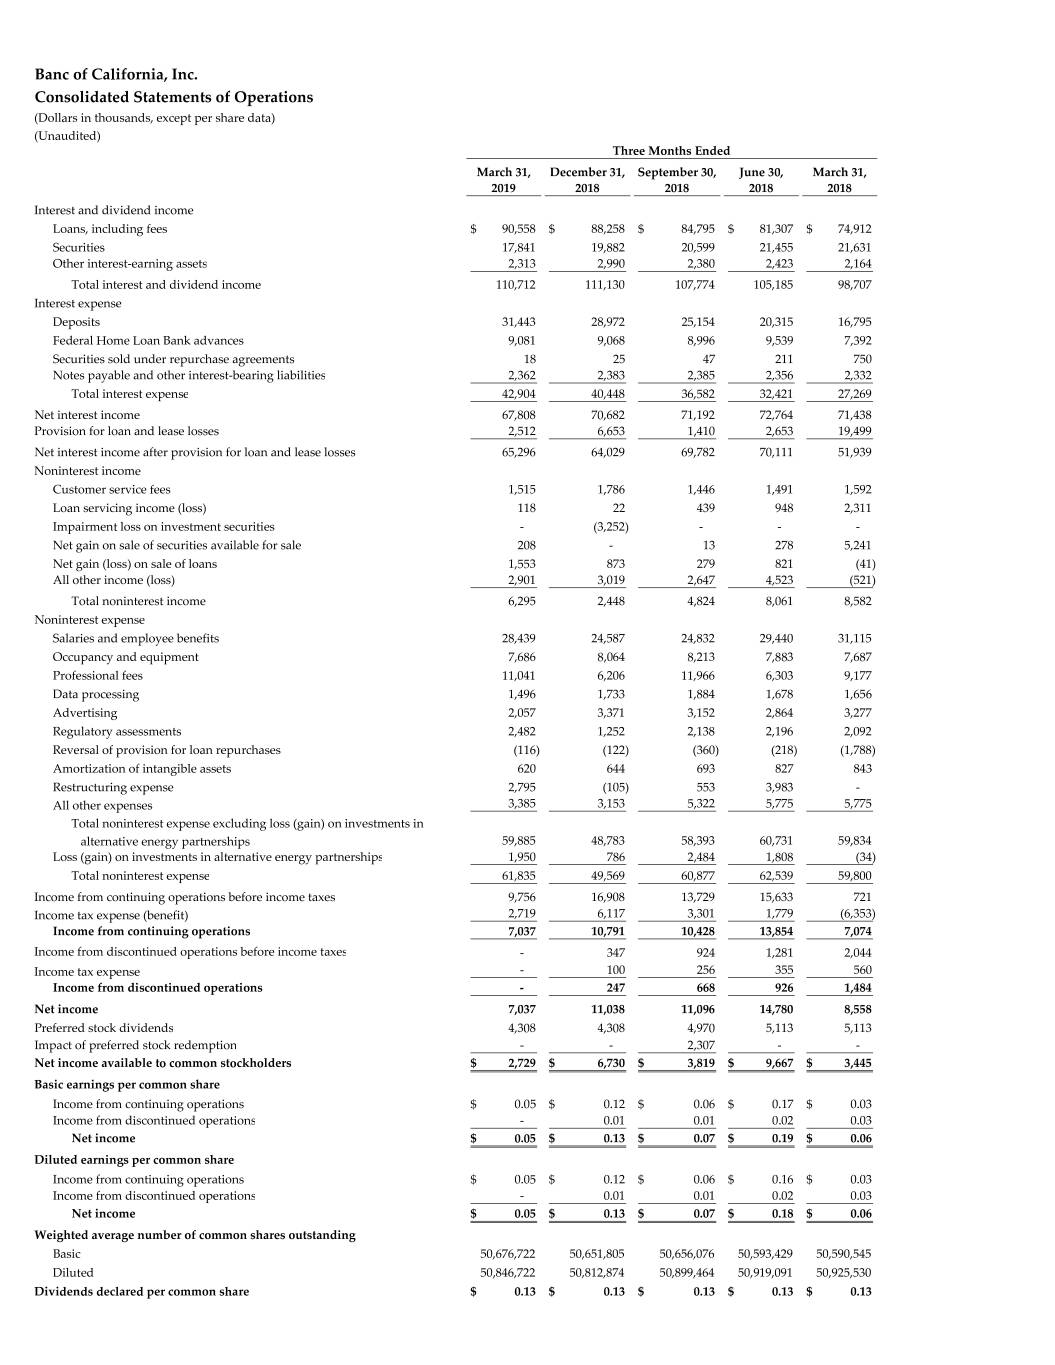
Banc of California, Inc. Consolidated Statements of Operations (Dollars in thousands, except per share data) (Unaudited) Three Months Ended March 31, December 31, September 30, June 30, March 31, 2019 2018 2018 2018 2018 Interest and dividend income Loans, including fees $ 90,558 $ 88,258 $ 84,795 $ 81,307 $ 74,912 Securities 17,841 19,882 20,599 21,455 21,631 Other interest‐earning assets 2,313 2,990 2,380 2,423 2,164 Total interest and dividend income 110,712 111,130 107,774 105,185 98,707 Interest expense Deposits 31,443 28,972 25,154 20,315 16,795 Federal Home Loan Bank advances 9,081 9,068 8,996 9,539 7,392 Securities sold under repurchase agreements 18 25 47 211 750 Notes payable and other interest‐bearing liabilities 2,362 2,383 2,385 2,356 2,332 Total interest expense 42,904 40,448 36,582 32,421 27,269 Net interest income 67,808 70,682 71,192 72,764 71,438 Provision for loan and lease losses 2,512 6,653 1,410 2,653 19,499 Net interest income after provision for loan and lease losses 65,296 64,029 69,782 70,111 51,939 Noninterest income Customer service fees 1,515 1,786 1,446 1,491 1,592 Loan servicing income (loss) 118 22 439 948 2,311 Impairment loss on investment securities ‐ (3,252) ‐ ‐ ‐ Net gain on sale of securities available for sale 208 ‐ 13 278 5,241 Net gain (loss) on sale of loans 1,553 873 279 821 (41) All other income (loss) 2,901 3,019 2,647 4,523 (521) Total noninterest income 6,295 2,448 4,824 8,061 8,582 Noninterest expense Salaries and employee benefits 28,439 24,587 24,832 29,440 31,115 Occupancy and equipment 7,686 8,064 8,213 7,883 7,687 Professional fees 11,041 6,206 11,966 6,303 9,177 Data processing 1,496 1,733 1,884 1,678 1,656 Advertising 2,057 3,371 3,152 2,864 3,277 Regulatory assessments 2,482 1,252 2,138 2,196 2,092 Reversal of provision for loan repurchases (116) (122) (360) (218) (1,788) Amortization of intangible assets 620 644 693 827 843 Restructuring expense 2,795 (105) 553 3,983 ‐ All other expenses 3,385 3,153 5,322 5,775 5,775 Total noninterest expense excluding loss (gain) on investments in alternative energy partnerships 59,885 48,783 58,393 60,731 59,834 Loss (gain) on investments in alternative energy partnerships 1,950 786 2,484 1,808 (34) Total noninterest expense 61,835 49,569 60,877 62,539 59,800 Income from continuing operations before income taxes 9,756 16,908 13,729 15,633 721 Income tax expense (benefit) 2,719 6,117 3,301 1,779 (6,353) Income from continuing operations 7,037 10,791 10,428 13,854 7,074 Income from discontinued operations before income taxes ‐ 347 924 1,281 2,044 Income tax expense ‐ 100 256 355 560 Income from discontinued operations ‐ 247 668 926 1,484 Net income 7,037 11,038 11,096 14,780 8,558 Preferred stock dividends 4,308 4,308 4,970 5,113 5,113 Impact of preferred stock redemption ‐ ‐ 2,307 ‐ ‐ Net income available to common stockholders $ 2,729 $ 6,730 $ 3,819 $ 9,667 $ 3,445 Basic earnings per common share Income from continuing operations $ 0.05 $ 0.12 $ 0.06 $ 0.17 $ 0.03 Income from discontinued operations ‐ 0.01 0.01 0.02 0.03 Net income $ 0.05 $ 0.13 $ 0.07 $ 0.19 $ 0.06 Diluted earnings per common share Income from continuing operations $ 0.05 $ 0.12 $ 0.06 $ 0.16 $ 0.03 Income from discontinued operations ‐ 0.01 0.01 0.02 0.03 Net income $ 0.05 $ 0.13 $ 0.07 $ 0.18 $ 0.06 Weighted average number of common shares outstanding Basic 50,676,722 50,651,805 50,656,076 50,593,429 50,590,545 Diluted 50,846,722 50,812,874 50,899,464 50,919,091 50,925,530 Dividends declared per common share $ 0.13 $ 0.13 $ 0.13 $ 0.13 $ 0.13
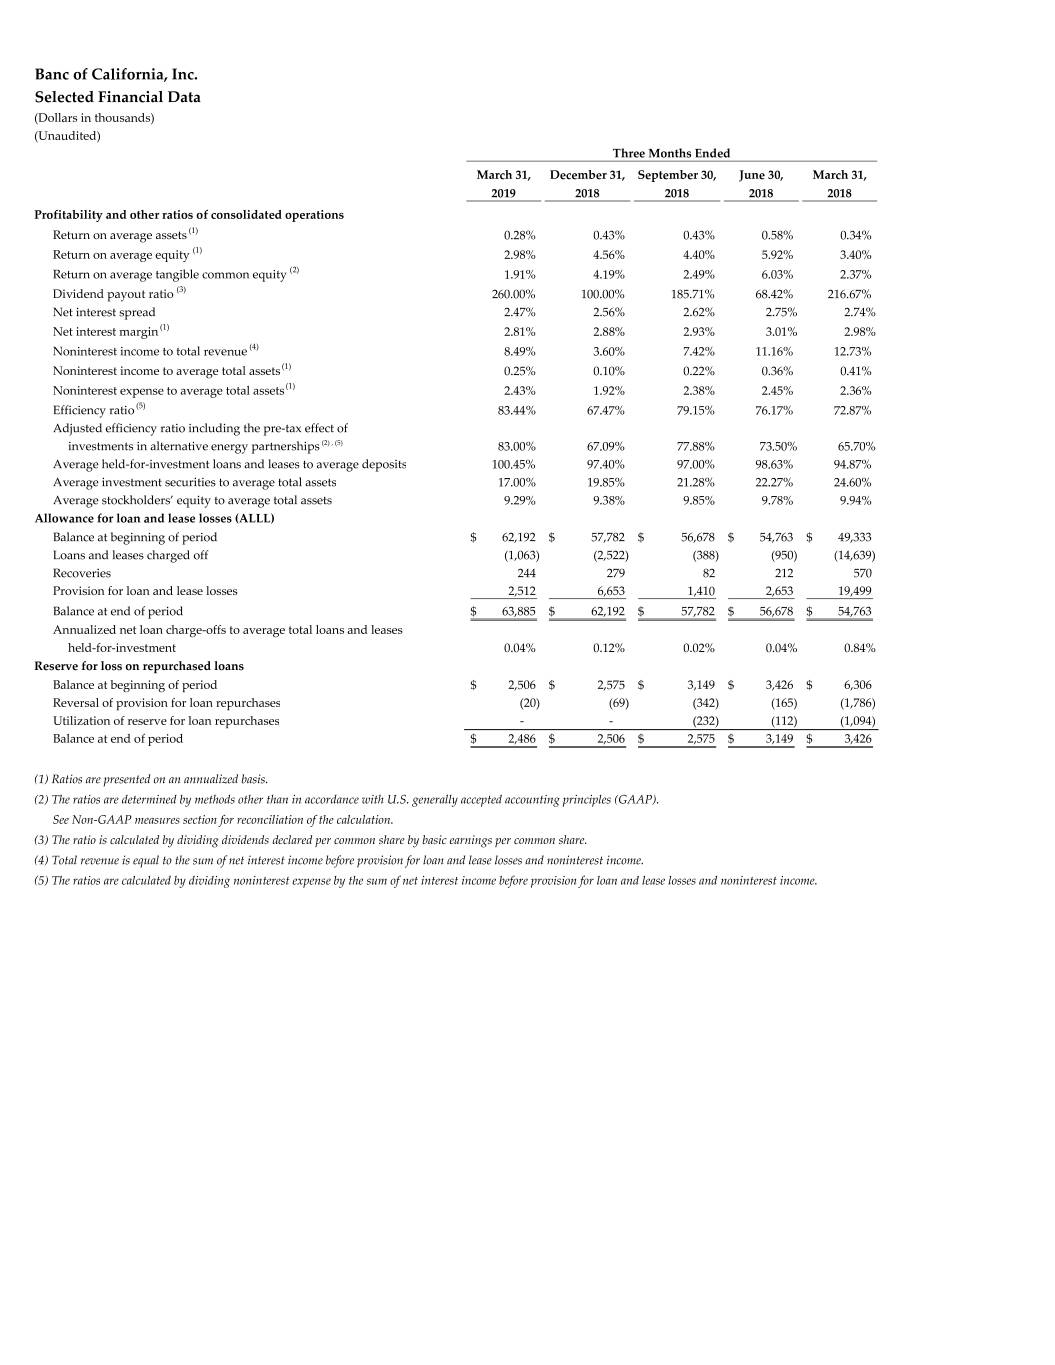
Banc of California, Inc. Selected Financial Data (Dollars in thousands) (Unaudited) Three Months Ended March 31, December 31, September 30, June 30, March 31, 2019 2018 2018 2018 2018 Profitability and other ratios of consolidated operations Return on average assets (1) 0.28% 0.43% 0.43% 0.58% 0.34% Return on average equity (1) 2.98% 4.56% 4.40% 5.92% 3.40% Return on average tangible common equity (2) 1.91% 4.19% 2.49% 6.03% 2.37% Dividend payout ratio (3) 260.00% 100.00% 185.71% 68.42% 216.67% Net interest spread 2.47% 2.56% 2.62% 2.75% 2.74% Net interest margin (1) 2.81% 2.88% 2.93% 3.01% 2.98% Noninterest income to total revenue (4) 8.49% 3.60% 7.42% 11.16% 12.73% Noninterest income to average total assets (1) 0.25% 0.10% 0.22% 0.36% 0.41% Noninterest expense to average total assets (1) 2.43% 1.92% 2.38% 2.45% 2.36% Efficiency ratio (5) 83.44% 67.47% 79.15% 76.17% 72.87% Adjusted efficiency ratio including the pre‐tax effect of investments in alternative energy partnerships (2) , (5) 83.00% 67.09% 77.88% 73.50% 65.70% Average held‐for‐investment loans and leases to average deposits 100.45% 97.40% 97.00% 98.63% 94.87% Average investment securities to average total assets 17.00% 19.85% 21.28% 22.27% 24.60% Average stockholders’ equity to average total assets 9.29% 9.38% 9.85% 9.78% 9.94% Allowance for loan and lease losses (ALLL) Balance at beginning of period$ 62,192 $ 57,782 $ 56,678 $ 54,763 $ 49,333 Loans and leases charged off (1,063) (2,522) (388) (950) (14,639) Recoveries 244 279 82 212 570 Provision for loan and lease losses 2,512 6,653 1,410 2,653 19,499 Balance at end of period$ 63,885 $ 62,192 $ 57,782 $ 56,678 $ 54,763 Annualized net loan charge‐offs to average total loans and leases held‐for‐investment 0.04% 0.12% 0.02% 0.04% 0.84% Reserve for loss on repurchased loans Balance at beginning of period$ 2,506 $ 2,575 $ 3,149 $ 3,426 $ 6,306 Reversal of provision for loan repurchases (20) (69) (342) (165) (1,786) Utilization of reserve for loan repurchases ‐ ‐ (232) (112) (1,094) Balance at end of period$ 2,486 $ 2,506 $ 2,575 $ 3,149 $ 3,426 (1) Ratios are presented on an annualized basis. (2) The ratios are determined by methods other than in accordance with U.S. generally accepted accounting principles (GAAP). See Non‐GAAP measures section for reconciliation of the calculation. (3) The ratio is calculated by dividing dividends declared per common share by basic earnings per common share. (4) Total revenue is equal to the sum of net interest income before provision for loan and lease losses and noninterest income. (5) The ratios are calculated by dividing noninterest expense by the sum of net interest income before provision for loan and lease losses and noninterest income.
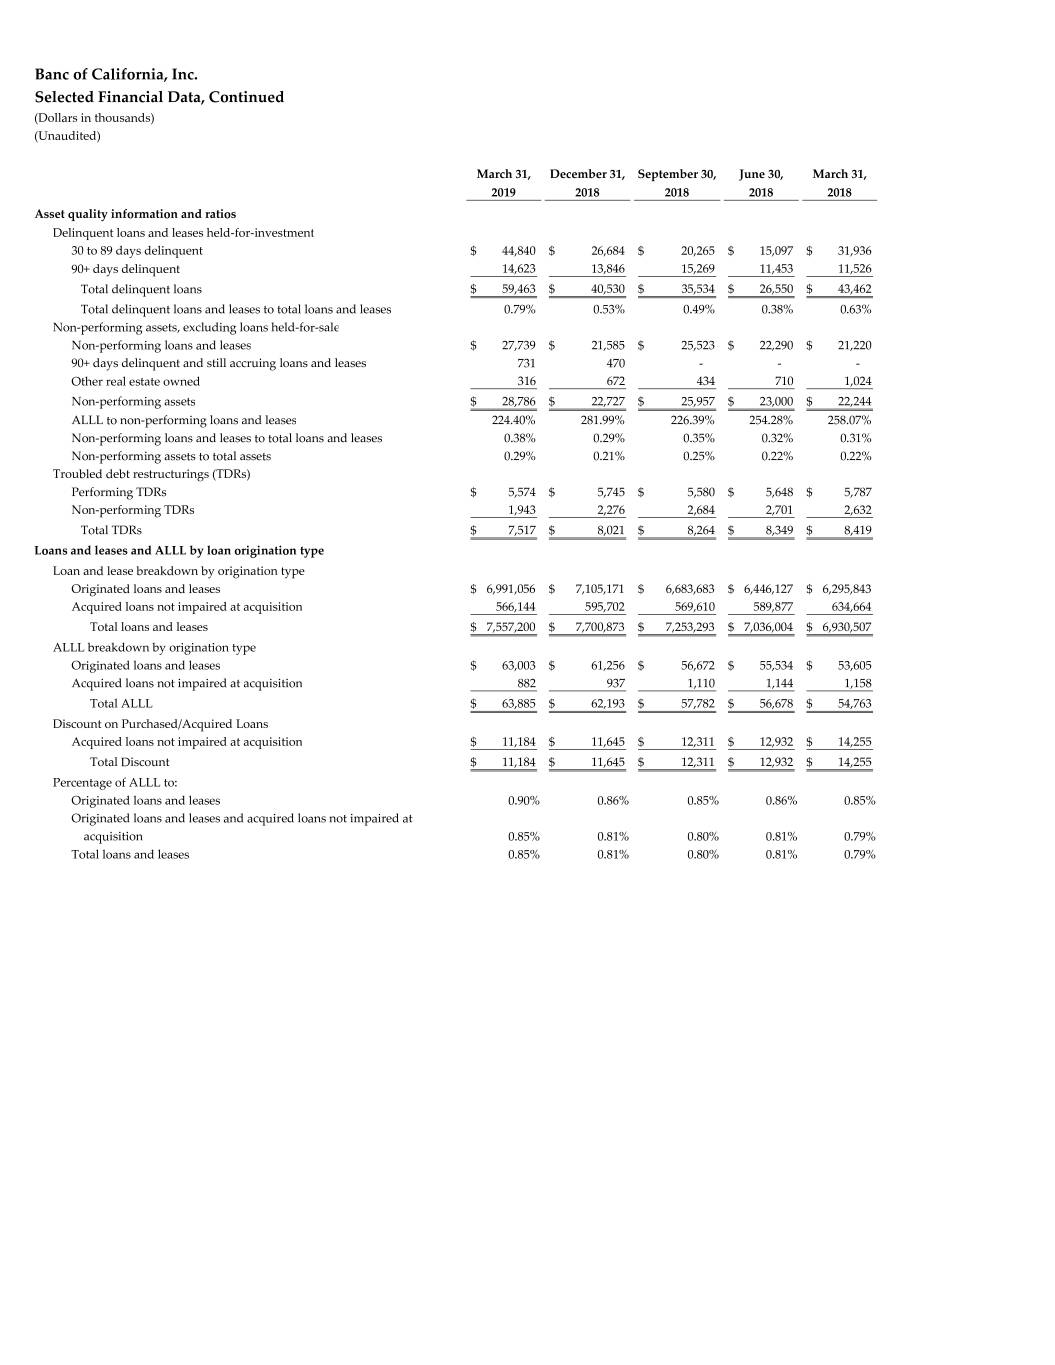
Banc of California, Inc. Selected Financial Data, Continued (Dollars in thousands) (Unaudited) March 31, December 31, September 30, June 30, March 31, 2019 2018 2018 2018 2018 Asset quality information and ratios Delinquent loans and leases held‐for‐investment 30 to 89 days delinquent $ 44,840 $ 26,684 $ 20,265 $ 15,097 $ 31,936 90+ days delinquent 14,623 13,846 15,269 11,453 11,526 Total delinquent loans $ 59,463 $ 40,530 $ 35,534 $ 26,550 $ 43,462 Total delinquent loans and leases to total loans and leases 0.79% 0.53% 0.49% 0.38% 0.63% Non‐performing assets, excluding loans held‐for‐sale Non‐performing loans and leases $ 27,739 $ 21,585 $ 25,523 $ 22,290 $ 21,220 90+ days delinquent and still accruing loans and leases 731 470 ‐ ‐ ‐ Other real estate owned 316 672 434 710 1,024 Non‐performing assets $ 28,786 $ 22,727 $ 25,957 $ 23,000 $ 22,244 ALLL to non‐performing loans and leases 224.40% 281.99% 226.39% 254.28% 258.07% Non‐performing loans and leases to total loans and leases 0.38% 0.29% 0.35% 0.32% 0.31% Non‐performing assets to total assets 0.29% 0.21% 0.25% 0.22% 0.22% Troubled debt restructurings (TDRs) Performing TDRs$ 5,574 $ 5,745 $ 5,580 $ 5,648 $ 5,787 Non‐performing TDRs 1,943 2,276 2,684 2,701 2,632 Total TDRs$ 7,517 $ 8,021 $ 8,264 $ 8,349 $ 8,419 Loans and leases and ALLL by loan origination type Loan and lease breakdown by origination type Originated loans and leases$ 6,991,056 $ 7,105,171 $ 6,683,683 $ 6,446,127 $ 6,295,843 Acquired loans not impaired at acquisition 566,144 595,702 569,610 589,877 634,664 Total loans and leases$ 7,557,200 $ 7,700,873 $ 7,253,293 $ 7,036,004 $ 6,930,507 ALLL breakdown by origination type Originated loans and leases$ 63,003 $ 61,256 $ 56,672 $ 55,534 $ 53,605 Acquired loans not impaired at acquisition 882 937 1,110 1,144 1,158 Total ALLL$ 63,885 $ 62,193 $ 57,782 $ 56,678 $ 54,763 Discount on Purchased/Acquired Loans Acquired loans not impaired at acquisition $ 11,184 $ 11,645 $ 12,311 $ 12,932 $ 14,255 Total Discount$ 11,184 $ 11,645 $ 12,311 $ 12,932 $ 14,255 Percentage of ALLL to: Originated loans and leases 0.90% 0.86% 0.85% 0.86% 0.85% Originated loans and leases and acquired loans not impaired at acquisition 0.85% 0.81% 0.80% 0.81% 0.79% Total loans and leases 0.85% 0.81% 0.80% 0.81% 0.79%

Banc of California, Inc. Selected Financial Data, Continued (Dollars in thousands) (Unaudited) March 31, December 31, September 30, June 30, March 31, 2019 2018 2018 2018 2018 Composition of held‐for‐investment loans and leases Commercial real estate$ 865,521 $ 867,013 $ 823,193 $ 793,855 $ 773,193 Multifamily 2,332,527 2,241,246 2,112,190 1,959,965 1,944,082 Construction 211,549 203,976 200,294 211,110 200,766 Commercial and industrial 1,907,102 1,944,142 1,673,055 1,742,559 1,638,559 SBA 74,998 68,741 71,494 78,092 79,022 Lease financing ‐ ‐ ‐ ‐ 3 Total commercial loans 5,391,697 5,325,118 4,880,226 4,785,581 4,635,625 Single family residential mortgage 2,102,694 2,305,490 2,300,069 2,174,183 2,201,358 Other consumer 62,809 70,265 72,998 76,240 93,524 Total consumer loans 2,165,503 2,375,755 2,373,067 2,250,423 2,294,882 Total gross loans and leases$ 7,557,200 $ 7,700,873 $ 7,253,293 $ 7,036,004 $ 6,930,507 Composition percentage of held‐for‐investment loans and leases Commercial real estate 11.5% 11.3% 11.3% 11.3% 11.2% Multifamily 30.9% 29.2% 29.1% 27.9% 28.1% Construction 2.8% 2.6% 2.8% 3.0% 2.9% Commercial and industrial 25.2% 25.2% 23.1% 24.8% 23.6% SBA 1.0% 0.9% 1.0% 1.1% 1.1% Lease financing 0.0% 0.0% 0.0% 0.0% 0.0% Total commercial loans 71.4% 69.2% 67.3% 68.1% 66.9% Single family residential mortgage 27.8% 29.9% 31.7% 30.9% 31.8% Other consumer 0.8% 0.9% 1.0% 1.0% 1.3% Total consumer loans 28.6% 30.8% 32.7% 31.9% 33.1% Total gross loans and leases 100.0% 100.0% 100.0% 100.0% 100.0% Composition of deposits Noninterest‐bearing checking $ 1,120,700 $ 1,023,360 $ 1,061,557 $ 1,005,032 $ 1,039,116 Interest‐bearing checking 1,573,499 1,556,410 1,713,790 1,778,400 1,864,629 Money market 899,330 873,153 856,886 1,136,335 1,091,735 Savings 1,151,442 1,265,847 1,269,489 1,175,275 1,051,267 Brokered certificates of deposit 1,295,066 1,543,269 987,771 686,203 974,706 Non‐brokered certificates of deposit 1,684,895 1,654,605 1,512,249 1,354,549 1,088,712 Total deposits$ 7,724,932 $ 7,916,644 $ 7,401,742 $ 7,135,794 $ 7,110,165 Composition percentage of deposits Noninterest‐bearing checking 14.5% 12.9% 14.3% 14.1% 14.6% Interest‐bearing checking 20.4% 19.7% 23.2% 24.9% 26.2% Money market 11.6% 11.0% 11.6% 15.9% 15.4% Savings 14.9% 16.0% 17.2% 16.5% 14.8% Brokered certificates of deposit 16.8% 19.5% 13.3% 9.6% 13.7% Non‐brokered certificates of deposit 21.8% 20.9% 20.4% 19.0% 15.3% Total deposits 100.0% 100.0% 100.0% 100.0% 100.0% Capital Ratios Banc of California, Inc. Total risk‐based capital ratio 14.01% 13.71% 14.05% 14.71% 14.60% Tier 1 risk‐based capital ratio 13.03% 12.77% 13.15% 13.83% 13.74% Common equity tier 1 capital ratio 9.72% 9.53% 9.80% 9.90% 9.80% Tier 1 leverage ratio 8.87% 8.95% 8.99% 9.30% 9.21% Banc of California, NA Total risk‐based capital ratio 15.79% 15.71% 15.94% 16.63% 16.53% Tier 1 risk‐based capital ratio 14.81% 14.77% 15.04% 15.74% 15.67% Common equity tier 1 capital ratio 14.81% 14.77% 15.04% 15.74% 15.67% Tier 1 leverage ratio 10.07% 10.36% 10.29% 10.58% 10.50%
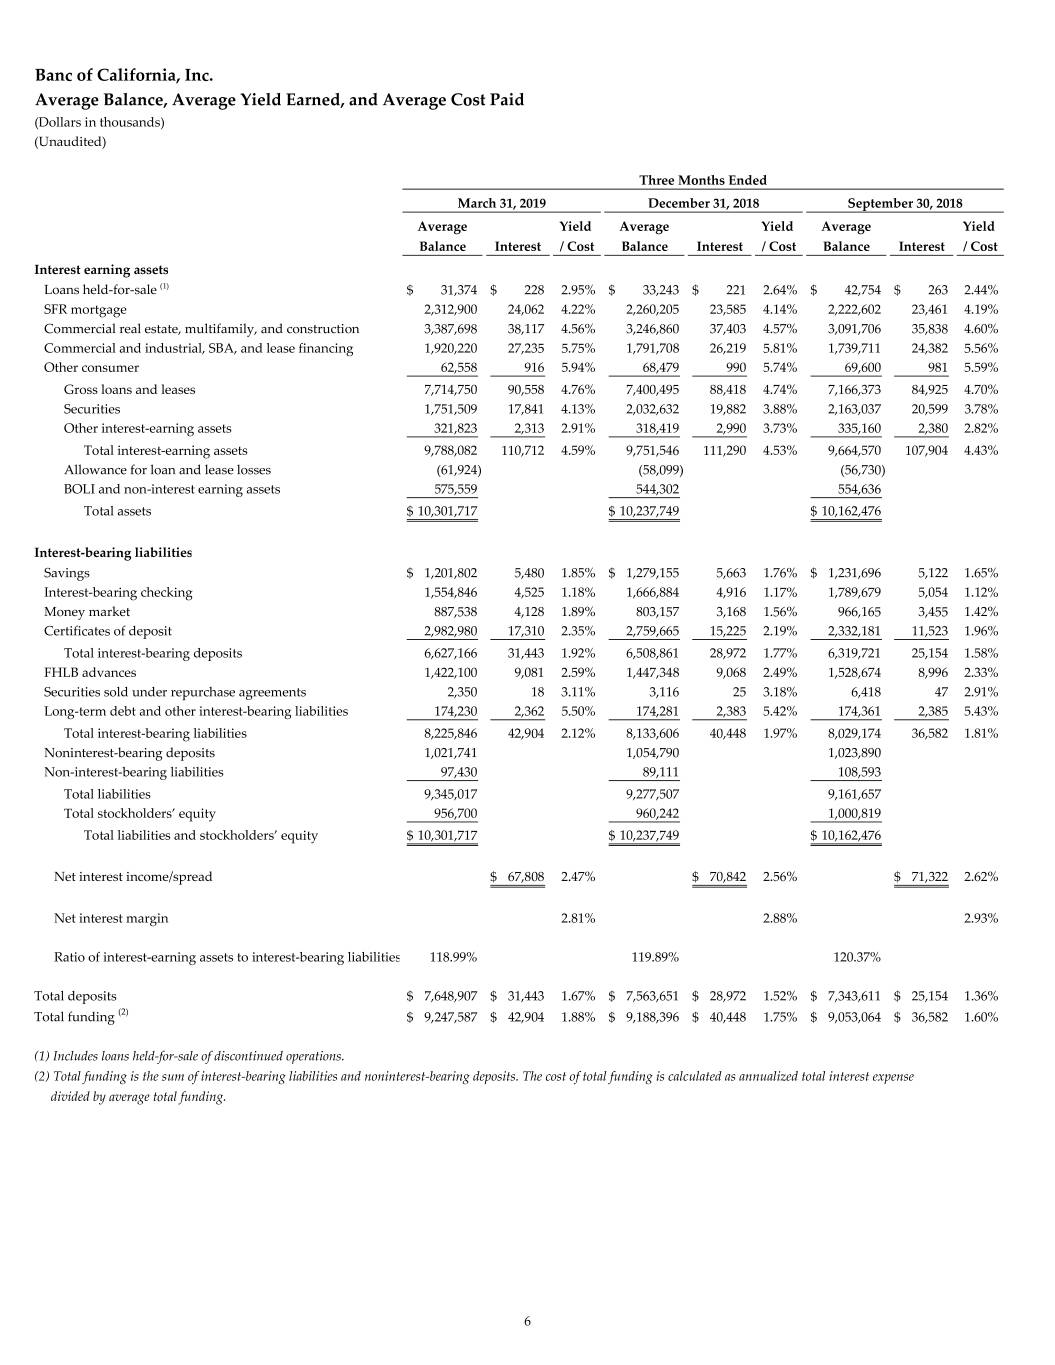
Banc of California, Inc. Average Balance, Average Yield Earned, and Average Cost Paid (Dollars in thousands) (Unaudited) Three Months Ended March 31, 2019 December 31, 2018 September 30, 2018 Average Yield Average Yield Average Yield Balance Interest / Cost Balance Interest / Cost Balance Interest / Cost Interest earning assets Loans held‐for‐sale (1) $ 31,374 $ 228 2.95%$ 33,243 $ 221 2.64%$ 42,754 $ 263 2.44% SFR mortgage 2,312,900 24,062 4.22% 2,260,205 23,585 4.14% 2,222,602 23,461 4.19% Commercial real estate, multifamily, and construction 3,387,698 38,117 4.56% 3,246,860 37,403 4.57% 3,091,706 35,838 4.60% Commercial and industrial, SBA, and lease financing 1,920,220 27,235 5.75% 1,791,708 26,219 5.81% 1,739,711 24,382 5.56% Other consumer 62,558 916 5.94% 68,479 990 5.74% 69,600 981 5.59% Gross loans and leases 7,714,750 90,558 4.76% 7,400,495 88,418 4.74% 7,166,373 84,925 4.70% Securities 1,751,509 17,841 4.13% 2,032,632 19,882 3.88% 2,163,037 20,599 3.78% Other interest‐earning assets 321,823 2,313 2.91% 318,419 2,990 3.73% 335,160 2,380 2.82% Total interest‐earning assets 9,788,082 110,712 4.59% 9,751,546 111,290 4.53% 9,664,570 107,904 4.43% Allowance for loan and lease losses (61,924) (58,099) (56,730) BOLI and non‐interest earning assets 575,559 544,302 554,636 Total assets$ 10,301,717 $ 10,237,749 $ 10,162,476 Interest‐bearing liabilities Savings$ 1,201,802 5,480 1.85%$ 1,279,155 5,663 1.76%$ 1,231,696 5,122 1.65% Interest‐bearing checking 1,554,846 4,525 1.18% 1,666,884 4,916 1.17% 1,789,679 5,054 1.12% Money market 887,538 4,128 1.89% 803,157 3,168 1.56% 966,165 3,455 1.42% Certificates of deposit 2,982,980 17,310 2.35% 2,759,665 15,225 2.19% 2,332,181 11,523 1.96% Total interest‐bearing deposits 6,627,166 31,443 1.92% 6,508,861 28,972 1.77% 6,319,721 25,154 1.58% FHLB advances 1,422,100 9,081 2.59% 1,447,348 9,068 2.49% 1,528,674 8,996 2.33% Securities sold under repurchase agreements 2,350 18 3.11% 3,116 25 3.18% 6,418 47 2.91% Long‐term debt and other interest‐bearing liabilities 174,230 2,362 5.50% 174,281 2,383 5.42% 174,361 2,385 5.43% Total interest‐bearing liabilities 8,225,846 42,904 2.12% 8,133,606 40,448 1.97% 8,029,174 36,582 1.81% Noninterest‐bearing deposits 1,021,741 1,054,790 1,023,890 Non‐interest‐bearing liabilities 97,430 89,111 108,593 Total liabilities 9,345,017 9,277,507 9,161,657 Total stockholders’ equity 956,700 960,242 1,000,819 Total liabilities and stockholders’ equity$ 10,301,717 $ 10,237,749 $ 10,162,476 Net interest income/spread$ 67,808 2.47%$ 70,842 2.56%$ 71,322 2.62% Net interest margin 2.81% 2.88% 2.93% Ratio of interest‐earning assets to interest‐bearing liabilities 118.99% 119.89% 120.37% Total deposits$ 7,648,907 $ 31,443 1.67%$ 7,563,651 $ 28,972 1.52%$ 7,343,611 $ 25,154 1.36% Total funding (2) $ 9,247,587 $ 42,904 1.88%$ 9,188,396 $ 40,448 1.75%$ 9,053,064 $ 36,582 1.60% (1) Includes loans held‐for‐sale of discontinued operations. (2) Total funding is the sum of interest‐bearing liabilities and noninterest‐bearing deposits. The cost of total funding is calculated as annualized total interest expense divided by average total funding. 6

Banc of California, Inc. Average Balance, Average Yield Earned, and Average Cost Paid, Continued (Dollars in thousands) (Unaudited) Three Months Ended June 30, 2018 March 31, 2018 Average Yield Average Yield Balance Interest / Cost Balance Interest / Cost Interest earning assets Loans held‐for‐sale (1) $ 54,791 $ 328 2.40%$ 97,095 $ 297 1.24% SFR mortgage 2,223,608 22,790 4.11% 2,122,666 21,352 4.08% Commercial real estate, multifamily, and construction 2,989,014 33,736 4.53% 2,856,290 31,439 4.46% Commercial and industrial, SBA, and lease financing 1,707,478 23,664 5.56% 1,625,549 20,850 5.20% Other consumer 80,188 978 4.89% 103,676 1,160 4.54% Gross loans and leases 7,055,079 81,496 4.63% 6,805,276 75,098 4.48% Securities 2,279,416 21,455 3.78% 2,525,220 21,631 3.47% Other interest‐earning assets 392,342 2,423 2.48% 407,064 2,164 2.16% Total interest‐earning assets 9,726,837 105,374 4.35% 9,737,560 98,893 4.12% Allowance for loan and lease losses (54,903) (49,257) BOLI and non‐interest earning assets 565,224 574,930 Total assets$ 10,237,158 $ 10,263,233 Interest‐bearing liabilities Savings$ 1,055,693 3,886 1.48%$ 1,055,338 3,300 1.27% Interest‐bearing checking 1,822,856 4,182 0.92% 1,976,160 4,108 0.84% Money market 1,134,280 3,689 1.30% 1,076,117 2,834 1.07% Certificates of deposit 2,079,932 8,558 1.65% 1,906,556 6,553 1.39% Total interest‐bearing deposits 6,092,761 20,315 1.34% 6,014,171 16,795 1.13% FHLB advances 1,827,307 9,539 2.09% 1,711,089 7,392 1.75% Securities sold under repurchase agreements 29,907 211 2.83% 119,543 750 2.54% Long‐term debt and other interest‐bearing liabilities 174,296 2,356 5.42% 174,424 2,332 5.42% Total interest‐bearing liabilities 8,124,271 32,421 1.60% 8,019,227 27,269 1.38% Noninterest‐bearing deposits 1,004,502 1,056,700 Non‐interest‐bearing liabilities 107,529 167,345 Total liabilities 9,236,302 9,243,272 Total stockholders’ equity 1,000,856 1,019,961 Total liabilities and stockholders’ equity$ 10,237,158 $ 10,263,233 Net interest income/spread$ 72,953 2.75%$ 71,624 2.74% Net interest margin 3.01% 2.98% Ratio of interest‐earning assets to interest‐bearing liabilities 119.73% 121.43% Total deposits$ 7,097,263 $ 20,315 1.15%$ 7,070,871 $ 16,795 0.96% Total funding (2) $ 9,128,773 $ 32,421 1.42%$ 9,075,927 $ 27,269 1.22% (1) Includes loans held‐for‐sale of discontinued operations. (2) Total funding is the sum of interest‐bearing liabilities and noninterest‐bearing deposits. The cost of total funding is calculated as annualized total interest expense divided by average total funding. 7
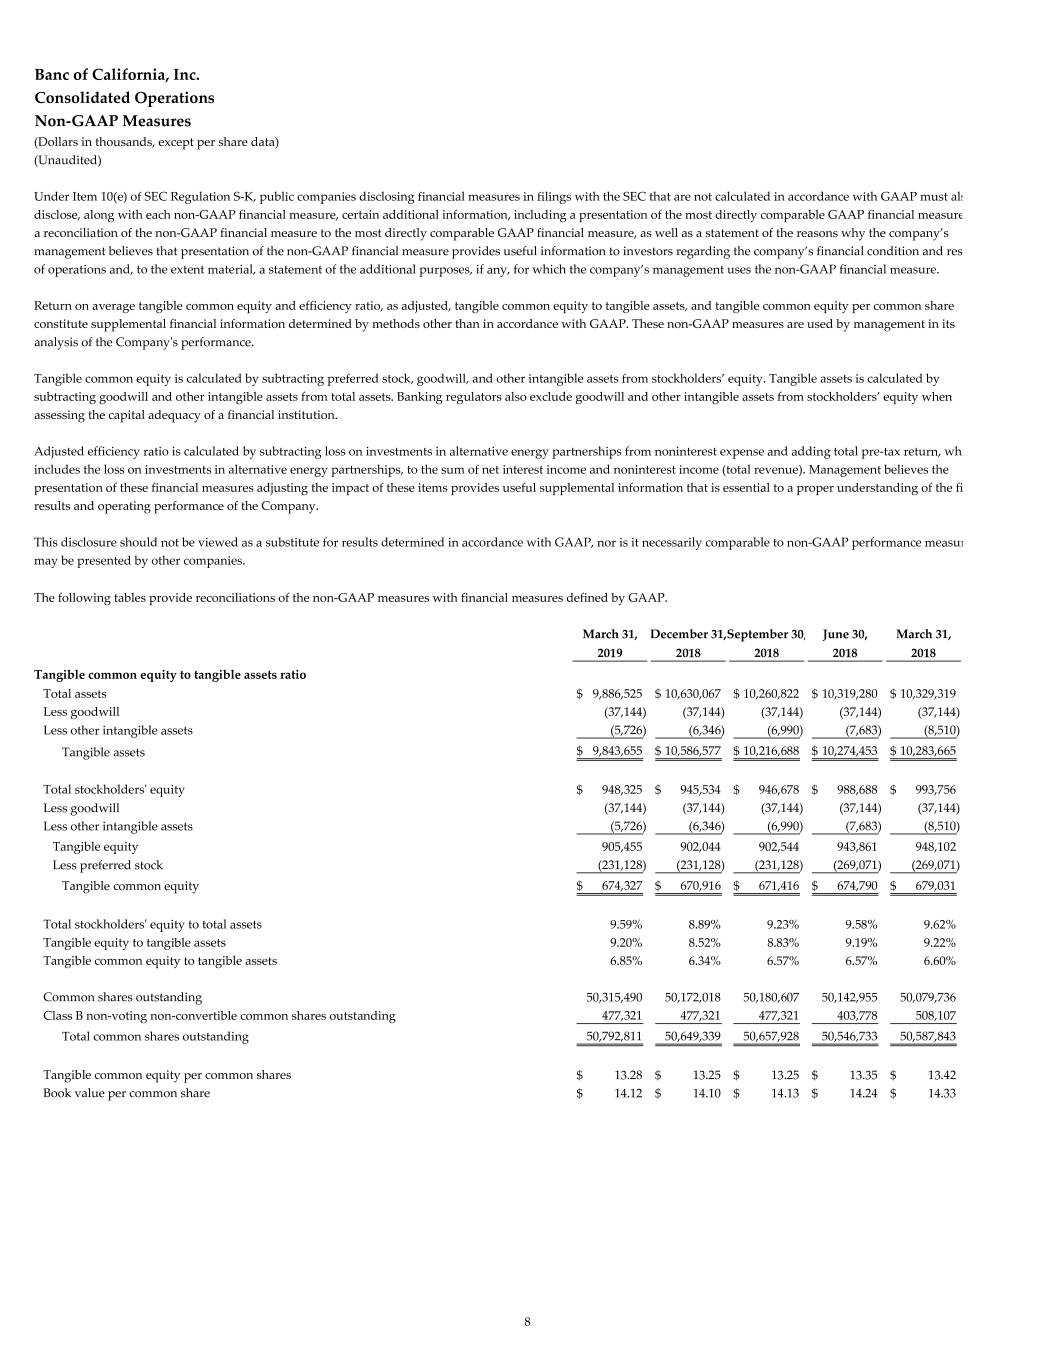
Banc of California, Inc. Consolidated Operations Non‐GAAP Measures (Dollars in thousands, except per share data) (Unaudited) Under Item 10(e) of SEC Regulation S‐K, public companies disclosing financial measures in filings with the SEC that are not calculated in accordance with GAAP must als disclose, along with each non‐GAAP financial measure, certain additional information, including a presentation of the most directly comparable GAAP financial measure a reconciliation of the non‐GAAP financial measure to the most directly comparable GAAP financial measure, as well as a statement of the reasons why the company’s management believes that presentation of the non‐GAAP financial measure provides useful information to investors regarding the company’s financial condition and resu of operations and, to the extent material, a statement of the additional purposes, if any, for which the company’s management uses the non‐GAAP financial measure. Return on average tangible common equity and efficiency ratio, as adjusted, tangible common equity to tangible assets, and tangible common equity per common share constitute supplemental financial information determined by methods other than in accordance with GAAP. These non‐GAAP measures are used by management in its analysis of the Companyʹs performance. Tangible common equity is calculated by subtracting preferred stock, goodwill, and other intangible assets from stockholders’ equity. Tangible assets is calculated by subtracting goodwill and other intangible assets from total assets. Banking regulators also exclude goodwill and other intangible assets from stockholders’ equity when assessing the capital adequacy of a financial institution. Adjusted efficiency ratio is calculated by subtracting loss on investments in alternative energy partnerships from noninterest expense and adding total pre‐tax return, whi includes the loss on investments in alternative energy partnerships, to the sum of net interest income and noninterest income (total revenue). Management believes the presentation of these financial measures adjusting the impact of these items provides useful supplemental information that is essential to a proper understanding of the fi results and operating performance of the Company. This disclosure should not be viewed as a substitute for results determined in accordance with GAAP, nor is it necessarily comparable to non‐GAAP performance measur may be presented by other companies. The following tables provide reconciliations of the non‐GAAP measures with financial measures defined by GAAP. March 31, December 31,September 30, June 30, March 31, 2019 2018 2018 2018 2018 Tangible common equity to tangible assets ratio Total assets $ 9,886,525 $ 10,630,067 $ 10,260,822 $ 10,319,280 $ 10,329,319 Less goodwill (37,144) (37,144) (37,144) (37,144) (37,144) Less other intangible assets (5,726) (6,346) (6,990) (7,683) (8,510) Tangible assets $ 9,843,655 $ 10,586,577 $ 10,216,688 $ 10,274,453 $ 10,283,665 Total stockholdersʹ equity $ 948,325 $ 945,534 $ 946,678 $ 988,688 $ 993,756 Less goodwill (37,144) (37,144) (37,144) (37,144) (37,144) Less other intangible assets (5,726) (6,346) (6,990) (7,683) (8,510) Tangible equity 905,455 902,044 902,544 943,861 948,102 Less preferred stock (231,128) (231,128) (231,128) (269,071) (269,071) Tangible common equity $ 674,327 $ 670,916 $ 671,416 $ 674,790 $ 679,031 Total stockholdersʹ equity to total assets 9.59% 8.89% 9.23% 9.58% 9.62% Tangible equity to tangible assets 9.20% 8.52% 8.83% 9.19% 9.22% Tangible common equity to tangible assets 6.85% 6.34% 6.57% 6.57% 6.60% Common shares outstanding 50,315,490 50,172,018 50,180,607 50,142,955 50,079,736 Class B non‐voting non‐convertible common shares outstanding 477,321 477,321 477,321 403,778 508,107 Total common shares outstanding 50,792,811 50,649,339 50,657,928 50,546,733 50,587,843 Tangible common equity per common shares $ 13.28 $ 13.25 $ 13.25 $ 13.35 $ 13.42 Book value per common share $ 14.12 $ 14.10 $ 14.13 $ 14.24 $ 14.33 8
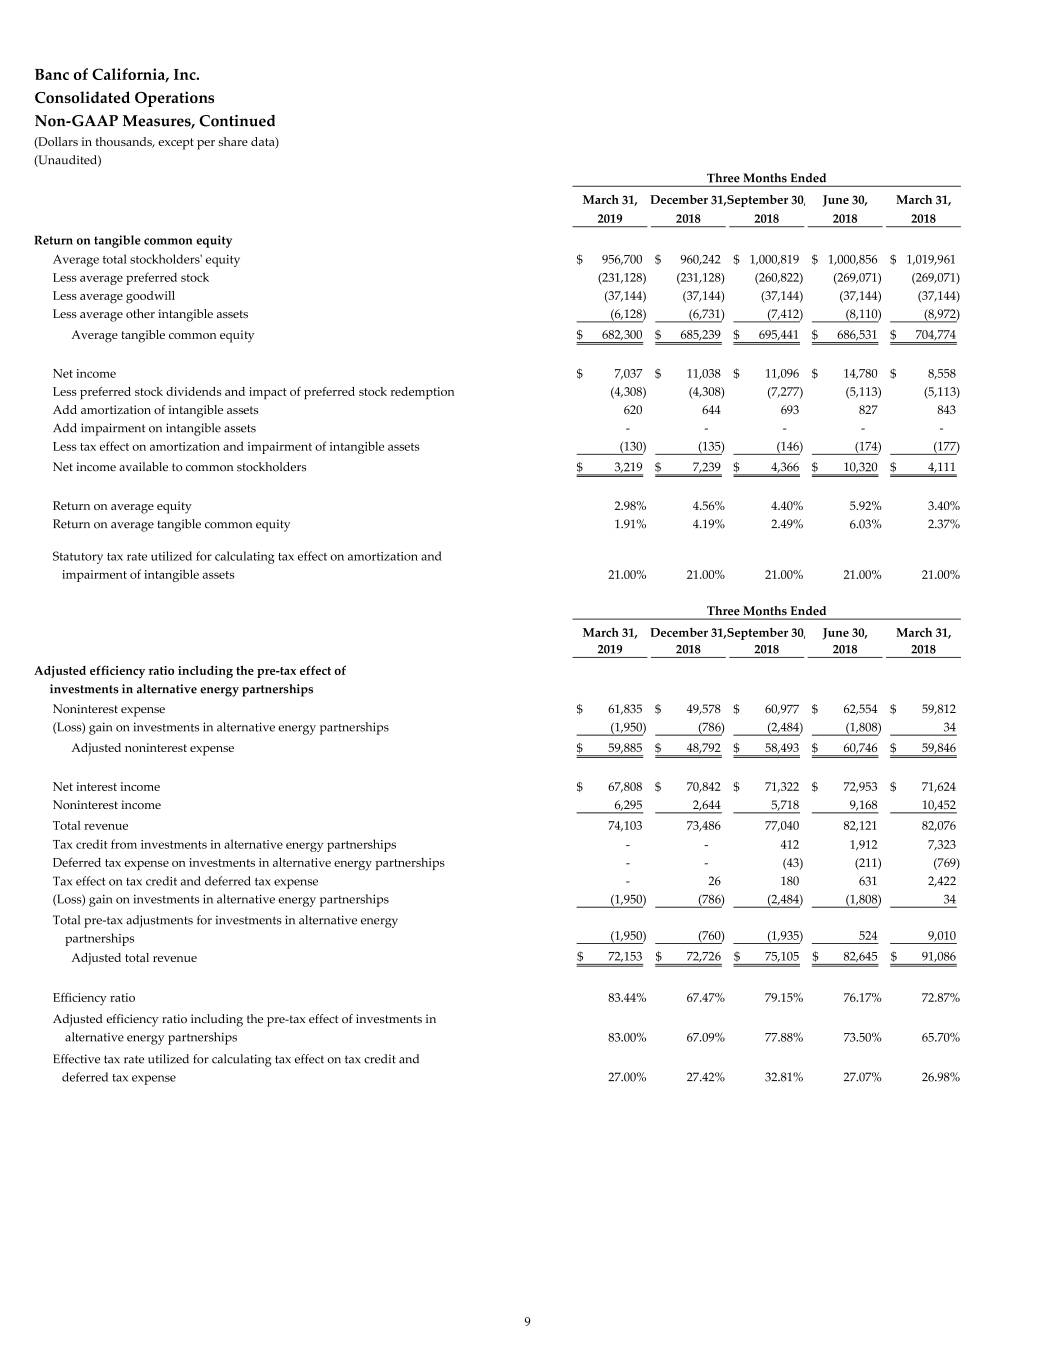
Banc of California, Inc. Consolidated Operations Non‐GAAP Measures, Continued (Dollars in thousands, except per share data) (Unaudited) Three Months Ended March 31, December 31,September 30, June 30, March 31, 2019 2018 2018 2018 2018 Return on tangible common equity Average total stockholdersʹ equity$ 956,700 $ 960,242 $ 1,000,819 $ 1,000,856 $ 1,019,961 Less average preferred stock (231,128) (231,128) (260,822) (269,071) (269,071) Less average goodwill (37,144) (37,144) (37,144) (37,144) (37,144) Less average other intangible assets (6,128) (6,731) (7,412) (8,110) (8,972) Average tangible common equity $ 682,300 $ 685,239 $ 695,441 $ 686,531 $ 704,774 Net income $ 7,037 $ 11,038 $ 11,096 $ 14,780 $ 8,558 Less preferred stock dividends and impact of preferred stock redemption (4,308) (4,308) (7,277) (5,113) (5,113) Add amortization of intangible assets 620 644 693 827 843 Add impairment on intangible assets ‐ ‐ ‐ ‐ ‐ Less tax effect on amortization and impairment of intangible assets (130) (135) (146) (174) (177) Net income available to common stockholders$ 3,219 $ 7,239 $ 4,366 $ 10,320 $ 4,111 Return on average equity 2.98% 4.56% 4.40% 5.92% 3.40% Return on average tangible common equity 1.91% 4.19% 2.49% 6.03% 2.37% Statutory tax rate utilized for calculating tax effect on amortization and impairment of intangible assets 21.00% 21.00% 21.00% 21.00% 21.00% Three Months Ended March 31, December 31,September 30, June 30, March 31, 2019 2018 2018 2018 2018 Adjusted efficiency ratio including the pre‐tax effect of investments in alternative energy partnerships Noninterest expense $ 61,835 $ 49,578 $ 60,977 $ 62,554 $ 59,812 (Loss) gain on investments in alternative energy partnerships (1,950) (786) (2,484) (1,808) 34 Adjusted noninterest expense$ 59,885 $ 48,792 $ 58,493 $ 60,746 $ 59,846 Net interest income $ 67,808 $ 70,842 $ 71,322 $ 72,953 $ 71,624 Noninterest income 6,295 2,644 5,718 9,168 10,452 Total revenue 74,103 73,486 77,040 82,121 82,076 Tax credit from investments in alternative energy partnerships ‐ ‐ 412 1,912 7,323 Deferred tax expense on investments in alternative energy partnerships ‐ ‐ (43) (211) (769) Tax effect on tax credit and deferred tax expense ‐ 26 180 631 2,422 (Loss) gain on investments in alternative energy partnerships (1,950) (786) (2,484) (1,808) 34 Total pre‐tax adjustments for investments in alternative energy partnerships (1,950) (760) (1,935) 524 9,010 Adjusted total revenue $ 72,153 $ 72,726 $ 75,105 $ 82,645 $ 91,086 Efficiency ratio 83.44% 67.47% 79.15% 76.17% 72.87% Adjusted efficiency ratio including the pre‐tax effect of investments in alternative energy partnerships 83.00% 67.09% 77.88% 73.50% 65.70% Effective tax rate utilized for calculating tax effect on tax credit and deferred tax expense 27.00% 27.42% 32.81% 27.07% 26.98% 9


