
INVESTOR PRESENTATIONbancofcal.com 2020 First Quarter Earnings bancofcal.com

FORWARD LOOKING STATEMENTS When used in this presentation and in documents filed with or furnished to the Securities and Exchange Commission (the “SEC”), in press releases or other public stockholder communications, or in oral statements made with the approval of an authorized executive officer, the words or phrases “believe,” “will,” “should,” “will likely result,” “are expected to,” “will continue,” “is anticipated,” “estimate,” “project,” “plans,” or similar expressions are intended to identify “forward-looking statements” within the meaning of the "Safe- Harbor" provisions of the Private Securities Litigation Reform Act of 1995. You are cautioned not to place undue reliance on any forward-looking statements. These statements may relate to future financial performance, strategic plans or objectives, revenue, expense or earnings projections, or other financial items of Banc of California Inc. and its affiliates (“BANC,” the “Company,” “we,” “us” or “our”), as well as the potential effects of the COVID-19 pandemic on the Company’s business, operations, financial performance and prospects. By their nature, these statements are subject to numerous uncertainties that could cause actual results to differ materially from those anticipated in the statements. Factors that could cause actual results to differ materially from the results anticipated or projected include, but are not limited to, the following: (i) the costs and effects of litigation generally, including legal fees and other expenses, settlements and judgments; (ii) the effect of the novel coronavirus (COVID-19) pandemic and steps taken by governmental and other authorities to contain, mitigate and combat the pandemic on our business, operations, financial performance and prospects; (iii) the risk that the benefits we realize from exiting the third party mortgage origination and brokered single-family residential lending business will be less than anticipated and that the costs we incur from exiting that business will be greater than anticipated; (iv) the risk that we will not be successful in the implementation of our capital utilization strategy and our other strategies for transitioning to a traditional community bank; (v) risks that the Company’s merger and acquisition transactions may disrupt current plans and operations and lead to difficulties in customer and employee retention, risks that the costs, fees, expenses and charges related to these transactions could be significantly higher than anticipated and risks that the expected revenues, cost savings, synergies and other benefits of these transactions might not be realized to the extent anticipated, within the anticipated timetables, or at all; (vi) the credit risks of lending activities, which may be affected by deterioration in real estate markets and the financial condition of borrowers, and the operational risk of lending activities, including but not limited to the effectiveness of our underwriting practices and the risk of fraud, any of which may lead to increased loan and lease delinquencies, losses and nonperforming assets in our loan and lease portfolio, and may result in our allowance for credit losses not being adequate and require us to materially increase our loan and lease loss reserves; (vii) the quality and composition of our securities portfolio; (viii) changes in general economic conditions, either nationally or in our market areas, or changes in financial markets; (ix) continuation of or changes in the short-term interest rate environment, changes in the levels of general interest rates, volatility in the interest rate environment, the relative differences between short- and long-term interest rates, deposit interest rates, our net interest margin and funding sources; (x) fluctuations in the demand for loans and leases, and fluctuations in commercial and residential real estate values in our market area; (xi) our ability to develop and maintain a strong core deposit base or other low cost funding sources necessary to fund our activities; (xii) results of examinations of us by regulatory authorities and the possibility that any such regulatory authority may, among other things, limit our business activities, require us to change our business mix, restrict our ability to invest in certain assets, increase our allowance for credit losses, write-down asset values or increase our capital levels, affect our ability to borrow funds or maintain or increase deposits, or impose fines, penalties or sanctions, any of which could adversely affect our liquidity and earnings; (xiii) legislative or regulatory changes that adversely affect our business, including, without limitation, changes in tax laws and policies, changes in privacy laws, and changes in regulatory capital or other rules, and the availability of resources to address or respond to such changes; (xiv) our ability to control operating costs and expenses; (xv) staffing fluctuations in response to product demand or the implementation of corporate strategies that affect our work force and potential associated charges; (xvi) the risk that our enterprise risk management framework may not be effective in mitigating risk and reducing the potential for losses; (xvii) errors in estimates of the fair values of certain of our assets and liabilities, which may result in significant changes in valuation; (xviii) failures or security breaches with respect to the network and computer systems on which we depend, including but not limited to, due to cybersecurity threats; (xix) our ability to attract and retain key members of our senior management team; (xx) increased competitive pressures among financial services companies; (xxi) changes in consumer spending, borrowing and saving habits; (xxii) the effects of severe weather, natural disasters, pandemics, acts of war or terrorism and other external events on our business; (xxiii) the ability of key third-party providers to perform their obligations to us; (xxiv) changes in accounting policies and practices, as may be adopted by the financial institution regulatory agencies or the Financial Accounting Standards Board or their application to our business, including additional guidance and interpretation on accounting issues and details of the implementation of new accounting methods; (xxv) the transition to a new accounting standard adopted by the Financial Accounting Standards Board, referred to as Current Expected Credit Loss, which will require financial institutions to determine periodic estimates of lifetime expected credit losses on loans, and provide for the expected credit losses as allowances for loan losses; (xxvi) share price volatility and reputational risks, related to, among other things, speculative trading and certain traders shorting our common shares and attempting to generate negative publicity about us; (xxvii) war or terrorist activities; and (xxviii) other economic, competitive, governmental, regulatory, and technological factors affecting our operations, pricing, products and services and the other risks described from time to time in other documents that we file with or furnish to the SEC. First Quarter 2020 | 1

FIRST QUARTER 2020 RESULTS ($ in Thousands Except EPS) 1Q20 4Q19 1Q19 Net interest income $ 51,861 $ 56,660 $ 67,808 Pre-tax pre-provision income1 $ 7,003 $ 14,107 $ 11,854 Provision for credit losses $ 15,761 $ (2,976) $ 2,098 Net (loss) income $ (6,593) $ 14,272 $ 7,037 EPS $ (0.19) $ 0.20 $ 0.05 Average assets $ 7,563 $ 7,955 $ 10,302 Net interest margin 2.97% 3.04% 2.81% Allowance for Credit Losses Coverage Ratio 1.45% 1.04% 0.90% Tangible Common Equity to Tangible Assets1 7.96% 8.68% 6.85% Core deposits as % of total loans 94.3% 91.0% 82.9% • Strong capital ratios + reserve provide for buffer against uncertainty • Noninterest-bearing deposits increased $167.6 million to represent 23% of total deposits • Net loss of $6.6 million driven primarily by COVID-19 related credit loss provision under CECL method (1) Denotes a non-GAAP financial measure; see “Non-GAAP Reconciliation” slides at end of presentation First Quarter 2020 | 2
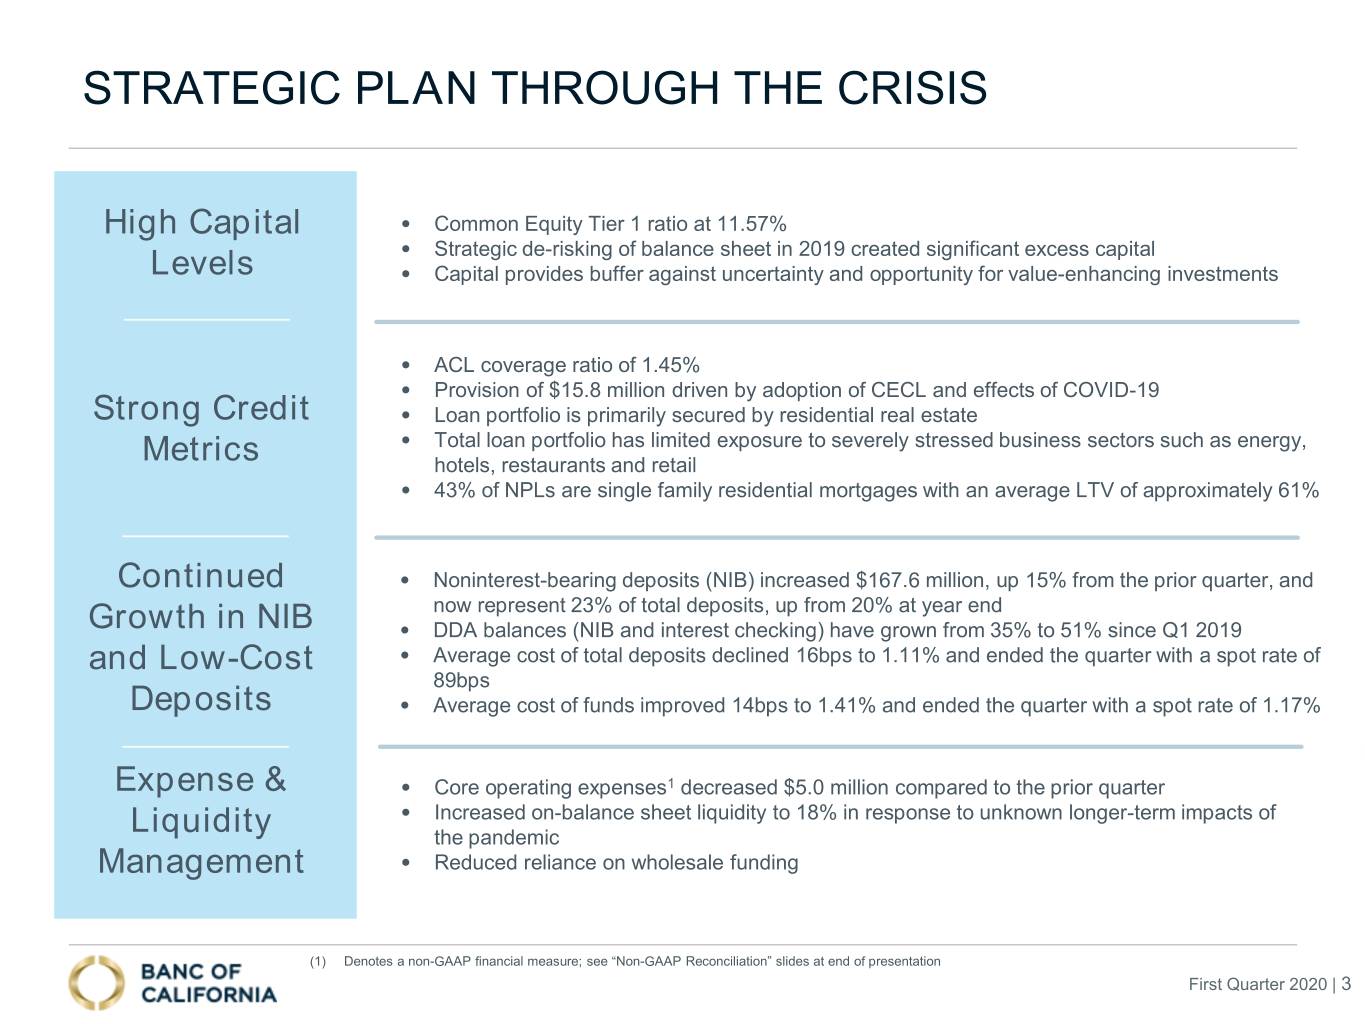
STRATEGIC PLAN THROUGH THE CRISIS High Capital • Common Equity Tier 1 ratio at 11.57% • Strategic de-risking of balance sheet in 2019 created significant excess capital Levels • Capital provides buffer against uncertainty and opportunity for value-enhancing investments • ACL coverage ratio of 1.45% • Provision of $15.8 million driven by adoption of CECL and effects of COVID-19 Strong Credit • Loan portfolio is primarily secured by residential real estate • Total loan portfolio has limited exposure to severely stressed business sectors such as energy, Metrics hotels, restaurants and retail • 43% of NPLs are single family residential mortgages with an average LTV of approximately 61% Continued • Noninterest-bearing deposits (NIB) increased $167.6 million, up 15% from the prior quarter, and now represent 23% of total deposits, up from 20% at year end Growth in NIB • DDA balances (NIB and interest checking) have grown from 35% to 51% since Q1 2019 and Low-Cost • Average cost of total deposits declined 16bps to 1.11% and ended the quarter with a spot rate of 89bps Deposits • Average cost of funds improved 14bps to 1.41% and ended the quarter with a spot rate of 1.17% Expense & • Core operating expenses1 decreased $5.0 million compared to the prior quarter • Increased on-balance sheet liquidity to 18% in response to unknown longer-term impacts of Liquidity the pandemic Management • Reduced reliance on wholesale funding (1) Denotes a non-GAAP financial measure; see “Non-GAAP Reconciliation” slides at end of presentation First Quarter 2020 | 3
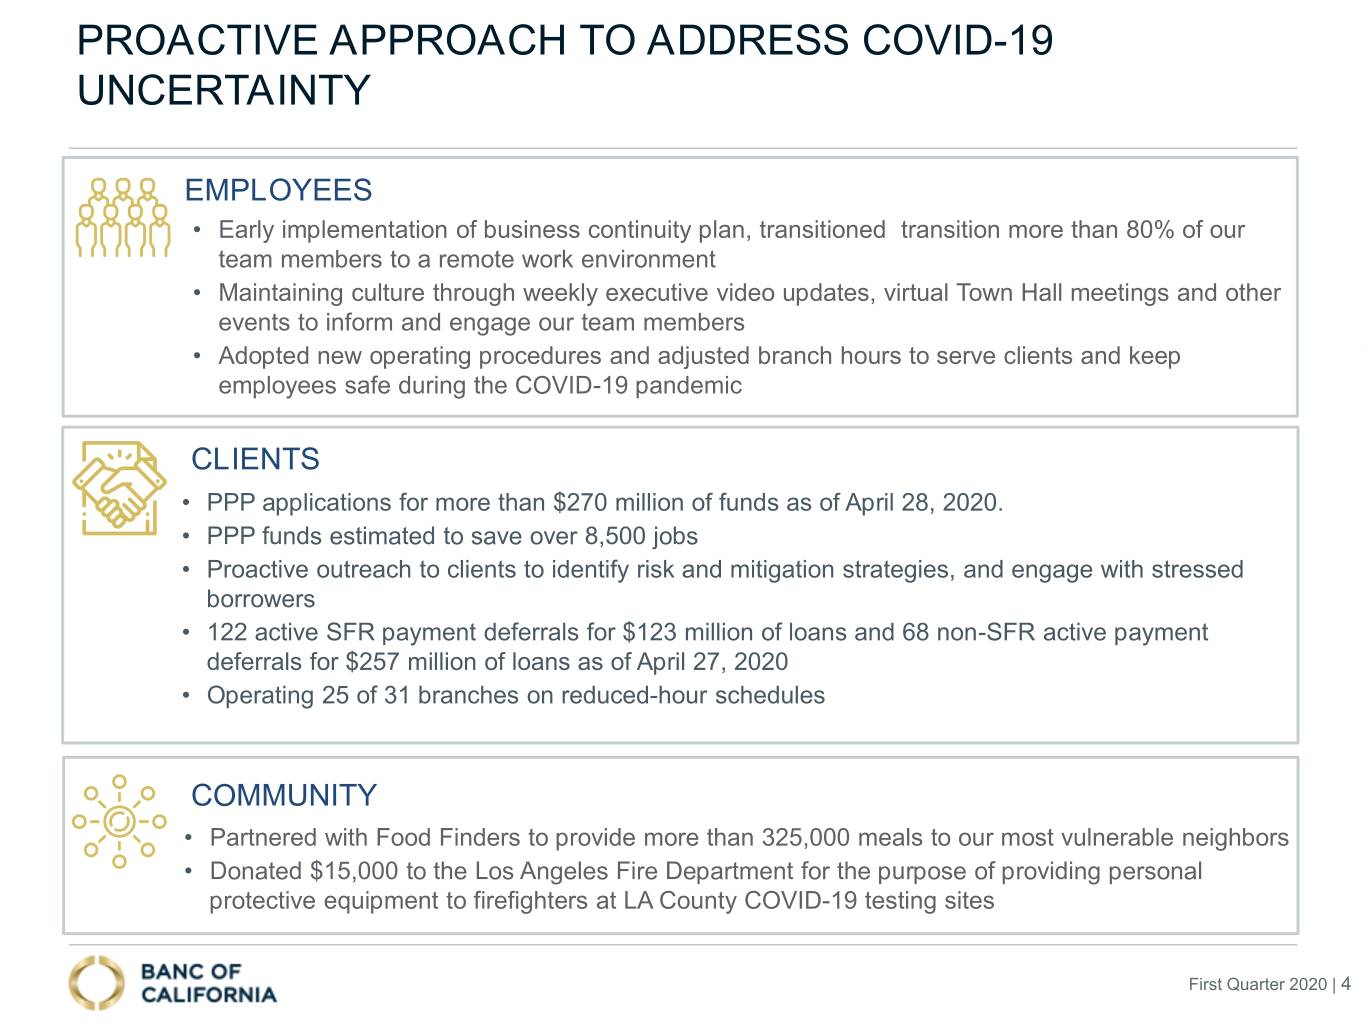
PROACTIVE APPROACH TO ADDRESS COVID-19 UNCERTAINTY EMPLOYEES • Early implementation of business continuity plan, transitioned transition more than 80% of our team members to a remote work environment • Maintaining culture through weekly executive video updates, virtual Town Hall meetings and other events to inform and engage our team members • Adopted new operating procedures and adjusted branch hours to serve clients and keep employees safe during the COVID-19 pandemic CLIENTS • PPP applications for more than $270 million of funds as of April 28, 2020. • PPP funds estimated to save over 8,500 jobs • Proactive outreach to clients to identify risk and mitigation strategies, and engage with stressed borrowers • 122 active SFR payment deferrals for $123 million of loans and 68 non-SFR active payment deferrals for $257 million of loans as of April 27, 2020 • Operating 25 of 31 branches on reduced-hour schedules COMMUNITY • Partnered with Food Finders to provide more than 325,000 meals to our most vulnerable neighbors • Donated $15,000 to the Los Angeles Fire Department for the purpose of providing personal protective equipment to firefighters at LA County COVID-19 testing sites First Quarter 2020 | 4

CECL IMPLEMENTATION WALK THROUGH $ in millions $19.0 $82.1 $6.4 $68.1 ($3.3) $61.7 ($1.7) 1.45%1 1.14%1 1.04%1 ALLL & OBS Day 1 ACL Day 1 Portfolio Charge-offs Economic ACL Day 2 (12/31/19) Adjustment (1/1/20) Changes Forecast (3/31/20) and Other • Day 1: Transition adjustment increased ACL $6.4 million, or 10%, and decreased retained earnings $4.5 million • Day 2: Provision increased ACL $15.8 million due mostly to updated economic forecast – ACL methodology uses a nationally-recognized, third party model that includes many assumptions based on our and peer historical loss data, our current loan portfolio risk profile, and economic forecasts – The economic forecasts used were released during the last week of March and included the onset of the pandemic. These forecasts included a sharp contraction in annualized GDP growth ranging from -13% to -26% and peak unemployment rates ranging from 8% to 13%. All forecasts returned to moderate long-term trends over time – The reserve included qualitative factors to account for our visibility of actual conditions related to our loan portfolio and an economic outlook that was worse than the late March forecasts, including a slower recovery • Capital Relief: Proposed Capital Relief from Day 1 and Day 2 CECL will phase in over three years beginning 1/1/22 • Allowance for Credit Losses (ACL) includes Reserve for Unfunded Commitments (1) Coverage percentage equals ACL to total loans First Quarter 2020 | 5

STRONG CAPITAL BASE 1Q20 4Q19 3Q19 2Q19 1Q19 Common Equity Tier 1 11.57% 11.56% 10.34% 10.50% 9.72% Tier 1 Risk-based Capital 14.91% 14.83% 13.32% 14.03% 13.03% Leverage Ratio 11.20% 10.89% 9.84% 9.62% 8.87% Tangible Equity / Tangible Assets1 10.42% 11.12% 10.01% 9.89% 9.20% Tangible Common Equity / Tangible Assets1 7.96% 8.68% 7.80% 7.41% 6.85% • Strategic decision to exit non-franchise enhancing assets during 2019 resulted in build up of significant capital and steadily improving ratios • Repurchased 827,584 common shares during Q1 2020 for aggregate cost of $12.0 million – Repurchases of common stock suspended after March 16, 2020 until better clarity on length and severity of pandemic • Repurchased 2,033 shares of Series D and 185 shares of Series E preferred stock for an aggregate cost of $1.6 million during Q1 2020 • Capital provides a buffer for the uncertain outlook and optionality to deploy for benefit of shareholders (1) Denotes a non-GAAP financial measure; see “Non-GAAP Reconciliation” slides at end of presentation First Quarter 2020 | 6

DIVERSIFIED LOAN PORTFOLIO Loan Portfolio by Segment Growing Commercial Loan Balances • Continued focus on becoming relationship- C&I SFR focused business bank demonstrated by 28% 26% current loan concentrations Consumer 1% • Reduced reliance on brokered SFR MF segment will improve yields and deposits. SBA 26% 1% CRE 14% Constr. 4% Loan Balances by Segment Loan Segment $ % Avg. Yield $ in millions $ in Millions $2,166 $2,022 $1,835 $1,645 $1,515 C&I $1,578 28% 4.84% Multifamily 1,466 26% 4.50% 73% 72% CRE 810 14% 4.80% 70% 71% 71% Construction 228 4% 6.03% SBA 71 1% 7.79% SFR 1,467 26% 4.01% $5,392 $4,697 $4,548 $4,307 $4,153 Consumer 47 1% 5.38% 1Q19 2Q19 3Q19 4Q19 1Q20 Loans – HFI $5,667 100% 4.54% Commercial SFR & Consumer Commercial / Loans-HFI First Quarter 2020 | 7

REAL ESTATE LOAN PORTOFLIO HAS LOW LTVS Real Estate Loan Balances1 Real Estate1 LTVs $ % Count $ in millions $ in Millions $5,512 <50% $1,028 26% 887 $4,626 $4,459 73% $4,136 $3,971 50% to 60% 1,001 25% 571 60% to 70% 1,466 37% 720 70% to 80% 351 9% 252 70% 70% 69% 69% >80% 125 3% 111 Total $3,971 100% 2,541 1Q19 2Q19 3Q19 4Q19 1Q20 • ~88% of all real estate secured loans have loan-to-values (LTVs) of less than RE Loans RE Loans / Loans-HFI 70% SFR Portfolio by LTV SFR LTVs $ % Count >80% $ in Millions 70% to 4% <50% $393 27% 484 80% <50% 15% 27% 50% to 60% 375 26% 358 60% to 70% 409 28% 418 70% to 80% 226 15% 218 60% to >80% 65 4% 80 70% 50% to 28% 60% Total $1,467 100% 1,558 26% • ~80% of all existing SFR have loan-to- values (LTVs) of less than 70% (1) Excludes credit facilities First Quarter 2020 | 8

CALIFORNIA-CENTRIC CRE AND MULTIFAMILY PORTFOLIO HAVE LOW WEIGHTED-AVERAGE LTV CRE & Multifamily by Collateral Type CRE & Multifamily Portfolio by State AZ All Others Industrial 2% 3% 4% Hospitality NV <1% Other 2% 9% Retail 14% MultiFamily 64% CA Office 93% 9% Collateral Type Count Balance Avg. Loan Size W.A. LTV $ in thousands Multi Family 651 $1,466,083 $2,252 59.9% Office 52 204,731 $3,937 62.3% Retail 91 315,090 $3,463 53.8% Hospitality 6 7,131 $1,188 71.2% Industrial 34 90,446 $2,660 53.6% Other 77 192,627 $2,502 89.1% Total CRE & MF 911 $2,276,107 $2,498 61.5% First Quarter 2020 | 9
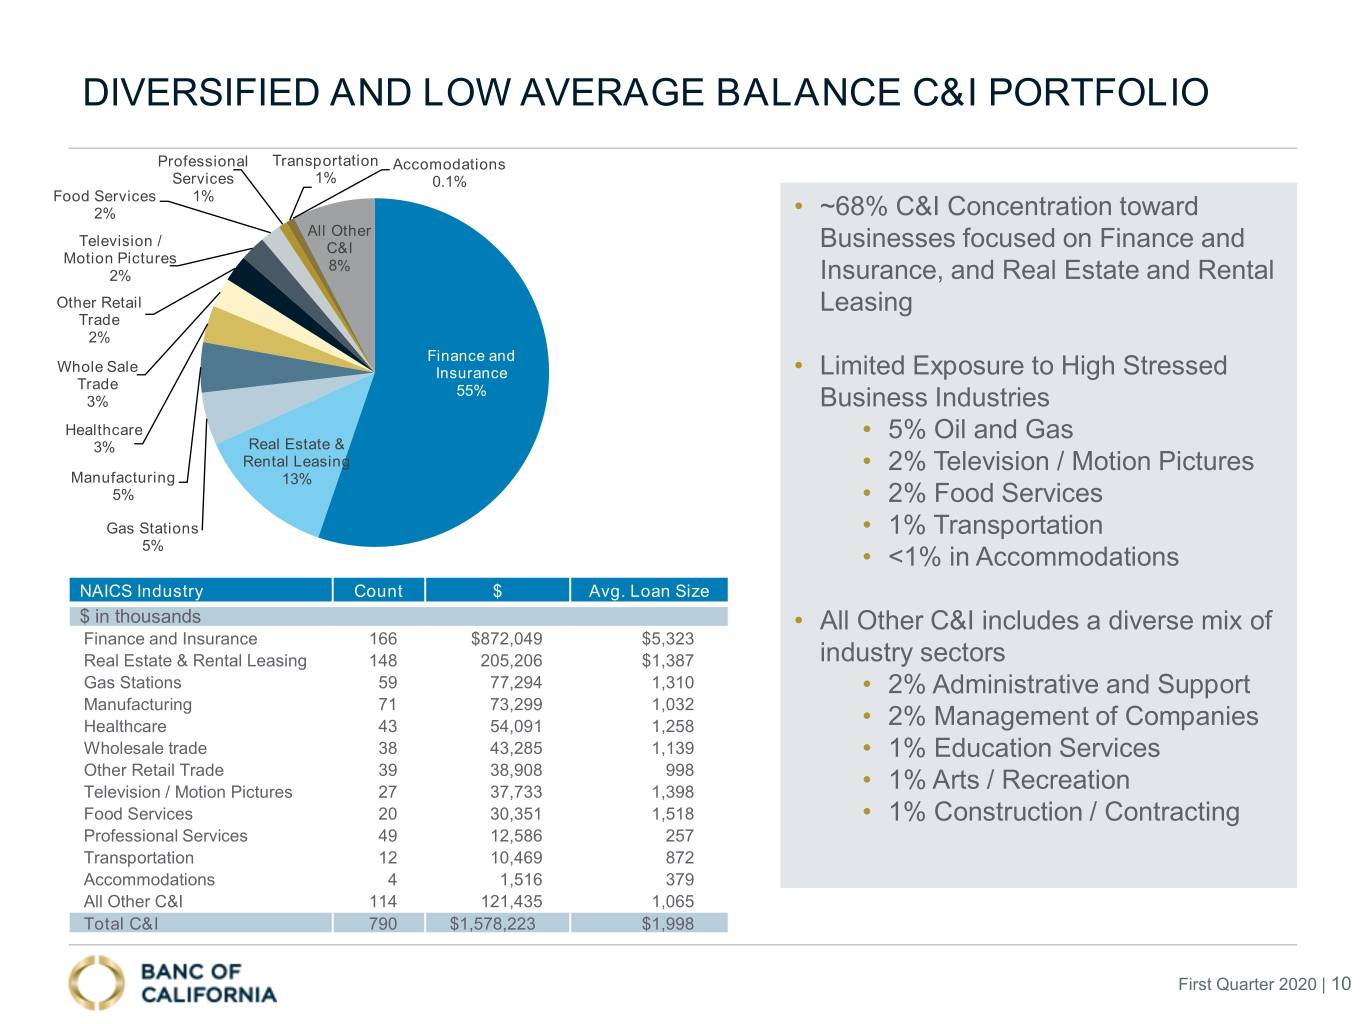
DIVERSIFIED AND LOW AVERAGE BALANCE C&I PORTFOLIO Professional Transportation Accomodations Services 1% 0.1% Food Services 1% 2% • ~68% C&I Concentration toward All Other Television / C&I Businesses focused on Finance and Motion Pictures 8% 2% Insurance, and Real Estate and Rental Other Retail Leasing Trade 2% Finance and Whole Sale Insurance • Limited Exposure to High Stressed Trade 55% 3% Business Industries Healthcare • 5% Oil and Gas 3% Real Estate & Rental Leasing • 2% Television / Motion Pictures Manufacturing 13% 5% • 2% Food Services Gas Stations • 1% Transportation 5% • <1% in Accommodations NAICS Industry Count $ Avg. Loan Size $ in thousands • All Other C&I includes a diverse mix of Finance and Insurance 166 $872,049 $5,323 Real Estate & Rental Leasing 148 205,206 $1,387 industry sectors Gas Stations 59 77,294 1,310 • 2% Administrative and Support Manufacturing 71 73,299 1,032 Healthcare 43 54,091 1,258 • 2% Management of Companies Wholesale trade 38 43,285 1,139 • 1% Education Services Other Retail Trade 39 38,908 998 Television / Motion Pictures 27 37,733 1,398 • 1% Arts / Recreation Food Services 20 30,351 1,518 • 1% Construction / Contracting Professional Services 49 12,586 257 Transportation 12 10,469 872 Accommodations 4 1,516 379 All Other C&I 114 121,435 1,065 Total C&I 790 $1,578,223 $1,998 First Quarter 2020 | 10
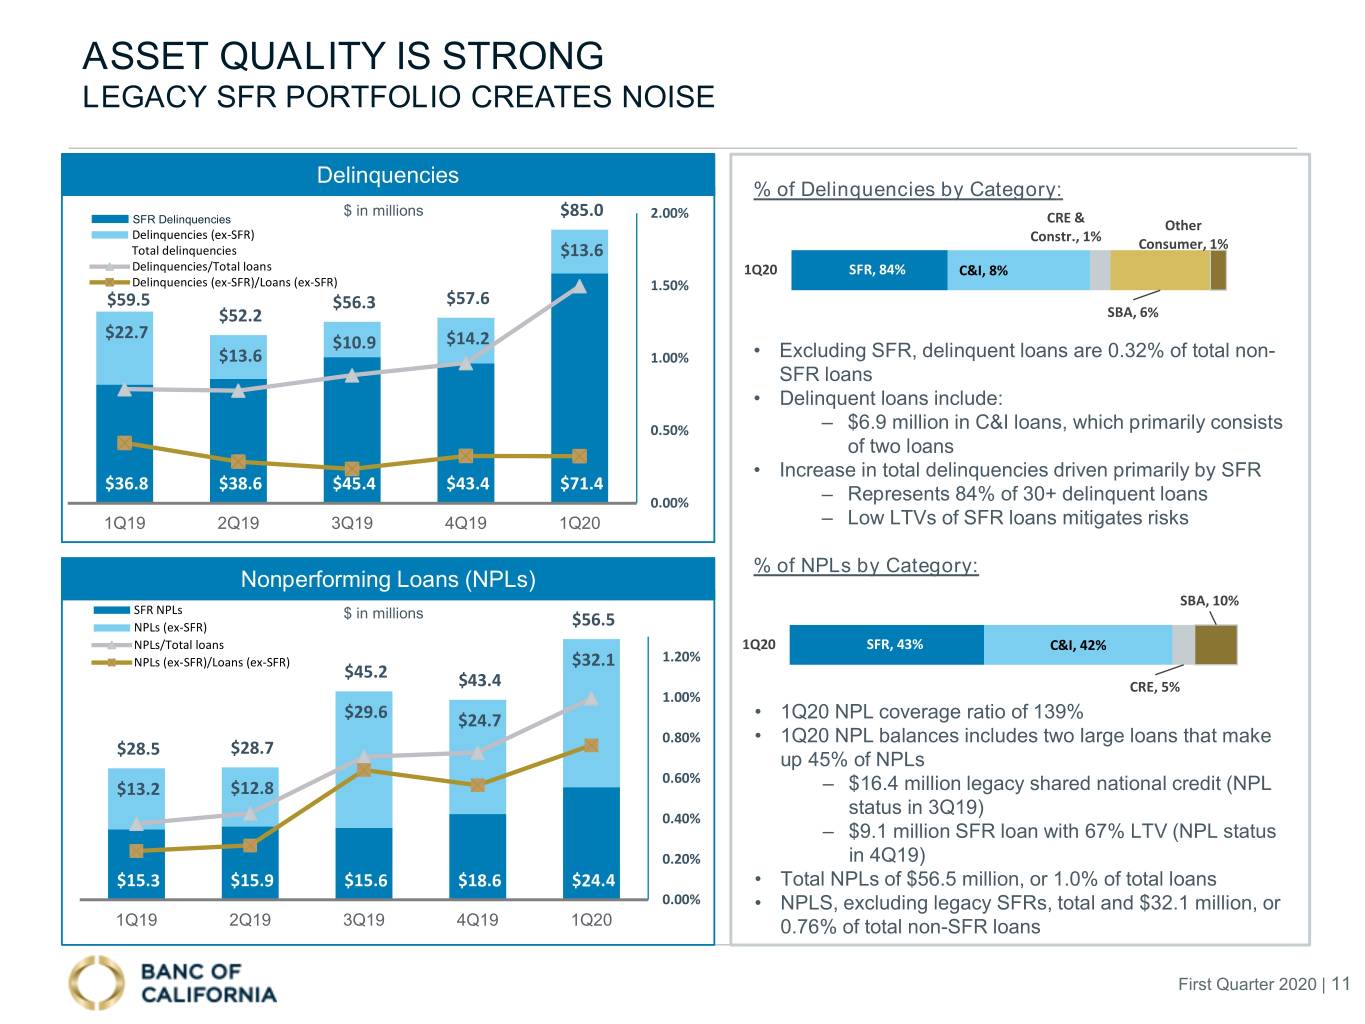
ASSET QUALITY IS STRONG LEGACY SFR PORTFOLIO CREATES NOISE Delinquencies % of Delinquencies by Category: $ in millions SFR Delinquencies $85.0 2.00% CRE & Other Delinquencies (ex-SFR) Constr., 1% Total delinquencies $13.6 Consumer, 1% Delinquencies/Total loans 1Q20 SFR, 84% C&I, 8% Delinquencies (ex-SFR)/Loans (ex-SFR) 1.50% $59.5 $56.3 $57.6 $52.2 SBA, 6% $22.7 $10.9 $14.2 $13.6 1.00% • Excluding SFR, delinquent loans are 0.32% of total non- SFR loans • Delinquent loans include: 0.50% – $6.9 million in C&I loans, which primarily consists of two loans • Increase in total delinquencies driven primarily by SFR $36.8 $38.6 $45.4 $43.4 $71.4 0.00% – Represents 84% of 30+ delinquent loans 1Q19 2Q19 3Q19 4Q19 1Q20 – Low LTVs of SFR loans mitigates risks % of NPLs by Category: Nonperforming Loans (NPLs) SBA, 10% SFR NPLs $ in millions NPLs (ex-SFR) $56.5 NPLs/Total loans 1Q20 SFR, 43% C&I, 42% NPLs (ex-SFR)/Loans (ex-SFR) $32.1 1.20% $45.2 $43.4 CRE, 5% 1.00% $29.6 $24.7 • 1Q20 NPL coverage ratio of 139% 0.80% • 1Q20 NPL balances includes two large loans that make $28.5 $28.7 up 45% of NPLs 0.60% $13.2 $12.8 – $16.4 million legacy shared national credit (NPL status in 3Q19) 0.40% – $9.1 million SFR loan with 67% LTV (NPL status 0.20% in 4Q19) $15.3 $15.9 $15.6 $18.6 $24.4 • Total NPLs of $56.5 million, or 1.0% of total loans 0.00% • NPLS, excluding legacy SFRs, total and $32.1 million, or 1Q19 2Q19 3Q19 4Q19 1Q20 0.76% of total non-SFR loans First Quarter 2020 | 11
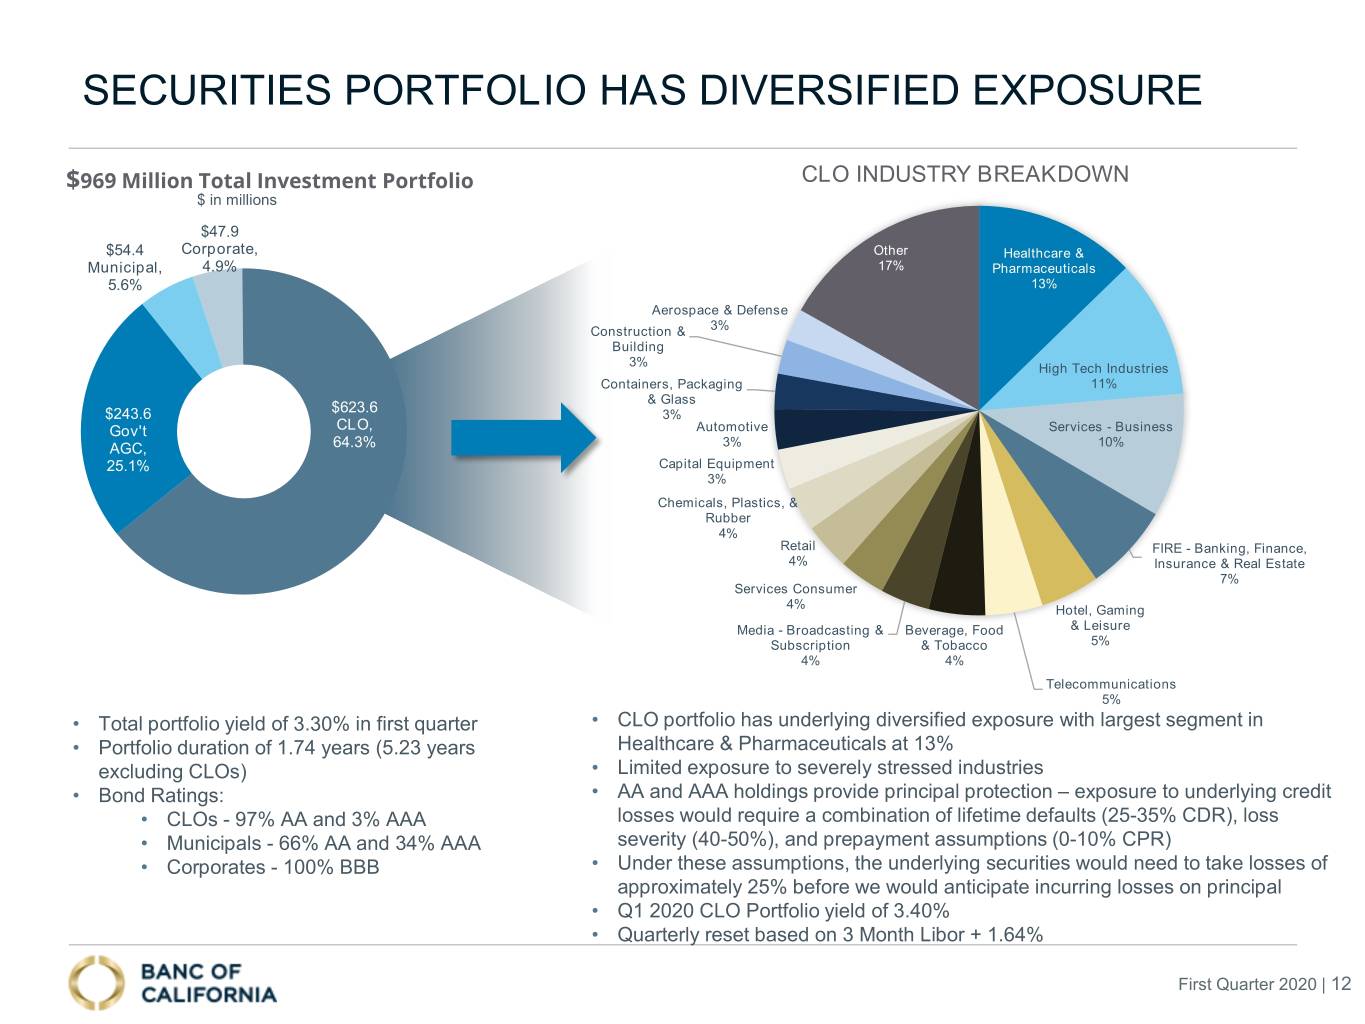
SECURITIES PORTFOLIO HAS DIVERSIFIED EXPOSURE $969 Million Total Investment Portfolio CLO INDUSTRY BREAKDOWN $ in millions $47.9 $54.4 Corporate, Other Healthcare & Municipal, 4.9% 17% Pharmaceuticals 5.6% 13% Aerospace & Defense Construction & 3% Building 3% High Tech Industries Containers, Packaging 11% & Glass $243.6 $623.6 3% Gov't CLO, Automotive Services - Business AGC, 64.3% 3% 10% 25.1% Capital Equipment 3% Chemicals, Plastics, & Rubber 4% Retail FIRE - Banking, Finance, 4% Insurance & Real Estate 7% Services Consumer 4% Hotel, Gaming Media - Broadcasting & Beverage, Food & Leisure Subscription & Tobacco 5% 4% 4% Telecommunications 5% • Total portfolio yield of 3.30% in first quarter • CLO portfolio has underlying diversified exposure with largest segment in • Portfolio duration of 1.74 years (5.23 years Healthcare & Pharmaceuticals at 13% excluding CLOs) • Limited exposure to severely stressed industries • Bond Ratings: • AA and AAA holdings provide principal protection – exposure to underlying credit • CLOs - 97% AA and 3% AAA losses would require a combination of lifetime defaults (25-35% CDR), loss • Municipals - 66% AA and 34% AAA severity (40-50%), and prepayment assumptions (0-10% CPR) • Corporates - 100% BBB • Under these assumptions, the underlying securities would need to take losses of approximately 25% before we would anticipate incurring losses on principal • Q1 2020 CLO Portfolio yield of 3.40% • Quarterly reset based on 3 Month Libor + 1.64% First Quarter 2020 | 12
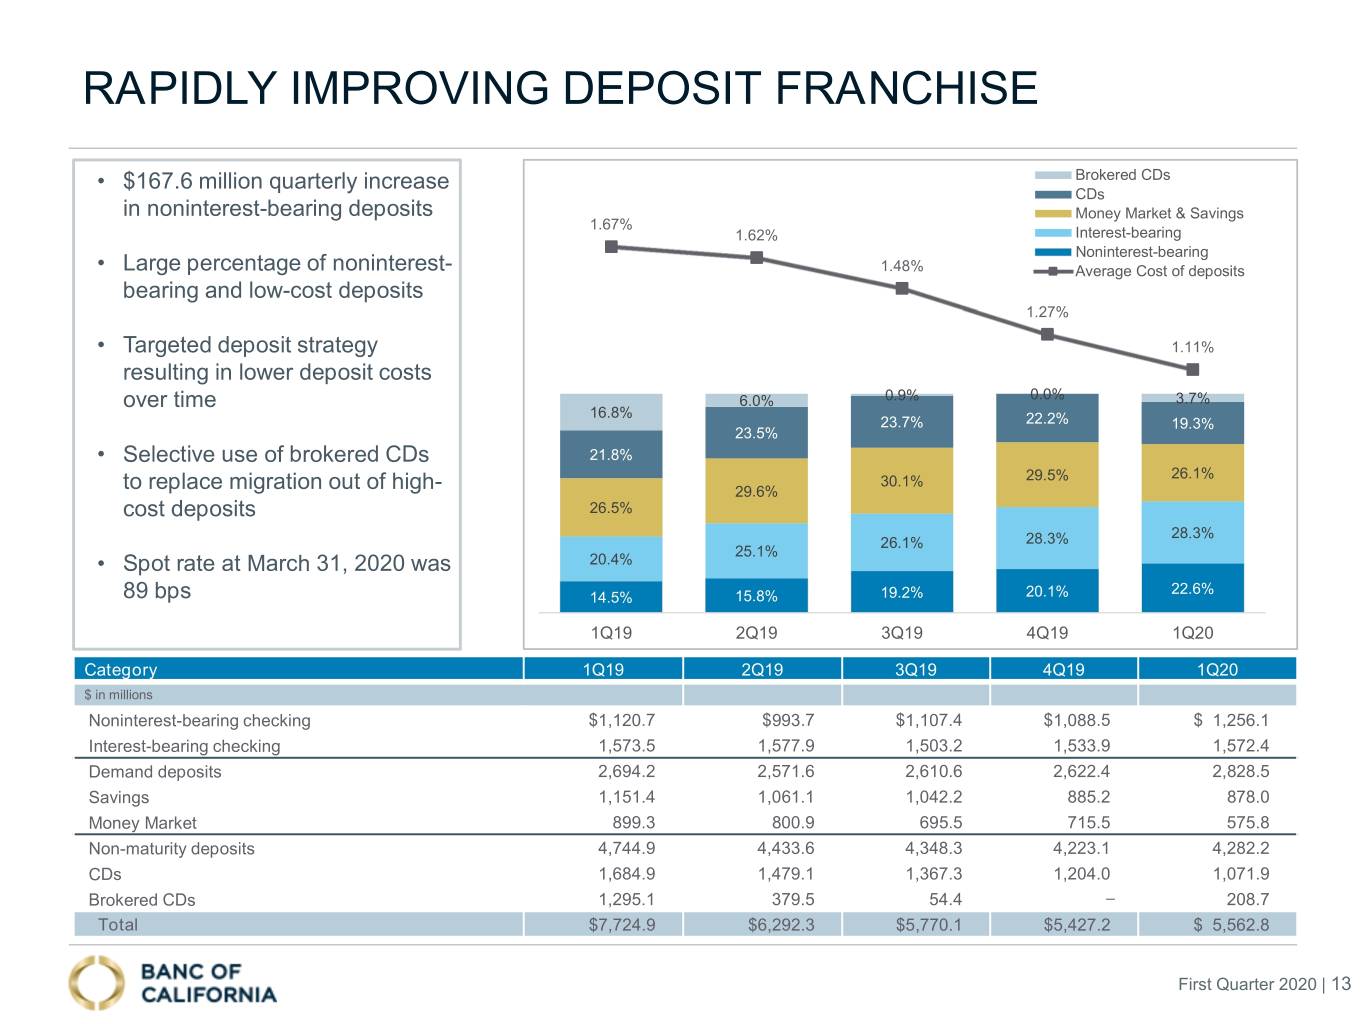
RAPIDLY IMPROVING DEPOSIT FRANCHISE • $167.6 million quarterly increase Brokered CDs CDs in noninterest-bearing deposits Money Market & Savings 1.67% 1.62% Interest-bearing Noninterest-bearing • Large percentage of noninterest- 1.48% Average Cost of deposits bearing and low-cost deposits 1.27% • Targeted deposit strategy 1.11% resulting in lower deposit costs over time 6.0% 0.9% 0.0% 3.7% 16.8% 23.7% 22.2% 19.3% 23.5% • Selective use of brokered CDs 21.8% 26.1% 30.1% 29.5% to replace migration out of high- 29.6% cost deposits 26.5% Cost of Deposits 28.3% 26.1% 28.3% 25.1% • Spot rate at March 31, 2020 was 20.4% 22.6% 89 bps 14.5% 15.8% 19.2% 20.1% 1Q19 2Q19 3Q19 4Q19 1Q20 Category 1Q19 2Q19 3Q19 4Q19 1Q20 $ in millions Noninterest-bearing checking $1,120.7 $993.7 $1,107.4 $1,088.5 $ 1,256.1 Interest-bearing checking 1,573.5 1,577.9 1,503.2 1,533.9 1,572.4 Demand deposits 2,694.2 2,571.6 2,610.6 2,622.4 2,828.5 Savings 1,151.4 1,061.1 1,042.2 885.2 878.0 Money Market 899.3 800.9 695.5 715.5 575.8 Non-maturity deposits 4,744.9 4,433.6 4,348.3 4,223.1 4,282.2 CDs 1,684.9 1,479.1 1,367.3 1,204.0 1,071.9 Brokered CDs 1,295.1 379.5 54.4 ̶ 208.7 Total $7,724.9 $6,292.3 $5,770.1 $5,427.2 $ 5,562.8 First Quarter 2020 | 13

DECLINING DEPOSIT COSTS OFFSET VARIABLE RATE LOAN RESETS TO PROTECT NET INTEREST MARGIN Net Interest Margin Drivers 4.59% 4.59% 4.50% 4.50% 4.27% 3.04% 2.97% 2.81% 2.86% 2.86% 2.50% 2.50% 2.03% 1.85% 1.71% 2.12% 2.09% 2.00% 1.75% 0.25% 1Q19 2Q19 2Q19 4Q19 1Q20 Earning Asset Yield Net Interest Margin Fed Funds Rate Interest-Bearing Liabilities First Quarter 2020 | 14
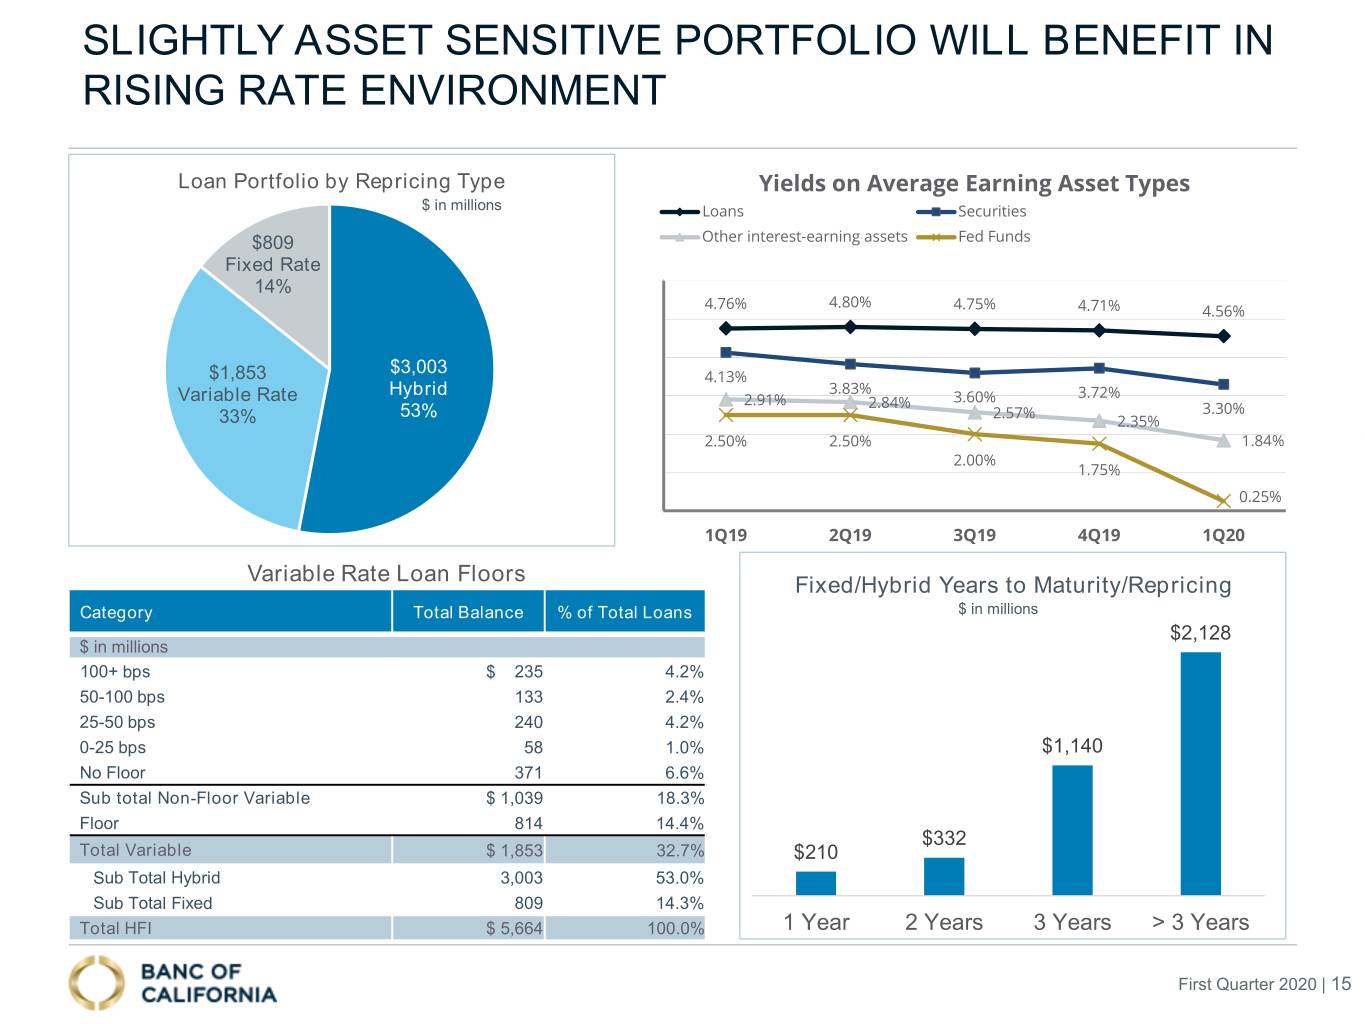
SLIGHTLY ASSET SENSITIVE PORTFOLIO WILL BENEFIT IN RISING RATE ENVIRONMENT Loan Portfolio by Repricing Type Yields on Average Earning Asset Types $ in millions Loans Securities $809 Other interest-earning assets Fed Funds Fixed Rate 14% 6.00% 4.76% 4.80% 4.75% 4.71% 5.00% 4.56% 4.00% $1,853 $3,003 4.13% Hybrid 3.00% 3.83% 3.72% Variable Rate 2.91% 2.84% 3.60% 2.57% 3.30% 33% 53% 2.35% 2.00% 2.50% 2.50% 1.84% 2.00% 1.00% 1.75% 0.25% 0.00% 1Q19 2Q19 3Q19 4Q19 1Q20 Variable Rate Loan Floors Fixed/Hybrid Years to Maturity/Repricing Category Total Balance % of Total Loans $ in millions $2,128 $ in millions 100+ bps $ 235 4.2% 50-100 bps 133 2.4% 25-50 bps 240 4.2% 0-25 bps 58 1.0% $1,140 No Floor 371 6.6% Sub total Non-Floor Variable $ 1,039 18.3% Floor 814 14.4% $332 Total Variable $ 1,853 32.7% $210 Sub Total Hybrid 3,003 53.0% Sub Total Fixed 809 14.3% Total HFI $ 5,664 100.0% 1 Year 2 Years 3 Years > 3 Years First Quarter 2020 | 15
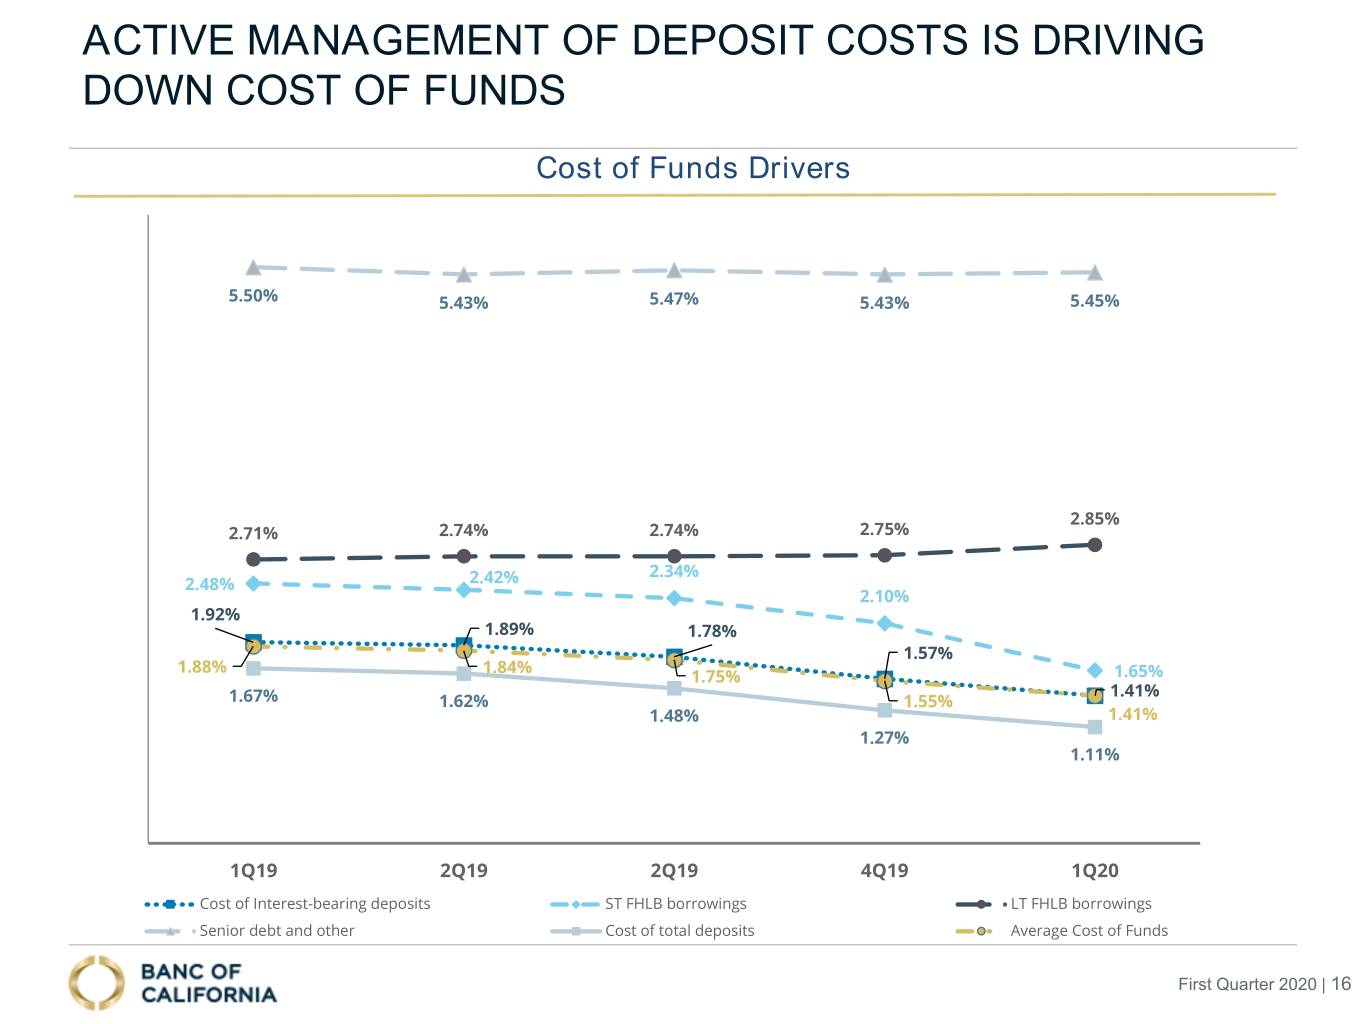
ACTIVE MANAGEMENT OF DEPOSIT COSTS IS DRIVING DOWN COST OF FUNDS Cost of Funds Drivers 5.50% 5.43% 5.47% 5.43% 5.45% 2.85% 2.71% 2.74% 2.74% 2.75% 2.34% 2.48% 2.42% 2.10% 1.92% 1.89% 1.78% 1.57% 1.88% 1.84% 1.75% 1.65% 1.41% 1.67% 1.62% 1.55% 1.48% 1.41% 1.27% 1.11% 1Q19 2Q19 2Q19 4Q19 1Q20 Cost of Interest-bearing deposits ST FHLB borrowings LT FHLB borrowings Senior debt and other Cost of total deposits Average Cost of Funds First Quarter 2020 | 16

CONTINUED FOCUS ON EXPENSE MANAGEMENT • Adjusted noninterest expense1 decreased $5.0 million versus prior quarter • Salaries and employee benefits decreased in line total headcount • Non-core expense/benefits relates to timing of indemnified legal costs/recoveries and loss/gain on investments in alternative energy partnerships2 • Adjusted noninterest expense decreased 21% versus 1Q19 Noninterest Expense to Average Assets Adjusted Noninterest Expense to Average Assets $ in millions $ in millions 2.45% 2.37% 2.50% 2.41% 1.97% 2.30% 1.82% 2.15% 2.06% 2.13% $62 $43 $43 $47 $47 -25% -21% $55 $49 $43 $55 $47 $48 $49 $47 $48 $43 $7 $4 -$6 -$4 -$1 1Q19 2Q19 3Q19 4Q19 1Q20 1Q19 2Q19 3Q19 4Q19 1Q20 Total Non-Core expense Noninterest Expense / Average Assets Adjusted Noninterest Expense Adjusted Noninterest Expense Adjusted Noninterest Expense / Average Assets (1) Denotes a non-GAAP financial measure; see “Non-GAAP Reconciliation” slides at end of presentation (2) Loss on investments in alternative energy partnerships create tax credits to offset expense incurred First Quarter 2020 | 17
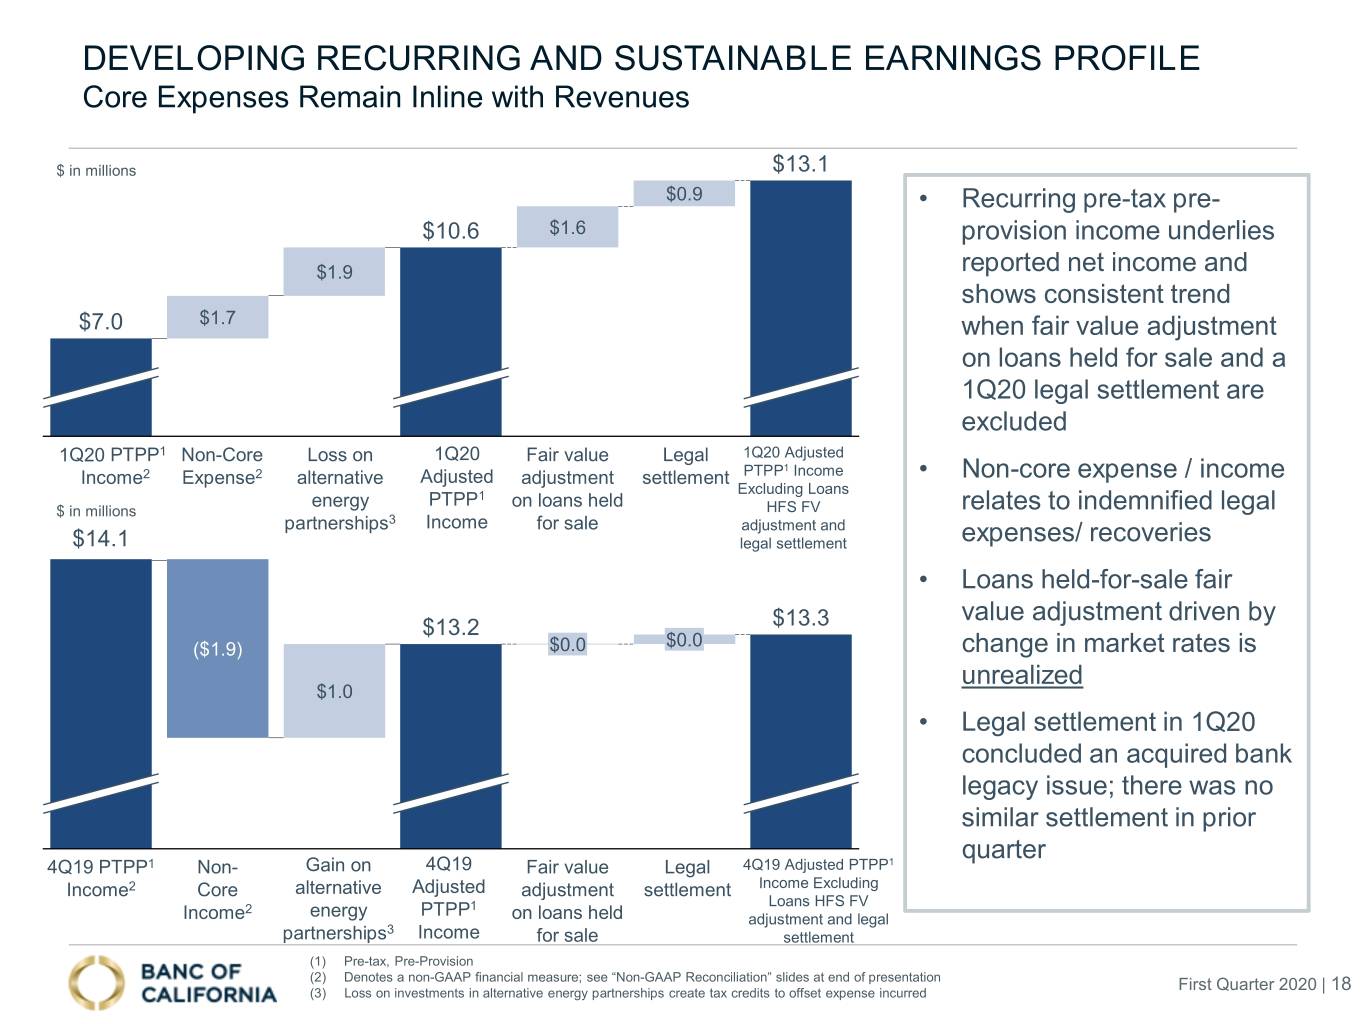
DEVELOPING RECURRING AND SUSTAINABLE EARNINGS PROFILE Core Expenses Remain Inline with Revenues $ in millions $13.1 $0.9 • Recurring pre-tax pre- $10.6 $1.6 provision income underlies $1.9 reported net income and shows consistent trend $7.0 $1.7 when fair value adjustment on loans held for sale and a 1Q20 legal settlement are excluded 1Q20 PTPP1 Non-Core Loss on 1Q20 Fair value Legal 1Q20 Adjusted 1 Income2 Expense2 alternative Adjusted adjustment settlement PTPP Income • Non-core expense / income Excluding Loans energy PTPP1 on loans held $ in millions HFS FV relates to indemnified legal partnerships3 Income for sale adjustment and $14.1 legal settlement expenses/ recoveries • Loans held-for-sale fair value adjustment driven by $13.2 $13.3 ($1.9) $0.0 $0.0 change in market rates is unrealized $1.0 • Legal settlement in 1Q20 concluded an acquired bank legacy issue; there was no similar settlement in prior quarter 4Q19 PTPP1 Non- Gain on 4Q19 Fair value Legal 4Q19 Adjusted PTPP1 Income2 Core alternative Adjusted adjustment settlement Income Excluding 2 1 Loans HFS FV Income energy PTPP on loans held adjustment and legal 3 partnerships Income for sale settlement (1) Pre-tax, Pre-Provision (2) Denotes a non-GAAP financial measure; see “Non-GAAP Reconciliation” slides at end of presentation (3) Loss on investments in alternative energy partnerships create tax credits to offset expense incurred First Quarter 2020 | 18

2020 STRATEGIC OBJECTIVES • Heightened focus and resources added to monitor portfolio even more closely in uncertain Laser Focus on environment • Rely on relationship-lending in our footprint Credit • Well-underwritten credit portfolio mainly secured by CA-based real estate with relatively low LTVs • Growing noninterest-bearing and DDA deposits, continue to improve deposit mix Creating High • Cost of deposits continue to drive down to peer median, with longer term goal of getting below Quality Deposit median Base • High touch relationship-banking for businesses and entrepreneurs driving value creation and growth • Lending teams gaining traction after joining in latter half of 2019 Remix Balance • Legacy SFR and Multifamily payoffs may outpace production in early 2020 • Production expected to outpace payoffs in 2H of 2020, balance sheet relatively flat for 2020 Sheet • Adding to investment portfolio and layering in quality mix of investments • High capital from reduction in balance sheet provides strong buffer in uncertain environment Optimize Use of • Common stock repurchases paused to preserve capital and provide flexibility • Opportunity to redeem preferred at appropriate time Capital • Evaluating other uses of capital that will enhance earnings and improve franchise for the long- term 2020 objectives represent second half of the Company’s transformation in terms of strategic focus and balance sheet composition. With strong capital, improving deposit franchise and relationship focus, progress on 2020 objectives will set up the company for solid performance in 2021 and beyond. First Quarter 2020 | 19
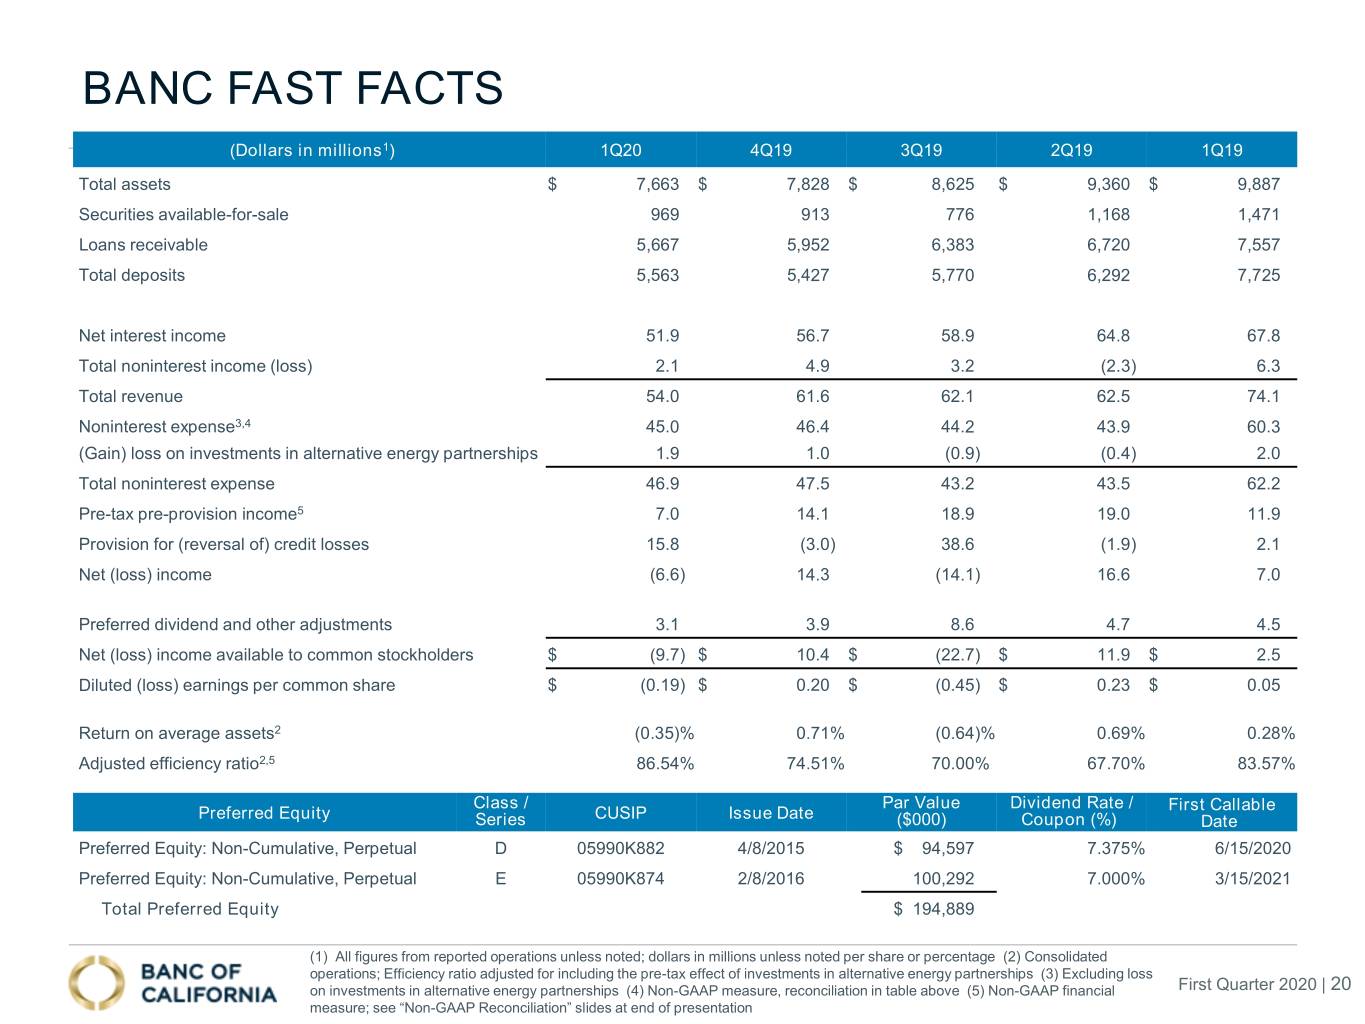
BANC FAST FACTS (Dollars in millions1) 1Q20 4Q19 3Q19 2Q19 1Q19 Total assets $ 7,663 $ 7,828 $ 8,625 $ 9,360 $ 9,887 Securities available-for-sale 969 913 776 1,168 1,471 Loans receivable 5,667 5,952 6,383 6,720 7,557 Total deposits 5,563 5,427 5,770 6,292 7,725 Net interest income 51.9 56.7 58.9 64.8 67.8 Total noninterest income (loss) 2.1 4.9 3.2 (2.3) 6.3 Total revenue 54.0 61.6 62.1 62.5 74.1 Noninterest expense3,4 45.0 46.4 44.2 43.9 60.3 (Gain) loss on investments in alternative energy partnerships 1.9 1.0 (0.9) (0.4) 2.0 Total noninterest expense 46.9 47.5 43.2 43.5 62.2 Pre-tax pre-provision income5 7.0 14.1 18.9 19.0 11.9 Provision for (reversal of) credit losses 15.8 (3.0) 38.6 (1.9) 2.1 Net (loss) income (6.6) 14.3 (14.1) 16.6 7.0 Preferred dividend and other adjustments 3.1 3.9 8.6 4.7 4.5 Net (loss) income available to common stockholders $ (9.7) $ 10.4 $ (22.7) $ 11.9 $ 2.5 Diluted (loss) earnings per common share $ (0.19) $ 0.20 $ (0.45) $ 0.23 $ 0.05 Return on average assets2 (0.35)% 0.71% (0.64)% 0.69% 0.28% Adjusted efficiency ratio2,5 86.54% 74.51% 70.00% 67.70% 83.57% Class / Par Value Dividend Rate / First Callable Preferred Equity Series CUSIP Issue Date ($000) Coupon (%) Date Preferred Equity: Non-Cumulative, Perpetual D 05990K882 4/8/2015 $ 94,597 7.375% 6/15/2020 Preferred Equity: Non-Cumulative, Perpetual E 05990K874 2/8/2016 100,292 7.000% 3/15/2021 Total Preferred Equity $ 194,889 (1) All figures from reported operations unless noted; dollars in millions unless noted per share or percentage (2) Consolidated operations; Efficiency ratio adjusted for including the pre-tax effect of investments in alternative energy partnerships (3) Excluding loss on investments in alternative energy partnerships (4) Non-GAAP measure, reconciliation in table above (5) Non-GAAP financial First Quarter 2020 | 20 measure; see “Non-GAAP Reconciliation” slides at end of presentation
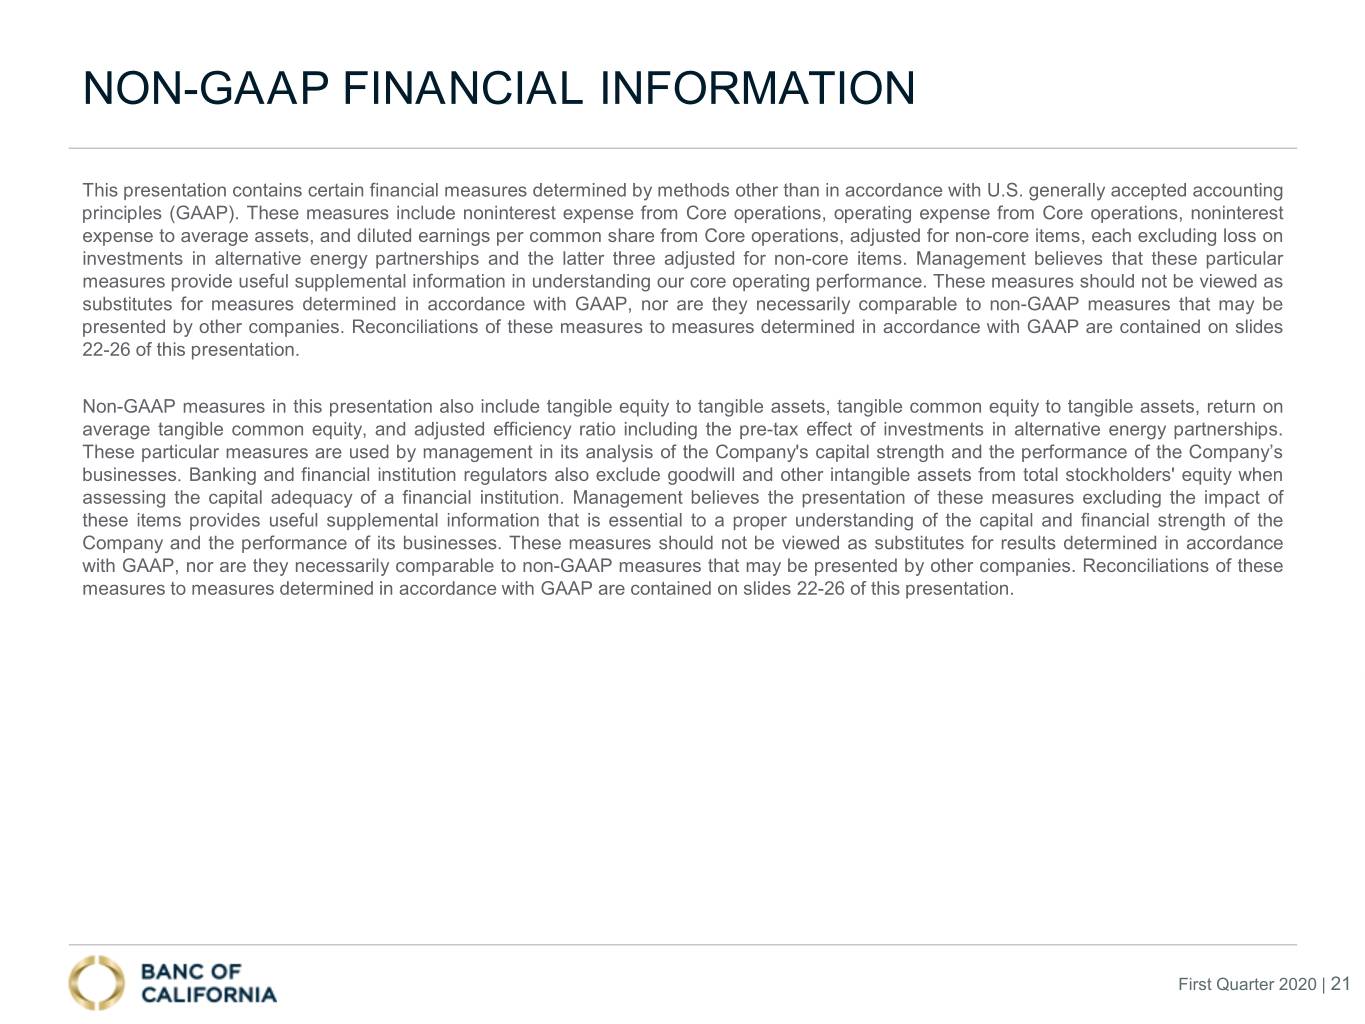
NON-GAAP FINANCIAL INFORMATION This presentation contains certain financial measures determined by methods other than in accordance with U.S. generally accepted accounting principles (GAAP). These measures include noninterest expense from Core operations, operating expense from Core operations, noninterest expense to average assets, and diluted earnings per common share from Core operations, adjusted for non-core items, each excluding loss on investments in alternative energy partnerships and the latter three adjusted for non-core items. Management believes that these particular measures provide useful supplemental information in understanding our core operating performance. These measures should not be viewed as substitutes for measures determined in accordance with GAAP, nor are they necessarily comparable to non-GAAP measures that may be presented by other companies. Reconciliations of these measures to measures determined in accordance with GAAP are contained on slides 22-26 of this presentation. Non-GAAP measures in this presentation also include tangible equity to tangible assets, tangible common equity to tangible assets, return on average tangible common equity, and adjusted efficiency ratio including the pre-tax effect of investments in alternative energy partnerships. These particular measures are used by management in its analysis of the Company's capital strength and the performance of the Company’s businesses. Banking and financial institution regulators also exclude goodwill and other intangible assets from total stockholders' equity when assessing the capital adequacy of a financial institution. Management believes the presentation of these measures excluding the impact of these items provides useful supplemental information that is essential to a proper understanding of the capital and financial strength of the Company and the performance of its businesses. These measures should not be viewed as substitutes for results determined in accordance with GAAP, nor are they necessarily comparable to non-GAAP measures that may be presented by other companies. Reconciliations of these measures to measures determined in accordance with GAAP are contained on slides 22-26 of this presentation. First Quarter 2020 | 21
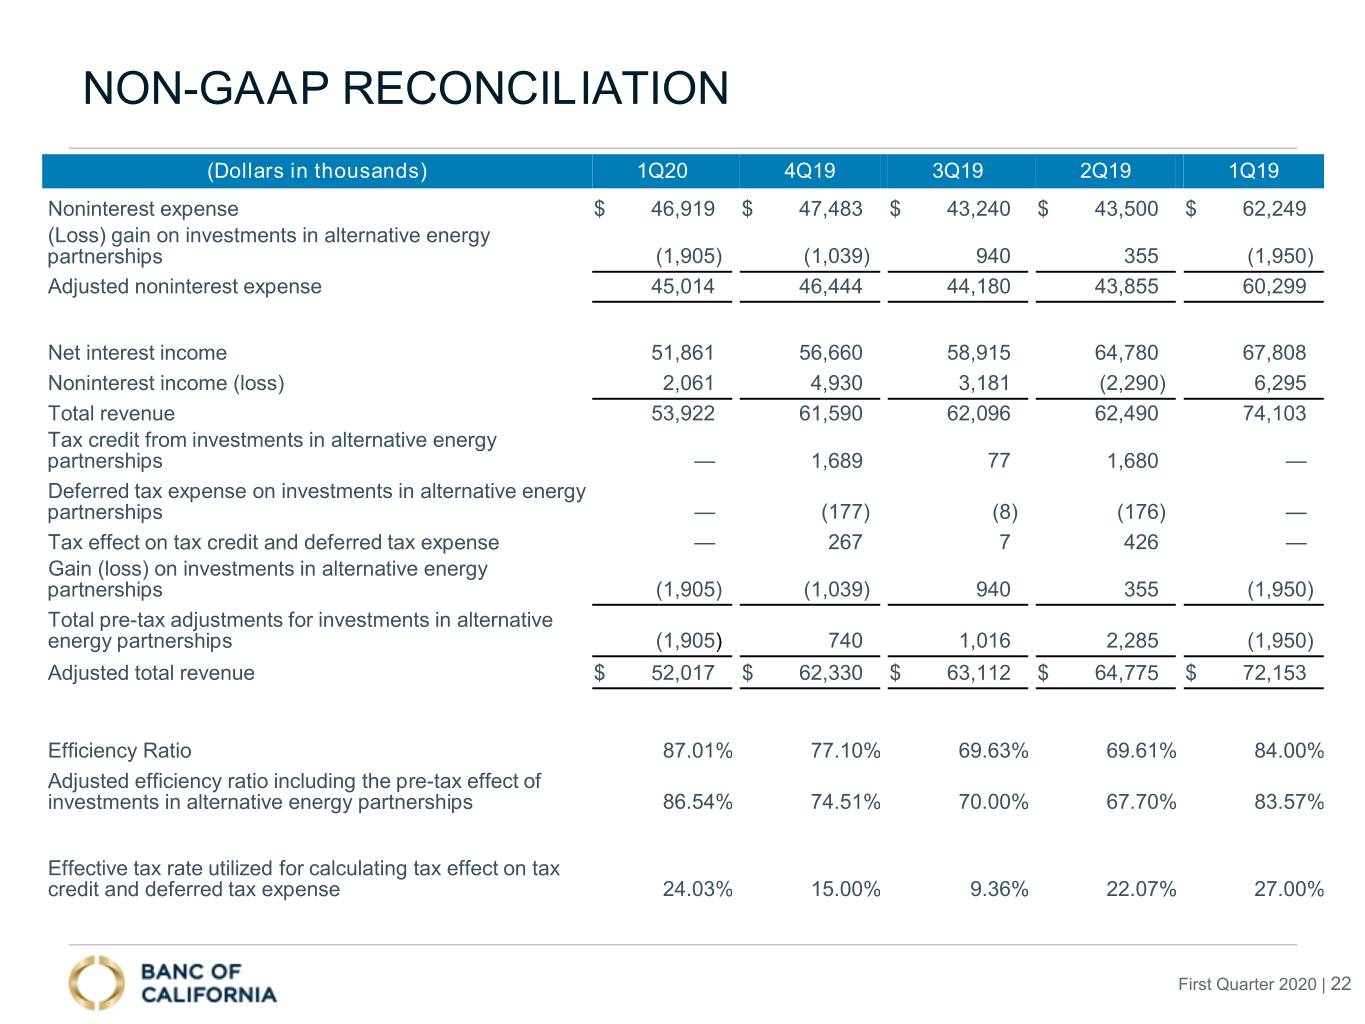
NON-GAAP RECONCILIATION (Dollars in thousands) 1Q20 4Q19 3Q19 2Q19 1Q19 Noninterest expense $ 46,919 $ 47,483 $ 43,240 $ 43,500 $ 62,249 (Loss) gain on investments in alternative energy partnerships (1,905) (1,039) 940 355 (1,950) Adjusted noninterest expense 45,014 46,444 44,180 43,855 60,299 Net interest income 51,861 56,660 58,915 64,780 67,808 Noninterest income (loss) 2,061 4,930 3,181 (2,290) 6,295 Total revenue 53,922 61,590 62,096 62,490 74,103 Tax credit from investments in alternative energy partnerships — 1,689 77 1,680 — Deferred tax expense on investments in alternative energy partnerships — (177) (8) (176) — Tax effect on tax credit and deferred tax expense — 267 7 426 — Gain (loss) on investments in alternative energy partnerships (1,905) (1,039) 940 355 (1,950) Total pre-tax adjustments for investments in alternative energy partnerships (1,905) 740 1,016 2,285 (1,950) Adjusted total revenue $ 52,017 $ 62,330 $ 63,112 $ 64,775 $ 72,153 Efficiency Ratio 87.01% 77.10% 69.63% 69.61% 84.00% Adjusted efficiency ratio including the pre-tax effect of investments in alternative energy partnerships 86.54% 74.51% 70.00% 67.70% 83.57% Effective tax rate utilized for calculating tax effect on tax credit and deferred tax expense 24.03% 15.00% 9.36% 22.07% 27.00% First Quarter 2020 | 22
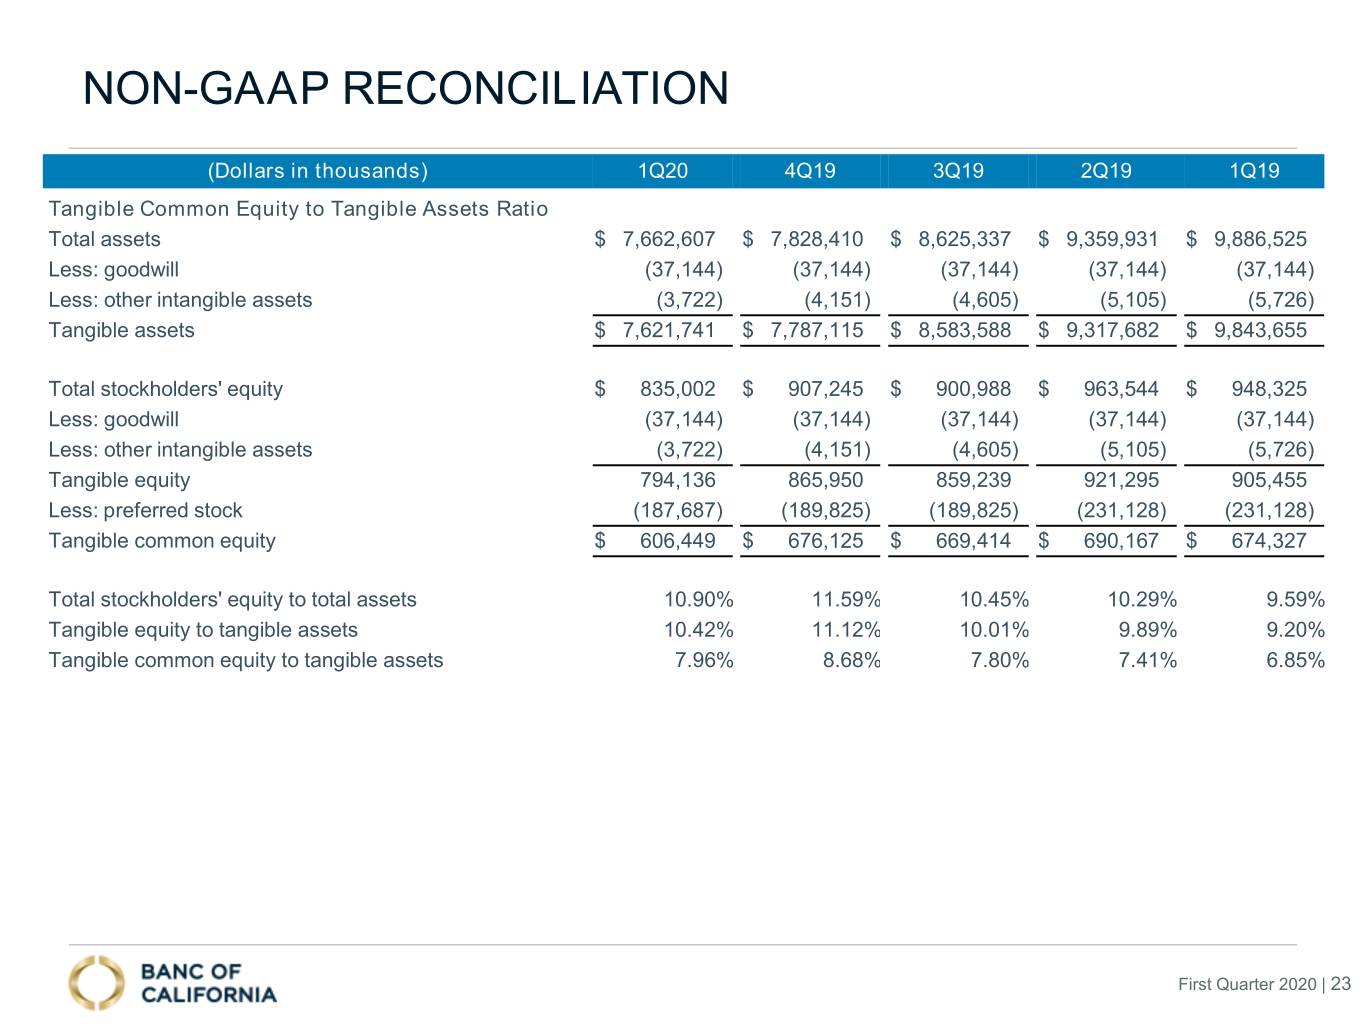
NON-GAAP RECONCILIATION (Dollars in thousands) 1Q20 4Q19 3Q19 2Q19 1Q19 Tangible Common Equity to Tangible Assets Ratio Total assets $ 7,662,607 $ 7,828,410 $ 8,625,337 $ 9,359,931 $ 9,886,525 Less: goodwill (37,144) (37,144) (37,144) (37,144) (37,144) Less: other intangible assets (3,722) (4,151) (4,605) (5,105) (5,726) Tangible assets $ 7,621,741 $ 7,787,115 $ 8,583,588 $ 9,317,682 $ 9,843,655 Total stockholders' equity $ 835,002 $ 907,245 $ 900,988 $ 963,544 $ 948,325 Less: goodwill (37,144) (37,144) (37,144) (37,144) (37,144) Less: other intangible assets (3,722) (4,151) (4,605) (5,105) (5,726) Tangible equity 794,136 865,950 859,239 921,295 905,455 Less: preferred stock (187,687) (189,825) (189,825) (231,128) (231,128) Tangible common equity $ 606,449 $ 676,125 $ 669,414 $ 690,167 $ 674,327 Total stockholders' equity to total assets 10.90% 11.59% 10.45% 10.29% 9.59% Tangible equity to tangible assets 10.42% 11.12% 10.01% 9.89% 9.20% Tangible common equity to tangible assets 7.96% 8.68% 7.80% 7.41% 6.85% First Quarter 2020 | 23

NON-GAAP RECONCILIATION (Dollars in thousands) 1Q20 4Q19 3Q19 2Q19 1Q19 Return on tangible common equity Average total stockholders' equity $ 916,047 $ 912,749 $ 961,739 $ 962,933 $ 956,700 Less: Average preferred stock (189,607) (189,824) (213,619) (231,128) (231,128) Less: Average goodwill (37,144) (37,144) (37,144) (37,144) (37,144) Less: Average other intangible assets (4,003) (4,441) (4,935) (5,503) (6,128) Average tangible common equity $ 685,293 $ 681,340 $ 706,041 $ 689,158 $ 682,300 Net (loss) income $ (6,593) $ 14,272 $ (14,132) $ 16,582 $ 7,037 Less: Preferred stock dividends and impact of preferred stock redemption (3,007) (3,540) (8,496) (4,308) (4,308) Add: Amortization of intangible assets 429 454 500 621 620 Less: Tax effect on amortization of intangible assets (90) (95) (105) (130) (130) Net (loss) income available to common stockholders $ (9,261) $ 11,091 $ (22,233) $ 12,765 $ 3,219 Return on average equity (2.89)% 6.20% (5.83)% 6.91% 2.98% Return on average tangible common equity (5.44)% 6.46% (12.49)% 7.43% 1.91% Statutory tax rate utilized for calculating tax effect on amortization of intangible assets 21.00% 21.00% 21.00% 21.00% 21.00% First Quarter 2020 | 24
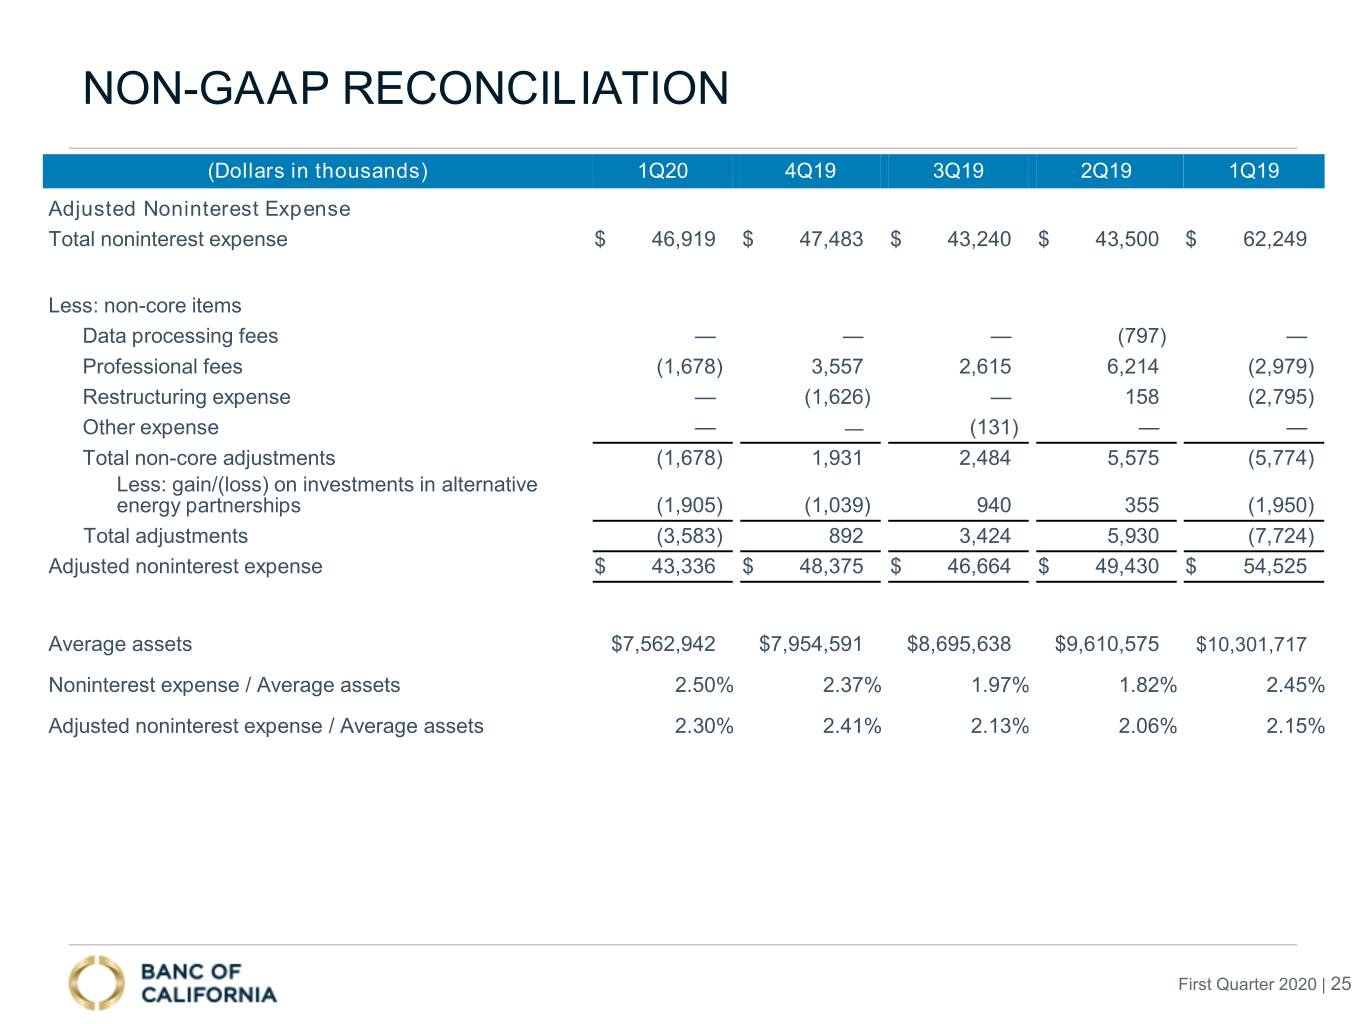
NON-GAAP RECONCILIATION (Dollars in thousands) 1Q20 4Q19 3Q19 2Q19 1Q19 Adjusted Noninterest Expense Total noninterest expense $ 46,919 $ 47,483 $ 43,240 $ 43,500 $ 62,249 Less: non-core items Data processing fees — — — (797) — Professional fees (1,678) 3,557 2,615 6,214 (2,979) Restructuring expense — (1,626) — 158 (2,795) Other expense — — (131) — — Total non-core adjustments (1,678) 1,931 2,484 5,575 (5,774) Less: gain/(loss) on investments in alternative energy partnerships (1,905) (1,039) 940 355 (1,950) Total adjustments (3,583) 892 3,424 5,930 (7,724) Adjusted noninterest expense $ 43,336 $ 48,375 $ 46,664 $ 49,430 $ 54,525 Average assets $7,562,942 $7,954,591 $8,695,638 $9,610,575 $10,301,717 Noninterest expense / Average assets 2.50% 2.37% 1.97% 1.82% 2.45% Adjusted noninterest expense / Average assets 2.30% 2.41% 2.13% 2.06% 2.15% First Quarter 2020 | 25

NON-GAAP RECONCILIATION (Dollars in thousands) 1Q20 4Q19 3Q19 2Q19 1Q19 Net interest income $ 51,861 $ 56,660 $ 58,915 $ 64,780 $ 67,808 Noninterest income 2,061 4,930 3,181 (2,290) 6,295 Total revenue 53,922 61,590 62,096 62,490 74,103 Noninterest expense 46,919 47,483 43,240 43,500 62,249 Pre-tax pre-provision income 7,003 14,107 18,856 18,990 11,854 Net interest income 51,861 56,660 58,915 64,780 67,808 Noninterest income 2,061 4,930 3,181 (2,290) 6,295 Total revenue 53,922 61,590 62,096 62,490 74,103 Noninterest expense 46,919 47,483 43,240 43,500 62,249 Total non-core adjustments (1,678) 1,931 2,484 5,575 (5,774) Noninterest expense after non-core adjustments 45,241 49,414 45,724 49,075 56,475 (Loss) gain on investment in alternative energy partnerships (1,905) (1,039) 940 355 (1,950) Adjusted noninterest expense 43,336 43,375 46,664 49,430 54,525 Adjusted pre-tax pre-provision income $ 10,586 $ 13,215 $ 15,432 $ 13,060 $ 19,578 First Quarter 2020 | 26

bancofcal.com bancofcal.com


