CarMax Investor Note:
Growth Plan, Prototypical Economics, and Finance
Background Paper, July 11, 2003
As an aid to investors constructing their own models to analyze the growth and economics of the CarMax business, we are both updating the CarMax growth note originally published in March 2001 and providing a CarMax Auto Finance supplementary note about our finance business. Section A, the Growth Plan and Prototypical Economics, is on pages 2-13. Section B, the CarMax Auto Finance Note, is on pages 14-28. There are also technical appendices A through F attached to the CarMax Auto Finance Note.
This note speaks only as of its date and we do not intend by furnishing it to investors to undertake any obligation to update it at any time in the future. It should be read in conjunction with our fiscal 2003 annual report on Form 10-K filed with the SEC on May 29, 2003, including the portions of our fiscal 2003 annual report to shareholders filed as an exhibit to the Form 10-K, and with our subsequent reports on Form 10-Q and 8-K filed with or furnished to the SEC after the date of this note.
FORWARD-LOOKING STATEMENTS
This document contains forward-looking statements that are subject to risks and uncertainties that could cause actual
results to differ materially from management’s projections, forecasts, estimates and expectations. Important factors
that could cause actual results to differ materially from management’s statements are set forth in detail under the
heading “Management’s Discussion and Analysis – Cautionary Information about Forward-Looking Statements”
contained in portions of our fiscal 2003 annual report to shareholders filed as an exhibit to our fiscal 2003
annual report on Form 10-K filed with the SEC on May 29, 2003, and under such heading and/or the heading “Management’s Discussion and Analysis – Forward-Looking Statements” in our subsequent reports on Form 10-Q filed with the SEC
after the date of this document.
Dated July 11, 2003 | 1 |
FORWARD-LOOKING STATEMENTS
This document contains forward-looking statements that are subject to risks and uncertainties that could cause actual
results to differ materially from management’s projections, forecasts, estimates and expectations. Important factors
that could cause actual results to differ materially from management’s statements are set forth in detail under the
heading “Management’s Discussion and Analysis – Cautionary Information about Forward-Looking Statements”
contained in portions of our fiscal 2003 annual report to shareholders filed as an exhibit to our fiscal 2003 annual
report on Form 10-K filed with the SEC on May 29, 2003, and under such heading and/or the heading “Management’s
Discussion and Analysis – Forward-Looking Statements” in our subsequent reports on Form 10-Q filed with the SEC
after the date of this document.
Section A: CarMax Growth Plan and Prototypical Economics
As an aid to investors attempting to model the impact of new store growth on CarMax profitability, we are outlining our growth plan and providing updated store economics for our used car superstore prototypes. This note will cover:
| 1) | CarMax Market Opportunity |
| 2) | CarMax History and Results |
| 3) | Growth and Profitability Plan |
| 4) | Store Plan Outline |
| 5) | Store Profitability Model |
| 6) | Average New Store Investment |
| 7) | Historical Returns |
| 1) | CarMax Market Opportunity |
The retail market for automobiles in the U.S. generates approximately $750 billion in annual sales and is the largest retail segment in the economy. Used cars constitute roughly half of this market. CarMax is focused on the late-model used segment, which includes primarily 1-year-old to 6-year-old used cars. This segment produces roughly $260 billion in annual sales.
CarMax currently operates 43 used-car superstores that present a consumer-preferred sales offer:
| · | low, no-haggle prices |
| · | huge selection of late-model used cars |
| · | great quality, including a 5-day money back guarantee and 30-day comprehensive warranty |
| · | customer-friendly service |
Based on the performance of our most mature stores (now 8-10 years old), we believe the CarMax used car superstore concept can ultimately achieve at least an 8% to 10% share of the late-model sales in each market where we operate.
Dated July 11, 2003 | 2 |
| 2) | CarMax History and Results |
CarMax opened its first store in Richmond, Va., in September 1993. Over the next three years, CarMax, then a subsidiary of Circuit City Stores, Inc., opened six additional stores as we worked on refining the concept. In the summer of 1996, we announced our national rollout and in February 1997, Circuit City completed an initial public offering of CarMax tracking stock. Our original plan was to open 70-80 used car superstores by the fiscal year ending February 28, 2002. Over the next two years, we opened 22 additional used car superstores. However, we found that many of our stores were underperforming on both sales and profits compared to our projections, and we suspended new store development while we focused on bringing the concept performance in line with our expectations. During FY00, we opened four additional used car superstores and five new car operations that had been in process, and in FY01, we did not add any new locations.
As we analyzed our underperformance, we came to believe that there were four factors that played a key role:
| a. | Organizational stresses of rapid growth (FY97-FY00) |
| – | Less mature staff, less effective execution. |
| b. | AutoNation Used-Car Superstores (FY97-FY00) |
| – | Their rapid rollout affected sales where they beat us to market (15 stores in Texas and Florida). |
| – | Continual AutoNation strategy changes caused consumer confusion and undermined credibility of the used car superstore concept in consumer’s mind. |
| – | Difficult for CarMax to build effective awareness in these markets. |
| c. | New Car Incentive Wars (FY99-present) |
| – | Explosion of new car incentive wars affected late-model used car pricing and competitiveness. |
| – | It took us about 24 months to understand how to effectively manage our pricing and inventory mix in response to these incentives. |
| d. | Overbuilding and Understoring (FY97-FY00) |
| – | Initial success with mega superstores (70,000-95,000 square feet, 20-35 acres, 800-1,000 cars) in Norcross (Atlanta, GA) and Laurel (Washington DC) suggested we could store large markets with fewer, bigger stores And draw from a larger trade area. Our standard format store is 40,000-60,000 square feet, 10-25 acres, 300-500 cars. |
| – | We built 11 more large-format stores in Miami, Tampa, Houston, Dallas and Chicago. |
| – | We were unsuccessful in duplicating the large volumes of Norcross and Laurel. The other large-format stores generally achieved sales and trade |
Dated July 11, 2003 | 3 |
area penetrations consistent with our projections for the standard prototype. |
| · | Sales and Profit Improvement Program |
During FY00, FY01, and FY02, we focused intently on executing a sales and profit improvement program. We specifically targeted:
| – | Gross margin improvements |
| – | Non-store overhead reductions |
| – | Store productivity improvements to reduce costs |
| – | Incremental sales opportunities (retail service, accessories) |
| – | Improved operational effectiveness and sales productivity |
| · | Results |
After 36 months of work on concept refinement and execution improvement, by the end of FY01, we believe we have identified and corrected our mistakes and re-established our strong used car concept economics. In FY02, we produced net profits of $91mm and a net return on sales of 2.6%. Based on the strength of this performance, we re-started our store growth program at the very end of FY02, opening two stores (one standard prototype and one satellite) in February 2002. We continued this growth program in FY03, opening five more stores during the year, including two standard stores and three satellite stores. Through the end of FY03, all of these new stores were performing above our original expectations.
During FY03, we also separated from Circuit City Stores, Inc. due to the increasingly unrelated nature of our two businesses. We completed this separation on October 1, 2002, through a tax-free distribution of CarMax, Inc. shares to Circuit City shareholders.
| 3) | Growth and Profitability Plan |
As we continue to pursue new store growth, we plan to roughly double sales to $8.0 billion over the next four years (FY04-FY07). We project profit growth will come from three sources:
| · | New Store Growth – We plan to open stores at a rate of 15-20% of our store base each year for the next four years which should produce roughly 34-44 new store openings over this period. The ramp-up economics for these stores are outlined in this discussion. |
| · | Net Margin Expansion: Comparable Store Sales Growth – We currently expect to achieve comparable store used unit sales growth of 5 to 9% annually during this period. Because our total margin per used car sold is approximately 15% of |
Dated July 11, 2003 | 4 |
sales, this growth will produce significant store operating profit leverage. |
| · | Net Margin Expansion: Overhead Leverage – Our non-store overhead, which includes all field operating expenses outside the store as well as corporate overhead, is currently about 2.0% of sales. Because of significant leverage from sales growth, we expect corporate overhead to fall to approximately 1.5% to 1.7% of sales at an $8 billion sales rate. |
| 4) | Store Plan Outline |
| · | Growth Plan |
For the next four years, CarMax will focus its new store growth primarily on mid-sized markets and satellite fill-in superstores in our existing markets. During the third or fourth year of this period, we would expect to once again begin new entry into one or more larger multi-store markets.
By focusing primarily on mid-sized markets and satellite fill-in superstores, we believe we will achieve the lowest-risk, highest-return growth. We believe this approach will allow us to gradually enter additional large multi-store markets. This will allow us to maximize our learning from the maturation of our existing large markets as we develop an increasingly robust model for how best to store a large market (number of trade areas, ideal combination of standard vs. satellite stores, etc.).
| · | Mid-Sized Markets |
| A. | Typical MSA/DMA populations: 1 million – 2.5 million people (within the television advertising umbrella) |
| B. | Current mid-sized markets (13): |
| 1. | Established: Richmond; Raleigh; Charlotte; Orlando; San Antonio; Greenville, S.C.; Nashville |
| 2. | New: Greensboro, Sacramento, Knoxville, Las Vegas, Kansas City, Birmingham |
| C. | Approximately 35-40 additional mid-sized markets are suitable for our standard prototype: |
| 1. | 45,000-55,000 square feet; 10-15 acres |
| 2. | 23-34 service/reconditioning bays |
| 3. | 300-500 car inventory |
| 4. | Expected sales: 275-550 cars/month |
| 5. | 22 of our existing 43 used car superstores are this size store |
Dated July 11, 2003 | 5 |
| D. | We are focusing on mid-sized markets first because: |
| 1. | Real estate acquisition is straightforward. |
| 2. | Establishing CarMax awareness is relatively fast and easy compared with large, multi-store markets. |
| 3. | They have proven to be our most profitable markets. |
| – | Every one has been profitable in its first year. |
| – | Every one has exceeded our economic return requirements. |
| – | Knoxville, our first test of a store in the smaller half of these markets, has been very successful thus far. |
| · | Satellite Fill-In Stores |
| A. | Focused primarily on underserved trade areas in our existing multi-store markets: |
| 1. | Washington, D.C./Baltimore, Chicago, Atlanta, Dallas, Houston, Miami, Tampa |
| 2. | There are at least 10 such opportunities in these markets. |
| B. | Satellite store prototype: |
| 1. | 14,000-19,000 square feet, 4-7 acres |
| 2. | 6-9 retail service bays |
| 3. | 250-400 car inventory |
| 4. | Expected sales: 200-400 used cars/month |
| C. | We are focusing on adding satellite fill-ins to existing markets because: |
| 1. | Satellite stores are very efficient: |
| – | Present the same consumer offer on 1/2—1/3 the acreage |
| – | Receive inventory reconditioned at existing nearby “hub” stores |
| – | Require little or no incremental advertising |
| 2. | We have added six prototypical fill-in satellites in multi-store markets so far: |
| – | Rockville (D.C.); Plano (Dallas); Cypress Fair (Houston); Merrillville and Oak Lawn (Chicago); Lithia Springs (Atlanta) |
| – | All have become profitable during their first year and should achieve very attractive economic returns |
| 3. | We are also testing the addition of satellites in mid-sized markets to increase penetration and market share: |
| – | South Boulevard (Charlotte) was first test, very successful |
| – | Las Vegas, Orlando, Richmond are in process of development |
| – | Market penetration analysis suggests most mid-size markets can accommodate at least one satellite as they mature |
Our experience with this growth focus to date has been very positive, with all stores opened in FY02 and FY03 (three standard and four satellite
Dated July 11, 2003 | 6 |
superstores) performing above expectations so far.
| 5) | Store Profitability Model |
Chart 1 illustrates the typical margin structure we expect to achieve in a used car store at maturity (fifth year). The gross margin from auto sales should be roughly $1,995 per car, or 10.8% of sales and 71.6% of total margin dollars. The sale of service and extended service policies, and the commissions paid CarMax by third party finance sources, should together generate approximately another $485 per car sold, yielding 2.6% of sales and roughly 17% of total margin dollars.
CarMax Auto Finance (CAF) income is reported after direct CAF costs only and before any other SG&A such as loan origination, store support, or overhead support costs; it is appropriately viewed in comparison to gross margin and as part of total margins generated. In a typical interest rate environment, we would expect CAF to produce income of roughly $305 per car sold, or roughly 11% of total margins. Because of the unusually large spreads between wholesale and retail interest rates that have occurred in FY02 and FY03, CAF has produced approximately $415 per used car sold, or 15% of total margins in fiscal 2003. We do not expect these windfall gains to repeat themselves longer term, and thus have not included them in our Prototypical Margin Structure.
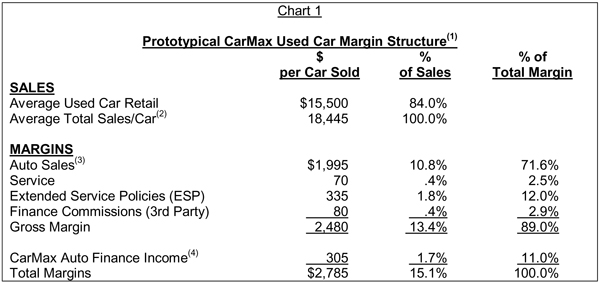
| (1) | This presentation follows the P&L format adopted by CarMax, Inc. on its separation from Circuit City Stores. Thus the margin and cost percentages differ from our 4/3/01 presentation, which was in the Circuit City P&L format. |
| (2) | Includes wholesale sales, 3rd party finance fees, accessories, ESP’s. |
| (3) | Auto Sales margin includes “retail used margin,” “wholesale margin,” and accessories and fees from “other margin.” |
| (4) | CAF income reflects direct CAF costs only, and excludes any cost of loan origination such as dealer commissions or participation, and also excludes any allocation of the store and overhead costs required to support CAF (HR, Information Systems, Accounting, etc.). Additionally, margins have been adjusted to reflect our current estimate of a mature store with normalized CAF profitability (excluding current windfall gains). |
Dated July 11, 2003 | 7 |
Chart 2 illustrates the prototypical store economics and profitability expectations for a typical standard prototype or satellite fill-in superstore. These numbers represent the performance of the store in the first five years of operation. We project that stores will ramp to their targeted sales levels over approximately four years, beginning at about 70 percent of targeted volume. These stores typically have shown a small profit in their first year, including recovering their pre-opening and grand opening expenses. Obviously, the actual performance will vary by store, with some ramping faster and others slower, some overperforming to target and others underperforming. The estimates presented in Chart 2 are our best estimates based on experience to date. The majority of our 22 standard store prototypes and our 8 satellite store prototypes are performing above the mid-point of these ranges when grouped by age.
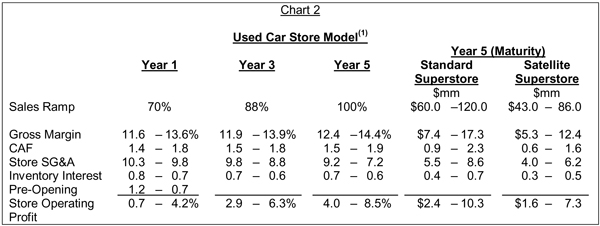
(1)This presentation follows the P&L format adopted by CarMax, Inc. on its separation from Circuit City Stores. Thus the margin and cost percentages differ from our 4/3/01 presentation, which was in the Circuit City P&L format. Additionally, margins have been adjusted to reflect our current estimate of a mature store with normalized CAF profitability (excluding current windfall gains).
Target sales in a single-store market range from 275 to 550 cars per month, with 350 to 450 being a most-likely average estimate. Target sales for a satellite fill-in prototype range from 200 to 400 cars per month, with 250 to 300 being a most-likely average estimate. Net sales generated by each satellite store will vary based on the differing sales cannibalized from existing stores. CarMax evaluates all satellite approval economics based on net sales, i.e., only sales at the store that are incremental.
Because of their lower rent and operating costs, satellite superstores can achieve margins similar to standard superstores at a lower volume range. Our experience with the 8 we have opened so far suggests that their sales also ramp somewhat faster in their early years due to established market awareness.
Dated July 11, 2003 | 8 |
The mature store operating profit projections in Chart 2 of 4.0 percent to 8.5 percent are pretax profits before non-store overhead. Our non-store overhead, which includes all field operating expenses outside the store as well as corporate overhead, is currently about 2.0 percent of sales. We estimate sales overhead leverage will result in a ratio of approximately 1.5 to 1.7 percent of sales at an $8 billion sales rate.
6) Average New-Store Investment
| · | Standard Prototype |
Chart 3 presents the average store investment for the standard prototype we expect to build in all mid-sized markets. It is very similar to what we have built in all 13 existing mid-sized markets. We also have built 9 similar stores in existing large multi-store markets.
We believe the total investment will typically range from $20 million to $30 million, depending on variances in acreage, local real estate prices and local construction costs. Furniture, fixtures and equipment costs should be the same at each store, but inventory investment will vary depending on the sales rate in each store. The inventory investment is presented in this example as the full amount of investment assumed at the end of the fourth year once the store has ramped to its full targeted sales.
We are able to recover much of this investment within the first year if we so choose. We typically sale-leaseback substantially all of the land and building investment within 6 to 12 months of opening and we believe we can finance up to 90% of the inventory. Thus, if we take full advantage of financing, the net CarMax cash investment in a standard superstore would be in the $2 million to $3 million range.
Because of the strong profitability and cash flow we have experienced over the last three years, we do not currently need to take full advantage of the inventory financing opportunities we have available. As of year-end FY03, we were using only $156 million of inventory financing versus an inventory of $466 million and a current inventory financing facility of $300 million. The company believes it should remain appropriately leveraged over time. However, this note is not intended to encompass the timing or alternatives for the company’s future financing transactions.
Dated July 11, 2003 | 9 |
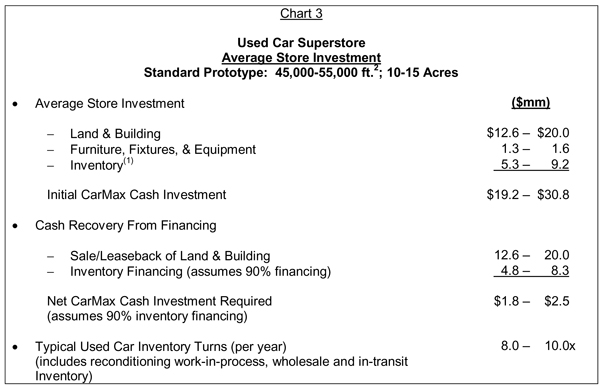
(1)Based on historical experience, net working capital other than inventory is roughly zero.
| · | Satellite Prototype |
Chart 4 presents the average store investment required for a satellite fill-in prototype. As Chart 4 illustrates, these stores typically require only about 60 to 65 percent the initial investment of a standard superstore. Although these stores present to the consumer a showroom and sales lot virtually identical to the standard prototype, they do not require the land or building to support a full reconditioning operation.
As a result, these stores are ideal for high-cost, high-traffic urban areas where land availability is problematic. They depend on a nearby, standard CarMax store (the “hub”), typically within 15-20 miles, for a continual supply of reconditioned cars. They also share purchasing and service operations overhead with this hub store. They typically also require little or no additional advertising expenditure beyond what we are already spending in the market.
Consequently, we believe these satellite fill-in superstores can operate very efficiently and be profitable at much lower sales levels than a hub store, usually less than 200 cars per month. At the same time, we believe they are capable of selling up to 500 cars per month if they are located in a high-potential trade area.
Dated July 11, 2003 | 10 |
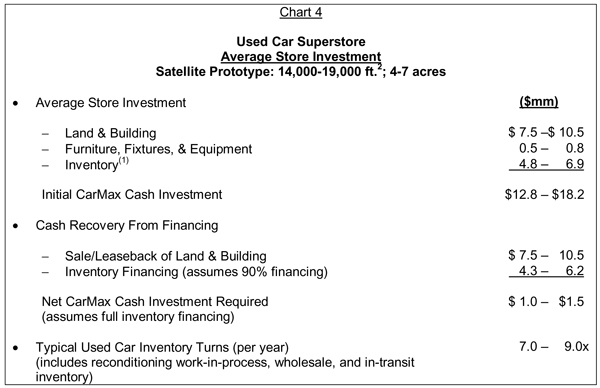
(1)Based on historical experience, net working capital other than inventory is roughly zero.
Although even a high-volume, standard superstore should be able to support an associated satellite store by running a reconditioning night shift (which we now have in most of our stores), the fill-in satellites have allowed us to use much of the excess reconditioning capacity we had in our 13 large prototype stores (70,000-95,000 square feet). All of these large stores are located in multi-store markets. Although we intend to build only the standard prototype as our full-sized stores going forward (and wish we had all along!), the addition of satellite fill-in stores over the next several years will allow us to continue leveraging these originally over-built assets to the point that we achieve very attractive returns on all of them.
7) Historical Returns
The economic returns we have experienced on our standard store prototypes and our satellite prototypes have been very attractive when compared to industry-leading retailers. Because leverage can vary across years and companies for a variety of reasons, we have compared the after-tax, unleveraged return on invested capital (ROIC).
Chart 5 presents:
| 1. | comparable (open more than 1 year) CarMax standard and satellite stores, assuming CAF profits normalized to 11% of total margin; |
| 2. | prototypical standard stores (mid-point of year 5 range); |
Dated July 11, 2003 | 11 |
| 3. | prototypical satellite stores (mid-point of year 5 range); |
| 4. | overall returns of CarMax as reported in FY03 (including megastores, new car stores, and new openings) |
in comparison to the 10 year average returns of two leading retail benchmarks, Home Depot and Wal-Mart. Obviously, our standard and satellite returns compare very favorably, which is why we are very enthusiastic about continuing with a growth program focus on these stores. Although the prototypical returns of satellite stores are somewhat higher than standard stores, cannibalization of existing stores will typically reduce the net return to roughly the same level as a standard store.
Obviously, we believe the use of leverage as discussed in section 6 will result in very attractive returns on equity. The improvements we have made in sales effectiveness, margin retention, inventory management and productivity have contributed to significant improvement in these returns.
Our overall corporate returns (excluding non-tax-deductible costs of separation from Circuit City) on a ROIC basis were roughly 12.9% in FY03 and are reduced somewhat by the significant overinvestment in our 13 large-format stores, the lower returns we have consistently seen in the 10% of our sales that come from new cars, and our seven newly opened stores. Including separation costs, ROIC was roughly 12.1% in FY03. As you can see in chart 5, our model may be somewhat conservative when you compare the ROIC of the existing 21 comparable standard stores to the results projected for the prototypical standard store. We do not plan to build any additional large-format stores. We intend to reduce our number of new car franchises from 15 to approximately 8, and expect to add few, if any, new car franchises in the foreseeable future. We also plan to move one or more existing integrated new car franchises into separate co-located facilities to improve sales effectiveness.
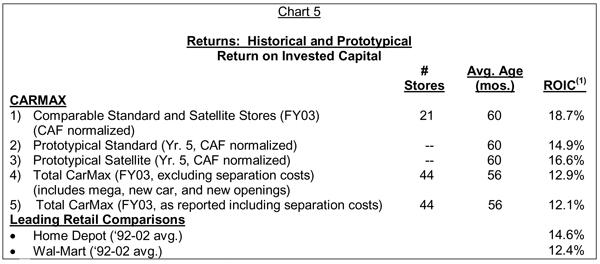
(1)ROIC – Return on Invested Capital (Unleveraged)
Return = Profit + Interest + Rent; After Tax
Invested Capital = Yearly Average; Debt + Equity + Real Estate (Rent x 8)
Assumes standard 40% tax rate for all companies and periods
Dated July 11, 2003 | 12 |
* * *
ABOUT CARMAX
CarMax is the nation’s leading specialty retailer of used cars. With headquarters in Richmond, Va., CarMax operates 43 used car superstores in 21 markets. CarMax also operates 15 new car franchises, 13 of which are integrated or co-located with its used car superstores. During the fiscal year ended February 28, 2003, the company sold 190,135 used vehicles, which is 89 percent of the total 212,495 vehicles the company sold during the year. For more information, access the CarMax Web site atwww.carmax.com.
Contact: Dandy Barrett, Director of Investor Relations, (804) 935-4591
Dated July 11, 2003 | 13 |
FORWARD-LOOKING STATEMENTS
This document contains forward-looking statements that are subject to risks and uncertainties that could cause actual results to differ materially from management’s projections, forecasts, estimates and expectations. Important facts that could cause actual results to differ materially from management’s statements are set forth in detail in the heading “Management’s Discussion and Analysis – Cautionary Information about Forward-Looking Statements” contained in portions of our fiscal 2003 annual report to shareholders filed as an exhibit to our fiscal 2003 annual report on Form 10-K filed with the SEC on May 29, 2003, and under such heading and/or the heading “Management’s Discussion and Analysis – Forward-Looking Statements” in our subsequent reports on Form 10-Q filed with the SEC after the date of this document.
SECTION B: AN OVERVIEW OF CARMAX AUTO FINANCE
Over the last year, as CarMax separated from Circuit City, many investors and analysts have asked us to provide more insight into our finance business. In general, investors have consistently asked us seven key questions about the business:
| 1) | What is CarMax Auto Finance (CAF), and what role does it play in the CarMax business? |
| 2) | How does the CarMax sales process create a loan origination advantage for all its lenders? |
| 3) | Why is CarMax in the finance business? |
| 4) | How important is CAF to overall CarMax profitability? |
| 5) | How does CAF fund its loans, and what ongoing risks does CarMax bear with respect to the receivables? |
| 6) | How does gain on sale accounting work, and why does CarMax use it for CAF income? |
| 7) | How have CAF portfolios performed over time? |
This document is designed to answer these questions for investors in a systematic way. To accommodate the varying levels of finance expertise and interest among investors, we have structured this part of our investor note as an overview of our approach to finance. We have also attached Appendices A - F that explain various points in greater detail for those who are interested.
| 1) What | is CarMax Auto Finance, and what role does it play in the CarMax business? |
CarMax Auto Finance (CAF) is the captive finance unit of CarMax. CAF began operations in 1993 and has originated over $6 billion in prime automotive installment loans exclusively for CarMax customers. At the beginning of the CarMax business in 1993, CAF was the only finance provider directly available to customers at the CarMax stores because of its unique ability to provide an automated loan process. Since that time, CarMax has added four additional finance providers to its system: Bank of America, for prime customers, and TransSouth, Wells Fargo and Americredit for non-prime rated customers. In addition, manufacturer-captive
Dated July 11, 2003 | 14 |
finance companies finance a portion of the new cars CarMax sells.
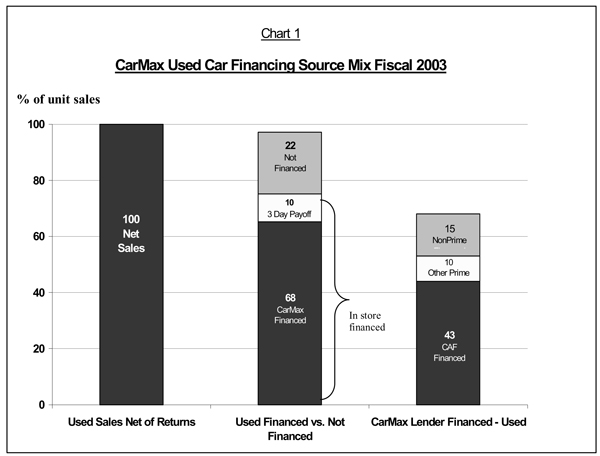
CarMax requires all lenders to provide a 3-day payoff option, which gives customers up to 3 business days to replace a loan with cash or an alternative lending source as part of our customer friendly shopping process. These finance sources provided financing for approximately 78% of CarMax used unit car sales in fiscal 2003, with CAF providing financing for more than half of all used unit car sales (Chart 1). After 3 day payoffs, these percentages are roughly 68% and 43%, respectively. For the fiscal year ended February 28, 2003, CAF originated an average of more than $100 million per month in loans on used and new vehicles exclusively through 44 CarMax locations.
| 2) | How does the CarMax sales process create a loan origination advantage for all its lenders? |
In order to understand the CarMax approach to auto financing, it is necessary to understand the role of financing in the auto sales business, how auto finance works at a traditional dealer and the competitive advantages that the CarMax no-haggle pricing, sales and financing process creates in the origination of loans. We compare our finance process to traditional new car dealers because these dealers are our
Dated July 11, 2003 | 15 |
primary competition in the used car segment. We estimate that 65%-75% of the late model (1 to 6 year old) vehicles are sold by the 21,800 new car dealers in the United States.
| · | Role of Finance in Auto Sales |
The availability of financing is critical to the sales of both used and new cars. Americans overwhelmingly choose to, or need to, finance the purchase of automobiles with installment credit loans covering most, and often all, of the purchase price. We estimate that more than 90% of all used car buyers use financing.
| · | Auto Finance at Traditional Dealerships |
Typically, auto financing is arranged through the dealer at the time of the car purchase. Most new car dealers provide financing through a wide variety of banks, manufacturer finance subsidiaries and independent finance companies who lend to prime, non-prime and sub-prime customers. The dealer is typically compensated by the finance source through a fee based on the spread between the loan offer rate provided by the financial institution and the final loan rate the dealer negotiates with the customer. In the case of high-risk or sub-prime sources, the dealer may, in fact, have to pay a discount in order to place the loan.
Most traditional dealers negotiate and manipulate the pricing on every aspect of the sale. Because salespeople, sales managers and finance managers are all paid a commission based on the profit spread in the deal, they have a strong incentive to negotiate the highest profit spread possible on each element of the transaction. They also search for customer “hot buttons” (total price, monthly payment, interest rate, trade-in value) and shift margin to other elements of the deal. This is why most offers at traditional dealerships are package deals that require the customer to take the dealer’s offer on one or more other elements of the deal in order to get the price, monthly payment or trade-in value the customer wants.
The problem this creates for lenders in evaluating a loan is obvious: they don’t know the true price and value of the car, the trade-in or the extended service policy, and there is no consistency in pricing from one deal to the next.
| · | The CarMax Process Advantage |
Financing, like all other elements of the sale process, is different at CarMax. Our transparent, no haggle pricing on the car, the extended service policy and the appraisal offer also extends to any financing offer. The CarMax process doesn’t use a finance manager; the sales consultant enters the application information into the sales office computer while sitting beside the consumer. The application
Dated July 11, 2003 | 16 |
is electronically submitted to the prime lenders. If the application does not receive a prime offer, it is routed to CarMax’s non-prime partners. Approvals are displayed on the computer screen for the consumer to view, including the interest rate, term of the loan and monthly payment. If the consumer receives multiple approvals, these offers are presented side by side for the consumer to compare. CarMax has prenegotiated fixed commissions with each of its lenders. Consequently, offers are presented as received from the lenders, with no negotiation at the store level. The customer chooses the offer that best suits his or her needs.
This process provides data integrity that we believe is unmatched in the auto retailing industry. As a result, CarMax provides a superior loan origination channel that yields consistent and predictable loan performance. Two of the three principal risks in used auto lending are significantly reduced or eliminated entirely at CarMax:
| A. | The consumer risk is the basic risk borne by all lenders. |
| B. | The risk of the car (collateral risk) is reduced by the consistent, high quality of the cars that CarMax sells, the fact that most of our customers also buy an extended service plan, and the consistency of the relationship between wholesale and retail values of CarMax vehicles. CAF and our third-party lenders have found they can rely on CarMax information to determine true vehicle worth. |
| C. | The “intermediary” risk is virtually eliminated at CarMax. There is no commission-driven finance manager who may distort the facts on pricing, car quality or consumer credit information. Thus, both CAF and outside lenders benefit from superior information quality in making financing decisions (see Appendix A for a more detailed discussion of the processes). This process advantage in loan origination is fundamental to understanding why CarMax is in the finance business as well as how the business performs. |
| 3) | Why is CarMax in the finance business? |
At the most fundamental level, CarMax is in the finance business because we believe it provides maximum benefit to our shareholders by helping us maximize both sales and profitability.
There are three primary benefits we derive from being in the finance business:
| A. | Innovation |
| B. | Control |
| C. | Profit |
Dated July 11, 2003 | 17 |
| · | Innovation |
From its inception, CarMax wanted to rationalize, streamline and automate the used car finance process in order to reduce operating costs, shorten response times, improve customer satisfaction and reduce portfolio risk in ways never previously attempted. We’ve consistently found we have to pioneer and demonstrate our processes before we can interest other finance sources in adopting them. Innovation has also provided increased sales. For example, the introduction of ValuMax in 1995 would not have been possible without CAF. ValuMax vehicles are cars that are either more than 6 years old, have more than 60,000 miles, or both, but that can still be reconditioned to meet CarMax’s rigorous quality standards. Traditional prime lenders were originally unwilling to support this product even for prime customers. By careful testing and evaluation of portfolio performance, CAF was able to demonstrate that we could support the ValuMax product while achieving prime loan quality. ValuMax today comprises approximately 16% of CarMax used unit sales and 13% of CAF loan origination dollars. CAF has been critical to the success of the ValuMax program. (To understand more about how CAF has taken advantage of the unique CarMax origination environment, see Appendix B.)
| · | Control |
A steady, rational source of prime financing through good and bad times is necessary for any auto retailer. New car retailers have manufacturer finance arms to play this role for them. Although CarMax can obtain prime financing from many finance sources, our experience is that limiting the number of sources has been essential to achieving the automation, economies of scale and cost savings we require. History teaches that banks make decisions about whether and how competitively to participate in the used car segment of the business based on their own experiences and corporate agendas. Given the previously described risks and uncertainties that banks run in originating loans through the traditional dealer channel, we believe it would be an imprudent risk not to have a finance source we can control and rely on.
CAF experience also provides significant insight into the favorable operating economics generated by our unique origination channel. Consequently, CarMax has used this information to optimize the customer service levels and commissions it receives from its third party lenders.
| · | Profit |
Prime automobile loans generate an attractive economic return. CAF provides CarMax the opportunity to capture additional profit and cash flows.
Dated July 11, 2003 | 18 |
| 4) | How important is CAF to CarMax profitability? |
CAF income is reported on the CarMax P&L as a line item after gross margin and before SG&A. CAF income is calculated after direct CAF costs only and before any of the other SG&A costs required to originate the loans (sales, marketing, or dealer commissions/fees) as well as the overhead required to support CAF (human resources, information systems, accounting, legal, treasury, etc.). Thus, we believe CAF income is appropriately viewed in comparison to gross margin and as a percent of total margins. Over the last three years, CAF income has varied from 11% to 15% of total margins (Chart 2).
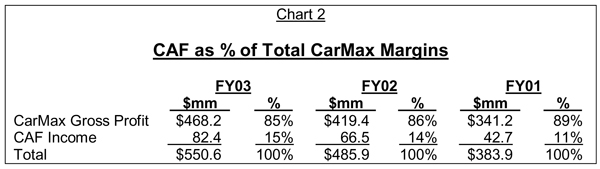
This variation has occurred largely because CAF has benefited from the abnormally high spreads experienced by the entire auto finance industry over the last two years. These abnormally high spreads resulted from the fact that funding costs fell faster than retail auto lending rates.
Two key questions frequently asked about the CAF contribution to profitability are:
| A. | What profitability would you expect from CAF in a more normal interest rate environment? |
| B. | If CarMax outsourced all financing, what portion of CAF income would it receive from third party lenders as fees and thus what portion of CAF income might be considered truly incremental income generated by operating the finance function itself? |
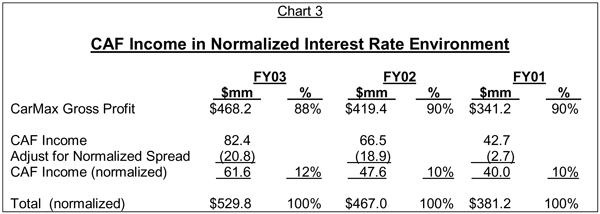
| · | CAF Income in a Normalized Interest Rate Environment |
CAF has generated a gain income as a percent of loans sold or spread of as much as 6.0% in recent years. In a more normalized interest rate environment, we would expect a spread in the range of 3.5% to 4.5%. If we adjust CAF’s gain spread to the mid-point of this range, we would expect CAF income to have represented approximately 10-12% of total margin over the last 3 years (Chart 3).
Dated July 11, 2003 | 19 |
| · | Potential Third Party Fees and CAF Incremental Income |
If CarMax outsourced all financing, it would receive third party fees from other lenders for the sales currently financed by CAF. Our best estimate is that CarMax could receive roughly $400 per car financed in fees if CarMax outsourced all the loans currently made by CAF. Such fees would be reported as part of gross profit, as are similar fees CarMax currently receives from its third party lenders. Chart 4 illustrates how the structure of CarMax income might appear in such a circumstance, but does not attempt to predict any impact on sales and gross margins that may result from such a shift in prime lenders.
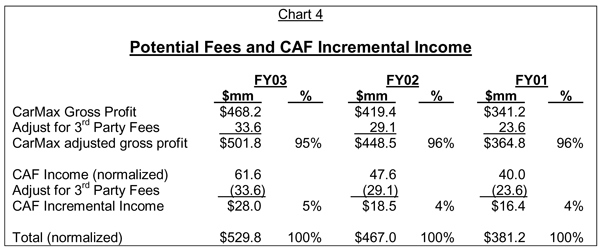
Although Chart 4 represents a purely theoretical exercise, we believe it provides a reasonable illustration of the portion of normalized CAF income that CarMax might capture if we outsourced all financing, and the portion of normalized CAF income that might have been considered the incremental product of operating the finance function ourselves over the last three years. This CAF incremental income would still be before any aforementioned indirect overhead costs required to support CAF.
Dated July 11, 2003 | 20 |
| 5) | How does CAF fund its loans, and what ongoing risks does CarMax bear with respect to the receivables? |
CAF uses securitizations to fund virtually all of the loans that it underwrites and to limit the risk of being in the finance business. CarMax’s securitization program can be viewed as a two step process. Loans are originally funded through an asset backed commercial paper program, referred to as the warehouse facility, and later funded through public term securitizations. In recent periods, public securitizations have occurred approximately once every six months. (For a more detailed discussion of the funding process, see Appendix C.)
CarMax’s risk on the loans CAF underwrites is limited to the retained interests we hold in the receivables we have sold through securitization. These retained interests consist of the net present value of the expected residual cash flows on the securitized receivables (interest-only strips), required cash reserves and required excess receivables (overcollateralization). Except for these retained interests, the loans sold and the liability for the principal amount of the loans is transferred to investors. As of February 28, 2003, the retained interest has an average economic life of 1.6 years.
At the end of fiscal 2003, CAF’s managed receivable balance was $1.9 billion, yet CAF’s risk associated with these receivables was limited to $135 million in retained interest.
CAF continues to manage these securitized receivables on behalf of the investors. For servicing the portfolio, we receive a fee of 1%, which roughly covers CAF’s direct servicing costs. We believe the efficiency and effectiveness of the CAF servicing process is an important contributor to consistent portfolio performance. (For a more detailed discussion of the CAF servicing process, see Appendix D.)
| 6) | How does gain on sale accounting work, and why does CarMax use it for CAF income? |
| · | How does gain on sale accounting work? |
This is intended to provide an overview of gain on sale accounting and is not
intended to be a technical interpretation of SFAS 140 and related accounting
standards.
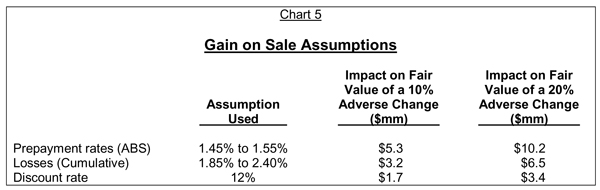
| A. | Gain on sale assumptions |
Under SFAS 140, gain on sale accounting requires CarMax to record a profit that reflects the present value of the future cash flows CAF expects to receive from the loan receivables that were sold through securitization. These cash flows are estimated using three basic assumptions:
Dated July 11, 2003 | 21 |
| 1. | Prepayment Rate: This is used to estimate early payments of principal to predict monthly receivable balance. |
| 2. | Cumulative Loss Rate: This is used to estimate the cumulative amount of losses a portfolio will sustain over its lifetime. |
| 3. | Discount Rate: This is the rate used to calculate the present value of CAF’s retained interest cash flows. |
| B. | Measuring the fair value of retained interests |
CarMax is required to evaluate the fair value of its retained interests each quarter. If the actual cash flows and underlying assumptions differ from previous expectations, CarMax would be required to immediately record the present value of the expected impact as an adjustment to current period income. CarMax discloses the assumptions used in its gain calculation, as well as the hypothetical impact of adverse changes in assumed receivable performance, in the notes to its consolidated financial statements as filed with the SEC. To date, CarMax has not recorded a material adjustment to quarterly profits as a result of any adverse changes in assumptions. As of February 28, 2003, these assumptions and adverse change estimates were (Chart 5):
| · | Timing Difference Between Earnings and Interest Cash Flow |
The use of gain on sale accounting results in a timing difference between CAF reported earnings and interest income cash flows received. Due to the short life of CAF loans, however, more than 50% of the interest-income-related cash flows are realized in the first 12 months of portfolio life and more than 80% in the first 24 months. Chart 6 below illustrates a theoretical example of the timing difference between income recognition and actual interest cash flow receipt for a hypothetical CAF portfolio of $100mm in loans with a normalized 4.0% spread on loans sold:
Dated July 11, 2003 | 22 |
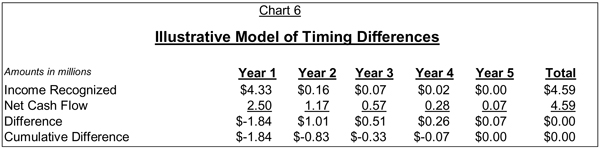
As the model illustrates, the actual cash flow produced is somewhat more than the year 1 gain on sale income recognized at the time of securitization due to the present value calculation used in the gain on sale calculation. (For a more detailed discussion of the gain on sale assumptions; the income recognition and cash flow model; CAF historical income and cash flows; and methods for estimating CAF cash flow and income, please see Appendix E.)
| · | Why Does CarMax Use Gain On Sale Accounting for CAF Income? |
CarMax uses gain on sale accounting for two reasons:
| A. | The associated revenue recognition is the most appropriate methodology for our core business. CarMax is a retailer that sells cars. Using gain on sale, CarMax recognizes the income from each sale, including the majority of the income from the financing, when the vehicle is sold. In reviewing CarMax performance, this is important for two reasons: |
| 1. | Earnings from finance are driven by current sales trends. With correct assumptions, it produces “clean” and comparable earnings from one period to the next. Sales and interest rate trends in one reporting period have a limited impact on future periods. |
| 2. | The revenue recognition for finance income generated by CAF matches the revenue recognition of finance fee income from third-party lenders. |
| B. | Gain on sale accurately reflects CarMax’s balance sheet position and exposure with respect to the managed receivables. The securitizations are true sales from both a legal and accounting perspective. CarMax has no liability for the principal balance of the securitized receivables beyond its retained interest that is carried on the balance sheet at fair value. Both the underlying assumptions used to value the retained interest, and the sensitivity to changes in the performance of the underlying receivables are also reported in the financial statements. While the risk related to receivables would be no different, the use of on-balance-sheet treatment accounting would require us to keep both the receivables and the related debt on the balance sheet. |
The main criticism associated with gain on sale accounting is that it produces earnings that are of a lower quality than non-gain on sale. Critics contend that because earnings are recognized before the cash income is received, adverse performance of the underlying receivables could have a negative impact on
Dated July 11, 2003 | 23 |
future earnings. In reality, as shown on Chart 6, gain on sale impacts the timing of earnings, not the quality or amount. The underlying economics and cash flows of the receivables are identical regardless of the accounting methodology.
In addition, because of the extensive reporting requirements associated with the gain on sale accounting standard (Statement of Financial Accounting Standards 140 (SFAS 140), “Accounting for Transfers and Servicing of Financial Assets and Extinguishment of Liabilities”), loss and prepayment assumptions for the underlying assets are much more transparent than they are for a company that does not use gain on sale accounting. Not only are the assumptions used in gain on sale clearly disclosed, but the potential impact of adverse changes in performance are quantified in each of the company’s public filings.
We believe gain on sale most accurately represents our true liability and results in the most appropriate revenue recognition for CarMax as a retailer. In addition, the stringent disclosure requirements combined with the scrutiny and transparency associated with funding the receivables in the public market provide the investment community with a wealth of information to help understand the performance of CAF.
| 7) | How have CAF managed receivable portfolios performed over time? |
CAF’s combination of an ideal origination channel, better information on which to make loan decisions, consistent and non-judgmental underwriting, and a strong servicing organization has allowed CAF to produce consistent results in its loan portfolio. Prior to CAF’s first securitization, used car portfolios in general were considered non- to sub-prime. At present, CAF has originated the only portfolio made up primarily of used vehicles (96%) that is deemed prime by the industry, i.e., with cumulative loss rates less than 3%. CAF’s consistent underwriting drives consistent results. Key measures for tracking the consistency of CAF loan underwriting and portfolio performance are:
| A. | Underwriting Performance |
| 1. | Average credit score |
| 2. | Loan to value ratio |
| B. | Portfolio Performance |
| 1. | Delinquency performance |
| 2. | Credit loss experience |
| · | Underwriting Performance |
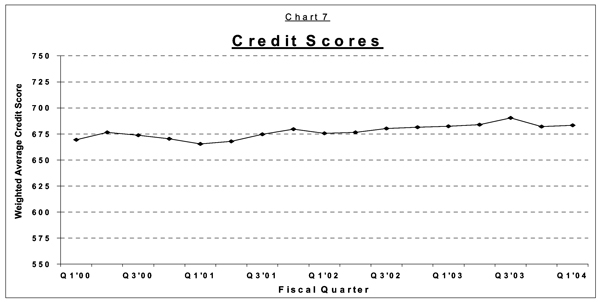
| 1. | Average (FICO) Credit Score |
The weighted average credit scores of the average customer CAF finances have remained very consistent over time, as illustrated by Chart 7. This reflects the
Dated July 11, 2003 | 24 |
consistency of the CAF underwriting process. The weighted average credit scores for the loans in our public securitizations can be found in Appendix C, Chart 2.
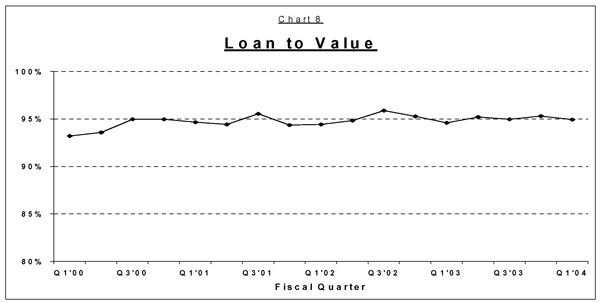
| 2. | Loan to Value Ratio |
The loan to value ratio, which measures the amount loaned by CAF compared to the CarMax vehicle sales price, has also remained very consistent over time (Chart 8).
| · | Portfolio Performance |
| 1. | Delinquency Performance |
Dated July 11, 2003 | 25 |
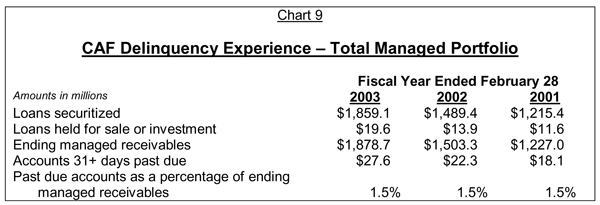
| a) | Managed portfolio. Chart 9 sets forth the dollar amount of accounts that were 31+ days delinquent, including repossessed inventory, as a percentage of ending managed receivables, while the credit loss experience table (Chart 10) measures the fiscal year losses as a percentage of the average managed receivables for the period. These tables are reported in the CarMax quarterly and annual financial statements as well as in public securitization supplemental prospectus information. |
| 2. | Credit Loss Experience |
| a) | Managed portfolio |
The credit loss experience table sets forth the fiscal year losses as a percentage of the average managed receivables for the period. The credit loss experience of CAF’s portfolio has been consistently low as a percentage of managed receivables, although it has risen somewhat during the economic downturn (Chart 10). The CarMax quarterly and annual financial statements and the prospectus supplements for the public securitizations also report credit loss information.
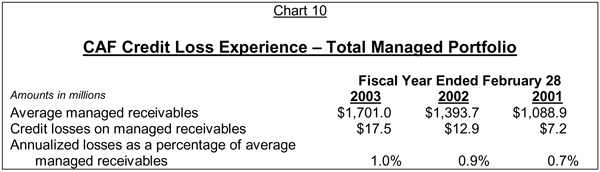
The increase in credit losses as a percentage of managed receivables for fiscal 2003 compared with fiscal 2002 resulted primarily from depressed wholesale vehicle values which led to lower recovery rates on repossessed vehicles. The increase in credit losses as a percentage of managed receivables from fiscal 2001 to 2002 was due to a
Dated July 11, 2003 | 26 |
moderation in the growth of our portfolio combined with the economic slow down causing lower recovery rates on repossessed vehicles.
Chart 11 presents the Moody’s Prime Index for annual losses as a percent of managed receivables for the last two calendar years. The trend line for the Big Three (FMAC, GMAC, CFC) domestic captive lenders is also reported. The CAF portfolio closely tracks with the Prime Index line.
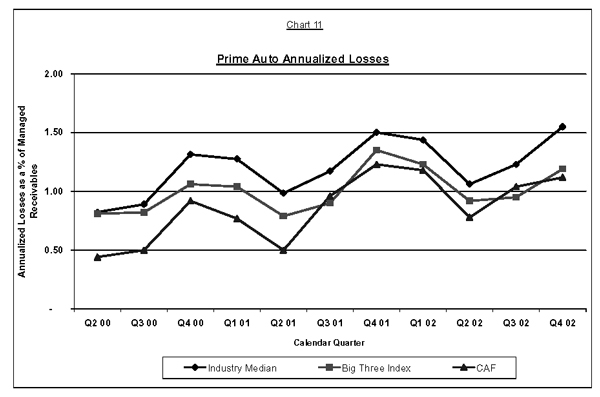
Note: Industry median and Big Three data is from Moody’s Investors Service. CAF information represents historical loss information for the total managed portfolio.
Again, these figures illustrate CAF’s conservative, well-managed, prime portfolio that leads the used-car credit industry.
| b) | Publicly securitized pools |
Another measure of credit loss experience is known as the “Cumulative Net Loss by Pool.” This measures the cumulative losses over the life of a static pool of loans as a percentage of the original principal balance. Chart 12 illustrates the cumulative loss percentage of CAF’s public securitizations as of May 31, 2003, other than CAF’s sixth public securitization, which closed in May 2003 and, therefore, has not accumulated enough data to be very helpful yet. All the pools are performing within the assumptions of a 1.85-2.40% loss rate previously discussed in question VI. (For a more detailed discussion of the performance of CAF’s portfolio, see Appendix F.)
Dated July 11, 2003 | 27 |
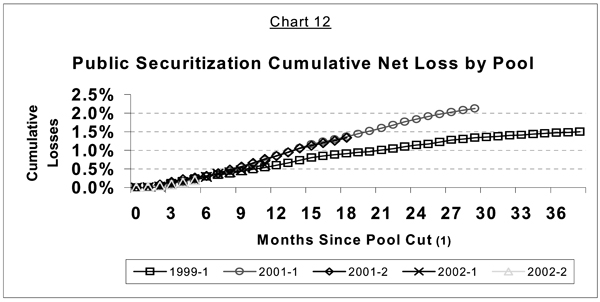
(1) Number of months since loans originally securitized in the public market.
The differences in performance of the public securitizations identified in Chart 12 are the result of differences in composition of the underlying receivables. The 1999-1 pool had significantly more seasoning compared to the other public securitizations. Seasoning refers to the age of the loans at the time they are securitized. Generally speaking, a pool of loans with a higher amount of seasoning will experience lower cumulative loss rates because many of the losses have already been incurred prior to securitization. The 2001-1 pool had the lowest weighted average FICO score of all the publicly securitized pools. Both the 2001-1 and 2001-2 pools were also negatively impacted by the economic slowdown and lower recovery rates resulting from the steep decline in wholesale vehicle prices. The 2002-1 and 2002-2 pools have shown a somewhat lower cumulative loss rate reflective of their higher average FICO scores.
Dated July 11, 2003 | 28 |
CarMax Investor Note:
Growth Plan, Prototypical Economics, and Finance
APPENDICES A THROUGH F
Dated July 11, 2003 |
FORWARD-LOOKING STATEMENTS
This document contains forward-looking statements that are subject to risks and uncertainties that could cause actual results to differ materially from management’s projections, forecasts, estimates and expectations. Important factors that could cause actual results to differ materially from management’s statements are set forth in detail in the heading “Management’s Discussion and Analysis – Cautionary Information about Forward-Looking Statements” contained in portions of our fiscal 2003 annual report to shareholders filed as an exhibit to our fiscal 2003 annual report on Form 10-K filed with the SEC on May 29, 2003, and under such heading and/or the heading “Management’s Discussion and Analysis – Forward-Looking Statements” in our subsequent reports on Form 10-Q filed with the SEC after the date of this document.
APPENDIX A: THE CARMAX LOAN ORIGINATION PROCESS
| Origination: | A unique competitive advantage for CarMax |
This appendix reviews in detail the risks involved in used car lending and how the transparency of the CarMax pricing, sales and financing processes significantly mitigates these risks, giving CarMax a significant competitive advantage as an originator of used car loans. This means that a CarMax-associated lender has more accurate information on both the customer and the car and can make better lending decisions. This advantage applies equally to both loans originated for CAF as well as loans originated for our third-party lending partners.
There are three areas of risk for a used auto lender:
| 1) | Customer risk |
| 2) | Car (or collateral) risk |
| 3) | Intermediary (or dealer) risk |
CarMax’s unique sales and financing process allows us to significantly mitigate the Car Risk, and completely eliminate intermediary risk for all our lenders.
| 1) | Customer Risk |
The customer risk in used car lending is measured by the customer’s ability and willingness to pay. Ability to pay is assessed based on customer income, debt levels and prior payment history. Customer risk is the most fundamental risk of the loan, common to all lenders.
| 2) | Car (Collateral) Risk |
CarMax:
The car risk in used car lending is measured by the value and quality of the vehicle supporting the loan. Quality impacts risk by determining the likelihood that a car will continue to perform acceptably for the customer over the life of the loan. A car that does not run often becomes a loan that does not pay. Quality also has a significant
Dated July 11, 2003 | A-1 |
impact on recovery values when loans default and cars are repossessed. CarMax significantly mitigates this risk through the consistent quality and high warranty coverage of the used cars we sell.
CarMax puts every vehicle through a 145-point inspection to ensure that it meets CarMax’s high quality standards. The quality standards are set by corporate and cannot be altered at the store level. If the car does not meet these standards, the store must choose to either invest the resources to bring the car up to CarMax’s standards or wholesale the vehicle. These standards are also very high compared with the industry. We will not sell a vehicle with suspected frame or flood damage, extensive paintwork or core support damage. Every car goes through a national title search to ensure that there is no odometer or prior title issue. Once the car is sold, CarMax stands behind the vehicle with a 5-day, money-back return policy and a 30-day comprehensive warranty on every vehicle. Over 40% of all CarMax used vehicles are still covered under manufacturer’s warranty. In addition, value-priced extended service policies offering up to 6 years additional coverage are also available. More than 50% of CarMax customers purchase an extended warranty. As a result, roughly 80% of cars financed through a CarMax lender carry ongoing warranty coverage. All of these policies go hand in hand to produce a high quality vehicle to support the loan.
Traditional Dealers:
Used car quality standards vary dramatically from dealer to dealer and across cars within a given dealership. Many dealers do minimal or no reconditioning on some or all cars. Some dealers will sell cars with significant hidden frame or flood damage without informing the customer or the lender. There is typically a no-return policy and purchases are often “as is” with no dealer warranty. Even when dealers provide a limited warranty, there is typically no written specification of what is covered and under what terms. Although extended service policies are often available, they typically have significant non-coverage clauses, and are sold at the highest price the dealer can negotiate. Purchase rates of these policies range from 25% to 35% of sales at most dealerships. All of these uncertainties expose both the consumer and the lender to significant and often unknown quality risk.
3) Intermediary Risk
Intermediary risk in used car lending is a function of the accuracy, the quality and the completeness of the information provided by the dealer intermediary, including information on each element of the transaction and the customer’s credit information. The vast majority of used car loans are made indirectly through dealers as intermediaries. Lenders consider this one of the largest sources of risk in used car lending. CarMax completely eliminates this risk, for both CAF and our third party lenders, through the integrity of the information we provide lenders.
Dated July 11, 2003 | A-2 |
CarMax:
| · | Pricing Information – All elements of the sale are fixed, value-oriented and non-negotiable at CarMax, including the price of the car, the trade, the financing and the extended service policy. Each of these elements is offered “a la carte”, so the customer chooses or excludes each based on the perceived value and usefulness to the customer. Each price bears a consistent relationship to the underlying cost of that element of the offer. As a result, two customers with the same credit rating looking at the same car should see identical prices on each element of the deal. If they have a car to trade, it will be appraised separately and they will be offered a cash price good for seven days or 300 miles. This appraisal offer will be the same regardless of whether they purchase a car from CarMax or not. Because CarMax appraises more than 1 million cars per year and actively wholesales thousands of cars that do not fit our retail specifications at our own auctions each week, these offers consistently reflect current actual wholesale prices in each local market. |
| · | Customer Credit Information – All customer credit information is entered directly into the CarMax sales system by the sales consultant based on rigorous and standardized rules of data collection, accuracy and completeness. This data is transmitted directly to the lenders. Our prime lenders consist of both CAF and Bank of America. In the event that a prime lender does not approve the application, it is automatically re-routed to the non-prime lenders. Lender decisions are transmitted directly to the sales consultant’s computer where all offers are displayed for the customer to review. The customer can then choose the rate and term that best meets their needs. |
Because of these processes, all CarMax lenders receive complete and accurate information on all elements of pricing and consumer credit background. There is no negotiation anywhere in the process, and no uncertainty about the quality or completeness of the information. No one at CarMax is paid a commission on finance sales, and there is no finance and insurance (F&I) manager. CarMax’s profit on any third party loan is prenegotiated with the lender and considered by the lender when it sets its offer. As a result, there is no incentive to manipulate consumer credit information. Additionally, at CarMax, such manipulation would be punished by immediate associate employment termination.
| · | Credit Mix - CAF reviews 100% of all credit applications submitted to CarMax. Although CAF decides against loan approval on approximately 60% of this flow and passes them on to our non-prime financing sources, CAF has access to the information on the total flow. The same is true for Bank of America (BofA) on all loans that meet its specified criteria. All three non-prime lenders see 100% of the loan applications that are turned down by both CAF and BofA that meet the non-prime lender’s specified criteria. This allows all CarMax financing sources to compete directly for those loans which they find most attractive without any concern for adverse selection resulting from the decisions of an F&I manager. It also means CAF has the broadest data for evaluating credit trends and loan performance. |
Dated July 11, 2003 | A-3 |
Traditional Dealers:
| · | Pricing Information – Most traditional dealers negotiate and manipulate the pricing on every aspect of the sale. Because salespeople, sales managers, and F&I managers are all paid a commission based on the profit spread in the deal, they have a strong incentive to negotiate the highest profit spread possible on each element of the transaction. They also search for customer “hot buttons” (total price, monthly payment, interest rate, trade-in value) and shift margin to other elements of the deal. This is why most offers at traditional dealerships are package deals that require the customer to take the dealer’s offer on one or more other elements of the deal in order to get the price, monthly payment or trade-in value the customer wants. |
The problem this creates for the lender in evaluating a loan is obvious: he doesn’t know the true price and value of the car, the trade or the service policy he is lending against.
| · | Customer Credit Information – At a traditional dealer, all credit applications are handled by the F&I manager, a commissioned employee whose commission per deal is a direct function of the finance spread achieved on each deal. Thus his goal is to find the finance source that will provide a loan for a given customer at the lowest rate and then try to sell that loan to the customer at the highest rate possible. F&I managers typically work with dozens of potential finance sources, each vying for the dealer loan flow. One of the key skills of a talented F&I manager is to know what customer profiles and deal structures can best be sold to each finance source. Thus loan placement at typical dealerships almost always involves extensive phone contact with the lender representative as the F&I manager tries to manage the customer credit information and deal structure to sell the lender representative on the best rate possible. |
Once the lender side of the negotiation is complete, the F&I manager switches gears to negotiate with the customer. Here the F&I manager must evaluate the sophistication and bargaining power of the customer, based on the information passed to him by the salespeople and sales managers. Obviously, the customer with significant credit history problems is the one with the least negotiating power. Thus, paradoxically, many of the lender’s riskiest loans may be the ones carrying the largest spreads. While lenders try to limit this behavior through spread limits, the F&I manager can often work with the sales manager to push more profit into another element of the deal.
| · | Credit Mix – At traditional dealerships, the F&I manager determines which financing sources see which loans and can also be adept at knowing which lenders will take which marginal deals. As a result, a lender is never certain what the overall pool of applicants looks like. The F&I manager can use this to |
Dated July 11, 2003 | A-4 |
manipulate lenders into taking loans they might otherwise pass on in order to have a shot at the more attractive loans. This makes it very difficult for lenders to effectively and rationally compete for those loans they most desire and can easily lead to adverse selection.
| · | A worst case example: Negative Equity and the Cheater Car |
A good example of the worst case for a lender on information quality and clarity is the customer who wishes to trade in a car whose current wholesale value is significantly less than the outstanding balance on the existing loan (negative equity). Working together, the sales manager and F&I manager can steer the customer to the purchase of what is known as a “cheater” car. This is a car whose book value in one of the published guides is significantly above its true current wholesale price in the marketplace. These anomalies are common, and good used car managers are adept at keeping a supply of such cars for this type of customer. Good F&I managers also know which lenders use which book to evaluate loan value, and thus who the best candidate is to buy the loan on a given cheater car. For example, if a customer’s trade-in is worth $8,000 and his loan balance is $10,000, the dealership may steer him toward a car with a current book loan value of $15,000 that was available in the wholesale market at $10,000. This allows the dealership plenty of room to “over-allow” on the trade-in by $2,000 and still make a healthy profit. It may also leave room for added high margin/low value add-on’s such as undercoating, credit life, GAP insurance or accessories to be added into the deal. Because the customer in this situation has limited bargaining power, they frequently can be manipulated into such a transaction.
Unfortunately for the lender, the information for making this loan bears little relationship to reality. He sees a customer with full equity in his trade and a used car deal in line with book loan value. What he really has is an asset worth $5,000 less than the loan and a customer who is years away from a breakeven loan position.
As a result of the information uncertainty created by both the volatile nature of the pricing in the used car market and the multi-faceted uncertainties of the dealer negotiation process, used car lenders face enormous potential intermediary risk in trying to determine the true pricing and value information on the asset they’re financing, as well as the true credit position of the customer they’re financing, both before and after the loan.
Summary
The CarMax origination process is unique in the auto industry and is ideal for the auto lender. Dealer risk is eliminated, costs to acquire market share and mitigate dealer risk are never incurred, collateral risk is consistently measurable and predictable, and customer risk is minimized to the point where all that is left is predicting their likelihood
Dated July 11, 2003 | A-5 |
to pay the loan based on their history of paying prior loans. This unique origination channel yields portfolio results that consistently outperform the standard portfolios for all our lenders, whether prime, captives or non-prime. The fact that all CAF loans come through this origination channel also helps explain the unique consistency of the CAF used car portfolio performance, which we discuss later in this note.
Dated July 11, 2003 | A-6 |
FORWARD-LOOKING STATEMENTS
This document contains forward-looking statements that are subject to risks and uncertainties that could cause actual results to differ materially from management’s projections, forecasts, estimates and expectations. Important factors that could cause actual results to differ materially from management’s statements are set forth in detail under the heading “Management’s Discussion and Analysis – Cautionary Information about Forward-Looking Statements” contained in portions of our fiscal 2003 annual report to shareholders filed as an exhibit to our fiscal 2003 annual report on Form 10-K filed with the SEC on May 29, 2003, and under such heading and/or the heading “Management’s Discussion and Analysis – Forward-Looking Statements” in our subsequent reports on Form 10-Q filed with the SEC after the date of this document.
APPENDIX B: THE CAF CREDIT PROCESS
The credit process (assessing customer risk)
This appendix focuses on the underwriting process and portfolio mix management. Here, we discuss the use of automated scorecards to assess, quantify and rank risk. We also discuss the use of automated and policy driven decisions to drive consistent and objective underwriting. Finally, we discuss key performance metrics used to manage and evaluate the effectiveness of the offer, which enables us to achieve a consistent and predictable portfolio mix.
| A. | Underwriting Process |
Step 1: The Scoring System
Historical customer credit experience and performance is the best predictor of future performance. Our scoring models rely solely on prior credit history and customer down payment to evaluate and rank the relative risk of the customer’s probability of re-payment and to facilitate risk-based pricing. A risk-based pricing approach groups customers on their likelihood of repayment. Those who are more likely to fulfill the payment obligations are charged less than those less likely to pay. We developed our models with Fair, Isaac and Company, an industry leader in predictive credit-risk modeling. Our models use empirically derived, statistically sound methods to calculate a numerical score that represents the customer’s relative likelihood of repayment. As a result, our underwriting is credit-based and score-driven.
The underwriting process begins with the electronic transmission of all applications from the CarMax store to CAF’s credit system. The application process allows CAF to monitor changes in the entire CarMax applicant population. The system electronically retrieves a consumer credit report from one of the three major credit reporting agencies, Equifax, Experian or TransUnion. CAF uses credit history, including the credit bureau risk score (FICO score), and the down payment percentage in its scoring models to calculate the customer’s score.
Dated July 11, 2003 | B-1 |
Step 2: Grade Assignment
CAF uses the scorecard score to segment applicants into sub-populations representing different relative levels of risk. These sub-populations represent the ‘odds’ that these customer groups will repay. For example, odds of 1:99 indicate that one in one hundred people scoring in a certain range will not pay, or that the population will have a cumulative loss rate of 1%. These sub-populations are then assigned a CAF credit grade. Customers falling below our minimum established scorecard score are automatically declined.
Step 3: Credit Bureau Review
Once the system completes scoring and assigns the CAF grade, the system reviews specific credit lines and public records in the customer’s credit file. The application is automatically declined if the credit report shows one of three immediate decline conditions, i.e. a recent bankruptcy, a recent repossession or a current past due trade account.
Step 4: Decision Rules
The scorecard is augmented by a number of decision rules derived from CAF’s historical performance. These decision rules identify irregularities or additional risk factors in the application or credit report. There are two primary categories for the CAF decision rules: potential fraud or invalid credit file and ‘thin’ credit file. Potential fraud or invalid credit file indicates that the application information and the credit report do not match or that there is suspicious activity in the credit report. Examples of this situation include the social security number on the application does not match the credit file returned, or the age of the credit information does not match with the age of the applicant (information from Sr. and Jr. are often mistakenly mixed). ‘Thin’ file involves a credit report that lacks sufficient revolving trade lines or depicts limited recent installment history. The thin file is often referred to as a ‘false Beacon’ in the industry, indicating a high credit bureau risk score but little supporting history of loan performance. Applications that trigger a decision rule are routed in for manual review by a CAF underwriter.
Step 5: The Underwriter
The underwriter addresses the decision rule(s) that caused the application to route in for manual review based on established CAF policies and procedures. The underwriting team is composed of analysts with an average of over four years of internal experience. Training and development is internal, focusing on ability to execute consistently against company policy and process. Since all applications are initially electronically reviewed and system graded, the underwriter’s objective is to either agree with the decision and grade established by the system or override that grade based on additional information obtained through investigation, verification, reviewing additional credit bureaus or speaking directly with the applicant.
Dated July 11, 2003 | B-2 |
Step 6: The Decision
Decisions are returned to the store in an average of three minutes, with the majority returned in less than five minutes. Approximately 65% of all decisions are electronic. A CAF underwriter manually reviews the remaining 35%. The vast majority of applications that route for review are stop-approves (the system grade designation is an approval grade). Approximately 60% of applications are declined and 40% approved.
Step 7: The Offer
Once the final decision and grade are determined, either electronically or after manual review, the maximum term and advance (required down payment) are established. Grade, along with product (new, used or ValuMax), age of vehicle and down-payment percentage determine the final rate offered at our standard term of 60 months. Shorter terms are offered to all CAF customers as an option. Customers who chose terms of 66 months, or 72 months if they are eligible, are charged a higher rate. CAF does not offer any terms greater than 72 months, with 72-month terms limited to the top 42% of our approved population. Approximately 15% of our customers accept at 66 months, and 6% accept at 72 months.
The offer is made directly to the customer and displayed on the screen for their review and selection. CAF directly controls the rates and terms offered to the customer as there is no F&I negotiation process at the CarMax locations. Additionally, the customer has 3 days to secure alternative financing and pay off any loan without interest or fees. This 3-day payoff process is honored by all CarMax lenders and allows customers to buy today without reservation.
| B. | Portfolio Management |
1. Portfolio Mix Management
CAF monitors the percentage of customers who accept its offer and those who choose the 3-day payoff option to measure its competitiveness in the marketplace. CAF then uses the offer to drive a consistent portfolio mix and achieves balance by raising and lowering rates. The effectiveness of the offer and resulting portfolio mix is evaluated weekly, primarily using the following key performance metrics:
| 1) | Gross Booking Percentage: the ratio of applicants who accept CAF’s offer to CAF approvals. |
| 2) | Payoff Percentage: the ratio of booked customers who use our 3-day payoff option to booked customers. |
| 3) | Overall Finance Penetration: the ratio of customers who finance through a CarMax in-store lender to total sales. |
Dated July 11, 2003 | B-3 |
| 4) | CAF Finance Penetration: the ratio of customers who finance through CAF to total sales. |
| 5) | Sales to Applications: the ratio of sales to total applications. |
| 6) | Grade Distribution: the percentage of customers that fall into each CAF credit grade. |
CAF’s high percentage of system-generated decisions and limited judgmental underwriting, which is based on following established policies and procedures, results in consistent, predictable prime portfolio performance. Unlike other lenders who rely on judgmental underwriting, when CAF evaluates historical performance and identifies opportunity for improvement, CAF knows what to change and can be reasonably certain that the changes will have the desired effect because of this consistency.
2. The CAF Customer
Our systematic, objective credit underwriting process and proactive portfolio mix management generate prime performance and consistent customer demographics. The characteristics of the typical CAF customer, based on loans originated in fiscal 2003, is as follows:
· $50,000 annual income · 38 years old · More than 6 years employed · More than 6 years at residence · More than 60% own their home · 13 years of credit history · More than 15 satisfactory trade accounts | · 2 to 3 year old vehicle · $15,000 average amount financed · $2,600 down payment · 96% loan-to-value · 60 month loan · Payment-to-income ratio of 8% · 670-690 credit bureau score |
Summary
The credit underwriting process focuses on evaluating the customer risk because the collateral risk is known and the intermediary risk is eliminated through the CarMax process. CAF is committed to using non-judgmental, system-driven decisioning to evaluate this risk. This underwriting methodology, along with active offer management, continues to produce consistent, predictable, prime portfolio performance while still providing a competitive consumer offer.
Dated July 11, 2003 | B-4 |
FORWARD-LOOKING STATEMENTS
This document contains forward-looking statements that are subject to risks and uncertainties that could cause
actual results to differ materially from management’s projections, forecasts, estimates and expectations.
Important factors that could cause actual results to differ materially from management’s statements are set forth
in detail under the heading “Management’s Discussion and Analysis – Cautionary Information about Forward-
Looking Statements” contained in portions of our fiscal 2003 annual report to shareholders filed as an exhibit to
our fiscal 2003 annual report on Form 10-K filed with the SEC on May 29, 2003, and under such heading and/or
the heading “Management’s Discussion and Analysis – Forward-Looking Statements” in our subsequent reports
on Form 10-Q filed with the SEC after the date of this document.
APPENDIX C: CAF FUNDING PROCESS
Funding Sources
CarMax funds substantially all of its $2.0 billion automobile receivable portfolio through securitizations. Prime auto loan receivables produce a stream of predictable, low-risk cash flows. Securitizing these assets enables the company to fund its portfolio growth through one of the deepest and most stable capital markets, at an attractive cost, while committing very little of our own capital. CarMax’s capital investment includes receivables held for sale, restricted cash (reserves) and receivables held for investment. (Depending upon the structure of the securitization transaction, these reserves may be partially funded by the cash flow from the securitized receivables.) Receivables held for sale are present receivables not yet funded through the warehouse facility, typically the last business day plus weekends and/or holidays at the end of a month. Restricted cash is cash on deposit in various reserve accounts established to enhance the credit of the transactions. Receivables held for investment represent CarMax’s subordinated, undivided ownership interest in the receivables housed in the warehouse facility. (Any cash flows generated by these receivables are used, if needed, to make payments to the investors, similar to the over-collateralization feature found in many conventional asset-backed loans.) Additional information is provided in the CarMax public filings.
The blended borrowing rate on our managed portfolio in FY03 was less than 4%. As Chart 1 illustrates, CarMax’s capital investment is approximately 3% of the managed receivable balance:
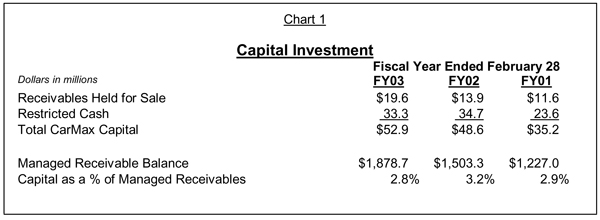
Dated July 11, 2003 | C-1 |
CarMax’s securitization program can be viewed as a two step process. Loans are originally funded through an asset-backed commercial paper program, referred to as the warehouse facility, and later funded through public term securitizations.
| 1) | Warehouse Facility |
The warehouse facility currently has a capacity of approximately $825 million and loans are sold into the warehouse facility on a daily basis. CarMax can request advances under the warehouse facility up to six times per month. Although the transfer of loans under the warehouse facility is accounted for as a sale, the warehouse facility operates much like a revolving credit facility that is secured by the receivables. In effect, CarMax pays a floating interest rate based on the amount of advances outstanding under the facility. Because the underlying auto receivables are fixed rate loans, CarMax enters into interest rate swaps each month to better match the underlying assets. Once a “critical mass” of loans has been generated (historically $500-$650 million) the loans are repurchased from the warehouse facility and re-sold into the public market through a term securitization. Because the public securitizations are fixed rate, the interest rate swaps agreements are terminated at this time. The market value of the swap contracts is settled for cash when the contracts are terminated. This settlement, a payment if interest rates have fallen and a receipt if interest rates have risen, is recaptured over the life of the public notes via a higher or lower interest payment. A lower fixed interest rate will result in more excess cash flows to CarMax over the life of the securitization and therefore an increase in the value of retained interest. A higher fixed interest rate will result in reduced cash flows over the life of the securitization and therefore a decrease in the value of retained interest. Therefore, any expense or income resulting from the swap termination is offset by a corresponding change in retained interest associated with the new fixed interest rate in the public securitization.
| 2) | Public Securitizations |
In a public securitization, the receivables are sold into a trust, which issues asset-backed debt securities to fixed-income investors in the public market. The yield on these securities is determined by market conditions and the credit ratings assigned to the securities by Moody’s and Standard & Poors. These securities are essentially amortizing bonds in which the investors are entitled to receive principal and a stated rate of interest. Typically, the principal is paid to investors as it is collected from customers. Through May 2003, CarMax has completed six public securitizations totaling almost $3.5 billion, as detailed in Chart 2.
Dated July 11, 2003 | C-2 |
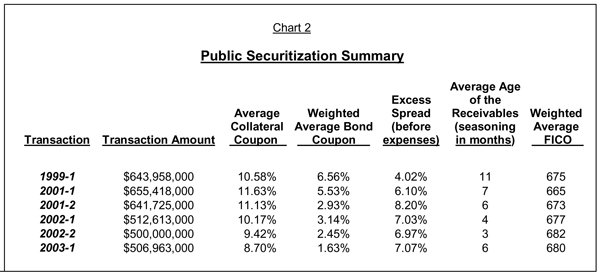
| 3) | Deal Structure and Credit Enhancement |
All securitization transactions stand on their own with no credit support from CarMax other than the cash reserves and any subordinated, undivided ownership interest that may be required by the securitization structure. Both the warehouse facility and the public securitizations have structural features designed to ensure that investors are paid the promised principal and interest due on the transaction. This “credit enhancement”, which may take the form of reserve accounts (fixed or performance-based), purchased third party guarantees, over-collateralization or subordination may vary from deal to deal. The rating agencies rely on structural features combined with the quality of the underlying assets and their view of the servicer in determining their rating for the public securitizations. The CarMax public securitizations have used two general structures:
| A. | A surety bond insured or “wrapped” structure – In this arrangement, a fee is paid to a highly rated bond insurer to guarantee that investors are paid interest and principal each month. This fee is negotiated as a percentage of the outstanding principal balance of the securities and paid each month. A wrapped transaction proves attractive when the reduction in bond yield arising from the guarantee more than offsets the cost of insurance, or when an issuer/servicer believes it has better access to the market due to the insurance support. CarMax’s wrapped public securitizations include “performance triggers” negotiated with the bond insurer related to loss and delinquency rates. If loss or delinquency rates exceed or “breach” the initial trigger levels, excess cash generated by the securitized receivables is trapped in a reserve account until the breach is cured. If a second level or “event” trigger is breached, the bond insurer could remove CarMax as servicer. Once an initial breach is cured, the reserve account funding requirements revert to their prior level and any cash on deposit in the reserve account in excess of the required amount is released to the company. Each of CarMax’s securitizations is treated separately. Therefore, the breach of a trigger on one deal will not impact |
Dated July 11, 2003 | C-3 |
the reserve requirements of the other deals. No CAF loan pool has ever breached a trigger level. Information on delinquency performance relative to triggers is graphed in Chart 3. Information regarding CarMax deal loss performance relative to established triggers is graphed in Charts 4 and 5. The 1999-1 pool performance is graphed in Appendix F.
| B. | Publicly securitized pools. Chart 3 sets forth the dollar amount of accounts that were 31+ days past due as a percentage of the pool balance at month end on certain of CAF’s public securitizations. The chart reflects the number of months from the respective securitization pool composition date. |
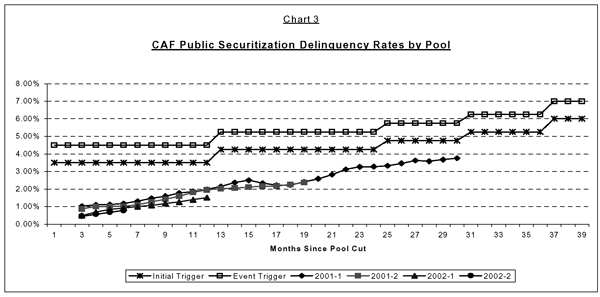
The differences in performance of the public securitizations are the result of differences in composition of the underlying receivables. The 2001-1 deal had the lowest bureau score of all the publicly securitized pools. Both the 2001-1 and 2001-2 securitizations were also negatively impacted by the economic slowdown.
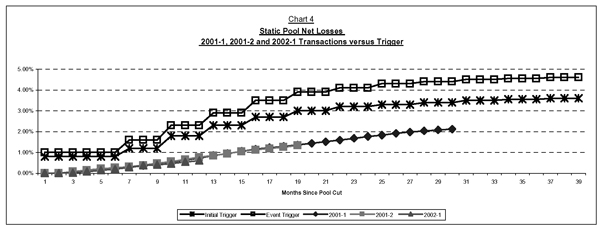
Dated July 11, 2003 | C-4 |
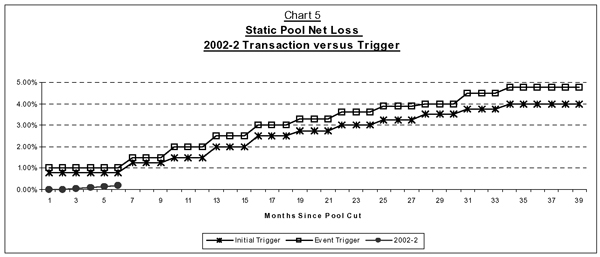
| C. | A senior-subordinated structure – In a senior-subordinated structure, the transaction stands on the merit of the assets and the servicer with no third party credit support. The credit enhancement of the deal consists of over-collateralization and/or cash reserves and by structured classes of securities which are “last in line” or subordinated with regard to their rights and priority in receiving payments. These subordinated securities bear the majority of the risk in the transaction and typically carry a higher interest rate than the senior securities. These transactions prove attractive for issuers when investors are willing to purchase securities without the support of a highly rated third party and the subordinated securities can be sold at a yield that facilitates a lower all-in cost of funds. Depending on market conditions, senior-subordinated transactions may or may not include performance triggers for the benefit of investors. CarMax’s most recent securitization employed a senior–subordinated structure and does not have built-in performance triggers or financial covenants. |
| 4) | Other Funding Alternatives |
CarMax is committed to funding its portfolio growth in the most effective manner. The company has explored, and will continue to explore, other funding alternatives for its auto loan receivables including sales arrangements that would transfer the residual risk to third parties. Any alternate funding opportunity must be evaluated with consideration to the economic and opportunity costs relative to current practice.
Dated July 11, 2003 | C-5 |
FORWARD-LOOKING STATEMENTS
This document contains forwarding-looking statements that are subject to risks and uncertainties that could cause actual results to differ materially from management’s projections, forecasts, estimates and expectations. Important factors that could cause actual results to differ materially from management’s statements are set forth in detail under the heading “Management’s Discussion and Analysis – Cautionary Information about Forward-Looking Statements” contained in portions of our fiscal 2003 annual report to shareholders filed as an exhibit to our fiscal 2003 annual report on Form 10-K filed with the SEC on May 29, 2003, and under such heading and/or the heading “Management’s Discussion and Analysis – Forward-Looking Statements in our subsequent reports on Form 10-Q filed with the SEC after the date of this document.
Appendix D: CAF Loan Servicing
Loan Servicing
This appendix presents an overview of CAF’s servicing team, key policies and general performance of key indicators. Here, we highlight repossession and remarketing processes, loss recognition and extension policies, and bankruptcy performance. CAF’s servicing team executes consistently and as a result achieves consistent portfolio performance.
| 1) | Servicing Philosophy |
CAF’s servicing philosophy is to provide customer service that supports the CarMax brand while ensuring portfolio performance. CAF’s policies and procedures are conservative and consistently applied. The team is dedicated to a high level of service and execution. Technology plays a key role and includes telephony management systems like a voice response unit (“VRU”), an automated dialer, and call management software. Servicing is divided into three primary sections: customer service, payment processing and collections. The team is comprised of approximately 200 associates: 55% collections, 35% customer service and 10% accounting.
| 2) | Customer Service |
Customer service has three primary areas of responsibility: contracts, titles and inbound calls and correspondence. The contract team ensures that all contracts are received, appropriately signed, and filed accordingly. The title team secures CAF’s interest in the collateral and facilitates title transfers at payoff. The inbound team handles all inbound customer service and early collection calls and any customer service correspondence. The group uses a VRU that provides customers 24-hour access to account information. Customer service focuses on maintaining the relationship and meeting the needs of the CAF customer, consistent with the superior CarMax brand.
Dated July 11, 2003 | D-1 |
| 3) | Collections |
The CAF collections team is divided into three areas: early, late and specialty. Overall, these teams focus on a customer service approach using technology and strategy that implements consistent and conservative policies to maximize portfolio performance results.
| A. | Early Collections – This team primarily performs outbound collections efforts on accounts that are 1-30 days past due. Dialer technology is used in order to maximize productivity and results. Both letter and call strategies are implemented. Behavioral characteristics and daily strategy are utilized to determine when a customer is called. |
| B. | Late Collections – This team works accounts that are greater than 30 days past due. Their primary objective is to ascertain whether the customer is going to pay or if CAF will need to repossess the vehicle. |
| C. | Specialty Collections – This team includes repossession, remarketing, bankruptcy, skip, legal and post-charge-off recovery. These teams focus on the specialized collection areas to minimize the loss on each account. |
| · | Repossession – CAF uses national and local vendors to repossess the cars. Generally, we repossess at 60-90 days past due and include this inventory in any reported delinquency numbers. Approximately 15-18% of repossessed vehicles are redeemed (returned to the customer) based on the customer bringing their account current while also considering prior behavior patterns of the customer, proof of employment and insurance. CAF currently repossesses an average of 250 cars monthly out of approximately 190,000 loans it services. |
| · | Remarketing – CAF remarkets or sells the vast majority of its repossessed inventory through the CarMax wholesale auctions. CAF uses these auctions because it costs less, takes less time, is more controllable and produces comparable results to the traditional auto auctions where CAF would have to pay another agency to represent its vehicles. On average, it takes 30 days from repossession to liquidate the vehicle, including state-mandated redemption periods. The proceeds from the sale are posted to the customer’s account and the remaining balance is charged off that same month. CAF’s recovery rates have historically run between 40-48% depending on the wholesale market. Recovery rate is reported as the repossession sale amount divided by the principal outstanding at the time of sale and does not include any subsequent payments made by the customer towards the deficiency balance. Recovery rates follow a seasonal trend, usually declining with the model year changeover in the fall. Additionally, the recent decline of the wholesale market due to manufacturer incentives has resulted in recovery rates in the low to mid 40’s. Recovery rates by fiscal year were 43% in fiscal |
Dated July 11, 2003 | D-2 |
2003, 45% in fiscal 2002, and 50% in fiscal 2001. CAF remarkets an average of 200 cars each month.
| · | Bankruptcy – CAF is a secured creditor. As a result, CAF has greater protection in a bankruptcy case than an unsecured creditor, such as a credit card issuer. For typical customers, their auto loan is a priority payment, second only to the mortgage. As such, bankruptcy filings have been extremely consistent month over month and year over year. CAF manages the Chapter 7 (liquidation) filings in-house, working with the debtor’s attorney. Chapter 7’s represent approximately 75% of the filings and typically result in CAF receiving possession of the vehicle for resale. Chapter 13 (rehabilitation) filings represent 25% of CAF filings and involve restructuring of debt. CAF manages these cases through an attorney network. Bankruptcy filings have remained consistent, averaging 1.1-1.4% of active accounts annually. |
| 4) | Key Collection Policies |
| A. | Loss recognition – CAF charges off a receivable on the earliest of: |
| · | The last business day of the month during which any payment, or any part of any payment, due under the receivable agreement becomes 120 days delinquent, whether or not CAF has repossessed the motor vehicle securing the receivable; and, |
| · | If CAF has repossessed the motor vehicle securing the receivable, the month during which the motor vehicle is liquidated or sold. |
| B. | Extensions – At times, a payment deferral, or extension, may be granted to a customer that allows them to delay making their payment for 30 days. The following criteria are used when determining an account’s eligibility for an extension: |
| · | Account has been open for a minimum of 6 months (6 payments received). |
| · | An account may only be allowed a total of one extension per contractual year over the lifetime of the contract and only two extensions in a 12 month period (a 60 month contract is eligible for a maximum of 5 extensions over its life and no more than 2 in any 12 month period). |
| · | An extension will only be granted if it cures that account, meaning that once the extension has been granted, the account will no longer be in a delinquent status. |
| · | In addition, an extension may also be approved in connection with bankrupt accounts. Once the account has been reaffirmed or the payment plan has been confirmed and three consecutive payments have been received, the account will be modified to reflect a current status. |
Dated July 11, 2003 | D-3 |
CAF uses this policy conservatively; not all customers who meet these guidelines are approved for an extension. CAF has established levels of authority within these guidelines that require different levels of management approval. At a minimum, a supervisor must approve any extension. Extensions are ultimately limited to those customers who CAF believes will ultimately complete the payments on their account. There is no charge the customer for an extension. On average, CAF extends about 5% of our active accounts annually. This percentage also follows a seasonal trend corresponding to delinquencies; that is, higher in the fall and winter months. CAF tracks the performance of the extension population separately in order to evaluate the use of this policy. |
Dated July 11, 2003 | D-4 |
FORWARD-LOOKING STATEMENTS
This document contains forward-looking statements that are subject to risks and uncertainties that could cause
actual results to differ materially from management’s projections, forecasts, estimates and expectations.
Important factors that could cause actual results to differ materially from management’s statements are set forth
in detail under the heading “Management’s Discussion and Analysis – Cautionary Information about Forward-
Looking Statements” contained in portions of our fiscal 2003 annual report to shareholders filed as an exhibit to
our fiscal 2003 annual report on Form 10-K filed with the SEC on May 29, 2003, and under such heading and/or
the heading “Management’s Discussion and Analysis – Forward-Looking Statements” in our subsequent reports
on Form 10-Q filed with the SEC after the date of this document.
APPENDIX E: UNDERSTANDING CAF FINANCIAL INFORMATION
| 1) | Key Assumptions Used in Measuring Retained Interest and Sensitivity Analysis |
The “carrying amount” or fair value of the interest only (i/o) strip portion of CarMax’s retained interest in securitized receivables is based on the projected discounted cash flows of the securitized receivables. The projected cash flows are based on certain assumptions, commonly referred to as the “gain” assumptions. These assumptions determine the amount of income CarMax recognizes at time the receivables are securitized. Continued valuation of the retained interest monitors the projected cash flows using these assumptions versus actual cash flows. If the receivables outperform these projections, CarMax will recognize additional income. If the receivables were to underperform the assumptions, CarMax would recognize an impairment to the retained interest that would have a negative impact on earnings. The following three variables are used to value the i/o portion of the retained interest:
| · | Prepayment Rate - A critical component of cash flow projections is the rate at which the principal balance pays down. A pool of loans will experience both “scheduled” and “unscheduled” principal payments each month. Scheduled principal payments are those principal payments that are based on a normal amortization schedule for a loan or pool of loans. A normal amortization schedule assumes all customers make their exact payment amount on the exact due date. Prepayment rates are used to estimate unscheduled principal payments. Unscheduled principal payments are those outside of the normal amortization scheduled. For example, most borrowers trade in their car well before the term of the loan expires. This results in unscheduled principal payments. CarMax uses the Absolute Prepayment Model or “ABS” prepayment to estimate the rate of prepayment. To evaluate the accuracy of the prepayment rate, CarMax simply compares the actual receivable balances to the modeled receivable balances on a monthly basis. |
| · | Loss Rate – To accurately model cash flows for a pool of receivables, both the timing and amount of losses must be taken into account. Because loss rates on a pool of amortizing auto loans are not linear, they are somewhat more complex |
Dated July 11, 2003 | E-1 |
to predict. They are also impacted by economic factors, seasonal factors and in the case of auto receivables, wholesale vehicle values. Because losses occur over the entire life of a pool of receivables, the industry views losses on a cumulative or static pool basis. In a hypothetical pool of $100 million in receivables (see Chart 2 and Chart 3, page E-4), we assumed a cumulative net loss rate of 1.9%. In other words, between the day the loans are originated and the day the final loan pays off 60 months later, $1,900,000 will charge off. The timing of losses is also an important factor in determining cash flows. To model the timing of losses, we use a net loss timing curve. Net loss timing curves are typically presented in graphical format and predict the cumulative percentage of losses a pool of receivables will have experienced at any point in time. As demonstrated in the Cash Flow models in Charts 2 and 3, historically, 64% of the total expected net losses are typically incurred in the first 24 months. |
| · | Discount Rate – CarMax currently uses a discount rate of 12% to obtain the present value of the cash flows related to the retained interest. The discount rate is determined based on the risk of the underlying receivables and current market conditions. |
CarMax evaluates the performance of the managed receivables in relation to these assumptions on a quarterly basis and, if needed, adjusts the assumptions accordingly. These assumptions as well as the hypothetical impact of adverse changes in receivable performance are disclosed in the annual report, Notes to CarMax’s financial statements as of February 28, 2003.
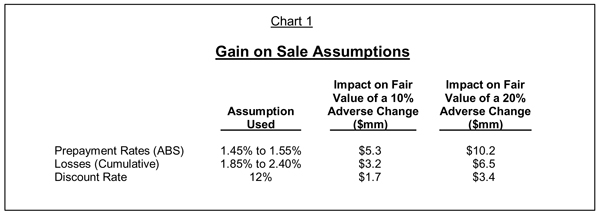
This table allows the reader of the financial statements to understand CarMax’s exposure to changes in the performance of the managed receivables. The table includes ranges for prepayment and loss rates as the individual public securitizations and the conduit may have different prepayment and loss assumptions. To date, CarMax has not recorded a material adjustment to profits as a result of any adverse change in assumptions.
Dated July 11, 2003 | E-2 |
Prepayments can vary based on the interest rate market. Rapidly declining interest rates may cause prepayments to increase as consumers find more attractive financing. Due to the relatively short term and small dollar amount of the loans, prepayment rates for auto loans are much less sensitive to market interest rates than prepayment rates for other loans such as mortgages.
Loss assumptions are based on the quality of the underlying receivables as well as the relative “seasoning” of the loans. Seasoning refers to the age of the loans at the time they are securitized. Generally speaking a pool of loans with a higher amount of seasoning will experience lower cumulative loss rates because many of the losses have already been incurred prior to securitization.
| 2) | Cash Flow and Income Recognition Model |
This section provides an illustrative model that depicts both how automobile loans originated by CAF generate income and how this income is recognized. In the interest of simplicity, it ignores certain aspects of CAF’s funding structures such as reserve accounts and over-collateralization. These are discussed in later sections.
| A. | Cash Flow Model |
The most efficient way to understand the finance operation is by looking at the underlying cash flows. CAF’s installment contracts are simple interest, fixed-rate amortizing receivables with a reasonably predictable cash flow stream. In a typical month CAF may originate a total of $100,000,000 in receivables. This month’s originations represent a distinct “pool” of receivables with specific characteristics that will determine the amount of net cash flows the receivables will generate over their expected life. These characteristics are defined below.
| · | APR– The annual percentage rate (APR) is the interest rate charged to the consumers. This determines the expected amount of finance income generated by the loans. |
| · | Term– The term is the average original term in months for the pool of loans. |
| · | Interest Expense – The interest expense represents the funding cost associated with financing the receivables. |
| · | Credit Losses – Credit losses are the dollar amount of loans that will default net of liquidation proceeds and recoveries (deficiency balance collections). |
| · | Servicing Expenses – Servicing expenses represent the cost of servicing the loans. |
| · | Prepayment Rates– Prepayment rates are used to estimate unscheduled principal payments. (See definition of prepayment rates on page E-1 of this appendix.) |
Assume the following characteristics for a pool of loans originated in a normal interest rate environment:
Dated July 11, 2003 | E-3 |
Loans originated | $ | 100,000,000 | |
APR | 8.5% | ||
Term (Months) | 60 | ||
Interest Expense | 4.16% | ||
Credit Losses (Cumulative) | 1.90% | ||
Servicing Expenses (Annualized) | 1.00% | ||
Pre-payment Speed (ABS) | 1.50% | ||
Discount Rate | 12% |
Based on these characteristics, we would expect the pool of loans to generate a total of $4.59 million in income over their life. The table below depicts the theoretical underlying cash flows for the pool of receivables including net finance income, the pay down of the receivable balance and present value of the cash flows discounted at 12%.
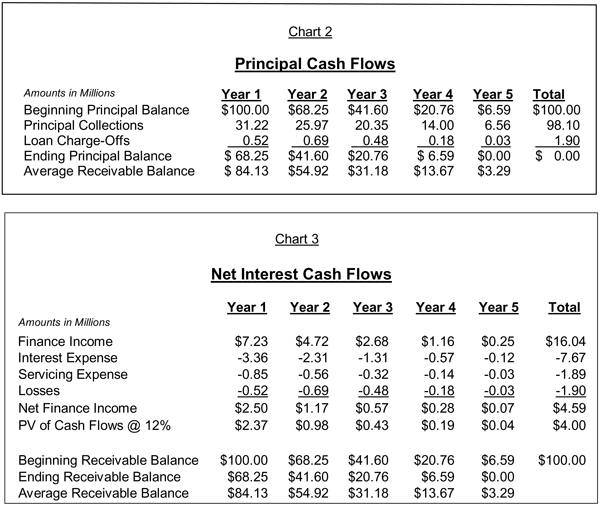
We believe the above cash flows are a reasonable illustration of the performance of a typical month of CAF originations in a normal interest rate environment. The actual interest rate environment was very favorable in FY02 and FY03. CAF receivables originated in these years generated substantially more cash than
Dated July 11, 2003 | E-4 |
depicted in the above example. Note that over 50% of the net cash flows are generated in the first year.
| B. | Income Recognition Model |
CAF securitizes or sells substantially all the receivables it originates in the month the loans are originated. These securitizations are treated as sales in accordance with SFAS 140. Because the securitizations are sales without recourse neither the receivables, related liabilities, finance income, interest expense or losses appear in CarMax’s financial statements.
Although CAF sells the receivables, it retains the rights to receive the excess cash flow stream. CAF also continues to service the receivables for a fee. Below is a description of the various components of CAF income:
| · | Gain Income– The present value (“PV”) of the expected excess cash flows from the securitized receivables is recorded as an “Interest-Only Strip Receivable” (also referred to as an “i/o strip”). In the example in Chart 3, the PV of the cash flows is $4 million. A receivable and corresponding gain on sale of $4 million is recognized. |
| · | Interest Income – The difference between the total cash received and the PV of the cash flow or “accreteable yield” is recognized as interest income over the life of the securitization using the effective yield method. For example, in year 1, the total excess cash generated by the securitized receivables is $2.5 million (see Net Interest Cash Flows). Of this amount $2.16 million reduces the I/O strip balance and $0.33 million is recognized as interest income. |
| · | Servicing Fee Income – CAF receives a servicing fee equal to 1% of the outstanding receivable balance each month. The model assumes that CAF retains the rights to service the receivables. |
| · | Estimated servicing expenses – The model below includes estimated expenses CAF would incur in servicing these receivables. |
Chart 4 illustrates the impact on CAF’s financial statements of a hypothetical pool of receivables in both the period they are originated and securitized as well as subsequent periods:
Dated July 11, 2003 | E-6 |
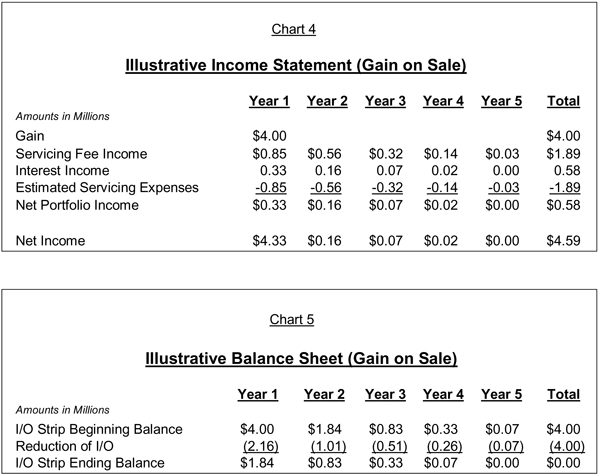
| C. | Timing Difference Between Earnings and Cash Flow |
Although a timing difference clearly exists between the recognition of earnings and the receipt of cash flows, due to the relatively short life of the loans more than 50% of the net interest cash flows are realized in the first 12 months and 80% in the first 24 months. Chart 6 illustrates the timing difference between earnings and cash flows, assuming no deviation from assumption based on the receivables in the illustrative model.
Dated July 11, 2003 | E-6 |
| 3) | CAF Actual Historical Income |
CarMax reports CAF’s income in its financial statements below gross profit and without any indirect expense allocation, including dealer participation or commissions and marketing costs that CAF would pay as a third party finance company. As a result, CAF income is best evaluated as a percentage of total margin contribution as illustrated in Section B.
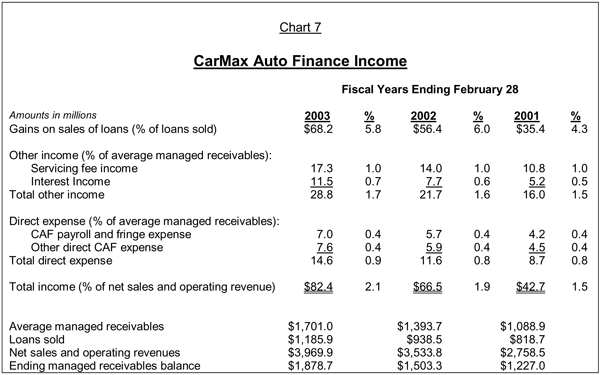
| A. | Gain on Sale of Receivables |
Gain on sale of receivables is typically expressed as a percentage of loans sold. CarMax sells the vast majority of the receivables originated by CAF in the same month they are originated. When the loans are repurchased and simultaneously resold in a public securitization, there is typically not a material impact on income; therefore, these loan sales are not reported. Projecting gain income requires the assumption for loans sold as well as the assumption for gain on sale percentage. Loans sold are best viewed as a percentage of used vehicle dollar sales as new vehicles represent only 4-5% of CAF originations. Over the last three fiscal years, this percentage has ranged from 38% to 42%, as seen in Chart 8.
Dated July 11, 2003 | E-7 |
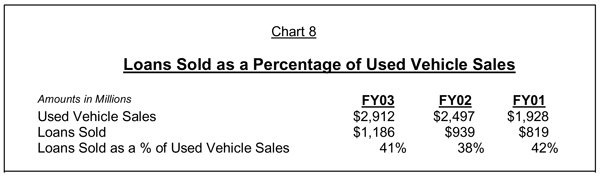
Gain on sale as a percentage of loans was 5.75% in FY03 and 6.01% in FY02; however, these percentages were much higher than normal as the result of a very favorable interest rate environment. In a more normal interest rate environment, we expect this percentage would be in the 3.50% – 4.50% range.
| B. | Other Income (Portfolio or Managed Receivables Income) |
Other income consists of interest income and servicing fees earned from servicing securitized receivables. The majority of interest income results from the accretion of the present value discount used to value retained interests. Over the last three years, other income as a percent of the average managed receivables balance has ranged from 1.5% to 1.7% of the managed receivable balance.
| C. | Direct Expenses (Portfolio or Managed Receivables Expenses) |
Direct expenses include CAF expenses incurred to underwrite and service the loans. As reported in the public filings it does not include any allocation of store or corporate overhead. Direct expenses are largely a function of the average managed receivable balance. Over the last three years, direct expenses as a percent of the average managed receivables balance has ranged from .80% to .86% of the managed receivable balance.
| 4) | Estimating CAF Cash Flows |
Pretax cash flows generated by CAF can be estimated using information readily available in CarMax’s financial statements. Chart 9 presents a theoretical example:
Dated July 11, 2003 | E-8 |
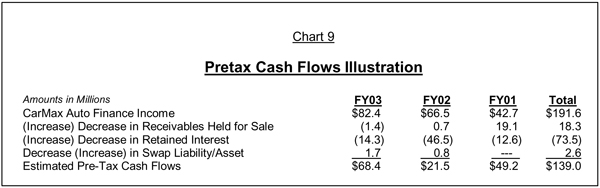
Although this methodology does not account for minor adjustments such as depreciation and amortization, it does account for the major differences between book income and cash flows for the finance operation. Both the change in receivables held for sale and the change in retained interest appear as individual line items in the CarMax statement of cash flows. The change in the swap liability or asset must be calculated based on the ending asset or liability for the years in question. This amount is found in Note 13 “Financial Derivatives” in the financial disclosures of the company’s consolidated financial statements.
| 5) | Projecting CAF Income |
The three components of CAF income can all be projected based on used vehicle sales dollars as follows:
| A. | Gain Income |
Gain income is a function of loans sold and gain percentage. Loans sold as a percentage of used vehicle dollar sales have ranged from 38% to 42% over the last three years. We expect loans sold as a percentage of used sales to remain in this range. Gain income as a percentage of loans sold has ranged from 4.3% to 6.0% over the last three years as we have benefited from a very favorable rate environment. In a normal interest rate environment, we expect this percentage would be in the 3.5% to 4.5% range.
| B. | Other Income |
Other income has ranged from 1.5% to 1.7% of managed receivables over the last three years. We expect this percentage to remain consistent and we expect managed receivables to grow proportionately to used vehicle sales.
| C. | Direct Expenses |
Direct expenses have ranged from ..8% to .9% of managed receivables over the last three years. We expect this percentage to remain consistent and we expect managed receivables to grow proportionately to used vehicle sales.
Dated July 11, 2003 | E-9 |
FORWARD-LOOKING STATEMENTS
This document contains forward-looking statements that are subject to risks and uncertainties that could cause actual results to differ materially from management’s projections, forecasts, estimates and expectations. Important factors that could cause actual results to differ materially from management’s statements are set forth in detail under the heading “Management’s Discussion and Analysis – Cautionary Information about Forward-Looking Statements” contained in portions of our fiscal 2003 annual report to shareholders filed as an exhibit to our fiscal 2003 annual report on Form 10-K filed with the SEC on May 29, 2003, and under such heading and/or the heading “Management’s Discussion and Analysis – Forward-Looking Statements” in our subsequent reports on Form 10-Q filed with the SEC after the date of this document.
Appendix F: Performance of CAF Portfolios
| 1) | CAF Securitization Loss Performance |
Cumulative loss assumptions can be evaluated by comparing the assumptions to the actual loss performance of CarMax’s publicly securitized receivables. Chart 1 details static pool performance for each of the securitized pools as of May 31, 2003.
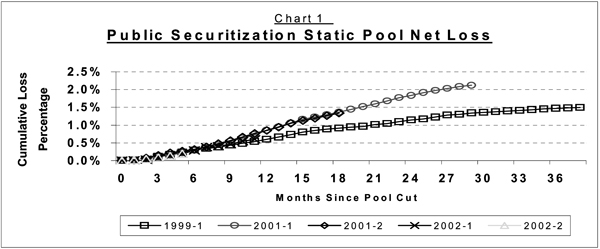
The differences in performance of the public securitizations are the result of differences in composition of the underlying receivables. The 1999-1 pool had significantly more seasoning compared to the other public securitizations and therefore lower net losses, as expected. The 2001-1 deal had the lowest credit score of all the publicly securitized pools. The 2001-1 and later securitizations have been negatively impacted by the economic slowdown and lower recovery rates resulting from the steep decline in wholesale vehicle prices. The weighted average credit scores on the 2001-2 and subsequent securitizations have been somewhat higher, resulting in lower net losses. Performance information related to the warehouse facility is not reported here as the receivables are only in this facility for 4 months on average. Consequently, the receivables are not old enough to have meaningful performance history when they are in this facility.
Dated July 11, 2003 | F-1 |
| 2) | Considerations when comparing loss and delinquency performance of CAF to others in the industry |
Three primary considerations when comparing cumulative static pool losses or annual losses as a percent to managed receivables are:
| 1) | Loss recognition policy and delinquency reporting |
| 2) | Seasoning (age of the portfolio) |
| 3) | Seasonality (time of year) |
| A. | Loss recognition policy and delinquency reporting – Loss recognition policies differ from lender to lender. CAF has a conservative policy that is further discussed in Appendix D. Many other finance companies allow repossessed inventory and bankruptcies to age longer than 120 days past due. Some finance companies may exclude repossessed inventory from their delinquency numbers. CAF includes repossessed inventory in its delinquency numbers. |
| B. | Seasoning (average portfolio age or result of growth rate of new receivables) – The growth rate or the seasoning (average age) of the portfolio impacts these industry measures. The impact of seasoning on losses as a percent of managed receivables is demonstrated by the performance of a modeled, static pool of receivables. Chart 2 illustrates this and is derived from the same cash flow model used in section B of Appendix E. |
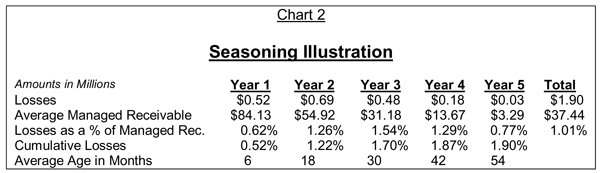
The above chart illustrates that over the life of the pool, cumulative losses were 1.9% of the original pool balance. Over the five-year life, annualized losses averaged 1.01% of the managed receivables. In a given year, losses as a percent of the average managed receivable balance ranged between .62% and 1.54% based on the average age of the portfolio. A managed portfolio with an average age of six months would experience losses as a percent of managed receivables of .62%. A pool of receivables with the same credit profile and same expected lifetime losses, but an average age of 18 months would experience losses as a percent to managed receivables of 1.26%. A managed portfolio that is growing rapidly will have a lower average age in months and therefore lower losses as a percent to managed receivables.
Dated July 11, 2003 | F-2 |
| C. | Seasonality (time of year) – There are also seasonality trends in these measures as losses and delinquencies tend to be higher in the winter months. Below is the Moody’s Prime Index for annual losses as a percent of managed receivables for the last two calendar years. The trend line for the Big Three (FMAC, GMAC, CFC) domestic captive lenders is also reported. The CAF portfolio closely tracks with the Prime Index line. |
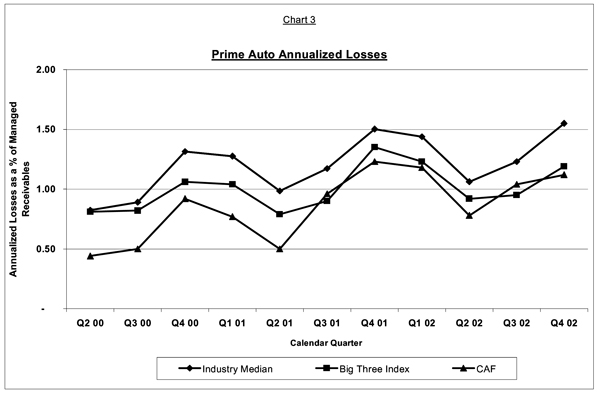
Note: Industry median and Big Three data is from Moody’s Investors Service. CAF
information represents historical loss information for the total managed portfolio.
| 4) | CAF Prepayment Performance |
CAF prepayment performance has been consistently within a narrow band on the securitized portfolios. CAF uses the industry standard ABS method to calculate prepayment rate.
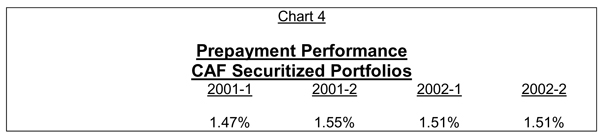
Dated July 11, 2003 | F-3 |
Performance has remained consistent despite the unprecedented downward trend in interest rates in the auto loan market. We believe this consistency is partially attributable to the 3-day payoff option CarMax offers customers on all loans booked through any of our five lenders.
Because this policy allows rate-sensitive borrowers to shop around for a lower rate for 3 days after the sale, and to re-book their loan with an outside lender at no penalty, we believe the customers most likely to refinance because of market rate changes never enter the portfolio.
# # #
Dated July 11, 2003 | F-4 |