2 Forward-Looking Statement This presentation contains forward-looking statements, which are subject to risks and uncertainties. Additional discussion of factors that could cause actual results to differ materially from management’s projections, forecasts, estimates, and expectations is contained in the CarMax, Inc. SEC filings. |
3 CarMax Today Used Car Superstores Nation’s largest used car retailer 71 used car superstores 34 markets FY06: • Sales: $6.3 Bn +19% • Net profit: $134 mm +32% Orlando Tampa Miami / Ft. Lauderdale Baltimore / DC Chicago Charlotte Greensboro Greensboro Mid-sized Markets (26) Large Markets (8) Greenville Birmingham Memphis Louisville Indianapolis Columbia 1 1 2 1 2 1 1 1 1 2 2 2 2 2 2 5 4 4 8 4 4 1 1 1 1 2 5 1 1 Jacksonville Houston San Antonio Austin Sacramento 1 Salt Lake City Nashville Knoxville Albuquerque Las Vegas Kansas City Richmond Atlanta Raleigh Los Angeles 1 Va. Beach 1 1 Wichita 1 Hartford 2 Columbus 1 Oklahoma City Dallas/Fort Worth |
4 CarMax Today Sustainable Store Growth Restarted 0 0 1 2 4 7 18 29 33 33 35 42 49 58 67 78 0 20 40 60 80 Prototype Development Prototype Refinement Competitive Response (Rapid Growth) Stabilization Growth Restart |
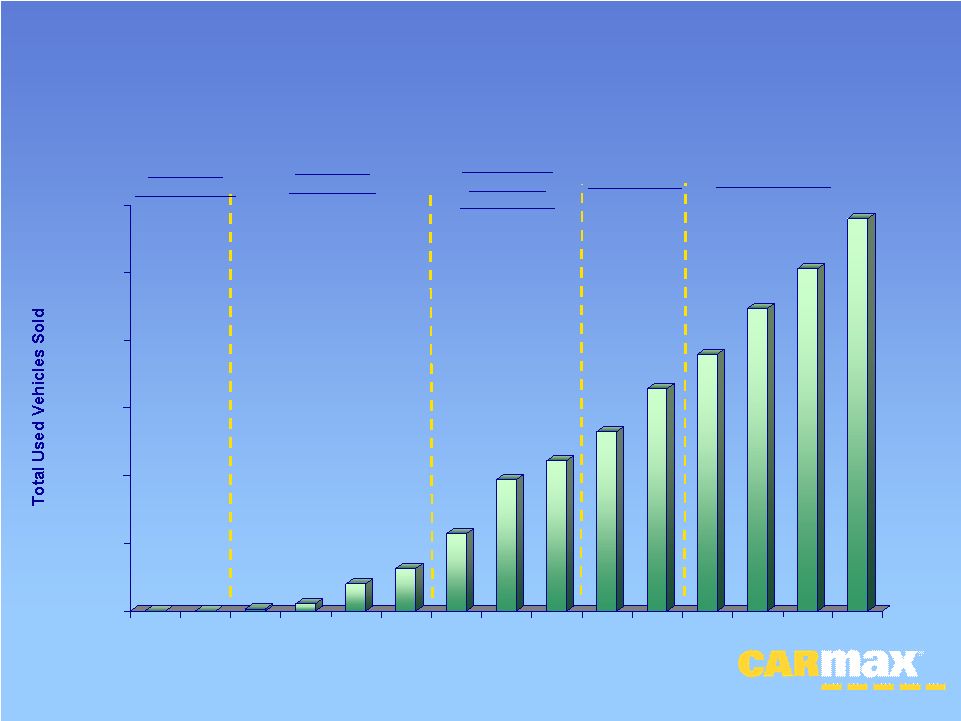
5 CarMax Today Unit Growth Continued 0 0 1,300 5,574 19,618 31,701 56,594 96,915 111,247 132,868 164,062 190,135 224,099 253,168 289,888 0 50,000 100,000 150,000 200,000 250,000 300,000 FY92 FY93 FY94 FY95 FY96 FY97 FY98 FY99 FY00 FY01 FY02 FY03 FY04 FY05 FY06 Competitive Response (Rapid Growth) Stabilization Growth Restart Prototype Refinement Prototype Development |
6 CarMax Today Profitability Established $0 ($25) ($2) ($4) ($5) ($9) ($34) ($24) $.5 $44 $89 $90 $110 $101 $134 ($50) $0 $50 $100 $150 $200 FY92 FY93 FY94 FY95 FY96 FY97 FY98 FY99 FY00 FY01 FY02 FY03 FY04 FY05 FY06 Prototype Development Prototype Refinement Competitive Response (Rapid Growth) Stabilization Growth Restart * Revised for the effects of stock-based compensation expense |
7 Results FY06 FY07e Used unit comp growth 4% 2%-- 8% Total sales growth 19% Net earnings growth 32% EPS $1.27 $1.25 -- $1.47 After adoption of SFAS 123R |
8 1Q FY07 Results FY07 Used unit comp growth 6% Used unit sales growth 14% Total sales growth 19% Net earnings growth 54% EPS 53¢ After adoption of SFAS 123R |
9 What Is CarMax? Unique retail opportunity Provides superior economic returns |
10 CarMax Sells More Cars Unit Sales / Store CarMax (FY06) 5,040 used Public new car dealers 1,640 new & used Average new car dealer 1,325 new & used Source: CarMax estimates and NADA 2005 |
11 CarMax Gains Market Share Used Car Comp Unit Sales 2005 4-Year Average CarMax (FY06) +4% +5% Public new car dealers 0% (4)% Source: Company reports and CarMax estimates |
12 Why Does CarMax Work? Used car focus Consumer-preferred concept Process-driven competitive advantages Organic growth plan |
13 Used Car Focus Used Unit Sales Mix % Per month CarMax (FY06) 93% 420 Public new car dealers 35% 50 Average new car dealer 41% 45 Source: Published auto retailer reports and NADA 2005 |
14 Why Used Cars? Huge, fragmented business Non-commodity Stable |
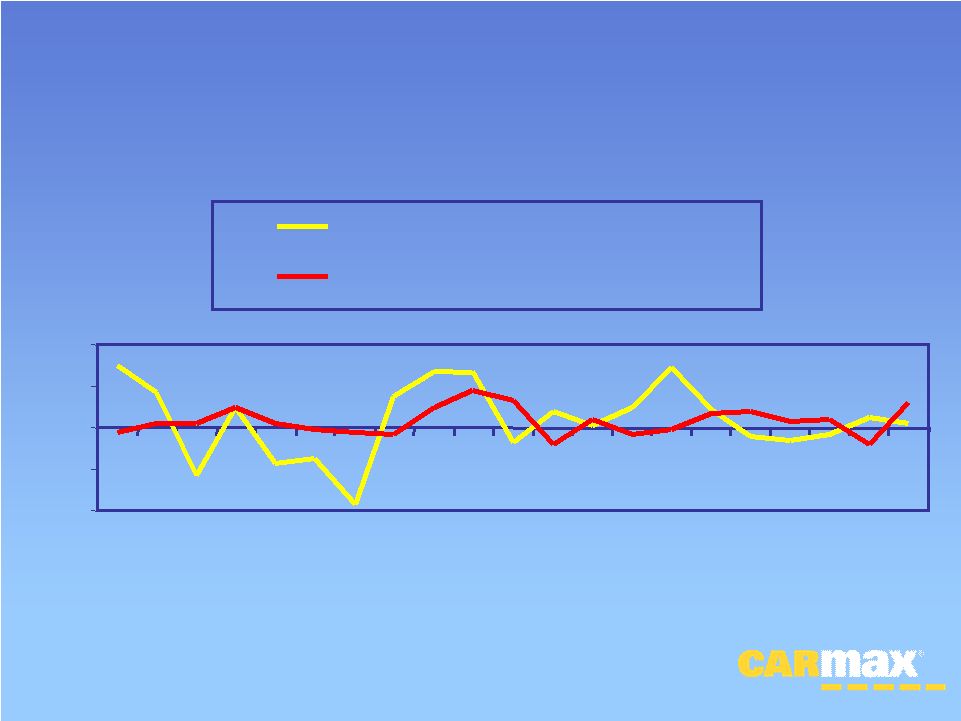
15 Used Vehicle Sales Stable Source: Manheim Auctions -12.0% -6.0% 0.0% 6.0% 12.0% 1985 1987 1989 1991 1993 1995 1997 1999 2001 2003 2005e % Change New Vehicle Unit Sales % Change Used Vehicle Unit Sales |
16 Consumer-Preferred Concept Low, no-haggle prices Huge selection of late-model used cars Guaranteed quality Customer-friendly service |
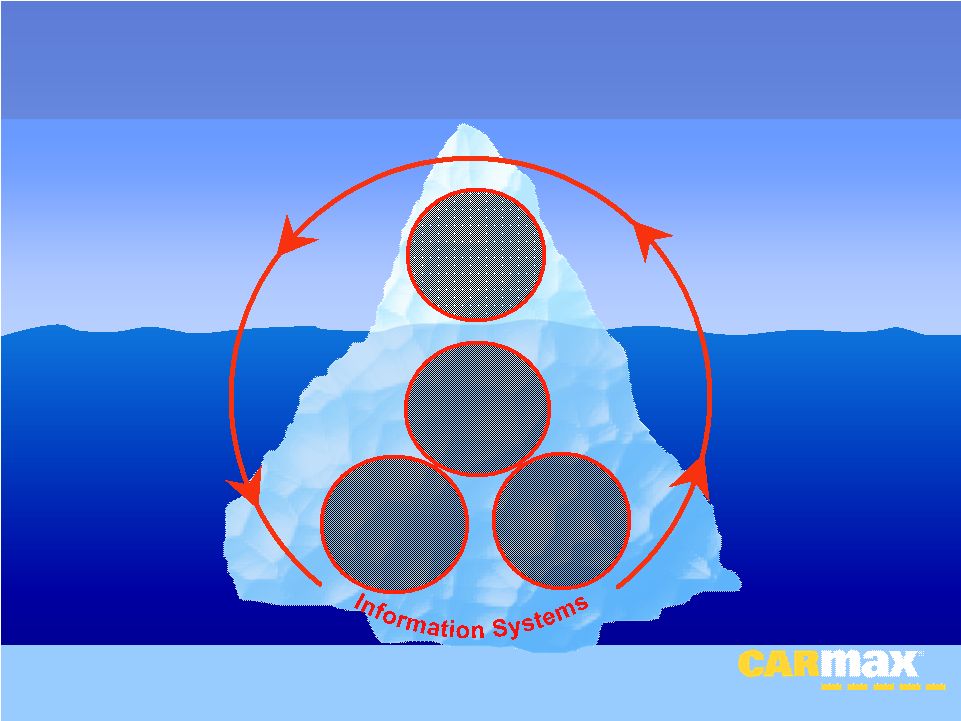
17 Proprietary Operating Process Finance Originations Purchasing/ Inventory Management Reconditioning Consumer Consumer Offer Offer |
18 Fortune Magazine Recognition • Two years running (2005, 2006) • Only auto retailer or manufacturer on list • Voted #1 in Automotive Retailing |
19 Organic Growth Creates value Not acquisition dependent Not 3 rd -party constrained |
20 Opportunity Scale Market: $280 Bn Currently 30% of U.S. Mature Stores 8% - 10% market share |
21 Growth Plan (FY06 – FY10) 5-year goal: $10 - $12 Bn Comp used unit growth: 4% - 8% New store openings 15% - 20% New store openings Store margin expansion Fixed overhead leverage Profit Growth Sales Growth |
22 FY07 Planned New Superstores Fredericksburg (DC / Richmond) Gastonia (Charlotte) 1 1 1 Austin South Atlanta Burbank (Los Angeles) New Stores Remaining to be Opened New Stores Remaining to be Opened 1 Oklahoma City 1 Hartford Charlottesville (Richmond) 2 Columbus 1 Car Buying Center Test Car Buying Center Test 1 1 Fresno New Stores Opened to Date New Stores Opened to Date 1 New Haven |


