UNITED STATES
SECURITIES AND EXCHANGE COMMISSION
Washington, D.C. 20549
FORM N-CSR
CERTIFIED SHAREHOLDER REPORT OF REGISTERED
MANAGEMENT INVESTMENT COMPANIES
Investment Company Act file number 811-21076
PIMCO Municipal Income Fund II
(Exact name of registrant as specified in charter)
1633 Broadway
New York, New York 10019
(Address of principal executive offices) (Zip code)
Lawrence G. Altadonna
1633 Broadway,
New York, New York 10019
(Name and address of agent for service)
Registrant’s telephone number, including area code: 212-739-3371
Date of fiscal year end: May 31, 2014
Date of reporting period: November 30, 2013
Item 1. REPORT TO SHAREHOLDERS
PIMCO Municipal Income Fund II
PIMCO California Municipal Income Fund II
PIMCO New York Municipal Income Fund II
Semi-Annual Report
November 30, 2013


Table of Contents
Letter from the Chairman of the Board and President

Hans W. Kertess
Chairman

Brain S. Shlissel
President & Chief Executive Officer
Dear Shareholder:
Municipal bonds generated weak results during the fiscal six-month reporting period ended November 30, 2013. Yields moved higher as the US economy continued to expand and the Federal Reserve (the “Fed”) indicated that it may begin tapering its asset purchase program. Investor demand for municipal securities also slumped as the reporting period progressed due to concerns regarding the fallout from Detroit’s bankruptcy filing.
For the fiscal six-month period ended November 30, 2013:
| n | | PIMCO Municipal Income Fund II returned -6.96% on net asset value (“NAV”) and -10.22% on market price. |
| n | | PIMCO California Municipal Income Fund II returned -9.18% on NAV and -9.22% on market price. |
| n | | PIMCO New York Municipal Income Fund II returned -8.02% on NAV and -9.93% on market price. |
Six Months in Review
During the reporting period, the US experienced choppy, but continued growth. Gross domestic product (“GDP”), the value of goods and services produced in the country, the broadest measure of economic activity and the principal indicator of economic performance, grew at an annual pace of 1.1% during the first quarter and 2.5% during the second quarter of 2013.
The US Commerce Department reported that third quarter 2013 GDP growth registered 4.1%. Supporting the economy were signs of improvement in the housing market and although unemployment remained elevated, the unemployment rate declined during the six-month reporting period.
The Fed maintained an accommodative monetary policy throughout the reporting period. However, with unemployment falling and signs of improving economic activity, the Fed announced its intention to begin tapering its monthly $85 billion asset purchase program in June 2013. This triggered sharply rising yields and declining bond prices. However, the Fed surprised many investors at its meetings in September and October 2013 by choosing not to begin tapering. This caused yields to drop from the reporting period peak in early September. All told, US Treasury interest rates moved sharply higher during the six-month fiscal period, with the yield on the benchmark 10-year Treasury bond rising from 2.16% to 2.75%.
| | | | |
| 2 | | Semi-Annual Report | | | November 30, 2013 |
Outlook
The US was highly resilient during the reporting period and appeared to overcome the headwinds associated with higher taxes, the sequestration and rising interest rates. Market volatility was at times elevated during the period. This was partly triggered by concerns regarding the Fed’s plans to taper its asset purchase program, mixed global growth and the 16 day partial US government shutdown that began on October 1, 2013.
Receive this report electronically and eliminate paper mailings.
To enroll, visit;
us.allianzgi.com/edelivery.
In December 2013, after the reporting period concluded, the Fed announced the tapering of its asset purchase program. We expect the central bank to take a measured approach with the withdrawal of its purchases in 2014. While ongoing Fed tapering could lead to periods of volatility, the Fed made it clear that it does not intend to raise short term rates for an extended period, indicating that “highly accommodative stance of monetary policy will remain appropriate for a considerable time after the asset purchase program ends and the economic recovery strengthens.” Consequently, concerns of higher mortgage rates impacting the housing market, geopolitical issues, and continued dysfunction in Washington DC are likely to contribute to market volatility.
For specific information on the Funds and their performance, please review the following pages. If you have any questions regarding the information provided, we encourage you to contact your financial advisor or call the Funds’ shareholder servicing agent at (800) 254-5197. In addition, a wide range of information and resources is available on our website, us.allianzgi.com/closedendfunds.
Together with Allianz Global Investors Fund Management LLC, the Funds’ investment manager, and Pacific Investment Management Company LLC (“PIMCO”), the Funds’ sub-adviser, we thank you for investing with us.
We remain dedicated to serving your investment needs.
Sincerely,
| | |
 | |  |
| Hans W. Kertess | | Brian S. Shlissel |
| Chairman of the Board of Trustees | | President & Chief Executive Officer |
| | | | | | |
| November 30, 2013 | | | Semi-Annual Report | | | 3 | |
Fund Insights
PIMCO Municipal Income Fund II
PIMCO California Municipal Income Fund II
PIMCO New York Municipal Income Fund II
November 30, 2013 (unaudited)
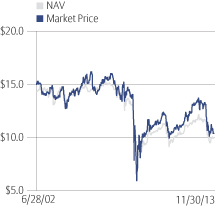
For the six-months ended November 30, 2013, PIMCO Municipal Income Fund II (“Municipal II”) returned -6.96% on net asset value (“NAV”) and -10.22% on market price.
For the six-months ended November 30, 2013, PIMCO California Municipal Income Fund II (“California Municipal II”) returned -9.18% on NAV and -9.22% on market price.
For the six-months ended November 30, 2013, PIMCO New York Municipal Income Fund II (“New York Municipal II”) returned -8.02% on NAV and -9.93% on market price.
The overall municipal bond market, as measured by the Barclays Municipal Bond Index (the “Index”) experienced periods of elevated volatility during the six-month reporting period ended November 30, 2013. The Index produced a negative return during each of the first three months of the period. This was triggered by sharply rising yields given the Federal Reserve’s (the “Fed”) announcement of a possible shift in monetary policy. Investor demand for municipal bonds also weakened due to several high profile credit events, including Detroit’s filing for bankruptcy in July 2013. The Index then rallied sharply over the next two months of the period as the Fed surprised the market and chose not be begin tapering its asset purchase program during its meeting on September 18. However, the Index modestly declined during the last month of the period as interest rates again moved higher. All told, the Index fell 2.45% during the six-month reporting period. In comparison, the overall taxable fixed income market, as measured by the Barclays US Aggregate Bond Index, declined 0.56%.
Each Fund’s longer duration than the Index detracted from performance, as municipal yields moved higher during the six-month reporting period. Each of the Funds were negatively impacted by their overweighting to the tobacco sector as this sector underperformed the Index. Municipal II and California Municipal II were negatively impacted by their overweighting to the Industrial Revenue sector given its underperformance versus the Index. California Municipal II’s and New York Municipal II’s preference for Revenue municipal bonds over General Obligation municipal bonds was detrimental as the former underperformed the latter during the reporting period. New York Municipal II’s overweighting to the Lease-Backed and Industrial Revenue sectors was detrimental to performance as both of these sectors underperformed the Index.
Each of the Funds benefited from an underweighting to Puerto Rico-related securities as a result of their underperformance versus the Index. Municipal Income II’s tactical exposure to the Special Tax sector and its underweighting to the Transportation sector were beneficial for its performance. California Municipal II’s tactical exposure to the Electric Utility sector and its underweighting to the Lease-Backed sector were positive for performance. New York Municipal II’s underweightings to the Special Tax and Electric Utility sectors contributed to performance as these sectors underperformed the Index.
| | | | |
| 4 | | Semi-Annual Report | | | November 30, 2013 |
Performance & Statistics
PIMCO Municipal Income Fund II
November 30, 2013 (unaudited)
| | | | | | | | |
| Total Return(1): | | Market Price | | | NAV | |
Six Month | | | -10.22% | | | | -6.96% | |
1 Year | | | -17.88% | | | | -8.74% | |
5 Year | | | 13.75% | | | | 13.85% | |
10 Year | | | 4.22% | | | | 3.99% | |
Commencement of Operations (6/28/02) to 11/30/13 | | | 3.82% | | | | 4.57% | |
| | |
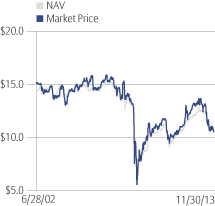
| Market Price/NAV Performance: |
Commencement of Operations (6/28/02) to 11/30/13
| | | | |
| Market Price/NAV: | | | |
Market Price | | | $10.56 | |
NAV | | | $10.92 | |
Discount to NAV | | | -3.30% | |
Market Price Yield(2) | | | 7.39% | |
Leverage Ratio(3) | | | 38.16% | |
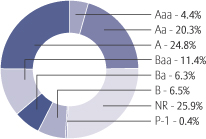
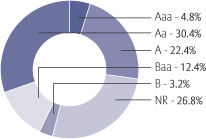
Moody’s Rating
(as a % of total investments)
| | | | | | |
| November 30, 2013 | | | Semi-Annual Report | | | 5 | |
Performance & Statistics
PIMCO California Municipal Income Fund II
November 30, 2013 (unaudited)
| | | | | | | | |
| Total Return(1): | | Market Price | | | NAV | |
Six Month | | | -9.22% | | | | -9.18% | |
1 Year | | | -9.79% | | | | -10.03% | |
5 Year | | | 16.89% | | | | 11.09% | |
10 Year | | | 3.47% | | | | 1.99% | |
Commencement of Operations (6/28/02) to 11/30/13 | | | 3.07% | | | | 2.46% | |
| | |
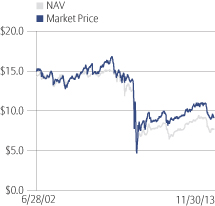
| Market Price/NAV Performance: |
Commencement of Operations (6/28/02) to 11/30/13
| | | | |
| Market Price/NAV: | |
Market Price | | | $9.15 | |
NAV | | | $7.73 | |
Premium to NAV | | | 18.37% | |
Market Price Yield(2) | | | 7.29% | |
Leverage Ratio(3) | | | 45.10% | |
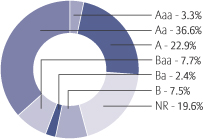
Moody’s Rating
(as a % of total investments)
| | | | |
| 6 | | Semi-Annual Report | | | November 30, 2013 |
Performance & Statistics
PIMCO New York Municipal Income Fund II
November 30, 2013 (unaudited)
| | | | | | | | |
| Total Return(1): | | Market Price | | | NAV | |
Six Month | | | -9.93% | | | | -8.02% | |
1 Year | | | -18.74% | | | | -11.28% | |
5 Year | | | 13.05% | | | | 10.49% | |
10 Year | | | 3.97% | | | | 3.36% | |
Commencement of Operations (6/28/02) to 11/30/13 | | | 3.57% | | | | 3.75% | |
| | | | |
| Market Price/NAV Performance: |
Commencement of Operations (6/28/02) to 11/30/13
| | | | |
| Market Price/NAV: | | | |
Market Price | | | $10.41 | |
NAV | | | $10.01 | |
Premium to NAV | | | 4.00% | |
Market Price Yield(2) | | | 7.64% | |
Leverage Ratio(3) | | | 44.29% | |
Moody’s Rating
(as a % of total investments)
(1) Past performance is no guarantee of future results. Total return is calculated by determining the percentage change in NAV or market price (as applicable) in the specified period. The calculation assumes that all dividends and distributions, if any, have been reinvested. Total return does not reflect broker commissions or sales charges in connection with the purchase or sale of Fund shares. Total return for a period of less than one year is not annualized. Total return for a period of more than one year represents the average annual total return.
Performance at market price will differ from results at NAV. Although market price returns typically reflect investment results over time, during shorter periods returns at market price can also be influenced by factors such as changing views about the Funds, market conditions, supply and demand for each Fund’s shares, or changes in each Fund’s dividends.
An investment in the Funds involves risk, including the loss of principal. Total return, market price, market price yield and NAV will fluctuate with changes in market conditions. This data is provided for information purposes only and is not intended for trading purposes. Closed-end funds, unlike open-end funds, are not continuously offered. There is a one time public offering and once issued, shares of closed-end funds are traded in the open market through a stock exchange. NAV is equal to total assets attributable to common shareholders less total liabilities divided by the number of common shares outstanding. Holdings are subject to change daily.
(2) Market Price Yield is determined by dividing the annualized current monthly dividend per common share (comprised of net investment income) by the market price per common share at November 30, 2013.
(3) Represents Floating Rate Notes issued in tender option bond transactions and Preferred Shares outstanding (collectively “Leverage”), as a percentage of total managed assets. Total managed assets refer to total assets (including assets attributable to Leverage) minus liabilities (other than liabilities representing Leverage).
| | | | | | |
| November 30, 2013 | | | Semi-Annual Report | | | 7 | |
Schedule of Investments
PIMCO Municipal Income Fund II
November 30, 2013 (unaudited)
| | | | | | | | | | |
Principal Amount (000s) | | | | | | | Value | |
| | Municipal Bonds & Notes – 96.4% | | | | | | |
| | | | Alabama – 2.6% | | | | | | |
| | $1,000 | | | Birmingham-Baptist Medical Centers Special Care Facs. Financing Auth. Rev.,
Baptist Health Systems, Inc., 5.00%, 11/15/30, Ser. A | | | | | $947,420 | |
| | | | Jefferson Cnty. Sewer Rev. (e), | | | | | | |
| | 20,000 | | | zero coupon, 10/1/50 (j) | | | | | 9,404,400 | |
| | 16,000 | | | 6.50%, 10/1/53, Ser. D | | | | | 14,868,640 | |
| | 2,000 | | | State Docks Department Rev., 6.00%, 10/1/40 | | | | | 2,205,340 | |
| | | | | | | | | | 27,425,800 | |
| | | | Arizona – 7.9% | | | | | | |
| | | | Health Facs. Auth. Rev., Banner Health, | | | | | | |
| | 3,500 | | | 5.00%, 1/1/35, Ser. A | | | | | 3,535,805 | |
| | 2,860 | | | 5.50%, 1/1/38, Ser. D | | | | | 2,990,187 | |
| | | | Pima Cnty. Industrial Dev. Auth. Rev., | | | | | | |
| | 29,700 | | | 5.00%, 9/1/39 | | | | | 29,821,473 | |
| | 1,500 | | | Tucson Electric Power Co., 5.25%, 10/1/40, Ser. A | | | | | 1,482,855 | |
| | | | Pinal Cnty. Electric Dist. No. 3 Rev., | | | | | | |
| | 1,750 | | | 5.25%, 7/1/36 | | | | | 1,789,410 | |
| | 3,700 | | | 5.25%, 7/1/41 | | | | | 3,750,579 | |
| | 10,000 | | | Salt River Project Agricultural Improvement & Power Dist. Rev., 5.00%, 1/1/39, Ser. A (i) | | | | | 10,412,900 | |
| | | | Salt Verde Financial Corp. Rev., | | | | | | |
| | 9,000 | | | 5.00%, 12/1/32 | | | | | 8,848,350 | |
| | 22,400 | | | 5.00%, 12/1/37 | | | | | 21,759,808 | |
| | | | | | | | | | 84,391,367 | |
| | | | California – 13.8% | | | | | | |
| | | | Bay Area Toll Auth. Rev., | | | | | | |
| | 5,000 | | | 5.25%, 4/1/48, Ser. S-4 | | | | | 5,106,850 | |
| | 6,000 | | | San Francisco Bay Area, 5.00%, 10/1/29 | | | | | 6,362,280 | |
| | 1,430 | | | San Francisco Bay Area, 5.00%, 4/1/34, Ser. F-1 | | | | | 1,489,660 | |
| | 1,565 | | | Foothill-Eastern Transportation Corridor Agcy. Rev., 5.875%, 1/15/26 (IBC-NPFGC) | | | | | 1,571,056 | |
| | 16,035 | | | Golden State Tobacco Securitization Corp. Rev., 5.75%, 6/1/47, Ser. A-1 | | | | | 12,266,775 | |
| | 2,000 | | | Hayward Unified School Dist., GO, 5.00%, 8/1/33 | | | | | 2,035,200 | |
| | | | Health Facs. Financing Auth. Rev., | | | | | | |
| | 1,500 | | | Scripps Health, 5.00%, 11/15/36, Ser. A | | | | | 1,522,290 | |
| | 6,300 | | | Sutter Health, 5.00%, 11/15/42, Ser. A (IBC-NPFGC) | | | | | 6,280,722 | |
| | 3,000 | | | Sutter Health, 6.00%, 8/15/42, Ser. B | | | | | 3,293,820 | |
| | 1,500 | | | Indian Wells Redev. Agcy., Tax Allocation, Whitewater Project,
4.75%, 9/1/34, Ser. A (AMBAC) | | | | | 1,290,210 | |
| | 2,000 | | | Los Angeles Community College Dist., GO, 5.00%, 8/1/32, Ser. A (FGIC-NPFGC) | | | | | 2,101,380 | |
| | 4,000 | | | Los Angeles Department of Water & Power Rev., 5.00%, 7/1/39, Ser. A-1 (AMBAC) | | | | | 4,086,440 | |
| | 5,000 | | | Los Angeles Unified School Dist., GO, 5.00%, 7/1/30, Ser. E (AMBAC) | | | | | 5,190,200 | |
| | 1,750 | | | M-S-R Energy Auth. Rev., 6.50%, 11/1/39, Ser. B | | | | | 2,077,302 | |
| | 2,000 | | | Montebello Unified School Dist., GO, 5.00%, 8/1/33 (AGM) | | | | | 2,088,460 | |
| | 2,985 | | | Municipal Finance Auth. Rev., Azusa Pacific Univ. Project, 7.75%, 4/1/31, Ser. B | | | | | 3,261,053 | |
| | 3,000 | | | Newport Beach Rev., Hoag Memorial Hospital Presbyterian,
5.875%, 12/1/30 (Pre-refunded @ $100, 12/1/21) (c) | | | | | 3,796,380 | |
| | 500 | | | Peralta Community College Dist., GO, 5.00%, 8/1/39, Ser. C | | | | | 502,410 | |
| | 2,000 | | | San Diego Cnty. Water Auth., CP, 5.00%, 5/1/38, Ser. 2008-A (AGM) | | | | | 2,090,720 | |
| | | | |
| 8 | | Semi-Annual Report | | | November 30, 2013 |
Schedule of Investments
PIMCO Municipal Income Fund II
November 30, 2013 (unaudited) (continued)
| | | | | | | | | | |
Principal Amount (000s) | | | | | | | Value | |
| | | | California (continued) | | | | | | |
| | $3,300 | | | San Marcos Unified School Dist., GO, 5.00%, 8/1/38, Ser. A | | | | | $3,373,491 | |
| | 2,000 | | | Santa Clara Cnty. Financing Auth. Rev., El Camino Hospital,
5.75%, 2/1/41, Ser. A (AMBAC) | | | | | 2,106,760 | |
| | | | State, GO, | | | | | | |
| | 2,925 | | | 5.00%, 11/1/32 | | | | | 3,104,741 | |
| | 1,590 | | | 5.00%, 6/1/37 | | | | | 1,629,352 | |
| | 5,200 | | | 5.125%, 8/1/36 | | | | | 5,379,036 | |
| | 2,500 | | | 5.25%, 3/1/38 | | | | | 2,590,050 | |
| | 5,945 | | | 5.25%, 11/1/40 | | | | | 6,185,475 | |
| | 5,750 | | | 5.50%, 3/1/40 | | | | | 6,205,400 | |
| | 9,500 | | | 6.00%, 4/1/38 | | | | | 10,752,575 | |
| | | | Statewide Communities Dev. Auth. Rev., | | | | | | |
| | 2,510 | | | California Baptist Univ., 5.75%, 11/1/17, Ser. B (a)(b)(d)(k)
(acquisition cost-$2,510,000; purchased 6/22/07) | | | | | 2,603,874 | |
| | 710 | | | California Baptist Univ., 6.50%, 11/1/21 | | | | | 773,020 | |
| | 1,000 | | | Cottage Health, 5.00%, 11/1/40 | | | | | 997,020 | |
| | 4,890 | | | Methodist Hospital Project, 6.625%, 8/1/29 (FHA) | | | | | 5,654,405 | |
| | 17,415 | | | Methodist Hospital Project, 6.75%, 2/1/38 (FHA) | | | | | 19,657,704 | |
| | 5,690 | | | Sutter Health, 6.00%, 8/15/42, Ser. A | | | | | 6,247,279 | |
| | 4,725 | | | Torrance Rev., Torrance Memorial Medical Center, 5.00%, 9/1/40, Ser. A | | | | | 4,759,587 | |
| | | | | | | | | | 148,432,977 | |
| | | | Colorado – 1.7% | | | | | | |
| | 5,800 | | | Aurora Rev., Children’s Hospital Assoc., 5.00%, 12/1/40 | | | | | 5,715,436 | |
| | 1,000 | | | Denver Health & Hospital Auth. Rev., 5.625%, 12/1/40 | | | | | 1,001,420 | |
| | | | Health Facs. Auth. Rev., Ser. A, | | | | | | |
| | 1,000 | | | American Baptist Homes, 5.90%, 8/1/37 | | | | | 914,430 | |
| | 2,500 | | | Catholic Health Initiatives, 5.00%, 2/1/41 | | | | | 2,445,325 | |
| | 500 | | | Evangelical Lutheran, 6.125%, 6/1/38 (Pre-refunded @ $100, 6/1/14) (c) | | | | | 514,550 | |
| | 6,045 | | | Sisters of Charity of Leavenworth Health System, 5.00%, 1/1/40 | | | | | 6,126,910 | |
| | 1,430 | | | Public Auth. for Colorado Energy Rev., 6.50%, 11/15/38 | | | | | 1,683,639 | |
| | | | | | | | | | 18,401,710 | |
| | | | Connecticut – 0.2% | | | | | | |
| | 1,250 | | | Harbor Point Infrastructure Improvement Dist., Tax Allocation, 7.875%, 4/1/39, Ser. A | | | | | 1,356,663 | |
| | 1,000 | | | State Health & Educational Fac. Auth. Rev., Hartford Healthcare, 5.00%, 7/1/41, Ser. A | | | | | 989,620 | |
| | | | | | | | | | 2,346,283 | |
| | | | Florida – 5.0% | | | | | | |
| | 1,000 | | | Brevard Cnty. Health Facs. Auth. Rev., Health First, Inc. Project, 7.00%, 4/1/39 | | | | | 1,082,210 | |
| | | | Broward Cnty. Airport System Rev., | | | | | | |
| | 12,100 | | | 5.00%, 10/1/42, Ser. Q-1 | | | | | 12,116,214 | |
| | 600 | | | 5.375%, 10/1/29, Ser. O | | | | | 648,282 | |
| | 8,500 | | | Broward Cnty. Water & Sewer Utility Rev., 5.25%, 10/1/34, Ser. A (i) | | | | | 9,131,295 | |
| | 1,000 | | | Clearwater Water & Sewer Rev., 5.25%, 12/1/39, Ser. A | | | | | 1,039,540 | |
| | 340 | | | Dev. Finance Corp. Rev., Renaissance Charter School, 6.50%, 6/15/21, Ser. A | | | | | 346,463 | |
| | 3,000 | | | Highlands Cnty. Health Facs. Auth. Rev., Adventist Health System,
5.625%, 11/15/37, Ser. B | | | | | 3,217,950 | |
| | 3,000 | | | Leesburg Hospital Rev., Leesburg Regional Medical Center Project, 5.50%, 7/1/32 | | | | | 3,000,210 | |
| | 10,000 | | | Orlando-Orange Cnty. Expressway Auth. Rev., 5.00%, 7/1/40, Ser. A | | | | | 10,077,600 | |
| | | | | | |
| November 30, 2013 | | | Semi-Annual Report | | | 9 | |
Schedule of Investments
PIMCO Municipal Income Fund II
November 30, 2013 (unaudited) (continued)
| | | | | | | | | | |
Principal Amount (000s) | | | | | | | Value | |
| | | | Florida (continued) | | | | | | |
| | $500 | | | Sarasota Cnty. Health Facs. Auth. Rev., 5.75%, 7/1/37 | | | | | $445,690 | |
| | 7,900 | | | State Board of Education, GO, 5.00%, 6/1/38, Ser. D (i) | | | | | 8,218,844 | |
| | 5,000 | | | Sumter Landing Community Dev. Dist. Rev., 4.75%, 10/1/35, Ser. A (NPFGC) | | | | | 4,664,800 | |
| | | | | | | | | | 53,989,098 | |
| | | | Georgia – 0.4% | | | | | | |
| | 1,500 | | | Atlanta Airport Rev., 5.00%, 1/1/40, Ser. A | | | | | 1,521,900 | |
| | 2,775 | | | Medical Center Hospital Auth. Rev., Spring Harbor Green Island Project, 5.25%, 7/1/37 | | | | | 2,481,960 | |
| | | | | | | | | | 4,003,860 | |
| | | | Illinois – 6.3% | | | | | | |
| | 2,500 | | | Chicago,
GO, 5.00%, 1/1/34, Ser. C | | | | | 2,297,125 | |
| | 2,444 | | | Special Assessment, Lake Shore East, 6.625%, 12/1/22 | | | | | 2,471,446 | |
| | 5,439 | | | Special Assessment, Lake Shore East, 6.75%, 12/1/32 | | | | | 5,498,992 | |
| | 1,250 | | | Chicago Motor Fuel Tax Rev., 5.00%, 1/1/38, Ser. A (AGC) | | | | | 1,196,000 | |
| | | | Finance Auth. Rev., | | | | | | |
| | 2,500 | | | Christian Homes, Inc., 5.75%, 5/15/31, Ser. A | | | | | 2,546,750 | |
| | 250 | | | Leafs Hockey Club Project, 6.00%, 3/1/37, Ser. A (b)(f) | | | | | 85,000 | |
| | 700 | | | OSF Healthcare System, 7.125%, 11/15/37, Ser. A | | | | | 794,017 | |
| | 2,000 | | | Provena Health, 6.00%, 5/1/28, Ser. A | | | | | 2,109,520 | |
| | 5,000 | | | Univ. of Chicago, 5.50%, 7/1/37, Ser. B (i) | | | | | 5,390,700 | |
| | 37,000 | | | Sports Facs. Auth. Rev., 5.50%, 6/15/30 (AMBAC) | | | | | 38,427,090 | |
| | | | Village of Hillside, Tax Allocation, Mannheim Redev. Project, | | | | | | |
| | 3,880 | | | 6.55%, 1/1/20 | | | | | 4,065,348 | |
| | 2,900 | | | 7.00%, 1/1/28 | | | | | 2,901,189 | |
| | | | | | | | | | 67,783,177 | |
| | | | Indiana – 0.4% | | | | | | |
| | 1,500 | | | Finance Auth. Rev., Duke Energy Indiana, Inc., 6.00%, 8/1/39, Ser. B | | | | | 1,603,470 | |
| | 990 | | | Vigo Cnty. Hospital Auth. Rev., Union Hospital, Inc.,
5.80%, 9/1/47 (a)(b)(d)(k) (acquisition cost-$960,082; purchased 9/7/07) | | | | | 926,234 | |
| | 1,900 | | | 7.50%, 9/1/22 | | | | | 2,244,432 | |
| | | | | | | | | | 4,774,136 | |
| | | | Iowa – 1.8% | | | | | | |
| | | | Finance Auth. Rev., | | | | | | |
| | 250 | | | Deerfield Retirement Community, Inc., 5.50%, 11/15/27, Ser. A (f) | | | | | 125,403 | |
| | 1,075 | | | Deerfield Retirement Community, Inc., 5.50%, 11/15/37, Ser. A (f) | | | | | 539,070 | |
| | 4,500 | | | Edgewater LLC Project, 6.75%, 11/15/42 | | | | | 4,574,295 | |
| | 5,000 | | | Fertilizer Company Project, 5.25%, 12/1/25 | | | | | 4,492,650 | |
| | 5,000 | | | Fertilizer Company Project, 5.50%, 12/1/22 | | | | | 4,712,200 | |
| | 5,350 | | | Tobacco Settlement Auth. Rev., 5.60%, 6/1/34, Ser. B | | | | | 4,470,085 | |
| | | | | | | | | | 18,913,703 | |
| | | | Kansas – 0.1% | | | | | | |
| | 500 | | | Dev. Finance Auth. Rev., Adventist Health, 5.75%, 11/15/38 | | | | | 537,675 | |
| | 850 | | | Manhattan Rev., Meadowlark Hills Retirement, 5.00%, 5/15/36, Ser. A (b) | | | | | 739,279 | |
| | | | | | | | | | 1,276,954 | |
| | | | Kentucky – 0.1% | | | | | | |
| | 1,000 | | | Economic Dev. Finance Auth. Rev., Owensboro Medical Healthcare Systems, 6.375%, 6/1/40, Ser. A | | | | | 1,048,890 | |
| | | | |
| 10 | | Semi-Annual Report | | | November 30, 2013 |
Schedule of Investments
PIMCO Municipal Income Fund II
November 30, 2013 (unaudited) (continued)
| | | | | | | | | | |
Principal Amount (000s) | | | | | | | Value | |
| | | | Louisiana – 0.7% | | | | | | |
| | | | Local Gov’t Environmental Facs. & Community Dev. Auth Rev., | | | | | | |
| | $450 | | | Westlake Chemical Corp., 6.50%, 11/1/35, Ser. A-2 | | | | | $480,069 | |
| | 750 | | | Woman’s Hospital Foundation, 5.875%, 10/1/40, Ser. A | | | | | 781,770 | |
| | 1,000 | | | Woman’s Hospital Foundation, 6.00%, 10/1/44, Ser. A | | | | | 1,046,550 | |
| | | | Public Facs. Auth. Rev., Ochsner Clinic Foundation Project, | | | | | | |
| | 3,300 | | | 5.50%, 5/15/47, Ser. B | | | | | 3,269,970 | |
| | 2,000 | | | 6.50%, 5/15/37 | | | | | 2,134,620 | |
| | | | | | | | | | 7,712,979 | |
| | | | Maryland – 0.7% | | | | | | |
| | | | Health & Higher Educational Facs. Auth. Rev., | | | | | | |
| | 1,400 | | | Charlestown Community, 6.25%, 1/1/41 | | | | | 1,497,986 | |
| | 2,380 | | | Medstar Health, 5.00%, 8/15/41 | | | | | 2,320,595 | |
| | 4,050 | | | Washington Cnty. Hospital, 6.00%, 1/1/43 | | | | | 4,090,581 | |
| | | | | | | | | | 7,909,162 | |
| | | | Massachusetts – 0.9% | | | | | | |
| | | | Dev. Finance Agcy. Rev., | | | | | | |
| | 4,610 | | | Adventcare Project, 6.75%, 10/15/37, Ser. A | | | | | 4,704,966 | |
| | 570 | | | Adventcare Project, 7.625%, 10/15/37 | | | | | 608,236 | |
| | 1,000 | | | Foxborough Regional Charter School, 7.00%, 7/1/42, Ser. A | | | | | 1,083,550 | |
| | 2,900 | | | State College Building Auth. Rev., 5.50%, 5/1/39, Ser. A | | | | | 3,156,592 | |
| | | | | | | | | | 9,553,344 | |
| | | | Michigan – 0.5% | | | | | | |
| | 1,000 | | | Detroit, GO, 5.25%, 11/1/35 | | | | | 959,740 | |
| | 800 | | | Public Educational Facs. Auth. Rev., Bradford Academy, 6.50%, 9/1/37 (a)(b)(d)(k)
(acquisition cost-$800,000; purchased 9/21/07) | | | | | 456,000 | |
| | 3,000 | | | Royal Oak Hospital Finance Auth. Rev., William Beaumont Hospital, 8.25%, 9/1/39 | | | | | 3,588,390 | |
| | | | | | | | | | 5,004,130 | |
| | | | Minnesota – 0.6% | | | | | | |
| | 1,500 | | | Minneapolis Rev., Providence Project, 5.75%, 10/1/37, Ser. A | | | | | 1,395,285 | |
| | | | North Oaks Rev., Presbyterian Homes North Oaks, | | | | | | |
| | 2,640 | | | 6.00%, 10/1/33 | | | | | 2,686,543 | |
| | 1,530 | | | 6.125%, 10/1/39 | | | | | 1,560,325 | |
| | 400 | | | St. Louis Park Rev., Nicollett Health Services, 5.75%, 7/1/39 | | | | | 420,772 | |
| | | | | | | | | | 6,062,925 | |
| | | | Mississippi – 0.0% | | | | | | |
| | 40 | | | Dev. Bank Special Obligation Rev., Capital Projects and Equipment Acquisition,
5.00%, 7/1/24, Ser. A-2 (AMBAC) | | | | | 38,380 | |
| | | | Missouri – 1.0% | | | | | | |
| | 645 | | | Lee’s Summit, Tax Allocation, Summit Fair Project, 5.625%, 10/1/23 | | | | | 659,964 | |
| | 10,000 | | | State Health & Educational Facs. Auth. Rev., CoxHealth, 5.00%, 11/15/44, Ser. A | | | | | 10,015,300 | |
| | | | | | | | | | 10,675,264 | |
| | | | Nevada – 0.9% | | | | | | |
| | 10,000 | | | Clark Cnty., GO, 4.75%, 11/1/35 (FGIC-NPFGC) (i) | | | | | 10,126,700 | |
| | | | New Hampshire – 0.2% | | | | | | |
| | 2,000 | | | Business Finance Auth. Rev., Elliot Hospital, 6.125%, 10/1/39, Ser. A | | | | | 2,064,420 | |
| | | | New Jersey – 3.9% | | | | | | |
| | 950 | | | Burlington Cnty. Bridge Commission Rev., The Evergreens Project, 5.625%, 1/1/38 | | | | | 829,730 | |
| | | | | | |
| November 30, 2013 | | | Semi-Annual Report | | | 11 | |
Schedule of Investments
PIMCO Municipal Income Fund II
November 30, 2013 (unaudited) (continued)
| | | | | | | | | | |
Principal Amount (000s) | | | | | | | Value | |
| | | | New Jersey (continued) | | | | | | |
| | $4,000 | | | Economic Dev. Auth., Special Assessment, Kapkowski Road Landfill Project,
5.75%, 10/1/21 | | | | | $4,268,760 | |
| | | | Economic Dev. Auth. Rev., | | | | | | |
| | 525 | | | Arbor Glen, 6.00%, 5/15/28, Ser. A | | | | | 453,721 | |
| | 2,000 | | | MSU Student Housing Project, 5.875%, 6/1/42 | | | | | 2,065,780 | |
| | | | Health Care Facs. Financing Auth. Rev., | | | | | | |
| | 1,500 | | | AHS Hospital Corp., 6.00%, 7/1/37 | | | | | 1,667,415 | |
| | 4,000 | | | Robert Wood Johnson Univ. Hospital, 5.50%, 7/1/43 | | | | | 4,172,200 | |
| | 1,500 | | | St. Peters Univ. Hospital, 5.75%, 7/1/37 | | | | | 1,390,650 | |
| | 2,000 | | | State Turnpike Auth. Rev., 5.25%, 1/1/40, Ser. E | | | | | 2,095,020 | |
| | | | Tobacco Settlement Financing Corp. Rev., Ser. 1-A, | | | | | | |
| | 3,300 | | | 4.75%, 6/1/34 | | | | | 2,404,149 | |
| | 31,305 | | | 5.00%, 6/1/41 | | | | | 22,585,931 | |
| | | | | | | | | | 41,933,356 | |
| | | | New Mexico – 0.2% | | | | | | |
| | 2,000 | | | Farmington Pollution Control Rev., 5.90%, 6/1/40, Ser. D | | | | | 2,099,860 | |
| | | | New York – 12.6% | | | | | | |
| | 33,500 | | | Hudson Yards Infrastructure Corp. Rev., 5.25%, 2/15/47, Ser. A | | | | | 34,529,120 | |
| | | | Liberty Dev. Corp. Rev., | | | | | | |
| | 1,000 | | | Bank of America Tower at One Bryant Park Project, 5.125%, 1/15/44 | | | | | 1,024,980 | |
| | 2,500 | | | Bank of America Tower at One Bryant Park Project, 5.625%, 7/15/47 | | | | | 2,647,375 | |
| | 1,250 | | | Bank of America Tower at One Bryant Park Project, 6.375%, 7/15/49 | | | | | 1,342,900 | |
| | 10,000 | | | Goldman Sachs Headquarters, 5.25%, 10/1/35 (i) | | | | | 10,506,600 | |
| | 1,505 | | | Goldman Sachs Headquarters, 5.25%, 10/1/35 | | | | | 1,581,243 | |
| | 3,880 | | | Metropolitan Transportation Auth. Rev., 5.00%, 11/15/36, Ser. D | | | | | 3,958,919 | |
| | 1,100 | | | Nassau Cnty. Industrial Dev. Agcy. Rev., Amsterdam at Harborside, 6.70%, 1/1/43, Ser. A | | | | | 599,335 | |
| | | | New York City Water & Sewer System Rev., | | | | | | |
| | 2,830 | | | 5.00%, 6/15/37, Ser. D (i) | | | | | 2,926,050 | |
| | 4,000 | | | Second Generation Resolutions, 4.75%, 6/15/35, Ser. DD (i) | | | | | 4,053,080 | |
| | 2,000 | | | Second Generation Resolutions, 5.00%, 6/15/39, Ser. GG-1 | | | | | 2,064,260 | |
| | | | New York Liberty Dev. Corp. Rev., | | | | | | |
| | 10,000 | | | 1 World Trade Center Project, 5.00%, 12/15/41 | | | | | 10,245,600 | |
| | 54,000 | | | 4 World Trade Center Project, 5.75%, 11/15/51 | | | | | 57,612,060 | |
| | 1,750 | | | State Dormitory Auth. Rev., The New School, 5.50%, 7/1/40 | | | | | 1,827,333 | |
| | | | | | | | | | 134,918,855 | |
| | | | North Carolina – 0.1% | | | | | | |
| | | | Medical Care Commission Rev., | | | | | | |
| | 550 | | | Salemtowne, 5.10%, 10/1/30 | | | | | 508,387 | |
| | 1,000 | | | Village at Brookwood, 5.25%, 1/1/32 | | | | | 1,033,780 | |
| | | | | | | | | | 1,542,167 | |
| | | | North Dakota – 0.4% | | | | | | |
| | 3,710 | | | Stark Cnty. Healthcare Rev., Benedictine Living Communities, 6.75%, 1/1/33 | | | | | 3,860,886 | |
| | | | Ohio – 4.8% | | | | | | |
| | 33,740 | | | Buckeye Tobacco Settlement Financing Auth. Rev., 6.50%, 6/1/47, Ser. A-2 | | | | | 28,206,640 | |
| | 4,000 | | | Hamilton Cnty. Healthcare Rev., Christ Hospital Project, 5.00%, 6/1/42 | | | | | 3,779,720 | |
| | 3,900 | | | Hamilton Cnty. Sales Tax Rev., 5.00%, 12/1/30, Ser. A | | | | | 4,019,106 | |
| | | | |
| 12 | | Semi-Annual Report | | | November 30, 2013 |
Schedule of Investments
PIMCO Municipal Income Fund II
November 30, 2013 (unaudited) (continued)
| | | | | | | | | | |
Principal Amount (000s) | | | | | | | Value | |
| | | | Ohio (continued) | | | | | | |
| | $1,000 | | | Higher Educational Fac. Commission Rev., Univ. Hospital Health Systems,
6.75%, 1/15/39, Ser. 2009-A (Pre-refunded @ $100, 1/15/15) (c) | | | | | $1,072,250 | |
| | 1,000 | | | Montgomery Cnty. Rev., Miami Valley Hospital, 6.25%, 11/15/39, Ser. A
(Pre-refunded @ $100, 11/15/14) (c) | | | | | 1,057,220 | |
| | 3,000 | | | State Rev., Cleveland Clinic Health System, 5.50%, 1/1/39, Ser. B | | | | | 3,193,410 | |
| | 10,000 | | | State Turnpike Commission Rev., 5.00%, 2/15/48, Ser. A-1 | | | | | 9,999,300 | |
| | | | | | | | | | 51,327,646 | |
| | | | Oregon – 0.2% | | | | | | |
| | 1,000 | | | Clackamas Cnty. Hospital Fac. Auth. Rev., Legacy Health System, 5.50%, 7/15/35, Ser. A | | | | | 1,037,520 | |
| | 1,155 | | | State Department of Administrative Services, CP, 5.25%, 5/1/39, Ser. A | | | | | 1,202,309 | |
| | | | | | | | | | 2,239,829 | |
| | | | Pennsylvania – 5.3% | | | | | | |
| | 9,000 | | | Berks Cnty. Municipal Auth. Rev., Reading Hospital Medical Center, 5.00%, 11/1/44, Ser. A | | | | | 8,860,320 | |
| | | | Cumberland Cnty. Municipal Auth. Rev., Messiah Village Project, Ser. A, | | | | | | |
| | 750 | | | 5.625%, 7/1/28 | | | | | 756,420 | |
| | 670 | | | 6.00%, 7/1/35 | | | | | 679,306 | |
| | 3,250 | | | Harrisburg Auth. Rev., Harrisburg Univ. of Science, 6.00%, 9/1/36, Ser. B (f) | | | | | 1,628,120 | |
| | | | Higher Educational Facs. Auth. Rev., | | | | | | |
| | 850 | | | Edinboro Univ. Foundation, 6.00%, 7/1/43 | | | | | 827,033 | |
| | 400 | | | Thomas Jefferson Univ., 5.00%, 3/1/40 | | | | | 404,028 | |
| | 500 | | | Luzerne Cnty. Industrial Dev. Auth. Rev., Pennsylvania American Water Co.,
5.50%, 12/1/39 | | | | | 524,930 | |
| | 8,500 | | | Montgomery Cnty. Industrial Dev. Auth. Rev., New Regional Medical Center,
5.375%, 8/1/38 (FHA) | | | | | 8,905,875 | |
| | 17,000 | | | Philadelphia, GO, 5.25%, 12/15/32, Ser. A (AGM) | | | | | 17,452,540 | |
| | 6,000 | | | Philadelphia Hospitals & Higher Education Facs. Auth. Rev., Temple Univ. Health System,
5.625%, 7/1/42, Ser. A | | | | | 4,873,320 | |
| | 500 | | | Philadelphia Water & Wastewater Rev., 5.25%, 1/1/36, Ser. A | | | | | 519,355 | |
| | 10,000 | | | Turnpike Commission Rev., 5.00%, 12/1/43, Ser. C | | | | | 10,078,200 | |
| | 1,000 | | | Westmoreland Cnty. Industrial Dev. Auth. Rev., Excela Health Project, 5.125%, 7/1/30 | | | | | 1,003,000 | |
| | | | | | | | | | 56,512,447 | |
| | | | Rhode Island – 5.1% | | | | | | |
| | 56,200 | | | Tobacco Settlement Financing Corp. Rev., 6.25%, 6/1/42, Ser. 2002-A | | | | | 54,671,360 | |
| | | | South Carolina – 1.5% | | | | | | |
| | 1,000 | | | Greenwood Cnty. Rev., Self Regional Healthcare, 5.375%, 10/1/39 | | | | | 1,027,310 | |
| | | | State Public Service Auth. Rev., | | | | | | |
| | 10,000 | | | 5.50%, 12/1/53, Ser. E | | | | | 10,231,400 | |
| | 5,000 | | | Sanatee Cooper, 5.125%, 12/1/43, Ser. B | | | | | 5,068,300 | |
| | | | | | | | | | 16,327,010 | |
| | | | Tennessee – 1.2% | | | | | | |
| | 1,750 | | | Claiborne Cnty. Industrial Dev. Board Rev., Lincoln Memorial Univ. Project,
6.625%, 10/1/39 | | | | | 1,839,705 | |
| | 1,000 | | | Johnson City Health & Educational Facs. Board Rev., Mountain States Health Alliance, 6.00%, 7/1/38, Ser. A | | | | | 1,062,880 | |
| | 500 | | | Sullivan Cnty. Health Educational & Housing Facs. Board Rev., Wellmont Health Systems Project, 5.25%, 9/1/36, Ser. C | | | | | 474,525 | |
| | | | | | |
| November 30, 2013 | | | Semi-Annual Report | | | 13 | |
Schedule of Investments
PIMCO Municipal Income Fund II
November 30, 2013 (unaudited) (continued)
| | | | | | | | | | |
Principal Amount (000s) | | | | | | | Value | |
| | | | Tennessee (continued) | | | | | | |
| | | | Tennessee Energy Acquisition Corp. Rev., Ser. C, | | | | | | |
| | $3,000 | | | 5.00%, 2/1/23 | | | | | $3,169,050 | |
| | 6,000 | | | 5.00%, 2/1/27 | | | | | 6,045,720 | |
| | | | | | | | | | 12,591,880 | |
| | | | Texas – 13.3% | | | | | | |
| | 130 | | | Aubrey Independent School Dist., GO, 5.50%, 2/15/33 (GTD-PSF) | | | | | 131,678 | |
| | 6,500 | | | Brazos Cnty. Health Facs. Dev. Corp. Rev., 5.375%, 1/1/32 | | | | | 6,500,325 | |
| | 2,500 | | | Dallas Rev., Dallas Civic Center, 5.25%, 8/15/38 (AGC) | | | | | 2,600,775 | |
| | 21,000 | | | Grand Parkway Transportation Corp. Rev., 5.00%, 4/1/53, Ser. B | | | | | 20,435,100 | |
| | | | Harris Cnty. Cultural Education Facs. Finance Corp. Rev.,
Texas Children’s Hospital Project, | | | | | | |
| | 3,750 | | | 5.25%, 10/1/29 | | | | | 4,099,125 | |
| | 12,700 | | | 5.50%, 10/1/39 | | | | | 13,517,499 | |
| | 700 | | | HFDC of Central Texas, Inc. Rev., Village at Gleannloch Farms, 5.50%, 2/15/37, Ser. A | | | | | 611,373 | |
| | 5,000 | | | Municipal Gas Acquisition & Supply Corp. III Rev., 5.00%, 12/15/26 | | | | | 5,076,150 | |
| | | | North Harris Cnty. Regional Water Auth. Rev., | | | | | | |
| | 10,300 | | | 5.25%, 12/15/33 | | | | | 10,852,492 | |
| | 10,300 | | | 5.50%, 12/15/38 | | | | | 10,891,838 | |
| | | | North Texas Tollway Auth. Rev., | | | | | | |
| | 5,750 | | | 5.00%, 1/1/38 | | | | | 5,811,238 | |
| | 1,300 | | | 5.50%, 9/1/41, Ser. A | | | | | 1,403,493 | |
| | 5,000 | | | 5.625%, 1/1/33, Ser. B | | | | | 5,254,600 | |
| | 1,200 | | | 5.75%, 1/1/33, Ser. F | | | | | 1,262,076 | |
| | 1,920 | | | Private Activity Bond Surface Transportation Corp. Rev., 7.00%, 6/30/40 | | | | | 2,099,059 | |
| | 250 | | | San Juan Higher Education Finance Auth. Rev., 6.70%, 8/15/40, Ser. A | | | | | 271,250 | |
| | | | State, Mobility Fund, GO (i), | | | | | | |
| | 10,025 | | | 4.75%, 4/1/35, Ser. A | | | | | 10,231,114 | |
| | 17,500 | | | 4.75%, 4/1/36 | | | | | 18,082,575 | |
| | 1,000 | | | State Public Finance Auth. Charter School Finance Corp. Rev., 5.875%, 12/1/36, Ser. A | | | | | 1,021,520 | |
| | 3,000 | | | Tarrant Cnty. Cultural Education Facs. Finance Corp. Rev., Baylor Health Care Systems Project, 6.25%, 11/15/29 | | | | | 3,350,070 | |
| | 15,300 | | | Texas Municipal Gas Acquisition & Supply Corp. I Rev., 6.25%, 12/15/26, Ser. D | | | | | 17,607,240 | |
| | 1,000 | | | Wise Cnty. Rev., Parker Cnty. Junior College Dist., 8.00%, 8/15/34 | | | | | 1,106,790 | |
| | | | | | | | | | 142,217,380 | |
| | | | Virginia – 0.2% | | | | | | |
| | 1,000 | | | Fairfax Cnty. Industrial Dev. Auth. Rev., Inova Health Systems, 5.50%, 5/15/35, Ser. A | | | | | 1,082,400 | |
| | | | James City Cnty. Economic Dev. Auth. Rev., United Methodist Home, Ser. A, | | | | | | |
| | 412 | | | 2.00%, 10/1/48(f) | | | | | 10,900 | |
| | 1,273 | | | 6.00%, 6/1/43 | | | | | 1,043,921 | |
| | | | | | | | | | 2,137,221 | |
| | | | Washington – 1.5% | | | | | | |
| | | | Health Care Facs. Auth. Rev., | | | | | | |
| | 1,300 | | | Multicare Health Systems, 6.00%, 8/15/39, Ser. B (AGC) | | | | | 1,384,175 | |
| | 1,000 | | | Seattle Cancer Care Alliance, 7.375%, 3/1/38 | | | | | 1,182,450 | |
| | 13,000 | | | Virginia Mason Medical Center, 6.125%, 8/15/37, Ser. A | | | | | 13,271,570 | |
| | | | | | | | | | 15,838,195 | |
| | | | West Virginia – 0.2% | | | | | | |
| | 2,000 | | | Hospital Finance Auth. Rev., Highland Hospital, 9.125%, 10/1/41 | | | | | 2,382,840 | |
| | | | |
| 14 | | Semi-Annual Report | | | November 30, 2013 |
Schedule of Investments
PIMCO Municipal Income Fund II
November 30, 2013 (unaudited) (continued)
| | | | | | | | | | |
Principal Amount (000s) | | | | | | | Value | |
| | | | Wisconsin – 0.1% | | | | | | |
| | $1,000 | | | Health & Educational Facs. Auth. Rev., Prohealth Care, Inc., 6.625%, 2/15/39 | | | | | $1,094,030 | |
| | Total Municipal Bonds & Notes (cost-$1,005,083,357) | | | | | 1,033,630,221 | |
| | Variable Rate Notes – 1.4% | | | | | | |
| | | | California – 0.5% | | | | | | |
| | 5,000 | | | Health Facs. Financing Auth. Rev., 9.529%, 11/15/36, Ser. 3193 (a)(b)(d)(g)(h)(k) (acquisition cost-$4,860,300; purchased 6/7/10) | | | | | 5,166,150 | |
| | | | Florida – 0.2% | | | | | | |
| | 1,830 | | | Highlands Cnty. Health Facs. Auth. Rev., Adventist Health System,
5.00%, 11/15/31, Ser. C (h) | | | | | 1,858,420 | |
| | | | Texas – 0.5% | | | | | | |
| | 5,365 | | | State, GO, 9.048%, 4/1/37, Ser. 3197 (a)(b)(d)(g)(h)(k)
(acquisition cost-$5,289,890; purchased 6/23/10) | | | | | 5,616,940 | |
| | | | West Virginia – 0.2% | | | | | | |
| | 2,000 | | | Economic Dev. Auth. Rev., Appalachian Power, 5.375%, 12/1/38, Ser. A (h) | | | | | 2,055,660 | |
| | Total Variable Rate Notes (cost-$13,983,591) | | | | | 14,697,170 | |
| | Corporate Bonds & Notes – 0.1% | | | | | | |
| | | | Commercial Services – 0.1% | | | | | | |
| | 900 | | | ADT Corp., 4.125%, 6/15/23 (cost-$801,163) | | | | | 797,993 | |
| | Short-Term Investments – 2.1% | | | | | | |
| | | | U.S. Treasury Obligations – 1.7% | | | | | | |
| | 2,300 | | | U.S. Treasury Bills, 0.08%-0.12%, 8/21/14-11/13/14 (l) | | | | | 2,297,544 | |
| | | | U.S. Treasury Notes, | | | | | | |
| | 200 | | | 0.125%, 7/31/14 | | | | | 199,992 | |
| | 1,800 | | | 0.25%, 5/31/14 | | | | | 1,801,195 | |
| | 100 | | | 0.25%, 6/30/14 | | | | | 100,074 | |
| | 3,200 | | | 0.50%, 8/15/14 | | | | | 3,208,064 | |
| | 11,100 | | | 2.25%, 5/31/14 | | | | | 11,217,072 | |
| | Total U.S. Treasury Obligations (cost-$18,822,776) | | | | | 18,823,941 | |
| | | | U.S. Government Agency Securities (l) – 0.4% | | | | | | |
| | 3,400 | | | Federal Home Loan Bank Discount Notes, 0.132%, 7/25/14 | | | | | 3,397,115 | |
| | 1,000 | | | Federal Home Loan Bank Discount Notes, 0.134%, 1/8/14 | | | | | 999,864 | |
| | Total U.S. Government Agency Securities (cost-$4,396,979) | | | | | 4,396,979 | |
| | Total Short-Term Investments (cost-$23,219,755) | | | | | 23,220,920 | |
| | Total Investments (cost-$1,043,087,866) – 100.0% | | | | | $1,072,346,304 | |
| | | | | | |
| November 30, 2013 | | | Semi-Annual Report | | | 15 | |
Schedule of Investments
PIMCO Municipal Income Fund II
November 30, 2013 (unaudited) (continued)
Industry classification of portfolio holdings as a percentage of total investments was as follows:
| | | | | | | | |
Revenue Bonds: | | | | | | | | |
Health, Hospital & Nursing Home Revenue | | | 23.8 | % | | | | |
Miscellaneous Revenue | | | 8.4 | | | | | |
Highway Revenue Tolls | | | 7.1 | | | | | |
Industrial Revenue | | | 6.9 | | | | | |
Miscellaneous Taxes | | | 6.8 | | | | | |
Tobacco Settlement Funded | | | 6.5 | | | | | |
Natural Gas Revenue | | | 6.2 | | | | | |
Water Revenue | | | 3.9 | | | | | |
Electric Power & Light Revenue | | | 3.1 | | | | | |
Lease (Appropriation) | | | 2.8 | | | | | |
Port, Airport & Marina Revenue | | | 2.5 | | | | | |
College & University Revenue | | | 2.3 | | | | | |
Sewer Revenue | | | 2.3 | | | | | |
Sales Tax Revenue | | | 0.4 | | | | | |
Transit Revenue | | | 0.4 | | | | | |
Resource Recovery Revenue | | | 0.2 | | | | | |
Fuel Sales Tax Revenue | | | 0.1 | | | | | |
Lease Revenue | | | 0.1 | | | | | |
| | | | | | | | |
Total Revenue Bonds | | | | | | | 83.8 | % |
General Obligation | | | | | | | 11.6 | |
U.S. Treasury Obligations | | | | | | | 1.7 | |
Special Assessment | | | | | | | 1.1 | |
Tax Allocation | | | | | | | 1.0 | |
U.S. Government Agency Securities | | | | | | | 0.4 | |
Certificates of Participation | | | | | | | 0.3 | |
Commercial Services | | | | | | | 0.1 | |
| | | | | | | | |
Total Investments | | | | | | | 100.0 | % |
| | | | | | | | |
Notes to Schedule of Investments:
| (a) | | Private Placement–Restricted as to resale and may not have a readily available market. Securities with an aggregate value of $14,769,198, representing 1.4% of total investments. | |
| (c) | | Pre-refunded bonds are collateralized by U.S. Government or other eligible securities which are held in escrow and used to pay principal and interest and retire the bonds at the earliest refunding date (payment date). | |
| (d) | | 144A–Exempt from registration under Rule 144A of the Securities Act of 1933. These securities may be resold in transactions exempt from registration, typically only to qualified institutional buyers. Unless otherwise indicated, these securities are not considered to be illiquid. | |
| (e) | | When-issued or delayed-delivery. To be settled/delivered after November 30, 2013. | |
| (g) | | Inverse Floater–The interest rate shown bears an inverse relationship to the interest rate on another security or the value of an index. The interest rate disclosed reflects the rate in effect on November 30, 2013. | |
| (h) | | Variable Rate Notes–Instruments whose interest rates change on specified date (such as a coupon date or interest payment date) and/or whose interest rates vary with changes in a designated base rate (such as the prime interest rate). The interest rate disclosed reflects the rate in effect on November 30, 2013. | |
| (i) | | Residual Interest Bonds held in Trust–Securities represent underlying bonds transferred to a separate securitization trust established in a tender option bond transaction in which the Fund acquired the residual interest certificates. These securities serve as collateral in a financing transaction. | |
| | | | |
| 16 | | Semi-Annual Report | | | November 30, 2013 |
Schedule of Investments
PIMCO Municipal Income Fund II
November 30, 2013 (unaudited) (continued)
| (j) | | Step Bond–Coupon is a fixed rate for an initial period then resets at a specific date and rate. | |
| (k) | | Restricted. The aggregate acquisition cost of such securities is $14,420,272. The aggregate value is $14,769,198, representing 1.4% of total investments. | |
| (l) | | Rates reflect the effective yields at purchase date. | |
| (m) | | Floating Rate Notes–The weighted average daily balance of Floating Rate Notes outstanding during the six months ended November 30, 2013 was $44,453,889 at a weighted average interest rate, including fees, of 0.67%. | |
| (n) | | Fair Value Measurements–See Note 1(b) in the Notes to Financial Statements. | |
| | | | | | | | | | | | | | | | |
| | | Level 1 –
Quoted
Prices | | | Level 2 –
Other Significant
Observable
Inputs | | | Level 3 –
Significant
Unobservable
Inputs | | | Value at
11/30/13 | |
Investments in Securities – Assets | | | | | | | | | | | | | | | | |
Municipal Bonds & Notes | | | $– | | | | $1,033,630,221 | | | | $– | | | | $1,033,630,221 | |
Variable Rate Notes | | | – | | | | 14,697,170 | | | | – | | | | 14,697,170 | |
Corporate Bonds & Notes | | | – | | | | 797,993 | | | | – | | | | 797,993 | |
Short-Term Investments | | | – | | | | 23,220,920 | | | | – | | | | 23,220,920 | |
Totals | | | $– | | | | $1,072,346,304 | | | | $– | | | | $1,072,346,304 | |
At November 30, 2013, there were no transfers between Levels 1 and 2.
| (o) | | The following is a summary of the derivative instruments categorized by risk exposure: | |
The effect of derivatives on the Statement of Operations for the six months ended November 30, 2013:
| | | | | | | | | | | | |
| Location | | | | | | | | | | Interest
Rate
Contracts | |
Net realized gain on: | | | | | | | | | | | | |
| Swaps | | | | | | | | | | | $622,762 | |
| | | | | | | | | | | | |
| Net change in unrealized appreciation/depreciation of: | | | | | | | | | | | | |
| Swaps | | | | | | | | | | | $(334,300 | ) |
| | | | | | | | | | | | |
| The average volume (measured at each fiscal quarter-end) of derivative activity during the six months ended November 30, 2013: | | | | | | | | | | | | |
| Interest | | | | | | | | | | | | |
| Rate Swap | | | | | | | | | | | | |
| Agreements(1) | | | | | | | | | | | $45,333 | |
| | | | | | | | | | | | |
| (1) | | Notional Amount (in Thousands). | |
Glossary:
| | | | |
| AGC | | - | | insured by Assured Guaranty Corp. |
| AGM | | - | | insured by Assured Guaranty Municipal Corp. |
| AMBAC | | - | | insured by American Municipal Bond Assurance Corp. |
| CP | | - | | Certificates of Participation |
| FGIC | | - | | insured by Financial Guaranty Insurance Co. |
| FHA | | - | | insured by Federal Housing Administration |
| GO | | - | | General Obligation Bond |
| GTD | | - | | Guaranteed |
| IBC | | - | | Insurance Bond Certificate |
| NPFGC | | - | | insured by National Public Finance Guarantee Corp. |
| PSF | | - | | Public School Fund |
| | | | | | |
| See accompanying Notes to Financial Statements | November 30, 2013 | | | Semi-Annual Report | | | 17 | |
Schedule of Investments
PIMCO California Municipal Income Fund II
November 30, 2013 (unaudited)
| | | | | | | | | | |
Principal
Amount
(000s) | | | | | | | Value | |
| | California Municipal Bonds & Notes – 87.7% | | | | | | |
| | $2,000 | | | Alhambra Rev., Atherton Baptist Homes, 7.625%, 1/1/40, Ser. A | | | | | $2,093,980 | |
| | 20,000 | | | Bay Area Toll Auth. Rev., San Francisco Bay Area, 5.00%, 4/1/39, Ser. F-1 (g) | | | | | 20,577,800 | |
| | | | Chabot-Las Positas Community College Dist., GO, Ser. C, | | | | | | |
| | 17,305 | | | zero coupon, 8/1/36 (AMBAC) | | | | | 4,634,279 | |
| | 5,000 | | | zero coupon, 8/1/37 (AMBAC) | | | | | 1,246,100 | |
| | 15,000 | | | zero coupon, 8/1/43 (AMBAC) | | | | | 2,546,100 | |
| | 1,000 | | | Chula Vista Rev., San Diego Gas & Electric, 5.875%, 2/15/34, Ser. B | | | | | 1,080,880 | |
| | 300 | | | City & Cnty. of San Francisco, Capital Improvement Projects, CP, 5.25%, 4/1/31, Ser. A | | | | | 318,696 | |
| | 8,920 | | | Coronado Community Dev. Agcy., Tax Allocation, 4.875%, 9/1/35 (AMBAC) | | | | | 8,952,558 | |
| | 25,000 | | | Desert Community College Dist., GO, zero coupon, 8/1/46, Ser. C (AGM) | | | | | 3,661,000 | |
| | 8,300 | | | El Dorado Irrigation Dist. & El Dorado Water Agcy., CP, 5.75%, 8/1/39, Ser. A (AGC) | | | | | 8,475,296 | |
| | 1,500 | | | Foothill-Eastern Transportation Corridor Agcy. Rev., 5.875%, 1/15/27 (IBC-NPFGC) | | | | | 1,505,805 | |
| | 1,440 | | | Fremont Community Facs. Dist. No. 1, Special Tax, Pacific Commons, 5.30%, 9/1/30 | | | | | 1,435,133 | |
| | | | Golden State Tobacco Securitization Corp. Rev., | | | | | | |
| | 13,885 | | | 5.00%, 6/1/45 (AMBAC-TCRS) | | | | | 13,169,089 | |
| | 3,500 | | | 5.00%, 6/1/45, Ser. A | | | | | 3,319,540 | |
| | 6,000 | | | 5.00%, 6/1/45, Ser. A (FGIC-TCRS) | | | | | 5,690,640 | |
| | 8,500 | | | 5.125%, 6/1/47, Ser. A-1 | | | | | 5,891,265 | |
| | 31,415 | | | 5.75%, 6/1/47, Ser. A-1 | | | | | 24,032,475 | |
| | | | Health Facs. Financing Auth. Rev., | | | | | | |
| | 250 | | | Adventist Health System, 5.75%, 9/1/39, Ser. A | | | | | 268,252 | |
| | 3,000 | | | Catholic Healthcare West, 6.00%, 7/1/39, Ser. A | | | | | 3,237,990 | |
| | 1,000 | | | Children’s Hospital of Los Angeles, 5.00%, 11/15/34, Ser. A | | | | | 954,980 | |
| | 500 | | | Children’s Hospital of Orange Cnty., 6.50%, 11/1/38, Ser. A | | | | | 557,660 | |
| | 4,000 | | | Scripps Health, 5.00%, 11/15/40, Ser. A | | | | | 4,023,360 | |
| | 3,700 | | | Stanford Hospital, 5.25%, 11/15/40, Ser. A-2 | | | | | 3,848,481 | |
| | 8,755 | | | Stanford Hospital Clinics, 5.00%, 8/15/51, Ser. A | | | | | 8,651,779 | |
| | 1,000 | | | Sutter Health, 5.00%, 8/15/35, Ser. D | | | | | 1,017,180 | |
| | 4,220 | | | Sutter Health, 5.00%, 11/15/42, Ser. A (IBC-NPFGC) | | | | | 4,207,087 | |
| | 12,195 | | | Sutter Health, 5.25%, 11/15/46, Ser. A (g) | | | | | 12,217,683 | |
| | 4,500 | | | Imperial Irrigation Dist. Rev., 5.00%, 11/1/41, Ser. B | | | | | 4,520,655 | |
| | | | Infrastructure & Economic Dev. Bank Rev., | | | | | | |
| | 175 | | | 5.25%, 2/1/38 | | | | | 177,070 | |
| | 10,000 | | | Independent System Operator Corp., 5.00%, 2/1/39 | | | | | 10,146,200 | |
| | 515 | | | Irvine Unified School Dist., Special Tax, 6.70%, 9/1/35 | | | | | 550,859 | |
| | 1,000 | | | Lancaster Redev. Agcy., Tax Allocation, 6.875%, 8/1/39 | | | | | 1,080,090 | |
| | 500 | | | Long Beach Airport Rev., 5.00%, 6/1/40, Ser. A | | | | | 500,270 | |
| | 7,500 | | | Long Beach Bond Finance Auth. Rev., Long Beach Natural Gas, 5.50%, 11/15/37, Ser. A | | | | | 7,869,225 | |
| | 10,000 | | | Long Beach Unified School Dist., GO, 5.25%, 8/1/33, Ser. A (g) | | | | | 10,869,400 | |
| | | | Los Angeles Department of Water & Power Rev., | | | | | | |
| | 15,000 | | | 4.75%, 7/1/30, Ser. A-2 (AGM) (g) | | | | | 15,409,950 | |
| | 3,000 | | | 5.00%, 7/1/36, Ser. B | | | | | 3,171,240 | |
| | 11,000 | | | Los Angeles Unified School Dist., GO, 5.00%, 1/1/34, Ser. I | | | | | 11,527,670 | |
| | 3,200 | | | M-S-R Energy Auth. Rev., 6.50%, 11/1/39, Ser. B | | | | | 3,798,496 | |
| | 10,000 | | | Manteca Redev. Agcy., Tax Allocation, 5.00%, 10/1/36 (AMBAC) | | | | | 9,064,300 | |
| | 5,000 | | | Metropolitan Water Dist. of Southern California Rev., 5.00%, 7/1/37, Ser. A (g) | | | | | 5,251,550 | |
| | 1,175 | | | Municipal Finance Auth. Rev., Azusa Pacific Univ. Project, 7.75%, 4/1/31, Ser. B | | | | | 1,283,664 | |
| | 5,000 | | | Oakland Unified School Dist., Alameda Cnty., GO, 6.125%, 8/1/29, Ser. A | | | | | 5,226,300 | |
| | | | |
| 18 | | Semi-Annual Report | | | November 30, 2013 |
Schedule of Investments
PIMCO California Municipal Income Fund II
November 30, 2013 (unaudited) (continued)
| | | | | | | | | | |
Principal
Amount
(000s) | | | | | | | Value | |
| | $4,750 | | | Palomar Pomerado Health, CP, 6.75%, 11/1/39 | | | | | $4,889,032 | |
| | 10,000 | | | Placentia-Yorba Linda Unified School Dist., CP, 5.00%, 10/1/32 (NPFGC) | | | | | 10,133,300 | |
| | 1,500 | | | Pollution Control Financing Auth. Rev., American Water Capital Corp. Project, 5.25%, 8/1/40 (a)(b)(d)(h)
(acquisition cost-$1,500,000; purchased 8/11/10) | | | | | 1,472,445 | |
| | | | Poway Unified School Dist., GO, | | | | | | |
| | 11,000 | | | zero coupon, 8/1/40 | | | | | 2,477,860 | |
| | 16,000 | | | zero coupon, 8/1/46 | | | | | 2,480,640 | |
| | 2,000 | | | Roseville Redev. Agcy., Tax Allocation, 5.00%, 9/1/32, Ser. B (NPFGC) | | | | | 1,936,480 | |
| | 1,375 | | | Ross Valley School Dist., GO, 5.00%, 8/1/42, Ser. B | | | | | 1,424,761 | |
| | 1,000 | | | San Diego Public Facs. Financing Auth. Sewer Rev., 5.25%, 5/15/39, Ser. A | | | | | 1,036,340 | |
| | 4,000 | | | San Diego Public Facs. Financing Auth. Water Rev., 5.25%, 8/1/38, Ser. A | | | | | 4,261,120 | |
| | 2,800 | | | San Diego Regional Building Auth. Rev., Cnty. Operations Center & Annex, 5.375%, 2/1/36, Ser. A | | | | | 3,003,308 | |
| | 2,800 | | | San Diego Unified School Dist., GO, 4.75%, 7/1/27, Ser. D-2 (AGM) | | | | | 2,894,472 | |
| | 1,000 | | | San Jose Hotel Tax Rev., Convention Center Expansion, 6.50%, 5/1/36 | | | | | 1,116,100 | |
| | 1,300 | | | San Marcos Unified School Dist., GO, 5.00%, 8/1/38, Ser. A | | | | | 1,328,951 | |
| | 1,260 | | | Santa Cruz Cnty., CP, 5.25%, 8/1/32 | | | | | 1,268,921 | |
| | 1,500 | | | Santa Cruz Cnty. Redev. Agcy., Tax Allocation, Live Oak/Soquel Community, 7.00%, 9/1/36, Ser. A | | | | | 1,699,905 | |
| | | | State, GO, | | | | | | |
| | 2,500 | | | 5.00%, 9/1/31 | | | | | 2,635,950 | |
| | 7,000 | | | 5.00%, 11/1/43 | | | | | 7,120,120 | |
| | 10,000 | | | 6.00%, 4/1/38 | | | | | 11,318,500 | |
| | | | State Public Works Board Rev., | | | | | | |
| | 3,000 | | | 5.75%, 10/1/30, Ser. G-1 | | | | | 3,312,840 | |
| | 2,000 | | | California State Univ., 6.00%, 11/1/34, Ser. J | | | | | 2,233,060 | |
| | 2,000 | | | Judicial Council Projects, 5.00%, 12/1/29, Ser. D | | | | | 2,092,460 | |
| | 2,500 | | | Judicial Council Projects, 5.00%, 3/1/38, Ser. A (b) | | | | | 2,499,800 | |
| | 7,915 | | | Regents Univ., 5.00%, 3/1/33, Ser. A (Pre-refunded @ $100, 3/1/18) (c) | | | | | 9,266,090 | |
| | | | Statewide Communities Dev. Auth. Rev., | | | | | | |
| | 3,760 | | | Bentley School, 7.00%, 7/1/40, Ser. A | | | | | 4,018,726 | |
| | 1,520 | | | Catholic Healthcare West, 5.50%, 7/1/31, Ser. D | | | | | 1,614,970 | |
| | 1,520 | | | Catholic Healthcare West, 5.50%, 7/1/31, Ser. E | | | | | 1,614,970 | |
| | 250 | | | Huntington Park Charter School Project, 5.15%, 7/1/30, Ser. A (b) | | | | | 207,610 | |
| | 1,250 | | | Huntington Park Charter School Project, 5.25%, 7/1/42, Ser. A (b) | | | | | 983,737 | |
| | 500 | | | International School of the Peninsula Project, 5.00%, 11/1/29 | | | | | 471,165 | |
| | 6,705 | | | Kaiser Permanente, 5.00%, 4/1/42, Ser. A | | | | | 6,674,358 | |
| | 1,000 | | | Lancer Student Housing Project, 7.50%, 6/1/42 | | | | | 1,067,370 | |
| | 9,700 | | | Los Angeles Jewish Home, 5.50%, 11/15/33 (CA Mtg. Ins.) | | | | | 9,717,654 | |
| | 2,135 | | | Methodist Hospital Project, 6.625%, 8/1/29 (FHA) | | | | | 2,468,743 | |
| | 7,860 | | | Methodist Hospital Project, 6.75%, 2/1/38 (FHA) | | | | | 8,872,211 | |
| | 3,700 | | | St. Joseph Health System, 5.75%, 7/1/47, Ser. A (FGIC) | | | | | 3,923,665 | |
| | 5,490 | | | Sutter Health, 5.25%, 11/15/48, Ser. B | | | | | 5,500,596 | |
| | 5,600 | | | Sutter Health, 6.00%, 8/15/42, Ser. A | | | | | 6,148,464 | |
| | 4,500 | | | Univ. of California Irvine E. Campus, 5.375%, 5/15/38 | | | | | 4,496,805 | |
| | 1,800 | | | Tobacco Securitization Agcy. Rev., Stanislaus Cnty., 5.875%, 6/1/43, Ser. A | | | | | 1,675,368 | |
| | 3,100 | | | Torrance Rev., Torrance Memorial Medical Center, 5.00%, 9/1/40, Ser. A | | | | | 3,122,692 | |
| | 3,000 | | | Township Health Care Dist, GO, 5.00%, 8/1/43, Ser. B | | | | | 2,972,310 | |
| | | | | | |
| November 30, 2013 | | | Semi-Annual Report | | | 19 | |
Schedule of Investments
PIMCO California Municipal Income Fund II
November 30, 2013 (unaudited) (continued)
| | | | | | | | | | |
Principal
Amount
(000s) | | | | | | | Value | |
| | $1,000 | | | Tustin Unified School Dist., Special Tax, 6.00%, 9/1/40, Ser. 2006-1 | | | | | $1,033,430 | |
| | Total California Municipal Bonds & Notes (cost-$362,401,298) | | | | | 386,549,326 | |
| | California Variable Rate Notes (a)(b)(d)(e)(f)(h) – 5.6% | | | | |
| | 6,035 | | | Desert Community College Dist., GO, 9.509%, 8/1/32, Ser. 3016-1 (AGC)
(acquisition cost-$5,860,407; purchased 4/17/09) | | | | | 6,541,578 | |
| | 7,500 | | | JPMorgan Chase Putters/Drivers Trust Rev., 9.543%, 5/15/34, Ser. 3838
(acquisition cost-$7,385,250; purchased 11/10/10) | | | | | 7,767,600 | |
| | 4,000 | | | Los Angeles Community College Dist., GO, 14.058%, 8/1/33, Ser. 3096
(acquisition cost-$3,986,400; purchased 8/27/09) | | | | | 4,610,440 | |
| | 5,000 | | | San Diego Community College Dist., GO, 10.044%, 2/1/17
(acquisition cost-$5,117,400; purchased 5/1/09) | | | | | 5,949,600 | |
| | Total California Variable Rate Notes (cost-$22,307,724) | | | | | 24,869,218 | |
| | Other Municipal Bonds & Notes – 5.5% | | | | | | |
| | | | Arizona – 1.8% | | | | | | |
| | 8,000 | | | Salt Verde Financial Corp. Rev., 5.00%, 12/1/37 | | | | | 7,771,360 | |
| | | | New Jersey – 0.7% | | | | | | |
| | | | Tobacco Settlement Financing Corp. Rev., Ser. 1-A, | | | | | | |
| | 1,300 | | | 4.75%, 6/1/34 | | | | | 947,089 | |
| | 3,000 | | | 5.00%, 6/1/41 | | | | | 2,164,440 | |
| | | | | | | | | | 3,111,529 | |
| | | | New York – 0.6% | | | | | | |
| | 1,250 | | | Liberty Dev. Corp. Rev., Goldman Sachs Headquarters, 5.25%, 10/1/35 | | | | | 1,313,325 | |
| | 1,900 | | | TSASC, Inc. Rev., 5.00%, 6/1/34, Ser. 1 | | | | | 1,477,649 | |
| | | | | | | | | | 2,790,974 | |
| | | | Rhode Island – 2.4% | | | | | | |
| | 11,000 | | | Tobacco Settlement Financing Corp. Rev., 6.25%, 6/1/42, Ser. 2002-A | | | | | 10,700,800 | |
| | Total Other Municipal Bonds & Notes (cost-$22,851,211) | | | | | 24,374,663 | |
| | Short-Term Investments – 1.2% | | | | | | |
| | | | U.S. Treasury Obligations – 1.2% | | | | | | |
| | | | U.S. Treasury Notes, | | | | | | |
| | 300 | | | 0.25%, 5/31/14 | | | | | 300,199 | |
| | 4,700 | | | 0.50%, 8/15/14 | | | | | 4,711,844 | |
| | 100 | | | 0.50%, 10/15/14 | | | | | 100,309 | |
| | Total U.S. Treasury Obligations (cost-$5,112,746) | | | | | 5,112,352 | |
| | Total Investments (cost-$412,672,979) – 100.0% | | | | | $440,905,559 | |
| | | | |
| 20 | | Semi-Annual Report | | | November 30, 2013 |
Schedule of Investments
PIMCO California Municipal Income Fund II
November 30, 2013 (unaudited) (continued)
Industry classification of portfolio holdings as a percentage of total investments was as follows:
| | | | | | | | |
Revenue Bonds: | | | | | | | | |
Health, Hospital & Nursing Home Revenue | | | 20.6 | % | | | | |
Tobacco Settlement Funded | | | 13.2 | | | | | |
Electric Power & Light Revenue | | | 6.8 | | | | | |
Highway Revenue Tolls | | | 5.0 | | | | | |
Natural Gas Revenue | | | 4.7 | | | | | |
Water Revenue | | | 3.2 | | | | | |
Lease (Abatement) | | | 3.0 | | | | | |
Miscellaneous Revenue | | | 2.7 | | | | | |
College & University Revenue | | | 2.6 | | | | | |
Port, Airport & Marina Revenue | | | 1.9 | | | | | |
Local or Guaranteed Housing | | | 1.0 | | | | | |
Private Schools | | | 1.0 | | | | | |
Lease Revenue | | | 0.3 | | | | | |
Hotel Occupancy Tax | | | 0.3 | | | | | |
Sewer Revenue | | | 0.2 | | | | | |
| | | | | | | | |
Total Revenue Bonds | | | | | | | 66.5 | % |
General Obligation | | | | | | | 20.7 | |
Certificates of Participation | | | | | | | 5.7 | |
Tax Allocation | | | | | | | 5.2 | |
U.S. Treasury Obligations | | | | | | | 1.2 | |
Special Tax | | | | | | | 0.7 | |
| | | | | | | | |
Total Investments | | | | | | | 100.0 | % |
| | | | | | | | |
Notes to Schedule of Investments:
| (a) | | Private Placement–Restricted as to resale and may not have a readily available market. Securities with an aggregate value of $26,341,663, representing 6.0% of total investments. | |
| (c) | | Pre-refunded bonds are collateralized by U.S. Government or other eligible securities which are held in escrow and used to pay principal and interest and retire the bonds at the earliest refunding date (payment date). | |
| (d) | | 144A–Exempt from registration under Rule 144A of the Securities Act of 1933. These securities may be resold in transactions exempt from registration, typically only to qualified institutional buyers. Unless otherwise indicated, these securities are not considered to be illiquid. | |
| (e) | | Inverse Floater–The interest rate shown bears an inverse relationship to the interest rate on another security or the value of an index. The interest rate disclosed reflects the rate in effect on November 30, 2013. | |
| (f) | | Variable Rate Notes–Instruments whose interest rates change on specified date (such as a coupon date or interest payment date) and/or whose interest rates vary with changes in a designated base rate (such as the prime interest rate). The interest rate disclosed reflects the rate in effect on November 30, 2013. | |
| (g) | | Residual Interest Bonds held in Trust–Securities represent underlying bonds transferred to a separate securitization trust established in a tender option bond transaction in which the Fund acquired the residual interest certificates. These securities serve as collateral in a financing transaction. | |
| (h) | | Restricted. The aggregate acquisition cost of such securities is $23,849,457. The aggregate value is $26,341,663, representing 6.0% of total investments. | |
| (i) | | Floating Rate Notes–The weighted average daily balance of Floating Rate Notes outstanding during the six months ended November 30, 2013 was $38,098,801 at a weighted average interest rate, including fees, of 0.53%. | |
| | | | | | |
| November 30, 2013 | | | Semi-Annual Report | | | 21 | |
Schedule of Investments
PIMCO California Municipal Income Fund II
November 30, 2013 (unaudited) (continued)
| (j) | | Fair Value Measurements-See Note 1(b) in the Notes to Financial Statements. | |
| | | | | | | | | | | | | | | | |
| | | Level 1 –
Quoted
Prices | | | Level 2 –
Other Significant
Observable
Inputs | | | Level 3 –
Significant
Unobservable
Inputs | | | Value at
11/30/13 | |
Investments in Securities – Assets | | | | | | | | | | | | | | | | |
California Municipal Bonds & Notes | | | $– | | | | $386,549,326 | | | | $– | | | | $386,549,326 | |
California Variable Rate Notes | | | – | | | | 24,869,218 | | | | – | | | | 24,869,218 | |
Other Municipal Bonds & Notes | | | – | | | | 24,374,663 | | | | – | | | | 24,374,663 | |
Short-Term Investments | | | – | | | | 5,112,352 | | | | – | | | | 5,112,352 | |
Totals | | | $– | | | | $440,905,559 | | | | $– | | | | $440,905,559 | |
At November 30, 2013, there were no transfers between Levels 1 and 2.
| (k) | | The following is a summary of the derivative instruments categorized by risk exposure: | |
The effect of derivatives on the Statement of Operations for the six months ended November 30, 2013:
| | | | | | | | | | |
| Location | | | | | | | | Interest
Rate
Contracts | |
| Net realized gain on: | | | | | | | | | | |
| Swaps | | | | | | | | | $205,965 | |
| | | | | | | | | | |
| Net change in unrealized appreciation/depreciation of: | | | | | | | | | | |
| Swaps | | | | | | | | | $(119,661 | ) |
| | | | | | | | | | |
| The average volume (measured at each fiscal quarter-end) of derivative activity during the six months ended November 30, 2013: | | | | | | | | | | |
| Interest | | | | | | | | | | |
| Rate Swap | | | | | | | | | | |
| Agreements(1) | | | | | | | | | $17,667 | |
| | | | | | | | | | |
| (1) | | Notional Amount (in Thousands) | |
Glossary:
| | | | |
| AGC | | - | | insured by Assured Guaranty Corp. |
| AGM | | - | | insured by Assured Guaranty Municipal Corp. |
| AMBAC | | - | | insured by American Municipal Bond Assurance Corp. |
| CA Mtg. Ins. | | - | | insured by California Mortgage Insurance |
| CP | | - | | Certificates of Participation |
| FGIC | | - | | insured by Financial Guaranty Insurance Co. |
| FHA | | - | | insured by Federal Housing Administration |
| GO | | - | | General Obligation Bond |
| IBC | | - | | Insurance Bond Certificate |
| NPFGC | | - | | insured by National Public Finance Guarantee Corp. |
| TCRS | | - | | Temporary Custodian Receipts |
| | | | |
| 22 | | Semi-Annual Report | | | November 30, 2013 | See accompanying Notes to Financial Statements |
Schedule of Investments
PIMCO New York Municipal Income Fund II
November 30, 2013 (unaudited)
| | | | | | | | | | |
Principal
Amount
(000s) | | | | | | | Value | |
| | New York Municipal Bonds & Notes – 90.3% | | | | | | |
| | $1,000 | | | Chautauqua Cnty. Industrial Dev. Agcy. Rev., Dunkirk Power Project, 5.875%, 4/1/42 | | | | | $1,017,190 | |
| | 150 | | | Erie Cnty. Industrial Dev. Agcy. Rev., Orchard Park, Inc. Project, 6.00%, 11/15/36, Ser. A | | | | | 130,832 | |
| | 9,000 | | | Hudson Yards Infrastructure Corp. Rev., 5.75%, 2/15/47, Ser. A | | | | | 9,604,620 | |
| | | | Liberty Dev. Corp. Rev., | | | | | | |
| | 1,400 | | | Bank of America Tower at One Bryant Park Project, 5.625%, 7/15/47 | | | | | 1,482,530 | |
| | 1,300 | | | Bank of America Tower at One Bryant Park Project, 6.375%, 7/15/49 | | | | | 1,396,616 | |
| | 2,230 | | | Goldman Sachs Headquarters, 5.25%, 10/1/35 | | | | | 2,342,972 | |
| | 4,120 | | | Goldman Sachs Headquarters, 5.25%, 10/1/35 (g) | | | | | 4,328,719 | |
| | 3,500 | | | Goldman Sachs Headquarters, 5.50%, 10/1/37 | | | | | 3,757,075 | |
| | 500 | | | Long Island Power Auth. Rev., 5.00%, 9/1/34, Ser. A (AMBAC) | | | | | 501,115 | |
| | | | Metropolitan Transportation Auth. Rev., | | | | | | |
| | 2,000 | | | 5.00%, 11/15/30, Ser. D | | | | | 2,095,460 | |
| | 2,000 | | | 5.00%, 11/15/34, Ser. B | | | | | 2,085,520 | |
| | 3,000 | | | 5.00%, 11/15/43, Ser. B | | | | | 3,022,380 | |
| | 5,000 | | | 5.50%, 11/15/39, Ser. A | | | | | 5,246,550 | |
| | | | Monroe Cnty. Industrial Dev. Corp. Rev., | | | | | | |
| | 3,500 | | | Unity Hospital Rochester Project, 5.50%, 8/15/40 (FHA) | | | | | 3,645,180 | |
| | 1,750 | | | University of Rochester, 5.00%, 7/1/43, Ser. A | | | | | 1,810,515 | |
| | 2,400 | | | Nassau Cnty. Industrial Dev. Agcy. Rev., Amsterdam at Harborside, 6.70%, 1/1/43, Ser. A | | | | | 1,307,640 | |
| | 2,000 | | | New York City, GO, 5.00%, 8/1/31, Ser. D1 | | | | | 2,143,900 | |
| | 1,500 | | | New York City Health & Hospital Corp. Rev., 5.00%, 2/15/30, Ser. A | | | | | 1,563,120 | |
| | | | New York City Industrial Dev. Agcy. Rev., | | | | | | |
| | 1,415 | | | Liberty Interactive Corp., 5.00%, 9/1/35 | | | | | 1,400,086 | |
| | 1,500 | | | Pilot Queens Baseball Stadium, 6.50%, 1/1/46 (AGC) | | | | | 1,621,995 | |
| | 1,500 | | | United Jewish Appeal Federation Project, 5.00%, 7/1/27, Ser. A | | | | | 1,531,680 | |
| | 750 | | | Yankee Stadium, 5.00%, 3/1/31 (FGIC) | | | | | 756,630 | |
| | 1,900 | | | Yankee Stadium, 5.00%, 3/1/36 (NPFGC) | | | | | 1,909,025 | |
| | 4,900 | | | Yankee Stadium, 7.00%, 3/1/49 (AGC) | | | | | 5,613,440 | |
| | | | New York City Transitional Finance Auth. Rev., | | | | | | |
| | 10 | | | 5.00%, 11/1/27, Ser. B | | | | | 10,030 | |
| | 4,850 | | | 5.00%, 5/1/39, Ser. F-1 | | | | | 5,055,931 | |
| | 5,000 | | | 5.25%, 1/15/39, Ser. S-3 | | | | | 5,324,300 | |
| | | | New York City Water & Sewer System Rev., | | | | | | |
| | 1,000 | | | 5.25%, 6/15/40, Ser. EE | | | | | 1,058,410 | |
| | 500 | | | Second Generation Resolutions, 5.00%, 6/15/39, Ser. GG-1 | | | | | 516,065 | |
| | | | New York Liberty Dev. Corp. Rev., | | | | | | |
| | 3,000 | | | 1 World Trade Center Project, 5.00%, 12/15/41 | | | | | 3,073,680 | |
| | 10,000 | | | 4 World Trade Center Project, 5.75%, 11/15/51 | | | | | 10,668,900 | |
| | 1,000 | | | Onondaga Cnty. Rev., Syracuse Univ. Project, 5.00%, 12/1/36 | | | | | 1,037,330 | |
| | 1,400 | | | Port Auth. of New York & New Jersey Rev., JFK International Air Terminal, 6.00%, 12/1/36 | | | | | 1,513,442 | |
| | | | State Dormitory Auth. Rev., | | | | | | |
| | 3,000 | | | 5.00%, 3/15/38, Ser. A | | | | | 3,204,630 | |
| | 2,500 | | | 5.00%, 2/15/40, Ser. D | | | | | 2,591,675 | |
| | 4,000 | | | 5.00%, 7/1/42, Ser. A | | | | | 4,129,360 | |
| | 7,490 | | | 5.50%, 5/15/31, Ser. A (AMBAC) | | | | | 8,446,847 | |
| | 2,600 | | | Catholic Health of Long Island, 5.10%, 7/1/34 | | | | | 2,567,292 | |
| | 1,500 | | | Fordham Univ., 5.50%, 7/1/36, Ser. A | | | | | 1,591,380 | |
| | | | | | |
| November 30, 2013 | | | Semi-Annual Report | | | 23 | |
Schedule of Investments
PIMCO New York Municipal Income Fund II
November 30, 2013 (unaudited) (continued)
| | | | | | | | | | |
Principal
Amount
(000s) | | | | | | | Value | |
| | $2,750 | | | Memorial Sloan-Kettering Cancer Center, 5.00%, 7/1/35, Ser. 1 | | | | | $2,782,973 | |
| | 2,000 | | | Memorial Sloan-Kettering Cancer Center, 5.00%, 7/1/36, Ser. A-1 | | | | | 2,041,700 | |
| | 2,000 | | | Mount Sinai Hospital, 5.00%, 7/1/31, Ser. A | | | | | 2,067,420 | |
| | 2,100 | | | New York Univ., 5.00%, 7/1/38, Ser. A | | | | | 2,185,155 | |
| | 1,000 | | | New York Univ. Hospital Center, 5.625%, 7/1/37, Ser. B | | | | | 1,054,280 | |
| | 600 | | | North Shore-Long Island Jewish Health System, 5.50%, 5/1/37, Ser. A | | | | | 629,082 | |
| | 5,000 | | | Rochester General Hospital, 5.00%, 12/1/35 (Radian)
(Pre-refunded @ $100, 12/1/15) (c) | | | | | 5,444,300 | |
| | 3,000 | | | Teachers College, 5.50%, 3/1/39 | | | | | 3,086,280 | |
| | 1,000 | | | The New School, 5.50%, 7/1/40 | | | | | 1,044,190 | |
| | 3,000 | | | Yeshiva Univ., 5.125%, 7/1/34 (AMBAC) | | | | | 3,015,660 | |
| | 5,000 | | | State Environmental Facs. Corp. Rev., 5.125%, 6/15/38, Ser. A | | | | | 5,348,200 | |
| | | | State Thruway Auth. Rev., | | | | | | |
| | 1,000 | | | 4.75%, 1/1/29, Ser. G (AGM) | | | | | 1,024,530 | |
| | 3,800 | | | 5.00%, 1/1/42, Ser. I | | | | | 3,878,280 | |
| | 6,000 | | | State Urban Dev. Corp. Rev., 5.00%, 3/15/36, Ser. B-1 (g) | | | | | 6,388,500 | |
| | 5,000 | | | Triborough Bridge & Tunnel Auth. Rev., 5.25%, 11/15/34, Ser. A-2 (g) | | | | | 5,271,000 | |
| | 3,435 | | | Troy Capital Res. Corp. Rev., Rensselaer Polytechnic Institute Project, 5.125%, 9/1/40, Ser. A | | | | | 3,496,418 | |
| | | | TSASC, Inc. Rev., Ser. 1, | | | | | | |
| | 5,000 | | | 5.00%, 6/1/26 | | | | | 4,419,900 | |
| | 5,000 | | | 5.00%, 6/1/34 | | | | | 3,888,550 | |
| | 1,000 | | | 5.125%, 6/1/42 | | | | | 742,570 | |
| | 1,815 | | | Ulster Cnty. Industrial Dev. Agcy. Rev., 6.00%, 9/15/37, Ser. A (b) | | | | | 1,399,038 | |
| | 2,000 | | | Warren & Washington Cntys. Industrial Dev. Agcy. Rev., Glens Falls Hospital Project, 5.00%, 12/1/35, Ser. A (AGM) | | | | | 2,000,580 | |
| | 1,490 | | | Westchester Cnty. Healthcare Corp. Rev., 6.125%, 11/1/37, Ser. C-2 | | | | | 1,625,858 | |
| | 1,000 | | | Yonkers Economic Dev. Corp. Rev., Charter School of Educational Excellence Project, 6.00%, 10/15/30, Ser. A | | | | | 1,002,140 | |
| | 600 | | | Yonkers Industrial Dev. Agcy. Rev., Sarah Lawrence College Project, 6.00%, 6/1/41, Ser. A | | | | | 637,368 | |
| | Total New York Municipal Bonds & Notes (cost-$172,805,496) | | | | | 175,578,034 | |
| | Other Municipal Bonds & Notes – 4.8% | | | | | | |
| | | | Florida – 0.5% | | | | | | |
| | 1,000 | | | Clearwater Water & Sewer Rev., 5.25%, 12/1/39, Ser. A | | | | | 1,039,540 | |
| | | | Louisiana – 0.6% | | | | | | |
| | 1,000 | | | East Baton Rouge Sewerage Commission Rev., 5.25%, 2/1/39, Ser. A | | | | | 1,053,400 | |
| | | | Ohio – 3.2% | | | | | | |
| | 7,450 | | | Buckeye Tobacco Settlement Financing Auth. Rev., 6.50%, 6/1/47, Ser. A-2 | | | | | 6,228,200 | |
| | | | U. S. Virgin Islands – 0.5% | | | | | | |
| | 1,000 | | | Public Finance Auth. Rev., 6.00%, 10/1/39, Ser. A | | | | | 1,009,180 | |
| | Total Other Municipal Bonds & Notes (cost-$9,864,041) | | | | | 9,330,320 | |
| | New York Variable Rate Notes – 2.8% | | | | | | |
| | 5,000 | | | JPMorgan Chase Putters/Drivers Trust Rev., 9.49%, 7/1/33, Ser. 3382 (a)(b)(d)(e)(f)(h) (acquisition cost-$4,876,400; purchased 4/2/09) (cost-$4,884,395) | | | | | 5,417,150 | |
| | | | |
| 24 | | Semi-Annual Report | | | November 30, 2013 |
Schedule of Investments
PIMCO New York Municipal Income Fund II
November 30, 2013 (unaudited) (continued)
| | | | | | | | | | |
Principal
Amount
(000s) | | | | | | | Value | |
| | Short-Term Investments – 2.1% | | | | | | |
| | | | U.S. Treasury Obligations – 2.1% | | | | | | |
| | | | U.S. Treasury Notes, | | | | | | |
| | $1,100 | | | 0.25%, 5/31/14 | | | | | $1,100,730 | |
| | 262 | | | 0.25%, 8/31/14 | | | | | 262,215 | |
| | 900 | | | 0.50%, 8/15/14 | | | | | 902,268 | |
| | 1,800 | | | 0.50%, 10/15/14 | | | | | 1,805,555 | |
| | Total U.S. Treasury Obligations (cost-$4,070,920) | | | | | 4,070,768 | |
| | Total Investments (cost-$191,624,852) – 100.0% | | | | | $194,396,272 | |
Industry classification of portfolio holdings as a percentage of total investments was as follows:
| | | | | | | | |
Revenue Bonds: | | | | | | | | |
Health, Hospital & Nursing Home Revenue | | | 14.5 | % | | | | |
College & University Revenue | | | 14.1 | | | | | |
Industrial Revenue | | | 10.2 | | | | | |
Income Tax Revenue | | | 8.9 | | | | | |
Miscellaneous Revenue | | | 8.0 | | | | | |
Tobacco Settlement Funded | | | 7.9 | | | | | |
Transit Revenue | | | 6.4 | | | | | |
Highway Revenue Tolls | | | 5.2 | | | | | |
Miscellaneous Taxes | | | 4.9 | | | | | |
Lease (Abatement) | | | 4.4 | | | | | |
Recreational Revenue | | | 4.3 | | | | | |
Water Revenue | | | 4.1 | | | | | |
Port, Airport & Marina Revenue | | | 2.4 | | | | | |
Economic Development Revenue | | | 0.7 | | | | | |
Sewer Revenue | | | 0.5 | | | | | |
Electric Power & Light Revenue | | | 0.3 | | | | | |
| | | | | | | | |
Total Revenue Bonds | | | | | | | 96.8 | % |
U.S. Treasury Obligations | | | | | | | 2.1 | |
General Obligation | | | | | | | 1.1 | |
| | | | | | | | |
Total Investments | | | | | | | 100.0 | % |
| | | | | | | | |
Notes to Schedule of Investments:
| (a) | | Private Placement–Restricted as to resale and may not have a readily available market. Security with a value of $5,417,150, representing 2.8% of total investments. | |
| (c) | | Pre-refunded bonds are collateralized by U.S. Government or other eligible securities which are held in escrow and used to pay principal and interest and retire the bonds at the earliest refunding date (payment date). | |
| (d) | | 144A–Exempt from registration under Rule 144A of the Securities Act of 1933. These securities may be resold in transactions exempt from registration, typically only to qualified institutional buyers. Unless otherwise indicated, these securities are not considered to be illiquid. | |
| (e) | | Inverse Floater–The interest rate shown bears an inverse relationship to the interest rate on another security or the value of an index. The interest rate disclosed reflects the rate in effect on November 30, 2013. | |
| (f) | | Variable Rate Notes–Instruments whose interest rates change on specified date (such as a coupon date or interest payment date) and/or whose interest rates vary with changes in a designated base rate (such as the prime interest rate). The interest rate disclosed reflects the rate in effect on November 30, 2013. | |
| | | | | | |
| November 30, 2013 | | | Semi-Annual Report | | | 25 | |
Schedule of Investments
PIMCO New York Municipal Income Fund II
November 30, 2013 (unaudited) (continued)
| (g) | | Residual Interest Bonds held in Trust–Securities represent underlying bonds transferred to a separate securitization trust established in a tender option bond transaction in which the Fund acquired the residual interest certificates. These securities serve as collateral in a financing transaction. | |
| (h) | | Restricted. The aggregate acquisition cost of such security is $4,876,400. The aggregate value is $5,417,150, representing 2.8% of total investments. | |
| (i) | | Floating Rate Notes–The weighted average daily balance of Floating Rate Notes outstanding during the six months ended November 30, 2013 was $8,313,867 at a weighted average interest rate, including fees, of 0.83%. | |
| (j) | | Fair Value Measurements-See Note 1(b) in the Notes to Financial Statements. | |
| | | | | | | | | | | | | | | | |
| | | Level 1 –
Quoted
Prices | | | Level 2 –
Other Significant
Observable
Inputs | | | Level 3 –
Significant
Unobservable
Inputs | | | Value at
11/30/13 | |
Investments in Securities – Assets | | | | | | | | | | | | | | | | |
New York Municipal Bonds & Notes | | | $– | | | | $175,578,034 | | | | $– | | | | $175,578,034 | |
Other Municipal Bonds & Notes | | | – | | | | 9,330,320 | | | | – | | | | 9,330,320 | |
New York Variable Rate Notes | | | – | | | | 5,417,150 | | | | – | | | | 5,417,150 | |
Short-Term Investments | | | – | | | | 4,070,768 | | | | – | | | | 4,070,768 | |
Totals | | | $– | | | | $194,396,272 | | | | $– | | | | $194,396,272 | |
At November 30, 2013, there were no transfers between Levels 1 and 2.
| (k) | | The following is a summary of the derivative instruments categorized by risk exposure: | |
The effect of derivatives on the Statement of Operations for the six months ended November 30, 2013:
| | | | |
| Location | | Interest
Rate
Contracts | |
| Net realized gain on: | | | | |
| Swaps | | | $144,467 | |
| | | | |
| Net change in unrealized appreciation/depreciation of: | | | | |
| Swaps | | | $(89,478 | ) |
| | | | |
| The average volume (measured at each fiscal quarter-end) of derivatives activity during the six months ended November 30, 2013 | | | | |
| Interest | | | | |
| Rate Swap | | | | |
| Agreements(1) | | | $12,000 | |
| | | | |
| (1) | | Notional Amount (in Thousands) | |
Glossary:
| | | | |
| AGC | | - | | insured by Assured Guaranty Corp. |
| AGM | | - | | insured by Assured Guaranty Municipal Corp. |
| AMBAC | | - | | insured by American Municipal Bond Assurance Corp. |
| FGIC | | - | | insured by Financial Guaranty Insurance Co. |
| FHA | | - | | insured by Federal Housing Administration |
| GO | | - | | General Obligation Bond |
| NPFGC | | - | | insured by National Public Finance Guarantee Corp. |
| Radian | | - | | insured by Radian Guaranty, Inc. |
| | | | |
| 26 | | Semi-Annual Report | | | November 30, 2013 | See accompanying Notes to Financial Statements |
Statements of Assets and Liabilities
PIMCO Municipal Income Funds II
November 30, 2013 (unaudited)
| | | | | | | | | | | | | | | | | | |
| | | | | Municipal II | | | | | California
Municipal II | | | | | New York
Municipal II | |
| Assets: | | | | | | | | | | | | | | | | | | |
| Investments, at value (cost-$1,043,087,866, $412,672,979 and $191,624,852, respectively) | | | | | $1,072,346,304 | | | | | | $440,905,559 | | | | | | $194,396,272 | |
| Cash | | | | | 595,025 | | | | | | 571,310 | | | | | | 570,550 | |
| Interest receivable | | | | | 18,196,708 | | | | | | 6,734,893 | | | | | | 2,990,153 | |
| Receivable for investments sold | | | | | 16,206,447 | | | | | | – | | | | | | – | |
| Prepaid expenses and other assets | | | | | 64,726 | | | | | | 64,564 | | | | | | 29,805 | |
Total Assets | | | | | 1,107,409,210 | | | | | | 448,276,326 | | | | | | 197,986,780 | |
| | | | | | |
| Liabilities: | | | | | | | | | | | | | | | | | | |
| Payable for floating rate notes issued | | | | | 44,317,277 | | | | | | 38,098,801 | | | | | | 8,186,394 | |
| Payable for investments purchased | | | | | 24,460,600 | | | | | | – | | | | | | – | |
| Dividends payable to common and preferred shareholders | | | | | 3,970,140 | | | | | | 1,981,135 | | | | | | 726,445 | |
| Investment management fees payable | | | | | 552,026 | | | | | | 217,782 | | | | | | 100,710 | |
| Interest payable | | | | | 77,822 | | | | | | 13,835 | | | | | | 10,407 | |
| Accrued expenses and other liabilities | | | | | 333,563 | | | | | | 157,847 | | | | | | 285,471 | |
Total Liabilities | | | | | 73,711,428 | | | | | | 40,469,400 | | | | | | 9,309,427 | |
| Preferred Shares ($0.00001 par value and $25,000 liquidation preference per share applicable to an aggregate of 14,680, 6,520 and 3,160 shares issued and outstanding, respectively) | | | | | 367,000,000 | | | | | | 163,000,000 | | | | | | 79,000,000 | |
| Net Assets Applicable to Common Shareholders | | | | | $666,697,782 | | | | | | $244,806,926 | | | | | | $109,677,353 | |
| | | | | | |
| Composition of Net Assets Applicable to Common Shareholders: | | | | | | | | | | | | | | | | | | |
Common Shares: | | | | | | | | | | | | | | | | | | |
Par value ($0.00001 per share) | | | | | $610 | | | | | | $317 | | | | | | $110 | |
Paid-in-capital in excess of par | | | | | 811,966,453 | | | | | | 412,145,941 | | | | | | 148,172,140 | |
Undistributed (dividends in excess of) net investment income | | | | | 22,890,985 | | | | | | (3,444,887) | | | | | | 1,542,836 | |
Accumulated net realized loss | | | | | (197,415,890) | | | | | | (192,128,491) | | | | | | (42,820,602) | |
Net unrealized appreciation | | | | | 29,255,624 | | | | | | 28,234,046 | | | | | | 2,782,869 | |
| Net Assets Applicable to Common Shareholders | | | | | $666,697,782 | | | | | | $244,806,926 | | | | | | $109,677,353 | |
| Common Shares Issued and Outstanding | | | | | 61,029,334 | | | | | | 31,675,550 | | | | | | 10,955,880 | |
| Net Asset Value Per Common Share | | | | | $10.92 | | | | | | $7.73 | | | | | | $10.01 | |
| | | | | | | | |
| See accompanying Notes to Financial Statements | | | November 30, 2013 | | | Semi-Annual Report | | | 27 | |
Statements of Operations
PIMCO Municipal Income Funds II
Six Months ended November 30, 2013 (unaudited)
| | | | | | | | | | | | | | | | | | |
| | | | | Municipal II | | | | | California
Municipal II | | | | | New York
Municipal II | |
| Investment Income: | | | | | | | | | | | | | | | | | | |
| Interest | | | | | $28,292,382 | | | | | | $12,348,981 | | | | | | $4,904,143 | |
| Consent fees | | | | | 90,000 | | | | | | – | | | | | | – | |
Total Investment Income | | | | | 28,382,382 | | | | | | 12,348,981 | | | | | | 4,904,143 | |
| | | | | | |
| Expenses: | | | | | | | | | | | | | | | | | | |
| Investment management | | | | | 3,382,788 | | | | | | 1,334,998 | | | | | | 615,801 | |
| Auction agent and commissions | | | | | 288,591 | | | | | | 134,997 | | | | | | 64,673 | |
| Interest | | | | | 151,868 | | | | | | 101,698 | | | | | | 35,089 | |
| Audit and tax services | | | | | 105,437 | | | | | | 32,361 | | | | | | 30,333 | |
| Custodian and accounting agent | | | | | 78,708 | | | | | | 48,192 | | | | | | 34,135 | |
| Shareholder communications | | | | | 35,438 | | | | | | 20,516 | | | | | | 11,631 | |
| Trustees | | | | | 29,488 | | | | | | 11,452 | | | | | | 5,260 | |
| New York Stock Exchange listing | | | | | 28,339 | | | | | | 14,671 | | | | | | 12,406 | |
| Transfer agent | | | | | 11,897 | | | | | | 13,194 | | | | | | 13,800 | |
| Legal | | | | | 8,232 | | | | | | 6,456 | | | | | | 5,677 | |
| Insurance | | | | | 7,514 | | | | | | 3,825 | | | | | | 2,497 | |
| Miscellaneous | | | | | 6,870 | | | | | | 5,601 | | | | | | 4,994 | |
Total Expenses | | | | | 4,135,170 | | | | | | 1,727,961 | | | | | | 836,296 | |
| | | | | | |
| Net Investment Income | | | | | 24,247,212 | | | | | | 10,621,020 | | | | | | 4,067,847 | |
| | | | | | |
| Realized and Change in Unrealized Gain (Loss): | | | | | | | | | | | | | | | | | | |
Net realized gain (loss) on: | | | | | | | | | | | | | | | | | | |
Investments | | | | | (2,408,905) | | | | | | (3,935,297) | | | | | | (108,172) | |
Swaps | | | | | 622,762 | | | | | | 205,965 | | | | | | 144,467 | |
Net change in unrealized appreciation/depreciation of: | | | | | | | | | | | | | | | | | | |
Investments | | | | | (74,258,993) | | | | | | (32,769,499) | | | | | | (13,924,359) | |
Swaps | | | | | (334,300) | | | | | | (119,661) | | | | | | (89,478) | |
| Net realized and change in unrealized loss | | | | | (76,379,436) | | | | | | (36,618,492) | | | | | | (13,977,542) | |
| Net Decrease in Net Assets Resulting from Investment Operations | | | | | (52,132,224) | | | | | | (25,997,472) | | | | | | (9,909,695) | |
| Dividends on Preferred Shares from Net Investment Income | | | | | (223,031) | | | | | | (99,057) | | | | | | (48,479) | |
| Net Decrease in Net Assets Applicable to Common Shareholders Resulting from Investment Operations | | | | | $(52,355,255) | | | | | | $(26,096,529) | | | | | | $(9,958,174) | |
| | | | | | |
| 28 | | Semi-Annual Report | | | November 30, 2013 | | | See accompanying Notes to Financial Statements |
[THIS PAGE INTENTIONALLY LEFT BLANK]
| | | | | | |
| November 30, 2013 | | | Semi-Annual Report | | | 29 | |
Statements of Changes in Net Assets
Applicable to Common Shareholders
PIMCO Municipal Income Funds II
| | | | | | | | | | | | |
| | | | | Municipal II | |
| | | | | Six Months ended
November 30, 2013
(unaudited) | | | | | Year ended
May 31, 2013 | |
| Investment Operations: | | | | | | | | | | | | |
| Net investment income | | | | | $24,247,212 | | | | | | $50,453,284 | |
| Net realized gain (loss) | | | | | (1,786,143) | | | | | | 4,106,105 | |
| Net change in unrealized appreciation/depreciation | | | | | (74,593,293) | | | | | | 9,719,063 | |
| Net increase (decrease) in net assets resulting from investment operations | | | | | (52,132,224) | | | | | | 64,278,452 | |
| | | | |
| Dividends on Preferred Shares from Net Investment Income | | | | | (223,031) | | | | | | (901,014) | |
| Net increase (decrease) in net assets applicable to common shareholders resulting from investment operations | | | | | (52,355,255) | | | | | | 63,377,438 | |
| | | | |
| Dividends to Common Shareholders from: | | | | | | | | | | | | |
| Net investment income | | | | | (23,777,031) | | | | | | (47,407,514) | |
| Return of capital | | | | | – | | | | | | – | |
| Total dividends and distributions to common shareholders | | | | | (23,777,031) | | | | | | (47,407,514) | |
| | | | |
| Common Share Transactions: | | | | | | | | | | | | |
| Reinvestment of dividends | | | | | 1,462,515 | | | | | | 3,236,891 | |
| Total increase (decrease) in net assets applicable to common shareholders | | | | | (74,669,771) | | | | | | 19,206,815 | |
| | | | |
| Net Assets Applicable to Common Shareholders: | | | | | | | | | | | | |
| Beginning of period | | | | | 741,367,553 | | | | | | 722,160,738 | |
| End of period* | | | | | $666,697,782 | | | | | | $741,367,553 | |
| *Including undistributed (dividends in excess of) net investment income of: | | | | | $22,890,985 | | | | | | $22,643,835 | |
| | | | |
| Common Shares Issued in Reinvestment of Dividends | | | | | 132,707 | | | | | | 257,784 | |
| | | | | | |
| 30 | | Semi-Annual Report | | | November 30, 2013 | | | See accompanying Notes to Financial Statements |
| | | | | | | | | | | | | | | | | | | | |
California Municipal II | | | | | New York Municipal II | |
Six Months ended
November 30, 2013
(unaudited) | | | | | Year ended
May 31, 2013 | | | | | Six Months ended
November 30, 2013
(unaudited) | | | | | Year ended
May 31, 2013 | |
| | | | | | | | | | | | | | | | | | | | |
| | $10,621,020 | | | | | | $21,709,832 | | | | | | $4,067,847 | | | | | | $8,604,979 | |
| | (3,729,332) | | | | | | 3,108,299 | | | | | | 36,295 | | | | | | 292,763 | |
| | (32,889,160) | | | | | | 7,700,006 | | | | | | (14,013,837) | | | | | | (612,931) | |
| | (25,997,472) | | | | | | 32,518,137 | | | | | | (9,909,695) | | | | | | 8,284,811 | |
| | | | | | | |
| | (99,057) | | | | | | (402,646) | | | | | | (48,479) | | | | | | (194,449) | |
|
(26,096,529) |
| | | | | 32,115,491 | | | | | | (9,958,174) | | | | | | 8,090,362 | |
| | | | | | | |
| | | | | | | | | | | | | | | | | | | | |
| | (11,868,172) | | | | | | (21,313,126) | | | | | | (4,350,125) | | | | | | (8,669,854) | |
| | – | | | | | | (2,354,016) | | | | | | – | | | | | | – | |
| | (11,868,172) | | | | | | (23,667,142) | | | | | | (4,350,125) | | | | | | (8,669,854) | �� |
| | | | | | | |
| | | | | | | | | | | | | | | | | | | | |
| | 590,692 | | | | | | 1,162,949 | | | | | | 300,494 | | | | | | 597,357 | |
| | (37,374,009) | | | | | | 9,611,298 | | | | | | (14,007,805) | | | | | | 17,865 | |
| | | | | | | |
| | | | | | | | | | | | | | | | | | | | |
| | 282,180,935 | | | | | | 272,569,637 | | | | | | 123,685,158 | | | | | | 123,667,293 | |
| | $244,806,926 | | | | | | $282,180,935 | | | | | | $109,677,353 | | | | | | $123,685,158 | |
| | $(3,444,887) | | | | | | $(2,098,678) | | | | | | $1,542,836 | | | | | | $1,873,593 | |
| | | | | | | |
| | 65,223 | | | | | | 113,525 | | | | | | 28,558 | | | | | | 47,813 | |
| | | | | | | | |
| See accompanying Notes to Financial Statements | | | November 30, 2013 | | | Semi-Annual Report | | | 31 | |
Notes to Financial Statements
PIMCO Municipal Income Funds II
November 30, 2013 (unaudited)
1. Organization and Significant Accounting Policies
PIMCO Municipal Income Fund II (‘‘Municipal II’’), PIMCO California Municipal Income Fund II (‘‘California Municipal II’’) and PIMCO New York Municipal Income Fund II (‘‘New York Municipal II’’), (each a “Fund” and collectively the ‘‘Funds’’ or ‘‘PIMCO Municipal Income Funds II’’), were organized as Massachusetts business trusts on March 29, 2002. Prior to commencing operations on June 28, 2002, the Funds had no operations other than matters relating to their organization and registration as non-diversified, closed-end management investment companies registered under the Investment Company Act of 1940 and the rules and regulations thereunder, as amended. Allianz Global Investors Fund Management LLC (the “Investment Manager”) and Pacific Investment Management Company LLC (“PIMCO” or the “Sub-Adviser”) serve as the Funds’ investment manager and sub-adviser, respectively, and are both indirect, wholly-owned subsidiaries of Allianz Asset Management of America L.P. (“AAM”). AAM is an indirect, wholly-owned subsidiary of Allianz SE, a publicly traded European insurance and financial services company. Each Fund has an unlimited amount of no par value per share of common shares authorized.
Under normal market conditions, Municipal II invests substantially all of its assets in a portfolio of municipal bonds, the interest from which is exempt from U.S. federal income taxes. Under normal market conditions, California Municipal II invests substantially all of its assets in municipal bonds which pay interest that is exempt from federal and California state income taxes. Under normal market conditions, New York Municipal II invests substantially all of its assets in municipal bonds which pay interest that is exempt from federal, New York State and New York City income taxes. There can be no assurance that the Funds will meet their stated objectives. The Funds will generally seek to avoid investing in
bonds generating interest income which could potentially subject individuals to alternative minimum tax. The issuers’ abilities to meet their obligations may be affected by economic and political developments in a specific state or region.
The preparation of the Funds’ financial statements in accordance with accounting principles generally accepted in the United States of America requires the Funds’ management to make estimates and assumptions that affect the reported amounts and disclosures in each Fund’s financial statements. Actual results could differ from those estimates.
In the normal course of business, the Funds enter into contracts that contain a variety of representations that provide general indemnifications. The Funds’ maximum exposure under these arrangements is unknown as this would involve future claims that may be made against the Funds that have not yet occurred.
The following is a summary of significant accounting policies consistently followed by the Funds:
(a) Valuation of Investments
Portfolio securities and other financial instruments for which market quotations are readily available are stated at market value. Market value is generally determined on the basis of last reported sales prices, or if no sales are reported, on the basis of quotes obtained from a quotation reporting system, established market makers, or independent pricing services. The Funds’ investments are valued daily using prices supplied by an independent pricing service or dealer quotations, or by using the last sale price on the exchange that is the primary market for such securities, or the mean between the last quoted bid and ask price.
| | | | |
| 32 | | Semi-Annual Report | | | November 30, 2013 |
Notes to Financial Statements
PIMCO Municipal Income Funds II
November 30, 2013 (unaudited)
1. Organization and Significant Accounting Policies (continued)
Independent pricing services use information provided by market makers or estimates of market values obtained from yield data relating to investments or securities with similar characteristics. Securities purchased on a when-issued or delayed-delivery basis are marked to market daily until settlement at the forward settlement date.
The Board of Trustees (the “Board”) has adopted procedures for valuing portfolio securities and other financial derivative instruments in circumstances where market quotes are not readily available, and has delegated the responsibility for applying the valuation methods to the Investment Manager and Sub-Adviser. The Funds’ Valuation Committee was established by the Board to oversee the implementation of the Funds’ valuation methods and to make fair value determinations on behalf of the Board, as instructed. The Sub-Adviser monitors the continued appropriateness of methods applied and determines if adjustments should be made in light of market changes, events affecting the issuer, or other factors. If the Sub-Adviser determines that a valuation method may no longer be appropriate, another valuation method may be selected, or the Valuation Committee will be convened to consider the matter and take any appropriate action in accordance with procedures set forth by the Board. The Board shall review the appropriateness of the valuation methods and these methods may be amended or supplemented from time to time by the Valuation Committee.
Short-term securities maturing in 60 days or less are valued at amortized cost, if their original term to maturity was 60 days or less, or by amortizing their value on the 61st day prior to maturity, if the original term to maturity exceeded 60 days.
The prices used by the Funds to value investments may differ from the value that would be realized if the investments were sold, and these differences could be material to the Funds’ financial statements. Each Fund’s net asset value (“NAV”) is normally determined as of the close of regular trading (normally, 4:00 p.m. Eastern time) on the New York Stock Exchange (“NYSE”) on each day the NYSE is open for business.
(b) Fair Value Measurements
Fair value is defined as the price that would be received to sell an asset or paid to transfer a liability (i.e. the “exit price”) in an orderly transaction between market participants. The three levels of the fair value hierarchy are described below:
| n | | Level 1 – quoted prices in active markets for identical investments that the Funds have the ability to access |
| n | | Level 2 – valuations based on other significant observable inputs, which may include, but are not limited to, quoted prices for similar assets or liabilities, interest rates, yield curves, volatilities, prepayment speeds, loss severities, credit risks and default rates or other market corroborated inputs |
| n | | Level 3 – valuations based on significant unobservable inputs (including the Sub-Adviser’s or Valuation Committee’s own assumptions and securities whose price was determined by using a single broker’s quote) |
The valuation techniques used by the Funds to measure fair value during the six months ended November 30, 2013 were intended to maximize the use of observable inputs and to minimize the use of unobservable inputs.
The Funds’ policy is to recognize transfers between levels at the end of the reporting period. An investment asset’s or liability’s level within the fair value hierarchy is based on the lowest level input, individually or in aggregate,
| | | | | | |
| November 30, 2013 | | | Semi-Annual Report | | | 33 | |
Notes to Financial Statements
PIMCO Municipal Income Funds II
November 30, 2013 (unaudited)
1. Organization and Significant Accounting Policies (continued)
that is significant to the fair value measurement. The objective of fair value measurement remains the same even when there is a significant decrease in the volume and level of activity for an asset or liability and regardless of the valuation techniques used. Investments categorized as Level 1 or 2 as of period end may have been transferred between Levels 1 and 2 since the prior period due to changes in the valuation method utilized in valuing the investments.
The inputs or methodology used for valuing securities are not necessarily an indication of the risk associated with investing in those securities. The following are certain inputs and techniques that the Funds generally use to evaluate how to classify each major category of assets and liabilities for Level 2 and Level 3, in accordance with Generally Accepted Accounting Principles (“GAAP”).
U.S. Treasury Obligations – U.S. Treasury obligations are valued by independent pricing services based on pricing models that evaluate the mean between the most recently quoted bid and ask price. The models also take into consideration data received from active market makers and broker-dealers, yield curves, and the spread over comparable U.S. Treasury issues. The spreads change daily in response to market conditions and are generally obtained from the new issue market and broker-dealer sources. To the extent that these inputs are observable, the values of U.S. Treasury obligations are categorized as Level 2. To the extent that these inputs are unobservable, the values are categorized as Level 3.
Government Sponsored Enterprise and Mortgage-Backed Securities – Government sponsored enterprise and mortgage-backed securities are valued by independent pricing services using pricing models based on inputs
that include issuer type, coupon, cash flows, mortgage prepayment projection tables and Adjustable Rate Mortgage evaluations that incorporate index data, periodic and life caps, the next coupon reset date. To the extent that these inputs are observable, the values of government sponsored enterprise and mortgage-backed securities are categorized as Level 2. To the extent that these inputs are unobservable, the values are categorized as Level 3.
Municipal Bonds & Notes and Variable Rate Notes – Municipal bonds & notes and variable rate notes are valued by independent pricing services based on pricing models that take into account, among other factors, information received from market makers and broker-dealers, current trades, bid-want lists, offerings, market movements, the callability of the bond, state of issuance, benchmark yield curves, and bond or note insurance. To the extent that these inputs are observable, the values of municipal bonds & notes and variable rate notes are categorized as Level 2. To the extent that these inputs are unobservable, the values are categorized as Level 3.
Corporate Bonds & Notes – Corporate bonds & notes are generally comprised of two main categories: investment grade bonds and high yield bonds. Investment grade bonds are valued by independent pricing services using various inputs and techniques, which include broker-dealer quotations, live trading levels, recently executed transactions in securities of the issuer or comparable issuers, and option adjusted spread models that include base curve and spread curve inputs. Adjustments to individual bonds can be applied to recognize trading differences compared to other bonds issued by the same issuer. High yield bonds are valued by independent pricing services based primarily on broker-dealer quotations from relevant market makers and recently executed transactions in
| | | | |
| 34 | | Semi-Annual Report | | | November 30, 2013 |
Notes to Financial Statements
PIMCO Municipal Income Funds II
November 30, 2013 (unaudited)
1. Organization and Significant Accounting Policies (continued)
securities of the issuer or comparable issuers. The broker-dealer quotations received are supported by credit analysis of the issuer that takes into consideration credit quality assessments, daily trading activity, and the activity of the underlying equities, listed bonds and sector-specific trends. To the extent that these inputs are observable, the values of corporate bonds & notes are categorized as Level 2. To the extent that these inputs are unobservable, the values are categorized as Level 3.
(c) Investment Transactions and Investment Income
Investment transactions are accounted for on the trade date. Securities purchased and sold on a when-issued or delayed-delivery basis may be settled a month or more after the trade date. Realized gains and losses on investments are determined on an identified cost basis. Interest income adjusted for the accretion of discount and amortization of premiums is recorded on an accrual basis. Discounts or premiums on debt securities purchased are accreted or amortized, respectively, to interest income.
(d) Federal Income Taxes
The Funds intend to distribute all of their taxable income and to comply with the other requirements of Subchapter M of the U.S. Internal Revenue Code of 1986, as amended, applicable to regulated investment companies. Accordingly, no provision for U.S. federal income taxes is required.
Accounting for uncertainty in income taxes establishes for all entities, including pass-through entities such as the Funds, a minimum threshold for financial statement recognition of the benefit of positions taken in filing tax returns (including whether an entity is taxable in a particular jurisdiction), and requires certain
expanded tax disclosures. In accordance with provisions set forth under U.S. GAAP, the Investment Manager has reviewed the Funds’ tax positions for all open tax years. As of November 30, 2013, the Funds have recorded no liability for net unrecognized tax benefits relating to uncertain income tax positions they have taken. The Funds’ federal income tax returns for the prior three years remain subject to examination by the Internal Revenue Service.
(e) Dividends and Distributions – Common Shares
The Funds declare dividends from net investment income to common shareholders monthly. Distributions of net realized capital gains, if any, are paid at least annually. The Funds record dividends and distributions on the ex-dividend date. The amount of dividends from net investment income and distributions from net realized capital gains is determined in accordance with federal income tax regulations, which may differ from GAAP. These “book-tax” differences are considered either temporary or permanent in nature. To the extent these differences are permanent in nature, such amounts are reclassified within the capital accounts based on their federal income tax treatment; temporary differences do not require reclassification. To the extent dividends and/or distributions exceed current and accumulated earnings and profits for federal income tax purposes, they are reported as dividends and/or distributions to shareholders from return of capital.
(f) Inverse Floating Rate Transactions – Residual Interest Municipal Bonds (“RIBs”) / Residual Interest Tax Exempt Bonds (“RITEs”)
The Funds invest in RIBs and RITEs (“Inverse Floaters”), whose interest rates bear an inverse relationship to the interest rate on another security or the value of an index. In inverse floating rate transactions, the Funds sell a fixed
| | | | | | |
| November 30, 2013 | | | Semi-Annual Report | | | 35 | |
Notes to Financial Statements
PIMCO Municipal Income Funds II
November 30, 2013 (unaudited)
1. Organization and Significant Accounting Policies (continued)
rate municipal bond (“Fixed Rate Bond”) to a broker who places the Fixed Rate Bond in a special purpose trust (“Trust”) from which floating rate bonds (“Floating Rate Notes”) and Inverse Floaters are issued. The Funds simultaneously or within a short period of time, purchase the Inverse Floaters from the broker. The Inverse Floaters held by the Funds provide the Funds with the right to: (1) cause the holders of the Floating Rate Notes to tender their notes at par, and (2) cause the broker to transfer the Fixed-Rate Bond held by the Trust to the Funds, thereby collapsing the Trust. The Funds account for the transaction described above as a secured borrowing by including the Fixed Rate Bond in their Schedules of Investments, and account for the Floating Rate Notes as a liability under the caption “Payable for Floating Rate Notes issued” in the Funds’ Statements of Assets and Liabilities. The Floating Rate Notes have interest rates that generally reset weekly and their holders have the option to tender their notes to the broker for redemption at par at each reset date.
The Funds may also invest in Inverse Floaters without transferring a fixed rate municipal bond into a Trust, which are not accounted for as secured borrowings. The Funds may also invest in Inverse Floaters for the purpose of increasing leverage.
The Inverse Floaters are created by dividing the income stream provided by the underlying bonds to create two securities, one short-term and one long-term. The interest rate on the short-term component is reset by an index or auction process typically every 7 to 35 days. After income is paid on the short-term securities at current rates, the residual income from the underlying bond(s) goes to the long-term securities. Therefore, rising short-term rates result in lower income for the long-term
component and vice versa. The longer-term bonds may be more volatile and less liquid than other municipal bonds of comparable maturity. Investments in Inverse Floaters typically will involve greater risk than in an investment in Fixed Rate Bonds.
The Funds’ restrictions on borrowings do not apply to the secured borrowings deemed to have occurred for accounting purposes. Inverse Floaters held by the Funds are exempt from registration under Rule 144A of the Securities Act of 1933.
In addition to general market risks, the Funds’ investments in Inverse Floaters may involve greater risk and volatility than an investment in a fixed rate bond, and the value of Inverse Floaters may decrease significantly when market interest rates increase. Inverse Floaters have varying degrees of liquidity, and the market for these securities may be volatile. These securities tend to underperform the market for fixed rate bonds in a rising interest rate environment, but tend to outperform the market for fixed rate bonds when interest rates decline or remain relatively stable. Although volatile, Inverse Floaters typically offer the potential for yields exceeding the yields available on fixed rate bonds with comparable credit quality, coupon, call provisions and maturity. Trusts in which Inverse Floaters may be held could be terminated due to market, credit or other events beyond the Funds’ control, which could require the Funds to reduce leverage and dispose of portfolio investments at inopportune times and prices.
(g) When-Issued/Delayed-Delivery Transactions
When-issued or delayed-delivery transactions involve a commitment to purchase or sell securities for a predetermined price or yield, with payment and delivery taking place beyond the customary settlement period. When
| | | | |
| 36 | | Semi-Annual Report | | | November 30, 2013 |
Notes to Financial Statements
PIMCO Municipal Income Funds II
November 30, 2013 (unaudited)
1. Organization and Significant Accounting Policies (continued)
delayed-delivery purchases are outstanding, the Funds will set aside and maintain until the settlement date in a designated account, liquid assets in an amount sufficient to meet the purchase price. When purchasing a security on a delayed-delivery basis, the Funds assume the rights and risks of ownership of the security, including the risk of price and yield fluctuations; consequently, such fluctuations are taken into account when determining the NAV. The Funds may dispose of or renegotiate a delayed-delivery transaction after it is entered into, and may sell when-issued securities before they are delivered, which may result in a realized gain or loss. When a security is sold on a delayed-delivery basis, the Funds do not participate in future gains and losses with respect to the security.
(h) U.S. Government Agencies or Government-Sponsored Enterprises
Securities issued by U.S. Government agencies or government-sponsored enterprises may not be guaranteed by the U.S. Treasury. The Government National Mortgage Association (“GNMA” or “Ginnie Mae”), a wholly-owned U.S. Government corporation, is authorized to guarantee, with the full faith and credit of the U.S. Government, the timely payment of principal and interest on securities issued by institutions approved by GNMA and backed by pools of mortgages insured by the Federal Housing Administration or guaranteed by the Department of Veterans Affairs. Government-related guarantors not backed by the full faith and credit of the U.S. Government include the Federal National Mortgage Association (“FNMA” or “Fannie Mae”) and the Federal Home Loan Mortgage Corporation (“FHLMC” or “Freddie Mac”). Pass-through securities issued by FNMA are guaranteed as to timely payment of principal and interest by FNMA, but are not backed by the full faith and credit of the U.S.
Government. FHLMC guarantees the timely payment of interest and ultimate collection of principal, but its participation certificates are not backed by the full faith and credit of the U.S. Government.
(i) Restricted Securities
The Funds are permitted to invest in securities that are subject to legal or contractual restrictions on resale. These securities generally may be resold in transactions exempt from registration or to the public if the securities are registered. Disposal of these securities may involve time-consuming negotiations and expenses, and prompt sale at an acceptable price may be difficult.
(j) Interest Expense
Interest expense primarily relates to the Funds’ participation in Floating Rate Notes held by third parties in conjunction with Inverse Floater transactions.
(k) Custody Credits on Cash Balances
The Funds may benefit from an expense offset arrangement with their custodian bank, whereby uninvested cash balances may earn credits that reduce monthly custodian and accounting agent expenses. Had these cash balances been invested in income-producing securities, they would have generated income for the Funds. Cash overdraft charges, if any, are included in custodian and accounting agent fees.
2. Principal Risks
In the normal course of business, the Funds trade financial instruments and enter into financial transactions where risk of potential loss exists due to, among other things, changes in the market (market risk) or failure of the other party to a transaction to perform (counterparty risk). The Funds are also exposed to other risks such as, but not limited to, interest rate, credit and leverage risks.
| | | | | | |
| November 30, 2013 | | | Semi-Annual Report | | | 37 | |
Notes to Financial Statements
PIMCO Municipal Income Funds II
November 30, 2013 (unaudited)
2. Principal Risks (continued)
Interest rate risk is the risk that fixed income securities will decline in value because of changes in interest rates. As nominal interest rates rise, the values of certain fixed income securities held by the Funds are likely to decrease. A nominal interest rate can be described as the sum of a real interest rate and an expected inflation rate. Fixed income securities with longer durations tend to be more sensitive to changes in interest rates, usually making them more volatile than securities with shorter durations. Duration is used primarily as a measure of the sensitivity of a fixed income security’s market price to interest rate (i.e. yield) movements.
Variable and floating rate securities generally are less sensitive to interest rate changes but may decline in value if their interest rates do not rise as much, or as quickly, as interest rates in general. Conversely, floating rate securities will not generally increase in value if interest rates decline. Inverse floating rate securities may decrease in value if interest rates increase. Inverse floating rate securities may also exhibit greater price volatility than a fixed rate obligation with similar credit quality. When a Fund holds variable or floating rate securities, a decrease (or, in the case of inverse floating rate securities, an increase) in market interest rates will adversely affect the income received from such securities and the NAV of the Funds’ shares.
The Funds are exposed to credit risk, which is the risk of losing money if the issuer or guarantor of a fixed income security is unable or unwilling, or is perceived (whether by market participants, rating agencies, pricing services or otherwise) as unable or unwilling, to make timely principal and/or interest payments, or to otherwise honor its obligations. Securities are subject to varying degrees of credit risk, which are often reflected in credit ratings.
The market values of securities may decline due to general market conditions (market risk) which are not specifically related to a particular company, such as real or perceived adverse economic conditions, changes in the general outlook for corporate earnings, changes in interest or currency rates or adverse investor sentiment. They may also decline due to factors that affect a particular industry or industries, such as labor shortages or increased production costs and competitive conditions within an industry. Equity securities and equity-related investments generally have greater market price volatility than fixed income securities.
The Funds are exposed to counterparty risk, or the risk that an institution or other entity with which the Funds have unsettled or open transactions will default. The potential loss to the Funds could exceed the value of the financial assets recorded in the Funds’ financial statements. Financial assets, which potentially expose the Funds to counterparty risk, consist principally of cash due from counterparties and investments. The Sub-Adviser seeks to minimize the Funds’ counterparty risk by performing reviews of each counterparty and by minimizing concentration of counterparty risk by undertaking transactions with multiple customers and counterparties on recognized and reputable exchanges. Delivery of securities sold is only made once the Funds have received payment. Payment is made on a purchase once the securities have been delivered by the counterparty. The trade will fail if either party fails to meet its obligation.
The Funds are exposed to risks associated with leverage. Leverage may cause the value of the Funds’ shares to be more volatile than if the Funds did not use leverage. This is because leverage tends to exaggerate the effect of any increase or decrease in the value of the Funds’ portfolio securities. The Funds may engage in transactions or purchase instruments that give
| | | | |
| 38 | | Semi-Annual Report | | | November 30, 2013 |
Notes to Financial Statements
PIMCO Municipal Income Funds II
November 30, 2013 (unaudited)
2. Principal Risks (continued)
rise to forms of leverage. In addition, to the extent the Funds employ leverage, dividend and interest costs may not be recovered by any appreciation of the securities purchased with the leverage proceeds and could exceed the Funds’ investment returns, resulting in greater losses.
The Funds hold defaulted securities that may involve special considerations including bankruptcy proceedings, other regulatory and legal restrictions affecting the Funds’ ability to trade, and the availability of prices from independent pricing services or dealer quotations. Some of these securities are illiquid and not actively traded. Sale of securities in bankrupt companies at an acceptable price may be difficult and differences compared to the value of the securities used by the Funds could be material. A Fund may incur additional expenses to the extent it is required to seek recovery upon a portfolio security’s default in the payment of principal or interest. In any bankruptcy proceeding relating to a defaulted investment, a Fund may lose its entire investment or may be required to accept cash or securities with a value substantially less than its original investment.
The Funds are party to International Swaps and Derivatives Association, Inc. Master Agreements (“ISDA Master Agreements”) with select counterparties that govern transactions, over-the-counter derivatives and foreign exchange contracts entered into by the Funds and those counterparties. The ISDA Master Agreements contain provisions for general obligations, representations, agreements, collateral and events of default or termination. Events of termination include conditions that may entitle counterparties to elect to terminate early and cause settlement of all outstanding transactions under the applicable ISDA Master Agreement. Any election to terminate early could be material to the financial statements of the Funds.
The considerations and factors surrounding the settlement of certain purchases and sales made on a delayed-delivery basis are governed by Master Securities Forward Transaction Agreements (“Master Forward Agreements”) between the Funds and select counterparties. The Master Forward Agreements maintain provisions for, among other things, initiation and confirmation, payment and transfer, events of default, termination, and maintenance of collateral.
3. Financial Derivative Instruments
Disclosure about derivatives and hedging activities requires qualitative disclosure regarding objectives and strategies for using derivatives, quantitative disclosure about fair value amounts of gains and losses on derivatives, and disclosure about credit-risk-related contingent features in derivative agreements. The disclosure requirements distinguish between derivatives, which are accounted for as “hedges,” and those that do not qualify for such accounting. Although the Funds at times use derivatives for hedging purposes, the Funds reflect derivatives at fair value and recognize changes in fair value through the Funds’ Statements of Operations, and such derivatives do not qualify for hedge accounting treatment.
(a) Swap Agreements
Swap agreements are bilaterally negotiated agreements between the Funds and a counterparty to exchange or swap investment cash flows, assets, foreign currencies or market or event-linked returns at specified, future intervals. Swap agreements may be privately negotiated in the over-the-counter market (“OTC swaps”) or may be executed in a multilateral or other trade facility platform, such as a registered commodities exchange (“centrally cleared swaps”). The Funds may enter into credit default, cross-currency, interest rate, total return, variance and other
| | | | | | |
| November 30, 2013 | | | Semi-Annual Report | | | 39 | |
Notes to Financial Statements
PIMCO Municipal Income Funds II
November 30, 2013 (unaudited)
3. Financial Derivative Instruments (continued)
forms of swap agreements in order, among other things, manage their exposure to credit, currency and interest rate risk. In connection with these agreements, securities or cash may be identified as collateral or margin in accordance with the terms of the respective swap agreements to provide assets of value and recourse in the event of default or bankruptcy/insolvency.
OTC swap payments received or made at the beginning of the measurement period, if any, are reflected as such on the Funds’ Statements of Assets and Liabilities and represent payments made or received upon entering into the swap agreement to compensate for differences between the stated terms of the swap agreement and prevailing market conditions (credit spreads, currency exchange rates, interest rates, and other relevant factors). These upfront payments are recorded as realized gains or losses on the Funds’ Statements of Operations upon termination or maturity of the swap. A liquidation payment received or made at the termination of the swap is recorded as realized gain or loss on the Funds’ Statements of Operations. Net periodic payments received or paid by the Funds are included as part of realized gains or losses on the Funds’ Statements of Operations. Changes in market value, if any, are reflected as a component of net changes in unrealized appreciation/depreciation on the Funds’ Statements of Operations. Daily changes in valuation of centrally cleared swaps, if any, are recorded as a receivable or payable, as applicable, for variation margin on centrally cleared swaps on the Funds’ Statements of Assets and Liabilities.
Entering into these agreements involves, to varying degrees, elements of credit, legal, market and documentation risk in excess of the amounts recognized on the Funds’ Statements of Assets and Liabilities. Such risks include the
possibility that there will be no liquid market for these agreements, that the counterparties to the agreements may default on their obligation to perform or disagree as to the meaning of contractual terms in the agreements and that there may be unfavorable changes in interest rates.
Interest Rate Swap Agreements – Interest rate swap agreements involve the exchange by the Funds with a counterparty of their respective commitments to pay or receive interest, e.g., an exchange of floating rate payments for fixed rate payments, with respect to the notional amount of principal. Certain forms of interest rate swap agreements may include: (i) interest rate caps, under which, in return for a premium, one party agrees to make payments to the other to the extent that interest rates exceed a specified rate, or “cap”, (ii) interest rate floors, under which, in return for a premium, one party agrees to make payments to the other to the extent that interest rates fall below a specified rate, or “floor”, (iii) interest rate collars, under which a party sells a cap and purchases a floor or vice versa in an attempt to protect itself against interest rate movements exceeding given minimum or maximum levels, (iv) callable interest rate swaps, under which the counterparty may terminate the swap transaction in whole at zero cost by a predetermined date and time prior to the maturity date, (v) spreadlocks, which allow the interest rate swap users to lock in the forward differential (or spread) between the interest rate swap rate and a specified benchmark, or (vi) basis swaps, under which two parties can exchange variable interest rates based on different money markets.
4. Investment Manager/Sub-Adviser
Each Fund has an Investment Management Agreement (each an “Agreement”) with the Investment Manager. Subject to the supervision of each Fund’s Board, the Investment Manager is responsible for managing, either directly or
| | | | |
| 40 | | Semi-Annual Report | | | November 30, 2013 |
Notes to Financial Statements
PIMCO Municipal Income Funds II
November 30, 2013 (unaudited)
4. Investment Manager/Sub-Adviser (continued)
through others selected by it, the Funds’ investment activities, business affairs and administrative matters. Pursuant to each Agreement, the Investment Manager receives an annual fee, payable monthly, at an annual rate of 0.65% of each Funds’ average daily net assets, inclusive of net assets attributable to any Preferred Shares that were outstanding.
The Investment Manager has retained the Sub-Adviser to manage the Funds’ investments. Subject to the supervision of the Investment Manager, the Sub-Adviser is responsible for making all of the Funds’ investment decisions. The Investment Manager, not the Funds, pays a portion of the fees it receives as Investment Manager to the Sub-Adviser in return for its services.
5. Investments in Securities
For the six months ended November 30, 2013, purchases and sales of investments, other than short-term securities were:
| | | | | | | | | | | | |
| | | Municipal II | | | California
Municipal II | | | New York
Municipal II | |
Purchases | | $ | 145,189,944 | | | $ | 48,669,565 | | | $ | 6,468,558 | |
Sales | | | 133,332,236 | | | | 45,136,467 | | | | 8,993,709 | |
6. Income Tax Information
At November 30, 2013, the aggregate cost basis and the net unrealized appreciation (depreciation) of investments for federal income tax purposes were:
| | | | | | | | | | | | | | | | |
| | | Federal Tax
Cost Basis | | | Unrealized
Appreciation | | | Unrealized
Depreciation | | | Net
Unrealized
Appreciation | |
Municipal II | | $ | 997,265,998 | | | $ | 49,182,306 | | | $ | 18,593,438 | | | $ | 30,588,868 | |
California Municipal II | | | 374,934,203 | | | | 31,795,678 | | | | 3,981,099 | | | | 27,814,579 | |
New York Municipal II | | | 183,210,931 | | | | 8,561,700 | | | | 5,787,022 | | | | 2,774,678 | |
Differences between book and tax cost basis were attributable to Inverse Floaters transactions and/or wash sale loss deferrals.
7. Auction-Rate Preferred Shares
Municipal II has 2,936 shares of Preferred Shares Series A, 2,936 shares of Preferred Shares Series B, 2,936 shares of Preferred Shares Series C, 2,936 shares of Preferred Shares Series D and 2,936 shares of Preferred Shares Series E outstanding, each with a liquidation preference of $25,000 per share plus any accumulated, unpaid dividends.
California Municipal II has 1,304 shares of Preferred Shares Series A, 1,304 shares of Preferred Shares Series B, 1,304 shares of Preferred Shares Series C, 1,304 shares of Preferred Shares Series D and 1,304 shares of
Preferred Shares Series E outstanding, each with a liquidation preference of $25,000 per share plus any accumulated, unpaid dividends.
New York Municipal II has 1,580 shares of Preferred Shares Series A and 1,580 shares of Preferred Shares Series B outstanding, each with a liquidation preference of $25,000 per share plus any accumulated, unpaid dividends.
Dividends are accumulated daily at an annual rate (that is typically re-set every seven days). Distributions of net realized capital gains, if any, are paid annually.
| | | | | | |
| November 30, 2013 | | | Semi-Annual Report | | | 41 | |
Notes to Financial Statements
PIMCO Municipal Income Funds II
November 30, 2013 (unaudited)
7. Auction-Rate Preferred Shares (continued)
For the six months ended November 30, 2013, the annualized dividend rates ranged from:
| | | | | | | | | | | | |
| | | | | | | | | | |
| | | High | | | Low | | | At November 30, 2013 | |
Municipal II: | | | | | | | | | | | | |
Series A | | | 0.246% | | | | 0.083% | | | | 0.122% | |
| | | |
Series B | | | 0.246% | | | | 0.083% | | | | 0.098% | |
| | | |
Series C | | | 0.246% | | | | 0.083% | | | | 0.098% | |
| | | |
Series D | | | 0.246% | | | | 0.083% | | | | 0.098% | |
| | | |
Series E | | | 0.246% | | | | 0.083% | | | | 0.098% | |
| | | |
California Municipal II: | | | | | | | | | | | | |
Series A | | | 0.246% | | | | 0.083% | | | | 0.122% | |
| | | |
Series B | | | 0.246% | | | | 0.083% | | | | 0.098% | |
| | | |
Series C | | | 0.246% | | | | 0.083% | | | | 0.098% | |
| | | |
Series D | | | 0.246% | | | | 0.083% | | | | 0.098% | |
| | | |
Series E | | | 0.246% | | | | 0.083% | | | | 0.098% | |
| | | |
New York Municipal II: | | | | | | | | | | | | |
Series A | | | 0.246% | | | | 0.083% | | | | 0.098% | |
| | | |
Series B | | | 0.246% | | | | 0.083% | | | | 0.098% | |
The Funds are subject to certain limitations and restrictions while Preferred Shares are outstanding. Failure to comply with these limitations and restrictions could preclude the Funds from declaring or paying any dividends or distributions to common shareholders or repurchasing common shares and/or could trigger the mandatory redemption of Preferred Shares at their liquidation preference plus any accumulated, unpaid dividends.
Preferred shareholders, who are entitled to one vote per share, generally vote together with the common shareholders but vote separately as a class to elect two Trustees and on certain matters adversely affecting the rights of the Preferred Shares.
Since mid-February 2008, holders of auction-rate preferred shares (“ARPS”) issued by the Funds have been directly impacted by a lack of liquidity, which has similarly affected ARPS
holders in many of the nation’s closed-end funds. Since then, regularly scheduled auctions for ARPS issued by the Funds have consistently “failed” because of insufficient demand (bids to buy shares) to meet the supply (shares offered for sale) at each auction. In a failed auction, ARPS holders cannot sell all, and may not be able to sell any, of their shares tendered for sale. While repeated auction failures have affected the liquidity for ARPS, they do not constitute a default or automatically alter the credit quality of the ARPS, and the ARPS holders have continued to receive dividends at the defined “maximum rate” equal to the higher of the 30-day “AA” Composite Commercial Paper Rate multiplied by 110% or the Taxable Equivalent of the Short-Term Municipal Obligations Rate-defined as 90% of the quotient of (A) the per annum rate expressed on an interest equivalent basis equal to the S&P Municipal Bond 7-day High Grade Rate Index divided by (B) 1.00 minus the Marginal Tax Rate (expressed as a decimal)
| | | | |
| 42 | | Semi-Annual Report | | | November 30, 2013 |
Notes to Financial Statements
PIMCO Municipal Income Funds II
November 30, 2013 (unaudited)
7. Auction-Rate Preferred Shares (continued)
multiplied by 110% (which is a function of short-term interest rates). As of November 30, 2013 the current multiplier for calculating the maximum rate was 110%. If the Funds’ ARPS auctions continue to fail and the “maximum
rate” payable on the ARPS rises as a result of changes in short-term interest rates, returns for the Funds’ common shareholders could be adversely affected.
8. Subsequent Events
In preparing these financial statements, the Funds’ management has evaluated events and transactions for potential recognition or disclosure through the date the financial statements were issued.
On December 2, 2013, the following dividends were declared to common shareholders payable January 2, 2014 to shareholders of record on December 12, 2013.
| | |
Municipal II | | $0.065 per common share |
California Municipal II | | $0.0625 per common share |
New York Municipal II | | $0.06625 per common share |
On January 2, 2014, the following dividends were declared to common shareholders payable February 3, 2014 to shareholders of record on January 13, 2014.
| | |
Municipal II | | $0.065 per common share |
California Municipal II | | $0.0625 per common share |
New York Municipal II | | $0.06625 per common share |
There were no other subsequent events identified that require recognition or disclosure.
| | | | | | |
| November 30, 2013 | | | Semi-Annual Report | | | 43 | |
Financial Highlights
PIMCO Municipal Income Fund II
For a common share outstanding throughout each period:
| | | | | | | | | | | | | | | | | | | | | | | | | | | | | | | | | | | | |
| | | | | Six Months
ended
November 30,
2013
(unaudited) | | | | | Year ended May 31, | |
| | | | | | | | 2013 | | | | | 2012 | | | | | 2011 | | | | | 2010 | | | | | 2009 | |
| Net asset value, beginning of period | | | | | $12.17 | | | | | | $11.91 | | | | | | $10.12 | | | | | | $10.77 | | | | | | $8.97 | | | | | | $13.86 | |
| Investment Operations: | | | | | | | | | | | | | | | | | | | | | | | | | | | | | | | | | | | | |
| Net investment income | | | | | 0.39 | | | | | | 0.82 | | | | | | 0.88 | | | | | | 0.91 | | | | | | 0.88 | | | | | | 1.02 | |
| Net realized and change in unrealized gain (loss) | | | | | (1.25 | ) | | | | | 0.23 | | | | | | 1.70 | | | | | | (0.75 | ) | | | | | 1.73 | | | | | | (4.94 | ) |
| Total from investment operations | | | | | (0.86 | ) | | | | | 1.05 | | | | | | 2.58 | | | | | | 0.16 | | | | | | 2.61 | | | | | | (3.92 | ) |
| Dividends on Preferred Shares from Net Investment Income | | | | | – | † | | | | | (0.01 | ) | | | | | (0.01 | ) | | | | | (0.03 | ) | | | | | (0.03 | ) | | | | | (0.19 | ) |
| Net increase (decrease) in net assets applicable to common shareholders resulting from investment operations | | | | | (0.86 | ) | | | | | 1.04 | | | | | | 2.57 | | | | | | 0.13 | | | | | | 2.58 | | | | | | (4.11 | ) |
| Dividends to Common Shareholders from Net Investment Income | | | | | (0.39 | ) | | | | | (0.78 | ) | | | | | (0.78 | ) | | | | | (0.78 | ) | | | | | (0.78 | ) | | | | | (0.78 | ) |
| Net asset value, end of period | | | | | $10.92 | | | | | | $12.17 | | | | | | $11.91 | | | | | | $10.12 | | | | | | $10.77 | | | | | | $8.97 | |
| Market price, end of period | | | | | $10.56 | | | | | | $12.19 | | | | | | $12.54 | | | | | | $10.45 | | | | | | $11.12 | | | | | | $9.56 | |
| Total Investment Return (1) | | | | | (10.22 | )% | | | | | 3.41 | % | | | | | 28.70 | % | | | | | 1.30 | % | | | | | 25.49 | % | | | | | (26.46 | )% |
| RATIOS/SUPPLEMENTAL DATA: | | | | | | | | | | | | | | | | | | | | | | | | | | | | | | | | | | | | |
| Net assets, applicable to common shareholders, end of period (000s) | | | | | $666,698 | | | | | | $741,368 | | | | | | $722,161 | | | | | | $610,800 | | | | | | $645,589 | | | | | | $534,046 | |
| Ratio of expenses to average net assets, including interest expense (2)(4) | | | | | 1.23 | %(6) | | | | | 1.16 | %(3)(5) | | | | | 1.19 | %(3)(5) | | | | | 1.37 | %(3) | | | | | 1.38 | %(3)(5) | | | | | 1.73 | %(3)(5) |
| Ratio of expenses to average net assets, excluding interest expense (2) | | | | | 1.18 | %(6) | | | | | 1.11 | %(3)(5) | | | | | 1.11 | %(3)(5) | | | | | 1.24 | %(3) | | | | | 1.24 | %(3)(5) | | | | | 1.35 | %(3)(5) |
| Ratio of net investment income to average net assets (2) | | | | | 7.21 | %(6) | | | | | 6.74 | %(5) | | | | | 8.04 | %(5) | | | | | 8.80 | % | | | | | 8.77 | %(5) | | | | | 10.23 | %(5) |
| Preferred shares asset coverage per share | | | | | $70,415 | | | | | | $75,501 | | | | | | $74,192 | | | | | | $66,606 | | | | | | $68,974 | | | | | | $61,376 | |
| Portfolio turnover rate | | | | | 13 | % | | | | | 16 | % | | | | | 26 | % | | | | | 21 | % | | | | | 6 | % | | | | | 42 | % |
| † | | Less than $(0.005) per common share. | |
| (1) | | Total investment return is calculated assuming a purchase of a common share at the market price on the first day and a sale of a common share at the market price on the last day of each period reported. Dividends and distributions, if any, are assumed, for purposes of this calculation, to be reinvested at prices obtained under the Fund’s dividend reinvestment plan. Total investment return does not reflect brokerage commissions or sales charges in connection with the purchase or sale of Fund shares. Total investment return for a period of less than one year is not annualized. | |
| (2) | | Calculated on the basis of income and expenses applicable to both common and preferred shares relative to the average net assets of common shareholders. | |
| (3) | | Inclusive of expenses offset by custody credits earned on cash balances at the custodian bank (See note 1(k) in Notes to Financial Statements). | |
| (4) | | Interest expense relates to the liability for Floating Rate Notes issued in connection with Inverse Floater transactions and/or participation in reverse repurchase agreement transactions. | |
| (5) | | During the periods indicated above, the Investment Manager waived a portion of its investment management fee. The effect of such waiver relative to the average net assets of common shareholders was 0.006%, 0.07%, 0.004% and 0.10% for the years ended May 31, 2013, May 31, 2012, May 31, 2010 and May 31, 2009, respectively. | |
| | | | |
| 44 | | Semi-Annual Report | | | November 30, 2013 | See accompanying Notes to Financial Statements |
Financial Highlights
PIMCO California Municipal Income Fund II
For a common share outstanding throughout each period:
| | | | | | | | | | | | | | | | | | | | | | | | | | | | | | | | | | | | |
| | | | | Six Months
ended
November 30, 2013
(unaudited) | | | | | Year ended May 31, | |
| | | | | | | | 2013 | | | | | 2012 | | | | | 2011 | | | | | 2010 | | | | | 2009 | |
| Net asset value, beginning of period | | | | | $8.93 | | | | | | $8.65 | | | | | | $7.38 | | | | | | $8.11 | | | | | | $7.48 | | | | | | $13.34 | |
| Investment Operations: | | | | | | | | | | | | | | | | | | | | | | | | | | | | | | | | | | | | |
| Net investment income | | | | | 0.34 | | | | | | 0.69 | | | | | | 0.71 | | | | | | 0.74 | | | | | | 0.76 | | | | | | 0.85 | |
| Net realized and change in unrealized gain (loss) | | | | | (1.16 | ) | | | | | 0.35 | | | | | | 1.32 | | | | | | (0.70 | ) | | | | | 0.67 | | | | | | (5.69 | ) |
| Total from investment operations | | | | | (0.82 | ) | | | | | 1.04 | | | | | | 2.03 | | | | | | 0.04 | | | | | | 1.43 | | | | | | (4.84 | ) |
| Dividends on Preferred Shares from Net Investment Income | | | | | – | † | | | | | (0.01 | ) | | | | | (0.01 | ) | | | | | (0.02 | ) | | | | | (0.03 | ) | | | | | (0.18 | ) |
| Net increase (decrease) in net assets applicable to common shareholders resulting from investment operations | | | | | (0.82 | ) | | | | | 1.03 | | | | | | 2.02 | | | | | | 0.02 | | | | | | 1.40 | | | | | | (5.02 | ) |
| Dividends and Distributions to Common Shareholders from: | | | | | | | | | | | | | | | | | | | | | | | | | | | | | | | | | | | | |
| Net investment income | | | | | (0.38 | ) | | | | | (0.68 | ) | | | | | (0.70 | ) | | | | | (0.75 | ) | | | | | (0.77 | ) | | | | | (0.80 | ) |
| Return of capital | | | | | – | | | | | | (0.07 | ) | | | | | (0.05 | ) | | | | | – | | | | | | – | | | | | | (0.04 | ) |
| Total dividends and distributions to shareholders | | | | | (0.38 | ) | | | | | (0.75 | ) | | | | | (0.75 | ) | | | | | (0.75 | ) | | | | | (0.77 | ) | | | | | (0.84 | ) |
| Net asset value, end of period | | | | | $7.73 | | | | | | $8.93 | | | | | | $8.65 | | | | | | $7.38 | | | | | | $8.11 | | | | | | $7.48 | |
| Market price, end of period | | | | | $9.15 | | | | | | $10.51 | | | | | | $10.15 | | | | | | $9.21 | | | | | | $9.33 | | | | | | $8.78 | |
| Total Investment Return (1) | | | | | (9.22 | )% | | | | | 11.41 | % | | | | | 19.59 | % | | | | | 7.53 | % | | | | | 16.44 | % | | | | | (32.26 | )% |
| RATIOS/SUPPLEMENTAL DATA: | | | | | | | | | | | | | | | | | | | | | | | | | | | | | | | | | | | | |
| Net assets, applicable to common shareholders, end of period (000s) | | | | | $244,807 | | | | | | $282,181 | | | | | | $272,570 | | | | | | $231,486 | | | | | | $252,816 | | | | | | $231,415 | |
| Ratio of expenses to average net assets, including interest expense (2)(4) | | | | | 1.40 | %(6) | | | | | 1.34 | %(3)(5) | | | | | 1.44 | %(3)(5) | | | | | 1.55 | %(3) | | | | | 1.56 | %(3)(5) | | | | | 3.15 | %(3)(5) |
| Ratio of expenses to average net assets, excluding interest expense (2) | | | | | 1.32 | %(6) | | | | | 1.23 | %(3)(5) | | | | | 1.24 | %(3)(5) | | | | | 1.37 | %(3) | | | | | 1.33 | %(3)(5) | | | | | 1.43 | %(3)(5) |
| Ratio of net investment income to average net assets (2) | | | | | 8.59 | %(6) | | | | | 7.65 | %(5) | | | | | 8.99 | %(5) | | | | | 9.73 | % | | | | | 9.78 | %(5) | | | | | 9.31 | %(5) |
| Preferred shares asset coverage per share | | | | | $62,547 | | | | | | $68,279 | | | | | | $66,804 | | | | | | $60,503 | | | | | | $63,773 | | | | | | $60,490 | |
| Portfolio turnover rate | | | | | 10 | % | | | | | 13 | % | | | | | 25 | % | | | | | 15 | % | | | | | 9 | % | | | | | 62 | % |
| † | | Less than $(0.005) per common share. | |
| (1) | | Total investment return is calculated assuming a purchase of a common share at the market price on the first day and a sale of a common share at the market price on the last day of each period reported. Dividends and distributions, if any, are assumed, for purposes of this calculation, to be reinvested at prices obtained under the Fund’s dividend reinvestment plan. Total investment return does not reflect brokerage commissions or sales charges in connection with the purchase or sale of Fund shares. Total investment return for a period of less than one year is not annualized. | |
| (2) | | Calculated on the basis of income and expenses applicable to both common and preferred shares relative to the average net assets of common shareholders. | |
| (3) | | Inclusive of expenses offset by custody credits earned on cash balances at the custodian bank (See note 1(k) in Notes to Financial Statements). | |
| (4) | | Interest expense relates to the liability for Floating Rate Notes issued in connection with Inverse Floater transactions and/or participation in reverse repurchase agreement transactions. | |
| (5) | | During the periods indicated above, the Investment Manager waived a portion of its investment management fee. The effect of such waiver relative to the average net assets of common shareholders was 0.006%, 0.08%, 0.004% and 0.10% for the years ended May 31, 2013, May 31, 2012, May 31, 2010 and May 31, 2009, respectively. | |
| | | | | | |
| See accompanying Notes to Financial Statements | November 30, 2013 | | | Semi-Annual Report | | | 45 | |
Financial Highlights
PIMCO New York Municipal Income Fund II
For a common share outstanding throughout each period:
| | | | | | | | | | | | | | | | | | | | | | | | | | | | | | | | | | | | |
| | | | | Six Months
ended
November 30, 2013
(unaudited) | | | | | Year ended May 31, | |
| | | | | | | | 2013 | | | | | 2012 | | | | | 2011 | | | | | 2010 | | | | | 2009 | |
| Net asset value, beginning of period | | | | | $11.32 | | | | | | $11.37 | | | | | | $10.10 | | | | | | $10.90 | | | | | | $9.56 | | | | | | $13.67 | |
| Investment Operations: | | | | | | | | | | | | | | | | | | | | | | | | | | | | | | | | | | | | |
| Net investment income | | | | | 0.37 | | | | | | 0.79 | | | | | | 0.85 | | | | | | 0.88 | | | | | | 0.98 | | | | | | 1.00 | |
| Net realized and change in unrealized gain (loss) | | | | | (1.28 | ) | | | | | (0.02 | ) | | | | | 1.24 | | | | | | (0.85 | ) | | | | | 1.19 | | | | | | (4.13 | ) |
| Total from investment operations | | | | | (0.91 | ) | | | | | 0.77 | | | | | | 2.09 | | | | | | 0.03 | | | | | | 2.17 | | | | | | (3.13 | ) |
| Dividends on Preferred Shares from Net Investment Income | | | | | – | † | | | | | (0.02 | ) | | | | | (0.02 | ) | | | | | (0.03 | ) | | | | | (0.03 | ) | | | | | (0.19 | ) |
| Net increase (decrease) in net assets applicable to common shareholders resulting from investment operations | | | | | (0.91 | ) | | | | | 0.75 | | | | | | 2.07 | | | | | | 0.00 | | | | | | 2.14 | | | | | | (3.32 | ) |
| Dividends to Common Shareholders from Net Investment Income | | | | | (0.40 | ) | | | | | (0.80 | ) | | | | | (0.80 | ) | | | | | (0.80 | ) | | | | | (0.80 | ) | | | | | (0.79 | ) |
| Net asset value, end of period | | | | | $10.01 | | | | | | $11.32 | | | | | | $11.37 | | | | | | $10.10 | | | | | | $10.90 | | | | | | $9.56 | |
| Market price, end of period | | | | | $10.41 | | | | | | $12.01 | | | | | | $12.29 | | | | | | $10.92 | | | | | | $11.42 | | | | | | $10.26 | |
| Total Investment Return (1) | | | | | (9.93 | )% | | | | | 4.14 | % | | | | | 20.97 | % | | | | | 3.03 | % | | | | | 19.92 | % | | | | | (22.95 | )% |
| RATIOS/SUPPLEMENTAL DATA: | | | | | | | | | | | | | | | | | | | | | | | | | | | | | | | | | | | | |
| Net assets, applicable to common shareholders, end of period (000s) | | | | | $109,677 | | | | | | $123,685 | | | | | | $123,667 | | | | | | $109,256 | | | | | | $117,161 | | | | | | $102,126 | |
| Ratio of expenses to average net assets, including interest expense (2)(4) | | | | | 1.52 | %(6) | | | | | 1.42 | %(3)(5) | | | | | 1.45 | %(3)(5) | | | | | 1.55 | %(3) | | | | | 1.53 | %(3)(5) | | | | | 1.88 | %(3)(5) |
| Ratio of expenses to average net assets, excluding interest expense (2) | | | | | 1.45 | %(6) | | | | | 1.33 | %(3)(5) | | | | | 1.36 | %(3)(5) | | | | | 1.44 | %(3) | | | | | 1.43 | %(3)(5) | | | | | 1.51 | %(3)(5) |
| Ratio of net investment income to average net assets (2) | | | | | 7.38 | %(6) | | | | | 6.78 | %(5) | | | | | 7.86 | %(5) | | | | | 8.46 | % | | | | | 9.51 | %(5) | | | | | 9.63 | %(5) |
| Preferred shares asset coverage per share | | | | | $59,708 | | | | | | $64,140 | | | | | | $64,135 | | | | | | $59,574 | | | | | | $62,073 | | | | | | $57,316 | |
| Portfolio turnover rate | | | | | 3 | % | | | | | 25 | % | | | | | 18 | % | | | | | 7 | % | | | | | 5 | % | | | | | 33 | % |
| † | | Less than $(0.005) per common share. | |
| (1) | | Total investment return is calculated assuming a purchase of a common share at the market price on the first day and a sale of a common share at the market price on the last day of each period reported. Dividends and distributions, if any, are assumed, for purposes of this calculation, to be reinvested at prices obtained under the Fund’s dividend reinvestment plan. Total investment return does not reflect brokerage commissions or sales charges in connection with the purchase or sale of Fund shares. Total investment return for a period of less than one year is not annualized. | |
| (2) | | Calculated on the basis of income and expenses applicable to both common and preferred shares relative to the average net assets of common shareholders. | |
| (3) | | Inclusive of expenses offset by custody credits earned on cash balances at the custodian bank (See note 1(k) in Notes to Financial Statements). | |
| (4) | | Interest expense relates to the liability for Floating Rate Notes issued in connection with Inverse Floater transactions and/or participation in reverse repurchase agreement transactions. | |
| (5) | | During the periods indicated above, the Investment Manager waived a portion of its investment management fee. The effect of such waiver relative to the average net assets of common shareholders was 0.006%, 0.08%, 0.004% and 0.10% for the years ended May 31, 2013, May 31, 2012, May 31, 2010 and May 31, 2009, respectively. | |
| | | | |
| 46 | | Semi-Annual Report | | | November 30, 2013| See accompanying Notes to Financial Statements |
Annual Shareholder Meeting Results/Proxy Voting Policies & Procedures
PIMCO Municipal Income Funds II (unaudited)
Annual Shareholder Meeting Results:
The Funds held their annual meeting of shareholder on December 18, 2013. Common/Preferred shareholders voted as indicated below:
| | | | | | | | |
| | | Affirmative | | | Withheld
Authority | |
Municipal II | | | | | | | | |
| | |
Re-election of Deborah A. DeCotis — Class II to serve until
2016-2017 fiscal year | | | 51,489,961 | | | | 4,273,544 | |
| | |
Re-election of James A. Jacobson* — Class II to serve until
2016-2017 fiscal year | | | 11,484 | | | | 354 | |
California Municipal II | | | | | | | | |
| | |
Re-election of Deborah A. DeCotis — Class II to serve until
2016-2017 fiscal year | | | 25,105,447 | | | | 1,809,442 | |
| | |
Re-election of James A. Jacobson* — Class II to serve until
2016-2017 fiscal year | | | 3,971 | | | | 274 | |
New York Municipal II | | | | | | | | |
| | |
Re-election of Deborah A. DeCotis — Class II to serve until
2016-2017 fiscal year | | | 9,324,548 | | | | 562,894 | |
| | |
Re-election of James A. Jacobson* — Class II to serve until
2016-2017 fiscal year | | | 2,445 | | | | 58 | |
The other members of the Board of Trustees at the time of the meeting, namely, Messrs. Bradford K. Gallagher, Hans W. Kertess*, William B. Ogden, IV, John C. Maney†, and Alan Rappaport continued to serve as Trustees of the Funds.
| * | | Preferred Shares Trustee | |
Proxy Voting Policies & Procedures:
A description of the policies and procedures that the Funds adopted to determine how to vote proxies relating to portfolio securities and information about how the Funds voted proxies relating to portfolio securities held during the most recent twelve month period ended
June 30 is available (i) without charge, upon request, by calling the Funds’ shareholder servicing agent at (800) 254-5197; (ii) on the Funds’ website at us.allianzgi.com/closedendfunds; and (iii) on the Securities and Exchange Commission website at www.sec.gov.
| | | | | | |
| November 30, 2013 | | | Semi-Annual Report | | | 47 | |
Matters Relating to the Trustees’ Consideration of the Investment Management & Portfolio Management Agreements
PIMCO Municipal Income Funds II (unaudited)
The Investment Company Act of 1940, as amended, requires that both the full Board of Trustees (the “Trustees”) and a majority of the non-interested Trustees (the “Independent Trustees”), voting separately, approve each Fund’s Management Agreement with the Investment Manager (the “Advisory Agreements”) and Portfolio Management Agreement between the Investment Manager and the Sub-Adviser (the “Sub-Advisory Agreements,” and, together with the Advisory Agreements, the “Agreements”). The Trustees met telephonically on June 10, 2013 and in person on June 25, 2013 (the “contract review meetings”) for the specific purpose of considering whether to approve the continuation of the Advisory Agreements and the Sub-Advisory Agreements. The Independent Trustees were assisted in their evaluation of the Agreements by independent legal counsel, from whom they received separate legal advice and with whom they met separately from Fund management during the contract review meetings.
In connection with their deliberations regarding the continuation of the Agreements, the Trustees, including the Independent Trustees, considered such information and factors as they believed, in light of the legal advice furnished to them and their own business judgment, to be relevant. As described below, the Trustees considered the nature, quality, and extent of the various investment management, administrative and other services performed by the Investment Manager or the Sub-Adviser under the applicable Agreement.
In connection with their contract review meetings, the Trustees received and relied upon materials provided by the Investment Manager which included, among other items: (i) information provided by Lipper Inc. (“Lipper”), an independent third party, on the total return investment performance (based on net assets) of the Funds for various time
periods, the investment performance of a group of funds with investment classifications/objectives comparable to those of the Funds identified by Lipper (the “Lipper performance universe”) and the performance of an applicable benchmark index, (ii) information provided by Lipper on the Funds’ management fees and other expenses and the management fees and other expenses of comparable funds identified by Lipper, (iii) information regarding the investment performance and fees for open-end funds managed by the Sub-Adviser with similar investment objectives and policies to those of the Funds, (iv) the estimated profitability to the Investment Manager from its relationship with the Funds for the one year period ended December 31, 2012, (v) descriptions of various functions performed by the Investment Manager and the Sub-Adviser for the Funds, such as portfolio management, compliance monitoring and portfolio trading practices, and (vi) information regarding the overall organization of the Investment Manager and the Sub-Adviser, including information regarding senior management, portfolio managers and other personnel providing investment management, administrative and other services to the Funds.
The Trustees’ conclusions as to the continuation of the Agreements were based on a comprehensive consideration of all information provided to the Trustees and were not the result of any single factor. Some of the factors that figured particularly in the Trustees’ deliberations are described below, although individual Trustees may have evaluated the information presented differently from one another, attributing different weights to various factors. The Trustees recognized that the fee arrangements for the Funds are the result of review and discussion in prior years between the Independent Trustees and the Investment Manager, that certain aspects of such arrangements may receive greater scrutiny in some years than in others, and that the
| | | | |
| 48 | | Semi-Annual Report | | | November 30, 2013 |
Matters Relating to the Trustees’ Consideration of the Investment Management & Portfolio Management Agreements
PIMCO Municipal Income Funds II (unaudited)
Trustees’ conclusions may be based, in part, on their consideration of these same arrangements during the course of the year and in prior years.
Fund-specific performance results reviewed by the Trustees are discussed below. The comparative performance information was prepared and provided by Lipper and was not independently verified by the Trustees. Due to the passage of time, these performance results may differ from the performance results for more recent periods, including those shown elsewhere in this report. The Trustees reviewed, among other information, comparative information showing performance of each Fund against its Lipper performance universe for the one-year, three-year, five-year and ten-year periods ended March 31, 2013.
In addition, it was noted that the Trustees considered matters bearing on the Funds and their advisory arrangements at their meetings throughout the year, including a review of performance data at each regular meeting.
As part of their review, the Trustees examined the Investment Manager’s and the Sub-Adviser’s abilities to provide high quality investment management and other services to the Funds. Among other information, the Trustees considered the investment philosophy and research and decision-making processes of the Sub-Adviser; the experience of key advisory personnel of the Sub-Adviser responsible for portfolio management of the Funds; the ability of the Investment Manager and the Sub-Adviser to attract and retain capable personnel; and the capability of the senior management and staff of the Investment Manager and the Sub-Adviser. In addition, the Trustees reviewed the quality of the Investment Manager’s and the Sub-Adviser’s services with respect to regulatory compliance and compliance with the investment policies of the Funds; the nature and quality of certain administrative services
the Investment Manager is responsible for providing to the Funds; and conditions that might affect the Investment Manager’s or the Sub-Adviser’s ability to provide high quality services to the Funds in the future under the Agreements, including each organization’s respective financial condition and operational stability. Based on the foregoing, the Trustees concluded that the Sub-Adviser’s investment process, research capabilities and philosophy were well suited to each Fund given its investment objective and policies, and that the Investment Manager and the Sub-Adviser would be able to continue to meet any reasonably foreseeable obligations under the Agreements.
In assessing the reasonableness of each Fund’s fees under the Agreements, the Trustees considered, among other information, each Fund’s management fee and its total expense ratio as a percentage of average net assets attributable to common shares and as a percentage of total managed assets (including assets attributable to common shares and preferred shares outstanding combined), and the management fee and total expense ratios of a peer expense group of funds based on information provided by Lipper. The Fund-specific fee and expense results discussed below were prepared and provided by Lipper and were not independently verified by the Trustees.
The Trustees specifically took note of how each Fund compared to its Lipper peers as to performance, management fee expense and total net expenses. The Trustees noted that while the Funds are not charged separate administration fees (recognizing that their management fees include a component for administrative services), it was not clear in all cases whether the peer funds in the Lipper category were separately charged such a fee by their investment managers, so that the total expense ratio (rather than any individual
| | | | | | |
| November 30, 2013 | | | Semi-Annual Report | | | 49 | |
Matters Relating to the Trustees’ Consideration of the Investment Management & Portfolio Management Agreements
PIMCO Municipal Income Funds II (unaudited)
expense component) represented the most relevant comparison. It was noted that the total expense ratio comparisons reflect the effect of expense waivers/reimbursements.
Municipal II
The Trustees noted that the expense group for the Fund provided by Lipper consisted of a total of eleven closed-end funds, including the Fund and two other peer Funds in the Allianz fund complex. The trustees noted that only leveraged closed-end funds were considered for inclusion in the group. The Trustees also noted that average net assets of the common shares of the eleven funds in the expense group ranged from $277.2 million to $664.6 million, and that no other fund was larger in asset size than the Fund. The Trustees also noted that the Fund was ranked sixth out of eleven funds in the expense group for total expense ratio based on common share assets, third out of eleven funds in the expense group for total expense ratio based on common share and leveraged assets combined, seventh out of eleven funds in actual management fees based on common share assets and in actual management fees based on common share and sixth out of eleven funds leveraged assets combined (with funds ranked first having the lowest fees/expenses and ranked eleventh having the highest fees/expenses in the expense group).
With respect to Fund total return performance relative to its Lipper performance universe (based on net asset value), the Trustees noted that the Fund had first quintile performance for the one-year and three-year periods and fifth quintile performance for the five-year and ten-year periods ended March 31, 2013.
California Municipal II
The Trustees noted that the expense group for the Fund provided by Lipper consisted of a total of nine closed-end funds, including the Fund and two other peer Funds in the Allianz fund complex. The trustees noted that only
leveraged closed-end funds were considered for inclusion in the group. The Trustees also noted that average net assets of the common shares of the nine funds in the expense group ranged from $33.1 million to $335.7 million, and that two of the funds are larger in asset size than the Fund. The Trustees also noted that the Fund was ranked fifth out of nine funds in the expense group for total expense ratio based on common share assets, fourth out of nine funds in the expense group for total expense ratio based on common share and leveraged assets combined, sixth out of nine funds in actual management fees based on common share assets and fourth out of nine funds in actual management fees based on common share and leveraged assets combined (with funds ranked first having the lowest fees/expenses and ranked ninth having the highest fees/expenses in the expense group).
With respect to Fund total return performance relative to its Lipper performance universe (based on net asset value), the Trustees noted that the Fund had first quintile performance for the one-year and three-year periods and fifth quintile performance for the five-year and ten-year periods ended March 31, 2013.
New York Municipal II
The Trustees noted that the expense group for the Fund provided by Lipper consisted of a total of eight closed-end funds, including the Fund and two other peer Funds in the Allianz fund complex. The Trustees noted that only leveraged closed-end funds were considered for inclusion in the group. The Trustees also noted that average net assets of the common shares of the eight funds in the expense group ranged from $51.7 million to $219.0 million, and that two of the funds are larger in asset size than the Fund. The Trustees also noted that the Fund was ranked third out of eight funds in the expense group for total expense ratio based on common share assets, second out of eight funds in the expense group for total expense
| | | | |
| 50 | | Semi-Annual Report | | | November 30, 2013 |
Matters Relating to the Trustees’ Consideration of the Investment Management & Portfolio Management Agreements
PIMCO Municipal Income Funds II (unaudited)
ratio based on common share and leveraged assets combined, seventh out of eight funds in actual management fees based on common share assets and third out of eight funds in actual management fees based on common share and leveraged assets combined (with funds ranked first having the lowest fees/expenses and ranked eighth having the highest fees/expenses in the expense group).
With respect to Fund total return performance relative to its Lipper performance universe (based on net asset value), the Trustees noted that the Fund had first quintile performance for the one-year and three-year periods and fifth quintile performance for the five-year and ten-year periods ended March 31, 2013.
In addition to their review of Fund performance based on net asset value, the Trustees also considered the market value performance of each Fund’s common shares and related share price premium and/or discount information based on the materials provided by Lipper and management.
The Trustees also considered the management fees charged by the Sub-Adviser to open-end funds with similar investment objectives and strategies to those of the Funds. The Trustees noted that the management fees paid by the Funds are higher than the fees paid by the open-end funds offered for comparison but were advised by the Sub-Adviser that there are additional portfolio management challenges in managing the Funds, such as those associated with the use of leverage and attempting to meet a regular dividend. The Trustees were advised that the Sub-Adviser does not manage any institutional or separate accounts with investment strategies and return profiles similar to those of the Funds.
The Trustees also took into account that the Funds have preferred shares outstanding, which increases the amount of fees received by
the Investment Manager and the Sub-Adviser under the Agreements (because the fees are calculated based on each Fund’s net assets, including any assets attributable to preferred shares). In this regard, the Trustees took into account that the Investment Manager and the Sub-Adviser have a financial incentive for the Funds to continue to have preferred shares outstanding, which may create a conflict of interest between the Investment Manager and the Sub-Adviser, on the one hand, and the Funds’ common shareholders, on the other. In this regard, the Trustees considered information provided by the Investment Manager and the Sub-Adviser and related presentations as to why each Fund’s use of preferred shares continues to be appropriate and in the best interests of the respective Fund’s common shareholders under current market conditions.
Based on a profitability analysis provided by the Investment Manager, the Trustees also considered the estimated profitability to the Investment Manager from its relationship with each Fund and determined that such profitability did not appear to be excessive.
The Trustees also took into account that, as closed-end investment companies, the Funds do not currently intend to raise additional assets, so the assets of the Funds will grow (if at all) only through the investment performance of each Fund. Therefore, the Trustees did not consider potential economies of scale as a principal factor in assessing the fee rates payable under the Agreements.
Additionally, the Trustees considered so-called “fall-out benefits” to the Investment Manager and the Sub-Adviser, such as reputational value derived from serving as Investment Manager and Sub-Adviser to the Funds.
After reviewing these and other factors described herein, the Trustees concluded, with
| | | | | | |
| November 30, 2013 | | | Semi-Annual Report | | | 51 | |
Matters Relating to the Trustees’ Consideration of the Investment Management & Portfolio Management Agreements
PIMCO Municipal Income Funds II (unaudited)
respect to each Fund, within the context of their overall conclusions regarding the Agreements and based on the information provided and related representations made by management, that they were satisfied with the Investment Manager’s and the Sub-Adviser’s responses and efforts relating to the investment performance of the Fund. The Trustees also concluded that the fees payable under each Agreement represent reasonable compensation in light of
the nature, extent and quality of services provided by the Investment Manager or Sub-Adviser, as the case may be. Based on their evaluation of factors that they deemed to be material, including those factors described above, the Trustees, including the Independent Trustees, unanimously concluded that the continuation of the Agreements was in the interests of each Fund and its shareholders, and should be approved.
| | | | |
| 52 | | Semi-Annual Report | | | November 30, 2013 |
Trustees
Hans W. Kertess
Chairman of the Board of Trustees
Deborah A. DeCotis
Bradford K. Gallagher
James A. Jacobson
John C. Maney
William B. Ogden, IV
Alan Rappaport
Fund Officers
Brian S. Shlissel
President & Chief Executive Officer
Lawrence G. Altadonna
Treasurer, Principal Financial & Accounting Officer
Thomas J. Fuccillo
Vice President, Secretary & Chief Legal Officer
Scott Whisten
Assistant Treasurer
Richard J. Cochran
Assistant Treasurer
Orhan Dzemaili
Assistant Treasurer
Thomas L. Harter
Chief Compliance Officer
Lagan Srivastava
Assistant Secretary
Investment Manager
Allianz Global Investors Fund Management LLC
1633 Broadway
New York, NY 10019
Sub-Adviser
Pacific Investment Management Company LLC
840 Newport Center Drive
Newport Beach, CA 92660
Custodian & Accounting Agent
State Street Bank & Trust Co.
225 Franklin Street
Boston, MA 02110
Transfer Agent, Dividend Paying Agent and Registrar
American Stock Transfer & Trust Company, LLC
6201 15th Avenue
Brooklyn, NY 11219
Independent Registered Public Accounting Firm
PricewaterhouseCoopers LLP
300 Madison Avenue
New York, NY 10017
Legal Counsel
Ropes & Gray LLP
Prudential Tower
800 Boylston Street
Boston, MA 02199
This report, including the financial information herein, is transmitted to the shareholders of PIMCO Municipal Income Fund II, PIMCO California Municipal Income Fund II and PIMCO New York Municipal Income Fund II for their information. It is not a prospectus, circular or representation intended for use in the purchase of shares of the Funds or any securities mentioned in this report.
The financial information included herein is taken from the records of the Funds without examination by an independent registered public accounting firm, who did not express an opinion herein.
Notice is hereby given in accordance with Section 23(c) of the Investment Company Act of 1940, as amended, that from time to time the Funds may purchase their common shares in the open market.
The Funds file their complete schedule of portfolio holdings with the Securities and Exchange Commission (“SEC”) for the first and third quarters of their fiscal year on Form N-Q. Each Fund’s Form N-Q is available on the SEC’s website at www.sec.gov and may be reviewed and copied at the SEC’s Public Reference Room in Washington, D.C. Information on the operation of the Public Reference Room may be obtained by calling (800) SEC-0330. The information on Form N-Q is also available on the Funds’ website at us.allianzgi.com/closedendfunds.
Information on the Funds is available at us.allianzgi.com/closedendfunds or by calling the Funds’ shareholder servicing agent at (800) 254-5197.
us.allianzgi.com
Receive this report electronically and eliminate paper mailings.
To enroll, go to us.allianzgi.com/edelivery.
AGI-2013-12-04-8328
Not required in this filing.
| ITEM 3. | AUDIT COMMITTEE FINANCIAL EXPERT |
Not required in this filing.
| ITEM 4. | PRINCIPAL ACCOUNTANT FEES AND SERVICES |
Not required in this filing
| ITEM 5. | AUDIT COMMITTEE OF LISTED REGISTRANT |
Not required in this filing
| ITEM 6. | SCHEDULE OF INVESTMENTS |
| | (a) | The registrant’s Schedule of Investments is included as part of the report to shareholders filed under Item 1 of this form. |
| ITEM 7. | DISCLOSURE OF PROXY VOTING POLICIES AND PROCEDURES FOR CLOSED-END MANAGEMENT INVESTMENT COMPANIES |
Not required in this filing
| ITEM 8. | PORTFOLIO MANAGERS OF CLOSED-END MANAGEMENT INVESTMENT COMPANIES |
Not required in this filing
| ITEM 9. | PURCHASES OF EQUITY SECURITIES BY CLOSED-END MANAGEMENT INVESTMENT COMPANY AND AFFILIATED COMPANIES |
None
| ITEM 10. | SUBMISSION OF MATTERS TO A VOTE OF SECURITY HOLDERS |
There have been no material changes to the procedures by which shareholders may recommend nominees to the Fund’s Board of Trustees since the Fund last provided disclosure in response to this item.
| ITEM 11. | CONTROLS AND PROCEDURES |
| | (a) | The registrant’s President and Treasurer, Principal Financial & Accounting Officer have concluded that the registrant’s disclosure controls and procedures (as defined in Rule 30a-3(c) under the Act (17 CFR 270.30a-3(c))) are effective based on their evaluation of these controls and procedures as of a date within 90 days of the filing date of this document. |
| | (b) | There were no significant changes in the registrant’s internal control over financial reporting (as defined in Rule 30a-3(d) under the Act (17 CFR 270.30a-3(d))) that occurred during the second fiscal quarter of the period covered by this report that has materially affected, or is reasonably likely to materially affect, the registrant’s internal control over financial reporting. |
| | (a) | (1) Not required in this filing. |
| | (a) | (2) Exhibit 99.302 Cert. — Certification pursuant to Section 302 of the Sarbanes-Oxley Act of 2002 |
| | (b) | Exhibit 99.906 Cert. — Certification pursuant to Section 906 of the Sarbanes-Oxley Act of 2002 |
Signatures
Pursuant to the requirements of the Securities Exchange Act of 1934 and the Investment Company Act of 1940, the registrant has duly caused this report to be signed on its behalf by the undersigned, thereunto duly authorized.
(Registrant) PIMCO Municipal Income Fund II
| | |
| By | | /s/ Brian S. Shlissel |
| | Brian S. Shlissel President & Chief Executive Officer |
Date: January 29, 2014
| | |
| By | | /s/ Lawrence G. Altadonna |
| | Lawrence G. Altadonna Treasurer, Principal Financial & Accounting Officer |
Date: January 29, 2014
Pursuant to the requirements of the Securities Exchange Act of 1934 and the Investment Company Act of 1940, this report has been signed below by the following persons on behalf of the registrant and in the capacities and on the dates indicated.
| | |
| By | | /s/ Brian S. Shlissel |
| | Brian S. Shlissel President & Chief Executive Officer |
Date: January 29, 2014
| | |
| By | | /s/ Lawrence G. Altadonna |
| | Lawrence G. Altadonna Treasurer, Principal Financial & Accounting Officer |
Date: January 29, 2014