UNITED STATES
SECURITIES AND EXCHANGE COMMISSION
Washington, D.C. 20549
|
| [X] | | Quarterly Report Pursuant to Section 13 or 15(d) of the Securities Exchange Act of 1934 |
| | | For the quarterly period endedJune 30, 2005 |

Commission File No.000-50258
|
Belrose Capital Fund LLC
(Exact name of registrant as specified in its charter)
|

None
(Former Name, Former Address and Former Fiscal Year, if changed since last report)
|
Indicate by check mark whether the registrant (1) has filed all reports required to be filed by Section 13 or 15(d) of the Securities Exchange Act of 1934 during the preceding 12 months (or for such shorter period that the registrant was required to file such reports), and (2) has been subject to such filing requirements for the past 90 days.

Indicate by check mark whether the registrant is an accelerated filer (as defined in Rule 12b-2 of the Securities Exchange Act of 1934).

Belrose Capital Fund LLC
Index to Form 10-Q
|
| PART I | | FINANCIAL INFORMATION | | Page |
| Item | | 1. | | Financial Statements | | |
| | | | | Condensed Consolidated Statements of Assets and Liabilities as of | | |
| | | | | June 30, 2005 (Unaudited) and December 31, 2004 | | 3 |
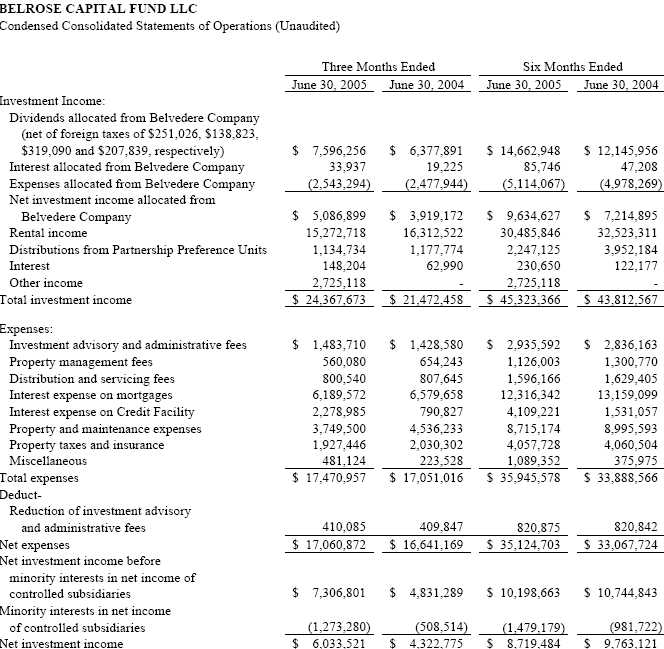
| | | | | Condensed Consolidated Statements of Operations (Unaudited) for the | | |
| Three Months Ended June 30, 2005 and 2004 and for the Six Months Ended |
| | | | | June 30, 2005 and 2004 | | 4 |
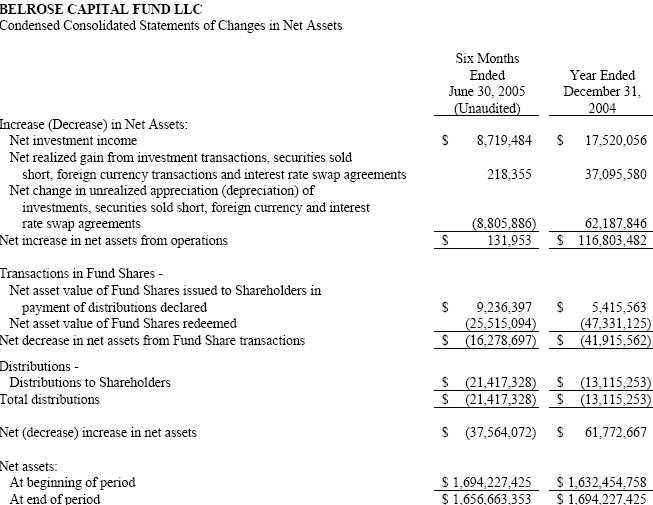
| | | | | Condensed Consolidated Statements of Changes in Net Assets for the | | |
| | | | | Six Months Ended June 30, 2005 (Unaudited) and the Year | | |
| | | | | Ended December 31, 2004 | | 6 |
| | | | | Condensed Consolidated Statements of Cash Flows (Unaudited) for the | | |
| | | | | Six Months Ended June 30, 2005 and 2004 | | 7 |
| | | | | Financial Highlights for the Six Months Ended June 30, 2005 (Unaudited) | | |
| | | | | and for the Year Ended December 31, 2004 | | 9 |
| | | | | Notes to Condensed Consolidated Financial Statements | | |
| | | | | as of June 30, 2005 (Unaudited) | | 10 |
| Item | | 2. | | Management’s Discussion and Analysis of Financial Condition (MD&A) | | |
| | | | | and Results of Operations | | 17 |
| Item | | 3. | | Quantitative and Qualitative Disclosures About Market Risk | | 21 |
| Item | | 4. | | Controls and Procedures | | 23 |
| PART II | | OTHER INFORMATION | | |
| Item | | 1. | | Legal Proceedings | | 23 |
| Item | | 2. | | Unregistered Sales of Equity Securities and Use of Proceeds | | 24 |
| Item | | 3. | | Defaults Upon Senior Securities | | 24 |
| Item | | 4. | | Submission of Matters to a Vote of Security Holders | | 24 |
| Item | | 5. | | Other Information | | 24 |
| Item | | 6. | | Exhibits | | 24 |
| SIGNATURES | | 25 |
| EXHIBIT INDEX | | 26 |
2

See notes to unaudited condensed consolidated financial statements
3
See notes to unaudited condensed consolidated financial statements
4

(1) Amounts represent interest expense incurred in connection with interest rate swap agreements (Note 5).
See notes to unaudited condensed consolidated financial statements
5
See notes to unaudited condensed consolidated financial statements
6

See notes to unaudited condensed consolidated financial statements
7
BELROSE CAPITAL FUND LLC
Condensed Consolidated Statements of Cash Flows (Unaudited) (Continued)
See notes to unaudited condensed consolidated financial statements
8
| BELROSE CAPITAL FUND LLC | | | | | | | | | | |
| CONDENSED CONSOLIDATED FINANCIAL STATEMENTS (Continued) | | | | | | | | | | |
| |
| Financial Highlights | | | | Six Months Ended | | | | | | |
| | | | | | | June 30, 2005 | | | | Year Ended |
| | | | | | | (Unaudited) | | | | December 31, 2004 |
|
| Net asset value – Beginning of period | | | | $ | | 102.030 | | | | $ | | 95.840 |
|
| |
| Income (loss) from operations | | | | | | | | | | | | |
|
| Net investment income (1) | | | | $ | | 0.525 | | | | $ | | 1.036 |
| Net realized and unrealized (loss) gain | | | | (0.515) | | | | | | 5.924 |
|
| Total income from operations | | | | $ | | 0.010 | | | | $ | | 6.960 |
|
| |
| Distributions | | | | | | | | | | | | |
|
| Distributions to Shareholders | | | | $ | | (1.290) | | | | $ | | (0.770) |
|
| Total distributions | | | | $ | | (1.290) | | | | $ | | (0.770) |
|
| |
| Net asset value – End of period | | | | $ | | 100.750 | | | | $ | | 102.030 |
|
| |
| Total Return(2) | | | | | | 0.04% | | | | | | 7.32% |
|
| |
| Ratios as a percentage of average net assets(3): | | | | | | | | | | |
|
| Expenses of Consolidated Real Property Subsidiaries | | | | | | | | | | |
| Interest and other borrowing costs | | (4) | | | | 1.19% | | (9) | | | | 1.29% |
| Operating expenses (4) | | | | | | 1.37% | | (9) | | | | 1.57% |
| Belrose Capital Fund LLC Expenses | | | | | | | | | | | | |
| Interest and other borrowing costs | | (5)(6) | | | | 0.50% | | (9) | | | | 0.27% |
| Investment advisory and administrative fees, distribution and | | | | | | | | | | |
| servicing fees and other Fund operating expenses (5)(7) | | | | 1.15% | | (9) | | | | 1.11% |
| |
|
| Total expenses | | | | | | 4.21% | | (9) | | | | 4.24% |
| |
| Net investment income | | | | | | 1.06% | | (9) | | | | 1.07% |
|
| |
| Ratios as a percentage of average gross assets(3)(8): | | | | | | | | | | |
|
| Expenses of Consolidated Real Property Subsidiaries | | | | | | | | | | |
| Interest and other borrowing costs | | (4) | | | | 0.95% | | (9) | | | | 0.98% |
| Operating expenses (4) | | | | | | 1.09% | | (9) | | | | 1.18% |
| Belrose Capital Fund LLC Expenses | | | | | | | | | | | | |
| Interest and other borrowing costs | | (5)(6) | | | | 0.40% | | (9) | | | | 0.20% |
| Investment advisory and administrative fees, distribution and | | | | | | | | | | |
| servicing fees and other Fund operating expenses (5)(7) | | | | 0.92% | | (9) | | | | 0.84% |
| |
|
| Total expenses | | | | | | 3.36% | | (9) | | | | 3.20% |
| |
| Net investment income | | | | | | 0.85% | | (9) | | | | 0.80% |
|
| |
| Supplemental Data | | | | | | | | | | | | |
|
| Net assets, end of period (000’s omitted) | | $ | | 1,656,663 | | | | $ | | 1,694,227 |
| Portfolio turnover of Tax-Managed Growth Portfolio (the Portfolio) | | | | 0.12% | | | | | | 3% |
|
| (1) | Calculated using average shares outstanding. |
| |
| (2) | Returns are calculated by determining the percentage change in net asset value with all distributions reinvested. Total return is not computed on an annualized basis. |
| |
| (3) | For the purpose of calculating ratios, the income and expenses of Belrose Realty Corporation’s (Belrose Realty) controlled subsidiaries are reduced by the proportionate interests therein of investors other than Belrose Realty. |
| |
| (4) | Includes Belrose Realty's proportional share of expenses incurred by its controlled subsidiaries. |
| |
| (5) | Includes the expenses of Belrose Capital Fund LLC (Belrose Capital) and Belrose Realty. Does not include expenses of Belrose Realty's controlled subsidiaries. |
| |
| (6) | Ratios do not include interest incurred in connection with interest rate swap agreements. Had such amounts been included, ratios would be higher. |
| |
| (7) | Includes Belrose Capital's share of Belvedere Capital Fund Company LLC's (Belvedere Company) allocated expenses, including those expenses allocated from the Portfolio. |
| |
| (8) | Average Gross Assets is defined as the average daily amount of all assets of Belrose Capital (including Belrose Capital's interest in Belvedere Company and Belrose Capital's ratable share of the assets of its directly and indirectly controlled subsidiaries), without reduction by any liabilities. For this purpose, the assets of Belrose Realty's controlled subsidiaries are reduced by the proportionate interests therein of investors other than Belrose Realty. |
| |
| (9) | Annualized. |
| |
See notes to unaudited condensed consolidated financial statements
9
BELROSE CAPITAL FUND LLC as of June 30, 2005
Notes to Condensed Consolidated Financial Statements (Unaudited)
The condensed consolidated interim financial statements of Belrose Capital Fund LLC (Belrose Capital) and its subsidiaries (collectively, the Fund) have been prepared, without audit, in accordance with accounting principles generally accepted in the United States of America (GAAP) for interim financial information and with the instructions to Form 10-Q and Article 10 of Regulation S-X. Accordingly, certain information and footnote disclosures normally included in annual financial statements prepared in accordance with GAAP have been condensed or omitted as permitted by such rules and regulations. All adjustments, consisting of normal recurring adjustments, have been included. Management believes that the disclosures are adequate to present fairly the financial position, results of operations, cash flows and financial highlights as of the dates and for the periods presented. It is suggested that these interim financial statements be read in conjunction with the financial statements and the notes thereto included in the Fund’s latest annual report on Form 10-K. Results for interim periods are not necessarily indicative of those to be expected for the full fiscal year.
The balance sheet at December 31, 2004 and the statement of changes in net assets and the financial highlights for the year then ended have been derived from the December 31, 2004 audited financial statements but do not include all of the information and footnotes required by GAAP for complete financial statements as permitted by the instructions to Form 10-Q and Article 10 of Regulation S-X.
Certain amounts in the prior periods’ condensed consolidated financial statements have been reclassified to conform with the current period presentation.
Shareholders in Belrose Capital are entitled to restructure their Fund Share interests under what is termed an Estate Freeze Election. Under this election, Fund Shares are divided into Preferred Shares and Common Shares. Preferred Shares have a preferential right over the corresponding Common Shares equal to (i) 95% of the original capital contribution made in respect of the undivided Shares from which the Preferred Shares and Common Shares were derived, plus (ii) an annuity priority return equal to 7.75% of the Preferred Shares’ preferential interest in the original capital contribution of the undivided Fund Shares. The associated Common Shares are entitled to the remaining 5% of the original capital contribution in respect of the undivided Shares, plus any returns thereon in excess of the fixed annual priority of the Preferred Shares. The existence of restructured Fund Shares does not adversely affect Shareholders who do not participate in the election nor do the restructured Fund Shares have preferential rights to Fund Shares that have not been restructured. Shareholders who subdivide Fund Shares under this election sacrifice certain rights and privileges that they would otherwise have with respect to the Fund Shares so divided, including redemption rights and voting and consent rights. Upon the twentieth anniversary of the issuance of the associated undivided Fund Shares to the original holders thereof, Preferred and Common Shares will automatically convert into full and fractional undivided Fund Shares.
10
The allocation of Belrose Capital’s net asset value per Share of $100.75 and $102.03 as of June 30, 2005 and December 31, 2004, respectively, between Preferred and Common shares that have been restructured is as follows:

3 Investment Transactions
The following table summarizes the Fund’s investment transactions, other than short-term obligations, for the six months ended June 30, 2005 and 2004:
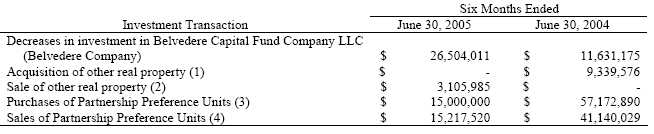
| (1) | On June 30, 2004, Belrose Realty Corporation (Belrose Realty) purchased an indirect investment in real property through a controlled subsidiary, Deerfield Property Trust (Deerfield), for $9,339,576. |
| |
| (2) | On April 6, 2005, Deerfield sold an industrial distribution property to a third party for which Belrose Realty recognized a loss of $152,242. |
| |
| (3) | Purchases of Partnership Preference Units during the six months ended June 30, 2004, include Partnership Preference Units purchased from other investment funds advised by Boston Management and Research (Boston Management). There were no Partnership Preference Units purchased from other investment funds advised by Boston Management for the six months ended June 30, 2005. |
| |
| (4) | Sales of Partnership Preference Units for the six months ended June 30, 2005 and 2004 include Partnership Preference Units sold to another investment fund advised by Boston Management for which a gain of $323,360 and a loss of $4,828,100 were recognized, respectively. |
| |
4 Indirect Investment in the Portfolio
|
The following table summarizes the Fund’s investment in Tax-Managed Growth Portfolio (the Portfolio) through Belvedere Company for the six months ended June 30, 2005 and 2004, including allocations of income, expenses and net realized and unrealized gains (losses) for the respective periods then ended:
11
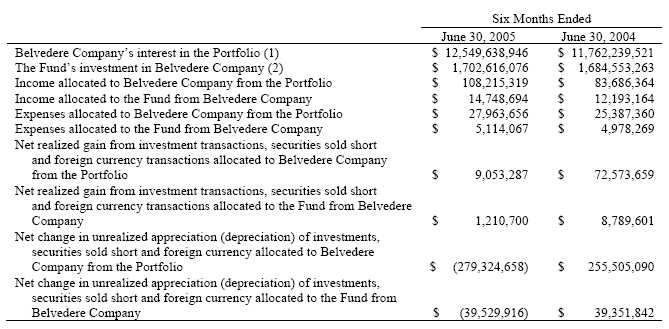
| (1) | As of June 30, 2005 and 2004, the value of Belvedere Company’s interest in the Portfolio represents 68.4% and 64.7% of the Portfolio’s net assets, respectively. |
| |
| (2) | As of June 30, 2005 and 2004, the Fund’s investment in Belvedere Company represents 13.6% and 14.3% of Belvedere Company’s net assets, respectively. |
| |
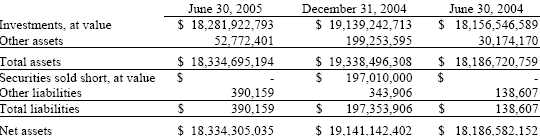
A summary of the Portfolio’s Statement of Assets and Liabilities at June 30, 2005, December 31, 2004 and June 30, 2004 and its operations for the six months ended June 30, 2005, for the year ended December 31, 2004 and for the six months ended June 30, 2004 follows:
12
| | | June 30, 2005 | | December 31, 2004 | | | | June 30, 2004 |
| |
|
| Dividends and interest | | $ | | 160,085,593 | | $ | | 292,265,206 | | $ | | 131,109,908 |
|
| Investment adviser fee | | $ | | 40,134,219 | | $ | | 77,609,178 | | $ | | 38,780,667 |
| Other expenses | | | | 1,275,628 | | | | 2,649,363 | | | | 1,025,267 |
| Total expense reductions | | | | (89,120) | | | | (26,706) | | | | - |
|
| Net expenses | | $ | | 41,320,727 | | $ | | 80,231,835 | | $ | | 39,805,934 |
|
| Net investment income | | $ | | 118,764,866 | | $ | | 212,033,371 | | $ | | 91,303,974 |
| Net realized gain from | | | | | | | | | | | | |
| investment transactions, | | | | | | | | | | | | |
| securities sold short and | | | | | | | | | | | | |
| foreign currency transactions | | | | 12,967,888 | | | | 152,422,840 | | | | 118,166,339 |
| Net change in unrealized | | | | | | | | | | | | |
| appreciation (depreciation) of | | | | | | | | | | | | |
| investments, securities sold | | | | | | | | | | | | |
| short and foreign currency | | | | (421,158,753) | | | | 1,317,878,707 | | | | 397,547,485 |
|
| Net (decrease) increase in net | | | | | | | | | | | | |
| assets from operations | | $ (289,425,999) | | $ | | 1,682,334,918 | | $ | | 607,017,798 |
|
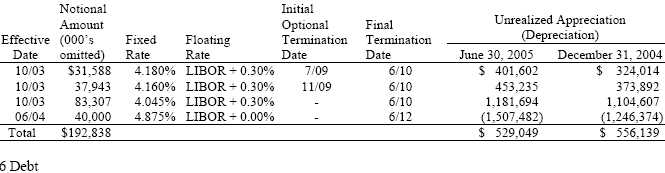
5 Interest Rate Swap Agreements
|
Belrose Capital has entered into interest rate swap agreements with Merrill Lynch Capital Services, Inc. in connection with its real estate investments and the associated borrowings. Under such agreements, Belrose Capital has agreed to make periodic payments at fixed rates in exchange for payments at floating rates. The notional or contractual amounts of these instruments may not necessarily represent the amounts potentially subject to risk. The measurement of the risks associated with these investments is meaningful only when considered in conjunction with all related assets, liabilities and agreements. Interest rate swap agreements in place at June 30, 2005 and December 31, 2004 are listed below.
A Note Payable — On June 30, 2005, Belrose Realty and the minority shareholder of Katahdin Property Trust LLC (Katahdin) loaned $2,250,000 and $750,000, respectively, to Katahdin. The note bears interest on the outstanding principal amount at the rate of 8.875% per annum. No interest payments are due until maturity on July 1, 2006, at which time the entire outstanding principal balance of the note, plus all accrued unpaid interest thereon is due and payable. All balances and transactions related to the note payable made by Belrose Realty have been eliminated through consolidation of the financial statements.
13
Belrose Capital pursues its investment objective primarily by investing indirectly in the Portfolio through Belvedere Company. The Portfolio is a diversified investment company that emphasizes investments in common stocks of domestic and foreign growth companies that are considered by its investment adviser to be high in quality and attractive in their long-term investment prospects. Separate from its investment in Belvedere Company, Belrose Capital invests in real estate assets through its subsidiary, Belrose Realty. Belrose Realty invests directly in Partnership Preference Units and indirectly in real property through controlled subsidiaries, Katahdin, Bel Communities Property Trust and Deerfield and formerly invested in Bel Apartment Properties Trust (for the period during which Belrose Realty maintained an interest in each of the controlled subsidiaries).
Belrose Capital evaluates performance of the reportable segments based on the net increase (decrease) in net assets from operations of the respective segment, which includes net investment income (loss), net realized gain (loss) and the net change in unrealized appreciation (depreciation). The accounting policies of the reportable segments are the same as those for Belrose Capital on a consolidated basis. No reportable segments have been aggregated. Reportable information by segment is as follows:

14
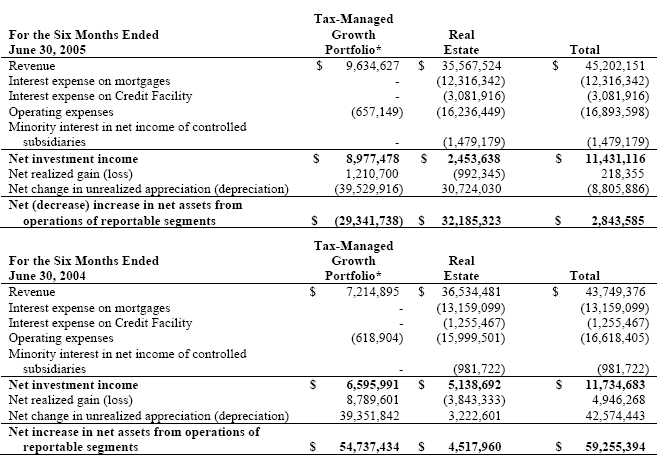
*Belrose Capital invests indirectly in Tax-Managed Growth Portfolio through Belvedere Company.
The following tables reconcile the reported segment information to the condensed consolidated financial statements for the periods indicated:
| | | | | Three Months Ended | | | | Six Months Ended |
| |
|
| | | June 30, 2005 | | June 30, 2004 | | June 30, 2005 | | June 30, 2004 |
| |
|
| Revenue: | | | | | | | | | | | | | | | | |
| Revenue from reportable segments | | $ | | 24,281,332 | | $ | | 21,432,348 | | $ | | 45,202,151 | | $ | | 43,749,376 |
| Unallocated amounts: | | | | | | | | | | | | | | | | |
| Interest earned on cash not invested | | | | | | | | | | | | | | | | |
| in the Portfolio or in subsidiaries | | | | 86,341 | | | | 40,110 | | | | 121,215 | | | | 63,191 |
| |
|
| Total revenue | | $ | | 24,367,673 | | $ | | 21,472,458 | | $ | | 45,323,366 | | $ | | 43,812,567 |
| |
|
15
| | | | | Three Months Ended | | | | Six Months Ended |
| |
|
| | | June 30, 2005 | | June 30, 2004 | | June 30, 2005 | | June 30, 2004 |
| |
|
| Net increase (decrease) in net assets | | | | | | | | | | | | | | |
| from operations: | | | | | | | | | | | | | | |
| Net increase in net assets from | | | | | | | | | | | | | | |
| operations of reportable segments | | $ | | 13,254,746 | | $ | | 27,762,252 | | $ | | 2,843,585 | | $ 59,255,394 |
| Unallocated investment income: | | | | | | | | | | | | | | |
| Interest earned on cash not invested | | | | | | | | | | | | | | |
| in the Portfolio or in subsidiaries | | | | 86,341 | | | | 40,110 | | | | 121,215 | | 63,191 |
| Unallocated expenses (1): | | | | | | | | | | | | | | |
| Distribution and servicing fees | | | | (800,540) | | | | (807,645) | | | | (1,596,166) | | (1,629,405) |
| Interest expense on Credit Facility | | | | (606,351) | | | | (149,751) | | | | (1,027,305) | | (275,590) |
| Audit, tax and legal fees | | | | (72,836) | | | | (39,115) | | | | (154,205) | | (75,888) |
| Other operating expenses | | | | (34,718) | | | | (33,189) | | | | (55,171) | | (53,870) |
| |
|
| Total net increase in net assets from | | | | | | | | | | | | | | |
| operations | | $ | | 11,826,642 | | $ | | 26,772,662 | | $ | | 131,953 | | $ 57,283,832 |
| |
|
| (1) | Unallocated expenses represent costs incurred that pertain to the overall operation of Belrose Capital, and do not pertain to either operating segment. |
| |
The following tables reconcile the reported segment information to the condensed consolidated financial statements for the periods indicated:
| | | | | Tax-Managed | | | | | | | | | | |
| | | | | Growth | | | | Real | | | | | | |
| At June 30, 2005 | | | | Portfolio* | | | | Estate | | | | | | Total |
|
| Segment assets | | $ | | 1,702,616,076 | | $ | | 617,601,078 | | $ | | | | 2,320,217,154 |
| Segment liabilities | | | | - | | | | 599,614,078 | | | | | | 599,614,078 |
|
| |
| Net assets of reportable segments | | $ | | 1,702,616,076 | | $ | | 17,987,000 | | $ | | | | 1,720,603,076 |
|
| |
| | | | | Tax-Managed | | | | | | | | | | |
| | | | | Growth | | | | Real | | | | | | |
| At December 31, 2004 | | | | Portforlio* | | | | Estate | | | | | | Total |
|
| Segment assets | | $ | | 1,757,804,676 | | $ | | 574,172,316 | | $ | | | | 2,331,976,992 |
| Segment liabilities | | | | 3,958,764 | | | | 589,131,572 | | | | | | 593,090,336 |
|
| |
| Net assets (liabilities) of reportable segments | | $ | | 1,753,845,912 | | $ | | (14,959,256) | | $ | | | | 1,738,886,656 |
|
| *Belrose Capital invests indirectly in Tax-Managed Growth Portfolio through Belvedere Company. | | | | | | |
| |
| |
| | | | | | | | | June 30, 2005 | | | | December 31, 2004 |
| |
|
| Net assets: | | | | | | | | | | | | | | |
| Net assets of reportable segments | | | | | | $ | | 1,720,603,076 | | | | $ | | 1,738,886,656 |
| Unallocated amounts: | | | | | | | | | | | | | | |
| Cash (1) | | | | | | | | 424,671 | | | | | | 370,849 |
| Short-term investments (1) | | | | | | | | 3,836,000 | | | | | | 721,000 |
| Loan payable – Credit Facility (2) | | | | | | | | (67,960,720) | | | | | | (45,508,412) |
| Other liabilities | | | | | | | | (239,674) | | | | | | (242,668) |
| |
|
| Total net assets | | | | | | $ | | 1,656,663,353 | | | | $ | | 1,694,227,425 |
| |
|
| (1) | Unallocated cash and short-term investments represent cash and cash equivalents not invested in the Portfolio or real estate assets. |
| |
| (2) | Unallocated amount of loan payable - Credit Facility represents borrowings not specifically used to fund real estate investments. Such borrowings are generally used to pay selling commissions, organization expenses and other liquidity needs of the Fund. |
| |
16
Item 2. Management’s Discussion and Analysis of Financial Condition (MD&A) and Results of Operations.
The information in this report contains forward-looking statements within the meaning of the federal securities laws. Forward-looking statements typically are identified by use of terms such as “may,” “will,” “should,” “might,” “expect,” “anticipate,” “estimate,” and similar words, although some forward-looking statements are expressed differently. The actual results of Belrose Capital Fund LLC (the Fund) could differ materially from those contained in the forward-looking statements due to a number of factors. The Fund undertakes no obligation to update publicly any forward-looking statements, whether as a result of new information, future events, or otherwise, except as required by applicable law. Factors that could affect the Fund’s performance include a decline in the U.S. stock markets or in general economic conditions, adverse developments affecting the real estate industry, or fluctuations in interest rates.
The following discussion should be read in conjunction with the Fund’s unaudited condensed consolidated financial statements and related notes in Item 1 above.
MD&A and Results of Operations for the Quarter Ended June 30, 2005 Compared to the Quarter Ended June 30, 2004
Performance of the Fund.1The Fund’s investment objective is to achieve long-term, after-tax returns for Shareholders. Eaton Vance Management (Eaton Vance), as the Fund’s manager, measures the Fund’s success in achieving its objective based on the investment returns of the Fund, using the S&P 500 Index as the Fund’s primary performance benchmark. The S&P 500 Index is a broad-based unmanaged index of common stocks widely used as a measure of U.S. stock market performance. Eaton Vance’s primary focus in pursuing total return is on the Fund’s common stock portfolio, which consists of its indirect interest in Tax-Managed Growth Portfolio (the Portfolio). The Fund invests in the Portfolio through its interest in Belvedere Capital Fund Company LLC (Belvedere Company). In measuring the performance of the Fund’s real estate investments, Eaton Vance considers whether, through current returns and changes in valuation, the real estate investments achieve returns that over the long-term exceed the cost of the borrowings incurred to acquire such investments and thereby add to Fund returns. The Fund has entered into interest rate swap agreements to fix a substantial portion of the borrowing costs under the Credit Facility (described under "Liquidity and Capital Resources" below) used to acquire equity in its real estate investments and to mitigate in part the impact of interest rate changes on the Fund’s net asset value.
The Fund’s total return was 0.72% for the quarter ended June 30, 2005. This return reflects an increase in the Fund’s net asset value per share from $100.03 to $100.75 during the period. The total return of the S&P 500 Index was 1.37% over the same period. The performance of the Fund exceeded that of the Portfolio by approximately 0.22% during the period. Last year, the Fund had a total return performance of 1.62% for the quarter ended June 30, 2004. This return reflected an increase in the Fund’s net asset value per share from $96.87 to $98.44 during the period. The S&P 500 Index had a total return of 1.72% over the same period. The performance of the Fund exceeded that of the Portfolio by approximately 0.31% during that period.
Performance of the Portfolio.For the quarter ended June 30, 2005, the Portfolio had a total return of 0.50%, which compares to the 1.37% total return of the S&P 500 Index over the same period. During the second quarter of last year, the Portfolio had a total return of 1.31% and the S&P 500 Index had a total return of 1.72% . Following a negative first quarter, U.S. equities posted modest gains in the second quarter of 2005. Despite record high oil prices and rising short-term interest rates, the U.S. economy remained vibrant as evidenced by healthy consumer spending, continued growth in corporate earnings and rebounding manufacturing activity. Even with positive economic indicators, investors remained cautious on equities, particularly growth stocks. Defensive, higher yielding stocks generally outperformed more aggressive stocks, and small- and mid-cap stocks generally outperformed large-cap stocks, a reversal of style and market capitalization leadership from the same period last year.
Utilities, health care and financials were the top performing market sectors during the second quarter of 2005, while the materials and industrials sectors were the worst performing sectors. Market leading industries in the second quarter included electric utilities, health care equipment, real estate and insurance. Metals, internet retailers and office electronics were among the weakest performing industries.
| 1 | Total returns are historical and are calculated by determining the percentage change in net asset value with all distributions reinvested. Past performance is no guarantee of future results. Investment return and principal value will fluctuate so that shares, when redeemed, may be worth more or less than their original cost. The Portfolio’s total return for the period reflects the total return of another fund that invests in the Portfolio, adjusted for non-Portfolio expenses of that fund. Performance is for the stated time period only and is not annualized; due to market volatility, the Fund’s current performance may be lower or higher. The performance of the Fund and the Portfolio is compared to that of their benchmark, the S&P 500 Index. It is not possible to invest directly in an Index. |
| |
17
The Portfolio invests on a long-term basis in a broadly diversified portfolio of primarily large-cap stocks. During the quarter, its large-cap orientation and growth emphasis were not consistent with a market environment that favored small-and mid-cap stocks and value-style investing. The Portfolio’s de-emphasis of the slower-growth, high yielding sectors, such as utilities, hurt returns during the period. Overweightings of the underperforming industrials and consumer discretionary sectors and stock selection within the insurance and asset management industries also hurt the Portfolio’s performance.
On the positive side, an overweighted position in the energy sector helped the Portfolio’s performance, as investments in oil production, equipment and drilling companies advanced on record oil prices. The Portfolio’s underweight of the materials sector, the worst performing sector during the quarter, and stock selection within the telecom services, food and staples retailing industries were also beneficial to performance during the quarter.
Performance of Real Estate Investments.The Fund’s real estate investments are held through Belrose Realty Corporation (Belrose Realty). As of June 30, 2005, real estate investments included interests in Bel Communities Property Trust (Bel Communities), Deerfield Property Trust (Deerfield) and Katahdin Property Trust, LLC (Katahdin), each of which is a real estate joint venture (Real Estate Joint Venture), and a portfolio of income-producing preferred equity interests in real estate operating partnerships (Partnership Preference Units). Bel Communities and Katahdin own multifamily properties and Deerfield owns industrial distribution properties. As of June 30, 2005, the estimated fair value of the Fund’s real estate investments represented 25.7% of the Fund’s total assets on a consolidated basis. After adjusting for the minority interest in the Real Estate Joint Ventures, the Fund’s real estate investments represented 29.3% of the Fund’s net assets as of June 30, 2005.
During the quarter ended June 30, 2005, rental income from real estate operations was approximately $15.3 million compared to approximately $16.3 million for the quarter ended June 30, 2004, a decrease of $1.0 million or 6%. This decrease in rental income was primarily due to Belrose Realty’s November 2004 sale of its interest in a multifamily Real Estate Joint Venture that provided 31.2% of the Fund’s consolidated rental income for the quarter ended June 30, 2004. The decline in rental income due to the sale of the multifamily Real Estate Joint Venture was offset in part by the rental income of Deerfield, which was acquired in June 2004. For the quarter ended June 30, 2005, rental income for Deerfield was negatively affected by a less favorable leasing environment than expected. During the quarter ended June 30, 2004, rental income increased due to modest increases in apartment rental rates net of concessions.
During the quarter ended June 30, 2005, property operating expenses were approximately $6.2 million compared to approximately $7.2 million for the quarter ended June 30, 2004, a decrease of $1.0 million or 14% (property operating expenses are before certain operating expenses of Belrose Realty of approximately $1.1 million for the quarter ended June 30, 2005 and $0.9 million for the quarter ended June 30, 2004). The decrease in property operating expenses was principally due to the November 2004 asset sale referenced in the preceding paragraph. The recent pick-up in economic and employment growth is expected to lead to improved supply-demand balance in the apartment industry. However, oversupply conditions continue to exist in many major markets. Boston Management expects that multifamily real estate operating results for 2005 will be similar to 2004, but that improvements in multifamily property operating performance will occur over the longer term. For many industrial distribution properties, reduced rent levels are likely to continue over the near term. Boston Management expects that improvements in industrial distribution property operating performance will occur over the longer term.
During the quarter ended June 30, 2005, the Fund saw net unrealized appreciation of the estimated fair value of its other real estate investments (which includes the Real Estate Joint Ventures) of approximately $7.6 million compared to net unrealized appreciation of approximately $0.7 million during the quarter ended June 30, 2004. Net unrealized appreciation of approximately $7.6 million during the quarter ended June 30, 2005 consisted of net unrealized appreciation in the value of the properties of the Real Estate Joint Ventures.
During the quarter ended June 30, 2005, Belrose Realty sold certain of its Partnership Preference Units totaling approximately $15.2 million (representing sales to other investment funds advised by Boston Management), recognizing a net gain of approximately $0.3 million on the transactions. During the quarter ended June 30, 2005, the Fund saw net unrealized appreciation in the estimated fair value of its Partnership Preference Units of approximately $0.8 million compared to net unrealized appreciation of approximately $2.2 million during the quarter ended June 30, 2004. The net unrealized appreciation of approximately $0.8 million during the quarter ended June 30, 2005 consisted of approximately $0.7 million of unrealized appreciation as a result of increases in the per unit values of Partnership Preference Units held
18
primarily due to low long-term interest rates, and approximately $0.1 million of unrealized appreciation resulting from the recharacterization of previously recorded unrealized depreciation as realized losses due to the sales of Partnership Preference Units during the quarter ended June 30, 2005. The Fund’s net unrealized depreciation in the second quarter of 2004 consisted of approximately $1.0 million of unrealized depreciation as a result of decreases in per unit values of Partnership Preference Units and approximately $3.2 million of unrealized appreciation resulting from the recharacterization of previously recorded unrealized depreciation to realized losses due to sales of Partnership Preference Units during the quarter.
Distributions from Partnership Preference Units for the quarter ended June 30, 2005 totaled approximately $1.1 million compared to approximately $1.2 million for the quarter ended June 30, 2004, a decrease of $0.1 million or 8%. The decrease was principally due to lower average distribution rates for the Partnership Preference Units held during the quarter. The decrease in average distribution rates of Partnership Preference Units was primarily due to the restructuring of certain Partnership Preference Units to pay lower distribution rates (reflecting lower market rates for preferred securities) as they neared potential call. Distributions from Partnership Preference Units for the quarter ended June 30, 2004 were unchanged from the same period in the prior year.
Performance of Interest Rate Swap Agreements.For the quarter ended June 30, 2005, net realized and unrealized losses on the Fund’s interest rate swap agreements totaled approximately $5.2 million, compared to net realized and unrealized gains of approximately $7.0 million for the quarter ended June 30, 2004. Net realized and unrealized losses on swap agreements for the quarter ended June 30, 2005 consisted of $4.8 million of unrealized depreciation due to changes in swap agreement valuations and $0.4 million of periodic payments made pursuant to outstanding swap agreements (and classified as net realized losses on interest rate swap agreements). For the quarter ended June 30, 2004, net realized and unrealized gains on swap agreements consisted of unrealized appreciation of $8.1 million on swap agreement valuation changes offset in part by $1.1 million of swap agreement periodic payments. The negative impact on Fund performance for the quarter ended June 30, 2005 from changes in swap agreement valuations was attributable to a decrease in swap rates during the period. The positive contribution to Fund performance for the quarter ended June 30, 2004 was attributable to an increase in swap rates during the period.
MD&A and Results of Operations for the Six Months Ended June 30, 2005 Compared to the Six Months Ended June 30, 2004
Performance of the Fund.The Fund’s total return was 0.04% for the six months ended June 30, 2005. This return reflects a decrease in the Fund’s net asset value per share from $102.03 to $100.75 and a distribution of $1.29 per share during the period. The S&P 500 Index had a total return of -0.81% over the same period. The performance of the Fund exceeded that of the Portfolio by approximately 1.53% during the period. Last year, the Fund had a total return performance of 3.54% for the six months ended June 30, 2004. This return reflected an increase in the Fund’s net asset value per share from $95.84 to $98.44 and a distribution of $0.77 per share during the period. The S&P 500 Index had a total return of 3.44% over the same period. The performance of the Fund exceeded that of the Portfolio by 0.09% during that period.
Performance of the Portfolio.For the six months ended June 30, 2005, the Portfolio had a total return of -1.49%, which compares to the -0.81% total return of the S&P 500 Index over the same period. During the first half of last year, the Portfolio had a total return of 3.45% and the S&P 500 Index had a total return of 3.44% . Although consumer spending, manufacturing activity and corporate earnings growth remained healthy during the first half of 2005, investor concerns about rising interest rates, a mounting trade deficit and record oil prices hampered stock market performance. Equity market leadership for the first half of 2005 can be characterized as defensive and interest rate sensitive. Higher yielding stocks generally outperformed more aggressive stocks, and small- and mid-cap stocks generally outperformed large-cap stocks. Energy, utilities and healthcare were the strongest performing sectors, while telecommunications and materials were the weakest performing sectors.
The Portfolio invests on a long-term basis in a broadly diversified portfolio of primarily large-cap stocks. The Portfolio’s sector allocation at June 30, 2005 remained comparable to that as of June 30, 2004, with a slight increase to the consumer staples and energy sectors. During the first half of 2005, its large-cap orientation and growth emphasis were not consistent with a market environment that favored small-and mid-cap stocks and value-style investing. The Portfolio’s de-emphasis of the slower-growth, high yielding sectors, such as utilities, hurt returns during the period. The Portfolio’s returns were also negatively affected by its overweight of airfreight logistics and machinery investments, and adverse stock selection within food and staples retailing industries.
19
On the positive side, an overweighted position in the energy sector helped the Portfolio’s performance, as investments in oil production, equipment and drilling companies advanced on record oil prices. The Portfolio’s underweight of the information technology and materials sectors was also helpful, as electronic equipment, computers and metal industries declined during the first half of 2005. The Portfolio also benefited from favorable stock selection within the diversified telecom, mortgage-thrifts and consumer service sectors during the period.
Performance of Real Estate Investments.During the six months ended June 30, 2005, rental income from real estate operations was approximately $30.5 million compared to approximately $32.5 million for the six months ended June 30, 2004, a decrease of $2.0 million or 6%. This decrease in rental income was principally due to Belrose Realty’s sale in November 2004 of its interest in a multifamily Real Estate Joint Venture that provided 31.5% of consolidated rental income for the six months ended June 30, 2004. The decline in rental income due to the sale of the multifamily Real Estate Joint Venture was offset in part by the rental income of Deerfield, which was acquired in June 2004. For the six months ended June 30, 2005, Deerfield’s rental income was negatively affected by a less favorable leasing environment than expected. For the six months ended June 30, 2004 rental income from real estate operations increased principally due to modest increases in apartment rental rates net of concessions.
During the six months ended June 30, 2005, property operating expenses were approximately $13.9 million compared to approximately $14.4 million for the six months ended June 30, 2004, a decrease of $0.5 million or 4% (property operating expenses are before certain operating expenses of Belrose Realty of approximately $2.3 million for the six months ended June 30, 2005 and $1.6 million for the six months ended June 30, 2004). This decrease in property operating expenses was principally due to the November 2004 asset sale referenced in the preceding paragraph. For the six months ended June 30, 2004, property operating expenses were unchanged from the same period in the prior year. The recent pick-up in economic and employment growth is expected to lead to improved supply-demand balance in the apartment industry. However, oversupply conditions continue to exist in many major markets. Boston Management expects that multifamily real estate operating results for 2005 will be similar to 2004, but that improvements in multifamily property operating performance will occur over the longer term. For many industrial distribution properties, reduced rent levels are likely to continue over the near term. Boston Management expects that improvements in industrial distribution property operating performance will occur over the longer term.
The estimated fair value of the real properties held through Belrose Realty was approximately $535.5 million at June 30, 2005 compared to approximately $496.8 million at December 31, 2004, an increase of $38.7 million or 8%. This increase in the estimated fair value of the real properties for the six months ended June 30, 2005 was principally due to increases in the estimated fair values of properties held by Katahdin and Deerfield. Despite weak operating conditions in many real estate market segments over the past several years and lower near-term earning expectations, property values have generally benefited from lower capitalization and discount rates.
During the six months ended June 30, 2005, the Fund saw net unrealized appreciation in the estimated fair value of its other real estate investments (which includes the Real Estate Joint Ventures) of approximately $29.2 million compared to approximately $1.1 million of unrealized appreciation for the six months ended June 30, 2004. Net unrealized appreciation of $29.2 million during the six months ended June 30, 2005 was due to increases in the estimated fair values of properties held by Katahdin and Deerfield. The Fund’s unrealized appreciation in the estimated fair value of its other real estate investments for the six months ended June 30, 2004 was due to net increases in estimated property values.
During the six months ended June 30, 2005, Belrose Realty sold certain of its Partnership Preference Units totaling $15.2 million (representing sales to other investment funds advised by Boston Management), recognizing gains of approximately $0.3 million on the transactions. During the six months ended June 30, 2005, Belrose Realty also acquired interests in additional Partnership Preference Units for a total of $15.0 million. At June 30, 2005, the estimated fair value of Belrose Realty’s Partnership Preference Units totaled approximately $61.2 million compared to approximately $59.6 million at December 31, 2004, an increase of $1.6 million or 3%. This net increase in the estimated fair value of Belrose Realty’s Partnership Preference Units for the six months ended June 30, 2005 was principally due to more Partnership Preference Units held at June 30, 2005 and increases in the per unit values of the Partnership Preference Units held at June 30, 2005. Estimated fair values for Partnership Preference Units have been positively affected by low long-term interest rates and by tight spreads for credit-sensitive income securities, including real estate-related securities.
The Fund saw unrealized appreciation in the estimated fair value of its Partnership Preference Units of approximately $1.6 million during the six months ended June 30, 2005 compared to net unrealized depreciation of approximately $1.6 million for the six months ended June 30, 2004. The unrealized appreciation of approximately $1.6 million during the six months ended June 30, 2005 consisted of approximately $1.5 million of unrealized appreciation as a result of increases in the per
20
unit values of Partnership Preference Units held, and approximately $0.1 million of unrealized appreciation resulting from the recharacterization of previously recorded unrealized depreciation as realized losses due to the sales of Partnership Preference Units during the six months ended June 30, 2005. The Fund’s net unrealized depreciation for the first six months of 2004 consisted of approximately $0.9 million of unrealized appreciation as a result of increases in the per unit values of the Partnership Preference Units and approximately $2.5 million of unrealized depreciation resulting from the recharacterization of previously recorded unrealized appreciation to realized gains due to sales of Partnership Preference Units during the six months ended June 30, 2004.
Distributions from Partnership Preference Units for the six months ended June 30, 2005 totaled approximately $2.2 million compared to approximately $4.0 million for the six months ended June 30, 2004, a decrease of $1.8 million or 45%. The decrease in the distributions from Partnership Preference Units for the six months ended June 30, 2005 was principally due to lower average distribution rates. The decrease in average distribution rates of Partnership Preference Units was primarily due to the restructuring of certain Partnership Preference Units to pay lower distribution rates (reflecting lower market rates for preferred securities) as they neared potential call. Distributions from Partnership Preference Units increased during the first six months of 2004 due to the larger number of Partnership Preference Units held during the period and a one-time special distribution from one issuer made in connection with a restructuring of its Partnership Preference Units.
Performance of Interest Rate Swap Agreements.For the six months ended June 30, 2005, net realized and unrealized losses on the Fund’s interest rate swap agreements totaled approximately $1.2 million, compared to net realized and unrealized gains of approximately $1.7 million for the six months ended June 30, 2004. Net realized and unrealized losses on swap agreements for the six months ended June 30, 2005 consisted of $1.2 million of periodic payments made pursuant to outstanding swap agreements (and classified as net realized losses on interest rate swap agreements). For the six months ended June 30, 2004, net realized and unrealized gains on swap agreements consisted of unrealized appreciation of $3.8 million on swap agreement valuation changes offset in part by $2.1 million of swap agreement periodic payments. For the six months ended June 30, 2005, there was no impact on Fund performance from changes in swap agreement valuations as swap rates for swaps with maturities comparable to those of the Fund’s swaps were substantially unchanged during the period. The positive impact on Fund performance for the six months ended June 30, 2004 from changes in swap valuations was attributable to an increase in swap rates during the period.
Liquidity and Capital Resources.
|
Outstanding Borrowings.The Fund has entered into credit arrangements with DrKW Holdings, Inc. and Merrill Lynch Mortgage Capital, Inc. (collectively, the Credit Facility) primarily to finance the Fund’s real estate investments and will continue to use the Credit Facility for such purpose in the future. The Credit Facility may also be used for other purposes, including any liquidity needs of the Fund. In the future, the Fund may increase the size of the Credit Facility (subject to lender consent) and the amount of outstanding borrowings thereunder. As of June 30, 2005, the Fund had outstanding borrowings of $258.0 million and $14.2 million of unused loan commitments under the Credit Facility.
The Fund has entered into interest rate swap agreements with respect to a substantial portion of its real estate investments and associated borrowings. Pursuant to these agreements, the Fund makes periodic payments to the counterparty at predetermined fixed rates in exchange for floating-rate payments that fluctuate with one and three month LIBOR. During the terms of the outstanding interest rate swap agreements, changes in the underlying values of the agreements are recorded as unrealized appreciation or depreciation. As of June 30, 2005, the unrealized appreciation related to the interest rate swap agreements was approximately $0.5 million. As of December 31, 2004, the unrealized appreciation related to the interest rate swap agreements was approximately $0.6 million.
Item 3. Quantitative and Qualitative Disclosures About Market Risk.
Interest Rate Risk.The Fund’s primary exposure to interest rate risk arises from its real estate investments that are financed by the Fund with floating rate borrowings under the Credit Facility and by fixed-rate secured mortgage debt obligations of the Real Estate Joint Ventures. Partnership Preference Units are fixed rate instruments whose values will generally decrease when interest rates rise and increase when interest rates fall. The interest rates on borrowings under the Credit Facility are reset at regular intervals based on one-month LIBOR. The Fund has entered into interest rate swap agreements to fix the cost of a substantial portion of its borrowings under the Credit Facility used to acquire equity in real estate investments and to mitigate in part the impact of interest rate changes on the Fund’s net asset value. Under the terms of the interest rate swap agreements, the Fund makes cash payments at fixed rates in exchange for floating rate payments that fluctuate with one and three month LIBOR. The Fund’s interest rate swap agreements will generally increase in value
21
when interest rates rise and decrease in value when interest rates fall. In the future, the Fund may use other interest rate hedging arrangements (such as caps, floors and collars) to fix or limit borrowing costs. The use of interest rate hedging arrangements is a specialized activity that can expose the Fund to significant loss.
The following table summarizes the contractual maturities and weighted-average interest rates associated with the Fund’s significant non-trading financial instruments. The Fund has no market risk sensitive instruments held for trading purposes. This information should be read in conjunction with Note 5 to the Fund’s unaudited condensed consolidated financial statements in Item 1 above.
Interest Rate Sensitivity
Cost, Principal (Notional) Amount
by Contractual Maturity and Callable Date
for the Twelve Months Ended June 30,*
|
| | | | | | | | | | | Estimated |
| | | | | | | | | | | Fair Value as |
| | | 2006- | | | | | | | | of June 30, |
| | | 2009 | | 2010 | | Thereafter | | Total | | 2005 |
|
| |
| Rate sensitive liabilities: | | | | | | | | | | |
| | |
| |
| Long-term debt: | | | | | | | | | | |
| | |
| |
| Fixed-rate mortgages | | | | | | $359,850,000 | | $359,850,000 | | $390,700,000 |
| |
| Average interest rate | | | | | | 6.67% | | 6.67% | | |
| | |
| |
| Variable-rate Credit | | | | | | | | | | |
| Facility | | | | $258,000,000 | | | | $258,000,000 | | $258,000,000 |
| |
| Average interest rate | | | | 3.65% | | | | 3.65% | | |
|
| |
| Rate sensitive derivative | | | | | | | | | | |
| financial instruments: | | | | | | | | | | |
| | |
| |
| Pay fixed/receive variable | | | | | | | | | | |
| interest rate | | | | | | | | | | |
| swap agreements | | | | $152,838,000 | | $40,000,000 | | $192,838,000 | | $529,049 |
| |
| Average pay rate | | | | 4.10% | | 4.88% | | 4.26% | | |
| |
| Average receive rate | | | | 3.64% | | 3.50% | | 3.61% | | |
|
| |
| Rate sensitive | | | | | | | | | | |
| investments: | | | | | | | | | | |
| | |
| |
| Fixed-rate Partnership | | | | | | | | | | |
| Preference Units: | | | | | | | | | | |
| | |
| |
| Essex Portfolio, L.P., | | | | | | | | | | |
| 7.875% Series B | | | | | | | | | | |
| Cumulative Redeemable | | | | | | | | | | |
| Preferred Units, Callable | | | | | | | | | | |
| 12/31/09, Current Yield: | | | | | | | | | | |
| 7.71% | | | | $11,370,510 | | | | $11,370,510 | | $11,495,745 |
| |
| Essex Portfolio, L.P., | | | | | | | | | | |
| 7.875% Series D | | | | | | | | | | |
| Cumulative Redeemable | | | | | | | | | | |
| Preferred Units, Callable | | | | | | | | | | |
| 7/28/10, Current Yield: | | | | | | | | | | |
| 7.65% | | | | | | $12,642,150 | | $12,642,150 | | $12,873,050 |
22
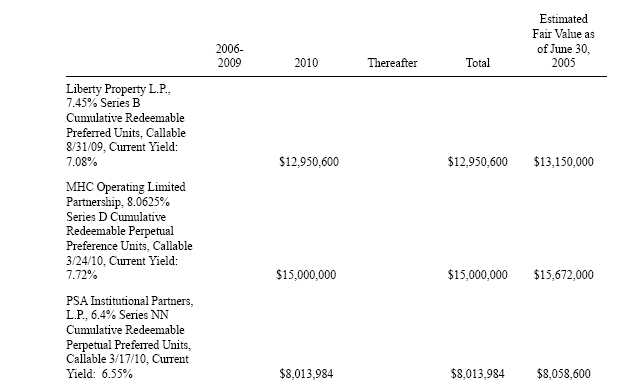
*The amounts listed reflect the Fund’s positions as of June 30, 2005. The Fund’s current positions may differ.
Item 4. Controls and Procedures.
Fund Governance.As the Fund’s manager, the complete and entire management, control and operation of the Fund are vested in Eaton Vance. The Fund’s Chief Executive Officer and Chief Financial Officer intend to report to the Board of Directors of Eaton Vance, Inc. (the sole trustee of Eaton Vance) any significant deficiency in the design or operation of internal control over financial reporting which could adversely affect the Fund’s ability to record, process, summarize and report financial data, and any fraud, whether or not material, that involves management or other employees who have a significant role in the Fund’s internal control over financial reporting. Effective August 10, 2005, Michelle A. Green will resume her position as the Fund’s Chief Financial Officer following her return from maternity leave.
Disclosure Controls and Procedures.Eaton Vance, as the Fund’s manager, evaluated the effectiveness of the Fund’s disclosure controls and procedures (as defined by Rule 13a-15(e) of the 1934 Act) as of the end of the period covered by this report, with the participation of the Fund’s Chief Executive Officer and Chief Financial Officer. The Fund’s disclosure controls and procedures are the controls and other procedures that the Fund designed to ensure that it records, processes, summarizes and reports in a timely manner the information that the Fund must disclose in reports that it files or submits to the Securities and Exchange Commission. Based on that evaluation, the Fund’s Chief Executive Officer and Chief Financial Officer concluded that, as of June 30, 2005, the Fund’s disclosure controls and procedures were effective.
Internal Control Over Financial Reporting.There were no changes in the Fund’s internal control over financial reporting that occurred during the quarter ended June 30, 2005 that have materially affected or are reasonably likely to materially affect the Fund’s internal control over financial reporting.
| | PART II.OTHER INFORMATION
|
| | Item 1. Legal Proceedings.
|
Although in the ordinary course of business, the Fund and its directly and indirectly controlled subsidiaries may become involved in legal proceedings, the Fund is not aware of any material pending legal proceedings to which any of them is subject.
23
Item 2. Unregistered Sales of Equity Securities and Use of Proceeds.
As described in the Fund’s Annual Report on Form 10-K for the year ended December 31, 2004, shares of the Fund may be redeemed by Fund shareholders on any business day. Redemptions are met at the net asset value per share of the Fund (less any applicable redemption fee). The right to redeem is available to all shareholders and all outstanding Fund shares are eligible (except for shares subject to an estate freeze election as described in Item 5 of the Fund's Annual Report on Form 10-K for the fiscal year ending December 31, 2004). During each month in the quarter ended June 30, 2005, the total number of shares redeemed and the average price paid per share were as follows:
| | | Total No. of Shares | | Average Price Paid |
| Month Ended | | Redeemed(1) | | Per Share |
|
| April 30, 2005 | | --- | | --- |
|
| May 31, 2005 | | 145,158.369 | | $99.34 |
|
| June 30, 2005 | | 21,339.595 | | $101.70 |
|
| Total | | 166,497.964 | | $101.08 |
| (1) | All shares redeemed during the periods were redeemed at the option of shareholders pursuant to the Fund’s redemption policy. The Fund has not announced any plans or programs to repurchase shares other than at the option of shareholders. |
| |
Item 3. Defaults Upon Senior Securities.
None.
Item 4. Submission of Matters to a Vote of Security Holders.
No matters were submitted to a vote of security holders during the three months ended June 30, 2005.
Item 5. Other Information.
|
| | Item 6. Exhibits and Reports on Form 8-K:
|
| (a) | The following is a list of all exhibits filed as part of this Form 10-Q: |
| |
| 10(4) | | (a) | | Copy of Amendment dated March 29, 2005 to Custody and Transfer Agency Agreement between the Fund |
| | | | | and Investors Bank & Trust Company filed herewith. |
| 31.1 | Certification Pursuant to 18 U.S.C. Section 1350, as Adopted Pursuant to Section 302 of the Sarbanes- Oxley Act of 2002 |
| |
| 31.2 | Certification Pursuant to 18 U.S.C. Section 1350, as Adopted Pursuant to Section 302 of the Sarbanes- Oxley Act of 2002 |
| |
| 32.1 | Certification Pursuant to 18 U.S.C. Section 1350, as Adopted Pursuant to Section 906 of the Sarbanes- Oxley Act of 2002 |
| |
| 32.2 | Certification Pursuant to 18 U.S.C. Section 1350, as Adopted Pursuant to Section 906 of the Sarbanes- Oxley Act of 2002 |
| |
| (b) | Reports on Form 8-K: None. |
| |
24
Pursuant to the requirements of the Securities Exchange Act of 1934, as amended, the registrant has duly caused this report to be signed on its behalf by the undersigned duly authorized officer on August 9, 2005.
| | /s/ James L. O'Connor
James L. O'Connor
Chief Financial Officer
(Duly Authorized Officer and
Principal Financial Officer)
|
25
EXHIBIT INDEX
10(4) (a) Copy of Amendment dated March 29, 2005 to Custody and Transfer Agency Agreement between the Fund and Investors Bank & Trust Company filed herewith.
| 31.1 | Certification Pursuant to 18 U.S.C. Section 1350, as Adopted Pursuant to Section 302 of the Sarbanes- Oxley Act of 2002 |
| |
| 31.2 | Certification Pursuant to 18 U.S.C. Section 1350, as Adopted Pursuant to Section 302 of the Sarbanes- Oxley Act of 2002 |
| |
| 32.1 | Certification Pursuant to 18 U.S.C. Section 1350, as Adopted Pursuant to Section 906 of the Sarbanes- Oxley Act of 2002 |
| |
| 32.2 | Certification Pursuant to 18 U.S.C. Section 1350, as Adopted Pursuant to Section 906 of the Sarbanes- Oxley Act of 2002 |
| |
26