UNITED STATES SECURITIES AND EXCHANGE COMMISSION
Washington, D.C. 20549
|
ANNUAL REPORT PURSUANT TO SECTION 13
OF THE SECURITIES EXCHANGE ACT OF 1934 (THE ACT)
For the Fiscal Year Ended December 31, 2005
Commission File No.000-50258
|
Belrose Capital Fund LLC (the Fund)
(Exact name of registrant as specified inits charter)
|
| Delaware | | 04-3613468 |
| (State of organization) | | (I.R.S. Employer Identification No.) |
The Eaton Vance Building
255 State Street
Boston, Massachusetts 02109
(Address and zip code of principal executive offices)
|
617-482-8260
(Registrant’s telephone number)
|
Securities registered pursuant to Section 12(g) of the Act:Limited Liability Company Interests in the Fund (Shares)
Indicate by check mark if Registrant is a well-known seasoned issuer as defined in Rule 405 of the Securities Act of 1933. [X] Yes [ ] No
Indicate by check mark if Registrant is not required to file reports pursuant to Section 13 or Section 15(d) of the Act. [ ] Yes [ X] No
Indicate by check mark whether Registrant (1) has filed all reports required to be filed by Section 13 or 15(d) of the Act during the preceding 12 months (or for such shorter period that the Registrant was required to file such reports), and (2) has been subject to such filing requirements for the past 90 days. [X] Yes [ ] No
Indicate by check mark if disclosure of delinquent filers pursuant to Item 405 of Regulation S-K is not contained herein, and will not be contained, to the best of Registrant’s knowledge, in definitive proxy or information statements incorporated by reference in Part III of this Form 10-K or any amendment to this Form 10-K. [X]
Indicate by check mark whether the Registrant is a large accelerated filer, an accelerated filer or a non-accelerated filer (as defined in Rule 12b-2 of the Act). Large Accelerated Filer [X] Accelerated Filer [ ] Non-accelerated Filer [ ]
Indicate by check mark whether the Registrant is a shell company (as defined in Rule 12b-2 of the Act).Yes [ ] No [X]
Aggregate market value of the Shares held by non-affiliates of Registrant, based on the closing net asset value on June 30, 2005 was $1,656,653,056. Calculation of holdings by non-affiliates is based upon the assumption, for these purposes only, that the Registrant’s manager, its executive officers and directors and persons holding 5% or more of the Registrant’s Shares are affiliates.
Incorporations by Reference:None.
|
The Exhibit Index is located on page 80.
|
Belrose Capital Fund LLC
Index to Form 10-K
| Item | | | | Page |
| | | PART I | | |
| |
| 1 | | Business ............................................................................................................................. | | 1 |
| | | Fund Overview ......................................................................................................... | | 1 |
| | | Structure of the Fund ...................................................................................... | | 1 |
| | | Fund Management ........................................................................................... | | 1 |
| | | The Fund’s Offering ........................................................................................ | | 2 |
| |
| | | The Fund’s Investment in Belvedere Capital Fund Company LLC | | |
| | | and Tax-Managed Growth Portfolio ......................................................................... | | 2 |
| | | Belvedere Company ........................................................................................ | | 2 |
| | | The Portfolio ................................................................................................... | | 2 |
| | | The Portfolio’s Investment Objective and Policies ............................................. | | 3 |
| | | The Portfolio’s Tax-Sensitive Management Strategies ....................................... | | 3 |
| |
| | | The Fund’s Real Estate Investments ........................................................................... | | 4 |
| | | Real Estate Joint Venture Investments .............................................................. | | 4 |
| | | Partnership Preference Units ........................................................................... | | 5 |
| | | Organization of the Fund’s Controlled Subsidiaries .......................................... | | 6 |
| |
| | | Fund Borrowings ....................................................................................................... | | 6 |
| | | Interest Rate Swap Agreements ....................................................................... | | 7 |
| |
| | | The Eaton Vance Organization ................................................................................... | | 7 |
| | | Conflicts of Interest ......................................................................................... | | 7 |
| |
| 1A | | Risk Factors ....................................................................................................................... | | 7 |
| |
| 1B | | Unresolved Staff Comments ................................................................................................ | | 8 |
| |
| 2 | | Properties .......................................................................................................................... | | 8 |
| |
| 3 | | Legal Proceedings ............................................................................................................... | | 8 |
| |
| 4 | | Submission of Matters to a Vote of Security Holders ........................................................... | | 8 |
| |
| | | PART II | | |
| |
| 5 | | Determining Net Asset Value, Market for Fund Shares, | | |
| | | Related Shareholder Matters and Issuer Purchases of Equity Securities ............................... | | 9 |
| | | Market Information, Restrictions on Transfers and Redemption of Shares ................... | | 9 |
| | | Transfers of Fund Shares ................................................................................. | | 9 |
| | | Redemption of Fund Shares ............................................................................. | | 9 |
| | | Determining Net Asset Value ........................................................................... | | 10 |
| | | Historic Net Asset Values ................................................................................ | | 11 |
| | | Record Holders of Shares of the Fund ........................................................................ | | 11 |
| | | Distributions .............................................................................................................. | | 11 |
| | | Income and Capital Gain Distributions .............................................................. | | 11 |
| | | Special Distributions ....................................................................................... | | 12 |
| 6 | | Selected Financial Data ....................................................................................................... | | 13 |
| | | Table of Selected Financial Data ................................................................................. | | 13 |
| |
| 7 | | Management’s Discussion and Analysis of Financial Condition (MD&A) | | |
| | | and Results of Operations .................................................................................................. | | 14 |
| | | Results of Operations ................................................................................................ | | 14 |
| | | MD&A and Results of Operations for the Year Ended December 31, 2005 | | |
| | | Compared to the Year Ended December 31, 2004 .................................................... | | 14 |
| | | Performance of the Fund .................................................................................. | | 14 |
| | | Performance of the Portfolio .............................................................................. | | 15 |
| | | Performance of Real Estate Investments ............................................................ | | 15 |
| | | Performance of Interest Rate Swap Agreements ................................................ | | 17 |
| | | MD&A and Results of Operations for the Year Ended December 31, 2004 | | |
| | | Compared to the Year Ended December 31, 2003 ................................................... | | 17 |
| | | Performance of the Fund .................................................................................. | | 17 |
| | | Performance of the Portfolio .............................................................................. | | 17 |
| | | Performance of Real Estate Investments ............................................................ | | 18 |
| | | Performance of Interest Rate Swap Agreements .................................................. | | 19 |
| | | Liquidity and Capital Resources ................................................................................... | | 20 |
| | | Outstanding Borrowings .................................................................................... | | 20 |
| | | Liquidity ........................................................................................................... | | 20 |
| | | Off-Balance Sheet Arrangements ................................................................................ | | 20 |
| | | The Fund’s Contractual Obligations ............................................................................. | | 21 |
| | | Critical Accounting Estimates ...................................................................................... | | 21 |
| |
| 7A | | Quantitative and Qualitative Disclosures About Market Risk .................................................. | | 24 |
| | | Quantitative Information About Market Risk ................................................................ | | 24 |
| | | Interest Rate Risk .............................................................................................. | | 24 |
| | | Qualitative Information About Market Risk .................................................................. | | 25 |
| | | Risks Associated with Equity Investing ............................................................... | | 25 |
| | | Risks of Investing in Foreign Securities ............................................................... | | 26 |
| | | Risks of Certain Investment Techniques ............................................................. | | 26 |
| | | Risks of Real Estate Investments ........................................................................ | | 27 |
| | | Risks of Interest Rate Swap Agreements ........................................................... | | 28 |
| | | Risks of Leverage ............................................................................................ | | 28 |
| |
| 8 | | Financial Statements and Supplementary Data ....................................................................... | | 29 |
| |
| 9 | | Changes in and Disagreements with Accountants on | | |
| | | Accounting and Financial Disclosure ..................................................................................... | | 29 |
| |
| 9A | | Controls and Procedures ....................................................................................................... | | 29 |
| | | Fund Governance ......................................................................................................... | | 29 |
| | | Disclosure Controls and Procedures ............................................................................. | | 30 |
| | | Internal Control Over Financial Reporting .................................................................... | | 30 |
| |
| 9B | | Other Information ................................................................................................................ | | 30 |
| | | PART III | | |
| |
| 10 | | Directors and Executive Officers of the Registrant ............................................................. | | 31 |
| | | Management .......................................................................................................... | | 31 |
| | | Compliance with Section 16(a) of the Securities Exchange Act of 1934 ................... | | 32 |
| | | Code of Ethics ....................................................................................................... | | 32 |
| |
| 11 | | Executive Compensation ................................................................................................. | | 32 |
| |
| 12 | | Security Ownership of Certain Beneficial Owners and Management | | |
| | | and Related Shareholder Matters .................................................................................... | | 32 |
| | | Security Ownership of Certain Beneficial Owners ................................................... | | 32 |
| | | Security Ownership of Management ....................................................................... | | 32 |
| | | Changes in Control ................................................................................................ | | 32 |
| |
| 13 | | Certain Relationships and Related Transactions ................................................................ | | 32 |
| | | The Fund’s Investment Advisory and Administrative Fee ......................................... | | 33 |
| | | Belrose Realty’s Management Fee ......................................................................... | | 33 |
| | | The Portfolio’s Investment Advisory Fee ................................................................ | | 34 |
| | | Servicing Fees Paid by the Fund ............................................................................. | | 34 |
| | | Servicing Fees Paid by Belvedere Company ........................................................... | | 34 |
| | | Distribution Fees Paid to EV Distributors ................................................................ | | 34 |
| | | Redemption Fees .................................................................................................. | | 34 |
| | | Certain Real Estate Investment Transactions .......................................................... | | 35 |
| |
| 14 | | Principal Accountant Fees and Services .......................................................................... | | 35 |
| |
| | | PART IV | | |
| |
| 15 | | Exhibits and Financial Statement Schedules ...................................................................... | | 36 |
| |
| APPENDIX A ..................................................................................................................................... | | 37 |
| |
| FINANCIAL STATEMENTS ............................................................................................................. | | 38 |
| |
| SIGNATURES .................................................................................................................................... | | 79 |
| |
| EXHIBIT INDEX ................................................................................................................................ | | 80 |
Fund Overview.Belrose Capital Fund LLC (the Fund) is a private investment company organized by Eaton Vance Management (Eaton Vance) to provide diversification and tax-sensitive investment management to investors holding large and concentrated positions in equity securities of selected public companies. The Fund’s investment objective is to achieve long-term, after-tax returns for persons who have invested in the Fund (Shareholders). The Fund, a Delaware limited liability company, commenced its investment operations on March 19, 2002. Limited liability company interests of the Fund (Shares) were issued to Shareholders at six closings during 2002 and 2003. At each Fund closing, the Fund accepted contributions of stock from investors in exchange for Shares of the Fund. The Fund discontinued offering Shares on February 19, 2003 and, while the Fund is not prohibited from doing so, no future offering is anticipated. As of December 31, 2005, the Fund had net assets of approximately $1.8 billion.
Structure of the Fund.The Fund is structured to provide tax-free diversification and tax-sensitive investment management to Shareholders. To meet the objective of tax-free diversification, the Fund must satisfy specific requirements of the Internal Revenue Code of 1986, as amended (the Code). In order for the contributions of appreciated stock to the Fund by Shareholders to be nontaxable, not more than 80% of the Fund’s assets (calculated in the manner prescribed) may consist of “stocks and securities” as defined in the Code. To meet this requirement, the Fund invests at least 20% of its assets as so determined in certain real estate investments (see “The Fund’s Real Estate Investments” below). The Fund invests up to 80% of its assets in a diversified portfolio of common stocks (see “The Fund’s Investment in Belvedere Capital Fund Company LLC and Tax-Managed Growth Portfolio” below). The Fund acquired its real estate investments with borrowed funds, as described below under “Fund Borrowings”. See Appendix A for a chart detailing the investment structure of the Fund.
In its investment program, the Fund balances investment considerations and tax considerations, and takes into account the taxes payable by Shareholders on allocated investment income and realized capital gains. See “The Fund’s Investment in Belvedere Capital Fund Company LLC and Tax-Managed Growth Portfolio” below.
There is no trading market for the Fund’s Shares. As described further under “Redemption of Fund Shares” in Item 5(a), Fund Shares may be redeemed on any business day. The Fund satisfies redemption requests principally by distributing securities, but may also distribute cash. The value of securities and cash distributed to satisfy a redemption will equal the net asset value of the number of Shares redeemed less any applicable redemption fee. Under most circumstances, a redemption from the Fund that is met by distributing securities as described herein will not result in the recognition of capital gains by the Fund or by the redeeming Shareholder. The redeeming Shareholder would generally recognize capital gains upon the sale of the securities received upon the redemption.
The Fund intends to distribute at the end of each year, or shortly thereafter, all of its net investment income for such year, if any. The Fund also intends to make annual capital gain distributions equal to approximately 18% of the amount of its net realized capital gains, if any, other than certain precontribution gains. The Fund’s distributions generally are based on determinations of net investment income and net realized capital gains for federal income tax purposes. Such amounts may differ from net investment income or loss and net realized gain or loss as set forth in the Fund’s consolidated financial statements due to differences in the treatment of various income, gain, loss, expense and other items for federal income tax purposes and under generally accepted accounting principles (GAAP). The Fund intends to pay any distributions on the last business day of each fiscal year of the Fund (which concludes on December 31) or shortly thereafter. See“Distributions” in Item 5(c).
Fund Management.The manager of the Fund is Eaton Vance, a Massachusetts business trust registered as an investment adviser under the Investment Advisers Act of 1940, as amended (the Advisers Act). Eaton Vance and its subsidiary, Boston Management and Research (Boston Management), provide management and advisory services to the Fund, its real estate subsidiary and the investment portfolio in which the Fund invests. Boston Management is also registered as an investment adviser under the Advisers Act. Eaton Vance and Boston Management provide advisory, administration and/or management services to over 150 investment companies, as well as separate accounts managed for individual and institutional investors. As of December 31, 2005, Eaton Vance and its affiliates managed more than $110 billion on behalf of clients. The fees payable to the Eaton Vance organization, as well as other fees payable by the Fund, are described in Item 13. The Eaton Vance organization is subject to certain conflicts of interest in providing services to the Fund, its subsidiaries and the investment portfolio in which the Fund invests. See “The Eaton Vance Organization – Conflicts of Interest" below.
1
The Fund’s Offering.Shares of the Fund were privately offered and sold only to “accredited investors” as defined in Rule 501(a) under the Securities Act of 1933, as amended (the Securities Act), who were “qualified purchasers” (as defined in Section 2(a)(51)(A) of the Investment Company Act of 1940, as amended (the 1940 Act)). The offering was conducted by Eaton Vance Distributors, Inc. (EV Distributors), a wholly-owned subsidiary of Eaton Vance, as placement agent and by certain subagents appointed by EV Distributors. The Shares were offered and sold in reliance upon an exemption from registration provided by Rule 506 under the Securities Act. The Fund issued Shares to Shareholders at closings taking place on March 19, 2002, May 22, 2002, July 30, 2002, October 9, 2002, December 18, 2002 and February 19, 2003. At the six closings, an aggregate of 17,590,033 Shares were issued in exchange for Shareholder contributions totaling approximately $1.5 billion.
The Fund is registered under the Securities Exchange Act of 1934, as amended (the 1934 Act), and files periodic reports (such as reports on Form 10-Q and Form 10-K) thereunder. Copies of the reports filed by the Fund are available: at the public reference room of the Securities and Exchange Commission (SEC) in Washington, DC (call 1-202-942-8090 for information on the operation of the public reference room); on the EDGAR Database on the SEC’s Internet site (http:// www.sec.gov); or, upon payment of copying fees, by writing to the SEC’s public reference section, Washington, DC 20549-0102, or by electronic mail at publicinfo@sec.gov. The Fund does not have a website. The Fund intends to provide Shareholders with an annual and semiannual report containing the Fund’s consolidated financial statements, audited by the Fund’s independent registered public accounting firm in the case of the annual report.
The Fund’s Investment in Belvedere Capital Fund Company LLC and Tax-Managed Growth Portfolio.At each Fund closing, all of the securities accepted for contribution to the Fund were contributed by the Fund to Belvedere Capital Fund Company LLC (Belvedere Company), a Massachusetts limited liability company, in exchange for shares of Belvedere Company. Belvedere Company, in turn, immediately thereafter contributed the securities received from the Fund to Tax-Managed Growth Portfolio (the Portfolio) in exchange for an interest in the Portfolio. The Portfolio is a diversified, open-end management investment company registered under the 1940 Act with net assets of approximately $19.0 billion as of December 31, 2005. As of December 31, 2005, the Fund’s investment in the Portfolio through Belvedere Company had a value of approximately $1.8 billion (equal to approximately 74.7% of the Fund’s total assets on a consolidated basis).
Belvedere Company.Belvedere Company was organized in 1997 by Eaton Vance to offer tax-free diversification and tax-sensitive investment management to certain qualified investors who contributed diversified portfolios of equity securities. As of December 31, 2005, the investment assets of Belvedere Company consisted exclusively of an interest inthe Portfolio with a value of approximately $13.4 billion. As of such date, the Fund owned approximately 13.3% of Belvedere Company’s outstanding shares. As of December 31, 2005, the other investors in Belvedere Company included ten other investment funds sponsored by the Eaton Vance organization (investment fund investors), as well as qualified individual investors who acquired shares of Belvedere Company in exchange for portfolios of acceptable securities (non-investment fund investors).
Belvedere Company considers for acceptance equity securities that (i) are listed on the New York Stock Exchange (NYSE), the American Stock Exchange, the NASDAQ National Market or a major foreign exchange, (ii) have a trading price of at least $10.00 per share and (iii) are issued by issuers having an equity market capitalization of at least $500 million. Because Belvedere Company only accepts contributions of diversified baskets of securities (as described below), it is not subject to the requirement that not more than 80% of its assets consist of “stocks and securities” as defined in the Code. For investors that own a diversified basket of securities, investing in Belvedere Company (rather than in the Fund) avoids the costs and risks of investing in real estate and the associated financial leverage to which the Fund is subject. See "Risks of Real Estate Investments" and "Risks of Leverage" in Item 7A(b).
Belvedere Company provides a vehicle through which investment fund and non-investment fund investors contributing a “diversified basket of securities” can acquire an indirect interest in the Portfolio. A “diversified basket of securities” means a group of securities that is diversified such that not more than 25% of the value of the securities are investments in the securities of any one issuer and not more than 50% of the value of the securities are investments in the securities of five or fewer issuers. The securities contributed to Belvedere Company at each Fund closing constituted a diversified basket of securities. Because the Fund is required to hold a percentage of its investments in non-Portfolio assets in order to meet certain tax requirements (see “Structure of the Fund” above and “The Fund’s Real Estate Investments” below), it does not satisfy the conditions of the 1940 Act for investing directly in the Portfolio.
The Portfolio.The Portfolio was organized in 1995 by Eaton Vance as the successor to the investment operations of Eaton Vance Tax-Managed Growth Fund 1.0 (Tax-Managed Growth 1.0), a mutual fund established in 1966 by Eaton Vance and
2
managed from inception for long-term, after-tax returns. As of December 31, 2005, investors in the Portfolio included six investors in addition to Belvedere Company and Tax-Managed Growth 1.0, each of which acquired or is acquiring on a continuous basis interests in the Portfolio with cash. All investors in the Portfolio are sponsored by or affiliated with Eaton Vance. As of December 31, 2005, Belvedere Company owned approximately 70.4% of the Portfolio.
The Fund invests in the Portfolio (on an indirect basis through Belvedere Company) because it is a well-established investment portfolio that has an investment objective and policies that are compatible to those of the Fund. Investing in the Portfolio enables the Fund to participate in a substantially larger and more diversified investment portfolio than it could achieve by managing the contributed securities directly. The audited financial statements of the Portfolio for the year ended December 31, 2005 are included as pages 61 to 77 of this Annual Report on Form 10-K. The Portfolio’s audited financial statements include information about the assets and liabilities of the Portfolio, including Portfolio expenses. For a discussion of the Portfolio’s performance for the year ended December 31, 2005, see “Performance of the Portfolio” in Item 7. For a description of the investment advisory fee payable by the Portfolio, see "The Portfolio’s Investment Advisory Fee" in Item 13.
The Portfolio’s Investment Objective and Policies.The investment objective of the Portfolio is to achieve long-term, after-tax returns for its investors by investing in a diversified portfolio of equity securities. The Portfolio invests primarily in common stocks of domestic and foreign growth companies that are considered by its investment adviser to be high in quality and attractive in their long-term investment prospects. The Portfolio seeks to invest in a broadly diversified portfolio of stocks and to invest primarily in established companies with characteristics of above-average growth, predictability and stability that are acquired with the expectation of being held for a period of years. Under normal market conditions, the Portfolio invests primarily in common stocks. The Portfolio has acquired securities through contributions from Belvedere Company, Tax-Managed Growth 1.0 and Tax-Managed Growth Fund 1.1, and through purchases of securities with cash invested in the Portfolio by other investors.
Although the Portfolio may, in addition to investing in common stocks, invest in investment-grade preferred stocks and debt securities, purchases of such securities are normally limited to securities convertible into common stocks and temporary investments in short-term notes and government obligations. During periods in which the investment adviser to the Portfolio believes that returns on common stock investments may be unfavorable, the Portfolio may invest a portion of its assets in U.S. government obligations and high quality short-term notes. The Portfolio’s holdings represent a number of different industries. Not more than 25% of the Portfolio’s assets may be invested inthe securities of issuers having their principal business activity in the same industry, determined as of the time of acquisition of any such securities.
The Portfolio’s Tax-Sensitive Management Strategies.In its operations, the Portfolio seeks to achieve long-term, after-tax returns in part by minimizing the taxes incurred by investors in the Portfolio in connection with the Portfolio’s investment income and realized capital gains. Taxes on investment incomeare minimized by investing primarily in lower-yielding securities and stocks that pay dividends that qualify for favorable federal tax treatment. Taxes on realized capital gains are minimized by avoiding or minimizing the sale of securities holdings with large accumulated capital gains. The Portfolio generally seeks to avoid net realized short-term capital gains.
When the Portfolio decides to sell a particular appreciated security, the Portfolio will select for sale the share lots resulting in the most favorable tax treatment, generally those with holding periods sufficient to qualify for long-term capital gain treatment that have the highest cost basis. The Portfolio may, when deemed prudent by its investment adviser, sell securities to realize capital losses that can be used to offset realized gains. While the Portfolio generally retains the securities contributed to the Portfolio by Belvedere Company, the Portfolio has the flexibility to sell contributed securities. Securities acquired by the Portfolio with cash may be sold in accordance with its management strategies. In lieu of selling a security, the Portfolio may hedge its exposure to that security by using the techniques described below. The Portfolio also disposes of contributed securities through its practice of settling redemptions by investors in the Portfolio that contributed securities primarily by distributing securities as described in Item 5(a) under “Redemption of Fund Shares.” As described in Item 5(a), settling redemptions with securities can result in certain tax benefits to the Portfolio, Belvedere Company, the Fund and the redeeming Shareholder.
To reduce its exposure to adverse price movements in individual securities or groups of securities holdings with large accumulated gains, the Portfolio may use various investment techniques, including, but not limited to, the purchase of put options on securities held, equity collars (combining the purchase of a put option and the sale of a call option), equity swaps, short sales of individual securities held, short sales of index or basket securities whose constituents are held in whole or in part, forward sales of stocks held, and the purchase and sale of futures contracts on stocks and stock indexes
3
and options thereon. By using these techniques rather than selling such securities, the Portfolio can, within certain limits, reduce its exposure to price declines in the securities without realizing substantial capital gains under current tax law.
The Portfolio’s ability to utilize covered short sales, certain equity swaps, forward sales, futures contracts and certain equity collar strategies as a tax-efficient management technique with respect to holdings of appreciated securities is limited to circumstances in which the hedging transaction isclosed out within 30 days after the end of the Portfolio’s taxable year in which the hedging transaction was initiated and the underlying appreciated securities position is held unhedged for at least the next 60 days after such hedging transaction is closed. In addition, dividends received on stock for which the Portfolio is obligated to make related payments (pursuant to a short sale or otherwise) with respect to positions in substantially similar or related property are subject to federal income tax at ordinary rates and do not qualify for favorable tax treatment. Also, the holding periods required to receive tax-advantaged treatment of qualified dividends on a stock are suspended whenever the Portfolio has an option (other than a qualified covered call option not in the money when written) or contractual obligation to sell or an open short sale of substantially identical stock, is the grantor of an option (other than a qualified covered call option not in the money when written) to buy substantially identical stock or has diminished risk of loss in such stock by holding positions with respect to substantially similar or related property. The use of these investment techniques may require the Portfolio to commit or make available cash and, therefore, may not be available at such times as the Portfolio has limited holdings of cash. At December 31, 2005, the Portfolio held no short positions. The Portfolio did not otherwise employ any of the techniques described above on securities holdings during the year ended December 31, 2005. See "Risks of Certain Investment Techniques" in Item 7A(b).
The Fund’s Real Estate Investments.Separate from its investment in the Portfolio through Belvedere Company, the Fund invests in certain real estate investments through Belrose Realty Corporation (Belrose Realty). The ownership structure of Belrose Realty is described below under “Organization of the Fund’s Controlled Subsidiaries”. As referred to above under “Fund Overview – Structure of the Fund”, the Fund invests in real estate investments to satisfy certain requirements of the Code for contributions of appreciated stocks to the Fund by Shareholders to be nontaxable. As of December 31, 2005, the consolidated real estate investments of Belrose Realty totaled approximately $570.8 million and represented 23.3% of the Fund’s assets on a consolidated basis. The Fund acquired its real estate investments with borrowed funds, as described below under “Fund Borrowings”. The Fund seeks a return on its real estate investments over the long term that exceeds the cost of the borrowings incurred to acquire such investments. For a description of material real estate investment transactions during the year ended December 31, 2005, see "Performance of Real Estate Investments" in Item 7(a).
At December 31, 2005, Belrose Realty held investments in two real estate joint ventures (Real Estate Joint Ventures) that are controlled by Belrose Realty, in a portfolio of income producing preferred equity interests in real estate operating partnerships that generally are affiliated with real estate investment trusts (REITs) that are publicly-traded (Partnership Preference Units), and in certain other real estate investments. Certain of the Partnership Preference Units are held by Belrose Realty indirectly through Belvorn Holdings LLC (Belvorn). Belvorn is a Delaware limited liability company formed in 2005 and treated as a partnership for tax purposes. At December 31, 2005, Belvorn’s sole investment was Partnership Preference Units issued by Vornado Realty, L.P. At December 31, 2005, Belrose Realty owned 10.0% of Belvorn’s outstanding units. Information included herein about Belrose Realty’s Partnership Preference Units includes the Partnership Preference Units held directly through Belrose Realty and indirectly through Belvorn. As of December 31, 2005, approximately 67.4% of the consolidated real estate investments of the Fund consisted of its investments in the Real Estate Joint Ventures, approximately 32.5% was investments in Partnership Preference Units and approximately 0.1% was investments in other real estate.
In the future, Belrose Realty may invest in other types of real estate investments, such as one or more real properties subject to long-term leases (Net Leased Property). Belrose Realty may purchase real estate investments from, and sell them to, real estate affiliates of other investment funds advised by Boston Management. See "Certain Real Estate Investment Transactions" in Item 13.
Boston Management serves as manager of Belrose Realty. In that capacity, Boston Management manages the investment and reinvestment of Belrose Realty’s assets and administers its affairs. See "Belrose Realty’s Management Fee" in Item 13 for a description of the management fee payable by Belrose Realty to Boston Management.
Real Estate Joint Venture Investments.At December 31, 2005, Belrose Realty owned a controlling interest in two Real Estate Joint Ventures, Deerfield Property Trust (Deerfield) and Katahdin Property Trust LLC (Katahdin). Deerfield owns real property through its interest in ProLogis Six Rivers Limited Partnership and the ProLogis Deerfield Fund L.P. Belrose
4
Realty owns a majority economic interest in each of Deerfield and Katahdin and controls a majority of the boards. Belrose Realty’s approval is required for all major decisions affecting Deerfield and Katahdin.
The day-to-day operating management of the real properties owned by Deerfield and Katahdin is provided by a real estate operating company that is the principal minority investor in the respective Real Estate Joint Venture or an affiliated company thereof (the Operating Partners). The Operating Partners receive certain fees from Deerfield and Katahdin (including property management fees and, in the case of Deerfield, fees for administration, construction management, leasing, acquisitions, dispositions, debt placement, tax preparation, legal and other services) and, in addition, are reimbursed for payroll and other direct expenses incurred.. For the year ended December 31, 2005, such fees totaled approximately $2.7 million.
At December 31, 2005, the assets of Katahdin consisted of 6 multifamily properties and the assets of Deerfield consisted of 17 industrial distribution properties, in each case acquired from or in conjunction with the Operating Partner thereof. See Item 2. Distributable cash flows from Deerfield and Katahdin are allocated in a manner that provides Belrose Realty: 1) a priority position versus the Operating Partners with respect to a fixed annual preferred return; and 2) participation on a pro rata or reduced basis in distributable cash flows in excess of the annual preferred return of Belrose Realty and the subordinated preferred return of the Operating Partners. A portion of Belrose Realty’s investment in Deerfield represents a partial interest in a property management contract pursuant to which Deerfield may receive cash flows from management fees and certain other fees over the life of the contract.
Financing for Deerfield and Katahdin consists primarily of fixed-rate secured mortgage debt obligations of Deerfield and Katahdin that are without recourse to Belrose Realty and the Fund. Both Belrose Realty and the respective Operating Partner invested equity in Deerfield and Katahdin. Belrose Realty’s equity in Deerfield and Katahdin was acquired using the proceeds of Fund borrowings.
A board of managers or trustees controlled by Belrose Realty oversees the performance of each Operating Partner and controls the major decisions of Deerfield and Katahdin. The persons serving as managers and trustees on behalf of Belrose Realty are employees of Boston Management. See “Directors and Executive Officers” in Item 10(a). No director of Belrose Realty or manager or trustee of Deerfield or Katahdin is a Shareholder of the Fund. The Operating Partners of Deerfield and Katahdin also serve as operating partners of other Real Estate Joint Ventures that are majority owned by real estate affiliates of other investment funds advised by Boston Management. Eaton Vance and its affiliates do not have a material financial interest in Deerfield and Katahdin.
The Operating Partner of Katahdin is Archstone-Smith Operating Trust. Archstone-Smith Trust (Archstone-Smith), the sole trustee of Archstone-Smith Operating Trust, is a publicly owned REIT. Archstone-Smith is traded on the NYSE under the symbol “ASN”. Archstone-Smith owns 25% of the voting shares of Katahdin. Belrose Realty owns the balance of such shares. Pursuant to a buy/sell agreement entered into at the time Katahdin was established, either Belrose Realty or Archstone-Smith can give notice on or after November 23, 2010 either to buy the other’s equity interest in Katahdin or to sell its own equity interest in Katahdin. Any such purchase or sale would be at a negotiated price.
The Operating Partner of Deerfield is ProLogis, a publicly owned REIT. Common shares of ProLogis are traded on the NYSE under the symbol "PLD". ProLogis owns 20% of the voting shares of Deerfield. Belrose Realty owns the balance of such shares. Pursuant to an agreement with ProLogis, from and after August 4, 2013 either Belrose Realty or ProLogis may cause a liquidation of Deerfield. If Belrose Realty elects to liquidate Deerfield, ProLogis will have the right either to purchase the shares of Deerfield owned by Belrose Realty or to acquire the assets of Deerfield, in either case at a price determined through an independent appraisal of the assets of Deerfield. The Deerfield operative documents prohibit any transfer of shares that would adversely affect Deerfield’s qualification as a REIT.
The buy/sell agreement applicable to Deerfield and the liquidation agreement applicable to Katahdin continue indefinitely, but could be terminated upon the receipt of the requisite approval of the owners of the voting interests therein. The sale to Belrose Realty by the Operating Partner of its interest in Deerfield or Katahdin would not affect the REIT qualification of Deerfield or Katahdin. If Belrose Realty were to dispose of its interest in Deerfield or Katahdin pursuant to a buy/sell agreement, liquidation agreement or otherwise, it may acquire an interest in a different real estate investment to replace the investment sold.
Partnership Preference Units.Belrose Realty’s investments in Partnership Preference Units represent preferred equity interests in real estate operating partnerships. The assets of the partnerships that issued the Partnership Preference Units owned by Belrose Realty on December 31, 2005 consisted primarily of direct or indirect ownership interests in real
5
properties, including multifamily properties, shopping centers, manufactured home communities, self-storage facilities and office and industrial properties. The Partnership Preference Units owned by Belrose Realty as of December 31, 2005 are listed in Item 7A(a) and in the consolidated portfolio of investments included in the Fund’s consolidated financial statements, which are included as pages 38 to 60 of this Annual Report on Form 10-K. Eaton Vance is not, and has not been, involved in the management or operation of the real estate operating partnerships that issued the Partnership Preference Units owned by Belrose Realty.
The Partnership Preference Units held by Belrose Realty were issued by partnerships that are not publicly-traded partnerships within the meaning of Code Section 7704(b). The Partnership Preference Units are perpetual life instruments (subject to call provisions) and are not, by their terms, readily convertible or exchangeable into cash or securities of the affiliated public company. Partnership Preference Units are not rated by a nationally-recognized rating agency, and such interests may not be as high in quality as issues that are rated investment grade.
Each issue of Partnership Preference Units held by Belrose Realty pays regular quarterly distributions at fixed rates from the net profits or gross income of the issuing partnership, with preferential rights over common and other subordinated units. None of the Partnership Preference Units is or will be registered under the Securities Act and each issue is thus subject to restrictions on transfer.
Organization of the Fund’s Controlled Subsidiaries.Belrose Realty, Deerfield and Katahdin operate in such a manner as to qualify for taxation as REITs under the Code. As REITs, Belrose Realty, Deerfield and Katahdin generally are not subject to federal income tax on that portion of their ordinary income or taxable gain that is distributed to stockholders each year. The Fund owns 100% of the common stock issued by Belrose Realty, and intends to hold all of the common stock at all times. Belrose Realty and the Operating Partners own all of the common shares of Deerfield and Katahdin.
Belrose Realty, Deerfield and Katahdin also have issued preferred shares to satisfy certain provisions of the Code, which require that a REIT be beneficially owned in the aggregate by 100 or more persons. The preferred shares of each such entity are owned by not less than 100 charitable organizations that received the preferred shares as gifts. Each charitable organization that received a preferred share was an “accredited investor” (as defined in the Securities Act) with total assets in excess of $5 million at the time the organization received the preferred shares. Eaton Vance selected the charitable organizations from the charities for which it has matched employee contributions and/or based on suggestions from its employees, ProLogis or Archstone-Smith. As of December 31, 2005, the total value of the preferred shares outstanding of Belrose Realty, Katahdin and Deerfield was $210,000, $216,000 and $240,000, respectively. Dividends on preferred shares are cumulative and payable annually at a dividend rate of 8% per year for Belrose Realty and Katahdin and 6% per year for Deerfield. The dividends paid on preferred shares have priority over payments on common shares. For the year ended December 31, 2005, Belrose Realty, Katahdin and Deerfield paid distributions to preferred shareholders of $16,800, $17,280 and $13,027, respectively.
Fund Borrowings.To finance its real estate investments, the Fund has entered into credit arrangements with DrKW Holdings, Inc. (the DrKW Credit Facility) and Merrill Lynch Mortgage Capital, Inc. (the MLMC Credit Facility) (collectively, the Credit Facility). The Credit Facility is secured by a pledge of the Fund’s assets, excluding the assets of Deerfield and Katahdin, and expires in June 2010. At December 31, 2005, the total principal amount outstanding under the Credit Facility was $393.5 million. The Credit Facility is also used to provide for selling commissions, organizational expenses and any liquidity needs of the Fund. Under certain circumstances, the Fund may increase the size of the Credit Facility (subject to lender consent) and the amount of outstanding borrowings thereunder.
The DrKW Credit Facility is a term credit agreement. Borrowings under the DrKW Credit Facility accrue interest at a rate of one-month LIBOR plus 0.30% per annum. As of December 31, 2005, outstanding borrowings under the DrKW Credit Facility totaled $242.5 million. During the quarter ended December 31, 2005, the Fund amended the DrKW Credit Facility to increase its borrowing by $9.0 million to $177.0 million.
The MLMC Credit Facility is a revolving credit agreement. The Fund may borrow up to $182.0 million under the MLMC Credit Facility, of which up to $10.0 million may be letters of credit. Borrowings under the MLMC Credit Facility accrue interest at a rate of one-month LIBOR plus 0.38% per annum. As of December 31, 2005, outstanding borrowings under the MLMC Credit Facility totaled $151.0 million. During the quarter ended December 31, 2005, the Fund amended the MLMC Credit Facility to increase its borrowing limit by $125.0 million to $182.0 million. There were no letters of credit issued as of December 31, 2005. The unused loan commitment amount totaled $31.0. A commitment fee of 0.10% per annum is paid on the unused commitment amount. The Fund pays all fees associated with issuing letters of credit.
6
Obligations under the Credit Facility are without recourse to Fund Shareholders. As described above, financing for Deerfield and Katahdin consists primarily of fixed-rate secured mortgage debt obligations of Deerfield and Katahdin that are without recourse to Belrose Realty, the Fund and Fund Shareholders.
Interest Rate Swap Agreements.The Fund has entered into interest rate swap agreements with Merrill Lynch Capital Services, Inc. (MLCS) to fix the cost of borrowings under the Credit Facility used to acquire equity in real estate investments. Pursuant to the interest rate swap agreements, the Fund makes cash payments to MLCS at fixed rates in exchange for floating rate payments from MLCS that fluctuate with one-month and three-month LIBOR. The interest rate swap agreements currently in effect with respect to Belrose Realty’s real estate investments extend until June 28, 2012, subject to the Fund’s earlier termination rights in the case of certain swaps, and provide for the Fund to make payments to MLCS at fixed rates averaging 4.26% . See Note 7 to the Fund’s consolidated financial statements included as pages 38 to 60 of this Annual Report on Form 10-K.
The Eaton Vance Organization.The Eaton Vance organization sponsors the Fund. Eaton Vance serves as the Fund’s manager. Boston Management serves as the Fund’s investment adviser and as manager of Belrose Realty. EV Distributors served as the Fund’s placement agent. The Fund’s business affairs are conducted by Eaton Vance (as its manager) and its investment operations are conducted by Boston Management (as its investment adviser). The Fund’s officers are employees of Eaton Vance. Eaton Vance, Boston Management and EV Distributors are wholly-owned subsidiaries of Eaton Vance Corp., a publicly-traded holding company that, through its affiliates and subsidiaries, engages primarily in investment management, administration and marketing activities.
As described above, the Fund pursues its objective primarily by investing in Belvedere Company. Belvedere Company invests exclusively in the Portfolio. Boston Management acts as investment adviser of the Portfolio and manager of Belvedere Company. EV Distributors acts as placement agent for Belvedere Company and the Portfolio. As of December 31, 2005, the assets of the Fund represented approximately 2.2% of assets under management by Eaton Vance and its affiliates. The offices of the Fund, Eaton Vance, Boston Management and EV Distributors are located at 255 State Street, Boston, Massachusetts 02109.
Conflicts of Interest.Boston Management and other Eaton Vance affiliates are subject to certain conflicts of interest in their dealings with the Fund, Belrose Realty, Belvedere Company and the Portfolio, as well as with other investment companies advised by Boston Management that invest in the Portfolio. Eaton Vance and Boston Management have determined and will determine which of their sponsored investment companies invest in the Portfolio, the securities each of them contributes to the Portfolio when making an investment therein and, subject to the rights of redeeming investors in the Portfolio, the securities and/or cash received in redemptions from the Portfolio. Such determinations are inherently subject to potential conflicts of interest. In addition, Portfolio management activities with respect to securities contributed to the Portfolio may have different tax consequences for the contributing investor in the Portfolio than for other investors in the Portfolio. Boston Management manages the Portfolio in pursuit of long-term, after-tax returns for all investors in the Portfolio and, with respect to contributed securities, takes into account the tax position of the contributing investor in the Portfolio. Whenever conflicts of interest arise, Eaton Vance, Boston Management and other Eaton Vance affiliates will endeavor to exercise their discretion in a manner that they believe is equitable to all interested persons.
Belrose Realty may purchase real estate investments from real estate affiliates of other investment funds that are advised by Boston Management. Belrose Realty may also co-invest with such entities in real estate investments and sell real estate investments to such entities. In any such transaction, the assets purchased and sold will be valued in good faith by Boston Management, after consideration of factors, data and information that Boston Management considers relevant. Transaction prices generally will include an allocation of the original costs incurred in creating and acquiring the transferred real estate investments. Real estate investments are often difficult to value and others could in good faith arrive at valuations different from those of Boston Management. See "Critical Accounting Estimates" in Item 7(e).
The Fund invests primarily in a diversified portfolio of common stocks and is thereby subject to general stock market risk. There can be no assurance that the performance of the Fund will match that of the U.S. stock market or that of other equity funds. In managing the Portfolio for long-term, after-tax returns, Boston Management generally seeks to avoid or minimize sales of securities with large accumulated capital gains, including contributed securities. Such securities constitute a substantial portion of the assets of the Portfolio. Although the Portfolio may utilize certain management strategies in lieu of selling appreciated securities, the Portfolio’s, and hence the Fund’s, exposure to losses during stock market declines may nonetheless be higher than funds that do not follow a general policy of avoiding sales of highly-
7
appreciated securities. The Fund is also subject to risks associated with real estate investments and certain other risks, which are described under "Qualitative Information About Market Risk" in Item 7A(b).
Item 1B. Unresolved Staff Comments.
None.
Item 2. Properties.
The Fund does not own any physical properties, other than indirectly through Belrose Realty’s investments. At December 31, 2005, Belrose Realty held investments in Partnership Preference Units of two issuers and owned majority interests in Deerfield and Katahdin whose assets are reflected in the consolidated financial statements of the Fund. At December 31, 2005, Katahdin owned six multifamily residential properties located in five states (Colorado, Florida, North Carolina, Texas and Washington). At December 31, 2005, Deerfield owned seventeen industrial distribution properties located in six states (Florida, Georgia, New Jersey, Ohio, Pennsylvania and South Carolina).
Item 3. Legal Proceedings.
|
Although in the ordinary course of business, the Fund and its directly and indirectly controlled subsidiaries may become involved in legal proceedings, the Fund is not aware of any material pending legal proceedings to which they are subject.
Item 4. Submission of Matters to a Vote of Security Holders.
No matters were submitted to a vote of security holders during the quarter ended December 31, 2005.
8
Item 5. Determining Net Asset Value, Market for Fund Shares, Related Shareholder Matters and Issuer Purchases of Equity Securities.
This Item and other Items in this report contain summaries of certain provisions contained in the Limited Liability Company Agreement of the Fund (the LLC Agreement), which was filed as an exhibit to the Fund’s registration statement on Form 10. All such summaries are qualified in their entirety by the actual provisions of the LLC Agreement, which are incorporated by reference herein.
(a) Market Information, Restrictions on Transfers and Redemption of Shares.
Transfers of Fund Shares.There is no established public trading market for the Shares of the Fund. Other than transfers to the Fund in a redemption, transfers of Shares are expressly prohibited by the LLC Agreement without the consent of Eaton Vance. Eaton Vance’s consent to a transfer may be withheld in its sole discretion for any reason or for no reason.
The Shares have not been and will not be registered under the Securities Act, and may not be resold unless an exemption from such registration is available. Shareholders have no right to require registration of the Shares and the Fund does not intend to register the Shares under the Securities Act or take any action to cause an exemption (whether pursuant to Rule 144 of the Securities Act or otherwise) to be available.
The Fund is not and will not be registered under the 1940 Act, and no transfer of Shares may be made if, as determined by Eaton Vance or counsel to the Fund, such transfer would result in the Fund being required to be registered under the 1940 Act. In addition, no transfer of Shares may be made unless, in the opinion of counsel to the Fund, such transfer would not result in termination of the Fund for purposes of Section 708 of the Code or result in the classification of the Fund as an association or a publicly traded partnership taxable as a corporation under the Code.
In no event shall all or any part of a Shareholder’s Shares be assigned to a minor or an incompetent, unless in trust for the benefit of such person. Shares may be sold, transferred, assigned or otherwise disposed of by a Shareholder only if it is determined by Eaton Vance or counsel to the Fund that such transfer, assignment or disposition would not violate federal securities or state securities or “blue sky” laws (including investor qualification standards).
There are no outstanding options or warrants to purchase, or securities convertible into, Shares of the Fund. Shares of the Fund cannot be sold pursuant to Rule 144 under the Securities Act, and the Fund does not propose to publicly offer any of its Shares at any time.
Redemption of Fund Shares.Shares of the Fund may be redeemed on any business day. The redemption price of Shares that are redeemed is based on the Fund’s net asset value next computed after receipt of the redemption request. Shares redeemed within three years of issuance are generally subject to a redemption fee equal to 1% of the net asset value of the Shares redeemed. See Item 13. During each month in the quarter ended December 31, 2005, the total number of Shares redeemed and the average price paid per Share were as follows:
| | | Total No. of Shares | | Average Price Paid |
| Month Ended | | Redeemed(1) | | Per Share |
|
| October | | 4,881.859 | | $102.42 |
|
| November | | 37,699.900 | | $104.74 |
|
| December | | 105,680.151 | | $109.32 |
|
| Total | | 148,261.910 | | $108.62 |
|
| (1) | All Shares redeemed during the periods were redeemed at the option of Shareholders pursuant to the Fund’s redemption policy. The Fund has not announced any plans or programs to repurchase Shares other than at the option of Shareholders. |
| |
The Fund satisfies redemption requests principally by distributing securities drawn from the Portfolio, but may also distribute cash. If requested by a redeeming Shareholder, the Fund will satisfy a redemption request by distributing securities that were contributed by the redeeming Shareholder, provided that such securities are held in the Portfolio at the time of redemption. The securities contributed by a Shareholder will not be distributed to any other Shareholder in the Fund (or to any other investor in Belvedere Company or the Portfolio) during the first seven years following their contribution unless the contributing Shareholder has withdrawn from the Fund.
9
Under most circumstances, a redemption from the Fund that is settled with securities as described herein will not result in the recognition of capital gains by the Fund or by the redeeming Shareholder. The redeeming Shareholder would generally recognize capital gains upon the sale of the securities received through redemption. If a redeeming Shareholder receives cash in addition to securities to settle a redemption, the amount of cash received will be taxable to the Shareholder to the extent it exceeds such Shareholder’s tax basis in Fund Shares. Shareholders should consult their tax advisors about the tax consequences of redeeming Fund Shares.
A Shareholder redemption request within seven years of a contribution of securities by such Shareholder is ordinarily satisfied by distributing securities that were contributed by such Shareholder, prior to distributing to such Shareholder any other securities held in the Portfolio. Securities contributed by a Shareholder may be distributed to other Shareholders in the Fund (or to other investors in Belvedere Company or the Portfolio) after a holding period of at least seven years and, if so distributed, would not be available to meet subsequent redemption requests made by the contributing Shareholder.
If requested by a redeeming Shareholder making a redemption of at least $1 million occurring more than seven years after such Shareholder’s final contribution of securities to the Fund, the Fund will generally distribute to the redeeming Shareholder a diversified basket of securities representing a range of industry groups that is drawn from the Portfolio, but the selection of individual securities would be made by Boston Management in its sole discretion. No interests in Real Estate Joint Ventures, Partnership Preference Units, Net Leased Property or other real estate investments will be distributed to meet a redemption request, and “restricted securities” will be distributed only to the Shareholder who contributed such securities or such Shareholder’s successor in interest.
Other than as set forth above, the allocation of each redemption between securities and cash and the selection of securities to be distributed will be at the sole discretion of Boston Management. Distributed securities may include securities contributed by Shareholders as well as other readily marketable securities held in the Portfolio. The value of securities and cash distributed to meet a redemption will equal the net asset value of the number of Shares being redeemed less any applicable redemption fee. The Fund’s Credit Facility prohibits the Fund from honoring redemption requests while there is an event of default outstanding under the Credit Facility.
The Fund may compulsorily redeem all or a portion of the Shares of a Shareholder if the Fund has determined that such redemption is necessary or appropriate to avoid registration of the Fund or Belvedere Company under the 1940 Act, or to avoid adverse tax or other consequences to the Portfolio, Belvedere Company, the Fund or Shareholders. No redemption fee is payable in the event of compulsory redemption, including those arising as the result of applicable anti-money laundering requirements.
The right of a Shareholder to redeem can be suspended and the payment of the redemption price may be deferred while there is an outstanding event of default under the Credit Facility, when the NYSE is closed, during periods when trading on the NYSE is restricted or during any emergency as determined by the SEC, at any time when it is impracticable for the Portfolio or the Fund to dispose of or value its assets, or during any other period permitted by order of the SEC for the protection of investors.
A capital account for each Shareholder is maintained on the books of the Fund. The account reflects the value of such Shareholder’s interest in the Fund, which is adjusted for profits, liabilities and distributions allocable to such account in accordance with Article 6 of the Fund’s LLC Agreement.
Subject to the consent of the manager of the Fund, a Shareholder may make an estate freeze election pursuant to which all or a portion of such Shareholder’s Shares will be divided into Preferred Shares and Common Shares (Estate Freeze Shares). Such division will be made in accordance with the terms of the LLC Agreement. Estate Freeze Shares are not transferable without the consent of the Fund’s manager and have no redemption rights or voting or consent rights.
Determining Net Asset Value.Boston Management, as investment adviser, is responsible for determining the value of the Fund’s assets. The Fund’s custodian, Investors Bank & Trust Company, calculates the value of the assets of the Fund, Belvedere Company and the Portfolio each day that the NYSE is open for trading, as of the close of regular trading on the NYSE. The Fund’s net asset value per Share is calculated by dividing the value of the Fund’s total assets, less its liabilities, by the number of Shares outstanding.
The Fund’s net assets are valued in accordance with the Fund’s valuation procedures and reflect the value of its directly-held assets and liabilities, as well as the net asset value of the Fund’s investment in the Portfolio held through Belvedere Company and in real estate investments held through Belrose Realty. The trustees of the Portfolio have established
10
procedures for the valuation of the Portfolio’s assets under normal market conditions. Pursuant to these procedures, marketable securities listed on U.S. securities exchanges generally are valued at the last sale price on the day of the valuation or, if there were no sales, at the mean between the closing bid and asked prices therefor on the exchange where such securities are principally traded. Marketable securities listed on the NASDAQ National Market generally are valued at the NASDAQ official closing price. Unlisted or listed securities for which closing sale prices are not available are valued at the mean between the last available bid and asked prices or by an independent pricing service. Exchange-traded options are valued at the last sale price for the day of valuation as quoted on the principal exchange or board of trade on which the options are traded, or in the absence of a sale on such day, at the mean between the latest bid and asked prices therefor. Futures positions on securities or currencies are generally valued at closing settlement prices. Short-term debt securities with a remaining maturity of 60 days or less are valued at amortized cost. If short-term debt securities were acquired with a remaining maturity of more than 60 days, their amortized cost value will be based on their value on the sixty-first day prior to maturity. Other fixed income and debt securities, including listed securities and securities for which price quotations are available, will normally be valued on the basis of valuations furnished by a pricing service.
Foreign securities and currencies held by the Portfolio are valued in U.S. dollars, as calculated by the Portfolio’s custodian based on foreign currency exchange rate quotations supplied by an independent quotation service. Valuation of foreign securities may be adjusted from prices in effect at the close of trading on foreign exchanges to more accurately reflect their fair value as of the close of regular trading on the NYSE. The Portfolio may rely on an independent fair valuation service in adjusting the valuation of foreign equity securities. All securities for which market prices are not readily available are valued at fair value as determined in good faith by or at the direction of the Portfolio’s trustees, considering relevant factors, data and information including, in the case of restricted securities, the market value of freely tradable securities of the same class in the principal market on which such securities are normally traded.
The Fund’s real estate investments are valued each day as determined in good faith by Boston Management after consideration of relevant factors, data and information. The procedures for valuing real estate investments are described under "Critical Accounting Estimates" in Item 7(e). Boston Management values the Fund’s interest rate swap agreements based upon dealer and counterparty quotes and pricing models that take into consideration the market trading prices of interest rate swap agreements that have similar terms to the Fund’s interest rate swap agreements. Fixed liabilities of the Fund generally are stated at principal value.
Historic Net Asset Values.Set forth below are the high and low net asset values per Share (NAVs) of the Fund for each full quarter during the two years ended December 31, 2005 and 2004, the closing NAV on the last business day of each full quarter, and the percentage change in NAV during each such quarter.
| | | | | | | | | | | NAV at | | Quarterly % |
| Quarter Ended | | High NAV | | Low NAV | | Quarter End | | Change in NAV(1) |
| 12/31/05 | | $110.09 | | $101.04 | | $108.30 | | 2.86% |
| 9/30/05 | | $106.03 | | $101.10 | | $105.29 | | 4.51% |
| 6/30/05 | | $102.10 | | $ | | 95.86 | | $100.75 | | 0.72% |
| 3/31/05 | | $102.53 | | $ | | 97.52 | | $100.03 | | -1.96% |
| 12/31/04 | | $103.91 | | $ | | 93.76 | | $102.03 | | 6.54% |
| 9/30/04 | | $ | | 97.52 | | $ | | 91.21 | | $ | | 95.77 | | -2.71% |
| 6/30/04 | | $ | | 98.94 | | $ | | 93.82 | | $ | | 98.44 | | 1.62% |
| 3/31/04 | | $ | | 99.06 | | $ | | 93.84 | | $ | | 96.87 | | 1.07% |
| (1) | Past performance is no guarantee of future results. Investment return and principal value will fluctuate so that Shares, when redeemed, may be worth more or less than their original cost. Changes in NAV are historical. Performance is for the stated time period only; due to market volatility, the Fund’s current performance may be lower or higher. For more information about the performance of the Fund, see “Management’s Discussion and Analysis of Financial Condition (MD&A) and Results of Operations” in Item 7. |
| |
(b) Record Holders of Shares of the Fund.
|
As of February 28, 2006, there were 627 record holders of Shares of the Fund.
Income and Capital Gain Distributions.The Fund intends to distribute each year the amount of its net investment income for such year, if any. The Fund also intends to make annual capital gain distributions equal to approximately 18% of the
11
amount of its net realized capital gains, if any, other than certain precontribution gains allocated to a Shareholder in connection with a taxable tender offer or other taxable corporate event for a security contributed to the Fund by that Shareholder or that Shareholder’s predecessor in interest. The Fund’s net investment income and net realized gains include the Fund’s allocated share of the net investment income and net realized gains of Belvedere Company and, indirectly, the Portfolio, as well as income and capital gains, if any, distributed by Belrose Realty. The Fund’s distributions generally are based on determinations of net investment income and net realized capital gains for federal income tax purposes. Such amounts may differ from net investment income or loss and net realized gain or loss as set forth in the Fund’s consolidated financial statements due to differences in the treatment of various income, gain, loss, expense and other items for federal income tax purposes and under GAAP. The Fund intends to pay distributions (if any) on the last business day of each fiscal year of the Fund (which concludes on December 31) or shortly thereafter. The Fund’s distribution rates with respect to realized gains may be adjusted in the future to reflect changes in the effective maximum marginal individual federal tax rate applicable to long-term capital gains.
Shareholder distributions with respect to net investment income, realized post-contribution gains and certain other realized gains are made pro rata in proportion to the number of Shares held as of the record date of the distribution. All income and capital gain distributions (including Special Distributions described below) are paid by the Fund in cash. Distributions are generally not taxable to the recipient Shareholder unless the distributions exceed the recipient Shareholder’s tax basis in Fund Shares. The Fund’s Credit Facility prohibits the Fund from making any distribution to Shareholders while there is an event of default outstanding under the Credit Facility.
On January 26, 2006, the Fund made a distribution of $1.28 per Share to Shareholders of record on January 25, 2006. On January 27, 2005, the Fund made a distribution of $1.29 per Share to Shareholders of record on January 26, 2005. On January 14, 2004, the Fund made a distribution of $0.77 per Share to Shareholders of record on January 13, 2004.
Special Distributions.In addition to the pro rata income and capital gain distributions described above, the Fund also makes distributions to Shareholders allocated precontribution gain (other than certain precontribution gains allocated to a Shareholder in connection with a taxable tender offer or other taxable corporate event involving a security contributed by such Shareholder or such Shareholder’s predecessor in interest) (a Special Distribution). Special Distributions generally equal approximately 18% of the amount of realized precontribution gains plus approximately 4% of the allocated precontribution gain or such other percentage as deemed appropriate to compensate Shareholders receiving such distributions for taxes that may be due on income specially allocated in connection with the precontribution gain and Special Distributions. Special Distributions are made solely to the Shareholders to whom the precontribution gain is allocated. The Fund does not intend to make Special Distributions to a Shareholder in respect of realized precontribution gain allocated to a Shareholder or such Shareholder’s predecessor in interest in connection with a taxable tender offer or other taxable corporate event involving a security contributed by such Shareholder or such Shareholder’s predecessor in interest. The Fund made no Special Distributions during the years ended December 31, 2005 and 2004.
12
Item 6. Selected Financial Data.
|
Table of Selected Financial Data. The consolidated data referred to below reflects the Fund’s historical results for the years ended December 31, 2005, 2004, 2003 and the period from March 19, 2002 through December 31, 2002. The following information should be read in conjunction with all of the consolidated financial statements and related notes appearing on pages 38 to 78 of this Annual Report on Form 10-K. The other consolidated data referred to below is as of each period end.
| | | | | Year Ended | | | | Year Ended | | | | Year Ended | | | | Period Ended |
| | | December 31, 2005 | | December 31, 2004 | | December 31, 2003 | | December 31, 2002(1) |
| Total investment income | | $ | | 85,765,527 | | $ | | 90,895,859 | | $ | | 82,312,956 | | $ | | 44,487,727 |
| | | | | | | | | | | | | | | | |
| Interest expense | | $ | | 32,704,624 | | $ | | 30,873,176 | | $ | | 29,114,183 | | $ | | 16,926,050 |
| | | | | | | | | | | | | | | | |
| Net expenses (including interest expense) | | $ | | 66,359,713 | | $ | | 71,503,398 | | $ | | 65,089,736 | | $ | | 37,590,944 |
| | | | | | | | | | | | | | | | |
| Net investment income | | $ | | 16,278,819 | | $ | | 17,520,056 | | $ | | 15,279,642 | | $ | | 5,431,684 |
| | | | | | | | | | | | | | | | |
| Minority interests in net income of controlled subsidiaries | | | | | | | | | | | | | | | | |
| | $ | | (3,126,995) | | $ | | (1,872,405) | | $ | | (1,943,578) | | $ | | (1,465,099) |
| | | | | | | | | | | | | | | | |
| Net realized gain | | $ | | 69,272,363 | | $ | | 37,095,580 | | $ | | 2,449,130 | | $ | | 5,188,827 |
| | | | | | | | | | | | | | | | |
| Net change in unrealized appreciation (depreciation) | | | | | | | | | | | | | | | | |
| | $ | | 38,218,085 | | $ | | 62,187,846 | | $ | | 311,836,713 | | $ | | (129,398,897) |
| | | | | | | | | | | | | | | | |
| Net increase (decrease) in net assets from operations | | | | | | | | | | | | | | | | |
| | $ | | 123,769,267 | | $ | | 116,803,482 | | $ | | 329,565,485 | | $ | | (118,778,386) |
| | | | | | | | |
| Total assets | | $ 2,452,041,038 | | $ 2,333,346,902 | | $ 2,193,423,733 | | $ 1,791,452,901 |
| | | | | | | | | | | | | | | | |
| Loan payable--Credit Facility | | $ | | 393,500,000 | | $ | | 236,000,000 | | $ | | 183,300,000 | | $ | | 155,300,000 |
| | | | | | | | | | | | | | | | |
| Mortgages payable | | $ | | 238,850,000 | | $ | | 359,850,000 | | $ | | 344,219,483 | | $ | | 344,219,483 |
| | | | | | | | |
| Net assets | | $ 1,753,010,400 | | $ 1,694,227,425 | | $ 1,632,454,758 | | $ 1,242,001,655 |
| | | | | | | | | | | | | | | | |
| Shares outstanding | | | | 16,186,813 | | | | 16,604,562 | | | | 17,032,796 | | | | 16,160,271 |
| | | | | | | | | | | | | | | | |
Net asset value and redemption price per
Share | | | | | | | | | | | | | | | | |
| | $ | | 108.30 | | $ | | 102.03 | | $ | | 95.84 | | $ | | 76.86 |
| | | | | | | | | | | | | | | | |
Net increase (decrease) in net assets from
operations per Share(6) | | | | | | | | | | | | | | | | |
| | $ | | 7.56 | | $ | | 6.96 | | $ | | 19.03 | | $ | | (23.14) |
| | | | | | | | | | | | | | | | |
| Distribution paid per Share | | $ | | 1.29(5) | | $ | | 0.77(4) | | $ | | 0.05(3) | | $ | | 0.00(2) |
| (1) | The Fund commenced operations on March 19, 2002. |
| |
| (2) | On January 17, 2003, the Fund made a distribution of $0.05 per Share to Shareholders of record on January 16, 2003 relating to net investment income and net realized capital gains recorded in 2002. |
| |
| (3) | On January 14, 2004, the Fund made a distribution of $0.77 per Share to Shareholders of record on January 13, 2004 relating to net investment income and net realized capital gains recorded in 2003. |
| |
| (4) | On January 27, 2005, the Fund made a distribution of $1.29 per Share to Shareholders of record on January 26, 2005 relating to net investment income and net realized capital gains recorded in 2004. |
| |
| (5) | On January 26, 2006, the Fund made a distribution of $1.28 per Share to Shareholders of record on January 25, 2006 relating to net investment income and net realized capital gains recorded in 2005. |
| |
| (6) | Based on average Shares outstanding. |
| |
13
Item 7. Management’s Discussion and Analysis of Financial Condition (MD&A) and Results of Operations.
The information in this report contains forward-looking statements within the meaning of the federal securities laws. Forward-looking statements typically are identified by use of terms such as “may,” “will,” “should,” “might,” “expect,” “anticipate,” “estimate,” and similar words, although some forward-looking statements are expressed differently. The actual results of the Fund could differ materially from those contained in the forward-looking statements due to a number of factors. The Fund undertakes no obligation to update publicly any forward-looking statements, whether as a result of new information, future events, or otherwise, except as required by applicable law. Factors that could affect the Fund’s performance include a decline in the U.S. stock markets or in general economic conditions, adverse developments affecting the real estate industry, or fluctuations in interest rates. See "Qualitative Information About Market Risk" in Item 7A(b) below.
The following discussion should be read in conjunction with the Fund’s consolidated financial statements and related note s appearing on pages 38 to 78 of this Annual Report on Form 10-K.
(a) Results of Operations.
|
Increases and decreases in the Fund’s net asset value per share are based on net investment income or loss and realized and unrealized gains and losses on investments. The Fund’s net investment income or loss is determined by subtracting the Fund’s total expenses from its investment income and then deducting the net investment income or loss attributable to the minority interest in the controlled subsidiaries of Belrose Realty. The Fund’s investment income generally includes the net investment income allocated to the Fund from Belvedere Company, rental income from the properties owned by Belrose Realty’s controlled subsidiaries, partnership income allocated to the Partnership Preference Units owned directly or indirectly by Belrose Realty and interest earned on the Fund’s short-term investments (if any). The net investment income of Belvedere Company allocated to the Fund includes dividends, interest and expenses allocated to Belvedere Company by the Portfolio less the expenses of Belvedere Company allocated to the Fund. The Fund’s total expenses include the Fund’s investment advisory and administrative fees, distribution and servicing fees, interest expense from mortgages on properties owned by Belrose Realty’s controlled subsidiaries, interest expense on the Fund’s Credit Facility, property management fees, property taxes, insurance, maintenance and other expenses relating to the properties owned by Belrose Realty’s controlled subsidiaries, and other miscellaneous expenses. The Fund’s realized and unrealized gains and losses are the result of transactions in, or changes in value of, security investments held through the Fund’s indirect interest (through Belvedere Company) in the Portfolio, real estate investments held through Belrose Realty, the Fund’s interest rate swap agreements and any other direct investments of the Fund, as well as periodic payments made by the Fund pursuant to interest rate swap agreements.
Realized and unrealized gains and losses on investments have the most significant impact on the Fund’s net asset value per share and result primarily from sales of such investments and changes in their underlying value. The investments of the Portfolio consist primarily of common stocks of domestic and foreign growth companies that are considered by its investment adviser to be high in quality and attractive in their long-term investment prospects. Because the securities holdings of the Portfolio are broadly diversified, the performance of the Portfolio cannot be attributed to one particular stock or one particular industry or market sector. The performance of the Portfolio and the Fund are substantially influenced by the overall performance of the U.S. stock market, as well as by the relative performance versus the overall market of specific stocks and classes of stocks in which the Portfolio maintains large positions.
MD&A and Results of Operations for the Year Ended December 31, 2005 Compared to the Year Ended December 31, 2004.
Performance of the Fund.(1)The Fund’s investment objective is to achieve long-term, after-tax returns for Shareholders. Eaton Vance, as the Fund’s manager, measures the Fund’s success in achieving its objective based on the investment returns of the Fund, using the S&P 500 Index as the Fund’s primary performance benchmark. The S&P 500 Index is a broad-based unmanaged index of common stocks commonly used as a measure of U.S. stock market performance. Eaton Vance’s primary focus in pursuing total return is on the Fund’s common stock portfolio, which consists of its indirect interest in the Portfolio. In measuring the performance of the Fund’s real estate investments, Eaton Vance considers
| (1) | Past performance is no guarantee of future results. Investment return and principal value will fluctuate so that Shares, when redeemed, may be worth more or less than their original cost. Total returns are historical and are calculated by determining the percentage change in net asset value with all distributions reinvested. The Portfolio’s total return for the period reflects the total return of another fund that invests in the Portfolio adjusted for non-Portfolio expenses of that fund. Performance is for the stated time period only; due to market volatility, the Fund’s current performance may be lower or higher. The performance of the Fund and the Portfolio is compared to that of their benchmark, the S&P 500 Index. It is not possible to invest directly in an Index. |
| |
14
whether, through current returns and changes in valuation, the real estate investments achieve returns that over the long-term exceed the cost of the borrowing incurred to acquire such investments and thereby add to Fund returns. The Fund has entered into interest rate swap agreements to fix the cost of its borrowings under the Credit Facility used to acquire equity in real estate investments and to mitigate in part the impact of interest rate changes on the Fund’s net asset value.
The Fund’s total return for the year ended December 31, 2005 was 7.54% . This return reflects an increase in the Fund’s net asset value per Share from $102.03 to $108.30 and a distribution of $1.29 per Share during the period. For comparison, the S&P 500 Index had a total return of 4.91% over the same period. The combined impact on performance of the Fund’s investment activities outside of the Portfolio was positive for the year ended December 31, 2005. The performance of the Fund exceeded that of the Portfolio by approximately 2.84% for the year.
The Fund had a total return of 7.32% for the year ended December 31, 2004. This return reflected an increase in the Fund’s net asset value per Share from $95.84 to $102.03 and a distribution of $0.77 per Share during the period. For comparison, the S&P 500 Index had a total return of 10.87% over the same period. For the year ended December 31, 2004, the performance of the Fund trailed that of the Portfolio by approximately 2.35% ..
Performance of the Portfolio.A late year surge helped the stock market conclude 2005 on a positive note, locking in its third consecutive annual gain. The S&P 500 Index had a positive, albeit modest, total return for the year, despite investor angst over rising interest rates, record-level energy prices and a flattening yield curve. These factors were offset by resilient consumer spending and healthy corporate profits. Double-digit growth in dividend payouts and share buybacks, coupled with continued strength in merger and acquisition activity, provided additional support for equities.
For the year ended December 31, 2005, energy and utilities were the top performing sectors in the S&P 500 Index. The energy sector was up 31% in 2005 and the utility sector rose over 16% for the same period. In contrast, each of the eight remaining sectors in the S&P 500 Index recorded single-digit or negative returns. The more growth-oriented consumer discretionary, telecommunications and technology sectors were the worst performers for the year. Also, small- and mid-capitalization stocks outperformed large-cap stocks.
The Portfolio invests on a long-term basis in a broadly diversified portfolio consisting primarily of common stocks of growth companies. The Portfolio’s performance for the year ended December 31, 2005 was 4.70%, trailing the return of the S&P 500 Index by 0.21%, due in part to differences in sector allocation and stock selection. The total return of the Portfolio for the year ended December 31, 2004 was 9.67% . The Portfolio remained overweighted in the industrials and energy sectors, while continuing to underweight the technology, telecommunication and utilities sectors. The Portfolio’s energy emphasis was additive to performance as stocks there advanced on record-high commodity prices. Financials also experienced solid gains in 2005, and the Fund's performance benefited from the Portfolio's overweighting of capital markets and insurance industries and de-emphasis of mortgage finance stocks. Telecommunications stocks continued to struggle through the year, and the Portfolio’s underweighted position there was beneficial to returns.
The Portfolio’s worst performance came from the industrials and information technology sectors. Capacity and pricing issues plagued information technology holdings, and investments within computers and peripherals were notable underperformers. An overweighting in lagging machinery and building products stocks within the industrials sector was also detrimental to performance. In addition, de-emphasis of the slower-growth, high-dividend-yielding areas, such as utilities, also detracted from returns, as investors favored these defensive investments for much of 2005.
Performance of Real Estate Investments.The Fund’s real estate investments are held through Belrose Realty. As of December 31, 2005, real estate investments included majority interests in two Real Estate Joint Ventures (Deerfield and Katahdin) and a portfolio of Partnership Preference Units. Deerfield owns industrial distribution properties and Katahdin owns multifamily properties. As of December 31, 2005, the estimated fair value of the Fund’s real estate investments represented 23.3% of the Fund’s total assets on a consolidated basis. After adjusting for the minority interests in Deerfield and Katahdin, the Fund’s real estate investments represented 27.0% of the Fund’s net assets as of December 31, 2005.
On December 28, 2005, Katahdin sold a multifamily property to a third party for approximately $42.3 million, recognizing a gain of approximately $8.7 million on the transaction. On December 15, 2005, Katahdin purchased a multifamily property from a third party for approximately $55.0 million. On September 30, 2005, a property management contract in which Deerfield held an interest was terminated, resulting in a gain of approximately $0.8 million for Belrose Realty. On April 6, 2005, Deerfield sold an industrial distribution property for approximately $3.1 million, recognizing a loss of approximately $0.2 million on the sale. On October 14, 2005, Belrose Realty sold its interest in a multifamily Real Estate Joint Venture, Bel Communities Property Trust (Bel Communities), to the real estate affiliate of another investment fund advised by Boston Management, recognizing a $12.3 million gain on the transaction.
15
During the year ended December 31, 2005, rental income from real estate operations was approximately $56.4 million compared to approximately $68.1 million for the year ended December 31, 2004, a decrease of $11.7 million or 17%. This decrease in rental income was principally due to Belrose Realty’s sale of its interest in Bel Apartment Property Trust (Bel Apartment), a multifamily Real Estate Joint Venture, in November 2004 and the sale of its interest in Bel Communities in October 2005, which together accounted for 59% of consolidated rental income for the year ended December 31, 2004. This decrease was offset in part by the rental income of Deerfield, which was acquired in 2004. For the year ended December 31, 2005, Deerfield’s rental income was negatively affected by a less favorable leasing environment than expected. During the year ended December 31, 2004, rental income increased due to income from the industrial distribution properties acquired by Deerfield on June 30 and August 4, 2004, offset in part by the sale of Bel Apartment in November 2004.
During the year ended December 31, 2005, property operating expenses were approximately $24.6 million compared to approximately $32.0 million for the year ended December 31, 2004, a decrease of $7.4 million or 23% (property operating expenses are before certain operating expenses of Belrose Realty of approximately $4.1 million for the year ended December 31, 2005 and $3.7 million for the year ended December 31, 2004). The decrease in property operating expenses was principally due to the asset sales referenced in the preceding paragraph, offset in part by the operating expenses of Deerfield, which was acquired in 2004. For the year ended December 31, 2005, Deerfield’s property operating expenses were in line with expectations. During the year ended December 31, 2004, the net increase in property operating expenses was principally due to the expenses of the industrial distribution properties acquired in 2004 and hurricane expenses of $2.6 million incurred by Katahdin, offset in part by the sale of Bel Apartment in November 2004.
Improvements in multifamily property operating conditions are being seen in numerous markets around the country, reflecting better supply/demand balance. Boston Management expects this favorable trend to continue in 2006, although higher operating expenses and capital expenditures attributable to routine maintenance costs are expected to offset much of the improvement in rental income. For many industrial distribution properties, rent levels are expected to see minimal growth over the near term. Boston Management expects that improvements in multifamily and industrial distribution property operating performance will occur over the longer term.
At December 31, 2005, the estimated fair value of the real properties indirectly held through Belrose Realty was approximately $385.0 million compared to approximately $496.8 million at December 31, 2004, a decrease of $111.8 million or 23%. The decrease in estimated real property values at December 31, 2005 as compared to December 31, 2004 was principally due to Belrose Realty’s sale of its interests in Bel Communities in October 2005, offset in part by increases in the estimated net values of properties held by Deerfield and Katahdin. The net increase in estimated real property values at December 31, 2004 was principally due to the properties acquired by Deerfield in June and August 2004, offset in part by the sale of Bel Apartment in November 2004.
During the year ended December 31, 2005, the Fund saw net unrealized appreciation of the estimated fair value of its other real estate investments (which includes Deerfield and Katahdin) of approximately $20.8 million, compared to net unrealized depreciation of approximately $27.6 million during the year ended December 31, 2004. Net unrealized appreciation of approximately $20.8 million during the year ended December 31, 2005 was due to increases in the estimated fair value of properties held by Katahdin and Deerfield, offset in part by the recharacterizing of previously recorded unrealized appreciation as realized gains as a result of the October 2005 sale of Belrose Realty’s interest in Bel Communities. Despite weak operating conditions over the past several years, estimated property values increased during 2005 as lower near-term property earnings expectations generally were offset by lower capitalization and discount rates applied in valuing properties. Capitalization and discount rates, terms commonly used in the real estate industry, are rate of return percentages applied to actual or projected income levels to estimate the value of real estate investments. In the case of multifamily properties, the increase in estimated fair values during 2005 also is attributable in part to increased investor demand for multifamily properties in certain markets experiencing increased condominium conversion activity. The Fund’s net unrealized depreciation for the year ended December 31, 2004 consisted of unrealized depreciation resulting from a net decrease in estimated industrial distribution property values, offset in part by unrealized appreciation resulting from a modest net increase in estimated multifamily property values.
During the year ended December 31, 2005, Belrose Realty acquired interests in additional Partnership Preference Units (including acquisitions from real estate investment affiliates of other investment funds advised by Boston Management) for a total of approximately $138.3 million. During the year ended December 31, 2005, Belrose Realty sold certain of its Partnership Preference Units for a total of approximately $15.2 million (representing sales to real estate investment affiliates of other investment funds advised by Boston Management), recognizing a net gain of $0.3 million on the
16
transactions. At December 31, 2005, the estimated fair value of Belrose Realty’s Partnership Preference Units totaled approximately $185.6 million compared to approximately $59.6 million at December 31, 2004, a net increase of $126.0 million or 211%. The net increase in value was principally due to more Partnership Preference Units held at December 31, 2005 as compared to December 31, 2004. During 2004, the estimated fair value of Partnership Preference Unit investments increased principally due to the net increase in the number of Partnership Preference Units held.
During the year ended December 31, 2005, the Fund saw net unrealized appreciation of the estimated fair value of its Partnership Preference Units of approximately $2.6 million compared to net unrealized depreciation of approximately$8.0 million during the year ended December 31, 2004. The net unrealized appreciation of approximately $2.6 million during the year ended December 31, 2005 consisted of approximately $2.5 million of unrealized appreciation as a result of increases in the per unit values of the Partnership Preference Units held by Belrose Realty at December 31, 2005 and approximately $0.1 million of unrealized appreciation resulting from the recharacterization of previously recorded unrealized depreciation as realized losses due to the sale of Partnership Preference Units during the year. During 2005, estimated fair values for Partnership Preference Units were positively affected by tighter credit spreads for credit-sensitive income securities, including real estate-related securities. The net unrealized depreciation of approximately $8.0 million during the year ended December 31, 2004 consisted of approximately $0.3 million of unrealized depreciation resulting from decreases in per unit values of the Partnership Preference Units held by Belrose Realty and approximately $7.7 million of unrealized depreciation resulting from the recharacterization of previously recorded unrealized appreciation to realized gains due to sales of Partnership Preference Units.
Distributions from Partnership Preference Units for the year ended December 31, 2005 totaled approximately $6.6 million compared to approximately $5.5 million for the year ended December 31, 2004, an increase of $1.1 million or 20%. The increase was due principally to an increased investment in Partnership Preference Units on average during the year, offset in part by lower average distribution rates for the Partnership Preference Units held. The decrease in average distribution rates of Partnership Preference Units was primarily due to the restructuring of certain Partnership Preference Units (reflecting lower market rates for preferred securities) as they neared their potential call dates. During the year ended December 31, 2004, distributions from Partnership Preference Units increased principally due to an increase in the number of Partnership Preference Units held on average and to a one-time special distribution from an issuer made in connection with a restructuring of its Partnership Preference Units, offset in part by lower average distribution rates for the Partnership Preference Units held during the year ended December 31, 2004.
Performance of Interest Rate Swap Agreements. For the year ended December 31, 2005, net realized and unrealized gains on the Fund’s interest rate swap agreements totaled approximately $4.2 million, compared to net realized and unrealized losses of $5.1 million for the year ended December 31, 2004. Net realized and unrealized gains on swap agreements in 2005 consisted of $5.6 million of net realized and unrealized gains due to changes in swap agreement valuations, offset in part by $1.4 million of periodic payments made pursuant to outstanding swap agreements (and classified as net realized losses on interest rate swap agreements in the Fund’s consolidated financial statements). In 2004, the Fund had net realized and unrealized losses of $0.8 million due to swap agreement valuation changes and $4.3 million of swap agreement periodic payments. The positive contribution to Fund performance from changes in swap agreement valuations in 2005 was attributable to a rise in swap rates during the year for swaps with maturities comparable to those of the Fund’s swaps. The negative contribution to Fund performance from changes in interest rate swap valuations in 2004 was attributable to a modest decrease in swap rates during the holding period for swaps entered into during 2004.
MD&A and Results of Operations for the Year Ended December 31, 2004 Compared to the Year Ended December 31, 2003.
Performance of the Fund.The Fund had a total return of 7.32% for the year ended December 31, 2004. This return reflected an increase in the Fund’s net asset value per Share from $95.84 to $102.03 and a distribution of $0.77 per Share during the period. For comparison, the S&P 500 Index had a total return of 10.87% over the same period. For the year ended December 31, 2004, the performance of the Fund trailed that of the Portfolio by approximately 2.35% .
The Fund had a total return of 24.77% for the year ended December 31, 2003. This return reflected an increase in the Fund’s net asset value per Share from $76.86 to $95.84 and a distribution of $0.05 per Share during the period. For comparison, the S&P 500 Index had a total return of 28.67% over the same period. For the year ended December 31, 2003, the performance of the Fund exceeded that of the Portfolio by approximately 0.89% .
Performance of the Portfolio.Economic pressures lingered for much of 2004, but the lifting of some political uncertainty ignited a late-year market rally, helping U.S. equities lock in a second consecutive year of gains. Strength in the broader
17
market toward year-end was a function of several economic and fundamental factors: historically low interest rates, decisive election results, retreating oil prices and solid earnings growth. A wave of merger and acquisition activity provided additional support for equities, as companies across technology, telecommunications and health care sectors announced multi-billion dollar combinations. The Federal Reserve raised its key interest-rate target five times in 2004, increasing the federal funds target rate to 2.25% . The Portfolio’s performance for the year ended December 31, 2004 was 9.67%, trailing the S&P 500 Index, which had a total return of 10.87% for the year. The total return of the Portfolio for the year ended December 31, 2003 was 23.88% .
In 2004, value stocks outperformed growth stocks and small-caps and mid-caps outperformed large-caps. The best performing market sectors were energy, utilities, telecom services and industrials. Lagging the overall market were the health care, technology, and consumer staples sectors.
During the year, the Portfolio’s sector allocation shifted slightly from 2003, as it increased positions in energy and industrial stocks and reduced exposure to the technology, health care and consumer discretionary sectors. The Portfolio’s performance versus the S&P 500 Index benefited from relative overweightings in the strong performing energy and industrial sectors and favorable stock selection among consumer staples. The Portfolio’s relative performance versus the S&P 500 Index was hampered by underweightings in the utilities and telecom services sectors and adverse selection among technology, health care and consumer discretionary stocks. Among industry groups, the Portfolio benefited from overweightings of air freight and logistics, oil and gas, and building products and underweightings of semiconductors and pharmaceuticals. Industry groups adversely affecting the Portfolio’s relative performance included the overweighted insurance and media groups and the underweighted health services and internet groups.
Performance of Real Estate Investments.As of December 31, 2004, real estate investments included majority interests in three Real Estate Joint Ventures (Bel Communities, Katahdin and Deerfield) and a portfolio of Partnership Preference Units. Bel Communities and Katahdin operate multifamily properties and Deerfield operates industrial distribution properties.
During the year ended December 31, 2004, Belrose Realty acquired a majority interest in Deerfield. In transactions occurring in June and August 2004, Deerfield acquired 100% of the economic interest in 18 industrial distribution properties located in six states. Deerfield acquired the properties for approximately $203.2 million. ProLogis owns a minority interest in Deerfield and manages the properties. Deerfield obtained first mortgage financing in October 2004, which is secured by the properties it owns and without recourse to Belrose Realty, the Fund or Shareholders.
In November 2004, Belrose Realty sold its interest in Bel Apartment for approximately $32.4 million to the real estate subsidiary of another fund advised by Boston Management. Belrose Realty recognized a loss of approximately $1.5 million on the transaction.
During the year ended December 31, 2004, rental income from real estate operations was approximately $68.1 million compared to approximately $64.7 million for the year ended December 31, 2003, an increase of $3.4 million or 5%. This increase in rental income was due to income from the industrial distribution properties acquired in 2004, offset in part by the sale of Bel Apartment in November 2004. For the year ended December 31, 2003, rental income increased principally due to the greater number of properties held, offset in part by increased rent concessions or reduced apartment rental rates and lower occupancy levels at properties owned during 2003.
During the year ended December 31, 2004, property operating expenses were approximately $32.0 million compared to approximately $28.6 million for the year ended December 31, 2003, an increase of $3.4 million or 12% (property operating expenses are before certain operating expenses of Belrose Realty of approximately $3.7 million for the year ended December 31, 2004 and $3.2 million for the year ended December 31, 2003). The net increase in property operating expenses was principally due to the expenses of the industrial distribution properties acquired in 2004 and hurricane expenses of $2.6 million for Katahdin, offset in part by the sale of Bel Apartment in November 2004. During the year ended December 31, 2003, property operating expenses increased principally due to the greater number of properties held during the year.
At December 31, 2004, the estimated fair value of the real properties indirectly held through Belrose Realty was approximately $496.8 million compared to approximately $473.5 million at December 31, 2003, a net increase of $23.3 million or 5%. The net increase in estimated real property values at December 31, 2004 was principally due to the properties acquired by Deerfield in June and August 2004, offset in part by the sale of Bel Apartment in November 2004. The modest increase in estimated multifamily property values at December 31, 2003 resulted from declines in
18
capitalization rates in a lower-return environment, which more than offset the impact of lower income expectations on property values.
During the year ended December 31, 2004, the Fund saw net unrealized depreciation of the estimated fair value of its other real estate investments (which includes Bel Communities, Katahdin and Deerfield) of approximately $27.6 million compared to unrealized appreciation of approximately $3.6 million during the year ended December 31, 2003. Net unrealized depreciation of approximately $27.6 million during the year ended December 31, 2004 included unrealized depreciation resulting from a net decrease in estimated industrial distribution property values, offset in part by unrealized appreciation resulting from a modest net increase in estimated multifamily property values. The net decrease in industrial distribution property values reflects the results of initial independent appraisals of newly acquired properties and adjustments in the value of unappraised industrial distribution properties to reflect appraisal results for similar properties, in accordance with the Fund’s valuation procedures described in "Real Estate Joint Ventures" under "Critical Accounting Estimates" in Item 7 (e) below. Initial appraised values of newly acquired properties differed from transaction values due primarily to differences in discount and capitalization rates applied in valuing the properties. Unrealized appreciation during the year ended December 31, 2003 resulted from increases in estimated multifamily property values during 2003.
During the year ended December 31, 2004, Belrose Realty sold (or experienced scheduled redemptions of) certain of its Partnership Preference Units totaling approximately $80.4 million (including sales to real estate subsidiaries of other investment funds advised by Boston Management), recognizing a net gain of approximately $5.0 million on the transactions. During the year ended December 31, 2004, Belrose Realty also acquired interests in additional Partnership Preference Units (representing acquisitions from real estate subsidiaries of other investment funds advised by Boston Management) for a total of approximately $86.3 million.
At December 31, 2004, the estimated fair value of Belrose Realty’s Partnership Preference Units totaled approximately $59.6 million compared to approximately $56.7 million at December 31, 2003, a net increase of $2.9 million or 5%. The net increase in value was principally due to the net increase in the number of Partnership Preference Units held. During 2003, the estimated fair value of Partnership Preference Units increased principally due to a greater number of units held.
During the year ended December 31, 2004, the Fund saw net unrealized depreciation in the estimated fair value of its Partnership Preference Units of approximately $8.0 million compared to unrealized appreciation of approximately $6.8 million during the year ended December 31, 2003. The net unrealized depreciation of approximately $8.0 million during 2004 consisted of approximately $0.3 million of unrealized depreciation resulting from decreases in per unit values of the Partnership Preference Units held by Belrose Realty at December 31, 2004, and approximately $7.7 million of unrealized depreciation resulting from the recharacterization of previously recorded unrealized appreciation to realized gains due to sales of Partnership Preference Units during the year ended December 31, 2004.
Distributions from Partnership Preference Units for the year ended December 31, 2004 totaled approximately $5.5 million compared to approximately $4.6 million for the year ended December 31, 2003, an increase of $0.9 million or 20%. The increase was principally due to an increase in the number of Partnership Preference Units held on average and to a one-time special distribution from an issuer made in connection with a restructuring of its Partnership Preference Units, offset in part by lower average distribution rates for the Partnership Preference Units held during the year ended December 31, 2004. The decrease in the per unit values was principally due to restructurings of certain Partnership Preference Units, including a special cash distribution mentioned above and the renegotiated lower subsequent distribution rates, offset in part by modest increases in value for other Partnership Preference Units held at December 31, 2004. During the year ended December 31, 2003, distributions increased due to the greater number of Partnership Preference Units held and the longer period they were held.
Performance of Interest Rate Swap Agreements.For the year ended December 31, 2004, net realized and unrealized losses on the Fund’s interest rate swap agreements totaled approximately $5.1 million, compared to net realized and unrealized losses of $3.7 million for the year ended December 31, 2003. Net realized and unrealized losses on swap agreements in 2004 consisted of $0.8 million of net realized and unrealized losses due to changes in swap agreement valuations and $4.3 million of periodic payments made pursuant to outstanding swap agreements (and classified as net realized losses on interest rate swap agreements in the Fund’s consolidated financial statements). In 2003, the Fund had net realized and unrealized gains of $0.8 million due to swap agreement valuation changes, offset by $4.5 million of swap agreement periodic payments. The positive contribution to 2003 Fund performance from changes in swap agreement valuations was attributable to a rise in swap rates during the year.
19
On October 1, 2003, the Fund terminated all of its then outstanding swap agreements and entered into new agreements to fix the cost of a substantial portion of Fund borrowings under the Credit Facility. The Fund realized a loss of approximately $12.2 million on the swap agreement terminations.
(b) Liquidity and Capital Resources.
|
Outstanding Borrowings.The Fund has entered into the Credit Facility primarily to finance the Fund’s real estate investments and to satisfy the liquidity needs of the Fund. In the future, the Fund may increase the size of the Credit Facility (subject to lender consent) and the amount of outstanding borrowings thereunder. As of December 31, 2005, the Fund had outstanding borrowings of $393.5 million and unused loan commitments of $31.0 under the Credit Facility. During the quarter ended December 31, 2005, the Fund amended the Credit Facility to increase its borrowing limit.
As of December 31, 2005, Katahdin had outstanding borrowings consisting of fixed-rate secured mortgage debt obligations of $115.9 million and Deerfield had outstanding borrowings consisting of fixed-rate secured mortgage obligations of $123.0 million.
Liquidity.The Fund may redeem shares of Belvedere Company at any time. Both Belvedere Company and the Portfolio normally follow the practice of satisfying redemptions primarily by distributing securities drawn from the Portfolio. Belvedere Company and the Portfolio may also satisfy redemptions by distributing cash. As of December 31, 2005, the Portfolio had cash totaling $0.1 million. The Portfolio participates in a $150 million multi-fund unsecured line of credit agreement with a group of banks. The Portfolio may temporarily borrow from the line of credit to satisfy redemption requests in cash or to settle investment transactions. The Portfolio had borrowings of $8.0 million outstanding at December 31, 2005. To ensure liquidity for investors in the Portfolio, the Portfolio may not invest more than 15% of its net assets in illiquid assets. As of December 31, 2005, illiquid assets (consisting of restricted securities not available for current public sale) constituted 0.03% of the net assets of the Portfolio.
The liquidity of Belrose Realty’s investments in Deerfield and Katahdin are extremely limited, and relies principally upon buy/sell and/or liquidation agreements with ProLogis and Archstone-Smith that are described in "Real Estate Joint Venture Investments" under "The Fund’s Real Estate Investments" in Item 1. Transfers of Belrose Realty’s interest in Deerfield and Katahdin to parties other than the Operating Partners are restricted by terms of Deerfield and Katahdin’s operative agreements and lender consent requirements. The Partnership Preference Units held by Belrose Realty are not registered under the Securities Act and are subject to substantial restrictions on transfer. As such, they are considered illiquid.
(c) Off-Balance Sheet Arrangements.
|
The Fund is required to disclose off-balance sheet arrangements that either have, or are reasonably likely to have, a current or future effect on its financial condition, changes in financial condition, revenues or expenses, results of operations, liquidity, capital expenditures or capital resources that is material to Shareholders. An off-balance sheet arrangement includes any contractual arrangement to which an unconsolidated entity is a party and under which the Fund has certain specified obligations. As of December 31, 2005, the Fund did not have any such off-balance sheet arrangements.
20
(d) The Fund’s Contractual Obligations.
The following table sets forth the amounts of payments due under the specified contractual obligations outstanding on December 31, 2005:
| | | | | | | | | Payments due: | | | | | | | | |
|
| | | | | Less than | | | | | | | | | | More than 5 |
| Type of Obligation | | Total | | 1 Year | | 1-3 Years | | 3-5 Years | | Years |
|
| Long Term Debt: | | | | | | | | | | | | | | | | | | |
| Mortgage Debt(1) | | $238,850,000 | | $ | | — | | $ | | — | | $ | | — | | $238,850,000 |
| Borrowings under Credit Facility(2) | | $393,500,000 | | $ | | — | | $ | | — | | $393,500,000 | | $ | | — |
| Purchase Obligations(3) | | | | | | | | | | | | | | | | | | |
| Other Long Term Liabilities: | | | | | | | | | | | | | | | | | | |
| Interest Rate Swap Agreements(4) | | $ 40,753,258 | | $8,218,575 | | $16,437,151 | | $ 13,191,231 | | $ 2,906,301 |
|
| Total | | $673,103,258 | | $8,218,575 | | $16,437,151 | | $406,691,231 | | $241,756,301 |
|
| (1) | The property held by Belrose Realty is financed in part through mortgage notes issued to Deerfield and Katahdin. The mortgage notes are secured by the underlying property and are without recourse to the other assets of the Fund or Belrose Realty, as described in "Risks of Real Estate Investments" in Item 7A(b). The mortgage notes mature during 2011 and 2012. The mortgage notes cannot be prepaid or otherwise disposed of without incurring a substantial prepayment penalty unless in conjunction with the sale of the associated property. |
| |
| (2) | To finance its real estate investments, the Fund has entered into a Credit Facility as described in "Liquidity and Capital Resources" above. The Credit Facility is secured by a pledge of the Fund’s assets, excluding the assets of Deerfield and Katahdin, and expires on June 25, 2010. The Credit Facility is primarily used to finance the Fund’s equity in its real estate investments and will continue to be used for such purpose in the future. |
| |
| (3) | The Fund and Belrose Realty have entered into agreements with certain service providers pursuant to which the Fund and Belrose Realty pay fees as a percentage of assets. These fees include fees paid to Eaton Vance and its affiliates (which are described in Item 13). These agreements generally continue indefinitely unless terminated by the Fund or Belrose Realty (as applicable) or the service provider. For the year ended December 31, 2005, fees paid to Eaton Vance and its affiliates equaled approximately 1.05% of the Fund’s net assets. Because these fees are based on the Fund’s assets (which will fluctuate over time) it is not possible to specify the dollar amounts payable in the future. |
| |
| (4) | The Fund has entered into interest rate swap agreements to fix the cost of borrowings under the Credit Facility used to acquire equity in real estate investments. Pursuant to the interest rate swap agreements, the Fund makes cash payments to MLCS at fixed rates in exchange for floating rate payments from MLCS that fluctuate with one-month and three-month LIBOR. The amounts disclosed in the table represent the fixed interest amounts payable by the Fund. The periodic floating rate payments that the Fund expects to receive pursuant to the agreements reduce the fixed interest cost to the Fund. The swap agreements expire on June 25, 2010 and June 28, 2012, subject to the Fund’s right to terminate earlier in the case of some swaps. |
| |
(e) Critical Accounting Estimates.
|
The Fund’s consolidated financial statements are prepared in accordance with GAAP. The preparation of these financial statements requires the Fund to make estimates, judgments and assumptions that affect the reported amounts of assets, liabilities, revenues and expenses. Estimates are deemed critical when a different estimate could have reasonably been used or where changes in the estimate are reasonably likely to occur from period to period, and where such different or changed estimates would materially impact the Fund’s financial condition, changes in financial condition or results of operations. The Fund’s significant accounting policies are discussed in Note 2 of the notes to the consolidated financial statements; critical estimates inherent in these accounting policies are discussed in the following paragraphs.
The Fund has determined that the valuation of the Fund’s real estate investments (including properties and other assets owned by Belrose Realty’s controlled subsidiaries, the allocation of equity interest in Real Estate Joint Ventures and the Partnership Preference Units) involve critical estimates. The Fund’s investments in real estate are an important component of its total investment program. Market prices for these investments are not readily available and therefore the investments are stated in the Fund’s consolidated financial statements at estimated fair value. The estimated fair value of an investment represents the amount at which Boston Management believes the investment could be sold in a current transaction between
21
willing parties in an orderly disposition, that is, other than in a forced or liquidation sale. The Fund reports the estimated fair value of its real estate investments on its consolidated statement of assets and liabilities, with any changes to estimated fair value charged to unrealized appreciation or depreciation in the Fund’s consolidated statement of operations.
The need to estimate the fair value of the Fund’s real estate investments introduces uncertainty into the Fund’s reported financial condition and performance because:
- such assets are, by their nature, difficult to value and estimated values may not accurately reflect what the Fundcould realize in a current sale between willing parties;
- property appraisals and other factors used to determine the estimated fair value of the Fund’s real estateinvestments depend on estimates of future operating results and supply and demand assumptions that may notreflect actual current market conditions and full consideration of all factors relevant to valuations;
- property appraisals and other factors used to determine the estimated fair value of the Fund’s real estateinvestments are not continuously updated and therefore may not be current as of specific dates; and
- if the Fund were forced to sell illiquid assets on a distressed basis, the proceeds may be substantially less thanstated values.
As of December 31, 2005, the estimated fair value of the Fund’s real estate investments represented 23.3% of the Fund’s total assets. As of December 31, 2005, adjusting for the minority interests of ProLogis and Archstone-Smith, the principal minority investors in Deerfield and Katahdin, the Fund’s real estate investments represented 27.0% of the Fund’s net assets. The estimated fair value of the Fund’s real estate investments may change due to changes in market conditions and changes in valuation assumptions made by property appraisers and third party valuation service providers as described below.
As noted in Item 1, to satisfy certain requirements of the Code, the Fund invests at least 20% of its gross assets (calculated in the manner prescribed) in real estate investments (the 20% requirement). Should the estimated fair value of the Fund’s real estate investments decrease, the Fund may be required to acquire additional real estate investments to satisfy the 20% requirement. Because the Fund acquires real estate investments with borrowings, acquisitions of additional real estate investments would increase the Fund’s borrowings under the Credit Facility and reduce the amounts otherwise available to the Fund thereunder. Should the estimated fair value of the Fund’s real estate investments increase, real estate investments could represent a larger percentage of the Fund’s investment portfolio.
Partnership Preference Units.Boston Management determines the estimated fair value of the Fund’s Partnership Preference Units based on analysis and calculations performed primarily on a monthly basis by a third party service provider. The service provider calculates an estimated price and yield (before accrued distributions) for each issue of Partnership Preference Units based on descriptions of such issue provided by Boston Management and certain publicly available information including, but not limited to, the trading prices of publicly issued debt and/or preferred stock instruments of the same or similar issuers, which may be adjusted to reflect the illiquidity and other structural characteristics of the Partnership Preference Units (such as call provisions). Daily valuations of Partnership Preference Units are determined by adjusting prices from the service provider to account for accrued distributions under the terms of the Partnership Preference Units. If changes in relevant markets, events that materially affect an issuer or other events that have a significant effect on the price or yield of Partnership Preference Units occur, relevant prices or yields may be adjusted to take such occurrences into account.
Valuations of Partnership Preference Units are inherently uncertain because they are based on adjustments from the market prices of publicly-traded debt and/or preferred stock instruments of the same or similar issuers to account for the Partnership Preference Units’ illiquidity, structural features (such as call provisions) and other relevant factors. Each month Boston Management reviews the analysis and calculations performed by the service provider. Boston Management generally relies on the assumptions and judgments made by the service provider in estimating the fair value of the Partnership Preference Units. If the assumptions and estimates used by the service provider to calculate prices for Partnership Preference Units were to change, it could materially impact the estimated fair value of the Fund’s holdings of Partnership Preference Units.
Real Estate Joint Ventures.Boston Management determines the estimated fair value of the Fund’s interests in Real Estate Joint Ventures based primarily on annual appraisals of the properties owned by such Real Estate Joint Ventures (provided
22
such appraisals are available) and an allocation of the equity value of a Real Estate Joint Venture between the Fund and the Operating Partner. Appraisals of Real Estate Joint Venture properties may be conducted more frequently than once a year if Boston Management determines that significant changes in economic circumstances that may materially impact estimated property values have occurred since the most recent appraisal.
In deriving the estimated value of a property, an appraiser considers numerous factors, including the expected future cash flows from the property, recent sale prices for similar properties and, if applicable, the replacement cost of the property, in order to derive an indication of the amount that a prudent, informed purchaser-investor would pay for the property. More specifically, the appraiser considers the revenues and expenses of the property and the estimated future growth or decline thereof, which may be based on tenant quality, property condition, change in market or submarket conditions, market trends, interest rates, inflation rates or other factors deemed relevant by the appraiser. The appraiser estimates operating cash flows from the property and the sale proceeds of a hypothetical transaction at the end of a hypothetical holding period. The cash flows are discounted to their present values using a market-derived discount rate and are added together to obtain a value indication. This value indication is compared to the value indication that results from applying a market-derived capitalization rate to a single year’s stabilized net operating income for the property. The assumed capitalization rate may be extracted from local market transactions or, when transaction evidence is lacking, obtained from trade sources. The appraiser considers the value indications derived by these two methods, as well as the value indicated by recent market transactions involving similar properties, in order to produce a final value estimate for the property.
Appraisals of properties owned by Real Estate Joint Ventures are conducted by independent appraisers who are licensed in their respective states and not affiliated with Eaton Vance or the Operating Partners. Each appraisal is conducted in accordance with the Uniform Standards Board and the Code of Professional Appraisal Practice of the Appraisal Institute (as well as other relevant standards). Boston Management reviews the appraisal of each property and generally relies on the assumptions and judgments made by the appraiser. Property appraisals are inherently uncertain because they apply assumed discount rates, capitalization rates, growth rates and inflation rates to the appraiser’s estimated stabilized cash flows, and due to the unique characteristics of a property, which may affect its value but may not be taken into account. If the assumptions and estimates used by the appraisers to determine the value of the properties owned by the Real Estate Joint Ventures were to change, it could materially impact the estimated fair value of the Real Estate Joint Ventures. When a property owned by a Real Estate Joint Venture has not been appraised (such as when the Real Estate Joint Venture recently acquired the property), Boston Management determines the estimated fair value of the property based on the transaction value of the property, which equals the total acquisition cost of the property exclusive of certain legal and transaction costs, provided such amount is deemed indicative of fair value. Once an appraisal of a property has been conducted, Boston Management bases the estimated fair value of the property principally on the estimated value as determined by the appraiser. Appraisals of newly acquired properties are conducted in the year following the acquisition. If the initial appraised value of a newly acquired property differs significantly from the transaction value of the property, it may materially impact the estimated fair value of the Real Estate Joint Venture that holds the property. Interim valuations of Real Estate Joint Venture assets may be adjusted to reflect significant changes in economic circumstances or recent evaluations of similar properties, and the results of operations and distributions. As of December 31, 2005, all of the properties owned by Deerfield and Katahdin were appraised during the year.
Boston Management determines the estimated fair value of the Fund’s equity interest in a Real Estate Joint Venture based on an estimate of the allocation of equity interests between the Fund and the Operating Partner. This allocation is generally calculated by a third party specialist, using current appraisals of the properties owned by the Real Estate Joint Venture. The specialist uses a financial model that considers (i) the terms of the joint venture agreement relating to allocation of distributable cash flow, (ii) the expected duration of the joint venture, and (iii) the projected property values and cash flows from the properties based on estimates used in the independent valuations. The estimated allocation of equity interests between the Fund and the Operating Partner of a Real Estate Joint Venture is prepared quarterly and reviewed by Boston Management. If the estimate of the allocation of equity interests in the Real Estate Joint Venture were to change (for example, because the appraisers’ estimate of property values or projected cash flows of the Real Estate Joint Venture changed), it may materially impact the estimated fair value of the Fund’s equity interest in the Real Estate Joint Venture.
23
Item 7A. Quantitative and Qualitative Disclosures About Market Risk.
(a) Quantitative Information About Market Risk.
Interest Rate Risk.The Fund’s primary exposure to interest rate risk arises from its real estate investments that are financed by the Fund with floating rate borrowings under the Credit Facility and by fixed-rate secured mortgage debt obligations of Deerfield and Katahdin. Partnership Preference Units are fixed rate instruments whose values will generally decrease when interest rates rise and increase when interest rates fall. The interest rates on borrowings under the Credit Facility are reset at regular intervals based on one-month LIBOR. The Fund has entered into interest rate swap agreements to fix the cost of a substantial portion of its borrowings under the Credit Facility used to acquire equity in real estate investments and to mitigate in part the impact of interest rate changes on the Fund’s net asset value. Under the terms of the interest rate swap agreements, the Fund makes cash payments at fixed rates in exchange for floating rate payments that fluctuate with one-month and three-month LIBOR. The Fund’s interest rate swap agreements will generally increase in value when interest rates rise and decrease in value when interest rates fall. In the future, the Fund may use other interest rate hedging arrangements (such as caps, floors and collars) to fix or limit borrowing costs. The use of interest rate hedging arrangements is a specialized activity that can expose the Fund to significant loss.
The following table summarizes the contractual maturities and weighted-average interest rates associated with the Fund’s significant non-trading financial instruments. The Fund has no market risk sensitive instruments held for trading purposes. This information should be read in conjunction with Notes 7 and 8 to the Fund’s consolidated financial statements appearing on pages 38 to 60 of this Annual Report on Form 10-K.
Interest Rate Sensitivity
Cost, Principal (Notional) Amount
by Contractual Maturity and Callable Date
for the Twelve Months Ended December 31,*
|
| | | | | | | | | | | | | | | Estimated |
| | | | | | | | | | | | | | | Fair Value as of |
| | | 2006-2007 | | 2008 | | 2009 | | 2010 | | Thereafter | | Total | | December 31, 2005 |
|
| Rate sensitive liabilities: | | | | | | | | | | | | | | |
| | |
| Long-term debt: | | | | | | | | | | | | | | |
| | |
| Fixed-rate mortgages | | | | | | | | | | $238,850,000 | | $238,850,000 | | $248,600,000 |
| | | | | | | | | | | | | | |
| Average interest rate | | | | | | | | | | 6.23% | | 6.23% | | |
| | |
| Variable-rate Credit Facility | | | | | | | | $393,500,000 | | | | $393,500,000 | | $393,500,000 |
| | | | | | | | | | | | | | |
| Average interest rate | | | | | | | | 4.72% | | | | 4.72% | | |
|
| Rate sensitive derivative financial | | | | | | | | | | | | | | |
| instruments: | | | | | | | | | | | | | | |
| | |
| Pay fixed/receive variable interest rate | | | | | | | | | | | | | | |
| swap agreements | | | | | | | | $152,837,500 | | $ 40,000,000 | | $192,837,500 | | $ 6,134,292 |
| | | | | | | | | | | | | | |
| Average pay rate | | | | | | | | 4.10% | | 4.88% | | 4.26% | | |
| | | | | | | | | | | | | | |
| Average receive rate | | | | | | | | 4.69% | | 4.54% | | 4.66% | | |
|
| Rate sensitive investments: | | | | | | | | | | | | | | |
| | |
| Fixed-rate Partnership Preference | | | | | | | | | | | | | | |
| Units: | | | | | | | | | | | | | | |
| | |
| Camden Operating, L.P., 7% Series B | | | | | | | | | | | | | | |
| Cumulative Redeemable Perpetual | | | | | | | | | | | | | | |
| Preferred Units, Callable 12/2/08, | | | | | | | | | | | | | | |
| Current Yield: 7.15% | | | | $15,802,670 | | | | | | | | $ 15,802,670 | | $ 15,918,500 |
24
| | | | | | | | | | | | | | | | | Estimated |
| | | | | | | | | | | | | | | | | Fair Value as of |
| | | 2006-2007 | | 2008 | | 2009 | | 2010 | | Thereafter | | | | Total | | December 31, 2005 |
|
| |
| Colonial Realty Limited Partnership, | | | | | | | | | | | | | | | | |
| 7.25% Series B Cumulative | | | | | | | | | | | | | | | | |
| Redeemable Perpetual Preferred | | | | | | | | | | | | | | | | |
| Units, Callable 8/24/09, | | | | | | | | | | | | | | | | |
| Current Yield: 7.27% | | | | | | $19,419,240 | | | | | | $ | | 19,419,240 | | $ 19,948,000 |
| |
| Essex Portfolio, L.P., 7.875% Series B | | | | | | | | | | | | | | | | |
| Cumulative Redeemable Preferred | | | | | | | | | | | | | | | | |
| Units, Callable 12/31/09, | | | | | | | | | | | | | | | | |
| Current Yield: 7.74% | | | | | | $26,643,900 | | | | | | $ | | 26,643,900 | | $ 26,707,537 |
| |
| Essex Portfolio, L.P., 7.875% Series D | | | | | | | | | | | | | | | | |
| Cumulative Redeemable Preferred | | | | | | | | | | | | | | | | |
| Units, Callable 7/28/10, | | | | | | | | | | | | | | | | |
| Current Yield: 7.68% | | | | | | $ | | 12,642,150 | | | | $ | | 12,642,150 | | $ 12,815,350 |
| |
| Kilroy Realty, L.P., 7.45% Series A | | | | | | | | | | | | | | | | |
| Cumulative Redeemable Preferred | | | | | | | | | | | | | | | | |
| Units, Callable 9/30/09, | | | | | | | | | | | | | | | | |
| Current Yield: 7.37% | | | | | | $22,381,740 | | | | | | $ | | 22,381,740 | | $ 22,731,975 |
| |
| Liberty Property Limited Partnership, | | | | | | | | | | | | | | | | |
| 7.45% Series B Cumulative | | | | | | | | | | | | | | | | |
| Redeemable Preferred Units, | | | | | | | | | | | | | | | | |
| Callable 8/31/09, | | | | | | | | | | | | | | | | |
| Current Yield: 7.22% | | | | | | $27,039,290 | | | | | | $ | | 27,039,290 | | $ 27,100,500 |
| |
| MHC Operating Limited Partnership, | | | | | | | | | | | | | | | | |
| 8.0625% Series D Cumulative | | | | | | | | | | | | | | | | |
| Redeemable Perpetual Preference | | | | | | | | | | | | | | | | |
| Units, Callable 3/24/10, | | | | | | | | | | | | | | | | |
| Current Yield: 7.97% | | | | | | $ | | 15,000,000 | | | | $ | | 15,000,000 | | $ 15,168,000 |
| |
| PSA Institutional Partners, L.P., 6.4% | | | | | | | | | | | | | | | | |
| Series NN Cumulative Redeemable | | | | | | | | | | | | | | | | |
| Perpetual Preferred Units, | | | | | | | | | | | | | | | | |
| Callable 3/17/10, | | | | | | | | | | | | | | | | |
| Current Yield: 6.54% | | | | | | $ | | 34,377,134 | | | | $ | | 34,377,134 | | $ 34,963,500 |
| |
| Vornado Realty, L.P., 6.75% Series | | | | | | | | | | | | | | | | |
| D-14 Cumulative Redeemable | | | | | | | | | | | | | | | | |
| Preferred Units, Callable 9/9/10, | | | | | | | | | | | | | | | | |
| Current Yield: 6.59%(1) | | | | | | $ | | 10,000,500 | | | | $ | | 10,000,500 | | $ 10,240,754 |
| * | The amounts listed reflect the Fund’s positions as of December 31, 2005. The Fund’s current positions may differ. (1)Belrose Realty’s interest in these Partnership Preference Units is held through Belvorn. |
| |
| | (b) Qualitative Information About Market Risk.
|
Risks Associated with Equity Investing.The Fund invests primarily in a diversified portfolio of common stocks and is thereby subject to general stock market risk. There can be no assurance that the performance of the Fund will match that of the U.S. stock market or that of other equity funds. In managing the Portfolio for long-term, after-tax returns, Boston Management generally seeks to avoid or minimize sales of securities with large accumulated capital gains, including contributed securities. Such securities constitute a substantial portion of the assets of the Portfolio. Although the Portfolio may utilize certain management strategies in lieu of selling appreciated securities, the Portfolio’s, and hence the Fund’s, exposure to losses during stock market declines may nonetheless be higher than funds that do not follow a general policy of avoiding sales of highly-appreciated securities.
25
Risks of Investing in Foreign Securities.The Portfolio invests in securities issued by foreign companies and the Fund may acquire foreign investments. Foreign investments involve considerations and possible risks not typically associated with investing in the United States. The value of foreign investments to U.S. investors may be adversely affected by changes in currency rates. Foreign brokerage commissions, custody fees and other costs of investing are generally higher than in the United States, and foreign investments may be less liquid, more volatile and subject to more government regulation than in the United States. Foreign investments could be adversely affected by other factors not present in the United States, including expropriation, confiscatory taxation, lack of uniform accounting and auditing standards, armed conflict, and potential difficulty in enforcing contractual obligations. These risks can be more significant for investments in emerging markets.
Risks of Certain Investment Techniques.In managing the Portfolio, Boston Management may purchase or sell derivative instruments (which derive their value by reference to other securities, indexes, instruments or currencies) to hedge against securities price declines and currency movements, to add investment exposure to individual securities and groups of securities and to enhance returns. Such transactions may include, without limitation, the purchase and sale of futures contracts on stocks and stock indexes and options thereon, the purchase of put options and the sale of call options on securities held, equity swaps, forward sales of stocks, and the purchase and sale of forward currency exchange contracts and currency futures. The Portfolio may engage in short sales of individual securities held and short sales of index or basket securities whose constituents are held in whole or in part. The Portfolio may enter into private contracts for the forward sale of stock held and may also lend portfolio securities.
The use of these investment techniques is a specialized activity that may be considered speculative and which can expose the Fund and the Portfolio to significant risk of loss. Successful use of these investment techniques is subject to the ability and performance of the investment adviser. The Fund’s and the Portfolio’s ability to achieve their investment objectives may be adversely affected by the use of these techniques. The writer of an option or a party to an equity swap may incur losses that substantially exceed the payments, if any, received from a counterparty. Forward sales, swaps, caps, floors, collars and over-the-counter options are private contracts in which there is also a risk of loss in the event of a default on an obligation to pay by the counterparty. Such instruments may be difficult to value, may be illiquid and may be subject to wide swings in valuation caused by changes in the price of the underlying security, index, instrument or currency. In addition, if the Fund or the Portfolio has insufficient cash to meet margin, collateral or settlement requirements, it may have to sell assets to meet such requirements. Alternatively, should the Fund or the Portfolio fail to meet these requirements, the counterparty or broker may liquidate positions of the Fund or the Portfolio. The Portfolio may also have to sell or deliver securities holdings in the event that it is not able to purchase securities on the open market to cover its short positions or to close out or satisfy an exercise notice with respect to options positions it has sold. In any of these cases, such sales may be made at prices or in circumstances that Boston Management considers unfavorable.
The Portfolio’s ability to utilize covered short sales, certain equity swaps, forward sales, futures and certain equity collar strategies (combining the purchase of a put option and the sale of a call option) as a tax-efficient management technique with respect to holdings of appreciated securities is limited to circumstances in which the hedging transaction is closed out within 30 days of the end of the Portfolio’s taxable year in which the hedging transaction was initiated and the underlying appreciated securities position is held unhedged for at least the next 60 days after such hedging transaction is closed. In addition, dividends received on stock for which the Portfolio is obligated to make related payments (pursuant to a short sale or otherwise) with respect to positions in substantially similar or related property are subject to federal income taxation at ordinary rates and do not qualify for favorable tax treatment. Also, holding periods required to receive tax-advantaged treatment of qualified dividends on a stock are suspended whenever the Portfolio has an option (other than a qualified covered call option not in the money when written) or contractual obligation to sell or an open short sale of substantially identical stock, is the grantor of an option (other than a qualified covered call option not in the money when written) to buy substantially identical stock or has diminished risk of loss in such stock by holding positions with respect to substantially similar or related property. There can be no assurance that counterparties will at all times be willing to enter into covered short sales, forward sales of stocks, interest rate hedges, equity swaps and other derivative instrument transactions on terms satisfactory to the Fund or the Portfolio. The Fund’s and the Portfolio’s ability to enter into such transactions may also be limited by covenants under the Fund’s Credit Facility, the federal margin regulations and other laws and regulations. The Portfolio’s use of certain investment techniques may be constrained because the Portfolio is a diversified, open-end management investment company registered under the 1940 Act and because other investors in the Portfolio are regulated investment companies under Subchapter M of the Code. Moreover, the Fund and the Portfolio are subject to restrictions under the federal securities laws on their ability to enter into transactions in respect of securities that are subject to restrictions on transfer pursuant to the Securities Act.
26
Risks of Real Estate Investments.The success of the Fund’s real estate investments depends in part on many factors related to the real estate market. These factors include, without limitation, general economic conditions, the supply and demand for different types of real properties, the financial health of tenants, changing transportation and logistics patterns (in the case of industrial distribution properties), the timing of lease expirations and terminations, fluctuations in rental rates and operating costs, exposure to adverse environmental conditions and losses from casualty or condemnation, fluctuations in interest rates, availability of financing, managerial performance, government rules and regulations, and acts of God (whether or not insured against). There can be no assurance that Belrose Realty’s ownership of real estate investments will be an economic success.
The success of investments in Partnership Preference Units depends upon factors relating to the issuing partnerships that may affect such partnerships’ profitability and their ability to make distributions to holders of Partnership Preference Units. Interests in Real Estate Joint Ventures and Partnership Preference Units are not registered under the federal securities laws and are subject to restrictions on transfer. Due to their illiquidity, they may be difficult to value and the ongoing value of the investments is uncertain. See "Critical Accounting Estimates" in Item 7(e). Investments in Partnership Preference Units are valued primarily by referencing market trading prices for comparable preferred equity securities or other fixed-rate instruments having similar investment characteristics. The valuations of Partnership Preference Units fluctuate over time to reflect, among other factors, changes in interest rates, changes in the perceived riskiness of such units (including call risk), changes in the perceived riskiness of comparable or similar securities trading in the public market and the relationship between supply and demand for comparable or similar securities trading in the public market. The valuation of Partnership Preference Units will be adversely affected by increases in interest rates and increases in the perceived riskiness of such units or comparable or similar securities. Fluctuations in the value of Partnership Preference Units derived from changes in general interest rates can be expected to be offset in part (but not entirely) by changes in the value of interest rate swap agreements or other interest rate hedges entered into by the Fund with respect to its borrowings under the Credit Facility. Fluctuations in the value of Partnership Preference Units that are derived from other factors besides general interest rate movements (including issuer-specific and sector-specific credit concerns, property or tenant-specific concerns, and changes in interest rate spread relationships) will not be offset by changes in the value of interest rate swap agreements or other interest rate hedges entered into by the Fund. Because the Partnership Preference Units are not rated by a nationally-recognized rating agency, they may be subject to more credit risk than securities that are rated investment grade.
The performance of Real Estate Joint Ventures is substantially influenced by the property management capabilities of the Operating Partners and conditions in the specific real estate sub-markets in which the properties owned by the Real Estate Joint Ventures are located. The Operating Partners are subject to substantial conflicts of interest in structuring, operating and winding up the Real Estate Joint Ventures. Each respective Operating Partner has an economic incentive to maximize the prices at which it sells properties to a Real Estate Joint Venture and has a similar incentive to minimize the prices at which it may acquire properties from a Real Estate Joint Venture. The Operating Partners may devote greater attention or more resources to managing their wholly-owned properties than properties held by the Real Estate Joint Ventures. Future investment opportunities identified by the Operating Partners will more likely be pursued independently, rather than through, the Real Estate Joint Ventures. Financial difficulties encountered by the Operating Partners in their other businesses may interfere with the operations of the Real Estate Joint Ventures.
Belrose Realty’s investment in Real Estate Joint Ventures may be significantly concentrated in terms of geographic regions, property types and operators, increasing the Fund’s exposure to regional, property type and operator-specific risks. Given a lack of stand-alone operating history and relatively high financial leverage, the Real Estate Joint Ventures are not equivalent in quality to real estate companies whose preferred equity or senior debt securities are rated investment grade. Distributable cash flows from a Real Estate Joint Ventures may not be sufficient for Belrose Realty to receive its fixed annual preferred return, or any returns in excess thereof.
The debt of Deerfield and Katahdin is fixed-rate, secured by the underlying properties and without recourse to Belrose Realty, the Fund and Shareholders. The availability of financing and other financial conditions can have a material impact on property values and therefore on the value of Real Estate Joint Venture assets. Mortgage debt of the Real Estate Joint Ventures normally cannot be refinanced prior to maturity without substantial penalties.
The ongoing value of Belrose Realty’s investments in the Real Estate Joint Ventures is substantially uncertain. The real property held through Belrose Realty’s Real Estate Joint Ventures is stated at the estimated fair value as described in Item 7(e). The policies for valuing real estate investments involve significant judgments that are based upon a number of factors, which may include, without limitation, general economic conditions, the supply and demand for different types of real properties, the financial health of tenants, the timing of lease expirations and terminations, fluctuations in rental rates
27
and operating costs, exposure to adverse environmental conditions and losses from casualty or condemnation, interest rates, availability of financing, managerial performance and government rules and regulations. Given that such valuations include many assumptions, values may differ from amounts ultimately realized.
Belrose Realty’s investments in Net Leased Property will be subject to general real estate market risks similar to an investment in a Real Estate Joint Venture. Investments in Net Leased Property will also be subject to risks specific to this type of investment, including a concentration of risk exposure to specific real estate submarkets and individual properties and tenants. Principal among the risks of investing in Net Leased Property is the risk that a major tenant fails to satisfy its lease obligations due to financial distress or other reasons. A tenant’s failure to meet its lease obligations would expose Belrose Realty to substantial loss of income without a commensurate reduction in debt service costs and other expenses, and would transfer to Belrose Realty all the costs, expenses and liabilities of property ownership and management borne by the tenant under the terms of the lease. Re-leasing a property could involve considerable time and expense. Re-leasing opportunities may be limited by the nature and location of the property, which may not be well suited to the needs of other possible tenants. Even if a property is re-leased, the property may not generate sufficient rental income to cover debt service and other expenses.
Net Leased Property is generally illiquid, and the ongoing value of Belrose Realty’s investments in Net Leased Property will be substantially uncertain. Net Leased Property held generally will be stated at estimated fair value based on annual appraisals. See "Critical Accounting Estimates" in Item 7(e). Because the value of Net Leased Property will reflect in part the creditworthiness of its principal tenant(s), any change in the financial status of a major tenant could affect the appraised value of a property and the value realized upon the disposition of such property. Tenants may hold rights to renew or extend expiring leases, and exercise of such rights would extend Belrose Realty’s risk exposure to a particular tenant beyond the initial lease term. Tenants may also hold options to purchase Net Leased Property, including options to purchase at below market levels. The value received upon the disposition of Net Leased Property will depend on real estate market conditions, lease and mortgage terms, tenant credit quality, tenant purchase options, lender approvals and other factors affecting valuation as may then apply. Because sales of Net Leased Property are not expected to occur for many years, market conditions and other valuation factors at the time of sale cannot be predicted. Since valuations of Net Leased Property assume an orderly disposition of assets, amounts realized in a distressed sale may differ substantially from stated values. Mortgage debt associated with Net Leased Property generally cannot be refinanced prior to maturity without substantial penalties. The terms of outstanding leases and mortgage debt obligations and restrictions on refinancing such debt will limit Belrose Realty’s ability to dispose of Net Leased Property.
Because all or substantially all of the rental payments on Net Leased Property generally will be dedicated to servicing the associated mortgage debt, during the initial lease term Belrose Realty will not generate significant cash flow from investments to offset Belrose Realty’s operating expenses and the cost of Fund borrowings used to finance Belrose Realty’s equity therein. Such costs and expenses must be provided from other sources of cash flow for Belrose Realty and the Fund, which may include additional Fund borrowings under the Credit Facility. Realized returns on investments in Net Leased Property generally are deferred until the properties are sold or re-leased following the initial lease term.
Changes in the value of real estate investments and other factors will cause the performance of the Fund to deviate from the performance of the Portfolio. Over time, the performance of the Fund can be expected to be more volatile than the performance of the Portfolio.
Risks of Interest Rate Swap Agreements. Interest rate swap agreements are subject to changes in valuation caused principally by movements in interest rates. Interest rate swap agreements are private contracts in which there is a risk of loss in the event of a default on an obligation to pay by the counterparty. Interest rate swap agreements may be difficult to value and may be illiquid. Fluctuations in the value of Partnership Preference Units derived from changes in general interest rates can be expected to be offset in part (but not entirely) by changes in the value of interest rate swap agreements applying to those Partnership Preference Units for which they were purchased, or other interest rate hedges that may be entered into by the Fund with respect to its borrowings.
Risks of Leverage.Although intended to add to returns, the borrowing of funds to purchase real estate investments exposes the Fund to the risk that the returns achieved on the real estate investments will be lower than the cost of borrowing to purchase such assets and that the leveraging of the Fund to buy such assets will therefore diminish the returns achieved by the Fund as a whole. In addition, there is a risk that the availability of financing will be interrupted at some future time, requiring the Fund to sell assets to repay outstanding borrowings or a portion thereof. It may be necessary to make such sales at unfavorable prices. The Fund’s obligations under the Credit Facility are secured by a pledge of its assets, excluding the assets of Deerfield and Katahdin. In the event of default, the lender could elect to sell assets of the Fund without regard
28
to consequences of such action for Shareholders. The rights of the lender to receive payments of interest on and repayments of principal of borrowings under the Credit Facility are senior to the rights of the Shareholders.
Under the terms of the Credit Facility, the Fund is not permitted to make distributions of cash or securities while there is an event of default outstanding under the Credit Facility. During such periods, the Fund would not be able to honor redemption requests or make cash distributions. In addition, the rights of lenders under the mortgages used to finance Real Estate Joint Venture properties are senior to Belrose Realty’s right to receive these distributions from the Real Estate Joint Ventures.
| | Item 8. Financial Statements and Supplementary Data.
|
The consolidated financial statements required by Item 8 are contained on pages 38 to 78 of this Annual Report on Form 10-K. The following is a summary of unaudited quarterly results of operations of the Fund for the years ended December 31, 2005 and 2004.
| | | | | 2005 | | | | |
| |
|
| | | First | | Second | | Third | | Fourth |
| | | Quarter | | Quarter | | Quarter | | Quarter |
| |
|
| Investment income | | $ 20,955,693 | | $24,367,673 | | $21,309,458 | | $19,132,703 |
| Minority interest in net income of controlled subsidiaries | | $ (205,899) | | $ (1,273,280) | | $ (787,853) | | $ (859,963) |
| Net investment income | | $ 2,685,963 | | $ 6,033,521 | | $ 3,220,354 | | $ 4,338,981 |
| Net increase (decrease) in net assets from operations | | $(11,694,689) | | $11,826,642 | | $74,581,679 | | $49,055,635 |
| |
| Per share data:(1) | | | | | | | | |
| Investment income | | $ 1.26 | | $ 1.47 | | $ 1.30 | | $ 1.17 |
| Net investment income | | $ 0.16 | | $ 0.36 | | $ 0.20 | | $ 0.27 |
| Net increase (decrease) in net assets from operations | | $ (0.70) | | $ 0.71 | | $ 4.55 | | $ 3.01 |
| | | | | | | 2004 | | | | |
| |
|
| | | First | | Second | | | | Third | | Fourth |
| | | Quarter | | Quarter | | | | Quarter | | Quarter |
| |
|
| Investment income | | $22,340,109 | | $21,472,458 | | $ | | 23,506,656 | | $ 23,576,636 |
| Minority interest in net income of controlled subsidiaries | | $ (473,208) | | $ (508,514) | | $ | | (292,336) | | $ (598,347) |
| Net investment income | | $ 5,440,346 | | $ 4,322,775 | | $ | | 2,175,246 | | $ 5,581,689 |
| Net increase (decrease) in net assets from operations | | $30,511,170 | | $26,772,662 | | $(45,229,350) | | $104,749,000 |
| |
| Per share data:(1) | | | | | | | | | | |
| Investment income | | $ 1.31 | | $ 1.26 | | $ | | 1.39 | | $ 1.41 |
| Net investment income | | $ 0.32 | | $ 0.25 | | $ | | 0.13 | | $ 0.33 |
| Net increase (decrease) in net assets from operations | | $ 1.79 | | $ 1.58 | | $ | | (2.68) | | $ 6.27 |
| (1) | Based on average Shares outstanding. |
| |
Item 9. Changes in and Disagreements with Accountants on Accounting and Financial Disclosure.
There have been no changes in, or disagreements with, accountants on accounting and financial disclosure.
| | Item 9A. Controls and Procedures.
|
Fund Governance.As the Fund’s manager, the complete and entire management, control and operation of the Fund are vested in Eaton Vance. The Fund’s Chief Executive Officer and Chief Financial Officer intend to report to the Board of Directors of Eaton Vance, Inc. (the sole trustee of Eaton Vance) any significant deficiency in the design or operation of internal control over financial reporting which could adversely affect the Fund’s ability to record, process, summarize and report financial data, and any fraud, whether or not material, that involves management or other employees who have a significant role in the Fund’s internal control over financial reporting.
29
Disclosure Controls and Procedures.Eaton Vance, as the Fund’s manager, evaluated the effectiveness of the Fund’s disclosure controls and procedures (as defined by Rule 13a-15(e) of the 1934 Act) as of the end of the period covered by this report, with the participation of the Fund’s Chief Executive Officer and Chief Financial Officer. The Fund’s disclosure controls and procedures are the controls and other procedures that the Fund designed to ensure that it records, processes, summarizes and reports in a timely manner the information that the Fund must disclose in reports that it files or submits to the Securities and Exchange Commission. Based on that evaluation, the Fund’s Chief Executive Officer and Chief Financial Officer concluded that, as of December 31, 2005, the Fund’s disclosure controls and procedures were effective.
Internal Control Over Financial Reporting.The Fund’s Chief Executive Officer and Chief Financial Officer have established and maintain internal control over financial reporting as defined in Rules 13a-15(f) and 15d-15(f) of the 1934 Act. Fund management’s report on internal control over financial reporting, including its assessment of the Fund’s internal control over financial reporting, appears on page 60 of this Annual Report on Form 10-K.
Item 9B. Other Information.
|
30
Item 10. Directors and Executive Officers of the Registrant.
Pursuant to the Fund’s LLC Agreement, the Fund’s manager, Eaton Vance, has the authority to conduct the Fund’s business. Eaton Vance appointed Thomas E. Faust Jr. and Michelle A. Green to serve indefinitely as the Fund’s Chief Executive Officer and Chief Financial Officer, respectively, on October 16, 2002. Information about Mr. Faust appears below. Ms. Green, 36, is a Vice President of Eaton Vance and Boston Management. She also serves as Chief Financial Officer of Belair Capital Fund LLC, Belcrest Capital Fund LLC, Belmar Capital Fund LLC and Belport Capital Fund LLC and as an officer of various other investment companies managed by Eaton Vance or Boston Management. Ms. Green has been an employee of Eaton Vance since 1997. As members of the Eaton Vance organization, Mr. Faust and Ms. Green receive no compensation from the Fund for serving as Fund officers. There are no other officers of the Fund. The Fund does not have a board of directors or similar governing body.
The Board of Directors of Eaton Vance, Inc., the sole trustee of Eaton Vance, oversees the accounting and financial reporting processes of the Fund and audits of the Fund’s financial statements. The directors of Eaton Vance, Inc. are James B. Hawkes and William M. Steul. The Fund’s audit committee financial expert (as that term is defined in Item 7(d)(3)(iv) of Schedule 14A under the Exchange Act) is Mr. Steul. Messrs. Hawkes and Steul are senior officers of Eaton Vance and, as such, are not independent of Fund management. Information about Mr. Hawkes and Mr. Steul appears below.
Boston Management is investment adviser to the Fund and the Portfolio and manager of Belrose Realty. The portfolio manager of the Fund and the Portfolio is Duncan W. Richardson, Executive Vice President and Chief Equity Investment Officer of Eaton Vance and Boston Management. Mr. Richardson has been employed by the Eaton Vance organization since 1987 and has served as portfolio manager of the Fund since its inception and of the Portfolio and its predecessor since 1990. A majority of Mr. Richardson’s time is spent managing the Portfolio and related entities. Boston Management has an experienced team of analysts that provides Mr. Richardson with research and recommendations on investments.
The directors of Belrose Realty are Mr. Faust and Alan R. Dynner, each of whom is described below. William R. Cross is the President and portfolio manager of Belrose Realty and the head of Boston Management’s real estate investment group which has primary responsibility for providing research and analysis relating to the Fund’s real estate investments held through Belrose Realty. Mr. Cross is a Vice President of Eaton Vance and Boston Management and has been employed by the Eaton Vance organization since 1996. A majority of Mr. Cross’s time is spent managing the real estate investments of Belrose Realty and the real estate affiliates of other investment funds advised by Boston Management. Mr. Cross, David Carlson and Mr. Dynner serve as managers or trustees of Deerfield and Katahdin owned by Belrose Realty. Mr. Dynner is also Vice President of Katahdin. Mr. Carlson is secretary of Katahdin and Mr. Cross serves as Chairman of Katahdin and President and Chairman of Deerfield. Mr. Carlson is a Vice President of Eaton Vance and Boston Management and has been employed by the Eaton Vance organization since 2001. Prior to joining Eaton Vance, Mr. Carlson was President of ILM Holding, Inc., a real estate holding company. Information about Mr. Dynner appears below.
As disclosed under “The Eaton Vance Organization” in Item 1, Eaton Vance and Boston Management are wholly-owned subsidiaries of Eaton Vance Corp. The non-voting common stock of Eaton Vance Corp. is listed and traded on the NYSE. All shares of the voting common stock of Eaton Vance Corp. are held in a voting trust, the voting trustees of which are senior officers of the Eaton Vance organization. Eaton Vance, Inc., a wholly-owned subsidiary of Eaton Vance Corp., is the sole trustee of Eaton Vance and of Boston Management, each of which is a Massachusetts business trust. The names of the executive officers and the directors of Eaton Vance, Inc. and their ages and principal occupations (in addition to their responsibilities described above) are set forth below.
James B. Hawkes (64) is Chairman, Chief Executive Officer and a Director of Eaton Vance Corp. and Chief Executive Officer of Eaton Vance, Boston Management and Eaton Vance, Inc., and a Director of Eaton Vance, Inc. He is Vice President and Director of EV Distributors. He is also a Trustee and an officer of various investment companies managed by Eaton Vance or Boston Management and has been employed by Eaton Vance since 1970.
Thomas E. Faust Jr. (47) is President and Chief Investment Officer of Eaton Vance and Boston Management, President of Eaton Vance, Inc., and a Director, President and Chief Investment Officer of Eaton Vance Corp. He is also Chief Executive Officer of Belair Capital Fund LLC, Belcrest Capital Fund LLC, Belmar Capital Fund LLC and Belport Capital Fund LLC
31
and is an officer of various other investment companies managed by Eaton Vance or Boston Management. Mr. Faust has been employed by Eaton Vance since 1985.
Alan R. Dynner (65) is Vice President, Chief Legal Officer and Secretary of Eaton Vance, Boston Management, Eaton Vance Corp., EV Distributors and Eaton Vance, Inc. He is also an officer of various investment companies managed by Eaton Vance or Boston Management and has been employed by Eaton Vance since 1996.
William M. Steul (63) is Vice President and Chief Financial Officer of Eaton Vance, Boston Management, Eaton Vance Corp. and Eaton Vance, Inc. and a Director of Eaton Vance, Inc. He is also Vice President of EV Distributors. He has been employed by Eaton Vance since 1994.
(b) Compliance with Section 16(a) of the Securities Exchange Act of 1934.
Section 16(a) of the 1934 Act requires the Fund’s officers and directors and persons who own more than ten percent of the Fund’s Shares to file forms reporting their affiliation with the Fund and reports of ownership and changes in ownership of the Fund’s Shares with the SEC. Eaton Vance, as manager of the Fund, and the Directors and executive officers of Eaton Vance, Inc., the sole trustee of Eaton Vance, also comply with Section 16(a). These persons and entities are required by SEC regulations to furnish the Fund with copies of all Section 16(a) forms they file. To the best of the Fund’s knowledge, during the year ended December 31, 2005 no Section 16(a) filings were required by such persons or entities.
The Fund has adopted a Code of Ethics that applies to the principal executive officer and principal financial officer (who is also the Fund’s principal accounting officer). A copy of the Code of Ethics is available at no cost by request to the Fund’s Chief Financial Officer, 255 State Street, Boston, MA 02109 or by calling (800) 225-6265. If the Fund makes any substantive amendments to the Code of Ethics or grants any waiver, including an implicit waiver, from a provision of the Code of Ethics as applicable to the principal executive officer or principal financial officer, the Fund will disclose the nature of such amendment or waiver in a report on Form 8-K.
Item 11. Executive Compensation.
|
As noted in Item 10, the officers of the Fund receive no compensation from the Fund. The Fund’s manager, Eaton Vance, and its affiliates receive certain fees from the Fund for services provided to the Fund, which are described in Item 13 below.
Item 12. Security Ownership of Certain Beneficial Owners and Management and Related Shareholder Matters.
Security Ownership of Certain Beneficial Owners.To the knowledge of the Fund, no person beneficially owns more than 5% of the Shares of the Fund.
Security Ownership of Management.As of February 28, 2006, Eaton Vance, the manager of the Fund, beneficially owned 103 Shares of the Fund. The Shares owned by Eaton Vance represent less than 1% of the outstanding Shares of the Fund as of February 28, 2006. None of the other entities or individuals named in response to Item 10 above beneficially owned Shares of the Fund as of such date.
Changes in Control.Not applicable.
Item 13. Certain Relationships and Related Transactions.
The table below sets forth the fees paid or payable by, or allocable to, the Fund and Belrose Realty for the years ended December 31, 2005 and 2004 in connection with services rendered by Eaton Vance and its affiliates. Each fee is described following the table.
32
| | | Year ended | | Year ended |
| | | December 31, 2005 | | December 31, 2004 |
|
| Fund Advisory and Administrative Fees* | | $1,311,285 | | $1,217,128 |
|
| Belrose Realty Management Fees* | | $2,954,419 | | $3,014,234 |
|
| Fund’s Allocable Portion of the Portfolio’s Advisory Fees** | | $7,486,967 | | $7,197,653 |
|
| Fund Servicing Fees | | $1,610,761 | | $1,610,127 |
|
| Fund’s Allocable Portion of Belvedere Company’s Servicing Fees | | $2,601,544 | | $2,494,434 |
|
| Fund Distribution Fees* | | $1,685,761 | | $1,641,602 |
|
| Redemption Fees paid by Redeeming Shareholders | | $ 128,646 | | $ 285,453 |
|
| Aggregate Compensation Paid by the Fund to Eaton Vance and | | | | |
| its Affiliates | | $5,951,465 | | $5,872,964 |
|
| * | Boston Management has agreed to waive the portion of the investment advisory and administrative fee payable by the Fund to the extent that such fee, together with the distribution fee payable by the Fund and the Fund’s attributable share of the investment advisory and management fees payable by the Portfolio and Belrose Realty, respectively, exceeds 0.60% of the average daily gross assets of the Fund. The amount is net of amounts waived by Boston Management. |
| |
| ** | For years ended December 31, 2005 and 2004, advisory fees paid or payable by the Portfolio totaled $80,617,092 and $77,609,178, respectively. For the year ended December 31, 2005, Belvedere Company’s allocable portion of that fee was $55,259,100, of which $7,486,967, was allocable to the Fund. For the year ended December 31, 2004, Belvedere Company’s allocable portion of that fee was $50,252,861 of which $7,197,653 was allocable to the Fund. |
| |
The Fund’s Investment Advisory and Administrative Fee.Under the terms of the Fund’s investment advisory and administrative agreement, Boston Management is entitled to receive, subject to the fee waiver described in the next sentence, a monthly advisory and administrative fee at the rate of 1/20 of 1% (equivalent to 0.60% annually) of the average daily gross assets of the Fund. Boston Management has agreed to waive that portion of the monthly investment advisory and administrative fee payable by the Fund to the extent that such fee, together with the distribution fees payable by the Fund (see "Distribution Fees Paid to EV Distributors" below) and the Fund’s attributable share of the monthly investment advisory and management fees for such month payable by the Portfolio and Belrose Realty, respectively, exceeds 1/20 of 1% of the average daily gross assets of the Fund. The term “gross assets of the Fund” means the value of all Fund assets (including the Fund’s interest in Belvedere Company and the Fund’s ratable share of the assets of its directly and indirectly controlled subsidiaries), without reduction by any liabilities.
Belrose Realty’s Management Fees.Under the terms of Belrose Realty’s management agreement with Boston Management, Boston Management receives a monthly management fee at the rate of 1/20 of 1% (equivalent to 0.60% annually) of the average daily gross assets of Belrose Realty. The term "gross assets of Belrose Realty" means the current value of all assets of Belrose Realty (including Belrose Realty’s ratable share of the assets of its controlled subsidiaries), without reduction by any liabilities. For this purpose, the assets and liabilities of Belrose Realty’s controlled subsidiaries are reduced by the proportionate interests therein of investors other than Belrose Realty.
33
The Portfolio’s Investment Advisory Fee.Under the terms of the Portfolio’s investment advisory agreement with Boston Management, Boston Management receives a monthly advisory fee as follows:
| | | Annual Fee Rate |
| Average Daily Net Assets for the Month | | (for each level) |
|
| Up to $500 million | | 0.6250% |
| $500 million but less than $1 billion | | 0.5625% |
| $1 billion but less than $1.5 billion | | 0.5000% |
| $1.5 billion but less than $7 billion | | 0.4375% |
| $7 billion but less than $10 billion | | 0.4250% |
| $10 billion but less than $15 billion | | 0.4125% |
| $15 billion and over | | 0.4000% |
In accordance with the terms of the 1940 Act, the Portfolio’s Board of Trustees considers the continuation of the Portfolio’s investment advisory agreement annually.
Servicing Fees Paid by the Fund.Pursuant to a servicing agreement between the Fund and EV Distributors, the Fund pays a servicing fee to EV Distributors for providing certain services and information to the Shareholders of the Fund. The servicing fee is paid on a quarterly basis at an annual rate of 0.25% of the Fund’s average daily net assets. With respect to Shareholders who subscribed through a subagent, EV Distributors has assigned servicing responsibilities and fees to the applicable subagent, beginning twelve months after the issuance of Shares of the Fund to such persons. The Fund’s allocated share of the servicing fee paid by Belvedere Company is credited toward the Fund’s servicing fee payment, thereby reducing the amount of the servicing fee payable by the Fund.
Servicing Fees Paid by Belvedere Company.Pursuant to a servicing agreement between Belvedere Company and EV Distributors, Belvedere Company pays a servicing fee to EV Distributors for providing certain services and information to direct and indirect investors in Belvedere Company. The servicing fee is paid on a quarterly basis, at an annual rate of 0.15% of Belvedere Company’s average daily net assets. With respect to investors in Belvedere Company andShareholders of the Fund who subscribed through a subagent, EV Distributors has assigned servicing responsibilities and fees to the applicable subagent, beginning twelve months after the issuance of shares of Belvedere Company or Shares of the Fund to such persons. The Fund assumes its allocated share of Belvedere Company’s servicing fee. The servicing fee payable in respect of the Fund’s investment in Belvedere Company is credited toward the Fund servicing fee described above.
Distribution Fees Paid to EV Distributors.Under the terms of the Fund’s placement agreement with EV Distributors, EV Distributors receives a monthly distribution fee at an annual rate of 0.10% of the average daily net assets of the Fund as compensation for its services as placement agent. The distribution fee accrued from the Fund’s initial closing and will continue for a period of ten years (subject to the annual approval of Eaton Vance, Inc.).
Redemption Fees.Shares of the Fund redeemed within three years of issuance are generally subject to a redemption fee equal to 1% of the net asset value of the Fund Shares redeemed. The redemption fee is payable to EV Distributors in cash by the Fund on behalf of the redeeming Shareholder. No redemption fee is imposed on Shares of the Fund held for at least three years, Shares acquired through the reinvestment of Fund distributions, Shares redeemed in connection with a tender offer or other extraordinary corporate event involving securities contributed by the redeeming Shareholder, or Shares redeemed following the death of all of the initial owners of the Shares redeemed. In addition, no fee applies to redemptions made pursuant to a systematic redemption plan established by a Shareholder with the Fund.
34
Certain Real Estate Investment Transactions.During the year ended December 31, 2005, Belrose Realty entered into the following real estate investment transactions with real estate affiliates of other investment funds managed by Eaton Vance and advised by Boston Management or an entity owned by such real estate affiliate:
- Belrose Realty sold its interest in Bel Communities to Belwater Realty Corporation, which realized a gain of $12.3million on the transaction.
- Belrose Realty purchased Partnership Preference Units from Belcrest Realty Corporation, which realized a loss ofapproximately $0.3 million on the transactions.
- Belrose Realty purchased Partnership Preference Units from Belwater Realty Corporation, which realized a loss ofapproximately $2.1 million on the transactions.
- Belrose Realty sold Partnership Preference Units to Belwater Realty Corporation, realizing a gain of approximately$0.3 million on the transactions.
The prices of the real estate investments purchased and sold by Belrose Realty were determined in good faith by Boston Management after consideration of factors, data and information that it considered relevant.
Item 14. Principal Accountant Fees and Services.
|
The following table presents fees for the professional audit services rendered by Deloitte & Touche LLP for the audit of the Fund’s annual financial statements for the years ended December 31, 2005 and 2004 and fees billed for other services rendered by Deloitte & Touche LLP during those periods, including fees charged by Deloitte & Touche LLP to the Fund’s consolidated subsidiaries.
| | | Year ended December 31, |
|
| | | 2005 | | | | 2004(2) |
|
| Audit fees | | $249,335 | | $ | | 241,598 |
| Tax fees(1) | | 215,876 | | | | 210,492 |
| |
|
| Total | | $465,211 | | $ | | 452,090 |
| |
|
| (1) | Tax fees consist of the aggregate fees billed for professional services rendered by Deloitte & Touche LLP for tax compliance, tax advice and tax planning. |
| |
| (2) | Certain amount have been reclassified to conform with current year presentation. Amounts disclosed as audit-related fees in 2004 have been reclassified as audit fees. |
| |
The Fund’s Audit Committee reviews all audit, tax and other fees of Deloitte & Touche LLP at least annually. The Audit Committee pre-approved all audit and tax services for the years ended December 31, 2005 and 2004 in accordance with the Fund’s pre-approval policies. The Audit Committee has concluded that the provision of the tax services listed above is compatible with maintaining the independence of Deloitte & Touche LLP.
35
Item 15. Exhibits and Financial Statement Schedules.
|
| (a) | Please see the Fund’s consolidated financial statements on pages 38 to 60 of this Annual Report on Form 10-K. Please see the Portfolio’s financial statements on pages 61 to 77 of this Annual Report on Form 10- K. |
| |
| (b) | Reports on Form 8-K: None. |
| |
| (c) | A list of the exhibits filed as a part of this Form 10-K is included in the Exhibit Index appearing on page 80 hereof. |
| |
36
A p p e n d ix A
T h e F u n d ’s In v e stm e n t S tru c tu re
a s o f D e c e m b e r 3 1 , 2 0 0 5
|
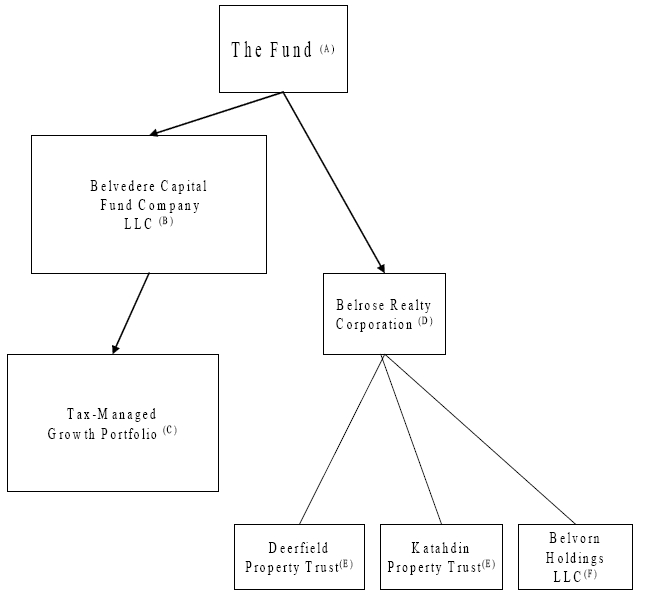
| (A ) Eaton Vance is the manager of the Fund; Boston Management is the Fund's investment adviser. |
|
| (B ) Boston Management is the manager of Belvedere Company. |
|
| (C ) Boston Management is the Portfolio's investment adviser. |
|
| (D ) Boston Management is the manager of Belrose Realty. Belrose Realty also holds direct investments in Partnership Preference Units. |
|
|
| (E ) Belrose Realty owns a majority interest in these Real Estate Joint Ventures. |
|
| (F ) Belrose Realty owns a minority interest in Belvorn Holdings LLC, which owns Partnership Preference Units issued by Vornado Realty, L.P. |
|
37
Belrose Capital Fund LLC
CONSOLIDATED PORTFOLIOS OF INVESTMENTS
As of December 31, 2005
|
I n v e s t m e n t i n B e l v e d e r e C a p i t a l F u n d
C o m p a n y L L C — 7 5 . 6 % |
|
| |
| Security | | | | Shares | | Value |
|
Investment in Belvedere Capital Fund Company LLC
(Belvedere Company) | | | | | | |
| | 10,130,547 | | $1,783,649,094 |
|
| |
| Total Investment in Belvedere Company | | |
| (identified cost, $1,505,010,481) | | $1,783,649,094 |
|
| |
| P a r t n e r s h i p P r e f e r e n c e U n i t s — | | 7 . 9 % |
| |
| Security | | | | Units | | Value |
|
| Belvorn Holdings LLC†(1)(2) | | | | 100,005 | | $ | | 10,240,754 |
Camden Operating, L.P. (Delaware Limited
Partnership affiliate of Camden Property Trust),
7% Series B Cumulative Redeemable Perpetual
Preferred Units, Callable from 12/2/08†(2) | | | | | | |
| | | | | | |
| | | | | | |
| | 650,000 | | | | 15,918,500 |
Colonial Realty Limited Partnership (Delaware
Limited Partnership affiliate of Colonial
Properties Trust), 7.25% Series B Cumulative
Redeemable Perpetual Preferred Units,
Callable from 8/24/09†(2) | | | | | | |
| | | | | | |
| | | | | | |
| | | | | | |
| | 400,000 | | | | 19,948,000 |
Essex Portfolio, L.P. (California Limited
Partnership affiliate of Essex Property
Trust, Inc.), 7.875% Series B Cumulative
Redeemable Preferred Units, Callable
from 12/31/09†(2) | | | | | | |
| | | | | | |
| | | | | | |
| | | | | | |
| | 525,000 | | | | 26,707,537 |
Essex Portfolio, L.P. (California Limited
Partnership affiliate of Essex Property
Trust, Inc.), 7.875% Series D Cumulative
Redeemable Preferred Units, Callable
from 7/28/10†(2) | | | | | | |
| | | | | | |
| | | | | | |
| | | | | | |
| | 500,000 | | | | 12,815,350 |
Kilroy Realty, L.P. (Delaware Limited Partnership
affiliate of Kilroy Realty Corporation),
7.45% Series A Cumulative Redeemable
Preferred Units, Callable from 9/30/09†(2) | | | | | | |
| | | | | | |
| | | | | | |
| | 450,000 | | | | 22,731,975 |
Liberty Property Limited Partnership (Pennsylvania
Limited Partnership affiliate of Liberty Property
Trust), 7.45% Series B Cumulative Redeemable
Preferred Units, Callable from 8/31/09†(2) | | | | | | |
| | | | | | |
| | | | | | |
| | 1,050,000 | | | | 27,100,500 |
MHC Operating Limited Partnership, L.P.
(Illinois Limited Partnership affiliate of Equity
Lifestyle Properties, Inc.), 8.0625% Series D
Cumulative Redeemable Perpetual Preference
Units, Callable from 3/24/10†(2) | | | | | | |
| | | | | | |
| | | | | | |
| | | | | | |
| | 600,000 | | | | 15,168,000 |
PSA Institutional Partners, L.P. (California Limited
Partnership affiliate of Public Storage, Inc.),
6.4% Series NN Cumulative Redeemable Perpetual
Preferred Units, Callable from 3/17/10†(2) | | | | | | |
| | | | | | |
| | | | | | |
| | 1,430,000 | | | | 34,963,500 |
|
| |
| Total Partnership Preference Units | | | | |
| (identified cost, $183,306,624) | | $ | | 185,594,116 |
|
| O t h e r R e a l E s t a t e I n v e s t m e n t s — 1 6 . 3 % |
| Description | | | | Value |
|
| Rental property(2)(3) | | | | $ | | 384,991,981 |
| Investment in management contracts(2)(4) | | | | 232,052 |
|
| |
| Total Other Real Estate Investments | | | | |
| (identified cost, $381,781,034) | | $ | | 385,224,033 |
|
| |
| C o m m e r c i a l P a p e r — 0 . 1 % |
Security | | Principal
Amount | |
Value |
| | |
|
| General Electric Capital Corporation, | | | | | | |
| 4.20%, 1/3/06 | | $2,798,000 | | $ | | 2,797,347 |
|
| |
| Total Commercial Paper | | | | |
| (at amortized cost, $2,797,347) | | $ | | 2,797,347 |
|
| |
| O t h e r S h o r t - Te r m I n v e s t m e n t s — 0 . 1 % |
Security | | Principal
Amount | |
Value |
| | |
|
| Investors Bank & Trust Company — | | | | | | |
| Time Deposit, 4.23%, 1/3/06 | | $2,000,000 | | $ | | 2,000,000 |
|
| |
| Total Other Short-Term Investments | | | | |
| (at amortized cost, $2,000,000) | | $ | | 2,000,000 |
|
| |
| Total Investments — 100.0% | | | | |
| (identified cost, $2,074,895,486) | | $2,359,264,590 |
|
S e e n o t e s t o c o n s o l i d a t e d f i n a n c i a l s t a t e m e n t s
|
38
Belrose Capital Fund LLC
CONSOLIDATED PORTFOLIOS OF INVESTMENTSCONT’D
As of December 31, 2004
|
I n v e s t m e n t i n B e l v e d e r e C a p i t a l F u n d
C o m p a n y L L C — 7 5 . 9 % |
|
| |
| Security | | | | Shares | | Value |
|
| Investment in Belvedere Capital Fund Company LLC | | | | |
| (Belvedere Company) | | | | 10,328,495 | | $1,757,804,676 |
|
| |
| Total Investment in Belvedere Company | | |
| (identified cost, $1,488,476,148) | | $1,757,804,676 |
|
| |
| P a r t n e r s h i p P r e f e r e n c e U n i t s — 2 . 6 % |
| |
| Security | | | | Units | | Value |
|
Essex Portfolio, L.P. (California Limited
Partnership affiliate of Essex Property
Trust, Inc.), 7.875% Series B Cumulative
Redeemable Preferred Units, Callable
from 12/31/09†(2) | | | | | | |
| | | | | | |
| | | | | |
| | | | | | |
| | 225,000 | | $ | | 11,423,745 |
Essex Portfolio, L.P. (California Limited
Partnership affiliate of Essex Property
Trust, Inc.), 7.875% Series D Cumulative
Redeemable Preferred Units, Callable
from 7/28/10†(2) | | | | | | |
| | | | | | |
| | | | | |
| | | | | | |
| | 500,000 | | | | 12,713,050 |
Liberty Property Limited Partnership
(Pennsylvania Limited Partnership affiliate
of Liberty Property Trust), 7.45% Series B
Cumulative Redeemable Preferred Units,
Callable from 8/31/09†(2) | | | | | | |
| | | | | |
| | | | | |
| | | | | |
| | 700,000 | | | | 17,983,000 |
PSA Institutional Partners, L.P. (California
Limited Partnership affiliate of Public
Storage, Inc.), 6.4% Series NN Cumulative
Redeemable Perpetual Preferred Units,
Callable from 3/17/10†(2) | | | | | | |
| | | | | | |
| | | | | |
| | | | | |
| | 730,000 | | | | 17,461,600 |
|
| |
| Total Partnership Preference Units | | | | |
| (identified cost, $59,871,404) | | $ | | 59,581,395 |
|
| |
| O t h e r R e a l E s t a t e I n v e s t m e n t s — 2 1 . 5 % |
| |
| Description | | | | | | Value |
|
| Rental property(2)(3) | | | | | | $ | | 496,847,049 |
| Investment in management contracts(2)(4) | | | | 1,542,829 |
|
| |
| Total Other Real Estate Investments | | | | |
| (identified cost, $528,935,061) | | $ | | 498,389,878 |
|
| S h o r t - Te r m I n v e s t m e n t s — 0 . 0 % |
| |
| | | | | Principal | | | | |
| Security | | Amount | | Value | | |
|
| |
| Investors Bank & Trust Company — | | | | | | |
| Time Deposit, 2.25%, 1/3/05 | | $721,000 | | $ | | 721,000 |
|
| |
| |
| Total Short-Term Investments | | | | | | |
| | | (at amortized cost, $721,000) | | | | $ | | 721,000 |
|
| |
| |
| Total Investments — 100.0% | | | | | | |
| | | (identified cost, $2,078,003,613) | | $2,316,496,949 |
|
| |
| The following footnotes are for the years ended December 31, 2005 |
| and December 31, 2004: | | | | | | |
| † | | Security exempt from registration under the Securities Act of
1933. At December 31, 2005 and 2004, the value of these
securities totaled $185,594,116 and $59,581,395, or 10.6% and
3.5% of net assets, respectively. |
| | |
| | |
| | |
| (1) | | The sole investment of Belvorn Holdings LLC is as follows:
Vornado Realty, L.P. (Delaware Limited Partnership affiliate of
Vornado Realty Trust), 6.75% Series D-14 Cumulative
Redeemable Preferred Units, callable from 9/9/10. This security
is exempt from the Securities Act of 1933. See Note 1B. |
| | |
| | |
| | |
| | |
| (2) | | Investment valued at fair value using methods determined in
good faith by or at the direction of the manager of Belrose
Realty Corporation. |
| | |
| | |
| (3) | | At December 31, 2005, rental property represents six multifamily
residential properties and seventeen industrial distribution
properties. At December 31, 2004, rental property represents
eighteen multifamily residential properties and eighteen
industrial distribution properties. None of the values of the
individual properties represent more than 5% of net assets. |
| | |
| | |
| | |
| | |
| | |
| (4) | | See Note 5 — Investment transactions. | | | | |
S e e n o t e s t o c o n s o l i d a t e d f i n a n c i a l s t a t e m e n t s
|
39
Belrose Capital Fund LLC
CONSOLIDATED FINANCIAL STATEMENTS
Consolidated Statements of Assets and Liabilities
|
| Assets | | December 31, 2005 | | December 31, 2004 |
|
| Investments, at value (identified cost, $2,074,895,486 and $2,078,003,613, respectively) | | $2,359,264,590 | | $2,316,496,949 |
| Cash | | | | 51,271,803 | | | | 5,348,786 |
| Escrow deposits — restricted | | | | 29,764,909 | | | | 2,160,740 |
| Open interest rate swap agreements, at value | | | | 6,134,292 | | | | 556,139 |
| Distributions and interest receivable | | | | 285,450 | | | | 343 |
| Swap interest receivable | | | | 68,131 | | | | — |
| Other assets | | | | 5,251,863 | | | | 8,783,945 |
|
| |
| Total assets | | $2,452,041,038 | | $2,333,346,902 |
|
| |
| |
| Liabilities | | | | | | | | |
|
| Loan payable — Credit Facility | | $ | | 393,500,000 | | $ | | 236,000,000 |
| Mortgages payable | | | | 238,850,000 | | | | 359,850,000 |
| Payable for Fund Shares redeemed | | | | — | | | | 3,958,764 |
| Payable to affiliate for investment advisory and administrative fees | | | | 365,900 | | | | — |
| Payable to affiliate for distribution and servicing fees | | | | 572,971 | | | | — |
| Note payable to minority shareholder | | | | 20,788,024 | | | | — |
| Security deposits | | | | 1,229,116 | | | | 1,443,878 |
| Accrued expenses: | | | | | | | | |
| Swap interest expense | | | | — | | | | 46,549 |
| Interest expense | | | | 1,622,241 | | | | 2,166,072 |
| Property taxes | | | | 1,856,924 | | | | 1,188,106 |
| Other expenses and liabilities | | | | 2,461,869 | | | | 4,633,014 |
| Minority interests in controlled subsidiaries | | | | 37,783,593 | | | | 29,833,094 |
|
| |
| Total liabilities | | $ | | 699,030,638 | | $ | | 639,119,477 |
|
| |
| Net Assets | | $1,753,010,400 | | $1,694,227,425 |
|
| |
| |
| |
| Shareholders’ Capital | | $1,753,010,400 | | $1,694,227,425 |
|
| |
| |
| Fund Shares Outstanding | | | | 16,186,813 | | | | 16,604,562 |
|
| |
| |
| Net Asset Value and Redemption Price Per Share (Note 4) | | $ | | 108.30 | | $ | | 102.03 |
|
S e e n o t e s t o c o n s o l i d a t e d f i n a n c i a l s t a t e m e n t s
|
40
Belrose Capital Fund LLC
CONSOLIDATED FINANCIAL STATEMENTSCONT’D
Consolidated Statements of Operations
|
| | | | | | | For the Year Ended | | | | |
| |
|
| Investment Income | | December 31, 2005 | | December 31, 2004 | | December 31, 2003 |
|
| Dividends allocated from Belvedere Company | | | | | | | | | | | | |
| (net of foreign taxes, $441,558, $352,093 and $248,681, respectively) | | $ 29,228,092 | | $ | | 26,977,973 | | $ | | 21,290,041 |
| Interest allocated from Belvedere Company | | | | 141,806 | | | | 117,249 | | | | 335,885 |
| Expenses allocated from Belvedere Company | | (10,412,031) | | | | (9,996,601) | | | | (8,692,174) |
|
| Net investment income allocated from Belvedere Company | | $ 18,957,867 | | $ | | 17,098,621 | | $ | | 12,933,752 |
| Rental income | | | | 56,403,019 | | | | 68,052,061 | | | | 64,679,823 |
| Distributions from Partnership Preference Units | | | | 6,573,938 | | | | 5,475,556 | | | | 4,591,951 |
| Interest | | | | 526,681 | | | | 269,621 | | | | 107,430 |
| Other income | | | | 3,304,022 | | | | — | | | | — |
|
| Total investment income | | $ 85,765,527 | | $ | | 90,895,859 | | $ | | 82,312,956 |
|
| |
| Expenses | | | | | | | | | | | | |
|
| Investment advisory and administrative fees | | $ | | 5,951,465 | | $ | | 5,872,964 | | $ | | 4,977,521 |
| Property management and administrative fees | | | | 2,486,905 | | | | 2,810,791 | | | | 2,590,322 |
| Distribution and servicing fees | | | | 3,296,522 | | | | 3,251,729 | | | | 2,800,440 |
| Interest expense on mortgages | | | | 22,289,206 | | | | 26,491,201 | | | | 26,317,765 |
| Interest expense on Credit Facility | | | | 10,415,418 | | | | 4,381,975 | | | | 2,796,418 |
| Property and maintenance expenses | | | | 14,576,846 | | | | 20,756,004 | | | | 17,974,998 |
| Property taxes and insurance | | | | 7,531,090 | | | | 8,456,423 | | | | 8,068,145 |
| Miscellaneous | | | | 1,498,022 | | | | 1,123,913 | | | | 979,238 |
|
| Total expenses | | $ 68,045,474 | | $ | | 73,145,000 | | $ | | 66,504,847 |
|
| Deduct — | | | | | | | | | | | | |
| Reduction of investment advisory and administrative fees | | $ | | 1,685,761 | | $ | | 1,641,602 | | $ | | 1,415,111 |
|
| Net expenses | | $ 66,359,713 | | $ | | 71,503,398 | | $ | | 65,089,736 |
|
| Net investment income before minority interests in net income of controlled subsidiaries | | $ 19,405,814 | | $ | | 19,392,461 | | $ | | 17,223,220 |
| Minority interests in net income of controlled subsidiaries | | | | (3,126,995) | | | | (1,872,405) | | | | (1,943,578) |
|
| |
| Net investment income | | $ 16,278,819 | | $ | | 17,520,056 | | $ | | 15,279,642 |
|
| |
| Realized and Unrealized Gain (Loss) | | | | | | | | | | | | |
|
| Net realized gain (loss) — | | | | | | | | | | | | |
| Investment transactions, securities sold short and foreign currency transactions allocated | | | | | | | | | | | | |
| from Belvedere Company (identified cost basis) | | $ 48,573,761 | | $ | | 37,885,739 | | $ | | 19,117,006 |
| Investment transactions (identified cost basis) | | | | — | | | | — | | | | (14,942) |
| Investment transactions in Partnership Preference Units (identified cost basis) | | | | 323,360 | | | | 4,995,589 | | | | — |
| Investment transactions in other real estate (net of minority interests in realized gain (loss) | | | | | | | | | | | | |
| of controlled subsidiaries of $7,929,126, $(4,035,005) and $0, respectively) | | | | 21,758,545 | | | | (1,548,753) | | | | — |
| Interest rate swap agreements(1) | | | | (1,383,303) | | | | (4,236,995) | | | | (16,652,934) |
|
| Net realized gain | | $ 69,272,363 | | $ | | 37,095,580 | | $ | | 2,449,130 |
|
| Change in unrealized appreciation (depreciation) — | | | | | | | | | | | | |
| Investments, securities sold short and foreign currency allocated from Belvedere | | | | | | | | | | | | |
| Company (identified cost basis) | | $ | | 9,310,085 | | $ | | 98,671,430 | | $288,392,438 |
| Investments in Partnership Preference Units (identified cost basis) | | | | 2,577,501 | | | | (7,973,845) | | | | 6,834,831 |
| Investments in other real estate (net of minority interests in unrealized appreciation (depreciation) | | | | | | | | | | | | |
| of controlled subsidiaries of $13,235,837, $(2,711,241) and $(5,418,472), respectively) | | | | 20,752,346 | | | | (27,642,011) | | | | 3,632,735 |
| Interest rate swap agreements | | | | 5,578,153 | | | | (867,728) | | | | 12,976,709 |
|
| Net change in unrealized appreciation (depreciation) | | $ | | 38,218,085 | | $ | | 62,187,846 | | $311,836,713 |
|
| Net realized and unrealized gain | | $107,490,448 | | $ | | 99,283,426 | | $314,285,843 |
|
| Net increase in net assets from operations | | $123,769,267 | | $ 116,803,482 | | $329,565,485 |
|
| |
(1)Amounts include net interest expense incurred in connection with interest rate swap agreements of $1,383,303, $4,297,449 and $4,477,357,
respectively (Note 2). |
|
S e e n o t e s t o c o n s o l i d a t e d f i n a n c i a l s t a t e m e n t s
|
41
Belrose Capital Fund LLC
CONSOLIDATED FINANCIAL STATEMENTSCONT’D
Consolidated Statements of Changes in Net Assets
|
| | | | | | | | | Year Ended | | | | |
| |
|
| Increase (Decrease) in Net Assets | | December 31, 2005 | | December 31, 2004 | | December 31, 2003 |
|
| From operations — | | | | | | | | | | | | |
| Net investment income | | $ | | 16,278,819 | | $ | | 17,520,056 | | $ | | 15,279,642 |
| Net realized gain from investment transactions, securities sold short, foreign | | | | | | | | | | | | |
| currency transactions and interest rate swap agreements | | | | 69,272,363 | | | | 37,095,580 | | | | 2,449,130 |
| Net change in unrealized appreciation (depreciation) of investments, | | | | | | | | | | | | |
| securities sold short, foreign currency and interest rate swap agreements | | | | 38,218,085 | | | | 62,187,846 | | | | 311,836,713 |
|
| Net increase in net assets from operations | | $ | | 123,769,267 | | $ | | 116,803,482 | | $ | | 329,565,485 |
|
| Transactions in Fund Shares — | | | | | | | | | | | | |
| Investment securities contributed | | $ | | — | | $ | | — | | $ | | 95,047,136 |
| Less — Selling commissions | | | | — | | | | — | | | | (325,083) |
|
| Net contributions | | $ | | — | | $ | | — | | $ | | 94,722,053 |
| Net asset value of Fund Shares issued to Shareholders in payment of | | | | | | | | | | | | |
| distributions declared | | | | 9,236,397 | | | | 5,415,563 | | | | 348,050 |
| Net asset value of Fund Shares redeemed | | | | (52,805,361) | | | | (47,331,125) | | | | (33,374,471) |
|
| Net increase (decrease) in net assets from Fund Share transactions | | $ | | (43,568,964) | | $ | | (41,915,562) | | $ | | 61,695,632 |
|
| Distributions — | | | | | | | | | | | | |
| Distributions to Shareholders | | $ | | (21,417,328) | | $ | | (13,115,253) | | $ | | (808,014) |
|
| Total distributions | | $ | | (21,417,328) | | $ | | (13,115,253) | | $ | | (808,014) |
|
| |
| |
| Net increase in net assets | | $ | | 58,782,975 | | $ | | 61,772,667 | | $ | | 390,453,103 |
|
| |
| |
| Net Assets | | | | | | | | | | | | |
|
| At beginning of year | | $1,694,227,425 | | $1,632,454,758 | | $1,242,001,655 |
|
| At end of year | | $ 1,753,010,400 | | $ 1,694,227,425 | | $ 1,632,454,758 |
|
S e e n o t e s t o c o n s o l i d a t e d f i n a n c i a l s t a t e m e n t s
|
42
Belrose Capital Fund LLC
CONSOLIDATED FINANCIAL STATEMENTSCONT’D
Consolidated Statements of Cash Flows
|
| | | | | | | | | Year Ended | | | | |
| |
|
| Increase (Decrease) in Cash | | December 31, 2005 | | December 31, 2004 | | December 31, 2003 |
|
| Cash Flows From (For) Operating Activities — | | | | | | | | | | | | |
| Net increase in net assets from operations | | $ | | 123,769,267 | | $ | | 116,803,482 | | $ | | 329,565,485 |
| Adjustments to reconcile net increase in net assets from operations to net cash flows | | | | | | | | | | | | |
| for operating activities — | | | | | | | | | | | | |
| Net investment income allocated from Belvedere Company | | | | (18,957,867) | | | | (17,098,621) | | | | (12,933,752) |
| (Increase) decrease in escrow deposits | | | | (27,604,169) | | | | 196,902 | | | | 802,927 |
| (Increase) decrease in distributions and interest receivable | | | | (285,107) | | | | 400,617 | | | | 39,093 |
| Increase in interest receivable for open swap agreements | | | | (68,131) | | | | — | | | | — |
| (Increase) decrease in other assets | | | | 2,869,069 | | | | (4,481,027) | | | | (176,904) |
| Decrease in interest payable for open swap agreements | | | | (46,549) | | | | (32,731) | | | | (50,603) |
| Increase in payable to affiliate for investment advisory and administrative fees | | | | 365,900 | | | | — | | | | — |
| Increase in payable to affiliate for distribution and servicing fees | | | | 572,971 | | | | — | | | | — |
| Increase (decrease) in security deposits, accrued interest and accrued other expenses and liabilities | | | | (1,007,848) | | | | 5,182,819 | | | | (858,833) |
| Increase (decrease) in accrued property taxes | | | | 1,267,749 | | | | 367,112 | | | | (615,937) |
| Purchases of Partnership Preference Units | | | | (138,329,380) | | | | (86,271,304) | | | | (8,033,600) |
| Proceeds from sales of Partnership Preference Units | | | | 15,217,520 | | | | 80,429,389 | | | | — |
| Proceeds from sale of common stock | | | | — | | | | — | | | | 10,140,535 |
| Payments for investments in other real estate | | | | (55,009,682) | | | | (162,599,200) | | | | — |
| Proceeds from sale of investment in other real estate | | | | 102,280,347 | | | | 32,404,340 | | | | — |
| Decrease in cash due to sale of majority interest in controlled subsidiary | | | | (2,824,892) | | | | (2,216,606) | | | | — |
| Improvements to rental property | | | | (5,368,536) | | | | (5,938,197) | | | | (4,679,844) |
| (Increase) decrease in short-term investments | | | | (4,076,347) | | | | 6,893,214 | | | | (7,614,214) |
| Net decrease in investment in Belvedere Company | | | | — | | | | — | | | | 1,651,419 |
| Interest incurred on interest rate swap agreements, net of payments received | | | | (1,383,303) | | | | (4,297,449) | | | | (4,477,357) |
| Proceeds from (payments for) termination of interest rate swap agreements | | | | — | | | | 60,454 | | | | (12,175,577) |
| Minority interests in net income of controlled subsidiaries | | | | 3,126,995 | | | | 1,872,405 | | | | 1,943,578 |
| Net realized gain from investment transactions, securities sold short, foreign currency transactions and | | | | | | | | | | | | |
| interest rate swap agreements | | | | (69,272,363) | | | | (37,095,580) | | | | (2,449,130) |
| Net change in unrealized (appreciation) depreciation of investments, securities sold short, foreign currency and | | | | | | | | | | | | |
| interest rate swap agreements | | | | (38,218,085) | | | | (62,187,846) | | (311,836,713) |
|
| Net cash flows for operating activities | | $(112,982,441) | | $(137,607,827) | | $ | | (21,759,427) |
|
| Cash Flows From (For) Financing Activities — | | | | | | | | | | | | |
| Proceeds from Credit Facility | | $ 173,500,000 | | $ 228,000,000 | | $ | | 28,000,000 |
| Repayments of Credit Facility | | | | (16,000,000) | | | | (175,300,000) | | | | — |
| Proceeds from mortgage | | | | — | | | | 123,000,000 | | | | — |
| Payments on behalf of investors (selling commissions) | | | | — | | | | — | | | | (325,083) |
| Notes payable to minority shareholder | | | | 21,538,024 | | | | — | | | | — |
| Repayment of note payable to minority shareholder | | | | (750,000) | | | | — | | | | — |
| Issuance of real estate joint venture preferred shares | | | | 240,000 | | | | — | | | | — |
| Payments for Fund Shares redeemed | | | | (5,766,830) | | | | (6,693,147) | | | | (6,204,599) |
| Distributions paid to minority shareholders | | | | (1,674,805) | | | | (286,455) | | | | — |
| Distributions paid to Shareholders | | | | (12,180,931) | | | | (7,699,690) | | | | (459,964) |
| Return of capital distributed to minority shareholders | | | | — | | | | (24,600,000) | | | | — |
| Capital contributed to controlled subsidiaries | | | | — | | | | — | | | | 70,837 |
|
| Net cash flows from financing activities | | $ 158,905,458 | | $ 136,420,708 | | $ | | 21,081,191 |
|
| Net increase (decrease) in cash | | $ | | 45,923,017 | | $ | | (1,187,119) | | $ | | (678,236) |
|
| Cash at beginning of year | | $ | | 5,348,786 | | $ | | 6,535,905 | | $ | | 7,214,141 |
|
| Cash at end of year | | $ | | 51,271,803 | | $ | | 5,348,786 | | $ | | 6,535,905 |
|
| |
| Supplemental Disclosure and Non-cash Investing and Financing Activities | | | | | | | | |
|
| Securities contributed by Shareholders, invested in Belvedere Company | | $ | | — | | $ | | — | | $ | | 95,047,136 |
| Interest paid on loan — Credit Facility | | $ | | 10,253,831 | | $ | | 4,329,878 | | $ | | 2,852,392 |
| Interest paid on mortgages | | $ | | 22,587,877 | | $ | | 25,521,341 | | $ | | 25,904,530 |
| Interest paid on swap agreements, net of interest received | | $ | | 1,497,983 | | $ | | 4,330,180 | | $ | | 4,527,960 |
| Market value of securities distributed in payment of redemptions | | $ | | 50,997,295 | | $ | | 36,679,214 | | $ | | 27,169,872 |
| Market value of common stock received from Belvedere Company | | $ | | — | | $ | | — | | $ | | 10,155,477 |
| Market value of real property and other assets, net of current liabilities, assumed in conjunction with | | | | | | | | | | | | |
| the acquisition of other real estate | | $ | | — | | $ 203,196,919 | | $ | | — |
| Market value of minority interests assumed in conjunction with the acquisition of other real estate | | $ | | — | | $ | | 40,639,384 | | $ | | — |
| Market value of real property and other assets, net of current liabilities, disposed of in conjunction with | | | | | | | | | | | | |
| the sale of other real estate | | $ 187,024,309 | | $ 143,874,457 | | $ | | — |
| Mortgage disposed of in conjunction with the sale of other real estate | | $ | | 121,000,000 | | $ | | 107,369,483 | | $ | | — |
| Market value of minority interests disposed of in conjunction with the sale of other real estate | | $ | | 14,906,651 | | $ | | 7,073,281 | | $ | | — |
| Non-cash change in working capital of real estate investments | | $ | | 816,614 | | $ | | — | | $ | | — |
|
S e e n o t e s t o c o n s o l i d a t e d f i n a n c i a l s t a t e m e n t s
|
43
Belrose Capital Fund LLC
CONSOLIDATED FINANCIAL STATEMENTSCONT’D
Financial Highlights
|
| | | | | | | | | Year Ended | | | | |
| |
|
| | | December 31, 2005 | | December 31, 2004 | | December 31, 2003 |
|
| Net asset value — Beginning of year | | $ | | 102.030 | | $ | | 95.840 | | $ | | 76.860 |
|
| Income (loss) from operations | | | | | | | | | | | | |
|
| Net investment income(1) | | $ | | 0.989 | | $ | | 1.036 | | $ | | 0.897 |
| Net realized and unrealized gain | | | | 6.571 | | | | 5.924 | | | | 18.133 |
|
| Total income from operations | | $ | | 7.560 | | $ | | 6.960 | | $ | | 19.030 |
|
| |
| Distributions | | | | | | | | | | | | |
|
| Distributions to Shareholders | | $ | | (1.290) | | $ | | (0.770) | | $ | | (0.050) |
|
| Total distributions | | $ | | (1.290) | | $ | | (0.770) | | $ | | (0.050) |
|
| Net asset value — End of year | | $ | | 108.300 | | $ | | 102.030 | | $ | | 95.840 |
|
| Total Return(2) | | | | 7.54% | | | | 7.32% | | | | 24.77% |
|
| Ratios as a percentage of average net assets(3): | | | | | | | | | | | | |
|
| Expenses of Consolidated Real Property Subsidiaries | | | | | | | | | | | | |
| Interest and other borrowing costs(4) | | | | 1.00% | | | | 1.29% | | | | 1.51% |
| Operating expenses(4) | | | | 1.11% | | | | 1.57% | | | | 1.65% |
| Belrose Capital Fund LLC Expenses | | | | | | | | | | | | |
| Interest and other borrowing costs(5)(6) | | | | 0.62% | | | | 0.27% | | | | 0.20% |
| Investment advisory and administrative fees, distribution and servicing fees and other | | | | | | | | | | | | |
| Fund operating expenses(5)(7) | | | | 1.13% | | | | 1.11% | | | | 1.12% |
| |
|
| Total expenses | | | | 3.86% | | | | 4.24% | | | | 4.48% |
| Net investment income | | | | 0.97% | | | | 1.07% | | | | 1.08% |
|
| Ratios as a percentage of average gross assets(3)(8): | | | | | | | | | | | | |
|
| Expenses of Consolidated Real Property Subsidiaries | | | | | | | | | | | | |
| Interest and other borrowing costs(4) | | | | 0.75% | | | | 0.98% | | | | 1.14% |
| Operating expenses(4) | | | | 0.84% | | | | 1.18% | | | | 1.25% |
| Belrose Capital Fund LLC Expenses | | | | | | | | | | | | |
| Interest and other borrowing costs(5)(6) | | | | 0.46% | | | | 0.20% | | | | 0.15% |
| Investment advisory and administrative fees, distribution and servicing fees and other | | | | | | | | | | | | |
| Fund operating expenses(5)(7) | | | | 0.85% | | | | 0.84% | | | | 0.84% |
| |
|
| Total expenses | | | | 2.90% | | | | 3.20% | | | | 3.38% |
| Net investment income | | | | 0.73% | | | | 0.80% | | | | 0.81% |
|
| Supplemental Data | | | | | | | | | | | | |
|
| Net assets, end of year (000’s omitted) | | $1,753,010 | | $1,694,227 | | $1,632,455 |
| Portfolio turnover of Tax-Managed Growth Portfolio (the Portfolio) | | | | 0%(9) | | | | 3% | | | | 15% |
|
| (1) | Calculated using average shares outstanding. |
| |
| (2) | Returns are calculated by determining the percentage change in net asset value with all distributions reinvested. |
| |
| (3) | For the purpose of calculating ratios, the income and expenses of Belrose Realty Corporation’s (Belrose Realty) controlled subsidiaries are reduced by the proportionate interest therein of investors other than Belrose Realty. |
| |
| (4) | Includes Belrose Realty’s proportional share of expenses incurred by its controlled subsidiaries. |
| |
| (5) | Includes the expenses of Belrose Capital Fund LLC (Belrose Capital) and Belrose Realty. Does not include expenses of Belrose Realty’s controlled subsidiaries. |
| |
| (6) | Ratios do not include interest incurred in connection with interest rate swap agreements. Had such amounts been included, ratios would be higher. |
| |
| (7) | Includes Belrose Capital’s share of Belvedere Capital Fund Company LLC’s (Belvedere Company) allocated expenses, including those expenses allocated from the Portfolio. |
| |
| (8) | Average gross assets is defined as the average daily amount of all assets of Belrose Capital (including Belrose Capital’s interest in Belvedere Company and Belrose Capital’s ratable share of the assets of its directly and indirectly controlled subsidiaries), without reduction by any liabilities. For this purpose, the assets of Belrose Realty’s controlled subsidiaries are reduced by the proportionate interest therein of investors other than Belrose Realty. |
| |
| (9) | Amounts to less than 1%. |
| |
S e e n o t e s t o c o n s o l i d a t e d f i n a n c i a l s t a t e m e n t s
|
44
Belrose Capital Fund LLC
N O T E S T O C O N S O L I D AT E D F I N A N C I A L S T AT E M E N T S
|
AInvestment Objective —Belrose Capital Fund LLC (Belrose Capital) is a Delaware limited liability company established to offer diversification and tax-sensitive investment management to investors holding large and concentrated positions in equity securities of selected publicly-traded companies. The investment objective of Belrose Capital is to achieve long-term, after-tax returns for Belrose Capital shareholders (Shareholders). Belrose Capital pursues this objective primarily by investing indirectly in Tax-Managed Growth Portfolio (the Portfolio), a diversified, open-end management investment company registered under the Investment Company Act of 1940, as amended. The Portfolio is organized as a trust under the laws of the state of New York. Belrose Capital maintains its investment in the Portfolio by investing in Belvedere Capital Fund Company LLC (Belvedere Company), a separate Massachusetts limited liability company that invests exclusively in the Portfolio. The performance of Belrose Capital and Belvedere Company is directly and substantially affected by the performance of the Portfolio. The audited financial statements of the Portfolio, including the Portfolio of Investments, are included elsewhere in this report and should be read in conjunction with these financial statements.
Separate from its investment in the Portfolio through Belvedere Company, Belrose Capital invests in real estate assets through a controlled subsidiary, Belrose Realty Corporation (Belrose Realty). Such investments include income-producing preferred equity interests in real estate operating partnerships (Partnership Preference Units) affiliated with publicly-traded real estate investment trusts (REITs) and interests in real properties held through real estate joint ventures that are controlled subsidiaries of Belrose Realty.
BSubsidiaries —Belrose Realty invests directly and indirectly in Partnership Preference Units and indirectly in real property through controlled subsidiaries, Katahdin Property Trust LLC (Katahdin), Deerfield Property Trust (Deerfield), Bel Communities Property Trust (Bel Communities) and Bel Apartment Properties Trust (Bel Apartment) (for the period during which Belrose Realty maintained an interest in Bel Apartment and Bel Communities). Belrose Realty’s investments in Partnership Preference Units are held directly except for its indirect investment in Partnership Preference Units of Vornado Realty, L.P. (a Delaware limited partnership), which is held through its 10% investment in Belvorn Holdings LLC at December 31, 2005. Vornado Realty, L.P. is the sole investment of Belvorn Holdings LLC.
Belrose Realty — Belrose Capital owns 100% of the common stock issued by Belrose Realty and intends to hold all of Belrose Realty’s common stock at all times. Additionally, 2,100 shares of preferred stock of Belrose Realty are outstanding at December 31, 2005 and 2004. The preferred stock has a par value of $0.01 per share and is redeemable by Belrose Realty at a redemption price of $100 per share. Dividends on the preferred stock are cumulative and payable annually equal to $8 per share. The interest in preferred stock is recorded as minority interest on the Consolidated Statements of Assets and Liabilities.
Katahdin — Katahdin, a controlled subsidiary of Belrose Realty since May 2002, owns six multifamily residential properties consisting of 2,384 units (collectively, the Katahdin Properties) located in five states (Colorado, Florida, North Carolina, Texas and Washington). The average occupancy rate is approximately 96% at December 31, 2005. Belrose Realty owns 100% of the Class A units of Katahdin and a minority shareholder (the Katahdin Minority Shareholder) owns 100% of the Class B units. The units of Katahdin entitled to board of managers’ representation are currently owned 75% by Belrose Realty and 25% by the Katahdin Minority Shareholder. The Class B equity interest is recorded as minority interest on the Consolidated Statements of Assets and Liabilities. The primary distinctions between the two classes of units are the distribution priority and voting rights. Class A units have priority in distributions and greater voting rights than Class B units. Pursuant to a buy/sell agreement entered into at the time Katahdin was established, either Belrose Realty or the Katahdin Minority Shareholder can give notice after November 23, 2010 either to buy the other’s equity interest in Katahdin or to sell its own equity interest in Katahdin.
Deerfield — Deerfield, a controlled subsidiary of Belrose Realty since June 2004, owns seventeen industrial distribution properties (collectively, the Deerfield Properties) located in six states (Florida, Georgia, New Jersey, Ohio, Pennsylvania and South Carolina). The average occupancy rate is approximately 90% at December 31, 2005. Belrose Realty owns 100% of the Class A shares of Deerfield, representing 80% of the voting interests in Deerfield and a minority shareholder (the Deerfield Minority Shareholder) owns 100% of the Class B shares, representing 20% of the voting interests in Deerfield. The Class B equity interest is recorded as minority interest on the Consolidated Statements of Assets and Liabilities. The primary distinctions between the two classes of shares are the distribution priority and voting rights. Class A shares have priority in distributions and greater voting rights than Class B shares. From and after August 4, 2013, either Belrose Realty or the Deerfield Minority Shareholder may cause a liquidation of Deerfield and, if Belrose Realty makes that election, the Deerfield
45
Belrose Capital Fund LLC
N O T E S T O C O N S O L I D AT E D F I N A N C I A L S T AT E M E N T SC O N T ’ D
|
Minority Shareholder has the right either to purchase the shares of Deerfield owned by Belrose Realty or to acquire the assets of Deerfield, in either case at a price determined through an appraisal of the assets of Deerfield.
Bel Communities — Bel Communities, formerly a controlled subsidiary of Belrose Realty, was acquired in October 2002. Belrose Realty subsequently sold its interest in Bel Communities in October 2005. Bel Communities owns twelve multifamily residential properties consisting of 2,624 units (collectively, the Bel Communities Properties) located in eleven states. Belrose Realty owned Class A shares of Bel Communities, representing 75% of the voting interests in Bel Communities, and a minority shareholder (the Bel Communities Minority Shareholder) owned Class B shares, representing 25% of the voting interests in Bel Communities. Belrose Realty did not own an interest in Bel Communities at December 31, 2005.
Bel Apartment — Bel Apartment, formerly a controlled subsidiary of Belrose Realty, was acquired in March 2002. Belrose Realty subsequently sold its interest in Bel Apartment in November 2004. Bel Apartment owns ten multifamily residential properties consisting of 2,530 units (collectively, the Bel Apartment Properties) located in seven states. Belrose Realty owned Class A shares of Bel Apartment, representing 75% of the voting interests in Bel Apartment, and a minority shareholder (the Bel Apartment Minority Shareholder) owned Class B shares, representing 25% of the voting interests in Bel Apartment. Belrose Realty did not own an interest in Bel Apartment at December 31, 2004 or anytime thereafter.
2Significant Accounting Policies
The following is a summary of significant accounting policies consistently followed in the preparation of the consolidated financial statements. The policies are in conformity with accounting principles generally accepted in the United States of America (GAAP).
APrinciples of Consolidation —The consolidated financial statements include the accounts of Belrose Capital and its controlled subsidiaries for the periods during which Belrose Capital was invested in such controlled subsidiaries. Belrose Capital and Belrose Realty consolidate all investments in affiliates that are controlled by ownership of a majority voting interest.
The accompanying consolidated financial statements include the accounts of Belrose Capital, Belrose Realty, Katahdin, Deerfield, Bel Communities and Bel Apartment (for the period during which Belrose Realty maintained an interest in Bel Communities and Bel Apartment) (collectively, the Fund).
All material intercompany accounts and transactions have been eliminated.
BBasis of Presentation —Belrose Capital is an investment company and, as such, presents its assets at fair value. Fixed liabilities are generally stated at their principal value.
CCash —The Fund considers cash in banks that can be liquidated without prior notice or penalty to be cash. Approximately $500,000 and $1,600,000 of cash is restricted for use and is held by Deerfield. Such amounts are classified as other assets for the years ended December 31, 2005 and 2004, respectively.
DInvestment Costs —The Fund’s investment assets were principally acquired through contributions of common stock by Shareholders in exchange for Shares of the Fund, through purchases of Partnership Preference Units and other real estate investments, and through contributions of real estate investments by the respective Minority Shareholder in exchange for cash and a minority interest in controlled subsidiaries. Upon receipt of common stock from Shareholders, Belrose Capital immediately exchanged the contributed securities into Belvedere Company for shares thereof, and Belvedere Company, in turn, immediately thereafter exchanged the contributed securities into the Portfolio for an interest in the Portfolio. The initial financial reporting cost basis of the Fund’s investments in contributed securities is the value of the contributed securities as of the close of business on the day prior to their contribution to the Fund. The initial tax basis of the Fund’s investment in the Portfolio through Belvedere Company is the same as the contributing Shareholders’ basis in securities contributed to the Fund. The initial tax and financial reporting cost basis of the Fund’s investments in Partnership Preference Units and other real estate investments purchased by the Fund is the purchase cost. The initial financial reporting cost basis of the Fund’s investments in real estate contributed to the Fund is the estimated fair value on contribution date. The initial tax basis of real estate investments contributed to the Fund is the contributor’s tax basis at the time of contribution or the fair value on the date of contribution, depending on the taxability of the contribution.
EInvestment and Other Valuations —The Fund’s investments may consist of shares of Belvedere Company, Partnership Preference Units, investments in management contracts, real property investments and short-term debt securities. Belvedere Company’s only investment is an interest in the Portfolio, the value of which is derived from a proportional interest therein. Valuation of securities by the Portfolio is discussed in Note 1A of the Portfolio’s Notes to
46
Belrose Capital Fund LLC
N O T E S T O C O N S O L I D AT E D F I N A N C I A L S T AT E M E N T SC O N T ’ D
|
Financial Statements, which are included elsewhere in this report. Additionally, Belrose Capital has entered into interest rate swap agreements (Note 7). The valuation policies followed by the Fund are as follows:
Market prices for the Fund’s real estate investments (including Partnership Preference Units, investments in management contracts and joint ventures) are not readily available and therefore such investments are stated in the Fund’s consolidated financial statements at estimated fair value. The estimated fair value of an investment represents the amount at which Boston Management and Research (Boston Management), as manager of Belrose Realty, believes the investment could be sold in a current transaction between willing parties in an orderly disposition, that is, other than in a forced or liquidation sale. In valuing these investments, Boston Management considers relevant factors, data and information. With respect to investments in Partnership Preference Units, Boston Management considers information from dealers and similar firms with knowledge of such issues and/or the prices of comparable preferred equity securities and other fixed or adjustable rate instruments having similar investment characteristics. With respect to investments in management contracts, Boston Management determines the estimated fair value based upon discounting expected cash flows over the terms of the contracts. Real estate investments, other than Partnership Preference Units, are primarily valued based upon independent valuations (i.e. appraisals) that represent the amount at which Boston Management believes the investments could be sold in a current transaction between willing parties and assume an orderly disposition, that is, other than in a forced or liquidation sale. Detailed real property valuations are performed at least annually and reviewed periodically. When a property has not been appraised (such as when a property has been recently acquired), Boston Management determines the estimated fair value of the property based on the transaction value of the property, which equals the total acquisition cost of the property, exclusive of certain legal and transaction costs, provided such amount is deemed indicative of fair value. Once an appraisal of a property has been conducted, Boston Management bases the estimated fair value of the property principally on the estimated value as determined by the appraiser. Appraisals of newly acquired properties are generally conducted in the year following the acquisition. Interim valuations of properties may be adjusted to reflect significant changes in economic circumstances or recent evaluations of similar properties, and the results of operations and distributions.
The fair value of Belrose Realty’s equity interest in each real estate joint venture is estimated using a financial model that considers (i) the terms of the joint venture agreements relating to the allocation of distributable cash flow, (ii) theexpected duration of the joint venture, and (iii) the projected property values and cash flows from the properties based on estimates used in the independent valuations. If detailed independent real property valuations have not been performed on every property within a joint venture (such as when a joint venture recently acquired the properties) Boston Management allocates equity interest in the real estate joint venture based on the contractual ownership interest of Belrose Realty and the respective Minority Shareholder. Interim valuations reflect results of operations and distributions, and may be adjusted if there has been a significant change in economic circumstances or recent evaluations of similar properties.
The valuation of real estate investments includes many assumptions, including, but not limited to, a current transaction between willing parties and an orderly disposition of assets. If the assumptions used to value a real estate investment change, it may materially impact the estimated fair value of that investment.
If a rental property securing a mortgage note payable has an estimated fair value that is less than the outstanding principal balance, the mortgage note payable may be adjusted to the estimated fair value of the property securing the mortgage note. No such adjustment has been made to mortgage notes payable at December 31, 2005 and 2004.
Interest rate swap agreements are valued by Boston Management, as investment adviser of Belrose Capital, based upon dealer and counterparty quotes and pricing models which take into consideration the market trading prices of interest rate swap agreements that have similar terms to the interest rate swap agreements Belrose Capital has entered.
Changes in the fair value of the Fund’s investments are recorded as unrealized appreciation or depreciation in the Consolidated Statements of Operations.
FInterest Rate Swaps —Belrose Capital has entered into interest rate swap agreements with respect to its borrowings and real estate investments. Pursuant to these agreements, Belrose Capital makes periodic payments to the counterparty at predetermined fixed rates in exchange for floating-rate payments from the counterparty at a predetermined spread to one-month or three-month LIBOR. Net interest paid and accrued or received and earned is recorded as realized gains or losses and changes in the underlying values of the swaps are recorded as unrealized appreciation (depreciation), each in the Consolidated Statements of Operations. Belrose Capital is exposed to credit loss in the event of non-performance by the swap
47
Belrose Capital Fund LLC
N O T E S T O C O N S O L I D AT E D F I N A N C I A L S T AT E M E N T SC O N T ’ D
counterparty. Risks may arise from the unanticipated movements in interest rates.
GRental Operations —The apartment units held by Katahdin, Bel Communities and Bel Apartment (for the period during which Belrose Realty maintained an interest in Bel Communities and Bel Apartment) are leased to residents generally for a term averaging approximately one year, renewable upon consent of both parties on a year-to-year or month-to-month basis. The properties held by Deerfield are leased under fixed long-term operating leases.
At December 31, 2005, the minimum lease payments from leases with lease periods greater than one year are as follows:
| Year Ending December 31, | | Amount |
|
| 2006 | | $ | | 9,188,833 |
| 2007 | | | | 7,474,651 |
| 2008 | | | | 6,463,228 |
| 2009 | | | | 4,802,675 |
| 2010 | | | | 2,425,584 |
| Thereafter | | | | 9,691,953 |
|
| | | $40,046,924 |
|
The mortgage escrow accounts consist of deposits for real estate taxes and insurance as required under the mortgage agreements. The mortgage escrow accounts also include amounts deposited by Katahdin as collateral for its mortgage loan (Note 8) until the lender accepts the multifamily residential property purchased on December 15, 2005 as replacement collateral for the property sold on December 28, 2005 (Note 5). The mortgage escrow accounts are held and controlled by the mortgage lenders (Note 8). Upon lender approval the amounts will be released from escrow. The lender released such amounts from escrow in March 2006.
Certain of the costs incurred in connection with acquisitions of properties have been capitalized. Significant betterments and improvements are capitalized as part of real property.
HIncome —Dividend income and distributions from Partnership Preference Units are recorded on the ex-dividend date and interest income is recorded on the accrual basis. Rental income is recorded on the accrual basis based upon the terms of the lease agreements.
Belvedere Company’s net investment income or loss consists of Belvedere Company’s pro rata share of the net investment income or loss of the Portfolio, less all actual or accruedexpenses of Belvedere Company, determined in accordance with GAAP. The Fund’s net investment income or loss consists of the Fund’s pro rata share of the net investment income or loss of Belvedere Company, plus all income earned on the Fund’s direct and indirect investments (including Partnership Preference Units and real property), less all actual and accrued expenses of the Fund determined in accordance with GAAP.
IDeferred Costs —Mortgage origination expenses incurred in connection with the financing of real estate joint ventures are capitalized and amortized over the terms of the respective loans. Deferred loan costs are included in other assets and amortization expense is included in mortgage interest expense in the accompanying consolidated financial statements.
JIncome Taxes —Belrose Capital, Belvedere Company and the Portfolio are treated as partnerships for federal income tax purposes. As a result, Belrose Capital, Belvedere Company and the Portfolio do not incur federal income tax liability, and the shareholders and partners thereof are individually responsible for taxes on items of partnership income, gain, loss and deduction. The policy of Belrose Realty and its controlled subsidiaries is to comply with the Internal Revenue Code of 1986, as amended, applicable to REITs. Belrose Realty, Katahdin, Deerfield, Bel Communities and Bel Apartment (for the period during which Belrose Realty maintained an interest in Bel Communities and Bel Apartment) will generally not be subject to federal income tax to the extent that they distribute their earnings to their stockholders each year and maintain their qualification as a REIT.
Net investment income and capital gains determined in accordance with income tax regulations may differ from such amounts determined in accordance with GAAP. Such differences could be significant and are primarily due to differences in the cost basis of securities and other contributed investments, depreciation of real estate assets, periodic payments made in connection with interest rate swap agreements and the character of distributions received from REITs and Partnership Preference Units.
KOther —Investment transactions are accounted for on a trade date basis.
LUse of Estimates —The preparation of financial statements in conformity with GAAP requires management to make estimates and assumptions that affect the reported amounts of assets and liabilities at the date of the financial statements and the reported amounts of income and expense during the reporting period. Actual results could differ from those estimates.
48
Belrose Capital Fund LLC
N O T E S T O C O N S O L I D AT E D F I N A N C I A L S T AT E M E N T SC O N T ’ D
|
MIndemnifications —Under Belrose Capital’s Limited Liability Company Agreement, Belrose Capital’s officers, its manager, investment adviser, and any affiliate, associate, officer, employee or trustee thereof, and any manager, director, officer or employee of Belrose Realty or any other controlled subsidiary may be indemnified against certain liabilities and expenses arising out of their duties to the Fund. Shareholders also may be indemnified against personal liability for the liabilities of Belrose Capital. Additionally, in the normal course of business, the Fund enters into agreements with service providers, lenders and counterparties that may contain indemnification clauses. The Fund’s maximum exposure under these arrangements is unknown as this would involve future claims that may be made against the Fund that have not yet occurred.
3Distributions to Shareholders
Belrose Capital intends to distribute at the end of each year, or shortly thereafter, all of its net investment income for the year, if any, and approximately 18% of its net realized capital gains for such year (reduced during the year ended December 31, 2003 from 22% to reflect the reduction in federal long-term capital gains taxes), if any, other than precontribution gains allocated to a Shareholder in connection with a taxable tender offer or other taxable corporate event with respect to a security contributed by that Shareholder or such Shareholder’s predecessor in interest. In addition, whenever a distribution in respect of a precontribution gain is made, Belrose Capital intends to make a supplemental distribution to compensate Shareholders receiving such distributions for taxes that may be due on income specially allocated in connection with the precontribution gain and supplemental distributions. Capital gain distributions that are made with respect to realized precontribution gains and the associated supplemental distributions (collectively, Special Distributions) are made solely to the Shareholders to whom such realized precontribution gain is allocated. There were no Special Distributions paid or accrued during the years ended December 31, 2005, 2004 and 2003.
The Fund’s distributions generally are based on determinations of net investment income and net realized capital gains for federal income tax purposes. Such amounts may differ from net investment income or loss and net realized gain or loss as set forth in the Fund’s financial statements due to differences in the treatment of various income, gain, loss, expense and other items for federal income tax purposes and under GAAP.
In addition, Belrose Realty, Katahdin and Deerfield intend to distribute substantially all of their taxable income earned by the respective entities during the year.
Distributions made to Shareholders electing the Fund’s Estate Freeze feature (Note 4) will be paid, first, to holders of Preferred Shares to the extent of the unpaid cumulative annual priority return of the Preferred Shares and, second, to the holders of the associated Common Shares. Distributions made in respect of any realized precontribution gains and associated supplemental distributions will be apportioned between Preferred Shares and Common Shares consistent with the allocation to the Preferred Shares and Common Shares of such realized precontribution gains. It is expected that substantially all Belrose Capital distributions in respect of Estate Freeze Shares will be paid to holders of Preferred Shares rather than holders of Common Shares. Distributions on Estate Freeze Shares may be reinvested in Belrose Capital to purchase undivided Fund Shares at the Fund’s net asset value per share on the date of reinvestment.
4Shareholder Transactions
|
Belrose Capital may issue an unlimited number of full and fractional Fund Shares. Transactions in Fund Shares, including contributions of securities in exchange for Shares of Belrose Capital, were as follows:
| | | | | Year Ended | | |
| |
|
| | | December 31, | | December 31, | | December 31, |
| | | 2005 | | 2004 | | 2003 |
|
| Issued at Belrose Capital closings | | — | | — | | 1,283,497 |
| Issued to Shareholders electing to | | | | | | |
| receive payment of distributions | | | | | | |
| in Fund Shares | | 94,548 | | 56,826 | | 4,413 |
| Redemptions | | (512,297) | | (485,060) | | (415,385) |
|
| Net increase (decrease) | | (417,749) | | (428,234) | | 872,525 |
|
Redemptions of Fund Shares held less than three years are generally subject to a redemption fee of 1% of the net asset value of Fund Shares redeemed. The redemption fee is paid to Eaton Vance Distributors, Inc. (EV Distributors) by Belrose Capital on behalf of the redeeming Shareholder. No charge is levied on redemptions of Fund Shares acquired through the reinvestment of distributions, Fund Shares redeemed in connection with a taxable tender offer or other taxable corporate event or Fund Shares redeemed following the death of all of the initial holders of the Fund Shares redeemed. In addition, no fee applies to redemptions made pursuant to a Systematic Redemption Plan, whereby a Shareholder can redeem up to 2% of Fund Shares held on a quarterly basis. For the years ended December 31, 2005, 2004 and 2003, EV Distributors received $128,646, $285,453, and $139,527 in redemption fees, respectively.
In connection with the offering of Fund Shares, for the year ended December 31, 2003, EV Distributors, the Placement Agent, received $325,083 in selling commissions paid by Belrose Capital on behalf of Shareholders. EV
49
Belrose Capital Fund LLC
N O T E S T O C O N S O L I D AT E D F I N A N C I A L S T AT E M E N T SC O N T ’ D
|
Distributors, in turn paid this amount to the applicable subagent on behalf of Shareholders investing in Belrose Capital through such subagent. In addition, for the year ended December 31, 2003, EV Distributors made payments to subagents from its own resources totaling $950,471 approximately equal to 1.0% of the value of investments in Belrose Capital made through subagents. There were no offerings of Fund Shares during the years ended December 31, 2005 and 2004.
Shareholders in Belrose Capital are entitled to restructure their Fund Share interests under what is termed an Estate Freeze Election. Under this election, Fund Shares are divided into Preferred Shares and Common Shares. Preferred Shares have a preferential right over the corresponding Common Shares equal to (i) 95% of the original capital contribution made in respect of the undivided Shares from which the Preferred Shares and Common Shares were derived, plus (ii) an annuity priority return equal to 7.75% of the Preferred Shares’ preferential interest in the original capital contribution of the undivided Fund Shares. The associated Common Shares are entitled to the remaining 5% of the original capital contribution in respect of the undivided Fund Shares, plus any returns thereon in excess of the fixed annual priority of the Preferred Shares. The existence of restructured Fund Shares does not adversely affect Shareholders who do not make an election nor do the restructured Fund Shares have preferential rights to Fund Shares that have not been restructured. Shareholders who subdivide Fund Shares under this election sacrifice certain rights and privileges that they would otherwise have with respect to the Fund Shares so divided, including redemption rights and voting and consent rights. Upon the twentieth anniversary of the issuance of the associated undivided Fund Shares to the original holders thereof, Preferred and Common Shares will automatically convert into full and fractional undivided Fund Shares.
The allocation of Belrose Capital’s net asset value per Share of $108.30 and $102.03 as of December 31, 2005 and 2004, respectively, between Preferred and Common Shares that have been restructured is as follows:
| | | | | Per Share Value At | | |
| |
|
| | | December 31, 2005 | | December 31, 2004 |
| |
|
| | | Preferred | | Common | | Preferred | | Common |
| Date of Contribution | | Shares | | Shares | | Shares | | Shares |
|
| February 19, 2003 | | $83.61 | | $24.69 | | $79.48 | | $22.55 |
|
5Investment Transactions
The following table summarizes the Fund’s investment transactions, other than short-term obligations, for the years ended December 31, 2005, 2004 and 2003:
| | | | | | | | | Year Ended | | | | |
| |
|
| | | December 31, | | December 31, | | December 31, |
| Investment Transactions | | 2005 | | 2004 | | 2003 |
|
| Increases in investment in | | | | | | | | | | | | |
| Belvedere Company | | $ | | — | | $ | | — | | $95,047,136 |
| Decreases in investment in | | | | | | | | | | | | |
| Belvedere Company(1) | | $ | | 50,997,295 | | $ | | 36,679,214 | | $38,976,768 |
| Sale of common stock(1) | | $ | | — | | $ | | — | | $10,140,535 |
| Acquisitions of other real | | | | | | | | | | | | |
| estate(2) | | $ | | 55,009,682 | | $162,599,200 | | $ | | — |
| Sales of other real estate(3) | | $102,280,347 | | $ | | 32,404,340 | | $ | | — |
| Purchases of Partnership | | | | | | | | | | | | |
| Preference Units(4) | | $138,329,380 | | $ | | 86,271,304 | | $ | | 8,033,600 |
| Sales of Partnership | | | | | | | | | | | | |
| Preference Units(5) | | $ | | 15,217,520 | | $ | | 80,429,389 | | $ | | — |
|
| (1) | Included in decreases in investment in Belvedere Company for the year ended December 31, 2003 is the receipt of common stock through a redemption in-kind of $10,155,477. |
| |
| | Belrose Capital subsequently sold the common stock during the year ended December 31, 2003 recognizing a loss of $14,942 on the transaction. |
| |
| (2) | On December 15, 2005, Katahdin purchased a multifamily residential property from a third party for $55,009,682. |
| |
| | In June and August 2004, Belrose Realty purchased indirect investments in real property through a controlled subsidiary, Deerfield, for $9,339,576 and $153,259,624, respectively (Note 1). |
| |
| (3) | On December 28, 2005, Katahdin sold a multifamily residential property to a third party for $42,276,160 and for which Belrose Realty recognized a gain of $8,733,050. |
| |
| | On October 14, 2005, Belrose Realty sold its majority interest in Bel Communities to the real estate investment affiliate of another investment fund advised by Boston Management, for $54,793,899 and for which a gain of $12,343,706 was recognized. |
| |
| | On April 6, 2005, Deerfield sold an industrial distribution property to a third party for $3,105,985 and for which Belrose Realty recognized a loss of $152,242. On September 30, 2005, Deerfield received compensation for its interest in the Contracts (as defined below) from an affiliate of the Deerfield Minority Shareholder for $2,104,303 and for which Belrose Realty recognized a gain of $834,031. In Novemeber 2004, Belrose Realty sold its majority interest in Bel Apartment to the real estate investment affiliate of another investment fund advised by Boston Management for which a loss of $1,548,753 was recognized. |
| |
| (4) | Purchases of Partnership Preference Units for the years ended December 31, 2005, 2004 and 2003 represent purchases of Partnership Preference Units from real estate investment affiliates of other investment funds advised by Boston Management. |
| |
| (5) | Sales of Partnership Preference Units for the years ended December 31, 2005 and 2004 include Partnership Preference Units sold to real estate investment affiliates of other investment funds advised by Boston Management for which gains of $323,360 and $1,946,870 were recognized, respectively. |
| |
50
Belrose Capital Fund LLC
N O T E S T O C O N S O L I D AT E D F I N A N C I A L S T AT E M E N T SC O N T ’ D
|
A portion of Belrose Realty’s investment in Deerfield represents an interest in certain property management contracts (the Contracts) pertaining to properties of which the Fund does not own a direct or indirect interest. Other interested parties to the Contracts include an affiliate of the Deerfield Minority Shareholder. The Contracts provide for Deerfield to receive cash flows from management fees and certain other fees over the life of the Contracts in amounts that exceed certain preferred payments to other interested parties. In September 2005, one of the Contracts was terminated (as described above). The estimated fair value of Deerfield’s interest in the Contract(s) is $232,052 and $1,542,829 as of December 31, 2005 and 2004, respectively, and is estimated based upon discounting expected cash flows over the terms of the Contract(s).
6Indirect Investment in the Portfolio
The following table summarizes the Fund’s investment in the Portfolio through Belvedere Company for the years ended December 31, 2005, 2004 and 2003, including allocations of income, expenses and net realized and unrealized gains (losses) for the years then ended:
| | | | | | | | | Year Ended | | | | |
| |
|
| | | December 31, | | December 31, | | December 31, |
| | | 2005 | | 2004 | | 2003 |
|
| Belvedere Company’s | | | | | | | | | | | | |
| interest in the | | | | | | | | | | | | |
| Portfolio(1) | | $13,400,922,141 | | $12,806,516,230 | | $11,100,012,615 |
| The Fund’s investment in | | | | | | | | | | | | |
| Belvedere Company(2) | | $ | | 1,783,649,094 | | $ | | 1,757,804,676 | | $ 1,640,828,100 |
| Income allocated to | | | | | | | | | | | | |
| Belvedere Company | | | | | | | | | | | | |
| from the Portfolio | | $ | | 216,731,361 | | $ | | 189,728,234 | | $ | | 143,671,130 |
| Income allocated to the | | | | | | | | | | | | |
| Fund from Belvedere | | | | | | | | | | | | |
| Company | | $ | | 29,369,898 | | $ | | 27,095,222 | | $ | | 21,625,926 |
| Expenses allocated to | | | | | | | | | | | | |
| Belvedere Company | | | | | | | | | | | | |
| from the Portfolio | | $ | | 57,207,392 | | $ | | 51,953,817 | | $ | | 43,085,940 |
| Expenses allocated to the | | | | | | | | | | | | |
| Fund from Belvedere | | | | | | | | | | | | |
| Company(3) | | $ | | 10,412,031 | | $ | | 9,996,601 | | $ | | 8,692,174 |
| | | | | | | | | Year Ended | | | | |
|
| | | December 31, | | December 31, | | December 31, |
| | | 2005 | | 2004 | | 2003 |
|
| Net realized gain from | | | | | | | | | | | | |
| investment transactions, | | | | | | | | | | | | |
| securities sold short | | | | | | | | | | | | |
| and foreign currency | | | | | | | | | | | | |
| transactions allocated | | | | | | | | | | | | |
| to Belvedere Company | | | | | | | | | | | | |
| from the Portfolio | | $ | | 341,680,818 | | $ | | 276,250,393 | | $ | | 128,352,887 |
| Net realized gain from | | | | | | | | | | | | |
| investment transactions, | | | | | | | | | | | | |
| securities sold short | | | | | | | | | | | | |
| and foreign currency | | | | | | | | | | | | |
| transactions allocated | | | | | | | | | | | | |
| to the Fund from | | | | | | | | | | | | |
| Belvedere Company | | $ | | 48,573,761 | | $ | | 37,885,739 | | $ | | 19,117,006 |
| Net change in unrealized | | | | | | | | | | | | |
| appreciation (depreciation) | | | | | | | | | | | | |
| of investments, securities | | | | | | | | | | | | |
| sold short and foreign | | | | | | | | | | | | |
| currency allocated to | | | | | | | | | | | | |
| Belvedere Company | | | | | | | | | | | | |
| from the Portfolio | | $ | | 100,866,308 | | $ | | 691,783,587 | | $ 1,892,271,872 |
| Net change in unrealized | | | | | | | | | | | | |
| appreciation (depreciation) | | | | | | | | | | |
| of investments, securities | | | | | | | | | | | | |
| sold short and foreign | | | | | | | | | | | | |
| currency allocated to | | | | | | | | | | | | |
| the Fund from | | | | | | | | | | | | |
| Belvedere Company | | $ | | 9,310,085 | | $ | | 98,671,430 | | $ | | 288,392,438 |
|
| (1) | As of December 31, 2005, 2004 and 2003, the value of Belvedere Company’s interest in the Portfolio represents 70.4%, 66.9% and 63.0% of the Portfolio’s net assets, respectively. |
| |
| (2) | As of December 31, 2005, 2004 and 2003, the Fund’s investment in Belvedere Company represents 13.3%, 13.7% and 14.8% of Belvedere Company’s net assets, respectively. |
| |
| (3) | Allocated expenses include: |
| |
| | | | | Year Ended | | |
| |
|
| | | December 31, | | December 31, | | December 31, |
| | | 2005 | | 2004 | | 2003 |
|
| Expenses allocated from the | | | | | | |
| Portfolio | | $7,751,156 | | $7,441,023 | | $6,481,012 |
| Service fees (see Note 9) | | $2,601,544 | | $2,494,434 | | $2,149,331 |
| Operating expenses | | $ 59,331 | | $ 61,144 | | $ 61,831 |
|
51
Belrose Capital Fund LLC
N O T E S T O C O N S O L I D AT E D F I N A N C I A L S T AT E M E N T SC O N T ’ D
7Interest Rate Swap Agreements
Belrose Capital has entered into interest rate swap agreements with Merrill Lynch Capital Services, Inc. in connection with its real estate investments and the associated borrowings. Under such agreements, Belrose Capital has agreed to make periodic payments at fixed rates in exchange for payments at floating rates. The notional or contractual amounts of these instruments may not necessarily represent the amounts potentially subject to risk. The measurement of the risks associated with these investments is meaningful only when considered in conjunction with all related assets, liabilities and agreements. Interest rate swap agreements in place at December 31, 2005 and 2004 are listed below.
Effective
Date | | Notional
Amount
(000’s
omitted) | | Fixed
Rate | | Floating
Rate | | Initial
Optional
Termi-
nation
Date | | Final
Termi-
nation
Date | | | | |
| | | | | | | Unrealized Appreciation |
| | | | | | | (Depreciation) at |
| | | | | | | December 31, | | December 31, |
| | | | | | | 2005 | | 2004 |
|
| | | | | | | LIBOR + | | | | | | | | |
| 10/03 | | $31,588 4.180% | | 0.30% | | 7/09 | | 6/10 | | $ 1,209,537 | | $ 324,014 |
| | | | | | | LIBOR + | | | | | | | | |
| 10/03 | | 37,943 4.160% | | 0.30% | | 11/09 | | 6/10 | | 1,449,351 | | 373,892 |
| | | | | | | LIBOR + | | | | | | | | |
| 10/03 | | 83,307 4.045% | | 0.30% | | — | | 6/10 | | 3,433,250 | | 1,104,607 |
| | | | | | | 3 mo. | | | | | | | | |
| | | | | | | LIBOR + | | | | | | | | |
| 06/04 | | 40,000 4.875% | | 0.00% | | — | | 6/12 | | 42,154 | | (1,246,374)(1) |
|
| |
| | | | | | | | | | | | | $6,134,292 | | $ 556,139 |
|
| (1) | On May 3, 2004, Belrose Capital entered into a forward interest rate swap agreement having a notional amount of $108,168,000 with Merrill Lynch Capital Services, Inc. in anticipation of its investment in a controlled subsidiary, Deerfield, for the purpose of hedging Belrose Realty’s proportionate share of the interest rate of substantially all of the expected fixed-rate mortgage financing of the real property over the expected 8-year term. A portion of this agreement was terminated in July 2004 and the Fund realized a gain of $60,454 upon this partial termination. Belrose Capital retains a $40,000,000 notional amount in this interest rate swap agreement at December 31, 2005. |
| |
8Debt
AMortgages —Rental property held by Belrose Realty’s controlled subsidiaries is financed through mortgage notes issued to those controlled subsidiaries. The mortgage notes are secured by the rental property of Katahdin, Deerfield and Bel Communities (for the period during which Belrose Realty maintained an interest in Bel Communities). The mortgage notes are generally without recourse to Belrose Capital and Belrose Realty, except, in the case of Bel Communities, where there may be recourse for certainliabilities associated with fraud, misrepresentation, misappropriation of funds or breach of material covenants, and liabilities arising from environmental conditions involving or affecting the rental property subject to the mortgage notes. Belrose Capital and Belrose Realty have received indemnification from the Bel Communities Minority Shareholder (Note 1B) for certain of such potential liabilities.
The estimated fair value of the aggregate rental property securing the mortgage notes is approximately $384,992,000 and $496,847,000 at December 31, 2005 and 2004, respectively. Terms of the mortgage notes payable and amounts outstanding at December 31, 2005 and 2004 are as follows:
Maturity
Date | | Annual
Interest
Rate | | Monthly
Interest
Payment* | | Balance at �� |
| | | | December 31, | | December 31, |
| | | | 2005 | | 2004 |
|
| December 1, 2010 | | 7.540% | | $760,283 | | $ | | —(1) | | $121,000,000 |
| June 1, 2011 | | 6.765% | | 653,104 | | | | 115,850,000 | | 115,850,000 |
| September 1, 2012 | | 5.720% | | 586,300 | | | | 123,000,000 | | 123,000,000(2) |
|
| | | | | | | $238,850,000 | | $359,850,000 |
|
| * | | The mortgage notes provide for interest only payments due |
| | | monthly with the entire principal balance due on the |
| | | respective maturity date. |
| (1) | | In October 2005, Belrose Realty sold its majority interest in |
| | | Bel Communities (Note 5). At the time of the transaction, |
| | | the Bel Communities mortgage loan balance was |
| | | $121,000,000. |
| (2) | | On October 6, 2004, Deerfield obtained first mortgage |
| | | financing for its investment in real properties in the amount |
| | | of $123,000,000. |
The estimated market value of the mortgage notes payable is approximately $248,600,000 and $392,500,000 at December 31, 2005 and 2004, respectively. The estimated market value of the mortgage notes payable at December 31, 2004 included an estimated market value of $137,900,000 for the mortgage note payable of Bel Communities that was disposed of in October 2005. The mortgage notes payable cannot be prepaid or otherwise disposed of without incurring a substantial prepayment penalty or without the sale of the rental property financed by the mortgage notes payable. Management generally has no current plans to prepay or otherwise dispose of the mortgage notes payable or sell the related rental property prior to the maturity date. The market value of the mortgage notes is based on estimates using discounted cash flow analysis and currently prevailing rates.
Considerable judgment is necessary in interpreting market data to develop estimates of market value. The use of
52
Belrose Capital Fund LLC
N O T E S T O C O N S O L I D AT E D F I N A N C I A L S T AT E M E N T SC O N T ’ D
|
different assumptions or estimation methodologies may have a material effect on the estimated market value.
BCredit Facility —Belrose Capital has entered into credit arrangements with DrKW Holdings, Inc. (DrKW) and Merrill Lynch Mortgage Capital, Inc. (Merrill Lynch) (collectively, the Credit Facility). The Credit Facility has a seven-year maturity and will expire on June 25, 2010. Belrose Capital’s obligations under the Credit Facility are secured by a pledge of its assets, excluding the assets of Katahdin, Deerfield and Bel Communities (for the period during which Belrose Realty maintained an interest in Bel Communities).
The credit arrangement with DrKW is a term loan facility that accrues interest at a rate of one-month LIBOR plus 0.30% per annum. On December 15, 2005, Belrose Capital amended its credit arrangement with DrKW by $26,500,000 to increase the amount of the term loan to $242,500,000.
The credit arrangement with Merrill Lynch is a revolving loan facility, including the ability to issue letters of credit up to $10,000,000. During the fourth quarter of 2005, Belrose Capital amended its credit arrangement with Merrill Lynch to increase the amount available by a total of $125,000,000 to an aggregate amount available for borrowing of $182,000,000. This credit arrangement accrues interest at a rate of one-month LIBOR plus 0.38% per annum. A commitment fee of 0.10% per annum is paid on the unused commitment amount. Belrose Capital pays all fees associated with issuing the letters of credit. A letter of credit was issued as a substitute for funding certain mortgage escrow accounts required by the lender of Bel Communities (for the period during which Belrose Realty maintained an interest in Bel Communities).
Among other borrowings made during the period, in August 2004, Belrose Capital made borrowings under its credit arrangement with Merrill Lynch in the amount of $57,000,000. At that time, Belrose Capital also increased the amount available under its credit arrangement with Merrill Lynch under a temporary arrangement (the Temporary Arrangement) by $66,000,000 and borrowed that amount. Belrose Capital used the proceeds from these borrowings to finance the Fund’s investment in Deerfield (Note 5). The borrowing under the Temporary Arrangement accrued interest at a rate of one-month LIBOR plus 0.90% and was for a term of sixty days, subject to a thirty-day extension. Any unused amount of the increase pertaining to the Temporary Arrangement was subject to a commitment fee of 0.10% per annum.
On October 6, 2004, Deerfield obtained first mortgage financing for its investment in real properties in the amount of $123,000,000. The proceeds from this financing were distributed to Belrose Realty and the Deerfield Minority Shareholder in accordance with their equity interests. Belrose Realty’s proceeds from this transaction along with other funds available were used to repay Belrose Capital’s borrowings under the Temporary Arrangement as well as a portion of other borrowings under the Credit Facility. Pursuant to its terms, the Temporary Arrangement expired on October 29, 2004.
The following table summarizes Belrose Capital’s Credit Facility:
| | | At December 31, 2005 | | At December 31, 2004 |
|
| Total amount available under the | | | | | | | | |
| Credit Facility | | $424,500,000 | | $273,000,000 |
| DrKW borrowings outstanding | | $242,500,000 | | $216,000,000 |
| Merrill Lynch borrowings outstanding | | $151,000,000 | | $ | | 20,000,000 |
| Outstanding letter of credit | | $ | | — | | $ | | 752,525 |
|
Borrowings under the Credit Facility have been used to purchase the Fund’s interests in real estate investments, to pay selling commissions and organizational expenses, and to provide for the liquidity needs of the Fund. Additional borrowings under the Credit Facility may be made in the future for these purposes.
CNotes Payable —On June 1, 2005, Belrose Realty and the Katahdin Minority Shareholder loaned $2,250,000 and $750,000, respectively, to Katahdin. The note bore interest on the outstanding principal amount at the rate of 8.75% per annum. There was no obligation to pay any principal or interest until maturity on May 31, 2006, at which time the entire outstanding principal balance of the note, plus all accrued unpaid interest thereon was due and payable. In November 2005, the entire principal amount plus accrued and unpaid interest outstanding under the note due to Belrose Realty and the Katahdin Minority Shareholder was paid in full.
On December 14, 2005, Belrose Realty and the Katahdin Minority Shareholder loaned $62,364,071 and $20,788,024, respectively, to Katahdin. The notes bear interest on the outstanding principal amount at the rate of 8.75% per annum. There is no obligation to pay any principal or interest until maturity on December 14, 2006, at which time the entire outstanding principal balance of the note, plus all accrued unpaid interest thereon is due and payable. At December 31, 2005, the principal amount outstanding under the notes due to Belrose Realty and the Katahdin
53
Belrose Capital Fund LLC
N O T E S T O C O N S O L I D AT E D F I N A N C I A L S T AT E M E N T SC O N T ’ D
|
Minority Shareholder is $62,364,071 and $20,788,024, respectively. All balances and transactions related to the notes payable made by Belrose Realty have been eliminated through consolidation of the financial statements. In January and March 2006, Katahdin paid Belrose Realty and the Katahdin Minority Shareholder an aggregate amount of $58,934,951 and $19,644,984, respectively, of the principal amount outstanding.
9Management Fee and Other Transactions with Affiliates
Belrose Capital and the Portfolio have engaged Boston Management as investment adviser. Under the terms of the advisory agreement with the Portfolio, Boston Management receives a monthly advisory fee of 5/96 of 1% (0.625% annually) of the average daily net assets of the Portfolio up to $500,000,000 and at reduced rates as daily net assets exceed that level. Certain of the advisory fee rate reductions are pursuant to an agreement between the Portfolio’s Board of Trustees and Boston Management. Those reductions may not be changed without Trustee and interestholder approval. For the years ended December 31, 2005, 2004 and 2003, the advisory fee applicable to the Portfolio was 0.43%, 0.43% and 0.44% of average daily net assets, respectively.
In addition, Boston Management is, subject to the fee cap described below, entitled to receive a monthly advisory and administrative fee of 1/20 of 1% (0.60% annually) of the average daily gross assets of Belrose Capital. The term “gross assets” with respect to Belrose Capital is defined to include the current value of all of Belrose Capital’s assets, including Belrose Capital’s interest in Belvedere Company and Belrose Capital’s ratable share of the assets of its directly and indirectly controlled subsidiaries, without reduction by any liabilities. The advisory fee payable to the Portfolio in respect of Belrose Capital’s indirect investment in the Portfolio is credited towards Belrose Capital’s advisory and administrative fee payment. Belrose Realty pays Boston Management a monthly management fee at a rate of 1/20 of 1% (equivalent to 0.60% annually) of the average daily gross assets of Belrose Realty. The term “gross assets” with respect to Belrose Realty is defined to include the current value of all assets of Belrose Realty, including Belrose Realty’s ratable share of the assets of its controlled subsidiaries, without reduction by any liabilities. For this purpose, the assets of Belrose Realty’s controlled subsidiaries are reduced by the proportionate interest therein of investors other than Belrose Realty.
Eaton Vance Management and Boston Management do not receive separate compensation for serving as manager of Belrose Capital and manager of Belvedere Company, respectively.
As compensation for its services as Placement Agent, Belrose Capital pays EV Distributors a monthly distribution fee at a rate of 1/120 of 1% (equivalent to 0.10% annually) of Belrose Capital’s average daily net assets.
Payments to the Eaton Vance organization for investment advisory, management, administration and distribution services made by or in respect of Belrose Capital on a direct or indirect basis are subject to a monthly fee cap at a rate of 1/20 of 1% (equivalent to 0.60% annually) of the average daily gross assets of Belrose Capital (as defined above). Payments subject to the monthly fee cap are the distribution fee paid to EV Distributors, Belrose Capital’s attributable share of advisory and management fees paid by the Portfolio and Belrose Realty, and Belrose Capital’s advisory and administrative fee. Boston Management has agreed to waive a portion of the monthly advisory and administrative fee otherwise payable by Belrose Capital as necessary to comply with the monthly fee cap.
Pursuant to a servicing agreement between Belvedere Company and EV Distributors, Belvedere Company pays a servicing fee to EV Distributors for providing certain services and information to Shareholders. The servicing fee is paid on a quarterly basis at an annual rate of 0.15% of Belvedere Company’s average daily net assets. Pursuant to a servicing agreement between Belrose Capital and EV Distributors, Belrose Capital pays a servicing fee to EV Distributors on a quarterly basis at an annual rate of 0.25% of Belrose Capital’s average daily net assets, less Belrose Capital’s allocated share of the servicing fee payable by Belvedere Company. With respect to Shareholders who subscribe through a subagent, EV Distributors has assigned servicing responsibilities and fees to the applicable subagent.
Management services for the real property held by Katahdin, Deerfield, Bel Apartment and Bel Communities (for the period during which Belrose Realty maintained an interest in Bel Apartment and Bel Communities) are provided by an affiliate of each respective entity’s Minority Shareholder (Note 1B). Each management agreement provides for a management fee and allows for reimbursement of payroll and other direct expenses incurred by the managers in conjunction with managing each respective entity’s properties (Note 1B). In addition to the fees noted above, an affiliate of the Deerfield Minority Shareholder also receives administrative and other fees for administering the financial and operating activities of the Deerfield Properties.
54
Belrose Capital Fund LLC
N O T E S T O C O N S O L I D AT E D F I N A N C I A L S T AT E M E N T SC O N T ’ D
|
The table below sets forth the fees paid or payable by, or allocable to, the Fund and Belrose Realty for the years ended December 31, 2005, 2004 and 2003, in connection with the services rendered by Eaton Vance, its affiliates, and affiliates of Belrose Realty’s controlled subsidiaries.
| | | | | | | Year Ended | | | | |
| |
|
| | | December 31, | | December 31, | | December 31, |
| | | 2005 | | 2004 | | 2003 |
|
| Advisory fee allocated to | | | | | | | | | | | | |
| Belvedere Company from | | | | | | | | | | | | |
| the Portfolio | | $55,259,100 | | $50,252,861 | | $41,671,111 |
| Advisory fee allocated to | | | | | | | | | | | | |
| the Fund from Belvedere | | | | | | | | | | | | |
| Company | | $ | | 7,486,967 | | $ | | 7,197,653 | | $ | | 6,267,847 |
| Advisory and administrative | | | | | | | | | | | | |
| fee and management fee | | | | | | | | | | | | |
| incurred directly by the Fund | | $ | | 5,951,465 | | $ | | 5,872,964 | | $ | | 4,977,521 |
| Distribution fees incurred | | | | | | | | | | | | |
| directly by the Fund | | $ | | 1,685,761 | | $ | | 1,641,602 | | $ | | 1,415,111 |
| Reduction of advisory and | | | | | | | | | | | | |
| administrative fees | | $ | | 1,685,761 | | $ | | 1,641,602 | | $ | | 1,415,111 |
| Servicing fees of Belvedere | | | | | | | | | | | | |
| Company | | $19,202,381 | | $17,418,515 | | $14,288,579 |
| Servicing fees allocated to | | | | | | | | | | | | |
| the Fund from Belvedere | | | | | | | | | | | | |
| Company | | $ | | 2,601,544 | | $ | | 2,494,434 | | $ | | 2,149,331 |
| Servicing fees incurred | | | | | | | | | | | | |
| directly by the Fund | | $ | | 1,610,761 | | $ | | 1,610,127 | | $ | | 1,385,329 |
| Servicing fees paid or | | | | | | | | | | | | |
| accrued to subagents | | $ | | 4,212,279 | | $ | | 4,104,537 | | $ | | 1,471,244 |
| Property management, | | | | | | | | | | | | |
| administrative and | | | | | | | | | | | | |
| other fees | | $ | | 2,748,714 | | $ | | 2,879,830 | | $ | | 2,590,322 |
|
10Segment Information
Belrose Capital pursues its investment objective primarily by investing indirectly in the Portfolio through Belvedere Company. The Portfolio is a diversified investment company that emphasizes investments in common stocks of domestic and foreign growth companies that are considered by its investment adviser to be high in quality and attractive in their long-term investment prospects. Separate from its investment in Belvedere Company, Belrose Capital invests in real estate assets through its subsidiary, Belrose Realty. Belrose Realty invests directly and indirectly in Partnership Preference Units and indirectly in real property through controlled subsidiaries, Katahdin, Deerfield, Bel Apartment and Bel Communities (for the period during which Belrose Realty maintained an interest in Bel Apartment and Bel Communities) (Note 1B).
Belrose Capital evaluates performance of the reportable segments based on the net increase (decrease) in net assets from operations of the respective segment, which includes net investment income (loss), net realized gain (loss) and the net change in unrealized appreciation (depreciation). The accounting policies of the reportable segments are the same as those for Belrose Capital on a consolidated basis (Note 2). No reportable segments have been aggregated. Reportable information by segment is as follows:
| | | Tax- | | | | |
| | | Managed | | | | |
| For the Year Ended | | Growth | | Real | | |
| December 31, 2005 | | Portfolio* | | Estate | | Total |
|
| Revenue | | $ | | 18,957,867 | | $ 66,581,796 | | $ 85,539,663 |
| Interest expense | | | | | | | | |
| on mortgages | | | | — | | (22,289,206) | | (22,289,206) |
| Interest expense on | | | | | | | | |
| Credit Facility | | | | — | | (8,644,797) | | (8,644,797) |
| Operating expenses | | | | (1,312,178) | | (28,654,593) | | (29,966,771) |
| Minority interest in net | | | | | | | | |
| income of | | | | | | | | |
| controlled subsidiaries | | | | — | | (3,126,995) | | (3,126,995) |
|
| |
| Net investment income | | $ | | 17,645,689 | | $ 3,866,205 | | $ 21,511,894 |
| Net realized gain | | | | 48,573,761 | | 20,698,602 | | 69,272,363 |
| Net change in unrealized | | | | | | | | |
| appreciation (depreciation) | | | | 9,310,085 | | 28,908,000 | | 38,218,085 |
|
| |
| Net increase in net assets | | | | | | | | |
| from operations of | | | | | | | | |
| reportable segments | | $ | | 75,529,535 | | $ 53,472,807 | | $129,002,342 |
|
| |
| | | Tax- | | | | |
| | | Managed | | | | |
| For the Year Ended | | Growth | | Real | | |
| December 31, 2004 | | Portfolio* | | Estate | | Total |
|
| Revenue | | $ | | 17,098,621 | | $ 73,646,315 | | $ 90,744,936 |
| Interest expense | | | | | | | | |
| on mortgages | | | | — | | (26,491,201) | | (26,491,201) |
| Interest expense on | | | | | | | | |
| Credit Facility | | | | — | | (3,768,499) | | (3,768,499) |
| Operating expenses | | | | (1,217,128) | | (35,726,434) | | (36,943,562) |
| Minority interest in net | | | | | | | | |
| income of | | | | | | | | |
| controlled subsidiaries | | | | — | | (1,872,405) | | (1,872,405) |
|
| |
| Net investment income | | $ | | 15,881,493 | | $ 5,787,776 | | $ 21,669,269 |
| Net realized gain (loss) | | | | 37,885,739 | | (790,159) | | 37,095,580 |
| Net change in unrealized | | | | | | | | |
| appreciation (depreciation) | | | | 98,671,430 | | (36,483,584) | | 62,187,846 |
|
| |
| Net increase (decrease) in | | | | | | | | |
| net assets from operations | | | | | | | | |
| of reportable segments | | $152,438,662 | | $ (31,485,967) | | $120,952,695 |
|
55
Belrose Capital Fund LLC
N O T E S T O C O N S O L I D AT E D F I N A N C I A L S T AT E M E N T SC O N T ’ D
|
| | | Tax- | | | | |
| | | Managed | | | | |
| For the Year Ended | | Growth | | Real | | |
| December 31, 2003 | | Portfolio* | | Estate | | Total |
|
| Revenue | | $ 12,933,752 | | $ 69,349,438 | | $ 82,283,190 |
| Interest expense | | | | | | |
| on mortgages | | — | | (26,317,765) | | (26,317,765) |
| Interest expense on | | | | | | |
| Credit Facility | | — | | (2,488,812) | | (2,488,812) |
| Operating expenses | | (922,781) | | (31,784,810) | | (32,707,591) |
| Minority interest in net | | | | | | |
| income of | | | | | | |
| controlled subsidiaries | | — | | (1,943,578) | | (1,943,578) |
|
| |
| Net investment income | | $ 12,010,971 | | $ 6,814,473 | | $ 18,825,444 |
| Net realized gain (loss) | | 19,102,064 | | (16,652,934) | | 2,449,130 |
| Net change in unrealized | | | | | | |
| appreciation (depreciation) | | 288,392,438 | | 23,444,275 | | 311,836,713 |
|
| |
| Net increase in net assets | | | | | | |
| from operations of | | | | | | |
| reportable segments | | $319,505,473 | | $ 13,605,814 | | $333,111,287 |
|
| |
| * Belrose Capital invests indirectly in Tax-Managed Growth |
| Portfolio through Belvedere Company. | | |
The following table reconciles the reported segment information to the consolidated financial statements for the periods indicated:
| | | | | Year Ended | | |
| |
|
| | | December 31, | | December 31, | | December 31, |
| | | 2005 | | 2004 | | 2003 |
|
| Revenue: | | | | | | |
| Revenue from reportable | | | | | | |
| segments | | $ 85,539,663 | | $ 90,744,936 | | $ 82,283,190 |
| Unallocated amounts: | | | | | | |
| Interest earned on cash | | | | | | |
| not invested in the | | | | | | |
| Portfolio or in controlled | | | | | | |
| subsidiaries | | 225,864 | | 150,923 | | 29,766 |
|
| Total revenue | | $ 85,765,527 | | $ 90,895,859 | | $ 82,312,956 |
|
| Net increase (decrease) in net | | | | | | |
| assets from operations: | | | | | | |
| Net increase in net assets | | | | | | |
| from operations of | | | | | | |
| reportable segments | | $129,002,342 | | $120,952,695 | | $333,111,287 |
| Unallocated investment income: | | | | | | |
| Interest earned on cash | | | | | | |
| not invested in the | | | | | | |
| Portfolio or in controlled | | | | | | |
| subsidiaries | | 225,864 | | 150,923 | | 29,766 |
| Unallocated expenses(1): | | | | | | |
| Distribution and servicing fees | | (3,296,522) | | (3,251,729) | | (2,800,440) |
| Interest expense on | | | | | | |
| Credit Facility | | (1,770,621) | | (613,476) | | (307,606) |
| Audit, tax and legal fees | | (287,685) | | (309,465) | | (294,771) |
| Other operating expenses | | (104,111) | | (125,466) | | (172,751) |
|
| Net increase in net assets | | | | | | |
| from operations | | $123,769,267 | | $116,803,482 | | $329,565,485 |
|
| (1) | Unallocated expenses represent costs incurred that pertain to the overall operation of Belrose Capital, and do not pertain to either operating segment. |
| |
56
Belrose Capital Fund LLC
N O T E S T O C O N S O L I D AT E D F I N A N C I A L S T AT E M E N T SC O N T ’ D
|
The following tables reconcile the reported segment information to the consolidated financial statements as of December 31, 2005 and 2004:
| | | Tax- | | | | |
| | | Managed | | | | |
| | | Growth | | Real | | |
| December 31, 2005 | | Portfolio* | | Estate | | Total |
|
| Segment assets | | $1,783,649,094 | | $661,856,326 | | $2,445,505,420 |
| Segment liabilities | | 116,987 | | 631,424,066 | | 631,541,053 |
|
| |
| Net assets of reportable | | | | | | |
| segments | | $ 1,783,532,107 | | $ 30,432,260 | | $ 1,813,964,367 |
|
| | | Tax- | | | | |
| | | Managed | | | | |
| | | Growth | | Real | | |
| December 31, 2004 | | Portfolio* | | Estate | | Total |
|
| Segment assets | | $1,757,804,676 | | $574,450,377 | | $2,332,255,053 |
| Segment liabilities | | 3,958,764 | | 602,352,828 | | 606,311,592 |
|
| |
| Net assets (liabilities) of | | | | | | |
| reportable segments | | $ 1,753,845,912 | | $ (27,902,451) | | $ 1,725,943,461 |
|
| * | Belrose Capital invests indirectly in Tax-Managed Growth Portfolio through Belvedere Company. |
| |
| | | December 31, 2005 | | December 31, 2004 |
|
| Net assets: | | | | |
| Net assets of reportable segments | | $1,813,964,367 | | $1,725,943,461 |
| Unallocated amounts: | | | | |
| Cash(1) | | 1,738,271 | | 370,849 |
| Short-term investments(1) | | 4,797,347 | | 721,000 |
| Loan payable — Credit Facility(2) | | (66,644,485) | | (32,573,536) |
| Payable to affiliate for distribution | | | | |
| and servicing fees | | (572,971) | | — |
| Other liabilities | | (272,129) | | (234,349) |
|
| Net assets | | $ 1,753,010,400 | | $1,694,227,425 |
|
| (1) | Unallocated cash and short-term investments represent cash and cash equivalents not invested in the Portfolio or real estate assets. |
| |
| (2) | Unallocated amount of loan payable — Credit Facility represents borrowings not specifically used to fund real estate investments. Such borrowings are generally used to pay selling commissions, organization expenses and other liquidity needs of the Fund. |
| |
11Contingencies
Katahdin became party to a claim arising out of the ordinary course of business during 2005. Due to the preliminary nature, it is not possible to predict or determine the outcome of the legal proceeding, nor is it reasonably possible to estimate the amount of loss, if any,that would be associated with an adverse decision. It is not expected that the results of any such claim or litigation will have a material adverse effect on the Fund’s financial position or results of operations.
12Subsequent Event
On January 26, 2006, the Fund made a distribution of $1.28 per share to Shareholders of record on January 25, 2006.
57
Belrose Capital Fund LLC
REPORT OF INDEPENDENT REGISTERED PUBLIC ACCOUNTING FIRM
|
To the Shareholders of Belrose Capital Fund LLC and Subsidiaries
We have audited the accompanying consolidated statements of assets and liabilities, including the consolidated portfolio of investments, of Belrose Capital Fund LLC and Subsidiaries, (collectively, the Fund) as of December 31, 2005 and 2004, and the related consolidated statements of operations, changes in net assets, cash flows, and financial highlights for each of the three years in the period ended December 31, 2005. These financial statements and the financial highlights are the responsibility of the Fund’s management. Our responsibility is to express an opinion on these financial statements and financial highlights based on our audits.
We conducted our audits in accordance with standards of the Public Company Accounting Oversight Board (United States). Those standards require that we plan and perform the audit to obtain reasonable assurance about whether the financial statements and financial highlights are free of material misstatement. An audit includes examining, on a test basis, evidence supporting the amounts and disclosures in the financial statements. Our procedures included confirmation of securities owned as of December 31, 2005 and 2004 by correspondence with the custodian. An audit also includes assessing the accounting principles used and significant estimates made by management, as well as evaluating the overall financial statement presentation. We believe that our audits provide a reasonable basis for our opinion.
In our opinion, the consolidated financial statements and financial highlights referred to above present fairly, in all material respects, the financial position of the Fund as of December 31, 2005 and 2004, and the results of its operations, the changes in its net assets, its cash flows, and the financial highlights for each of the three years in the period ended December 31, 2005 in conformity with accounting principles generally accepted in the United States of America.
We have also audited, in accordance with the standards of the Public Company Accounting Oversight Board (United States), the effectiveness of the Fund’s internal control over financial reporting as of December 31, 2005, based on the criteria established inInternal Control — Integrated Frameworkissued by the Committee of Sponsoring Organizations of the Treadway Commission and our report dated March 10, 2006 expressed an unqualified opinion on management’s assessment of the effectiveness of the Fund’s internal control over financial reporting and an unqualified opinion on the effectiveness of the Fund’s internal control over financial reporting.
DELOITTE & TOUCHE LLP
Boston, Massachusetts
March 10, 2006
|
58
MANAGEMENT’S REPORT ON INTERNAL CONTROL OVER FINANCIAL REPORTING
Eaton Vance Management (“Eaton Vance”), as manager of Belrose Capital Fund LLC (the “Fund”), with the participation of the Fund’s Chief Executive Officer and Chief Financial Officer, (collectively referred to in this report as “management”) is responsible for establishing and maintaining adequate internal control over financial reporting as defined in Rules 13a-15(f) and 15d-15(f) under the 1934 Act. The Fund’s internal control over financial reporting is designed to provide reasonable assurance regarding the reliability of financial reporting and the preparation of financial statements for external purposes in accordance with generally accepted accounting principles.
Because of its inherent limitations, internal control over financial reporting may not prevent or detect misstatements. Also, projections of any evaluation of effectiveness to future periods are subject to the risk that controls may become inadequate because of changes in conditions, or that the degree of compliance with the policies or procedures may deteriorate.
Management assessed the effectiveness of the Fund’s internal control over financial reporting as of December 31, 2005. In making this assessment, management used the criteria set forth by the Committee of Sponsoring Organizations of the Treadway Commission inInternal Control-Integrated Framework. Based on its assessment and those criteria, management believes that the Fund maintained effective internal control over financial reporting as of December 31, 2005.
The Fund’s independent registered public accounting firm has issued an attestation report on management’s assessment of the Fund’s internal control over financial reporting. That report appears on the following page.
59
R E P O RT O F I N D E P E N D E N T R E G I S T E R E D P U B L I C A C C O U N T I N G F I R M
To the Shareholders of Belrose Capital Fund LLC and Subsidiaries
We have audited management’s assessment, included in the accompanying Management’s Report on Internal Control Over Financial Reporting, that Belrose Capital Fund LLC and Subsidiaries (the “Fund”) maintained effective internal control over financial reporting as of December 31, 2005, based on criteria established inInternal Control — Integrated Frameworkissued by the Committee of Sponsoring Organizations of the Treadway Commission. The Fund’s management is responsible for maintaining effective internal control over financial reporting and for its assessment of the effectiveness of internal control over financial reporting. Our responsibility is to express an opinion on management’s assessment and an opinion on the effectiveness of the Fund’s internal control over financial reporting based on our audit.
We conducted our audit in accordance with the standards of the Public Company Accounting Oversight Board (United States). Those standards require that we plan and perform the audit to obtain reasonable assurance about whether effective internal control over financial reporting was maintained in all material respects. Our audit included obtaining an understanding of internal control over financial reporting, evaluating management’s assessment, testing and evaluating the design and operating effectiveness of internal control, and performing such other procedures as we considered necessary in the circumstances. We believe that our audit provides a reasonable basis for our opinions.
A company’s internal control over financial reporting is a process designed by, or under the supervision of, the company’s principal executive and principal financial officers, or persons performing similar functions, and effected by the company’s board of directors, management, and other personnel to provide reasonable assurance regarding the reliability of financial reporting and the preparation of financial statements for external purposes in accordance with generally accepted accounting principles. A company’s internal control over financial reporting includes those policies and procedures that (1) pertain to the maintenance of records that, in reasonable detail, accurately and fairly reflect the transactions and dispositions of the assets of the company; (2) provide reasonable assurance that transactions are recorded as necessary to permit preparation of financial statements in accordance with generally accepted accounting principles, and that receipts and expenditures of the company are being made only in accordance with authorizations of management and directors of the company; and (3) provide reasonable assurance regarding prevention or timely detection of unauthorized acquisition, use,
or disposition of the company’s assets that could have a material effect on the financial statements.
Because of the inherent limitations of internal control over financial reporting, including the possibility of collusion or improper management override of controls, material misstatements due to error or fraud may not be prevented or detected on a timely basis. Also, projections of any evaluation of the effectiveness of the internal control over financial reporting to future periods are subject to the risk that the controls may become inadequate because of changes in conditions, or that the degree of compliance with the policies or procedures may deteriorate.
In our opinion, management’s assessment that the Fund maintained effective internal control over financial reporting as of December 31, 2005, is fairly stated, in all material respects, based on the criteria established inInternal Control — Integrated Frameworkissued by the Committee of Sponsoring Organizations of the Treadway Commission. Also in our opinion, the Fund maintained, in all material respects, effective internal control over financial reporting as of December 31, 2005, based on the criteria established inInternal Control —Integrated Frameworkissued by the Committee of Sponsoring Organizations of the Treadway Commission.
We have also audited, in accordance with the standards of the Public Company Accounting Oversight Board (United States), the consolidated financial statements as of and for the year ended December 31, 2005 of the Fund and our report dated March 10, 2006 expressed an unqualified opinion on those financial statements.
DELOITTE & TOUCHE LLP
Boston, Massachusetts
March 10, 2006
|
60
Tax-Managed Growth Portfolio a s o f D e c e m b e r 3 1 , 2 0 0 5
P O R T F O L I O O F I N V E S T M E N T S
| C o m m o n S t o c k s — 9 9 . 7 % | | | | | | |
| | | | | | |
| Security | | | | Shares | | Value |
|
| Aerospace & Defense — 3.0% | | | | | | |
|
| Boeing Company (The) | | | | 798,441 | | $ | | 56,082,496 |
| General Dynamics Corp. | | | | 735,000 | | | | 83,826,750 |
| Honeywell International, Inc. | | | | 289,748 | | | | 10,793,113 |
| Northrop Grumman Corp. | | | | 3,090,955 | | | | 185,797,305 |
| Raytheon Co. | | | | 345,300 | | | | 13,863,795 |
| Rockwell Collins, Inc. | | | | 156,972 | | | | 7,294,489 |
| Teledyne Technologies, Inc.(1) | | | | 6,117 | | | | 178,005 |
| United Technologies Corp. | | | | 3,660,728 | | | | 204,671,302 |
|
| | | | | | | $ | | 562,507,255 |
|
| Air Freight & Logistics — 2.9% | | | | | | |
|
| C.H. Robinson Worldwide, Inc. | | | | 2,079,406 | | $ | | 77,000,404 |
| FedEx Corp. | | | | 2,226,609 | | | | 230,209,105 |
| United Parcel Service, Inc., Class B | | | | 3,231,607 | | | | 242,855,266 |
|
| | | | | | | $ | | 550,064,775 |
|
| Airlines — 0.0% | | | | | | | | |
|
| Southwest Airlines Co. | | | | 386,112 | | $ | | 6,343,820 |
|
| | | | | | | $ | | 6,343,820 |
|
| Auto Components — 0.1% | | | | | | |
|
| ArvinMeritor, Inc. | | | | 8,000 | | $ | | 115,120 |
| BorgWarner, Inc. | | | | 180,098 | | | | 10,919,342 |
| Delphi Corp. | | | | 5,361 | | | | 1,560 |
| Johnson Controls, Inc. | | | | 233,221 | | | | 17,004,143 |
| Visteon Corp.(1) | | | | 9,828 | | | | 61,523 |
|
| | | | | | | $ | | 28,101,688 |
|
| Automobiles — 0.1% | | | | | | | | |
|
| DaimlerChrysler AG(2) | | | | 7,000 | | $ | | 357,210 |
| Ford Motor Co. | | | | 83,266 | | | | 642,814 |
| General Motors Corp. | | | | 34,443 | | | | 668,883 |
| Harley-Davidson, Inc. | | | | 140,700 | | | | 7,244,643 |
| Honda Motor Co. Ltd. (ADR) | | | | 20,000 | | | | 579,400 |
|
| | | | | | | $ | | 9,492,950 |
|
| Beverages — 4.2% | | | | | | | | |
|
| Anheuser-Busch Companies, Inc. | | | | 4,702,340 | | $ | | 202,012,526 |
| Brown-Forman Corp., Class A | | | | 547,732 | | | | 38,856,108 |
| Brown-Forman Corp., Class B | | | | 45,820 | | | | 3,176,242 |
| Security | | Shares | | Value |
|
| Beverages (continued) | | | | | | |
|
| Coca-Cola Co. | | 3,696,347 | | $ | | 148,999,748 |
| Coca-Cola Enterprises, Inc. | | 1,756,930 | | | | 33,680,348 |
| PepsiCo, Inc. | | 6,217,904 | | | | 367,353,768 |
|
| | | | | $ | | 794,078,740 |
|
| Biotechnology — 2.2% | | | | | | |
|
| Amgen, Inc.(1) | | 4,322,439 | | $ | | 340,867,540 |
| Applera Corp. - Celera Genomics Group(1) | | 26,000 | | | | 284,960 |
| Biogen Idec, Inc.(1) | | 11,200 | | | | 507,696 |
| Genzyme Corp.(1) | | 476,887 | | | | 33,754,062 |
| Gilead Sciences, Inc.(1) | | 115,482 | | | | 6,077,818 |
| Incyte Corp.(1) | | 14,294 | | | | 76,330 |
| Invitrogen Corp.(1) | | 429,910 | | | | 28,649,202 |
| Vertex Pharmaceuticals, Inc.(1) | | 13,000 | | | | 359,710 |
|
| | | | | $ | | 410,577,318 |
|
| Building Products — 0.8% | | | | | | |
|
| American Standard Companies, Inc. | | 975,691 | | $ | | 38,978,855 |
| Masco Corp. | | 3,815,892 | | | | 115,201,779 |
| Water Pik Technologies, Inc.(1) | | 2,141 | | | | 45,967 |
|
| | | | | $ | | 154,226,601 |
|
| Capital Markets — 4.6% | | | | | | |
|
| Affiliated Managers Group, Inc.(1) | | 20,520 | | $ | | 1,646,730 |
| Ameriprise Financial, Inc. | | 123,241 | | | | 5,052,865 |
| Bank of New York Co., Inc. (The) | | 399,053 | | | | 12,709,838 |
| Bear Stearns Companies, Inc. | | 88,001 | | | | 10,166,756 |
| Charles Schwab Corp. (The) | | 857,261 | | | | 12,576,019 |
| Credit Suisse Group(2) | | 155,136 | | | | 7,879,077 |
| Federated Investors, Inc. | | 1,666,768 | | | | 61,737,087 |
| Franklin Resources, Inc. | | 1,448,649 | | | | 136,187,493 |
| Goldman Sachs Group, Inc. | | 1,014,997 | | | | 129,625,267 |
| Investors Financial Services Corp. | | 453,428 | | | | 16,699,753 |
| Knight Capital Group, Inc., Class A(1) | | 1,750,000 | | | | 17,307,500 |
| Legg Mason, Inc. | | 26,461 | | | | 3,167,117 |
| Lehman Brothers Holdings, Inc. | | 96,237 | | | | 12,334,696 |
| Mellon Financial Corp. | | 250,087 | | | | 8,565,480 |
| Merrill Lynch & Co., Inc. | | 2,109,325 | | | | 142,864,582 |
| Morgan Stanley | | 3,713,173 | | | | 210,685,436 |
| Northern Trust Corp. | | 726,812 | | | | 37,663,398 |
| Nuveen Investments, Class A | | 150,000 | | | | 6,393,000 |
| Piper Jaffray Cos., Inc.(1) | | 27,967 | | | | 1,129,867 |
S e e n o t e s t o f i n a n c i a l s t a t e m e n t s
61
Tax-Managed Growth Portfolio a s o f D e c e m b e r 3 1 , 2 0 0 5
P O R T F O L I O O F I N V E S T M E N T S C O N T’D
|
| Security | | Shares | | Value |
|
| Capital Markets (continued) | | | | | | |
|
| Raymond James Financial, Inc. | | 147,337 | | $ | | 5,550,185 |
| State Street Corp. | | 150,434 | | | | 8,340,061 |
| T. Rowe Price Group, Inc. | | 163,648 | | | | 11,787,565 |
| UBS AG(2) | | 83,392 | | | | 7,934,749 |
| Waddell & Reed Financial, Inc., Class A | | 273,635 | | | | 5,738,126 |
|
| | | | | $ | | 873,742,647 |
|
| Chemicals — 0.8% | | | | | | |
|
| Airgas, Inc. | | 117,613 | | $ | | 3,869,468 |
| Arch Chemicals, Inc. | | 4,950 | | | | 148,005 |
| Ashland, Inc. | | 116,107 | | | | 6,722,595 |
| Bayer AG (ADR) | | 40,000 | | | | 1,670,400 |
| Dow Chemical Co. (The) | | 257,005 | | | | 11,261,959 |
| E.I. du Pont de Nemours and Co. | | 1,069,852 | | | | 45,468,710 |
| Ecolab, Inc. | | 305,627 | | | | 11,085,091 |
| MacDermid, Inc. | | 61,937 | | | | 1,728,042 |
| Monsanto Co. | | 19,181 | | | | 1,487,103 |
| Olin Corp. | | 9,900 | | | | 194,832 |
| PPG Industries, Inc. | | 23,542 | | | | 1,363,082 |
| Rohm and Haas Co. | | 2,601 | | | | 125,940 |
| RPM International, Inc. | | 70,138 | | | | 1,218,297 |
| Sigma-Aldrich Corp. | | 630,897 | | | | 39,929,471 |
| Solutia, Inc.(1) | | 11,510 | | | | 5,180 |
| Valspar Corp. (The) | | 1,289,459 | | | | 31,810,954 |
|
| | | | | $ | | 158,089,129 |
|
| Commercial Banks — 8.4% | | | | | | |
|
| AmSouth Bancorporation | | 586,114 | | $ | | 15,362,048 |
| Associated Banc-Corp. | | 991,726 | | | | 32,280,681 |
| Bank of America Corp. | | 4,813,556 | | | | 222,145,609 |
| Bank of Hawaii Corp. | | 69,735 | | | | 3,594,142 |
| Bank of Montreal(2) | | 257,366 | | | | 14,397,054 |
| BB&T Corp. | | 1,715,782 | | | | 71,908,424 |
| City National Corp. | | 184,221 | | | | 13,344,969 |
| Colonial BancGroup, Inc. (The) | | 253,936 | | | | 6,048,756 |
| Comerica, Inc. | | 333,089 | | | | 18,906,132 |
| Commerce Bancshares, Inc. | | 162,911 | | | | 8,490,921 |
| Compass Bancshares, Inc. | | 297,054 | | | | 14,344,738 |
| Fifth Third Bancorp | | 1,973,171 | | | | 74,428,010 |
| First Citizens BancShares, Inc., Class A | | 30,600 | | | | 5,337,252 |
| First Financial Bancorp. | | 47,933 | | | | 839,786 |
| First Horizon National Corp. | | 152,267 | | | | 5,853,143 |
| Security | | Shares | | Value |
|
| Commercial Banks (continued) | | | | | | |
|
| First Midwest Bancorp, Inc. | | 523,358 | | $ | | 18,348,931 |
| HSBC Holdings PLC (ADR) | | 601,671 | | | | 48,416,465 |
| Huntington Bancshares, Inc. | | 630,239 | | | | 14,968,176 |
| KeyCorp | | 799,881 | | | | 26,340,081 |
| M&T Bank Corp. | | 64,486 | | | | 7,032,198 |
| Marshall & Ilsley Corp. | | 589,899 | | | | 25,389,253 |
| National City Corp. | | 1,784,322 | | | | 59,899,690 |
| North Fork Bancorporation, Inc. | | 1,865,892 | | | | 51,050,805 |
| PNC Financial Services Group, Inc. | | 149,958 | | | | 9,271,903 |
| Popular, Inc.(2) | | 1,432 | | | | 30,287 |
| Regions Financial Corp. | | 1,653,747 | | | | 56,491,998 |
| Royal Bank of Canada(2) | | 288,465 | | | | 22,494,501 |
| Royal Bank of Scotland Group PLC(2) | | 50,837 | | | | 1,530,783 |
| S&T Bancorp, Inc. | | 100,000 | | | | 3,682,000 |
| Societe Generale(2) | | 1,152,974 | | | | 141,172,207 |
| SunTrust Banks, Inc. | | 1,373,393 | | | | 99,928,075 |
| Synovus Financial Corp. | | 1,369,351 | | | | 36,986,171 |
| TCF Financial Corp. | | 72,500 | | | | 1,967,650 |
| Trustmark Corp. | | 205,425 | | | | 5,643,025 |
| U.S. Bancorp | | 4,364,242 | | | | 130,447,193 |
| Valley National Bancorp. | | 104,601 | | | | 2,520,884 |
| Wachovia Corp. | | 2,190,523 | | | | 115,791,046 |
| Wells Fargo & Co. | | 2,313,285 | | | | 145,343,697 |
| Westamerica Bancorporation | | 268,474 | | | | 14,247,915 |
| Whitney Holding Corp. | | 383,436 | | | | 10,567,482 |
| Zions Bancorporation | | 620,420 | | | | 46,878,935 |
|
| | | | | $ | | 1,603,723,016 |
|
| Commercial Services & Supplies — 1.4% | | | | |
|
| Acco Brands Corp.(1) | | 30,117 | | $ | | 737,867 |
| Allied Waste Industries, Inc.(1) | | 1,626,411 | | | | 14,214,832 |
| Avery Dennison Corp. | | 851,315 | | | | 47,052,180 |
| Banta Corp. | | 42,341 | | | | 2,108,582 |
| CBIZ, Inc.(1) | | 185,000 | | | | 1,113,700 |
| Cendant Corp. | | 584,731 | | | | 10,086,610 |
| Cintas Corp. | | 1,531,435 | | | | 63,064,493 |
| Consolidated Graphics, Inc.(1) | | 70,215 | | | | 3,323,978 |
| Deluxe Corp. | | 32,000 | | | | 964,480 |
| Donnelley (R.R.) & Sons Co. | | 91,260 | | | | 3,122,005 |
| Equifax, Inc. | | 80,000 | | | | 3,041,600 |
| Herman Miller, Inc. | | 541,800 | | | | 15,273,342 |
| HNI Corp. | | 1,121,592 | | | | 61,609,049 |
S e e n o t e s t o f i n a n c i a l s t a t e m e n t s
62
Tax-Managed Growth Portfolio a s o f D e c e m b e r 3 1 , 2 0 0 5
P O R T F O L I O O F I N V E S T M E N T S C O N T’D
|
| Security | | Shares | | Value |
|
| Commercial Services & Supplies (continued) |
|
| Hudson Highland Group, Inc.(1) | | 10,262 | | $ | | 178,148 |
| Ikon Office Solutions, Inc. | | 56,287 | | | | 585,948 |
| Manpower, Inc. | | 2,000 | | | | 93,000 |
| Monster Worldwide, Inc.(1) | | 68,426 | | | | 2,793,149 |
| Navigant Consulting, Inc.(1) | | 238,641 | | | | 5,245,329 |
| PHH Corp.(1) | | 27,467 | | | | 769,625 |
| Pitney Bowes, Inc. | | 22,857 | | | | 965,708 |
| School Specialty, Inc.(1) | | 49,197 | | | | 1,792,739 |
| Steelcase, Inc., Class A | | 123,000 | | | | 1,947,090 |
| Waste Management, Inc. | | 911,032 | | | | 27,649,821 |
|
| | | | | $ | | 267,733,275 |
|
| Communications Equipment — 1.4% | | | | |
|
| 3Com Corp.(1) | | 664,106 | | $ | | 2,390,782 |
| ADC Telecommunications, Inc.(1) | | 41,693 | | | | 931,421 |
| Alcatel SA (ADR)(1) | | 43,728 | | | | 542,227 |
| Avaya, Inc.(1) | | 31,239 | | | | 333,320 |
| Ciena Corp.(1) | | 375,431 | | | | 1,115,030 |
| Cisco Systems, Inc.(1) | | 5,089,042 | | | | 87,124,399 |
| Comverse Technology, Inc.(1) | | 293,654 | | | | 7,808,260 |
| Corning, Inc.(1) | | 3,633,999 | | | | 71,444,420 |
| Dycom Industries, Inc.(1) | | 143,116 | | | | 3,148,552 |
| Enterasys Networks, Inc.(1) | | 12,356 | | | | 164,088 |
| JDS Uniphase Corp.(1) | | 52,451 | | | | 123,784 |
| Juniper Networks, Inc.(1) | | 35,691 | | | | 795,909 |
| Lucent Technologies, Inc.(1) | | 255,464 | | | | 679,534 |
| Motorola, Inc. | | 1,282,326 | | | | 28,967,744 |
| Nokia Oyj (ADR) | | 2,042,478 | | | | 37,377,347 |
| Nortel Networks Corp.(1)(2) | | 739,418 | | | | 2,262,619 |
| QUALCOMM, Inc. | | 562,096 | | | | 24,215,096 |
| Riverstone Networks, Inc.(1) | | 28,706 | | | | 16,362 |
| Tellabs, Inc.(1) | | 106,674 | | | | 1,162,747 |
|
| | | | | $ | | 270,603,641 |
|
| Computers & Peripherals — 2.2% | | | | |
|
| Dell, Inc.(1) | | 4,471,715 | | $ | | 134,106,733 |
| EMC Corp.(1) | | 1,770,402 | | | | 24,112,875 |
| Gateway, Inc.(1) | | 79,938 | | | | 200,644 |
| Hewlett-Packard Co. | | 906,807 | | | | 25,961,884 |
| International Business Machines Corp. | | 1,712,254 | | | | 140,747,279 |
| Lexmark International, Inc., Class A(1) | | 1,714,509 | | | | 76,861,438 |
| McDATA Corp., Class A(1) | | 17,915 | | | | 68,077 |
| Security | | Shares | | Value |
|
| Computers & Peripherals (continued) | | | | |
|
| Network Appliance, Inc.(1) | | 488,000 | | $ | | 13,176,000 |
| Palm, Inc.(1) | | 64,913 | | | | 2,064,233 |
| Sun Microsystems, Inc.(1) | | 319,180 | | | | 1,337,364 |
|
| | | | | $ | | 418,636,527 |
|
| Construction & Engineering — 0.1% | | | | |
|
| Jacobs Engineering Group, Inc.(1) | | 160,823 | | $ | | 10,915,057 |
|
| | | | | $ | | 10,915,057 |
|
| Construction Materials — 0.2% | | | | |
|
| CRH PLC(2) | | 329,450 | | $ | | 9,642,564 |
| Vulcan Materials Co. | | 206,614 | | | | 13,998,099 |
|
| | | | | $ | | 23,640,663 |
|
| Consumer Finance — 1.1% | | | | | | |
|
| American Express Co. | | 617,258 | | $ | | 31,764,097 |
| Capital One Financial Corp. | | 1,429,006 | | | | 123,466,118 |
| MBNA Corp. | | 411,292 | | | | 11,170,691 |
| SLM Corp. | | 916,399 | | | | 50,484,421 |
|
| | | | | $ | | 216,885,327 |
|
| Containers & Packaging — 0.1% | | | | |
|
| Bemis Co., Inc. | | 295,186 | | $ | | 8,223,882 |
| Caraustar Industries, Inc.(1) | | 167,599 | | | | 1,456,435 |
| Sealed Air Corp.(1) | | 37,014 | | | | 2,079,076 |
| Sonoco Products Co. | | 148,033 | | | | 4,352,170 |
| Temple-Inland, Inc. | | 115,924 | | | | 5,199,191 |
|
| | | | | $ | | 21,310,754 |
|
| Distributors — 0.1% | | | | | | |
|
| Genuine Parts Co. | | 347,293 | | $ | | 15,253,109 |
|
| | | | | $ | | 15,253,109 |
|
| Diversified Consumer Services — 0.4% | | | | |
|
| Apollo Group, Inc., Class A(1) | | 49,852 | | $ | | 3,014,052 |
| H&R Block, Inc. | | 1,575,244 | | | | 38,672,240 |
| Laureate Education, Inc.(1) | | 520,213 | | | | 27,316,385 |
| Service Corp. International | | 142,389 | | | | 1,164,742 |
| ServiceMaster Co. (The) | | 1,156,537 | | | | 13,820,617 |
| Stewart Enterprises, Inc. | | 114,000 | | | | 616,740 |
|
| | | | | $ | | 84,604,776 |
|
S e e n o t e s t o f i n a n c i a l s t a t e m e n t s
63
Tax-Managed Growth Portfolio a s o f D e c e m b e r 3 1 , 2 0 0 5
P O R T F O L I O O F I N V E S T M E N T S C O N T’D
|
| Security | | Shares | | Value |
|
| Diversified Financial Services — 1.9% | | | | |
|
| Citigroup, Inc. | | 4,327,010 | | $ | | 209,989,795 |
| FINOVA Group, Inc. (The)(1) | | 175,587 | | | | 10,535 |
| ING Groep N.V. (ADR) | | 257,281 | | | | 8,958,524 |
| JPMorgan Chase & Co. | | 3,164,955 | | | | 125,617,064 |
| Moody’s Corp. | | 155,397 | | | | 9,544,484 |
| Principal Financial Group, Inc. | | 113,328 | | | | 5,375,147 |
|
| | | | | $ | | 359,495,549 |
|
| Diversified Telecommunication Services — 1.3% |
|
| AT&T, Inc. | | 1,678,472 | | $ | | 41,105,779 |
| BCE, Inc.(2) | | 3,100,000 | | | | 74,245,000 |
| BellSouth Corp. | | 161,722 | | | | 4,382,666 |
| Cincinnati Bell, Inc.(1) | | 169,013 | | | | 593,236 |
| Citizens Communications Co. | | 12,231 | | | | 149,585 |
| Deutsche Telekom AG (ADR) | | 2,006,790 | | | | 33,372,918 |
| McLeod USA, Inc., Class A(1) | | 947 | | | | 10 |
| Qwest Communications International, Inc.(1) | | 38,011 | | | | 214,762 |
| RSL Communications, Ltd., Class A(1)(2)(3) | | 247,161 | | | | 0 |
| Telefonos de Mexico SA de CV (ADR) | | 3,051,574 | | | | 75,312,846 |
| Verizon Communications, Inc. | | 459,935 | | | | 13,853,242 |
|
| | | | | $ | | 243,230,044 |
|
| Electric Utilities — 0.3% | | | | | | |
|
| American Electric Power Co., Inc. | | 960 | | $ | | 35,606 |
| Exelon Corp. | | 1,002,600 | | | | 53,278,164 |
| Southern Co. (The) | | 65,985 | | | | 2,278,462 |
|
| | | | | $ | | 55,592,232 |
|
| Electrical Components — 0.0% | | | | | | |
|
| Molex, Inc., Class A | | 61,319 | | $ | | 1,507,834 |
|
| | | | | $ | | 1,507,834 |
|
| Electrical Equipment — 0.6% | | | | | | |
|
| American Power Conversion Corp. | | 30,856 | | $ | | 678,832 |
| Baldor Electric Co. | | 149,060 | | | | 3,823,389 |
| Emerson Electric Co. | | 1,143,636 | | | | 85,429,609 |
| Rockwell Automation, Inc. | | 250,649 | | | | 14,828,395 |
| Roper Industries, Inc. | | 46,244 | | | | 1,827,100 |
| Thomas & Betts Corp.(1) | | 114,600 | | | | 4,808,616 |
|
| | | | | $ | | 111,395,941 |
|
| Security | | Shares | | Value |
|
| Electronic Equipment & Instruments — 0.7% |
|
| Agilent Technologies, Inc.(1) | | 461,244 | | $ | | 15,354,813 |
| Arrow Electronics, Inc.(1) | | 8,750 | | | | 280,263 |
| Flextronics International, Ltd.(1)(2) | | 441,607 | | | | 4,610,377 |
| Jabil Circuit, Inc.(1) | | 2,127,971 | | | | 78,926,444 |
| National Instruments Corp. | | 735,687 | | | | 23,578,768 |
| Plexus Corp.(1) | | 150,776 | | | | 3,428,646 |
| Sanmina-SCI Corp.(1) | | 1,140,602 | | | | 4,858,965 |
| Solectron Corp.(1) | | 1,707,596 | | | | 6,249,801 |
|
| | | | | $ | | 137,288,077 |
|
| Energy Equipment & Services — 0.8% | | | | |
|
| Baker Hughes, Inc. | | 358,482 | | $ | | 21,788,536 |
| Core Laboratories N.V.(1)(2) | | 20,244 | | | | 756,316 |
| Grant Prideco, Inc.(1) | | 11,694 | | | | 515,939 |
| Halliburton Co. | | 644,762 | | | | 39,949,454 |
| National-Oilwell Varco, Inc.(1) | | 311,875 | | | | 19,554,563 |
| Schlumberger, Ltd.(2) | | 557,887 | | | | 54,198,722 |
| Smith International, Inc. | | 191,739 | | | | 7,115,434 |
| Transocean, Inc.(1)(2) | | 103,602 | | | | 7,220,023 |
|
| | | | | $ | | 151,098,987 |
|
| Food & Staples Retailing — 1.8% | | | | |
|
| Albertson’s, Inc. | | 853,255 | | $ | | 18,216,994 |
| Casey’s General Stores, Inc. | | 12,551 | | | | 311,265 |
| Costco Wholesale Corp. | | 928,292 | | | | 45,922,605 |
| CVS Corp. | | 266,910 | | | | 7,051,762 |
| Kroger Co. (The)(1) | | 1,348,478 | | | | 25,459,265 |
| Safeway, Inc. | | 1,190,841 | | | | 28,175,298 |
| Sysco Corp. | | 2,053,288 | | | | 63,754,592 |
| Sysco Corp.(3)(4) | | 60,000 | | | | 1,862,224 |
| Walgreen Co. | | 988,481 | | | | 43,750,169 |
| Wal-Mart Stores, Inc. | | 2,119,018 | | | | 99,170,042 |
| Winn-Dixie Stores, Inc.(1) | | 137,447 | | | | 107,758 |
|
| | | | | $ | | 333,781,974 |
|
| Food Products — 2.6% | | | | | | |
|
| Archer-Daniels-Midland Co. | | 977,204 | | $ | | 24,097,851 |
| Campbell Soup Co. | | 1,274,493 | | | | 37,941,657 |
| ConAgra Foods, Inc. | | 1,048,341 | | | | 21,260,355 |
| Dean Foods Co.(1) | | 304,629 | | | | 11,472,328 |
| Del Monte Foods Co.(1) | | 99,492 | | | | 1,037,702 |
| General Mills, Inc. | | 151,037 | | | | 7,449,145 |
S e e n o t e s t o f i n a n c i a l s t a t e m e n t s
64
Tax-Managed Growth Portfolio a s o f D e c e m b e r 3 1 , 2 0 0 5
P O R T F O L I O O F I N V E S T M E N T S C O N T’D
|
| Security | | Shares | | Value |
|
| Food Products (continued) | | | | | | |
|
| H.J. Heinz Co. | | 299,708 | | $ | | 10,106,154 |
| Hershey Co. (The) | | 505,557 | | | | 27,932,024 |
| J.M. Smucker Co. (The) | | 7,276 | | | | 320,144 |
| Kellogg Co. | | 54,076 | | | | 2,337,165 |
| Kraft Foods, Inc. | | 465 | | | | 13,085 |
| Nestle SA(2) | | 275,000 | | | | 81,882,612 |
| Sara Lee Corp. | | 4,771,143 | | | | 90,174,603 |
| Smithfield Foods, Inc.(1) | | 3,845,278 | | | | 117,665,507 |
| TreeHouse Foods, Inc.(1) | | 64,797 | | | | 1,213,000 |
| Tyson Foods, Inc., Class A | | 265,272 | | | | 4,536,151 |
| Wm. Wrigley Jr. Co. | | 839,317 | | | | 55,806,187 |
|
| | | | | $ | | 495,245,670 |
|
| Gas Utilities — 0.0% | | | | | | |
|
| National Fuel Gas Co. | | 4,000 | | $ | | 124,760 |
|
| | | | | $ | | 124,760 |
|
| Health Care Equipment & Supplies — 1.3% | | |
|
| Advanced Medical Optics, Inc.(1) | | 31,158 | | $ | | 1,302,404 |
| Bausch & Lomb, Inc. | | 29,250 | | | | 1,986,075 |
| Baxter International, Inc. | | 229,317 | | | | 8,633,785 |
| Becton, Dickinson and Co. | | 64,173 | | | | 3,855,514 |
| Biomet, Inc. | | 419,890 | | | | 15,355,377 |
| Boston Scientific Corp.(1) | | 1,109,134 | | | | 27,162,692 |
| DENTSPLY International, Inc. | | 6,927 | | | | 371,911 |
| Dionex Corp.(1) | | 37,300 | | | | 1,830,684 |
| Edwards Lifesciences Corp.(1) | | 10,353 | | | | 430,788 |
| Guidant Corp. | | 57,206 | | | | 3,704,089 |
| Hillenbrand Industries, Inc. | | 342,176 | | | | 16,906,916 |
| Hospira, Inc.(1) | | 126,372 | | | | 5,406,194 |
| Lumenis, Ltd.(1)(2) | | 100,000 | | | | 222,000 |
| Medtronic, Inc. | | 2,079,834 | | | | 119,736,043 |
| PerkinElmer, Inc. | | 254,526 | | | | 5,996,633 |
| St. Jude Medical, Inc.(1) | | 48,028 | | | | 2,411,006 |
| Steris Corp. | | 718 | | | | 17,964 |
| Stryker Corp. | | 71,556 | | | | 3,179,233 |
| Waters Corp.(1) | | 165,841 | | | | 6,268,790 |
| Zimmer Holdings, Inc.(1) | | 320,941 | | | | 21,644,261 |
|
| | | | | $ | | 246,422,359 |
|
| Health Care Providers & Services — 2.1% | | |
|
| AmerisourceBergen Corp. | | 348,354 | | $ | | 14,421,856 |
| Security | | Shares | | Value |
|
| Health Care Providers & Services (continued) |
|
| Beverly Enterprises, Inc.(1) | | 50,586 | | $ | | 590,339 |
| Cardinal Health, Inc. | | 1,784,669 | | | | 122,695,994 |
| Caremark Rx, Inc.(1) | | 801,471 | | | | 41,508,183 |
| CIGNA Corp. | | 11,836 | | | | 1,322,081 |
| Express Scripts, Inc.(1) | | 53,316 | | | | 4,467,881 |
| HCA, Inc. | | 140 | | | | 7,070 |
| Health Management Associates, Inc., Class A | | 131,615 | | | | 2,890,265 |
| Henry Schein, Inc.(1) | | 1,904,253 | | | | 83,101,601 |
| IDX Systems Corp.(1) | | 60,000 | | | | 2,635,200 |
| IMS Health, Inc. | | 280,530 | | | | 6,990,808 |
| McKesson Corp. | | 2,631 | | | | 135,733 |
| Medco Health Solutions, Inc.(1) | | 182,743 | | | | 10,197,059 |
| PAREXEL International Corp.(1) | | 27,837 | | | | 563,978 |
| Renal Care Group, Inc.(1) | | 239,856 | | | | 11,347,587 |
| Sunrise Senior Living, Inc.(1) | | 288,000 | | | | 9,708,480 |
| Tenet Healthcare Corp.(1) | | 3,961 | | | | 30,341 |
| UnitedHealth Group, Inc. | | 426,716 | | | | 26,516,132 |
| Ventiv Health, Inc.(1) | | 13,170 | | | | 311,075 |
| WellPoint, Inc.(1) | | 809,292 | | | | 64,573,409 |
|
| | | | | $ | | 404,015,072 |
|
| Hotels, Restaurants & Leisure — 1.7% | | | | |
|
| Bob Evans Farms, Inc. | | 50,957 | | $ | | 1,175,068 |
| Brinker International, Inc. | | 198,438 | | | | 7,671,613 |
| Carnival Corp.(2) | | 561,335 | | | | 30,014,582 |
| CBRL Group, Inc. | | 62,047 | | | | 2,180,952 |
| Darden Restaurants, Inc. | | 184,714 | | | | 7,181,680 |
| Gaylord Entertainment Co.(1) | | 428,482 | | | | 18,677,530 |
| International Game Technology | | 400,000 | | | | 12,312,000 |
| International Speedway Corp., Class A | | 118,344 | | | | 5,668,678 |
| Jack in the Box, Inc.(1) | | 500,000 | | | | 17,465,000 |
| Lone Star Steakhouse & Saloon, Inc. | | 145,981 | | | | 3,465,589 |
| Marriott International, Inc., Class A | | 185,766 | | | | 12,440,749 |
| McDonald’s Corp. | | 863,972 | | | | 29,133,136 |
| MGM MIRAGE(1) | | 188,890 | | | | 6,926,596 |
| Navigant International, Inc.(1) | | 38,258 | | | | 415,099 |
| Outback Steakhouse, Inc. | | 1,360,076 | | | | 56,592,762 |
| Papa John’s International, Inc.(1) | | 188,800 | | | | 11,197,728 |
| Royal Caribbean Cruises, Ltd.(2) | | 397,428 | | | | 17,908,106 |
| Sonic Corp.(1) | | 159,765 | | | | 4,713,068 |
| Starbucks Corp.(1) | | 2,343,463 | | | | 70,327,325 |
| Yum! Brands, Inc. | | 236,553 | | | | 11,089,605 |
|
| | | | | $ | | 326,556,866 |
|
S e e n o t e s t o f i n a n c i a l s t a t e m e n t s
65
Tax-Managed Growth Portfolio a s o f D e c e m b e r 3 1 , 2 0 0 5
P O R T F O L I O O F I N V E S T M E N T S C O N T’D
|
| Security | | Shares | | Value |
|
| Household Durables — 0.5% | | | | | | |
|
| Blyth, Inc. | | 699,869 | | $ | | 14,662,256 |
| D.R. Horton, Inc. | | 625,255 | | | | 22,340,361 |
| Fortune Brands, Inc. | | 126,932 | | | | 9,903,235 |
| Helen of Troy, Ltd.(1)(2) | | 20,000 | | | | 322,200 |
| Interface, Inc., Class A(1) | | 75,467 | | | | 620,339 |
| Leggett & Platt, Inc. | | 1,799,370 | | | | 41,313,535 |
| Lenox Group, Inc.(1) | | 5,455 | | | | 72,224 |
| Newell Rubbermaid, Inc. | | 411,393 | | | | 9,782,926 |
| Snap-On, Inc. | | 42,453 | | | | 1,594,535 |
|
| | | | | $ | | 100,611,611 |
|
| Household Products — 2.9% | | | | | | |
|
| Clorox Co. (The) | | 53,688 | | $ | | 3,054,310 |
| Colgate-Palmolive Co. | | 713,670 | | | | 39,144,800 |
| Energizer Holdings, Inc.(1) | | 168,981 | | | | 8,413,564 |
| Kimberly-Clark Corp. | | 1,484,938 | | | | 88,576,552 |
| Procter & Gamble Co. (The) | | 7,098,400 | | | | 410,855,392 |
|
| | | | | $ | | 550,044,618 |
|
| Independent Power Producers & | | | | |
| Energy Traders — 0.2% | | | | | | |
|
| AES Corp. (The)(1) | | 49,542 | | $ | | 784,250 |
| Duke Energy Corp. | | 417,250 | | | | 11,453,513 |
| Dynegy, Inc., Class A(1) | | 22,688 | | | | 109,810 |
| TXU Corp. | | 327,916 | | | | 16,458,104 |
|
| | | | | $ | | 28,805,677 |
|
| Industrial Conglomerates — 3.0% | | | | |
|
| 3M Co. | | 913,513 | | $ | | 70,797,258 |
| General Electric Co. | | 13,345,070 | | | | 467,744,703 |
| Teleflex, Inc. | | 23,700 | | | | 1,540,026 |
| Tyco International, Ltd.(2) | | 1,147,900 | | | | 33,128,394 |
|
| | | | | $ | | 573,210,381 |
|
| Insurance — 6.2% | | | | | | |
|
| 21st Century Insurance Group | | 70,700 | | $ | | 1,143,926 |
| Aegon, N.V. (ADR) | | 5,182,849 | | | | 84,584,096 |
| AFLAC, Inc. | | 2,196,373 | | | | 101,955,635 |
| Allstate Corp. (The) | | 189,192 | | | | 10,229,611 |
| American International Group, Inc. | | 5,154,370 | | | | 351,682,665 |
| AON Corp. | | 550,106 | | | | 19,776,311 |
| Arthur J. Gallagher & Co. | | 647,017 | | | | 19,979,885 |
| Security | | Shares | | Value |
|
| Insurance (continued) | | | | | | |
|
| Berkshire Hathaway, Inc., Class A(1) | | 639 | | $ | | 56,628,180 |
| Berkshire Hathaway, Inc., Class B(1) | | 41,253 | | | | 121,098,182 |
| Chubb Corp. (The) | | 16,099 | | | | 1,572,067 |
| Commerce Group, Inc. (The) | | 120,000 | | | | 6,873,600 |
| Hartford Financial Services Group, Inc. (The) | | 46,382 | | | | 3,983,750 |
| Jefferson-Pilot Corp. | | 150,301 | | | | 8,556,636 |
| Lincoln National Corp. | | 52,903 | | | | 2,805,446 |
| Manulife Financial Corp.(2) | | 74,958 | | | | 4,407,530 |
| Marsh & McLennan Cos., Inc. | | 686,159 | | | | 21,792,410 |
| MetLife, Inc. | | 1,824,271 | | | | 89,389,279 |
| Old Republic International Corp. | | 240,548 | | | | 6,316,790 |
| Progressive Corp. (The)(3)(4) | | 9,470 | | | | 1,104,524 |
| Progressive Corp. (The) | | 1,725,948 | | | | 201,556,207 |
| SAFECO Corp. | | 161,000 | | | | 9,096,500 |
| St. Paul Travelers Companies, Inc., (The) | | 333,134 | | | | 14,881,096 |
| Torchmark Corp. | | 324,638 | | | | 18,049,873 |
| UICI | | 43,597 | | | | 1,548,129 |
| UnumProvident Corp. | | 53,710 | | | | 1,221,903 |
| XL Capital Ltd., Class A(2) | | 187,100 | | | | 12,606,798 |
|
| | | | | $ | | 1,172,841,029 |
|
| Internet & Catalog Retail — 0.1% | | | | |
|
| Amazon.com, Inc.(1) | | 23,500 | | $ | | 1,108,025 |
| Expedia, Inc.(1) | | 403,096 | | | | 9,658,180 |
| IAC/InterActiveCorp(1) | | 403,096 | | | | 11,411,648 |
|
| | | | | $ | | 22,177,853 |
|
| Internet Software & Services — 0.3% | | | | |
|
| eBay, Inc.(1) | | 1,257,244 | | $ | | 54,375,803 |
|
| | | | | $ | | 54,375,803 |
|
| IT Services — 2.5% | | | | | | |
|
| Accenture Ltd., Class A(2) | | 2,738,000 | | $ | | 79,046,060 |
| Acxiom Corp. | | 616,809 | | | | 14,186,607 |
| Affiliated Computer Services, Inc.(1) | | 183,730 | | | | 10,873,141 |
| Automatic Data Processing, Inc. | | 1,560,553 | | | | 71,613,777 |
| BISYS Group, Inc. (The)(1) | | 65,000 | | | | 910,650 |
| Ceridian Corp.(1) | | 26,632 | | | | 661,805 |
| Certegy, Inc. | | 42,862 | | | | 1,738,483 |
| Computer Sciences Corp.(1) | | 226,702 | | | | 11,480,189 |
| CSG Systems International, Inc.(1) | | 25,200 | | | | 562,464 |
| DST Systems, Inc.(1) | | 231,544 | | | | 13,871,801 |
S e e n o t e s t o f i n a n c i a l s t a t e m e n t s
66
Tax-Managed Growth Portfolio a s o f D e c e m b e r 3 1 , 2 0 0 5
P O R T F O L I O O F I N V E S T M E N T S C O N T’D
|
| Security | | Shares | | Value |
|
| IT Services (continued) | | | | | | |
|
| eFunds Corp.(1) | | 1 | | $ | | 23 |
| Electronic Data Systems Corp. | | 1,252 | | | | 30,098 |
| First Data Corp. | | 3,759,930 | | | | 161,714,589 |
| Fiserv, Inc.(1) | | 832,355 | | | | 36,016,001 |
| Gartner, Inc.(1) | | 30,576 | | | | 394,430 |
| Paychex, Inc. | | 1,597,890 | | | | 60,911,567 |
| Perot Systems Corp.(1) | | 684,871 | | | | 9,684,076 |
| Safeguard Scientifics, Inc.(1) | | 26,579 | | | | 51,297 |
|
| | | | | $ | | 473,747,058 |
|
| Leisure Equipment & Products — 0.0% | | | | |
|
| Eastman Kodak Co. | | 90,761 | | $ | | 2,123,807 |
| Mattel, Inc. | | 30,514 | | | | 482,731 |
|
| | | | | $ | | 2,606,538 |
|
| Machinery — 3.0% | | | | | | |
|
| Caterpillar, Inc.(3)(4) | | 34,186 | | $ | | 1,974,662 |
| Caterpillar, Inc. | | 110,120 | | | | 6,361,632 |
| Danaher Corp. | | 4,031,970 | | | | 224,903,287 |
| Deere & Co. | | 3,350,000 | | | | 228,168,500 |
| Donaldson Co., Inc. | | 79,326 | | | | 2,522,567 |
| Dover Corp. | | 367,670 | | | | 14,886,958 |
| Federal Signal Corp. | | 218,345 | | | | 3,277,358 |
| Illinois Tool Works, Inc. | | 756,673 | | | | 66,579,657 |
| ITT Industries, Inc. | | 4,214 | | | | 433,283 |
| Nordson Corp. | | 163,978 | | | | 6,642,749 |
| Parker Hannifin Corp. | | 43,632 | | | | 2,877,967 |
| Tecumseh Products Co., Class A | | 125,700 | | | | 2,879,787 |
| Wabtec Corp. | | 94,504 | | | | 2,542,158 |
|
| | | | | $ | | 564,050,565 |
|
| Media — 4.3% | | | | | | |
|
| ADVO, Inc. | | 750,000 | | $ | | 21,135,000 |
| Arbitron, Inc. | | 11,555 | | | | 438,859 |
| Belo Corp., Class A | | 542,924 | | | | 11,624,003 |
| Cablevision Systems Corp., Class A(1) | | 207,410 | | | | 4,867,913 |
| Catalina Marketing Corp. | | 87,095 | | | | 2,207,858 |
| CCE Spinco, Inc.(1) | | 16,410 | | | | 214,976 |
| Clear Channel Communications, Inc. | | 131,283 | | | | 4,128,850 |
| Comcast Corp., Class A(1) | | 1,979,556 | | | | 51,389,274 |
| Comcast Corp., Class A Special(1) | | 1,424,823 | | | | 36,603,703 |
| Discovery Holding Co., Class A(1) | | 131,304 | | | | 1,989,256 |
| Security | | Shares | | Value |
|
| Media (continued) | | | | | | |
|
| Discovery Holding Co., Class B(1) | | 3,287 | | $ | | 50,620 |
| E.W. Scripps Co. (The), Class A | | 51,066 | | | | 2,452,189 |
| EchoStar Communications Corp., Class A(1) | | 35,150 | | | | 955,026 |
| Entercom Communications Corp.(1) | | 220,000 | | | | 6,527,400 |
| Gannett Co., Inc. | | 701,567 | | | | 42,493,913 |
| Havas SA (ADR) | | 3,142,938 | | | | 13,326,057 |
| Interpublic Group of Companies, Inc. (The)(1) | | 976,936 | | | | 9,427,432 |
| Knight Ridder, Inc. | | 19,023 | | | | 1,204,156 |
| Lamar Advertising Co.(1) | | 241,409 | | | | 11,138,611 |
| Liberty Global, Inc., Class A(1) | | 50,655 | | | | 1,139,738 |
| Liberty Global, Inc., Class B(1) | | 1,643 | | | | 37,345 |
| Liberty Global, Inc., Class C(1) | | 52,298 | | | | 1,108,718 |
| Liberty Media Corp., Class A(1) | | 1,313,041 | | | | 10,333,633 |
| Liberty Media Corp., Class B(1) | | 32,876 | | | | 264,981 |
| McClatchy Co., (The), Class A | | 48,066 | | | | 2,840,701 |
| McGraw-Hill Companies, Inc., (The) | | 472,484 | | | | 24,394,349 |
| New York Times Co. (The), Class A | | 300,468 | | | | 7,947,379 |
| News Corp., Class A | | 187,934 | | | | 2,922,374 |
| Omnicom Group, Inc. | | 2,326,246 | | | | 198,033,322 |
| ProQuest Co.(1) | | 95,464 | | | | 2,664,400 |
| Publicis Groupe(2) | | 329,132 | | | | 11,417,022 |
| Reuters Group PLC (ADR) | | 1,431 | | | | 63,322 |
| Time Warner, Inc. | | 4,153,197 | | | | 72,431,756 |
| Tribune Co. | | 1,601,074 | | | | 48,448,499 |
| Univision Communications, Inc., Class A(1) | | 401,298 | | | | 11,794,148 |
| Viacom, Inc., Class A | | 29,774 | | | | 975,396 |
| Viacom, Inc., Class B | | 965,189 | | | | 31,465,161 |
| Vivendi Universal SA (ADR) | | 417,045 | | | | 13,107,724 |
| Walt Disney Co., (The) | | 4,904,830 | | | | 117,568,775 |
| Washington Post Co. (The), Class B | | 16,470 | | | | 12,599,550 |
| Westwood One, Inc. | | 122,400 | | | | 1,995,120 |
| WPP Group PLC(2) | | 139,450 | | | | 1,505,381 |
| WPP Group PLC (ADR) | | 256,051 | | | | 13,826,754 |
|
| | | | | $ | | 811,060,644 |
| | | | | | |
| Metals & Mining — 0.3% | | | | | | |
|
| Alcoa, Inc. | | 85,947 | | $ | | 2,541,453 |
| Allegheny Technologies, Inc. | | 21,408 | | | | 772,401 |
| Inco, Ltd.(1)(2) | | 200,000 | | | | 8,714,000 |
| Nucor Corp. | | 421,662 | | | | 28,133,289 |
| Phelps Dodge Corp. | | 14,862 | | | | 2,138,196 |
| Steel Dynamics, Inc. | | 311,800 | | | | 11,072,018 |
|
| | | | | $ | | 53,371,357 |
|
S e e n o t e s t o f i n a n c i a l s t a t e m e n t s
67
Tax-Managed Growth Portfolio a s o f D e c e m b e r 3 1 , 2 0 0 5
P O R T F O L I O O F I N V E S T M E N T S C O N T’D
|
| Security | | Shares | | Value |
|
| Multiline Retail — 1.6% | | | | | | |
|
| 99 Cents Only Stores(1) | | 1,142,232 | | $ | | 11,947,747 |
| Dollar General Corp. | | 101,456 | | | | 1,934,766 |
| Dollar Tree Stores, Inc.(1) | | 659,218 | | | | 15,781,679 |
| Family Dollar Stores, Inc. | | 2,618,411 | | | | 64,910,409 |
| Federated Department Stores, Inc. | | 130,024 | | | | 8,624,492 |
| J.C. Penney Company, Inc. | | 130,816 | | | | 7,273,370 |
| Kohl’s Corp.(1) | | 55 | | | | 2,673 |
| Nordstrom, Inc. | | 131,384 | | | | 4,913,762 |
| Sears Holdings Corp.(1) | | 5,747 | | | | 663,951 |
| Target Corp. | | 3,498,908 | | | | 192,334,973 |
|
| | | | | $ | | 308,387,822 |
|
| Multi-Utilities — 0.0% | | | | | | |
|
| Ameren Corp. | | 5,000 | | $ | | 256,200 |
| Dominion Resources, Inc. | | 3,249 | | | | 250,823 |
| PG&E Corp. | | 47,705 | | | | 1,770,810 |
| TECO Energy, Inc. | | 34,145 | | | | 586,611 |
| Wisconsin Energy Corp. | | 9,576 | | | | 374,039 |
|
| | | | | $ | | 3,238,483 |
|
| Office Electronics — 0.0% | | | | | | |
|
| Xerox Corp.(1) | | 42,878 | | $ | | 628,163 |
| Zebra Technologies Corp., Class A(1) | | 13,500 | | | | 578,475 |
|
| | | | | $ | | 1,206,638 |
|
| Oil, Gas & Consumable Fuels — 10.5% | | | | |
|
| Amerada Hess Corp. | | 18,947 | | $ | | 2,402,859 |
| Anadarko Petroleum Corp. | | 2,559,141 | | | | 242,478,610 |
| Apache Corp. | | 2,073,929 | | | | 142,105,615 |
| BP PLC (ADR) | | 5,008,980 | | | | 321,676,696 |
| Burlington Resources, Inc. | | 4,335,883 | | | | 373,753,115 |
| Chevron Corp. | | 409,158 | | | | 23,227,900 |
| ConocoPhillips | | 3,329,274 | | | | 193,697,161 |
| Devon Energy Corp. | | 1,015,400 | | | | 63,503,116 |
| El Paso Corp. | | 148,709 | | | | 1,808,301 |
| Exxon Mobil Corp. | | 6,579,287 | | | | 369,558,551 |
| Kerr-McGee Corp. | | 267,327 | | | | 24,289,331 |
| Kinder Morgan, Inc. | | 1,781,672 | | | | 163,824,740 |
| Marathon Oil Corp. | | 30,098 | | | | 1,835,075 |
| Murphy Oil Corp. | | 39,036 | | | | 2,107,554 |
| Newfield Exploration Co.(1) | | 120,000 | | | | 6,008,400 |
| Royal Dutch Shell PLC (ADR) | | 118,194 | | | | 7,267,749 |
| Security | | Shares | | Value |
| |
| |
|
| Oil, Gas & Consumable Fuels (continued) | | |
| |
|
| Total SA (ADR) | | 400,000 | | $ | | 50,560,000 |
| Valero Energy Corp. | | 206,040 | | | | 10,631,664 |
| Williams Cos., Inc. (The) | | 219,065 | | | | 5,075,736 |
|
| | | | | $ | | 2,005,812,173 |
|
| Paper and Forest Products — 0.1% | | | | |
|
| International Paper Co. | | 111,913 | | $ | | 3,761,396 |
| Louisiana-Pacific Corp. | | 70,750 | | | | 1,943,503 |
| MeadWestvaco Corp. | | 73,347 | | | | 2,055,916 |
| Neenah Paper, Inc. | | 38,811 | | | | 1,086,708 |
| Weyerhaeuser Co. | | 89,778 | | | | 5,955,873 |
|
| | | | | $ | | 14,803,396 |
|
| Personal Products — 0.4% | | | | | | |
|
| Avon Products, Inc. | | 173,400 | | $ | | 4,950,570 |
| Estee Lauder Cos., Inc. (The), Class A | | 2,092,312 | | | | 70,050,606 |
|
| | | | | $ | | 75,001,176 |
|
| Pharmaceuticals — 6.1% | | | | | | |
|
| Abbott Laboratories | | 3,078,014 | | $ | | 121,366,092 |
| Allergan, Inc. | | 38,300 | | | | 4,134,868 |
| Andrx Corp.(1) | | 180,170 | | | | 2,967,400 |
| Bristol-Myers Squibb Co. | | 4,973,196 | | | | 114,284,044 |
| Elan Corp. PLC (ADR)(1) | | 31,838 | | | | 443,503 |
| Eli Lilly & Co. | | 3,585,323 | | | | 202,893,429 |
| Forest Laboratories, Inc.(1) | | 56,800 | | | | 2,310,624 |
| GlaxoSmithKline PLC (ADR) | | 434,293 | | | | 21,923,111 |
| Johnson & Johnson | | 3,505,021 | | | | 210,651,762 |
| King Pharmaceuticals, Inc.(1) | | 505,637 | | | | 8,555,378 |
| Merck & Co., Inc. | | 2,605,384 | | | | 82,877,265 |
| Mylan Laboratories, Inc. | | 27,992 | | | | 558,720 |
| Novo Nordisk A/S (ADR) | | 292,277 | | | | 16,466,886 |
| Pfizer, Inc. | | 8,223,321 | | | | 191,767,846 |
| Schering-Plough Corp. | | 2,461,993 | | | | 51,332,554 |
| Sepracor, Inc.(1) | | 4,000 | | | | 206,400 |
| Shering AG (ADR) | | 25,000 | | | | 1,672,750 |
| Teva Pharmaceutical Industries, Ltd. (ADR) | | 1,676,190 | | | | 72,092,932 |
| Watson Pharmaceuticals, Inc.(1) | | 668,041 | | | | 21,718,013 |
| Wyeth | | 890,144 | | | | 41,008,934 |
|
| | | | | $ | | 1,169,232,511 |
|
S e e n o t e s t o f i n a n c i a l s t a t e m e n t s
68
Tax-Managed Growth Portfolio a s o f D e c e m b e r 3 1 , 2 0 0 5
P O R T F O L I O O F I N V E S T M E N T S C O N T’D
|
| Security | | Shares | | Value |
|
| Real Estate — 0.1% | | | | | | |
|
| AvalonBay Communities, Inc. | | 28,867 | | $ | | 2,576,380 |
| Forest City Enterprises, Inc., Class A | | 77,326 | | | | 2,932,975 |
| Jones Lang LaSalle, Inc. | | 1,835 | | | | 92,392 |
| Plum Creek Timber Co., Inc. | | 198,791 | | | | 7,166,416 |
| ProLogis | | 126,355 | | | | 5,903,306 |
| Trammell Crow Co.(1) | | 65,491 | | | | 1,679,844 |
|
| | | | | $ | | 20,351,313 |
|
| Road & Rail — 0.2% | | | | | | |
|
| ANC Rental Corp.(1) | | 50,667 | | $ | | 5 |
| Burlington Northern Santa Fe Corp. | | 194,233 | | | | 13,755,581 |
| CSX Corp. | | 38,134 | | | | 1,936,063 |
| Florida East Coast Industries, Inc. | | 121,978 | | | | 5,168,208 |
| Heartland Express, Inc. | | 653,154 | | | | 13,252,495 |
| Kansas City Southern(1) | | 15,215 | | | | 371,702 |
| Norfolk Southern Corp. | | 3,990 | | | | 178,872 |
| Union Pacific Corp. | | 10,453 | | | | 841,571 |
|
| | | | | $ | | 35,504,497 |
|
| Semiconductors & Semiconductor Equipment — 2.2% |
|
| Agere Systems, Inc.(1) | | 8,329 | | $ | | 107,444 |
| Altera Corp.(1) | | 66,116 | | | | 1,225,129 |
| Analog Devices, Inc. | | 574,160 | | | | 20,595,119 |
| Applied Materials, Inc. | | 1,123,242 | | | | 20,150,961 |
| Broadcom Corp., Class A(1) | | 576,281 | | | | 27,171,649 |
| Conexant Systems, Inc.(1) | | 134,174 | | | | 303,233 |
| Cypress Semiconductor Corp.(1) | | 152,742 | | | | 2,176,574 |
| Freescale Semiconductor, Inc., Class B(1) | | 101,523 | | | | 2,555,334 |
| Intel Corp. | | 10,662,764 | | | | 266,142,589 |
| KLA-Tencor Corp. | | 148,373 | | | | 7,319,240 |
| Linear Technology Corp. | | 95,760 | | | | 3,454,063 |
| LSI Logic Corp.(1) | | 132,810 | | | | 1,062,480 |
| Maxim Integrated Products, Inc. | | 304,351 | | | | 11,029,680 |
| Mindspeed Technologies, Inc.(1) | | 44,724 | | | | 105,101 |
| Skyworks Solutions, Inc.(1) | | 98,685 | | | | 502,307 |
| Taiwan Semiconductor Manufacturing Co., Ltd. (ADR) | | 909 | | | | 9,008 |
| Teradyne, Inc.(1) | | 27,996 | | | | 407,902 |
| Texas Instruments, Inc. | | 1,820,303 | | | | 58,377,117 |
| Xilinx, Inc. | | 58,684 | | | | 1,479,424 |
|
| | | | | $ | | 424,174,354 |
|
| Security | | Shares | | Value |
|
| Software — 1.7% | | | | | | |
|
| Adobe Systems, Inc. | | 608,276 | | $ | | 22,481,881 |
| Cadence Design Systems, Inc.(1) | | 450,000 | | | | 7,614,000 |
| Cognos, Inc.(1)(2) | | 77,000 | | | | 2,672,670 |
| Computer Associates International, Inc. | | 38,744 | | | | 1,092,193 |
| Compuware Corp.(1) | | 150,944 | | | | 1,353,968 |
| Electronic Arts, Inc.(1) | | 21,405 | | | | 1,119,696 |
| Fair Isaac Corp. | | 564,515 | | | | 24,934,628 |
| Intuit, Inc.(1) | | 573,111 | | | | 30,546,816 |
| Jack Henry & Associates, Inc. | | 201,006 | | | | 3,835,194 |
| Microsoft Corp. | | 7,149,319 | | | | 186,954,692 |
| Oracle Corp.(1) | | 1,014,698 | | | | 12,389,463 |
| Parametric Technology Corp.(1) | | 94,600 | | | | 577,060 |
| Reynolds and Reynolds Co. (The), Class A | | 216,412 | | | | 6,074,685 |
| SAP AG (ADR) | | 400,000 | | | | 18,028,000 |
| Siebel Systems, Inc. | | 179,184 | | | | 1,895,767 |
| Symantec Corp.(1) | | 90,220 | | | | 1,578,850 |
| Wind River Systems, Inc.(1) | | 91,910 | | | | 1,357,511 |
|
| | | | | $ | | 324,507,074 |
|
| Specialty Retail — 2.0% | | | | | | |
|
| Abercrombie & Fitch Co., Class A | | 11,225 | | $ | | 731,646 |
| AutoNation, Inc.(1) | | 1,370,088 | | | | 29,772,012 |
| Best Buy Co., Inc. | | 170,415 | | | | 7,409,644 |
| Burlington Coat Factory Warehouse Corp. | | 95,284 | | | | 3,831,370 |
| CarMax, Inc.(1) | | 67,797 | | | | 1,876,621 |
| Circuit City Stores, Inc. | | 216,000 | | | | 4,879,440 |
| Gap, Inc. (The) | | 540,888 | | | | 9,541,264 |
| Home Depot, Inc. (The) | | 4,485,692 | | | | 181,580,812 |
| Limited Brands, Inc. | | 692,655 | | | | 15,480,839 |
| Lowe’s Companies, Inc. | | 879,145 | | | | 58,603,806 |
| Office Depot, Inc.(1) | | 80,276 | | | | 2,520,666 |
| OfficeMax, Inc. | | 2,192 | | | | 55,589 |
| Payless ShoeSource, Inc.(1) | | 23,100 | | | | 579,810 |
| Pep Boys (The) - Manny, Moe & Jack | | 62,500 | | | | 930,625 |
| RadioShack Corp. | | 625,064 | | | | 13,145,096 |
| Sherwin-Williams Co. (The) | | 53,386 | | | | 2,424,792 |
| Staples, Inc. | | 300,587 | | | | 6,826,331 |
| Tiffany & Co. | | 57,286 | | | | 2,193,481 |
| TJX Companies, Inc. (The) | | 1,716,834 | | | | 39,882,054 |
| Too, Inc.(1) | | 38,284 | | | | 1,079,992 |
|
| | | | | $ | | 383,345,890 |
|
S e e n o t e s t o f i n a n c i a l s t a t e m e n t s
|
69
Tax-Managed Growth Portfolio a s o f D e c e m b e r 3 1 , 2 0 0 5
P O R T F O L I O O F I N V E S T M E N T S C O N T’D
| Security | | Shares | | Value |
|
| Textiles, Apparel & Luxury Goods — 0.8% | | |
|
| Coach, Inc.(1) | | 731,440 | | $ | | 24,386,210 |
| NIKE, Inc., Class B | | 1,529,222 | | | | 132,721,177 |
|
| | | | | $ | | 157,107,387 |
|
| Thrifts & Mortgage Finance — 0.6% | | | | |
|
| Countrywide Financial Corp. | | 999,998 | | $ | | 34,189,932 |
| Fannie Mae | | 335,606 | | | | 16,380,929 |
| Freddie Mac | | 151,086 | | | | 9,873,470 |
| Golden West Financial Corp. | | 89,168 | | | | 5,885,088 |
| MGIC Investment Corp. | | 85,000 | | | | 5,594,700 |
| Radian Group, Inc. | | 1,796 | | | | 105,228 |
| Washington Mutual, Inc. | | 875,535 | | | | 38,085,772 |
|
| | | | | $ | | 110,115,119 |
|
| Tobacco — 0.3% | | | | | | |
|
| Altria Group, Inc. | | 700,409 | | $ | | 52,334,560 |
| | | | | | |
| | | | | $ | | 52,334,560 |
|
| Trading Companies & Distributors — 0.0% | | |
|
| United Rentals, Inc.(1) | | 397,333 | | $ | | 9,293,619 |
|
| | | | | $ | | 9,293,619 |
|
| Wireless Telecommunication Services — 0.6% |
|
| Alltel Corp. | | 1,682,674 | | $ | | 106,176,729 |
| Sprint Nextel Corp. | | 297,303 | | | | 6,944,998 |
| Telephone & Data Systems, Inc., Special Shares | | 25,844 | | | | 894,461 |
| Telephone and Data Systems, Inc. | | 25,844 | | | | 931,159 |
| Vodafone Group PLC (ADR) | | 332,062 | | | | 7,129,371 |
|
| | | | | $ | | 122,076,718 |
|
| Total Common Stocks | | | | | | |
| (identified cost $14,184,947,956) | | | | $18,969,682,297 |
|
| C o n v e r t i b l e P r e f e r r e d S t o c k s — 0 . 0 % |
| | | | |
| Security | | Shares | | Value |
|
| Oil, Gas & Consumable Fuels — 0.0% | | | | |
| |
| |
|
| Enron Corp.(1)(3) | | 11,050 | | $ | | 0 |
|
| | | | | $ | | 0 |
|
| Total Convertible Preferred Stocks | | | | |
| (identified cost $16,626,069) | | | | $ | | 0 |
|
| P r e f e r r e d S t o c k s — 0 . 0 % | | | | | | |
| Security | | Shares | | Value | | |
|
| Commercial Banks — 0.0% | | | | | | |
|
| Wachovia Corp. (Dividend Equalization | | | | | | |
| Preferred Shares)(1) | | 166,518 | | $ | | 666 |
|
| | | | | | | $ | | 666 |
|
| Total Preferred Stocks | | | | | | |
| | | (identified cost $39,407) | | | | $ | | 666 |
|
| R i g h t s — 0 . 0 % | | | | | | |
| | | | | | |
| Security | | Shares | | Value | | |
|
| Computers and Business Equipment — 0.0% |
|
| Seagate Technology, Inc. (Tax Refund Rights)(1)(3) | | 197,392 | | $ | | 0 |
| | | | | | |
| | | | | | | $ | | 0 |
|
| Diversified Telecommunication Services — 0.0% |
|
| McLeodUSA, Inc., (Escrow Rights)(1)(3) | | 1,592,200 | | $ | | 0 |
|
| | | | | | | $ | | 0 |
|
| Total Rights | | | | | | |
| | | (identified cost $0) | | | | $ | | 0 |
|
| W a r r a n t s — 0 . 0 % | | | | | | |
| | | | | | |
| Security | | Shares | | Value | | |
|
| Communications Equipment — 0.0% | | | | |
|
| Lucent Technologies, Inc.(1) | | 18,106 | | $ | | 10,230 |
|
| | | | | | | $ | | 10,230 |
|
| Total Warrants | | | | | | |
| | | (identified cost $0) | | | | $ | | 10,230 |
|
| Total Investments — 99.7% | | | | | | |
| | | (identified cost $14,201,613,432) | | | | $18,969,693,193 |
|
| Other Assets, Less Liabilities — 0.3% | | $ | | 62,913,660 |
|
| Net Assets — 100.0% | | | | $19,032,606,853 |
|
| ADR - American Depository Receipt | | | | | | |
| (1) | | Non-income producing security. | | | | | | |
| (2) | | Foreign security. | | | | | | |
| (3) | | Security valued at fair value using methods determinedin good |
| | | faith by or at the direction of the Trustees. | | | | |
| (4) | | Security subject to restrictions on resale (see Note 7). | | |
S e e n o t e s t o f i n a n c i a l s t a t e m e n t s
70
Tax-Managed Growth Portfolio a s o f D e c e m b e r 3 1 , 2 0 0 5
F I N A N C I A L S T A T E M E N T S
|
| S t a t e m e n t o f A s s e t s a n d L i a b i l i t i e s | | |
| As of December 31, 2005 | | | | |
| Assets | | | | |
|
| Investments, at value (identified cost, $14,201,613,432) | | $ 18,969,693,193 |
| Cash | | | | 56,253 |
| Receivable for investments sold | | | | 51,552,943 |
| Dividends and interest receivable | | | | 25,609,097 |
| Tax reclaim receivable | | | | 1,279,291 |
|
| Total assets | | $ 19,048,190,777 |
|
| Liabilities | | | | |
|
| Demand note payable | | $ | | 8,000,000 |
| Payable to affiliate for investment adviser fee | | | | 6,896,006 |
| Payable to affiliate for Trustees’ fees | | | | 12,004 |
| Accrued expenses | | | | 675,914 |
|
| Total liabilities | | $ | | 15,583,924 |
|
| Net Assets applicable to investors’ interest in Portfolio | | $ 19,032,606,853 |
|
| Sources of Net Assets | | | | |
|
| Net proceeds from capital contributions and withdrawals | | $ 14,264,573,420 |
| Net unrealized appreciation (computed on the basis of identified cost) | | | | 4,768,033,433 |
|
| Total | | $ 19,032,606,853 |
|
| S t a t e m e n t o f O p e r a t i o n s | | | | |
| | | | |
| For the Year Ended | | | | |
| December 31, 2005 | | | | |
| | | | |
| Investment Income | | | | |
|
| Dividends (net of foreign taxes, $4,483,174) | | $ 314,591,123 |
| Interest | | | | 1,772,594 |
|
| Total investment income | | $ 316,363,717 |
|
| Expenses | | | | |
|
| Investment adviser fee | | $ | | 80,617,092 |
| Trustees’ fees and expenses | | | | 34,741 |
| Custodian fee | | | | 2,335,402 |
| Legal and accounting services | | | | 107,743 |
| Miscellaneous | | | | 453,249 |
|
| Total expenses | | $ | | 83,548,227 |
|
| Deduct — | | | | |
| Reduction of custodian fee | | $ | | 267 |
| Reduction of investment adviser fee | | | | 88,889 |
|
| Total expense reductions | | $ | | 89,156 |
|
| Net expenses | | $ | | 83,459,071 |
|
| Net investment income | | $232,904,646 |
|
| Realized and Unrealized Gain (Loss) | | | | |
|
| Net realized gain (loss) — | | | | |
| Investment transactions (identified cost basis) | | $ 101,182,645 |
| Securities sold short | | | | (30,244,833) |
| Foreign currency transactions | | | | (48,663) |
|
| Net realized gain | | $ | | 70,889,149 |
|
| Change in unrealized appreciation (depreciation) — | | | | |
| Investments (identified cost basis) | | $ 523,919,934 |
| Securities sold short | | | | 27,299,373 |
| Foreign currency | | | | (199,704) |
|
| Net change in unrealized appreciation (depreciation) | | $ 551,019,603 |
|
| Net realized and unrealized gain | | $ 621,908,752 |
|
| Net increase in net assets from operations | | $ 854,813,398 |
|
S e e n o t e s t o f i n a n c i a l s t a t e m e n t s
|
71
Tax-Managed Growth Portfolio a s o f D e c e m b e r 3 1 , 2 0 0 5
F I N A N C I A L S T A T E M E N T S C O N T’D
S t a t e m e n t s o f C h a n g e s i n N e t A s s e t s
|
| Increase (Decrease) | | Year Ended | | Year Ended |
| in Net Assets | | December 31, 2005 | | December 31, 2004 |
|
| From operations — | | | | | | | | |
| Net investment income | | $ | | 232,904,646 | | $ | | 212,033,371 |
| Net realized gain from investment | | | | | | | | |
| transactions, securities sold short | | | | | | | | |
| and foreign currency transactions | | | | 70,889,149 | | | | 152,422,840 |
| Net change in unrealized | | | | | | | | |
| appreciation (depreciation) | | | | | | | | |
| of investments, securities sold | | | | | | | | |
| short and foreign currency | | | | 551,019,603 | | | | 1,317,878,707 |
|
| Net increase in net assets from operations | | $ | | 854,813,398 | | $ | | 1,682,334,918 |
|
| Capital transactions — | | | | | | | | |
| Contributions | | $ | | 1,237,495,815 | | $ | | 1,775,098,351 |
| Withdrawals | | | | (2,200,844,762) | | | | (1,925,879,872) |
|
| Net decrease in net assets from | | | | | | | | |
| capital transactions | | $ | | (963,348,947) | | $ | | (150,781,521) |
|
| Net increase (decrease) in net assets | | $ | | (108,535,549) | | $ | | 1,531,553,397 |
|
| Net Assets | | | | | | | | |
|
| At beginning of year | | $19,141,142,402 | | $17,609,589,005 |
|
| At end of year | | $19,032,606,853 | | $19,141,142,402 |
|
S e e n o t e s t o f i n a n c i a l s t a t e m e n t s
72
Tax-Managed Growth Portfolio a s o f D e c e m b e r 3 1 , 2 0 0 5
F I N A N C I A L S T A T E M E N T S C O N T’D
S u p p l e m e n t a r y D a t a
|
| | | Year Ended December 31, |
| |
|
| | | 2005 | | 2004 | | 2003 | | 2002 | | 2001 |
|
| Ratios/Supplemental Data | | | | | | | | | | |
|
| Ratios (As a percentage of average daily net assets): | | | | | | | | | | |
| Expenses | | 0.45%† | | 0.45%† | | 0.45% | | 0.45% | | 0.45% |
| Expenses after custodian fee reduction | | 0.45%† | | 0.45%† | | — | | — | | — |
| Net investment income | | 1.25%† | | 1.18%† | | 1.05% | | 0.85% | | 0.64% |
| Portfolio Turnover | | 0%(1) | | 3% | | 15% | | 23% | | 18% |
|
| Total Return | | 4.70% | | 9.67% | | 23.88% | | (19.52)% | | (9.67)% |
|
| Net assets, end of year (000’s omitted) | | $19,032,607 | | $19,141,142 | | $17,609,589 | | $14,571,522 | | $18,335,865 |
|
| † | | The operating expenses of the Portfolio reflect a reduction of theinvestment adviser fee.Had such action not been taken, the ratios would have changed by less than 0.005%. |
| | |
| (1) | | Amounts to less than 1%. |
S e e n o t e s t o f i n a n c i a l s t a t e m e n t s
|
73
Tax-Managed Growth Portfolio a s o f D e c e m b e r 3 1 , 2 0 0 5
N O T E S T O F I N A N C I A L S T A T E M E N T S
|
1 Significant Accounting Policies
Tax-Managed Growth Portfolio (the Portfolio) is registered under the Investment Company Act of 1940, as amended, as a diversified, open-end managementinvestment company. The Portfolio, which was organized as a trust under the laws of the State of New York on December 1, 1995, seeks to achieve long-term, after-tax returns for its interestholders throughinvesting in a diversified portfolio of equity securities. The Declaration of Trust permits the Trustees to issue interests in the Portfolio. The following is summary of significant accounting policies consistently followed by the Portfolio in the preparation of its financial statements. The policies are in conformity with accounting principles generally accepted in the United States of America.
AInvestment Valuations -- Securities listed on a U.S. securities exchange generally are valued at the last sale price on the day of valuation or, if no sales took place on such date, at the mean between the closing bid and asked prices therefore on the exchange where such securities are principally traded. Equity securities listed on the NASDAQ National Market System generally are valued at the official NASDAQ closing price. Unlisted or listed securities for which closing sales prices or closing quotations are not available are valued at the mean between the latest available bid and asked prices or, in the case of preferred equity securities that are not listed or traded in the over-the-counter market, by an independent pricing service. Exchange-traded options are valued at the last sale price for the day of valuation as quoted on the principal exchange or board of trade on which the options are traded or, in the absence of sales on such date, at the mean between the latest bid and asked prices therefore. Futures positions on securities and currencies generally are valued at closing settlement prices. Short-term debt securities with a remaining maturity of 60 days or less are valued at amortized cost. If short-term debt securities were acquired with a remaining maturity of more than 60 days, their amortized cost value will be based on their value on the sixty-first day prior to maturity. Other fixed income and debt securities, including listed securities and securities for which price quotations are available, will normally be valued on the basis of valuations furnished by a pricing service. Foreign securities and currencies are valuedin U.S. dollars, based on foreign currency exchange rate quotations supplied by an independent quotat< /FONT>ion service. The daily valuation of exchange-traded foreign securities generally is determined as of the close of trading on the principal exchange on which such securities trade. Events occurring after the close of trading on foreign exchanges may result in adjustments to the valuation of foreign securities to more accurately reflect their fair value as of the close of regular trading on the New York Stock Exchange. When valuing foreign equity securities that meet certain criteria, the Trustees have approved the use of a fair value service that values such securities to reflect market trading that occurs after the close of the applicable foreign markets of comparable securities or otherinstruments that have a strong correlation to the fair-valued securities. Investments held by the Portfolio for which valuations or market quotations are unavailable are valued at fair value using methods determinedin good faith by or at the direction of the Trustees of the Portfolio considering relevant factors, data and information including the market value of freely tradable securities of the same class in the principal market on which such securities are normally traded.
BIncome Taxes -- The Portfolio is treated as a partnership for federal tax purposes. No provisionis made by the Portfolio for federal or state taxes on any taxableincome of the Portfolio because eachinvestorin the Portfoliois ultimately responsible for the payment of any taxes onits share of such taxableincome. Since some of the Portfolio’sinvestors are regulatedinvestment companies thatinvest all or substantially all of their assetsin the Portfolio, the Portfolio normally must satisfy the applicable source ofincome and diversification requirements (under the Internal Revenue Code)in order foritsinvestors to satisfy them. The Portfolio will allocate, at least annually amongitsinvestors, eachinvestor’s distributive share of the Portfolio’s netinvestmentincome, net realized capital gains, and any otheritems ofincome, gain, loss, deduction or credit.
CFutures Contracts -- Upon the entering of a financial futures contract, the Portfoliois required to deposit eitherin cash or securities an amount (initial margin) equal to a certain percentage of the purchase price indicated in the financial futures contract. Subsequent payments are made or received by the Portfolio (margin maintenance) each day, dependent on daily fluctuations in the value of the underlying security, and are recorded for book purposes as unrealized gains or losses by the Portfolio. The Portfolio’sinvestment in financial futures contractsis designed to hedge against anticipated future changes in the price of current or anticipated portfolio positions. Should prices move unexpectedly, the Portfolio may not achieve the anticipated benefits of the financial futures contracts and may realize a loss.
DPut Options -- Upon the purchase of a put option by the Portfolio, the premium paidis recorded as an investment, the value of which is marked-to-market daily.
74
Tax-Managed Growth Portfolio a s o f D e c e m b e r 3 1 , 2 0 0 5
N O T E S T O F I N A N C I A L S T A T E M E N T S C O N T’D
|
When a purchased option expires, the Portfolio will realize a loss in the amount of the cost of the option. When the Portfolio enters into a closing sale transaction, the Portfolio will realize a gain or loss depending on whether the sales proceeds from the closing sale transaction are greater or less than the cost of the option. When the Portfolio exercises a put option, settlement is made in cash. The risk associated with purchasing options is limited to the premium originally paid.
ESecurities Sold Short -- The Portfolio may sell a security short if it owns at least an equal amount of the security sold short or another security exchangeable for an equal amount of the security sold short in anticipation of a decline in the market price of the securities or in order to hedge portfolio positions. The Portfolio will generally borrow the security sold in order to make delivery to the buyer. Upon executing the transaction, the Portfolio records the proceeds as deposits with brokers in the Statement of Assets and Liabilities and establishes an offsetting payable for securities sold short for the securities due on settlement. The proceeds are retained by the broker as collateral for the short position. The liability is marked-to-market and the Portfolio is required to pay the lending broker any dividend or interest income earned while the short position is open. A gain or loss is recorded when the security is delivered to the broker. The Portfolio may recognize a loss on the transaction if the market value of the securities sold increases before the securities are delivered.
FForeign Currency Translation -- Investment valuations, other assets and liabilities initially expressed in foreign currencies are converted each business day into U.S. dollars based upon current exchange rates. Purchases and sales of foreign investment securities and income and expenses are converted into U.S. dollars based upon currency exchange rates prevailing on the respective dates of such transactions. Recognized gains or losses on investment transactions attributable to foreign currency exchange rates are recorded for financial statement purposes as net realized gains and losses on investments. That portion of unrealized gains and losses on investments that results from fluctuations in foreign currency exchange rates is not separately disclosed.
GIndemnifications -- Under the Portfolio's organizational documents, its officers and Trustees may be indemnified against certain liabilities and expenses arising out of the performance of their duties to the Portfolio. Interestholders in the Portfolio are jointly and severally liable for the liabilities and obligations of the Portfolioin the event that the Portfolio fails to satisfy such liabilities and obligations; provided, however, that, to the extent assets are available in the Portfolio, the Portfolio may, under certain circumstances, indemnify interestholders from and against any claim or liability to which such holder may become subject by reason of being or having been an interestholder in the Portfolio. Additionally,in the normal course of business, the Portfolio enters into agreements with service providers that may contain indemnification clauses. The Portfolio’s maximum exposure under these arrangements is unknown as this would involve future claims that may be made against the Portfolio that have not yet occurred.
HOther -- Investment transactions are accounted for on a trade-date basis. Dividend income is recorded on the ex-dividend date. However, if the ex-dividend date has passed, certain dividends from foreign securities are recorded as the Portfolio is informed of the ex-dividend date. Interest income is recorded on the accrual basis.
IExpense Reduction -- Investors Bank & Trust Company (IBT) serves as custodian of the Portfolio. Pursuant to the custodian agreement, IBT receives a fee reduced by credits which are determined based on the average daily cash balances the Portfolio maintains with IBT. All credit balances used to reduce the Portfolio’s custodian fees are reported as a reduction of expenses on the Statement of Operations. For the year ended December 31, 2005, there were $267 in credit balances used to reduce the Portfolio’s custodian fee.
JUse of Estimates -- The preparation of the financial statements in conformity with accounting principles generally accepted in the United States of America requires management to make estimates and assumptions that affect the reported amounts of assets and liabilities at the date of the financial statements and the reported amounts of income and expense during the reporting period. Actual results could differ from those estimates.
2 Investment Adviser Fee and Other Transactions with Affiliates
The investment adviser fee is earned by Boston Management and Research (BMR), a wholly-owned subsidiary of Eaton Vance Management (EVM), as compensation for management and investment advisory services rendered to the Portfolio. Under the advisory agreement, BMR receives a monthly advisory fee of 5/96 of 1% (0.625% annually) of the average daily net assets of the Portfolio up to $500,000,000, and at reduced rates as daily net assets exceed that level. Certain of the advisory fee rate reductions are pursuant to an agreement between
75
Tax-Managed Growth Portfolio a s o f D e c e m b e r 3 1 , 2 0 0 5
N O T E S T O F I N A N C I A L S T A T E M E N T S C O N T’D
|
the Portfolio’s Board of Trustees and BMR. Those reductions may not be changed without Trustee andinterestholder approval. For the year ended December 31, 2005, the advisory fee was 0.43% of the Portfolio’s average daily net assets. BMR has also agreed to reduce theinvestment adviser fee by an amount equal to that portion of commissions paid to broker dealersin execution of Portfolio security transactions thatis consideration for third-party research services. For the year ended December 31, 2005, BMR waived $88,889 ofits advisory fee. Except for Trustees of the Portfolio who are not members of EVM’s or BMR’s organization, officers and Trustees receive remuneration for their services to the Portfolio out of suchinvestment adviser fee. Trustees of the Portfolio that are not affiliated with theinvestment adviser may elect to defer receipt of all or a percentage of their annual feesin accordance with the terms of the Trustees Deferred Compensation Plan. For the year ended December 31, 2005, no significant amounts have been deferred.
Certain officers and Trustees of the Portfolio are officers of the above organizations.
3 Investment Transactions
For the year ended December 31, 2005, purchases and sales ofinvestments, other than short-term obligations, aggregated $58,765,480 and $774,871,275, respectively. In addition,investments having an aggregate market value of $1,057,904,697 at dates of withdrawal were distributedin payment for capital withdrawals andinvestors contributed securities with a value of $1,009,478,984, during the year ended December 31, 2005.
4 Federal Income Tax Basis of UnrealizedAppreciation (Depreciation)
The cost and unrealized appreciation (depreciation)in value of theinvestments owned at December 31, 2005 as computed on a federalincome tax basis, were as follows:
| Aggregate cost | | $ 4,152,013,829 |
|
| Gross unrealized appreciation | | $14,819,049,235 |
| Gross unrealized depreciation | | (1,369,871) |
|
| Net unrealized appreciation | | $14,817,679,364 |
|
Unrealized depreciation on foreign currencyis $46,328.
5 Financial Instruments
The Portfolio may tradein financialinstruments with off-balance sheet riskin the normal course ofitsinvesting activities to assistin managing exposure to various marketrisks. These financialinstrumentsinclude written options, forward foreign currency exchange contracts and financial futures contracts and mayinvolve, to a varying degree, elements of riskin excess of the amounts recognized for financial statement purposes.
The notional or contractual amounts of theseinstruments represent theinvestment the Portfolio hasin particular classes of financialinstruments and does not necessarily represent the amounts potentially subject to risk. The measurement of the risks associated with theseinstrumentsis meaningful only when all related and offsetting transactions are considered. The Portfolio did not have any open obligations under these financialinstruments at December 31, 2005.
6 Line of Credit
The Portfolio participates with other portfolios and funds managed by BMR and EVM andits affiliatesin a $150 million unsecured line of credit agreement with a group of banks. Borrowings will be made by the Portfolio solely to facilitate the handling of unusual and/or unanticipated short-term cash requirements. Interestis charged to each participating portfolio or fund based onits borrowings at an amount above either the Eurodollar rate or Federal Funds rate. In addition, a fee computed at an annual rate of 0.10% on the daily unused portion of the line of creditis allocated among the participating portfolios and funds at the end of each quarter. At December 31, 2005 the Portfolio had a balance outstanding pursuant to this line of credit of $8,000,000. The Portfolio did not have any significant borrowings or allocated fees during the year ended December 31, 2005.
7 Restricted Securities
At December 31, 2005, the Portfolio owned the following securities (representing 0.03% of net assets) which were restricted as to public resale and not registered under the Securities Act of 1933.The securities are valued at fair value using methods determinedin good faith by or at the direction of the Trustees.
| | | Date of | | Eligible | | | | | | |
| Common Stocks | | Acquisition | | for Resale | | Shares | | Cost | | Fair Value |
|
| Caterpillar, Inc. | | 2/17/05 | | 2/18/06 | | 34,186 | | $1,580,520 | | $1,974,662 |
| Progressive Corp. | | 10/14/05 | | 10/15/06 | | 9,470 | | 1,031,533 | | 1,104,524 |
| Sysco Corp. | | 5/19/05 | | 5/20/06 | | 60,000 | | 2,220,777 | | 1,862,224 |
|
| | | | | | | | | $4,832,830 | | $4,941,410 |
|
76
Tax-Managed Growth Portfolio a s o f D e c e m b e r 3 1 , 2 0 0 5
REPORT OF INDEPENDENT REGISTERED PUBLIC ACCOUNTING FIRM
|
To the Trustees and Investors of Tax-Managed Growth Portfolio:
We have audited the accompanying statement of assets and liabilities of Tax-Managed Growth Portfolio (the Portfolio),including the portfolio ofinvestments, as of December 31, 2005, and the related statement of operations for the year then ended, the statements of changesin net assets for each of the two yearsin the period then ended, and the supplementary data for each of the five yearsin the period then ended. These financial statements and supplementary data are the responsibility of the Portfolio’s management. Our responsibilityis to express an opinion on these financial statements and supplementary data based on our audits.
We conducted our auditsin accordance with the standards of the Public Company Accounting Oversight Board (United States). Those standards require that we plan and perform the audits to obtain reasonable assurance about whether the financial statements and supplementary data are free of material misstatement. The Portfoliois not required to have, nor were we engaged to perform, an audit ofitsinternal control over financial reporting. Our auditsincluded consideration ofinternal control over financial reporting as a basis for designing audit procedures that are appropriatein the circumstances, but not for the purpose of expressing an opinion on the effectiveness of the Portfolio’sinternal control over financial reporting. Accordingly, we express no such opinion. An audit alsoincludes examining, on a test basis, evidence supporting the amounts and disclosuresin the financial statements, assessing the accounting principles used and significant estimates made by management, as well as evaluating the overall financial statement presentation. Our proceduresincluded confirmation of securities owned as of December 31, 2005 by correspondence with the custodian and brokers; where replies were not received from brokers, we performed other auditing procedures. We believe that our audits provide a reasonable basis for our opinion.
In our opinion, such financial statements and supplementary data referred to above present fairly,in all material respects, the financial position of Tax-Managed Growth Portfolio as of December 31, 2005, the results ofits operations for the year then ended, the changesinits net assets for each of the two yearsin the period then ended, and the supplementary data for each of the five yearsin the period then ended,in conformity with accounting principles generally acceptedin the United States of America.
DELOITTE & TOUCHE LLP
Boston, Massachusetts
February 17, 2006
|
77
Belrose Capital Fund LLC
Investment Adviser of
Tax-Managed Growth Portfolio and Belrose Capital Fund LLC
| | Boston Management and Research
The Eaton Vance Building
255 State Street
Boston, MA 02109
|
Manager of Belrose Realty Corporation
| | Boston Management and Research
The Eaton Vance Building
255 State Street
Boston, MA 02109
|
Manager of Belrose Capital Fund LLC
| | Eaton Vance Management
The Eaton Vance Building
255 State Street
Boston, MA 02109
|
| | Custodian and Transfer Agent
Investors Bank & Trust Company
200 Clarendon Street
Boston, MA 02116
|
Independent Registered Public Accounting Firm
| | Deloitte & Touche LLP
200 Berkeley Street
Boston, MA 02116
|
78
Pursuant to the requirements of Section 13 or 15(d) of the Securities Exchange Act of 1934, the registrant has duly caused this report to be signed on its behalf by the undersigned, thereunto duly authorized.
| BELROSE CAPITAL FUND LLC |
| (Registrant) |
| |
| By: | | /s/ Michelle A. Green |
| | | Michelle A. Green |
| | | Duly Authorized Officer and |
| | | Principal Accounting Officer |
Pursuant to the requirements of the Securities Exchange Act of 1934, this report has been signed below by the following persons on behalf of the registrant and in the capacities and on the dates indicated.
| By: | | /s/ Thomas E. Faust Jr. |
| | | Thomas E. Faust Jr. |
| | | Chief Executive Officer |
| By: | | /s/ Michelle A. Green |
| | | Michelle A. Green |
| | | Chief Financial Officer |
79
EXHIBIT INDEX
| Exhibit No. | | Description |
| | |
| 3 | | Copy of Limited Liability Company Agreement of the Fund dated December 5, 2001 filed as Exhibit 3 to |
| | | the Fund’s Initial Registration Statement on Form 10 and incorporated herein by reference. (Note: the |
| | | LLC Agreement also defines the rights of the holders of Shares of the Fund.) |
| |
| 4.1 | | Copy of Loan and Security Agreement between the Fund and DrKW Holdings, Inc. dated as of June 30, |
| | | 2003 filed as Exhibit 4.1 to the Fund’s Form 10-Q filed for the period ended June 30, 2003 and |
| | | incorporated herein by reference. |
| | |
| 4.1(a) | | Copy of Amendment No. 1 to Loan and Security Agreement between the Fund and DrKW Holdings, Inc. |
| | | dated September 29, 2003 filed as Exhibit 4.1(a) to the Fund’s Form 10-Q filed for the period ended |
| | | September 30, 2003 and incorporated herein by reference. |
| | |
| 4.1(b) | | Copy of Amendment No. 2 to Loan and Security Agreement between the Fund and DrKW Holdings, Inc. dated March 16, 2004 filed as Exhibit 4.1(b) to the Fund’s Form 10-Q filed for the period ended March 31, 2004 and incorporated herein by reference. |
| | |
| | |
| | |
| 4.1(c) | | Copy of Amendment No. 3 to Loan and Security Agreement between the Fund and DrKW Holdings, Inc. |
| | | dated December 15, 2005 filed herewith. |
| | |
| 4.1(d) | | Copy of Amendment No. 4 to Loan and Security Agreement between the Fund and DrKW Holdings, Inc. |
| | | dated December 15, 2005 filed herewith. |
| | |
| 4.2 | | Copy of Loan and Security Agreement among the Fund, Merrill Lynch Mortgage Capital, Inc., the lenders |
| | | referred to therein and Merrill Lynch Capital Services, Inc., dated June 30, 2003 filed as Exhibit 4.2 to the |
| | | Fund’s Form 10-Q for the period ended June 30, 2003 and incorporated herein by reference. |
| | |
| 4.2(a) | | Copy of Amendment No. 1 to Loan and Security Agreement among the Fund, Merrill Lynch Mortgage |
| | | Capital, Inc., as Agent, the Lenders referred to therein and Merrill Lynch Capital Services, Inc. dated |
| | | September 29, 2003 filed as Exhibit 4.2(a) to the Fund’s Form 10-Q for the period ended September 30, |
| | | 2003 and incorporated herein by reference. |
| | |
| 4.2(b) | | Copy of Amendment No. 2 to Loan and Security Agreement among the Fund, Merrill Lynch Mortgage
Capital, Inc., as Agent, the Lenders referred to therein and Merrill Lynch Capital Services, Inc. dated
August 3, 2004 filed as Exhibit 4.2(b) to the Fund’s Form 10-Q for the period ended September 30, 2004 and incorporated herein by reference. |
| | |
| | |
| | |
| 4.2(c) | | Copy of Amendment No. 3 to Loan and Security Agreement among the Fund, Merrill Lynch Morgage |
| | | Capital, Inc., as Agent, the lenders referred to therein and Merrill Lynch Capital Services, Inc. dated |
| | | October 14, 2005 filed herewith. |
| | |
| 4.2(d) | | Copy of Amendment No. 4 to Loan and Security Agreement among the Fund, Merrill Lynch Morgage |
| | | Capital, Inc., as Agent, the lenders referred to therein and Merrill Lynch Capital Services, Inc. dated |
| | | December 15, 2005 filed herewith. |
| | |
| 10(1) | | Copy of Investment Advisory and Administration Agreement between the Fund and Boston Management |
| | | and Research dated March 7, 2001 filed as Exhibit 10(1) to the Fund’s Initial Registration Statement on |
| | | Form 10 and incorporated herein by reference. |
| | |
| 10(2) | | Copy of Management Agreement between Belrose Realty Corporation and Boston Management and
Research dated March 14, 2001 filed as Exhibit 10(2) to the Fund’s Initial Registration Statement on Form 10 and incorporated herein by reference. |
| | |
| | |
| 10(3) | | Copy of Investor Servicing Agreement between the Fund and Eaton Vance Distributors, Inc. dated |
| | | December 5, 2000 filed as Exhibit 10(3) the Fund’s Initial Registration Statement on Form 10 and |
| | | incorporated herein by reference. |
80
| 10(4) | | Copy of Custody and Transfer Agency Agreement between the Fund and Investors Bank & Trust
Company dated December 5, 2000 filed as Exhibit 10(4) the Fund’s Initial Registration Statement on Form 10 and incorporated herein by reference. |
| | |
| | |
| | |
| 10(4)(a) | | Copy of Amendment dated March 29, 2005 to Custody and Transfer Agency Agreement between the Fund and Investors Bank & Trust Company filed as Exhibit 10(4)(a) to the Fund’s report on Form 10-Q for the period ended June 30, 2005 and incorporated herein by reference. |
| | |
| | |
| | |
| 21 | | List of Subsidiaries of the Fund filed herewith. |
| | |
| 31.1 | | Certification Pursuant to 18 U.S.C. Section 1350, as Adopted Pursuant to Section 302 of the Sarbanes- |
| | | Oxley Act of 2002 filed herewith. |
| | |
| 31.2 | | Certification Pursuant to 18 U.S.C. Section 1350, as Adopted Pursuant to Section 302 of the Sarbanes- |
| | | Oxley Act of 2002 filed herewith. |
| | |
| 32.1 | | Certification Pursuant to 18 U.S.C. Section 1350, as Adopted Pursuant to Section 906 of the Sarbanes- |
| | | Oxley Act of 2002 filed herewith. |
| | |
| 32.2 | | Certification Pursuant to 18 U.S.C. Section 1350, as Adopted Pursuant to Section 906 of the Sarbanes- |
| | | Oxley Act of 2002 filed herewith. |
| | |
| 99.3 | | Form N-CSR of Eaton Vance Tax-Managed Growth Portfolio (File No. 811-7409) for its year ended |
| | | December 31, 2005 filed electronically with the Securities and Exchange Commission under the |
| | | Investment Company Act of 1940 on March 8, 2006 incorporated herein by reference pursuant to Rule |
| | | 12b-32. |
81