Exhibit 99.1
MITEL NETWORKS INVESTOR PRESENTATION
Rich McBee, President and Chief Executive Officer Steve Spooner, Chief Financial Officer
SAFE HARBOR STATEMENT
Forward Looking Statements
Some of the statements in this presentation are forward-looking statements (or forward-looking information) within the meaning of applicable U.S. and Canadian securities laws. These include statements using the words target, outlook, may, will, should, could, estimate, continue, expect, intend, plan, predict, potential, project and anticipate, and similar statements which do not describe the present or provide information about the past. Actual results may differ materially from those presented in forward-looking statements. Material risks that could cause actual results to differ include: our ability to achieve or sustain profitability in the future; fluctuations in our quarterly and annual revenues and operating results; fluctuations in foreign exchange rates; current and ongoing global economic instability; intense competition; our reliance on channel partners for a significant component of our sales; our dependence upon a small number of outside contract manufacturers to manufacture our products; and our ability to implement and achieve our business strategies successfully. Additional risks are described under the heading “Risk Factors” in Mitel’s Annual Report on Form 10-K. We have made assumptions regarding, among other things: no unforeseen changes occurring in the competitive landscape that would affect our industry generally or Mitel in particular; a stable or recovering economic environment; no significant event occurring outside the ordinary course of our business; and stable foreign exchange and interest rates. Forward-looking information is intended to help you understand management’s current views of our future prospects, and it may not be appropriate for other purposes. Except as required by law, Mitel will not necessarily update forward-looking statements.
Non-GAAP Financial Measurements
This presentation includes references to non-GAAP financial measures. Non-GAAP financial measures do not have any standardized meaning and are therefore unlikely to be comparable to similar measures presented by other companies. We use these non-GAAP financial measures to assist management and investors in understanding our past financial performance and prospects for the future, including changes in our operating results, trends and marketplace performance, exclusive of unusual events or factors which do not directly affect what we consider to be our core operating performance. Non-GAAP measures are among the primary indicators management uses as a basis for our planning and forecasting of future periods. Investors are cautioned that non-GAAP financial measures should not be relied upon as a substitute for financial measures prepared in accordance with generally accepted accounting principles. Please see the reconciliation of non-GAAP financial measures to the most directly comparable U.S. GAAP measure contained in Mitel’s Reports on Form 8-K which have been filed with the U.S. Securities and Exchange Commission on March 1, 2012 and March 8, 2012, respectively.
MITEL – WHO WE ARE
• A global provider of business communications and collaboration software and services
• Profitably delivering approximately $600M * of annual revenues
• Selling products in over 90 countries
• Servicing our customers through a network of over 1,600 value-added resellers and partners.
• Holding over 1600 patents
• ~1900 employees
*Revenue from continuing operations for 12 months ended 1/31/12.
WHAT WE SELL
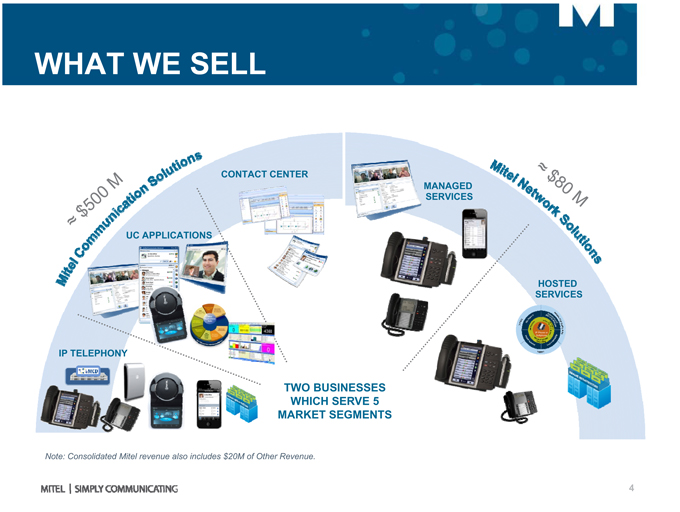
CONTACT CENTER
MANAGED SERVICES
UC APPLICATIONS
HOSTED SERVICES
IP 5330 Phone IP or Phone Softphone
IP TELEPHONY
TWO BUSINESSES WHICH SERVE 5 MARKET SEGMENTS
Note: Consolidated Mitel revenue also includes $20M of Other Revenue.
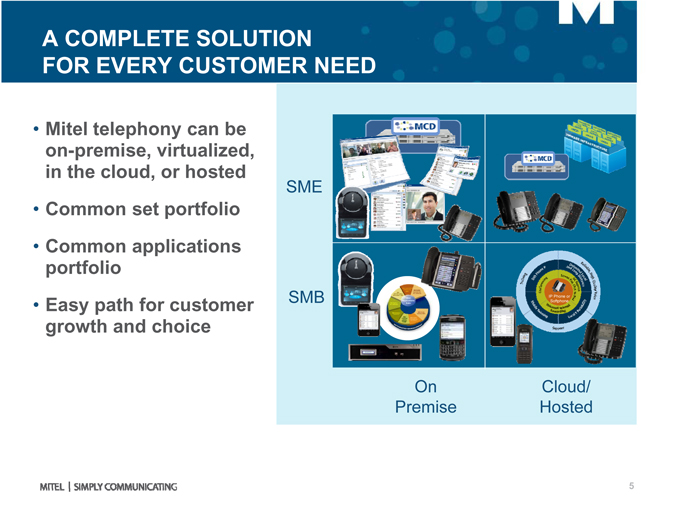
A COMPLETE SOLUTION FOR EVERY CUSTOMER NEED
• Mitel telephony can be on-premise, virtualized, in the cloud, or hosted
• Common set portfolio
• Common applications portfolio
• Easy path for customer growth and choice
SME
SMB
On Premise
Cloud/ Hosted
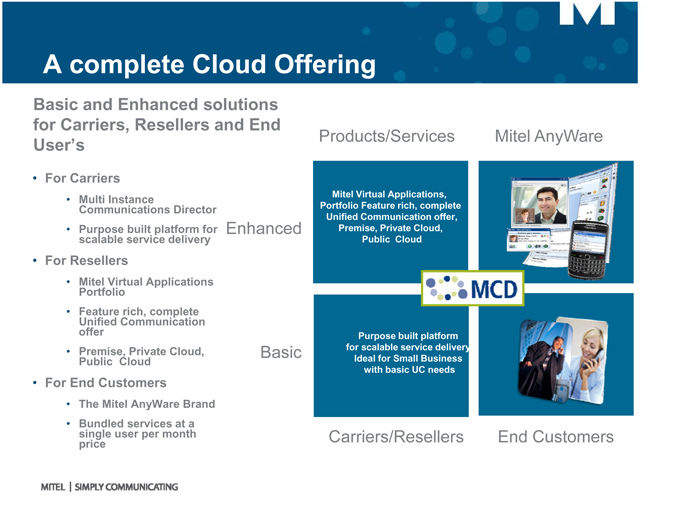
A complete Cloud Offering
Basic and Enhanced solutions for Carriers, Resellers and End User’s
• For Carriers
• Multi Communications Instance Director
• scalable Purpose service built platform delivery for Enhanced
• For Resellers
• Mitel Portfolio Virtual Applications
• Feature Unified Communication rich, complete offer
• Premise, Public Cloud Private Cloud, Basic
• For End Customers
• The Mitel AnyWare Brand • single Bundled user services per month at a price
Products/Services
Mitel Virtual Applications, Portfolio Feature rich, complete Unified Communication offer, Premise, Private Cloud, Public Cloud
Purpose built platform for scalable service delivery, Ideal for Small Business with basic UC needs
Carriers/Resellers
Mitel AnyWare
End Customers
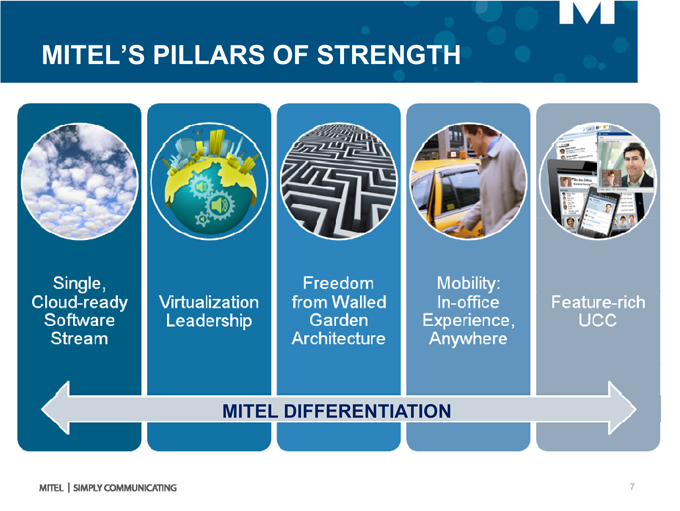
MITEL’S PILLARS OF STRENGTH
MITEL DIFFERENTIATION
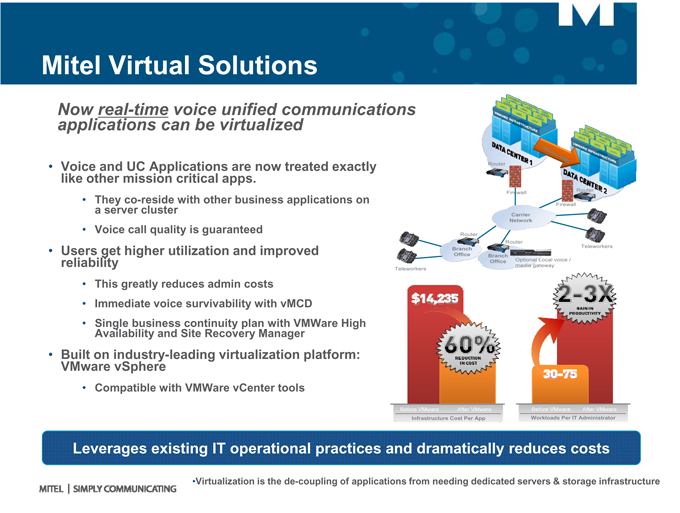
Mitel Virtual Solutions
applications Now real-time can voice be virtualized unified communications
• like Voice other and mission UC Applications critical apps. are now treated exactly
• They a server co- cluster reside with other business applications on
• Voice call quality is guaranteed
• Users reliability get higher utilization and improved
• This greatly reduces admin costs
• Immediate voice survivability with vMCD
• Availability Single business and Site continuity Recovery plan Manager with VMWare High
• VMware Built on industry vSphere-leading virtualization platform:
• Compatible with VMWare vCenter tools
Leverages existing IT operational practices and dramatically reduces costs
•Virtualization is the de-coupling of applications from needing dedicated servers & storage infrastructure
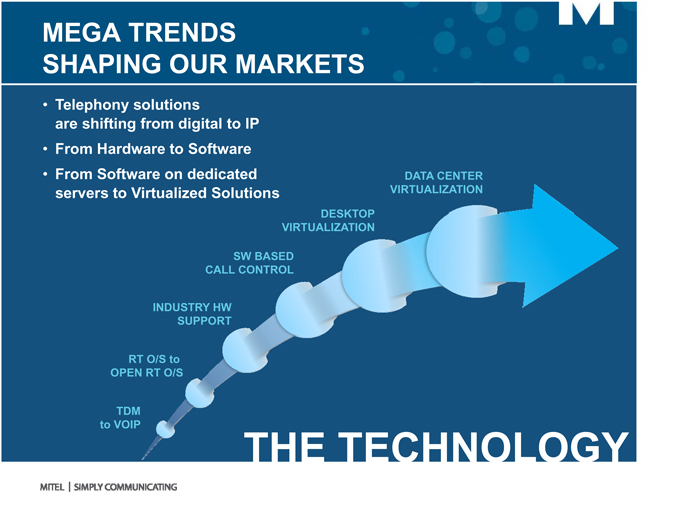
MEGA TRENDS
SHAPING OUR MARKETS
• Telephony solutions are shifting from digital to IP
• From Hardware to Software
• From Software on dedicated servers to Virtualized Solutions
TDM to VOIP
RT O/S to
OPEN RT O/S
INDUSTRY HW
SUPPORT
SW BASED
CALL CONTROL
DESKTOP
VIRTUALIZATION
DATA CENTER
VIRTUALIZATION
THE TECHNOLOGY
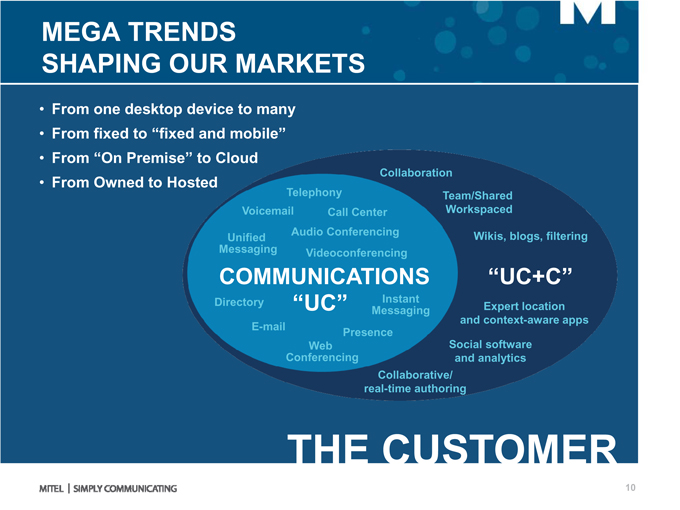
MEGA TRENDS
SHAPING OUR MARKETS
• From one desktop device to many
• From fixed to “fixed and mobile”
• From “On Premise” to Cloud
• From Owned to Hosted
Collaboration
Telephony Team/Shared Voicemail Call Center Workspaced
Audio Conferencing Wikis, blogs, filtering Unified Messaging Videoconferencing
COMMUNICATIONS “UC+C”
Directory Instant
“UC” Messaging Expert location and context-aware apps E-mail Presence Web Social software Conferencing and analytics Collaborative/ real-time authoring
THE CUSTOMER
10
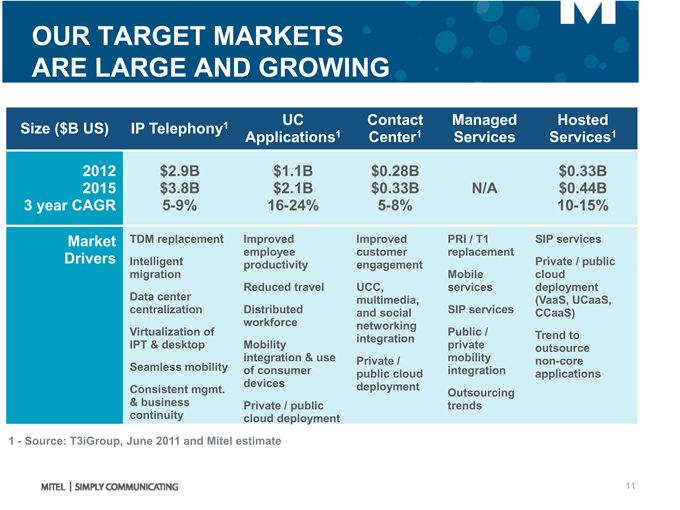
OUR TARGET MARKETS ARE LARGE AND GROWING
Size ($B US)
2012
2015
Market
Drivers
IP Telephony1
$2.9B $3.8B 5-9%
TDM replacement Intelligent migration Data center centralization Virtualization of IPT & desktop Seamless mobility Consistent mgmt. & business continuity
UC Applications1
$1.1B $2.1B
16-24%
Improved employee productivity Reduced travel Distributed workforce Mobility integration & use of consumer devices Private / public cloud deployment
Contact Center1
$0.28B $0.33B 5-8%
Improved customer engagement UCC, multimedia, and social networking integration Private / public cloud deployment
Managed Services
N/A
PRI / T1 replacement Mobile services SIP services Public / private mobility integration Outsourcing trends
Hosted Services1
$0.33B $0.44B
10-15%
SIP services Private / public cloud deployment (VaaS, UCaaS, CCaaS) Trend to outsource non-core applications
1—Source: | | T3iGroup, June 2011 and Mitel estimate |
11
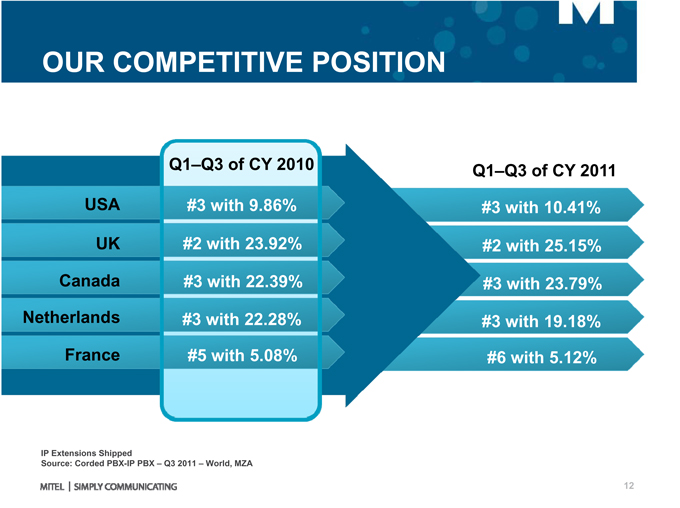
OUR COMPETITIVE POSITION
Q1–Q3 of CY 2010 USA #3 with 9.86% UK #2 with 23.92% Canada #3 with 22.39%
Netherlands #3 with 22.28% France #5 with 5.08%
Q1–Q3 of CY 2011 #3 with 10.41% #2 with 25.15% #3 with 23.79% #3 with 19.18% #6 with 5.12%
IP Extensions Shipped
Source: Corded PBX-IP PBX – Q3 2011 – World, MZA
12
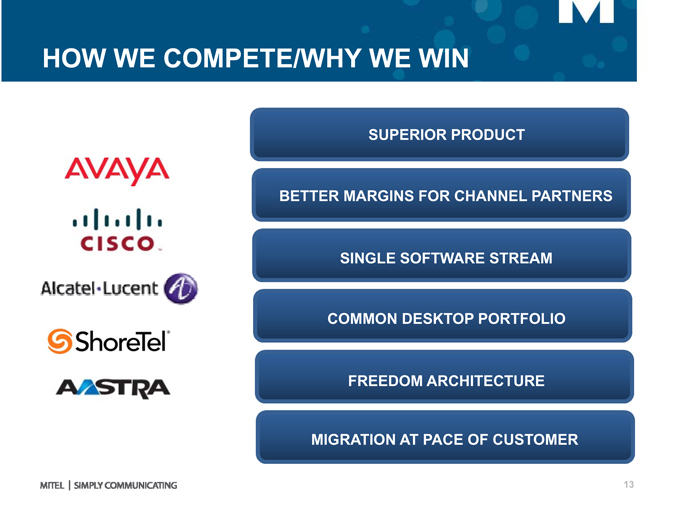
HOW WE COMPETE/WHY WE WIN
SUPERIOR PRODUCT
BETTER MARGINS FOR CHANNEL PARTNERS
SINGLE SOFTWARE STREAM
COMMON DESKTOP PORTFOLIO
FREEDOM ARCHITECTURE
MIGRATION AT PACE OF CUSTOMER
13
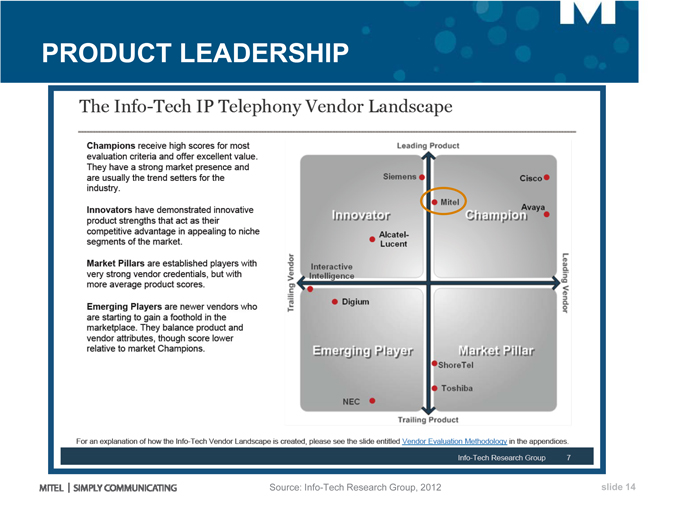
PRODUCT LEADERSHIP
Source: Info-Tech Research Group, 2012
slide 14
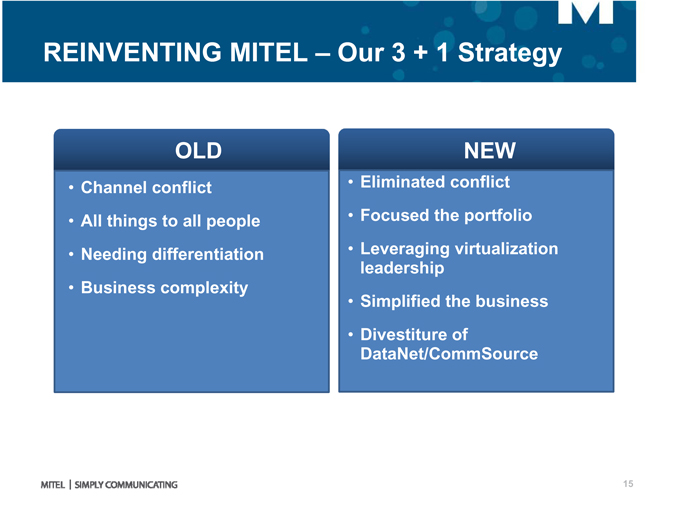
REINVENTING MITEL – Our 3 + 1 Strategy
OLD
• Channel conflict
• All things to all people
• Needing differentiation
• Business complexity
NEW
• Eliminated conflict
• Focused the portfolio
• Leveraging virtualization leadership
• Simplified the business
• Divestiture of DataNet/CommSource
15
HOW WE WILL DRIVE GROWTH
• Focus on the SMB and SME
• Product excellence
• Ageing installed base
• Channel enhancement
• Direct to Direct touch
• Geographic Expansion
• Leadership in Virtualization
• Improved execution in our US market
16
INVESTMENT THESIS
• Focused Strategy on the SMB and SME
• Large markets that are growing
• Superior portfolio which is broad and deep
• Operationally disciplined to deliver profitable growth in a leveraged business model
17
PROFITABLE GROWTH &
SHAREHOLDER VALUE CREATION
Steve Spooner, CFO
DRIVING TOP-LINE GROWTH
• Leveraging market share leadership in core markets
• Deploying a proven go-to-market model in US region
• Upgrading sales leadership
• Recruiting/on-boarding mid-market channel
• Focused strategies in emerging markets
• Capitalizing on portfolio strengths
• Enhancing our brand
19
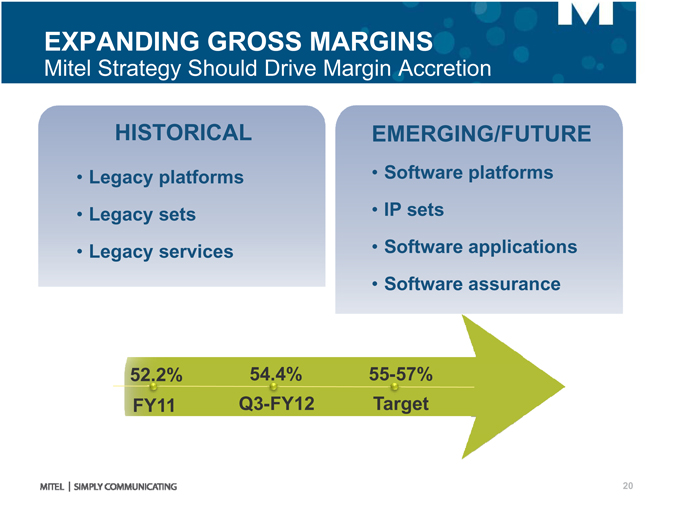
EXPANDING GROSS MARGINS
Mitel Strategy Should Drive Margin Accretion
HISTORICAL
• Legacy platforms
• Legacy sets
• Legacy services
EMERGING/FUTURE
• Software platforms
• IP sets
• Software applications
• Software assurance
52.2% 54.4% 55-57% FY11 Q3-FY12 Target
20
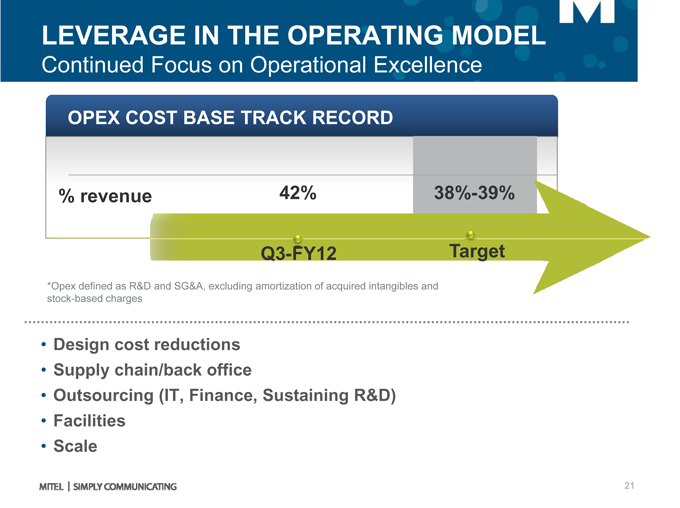
LEVERAGE IN THE OPERATING MODEL
Continued Focus on Operational Excellence
OPEX COST BASE TRACK RECORD
% revenue 42% 38%-39%
Q3-FY12 Target
*Opex defined as R&D and SG&A, excluding amortization of acquired intangibles and stock-based charges
• Design cost reductions
• Supply chain/back office
• Outsourcing (IT, Finance, Sustaining R&D)
• Facilities
• Scale
21
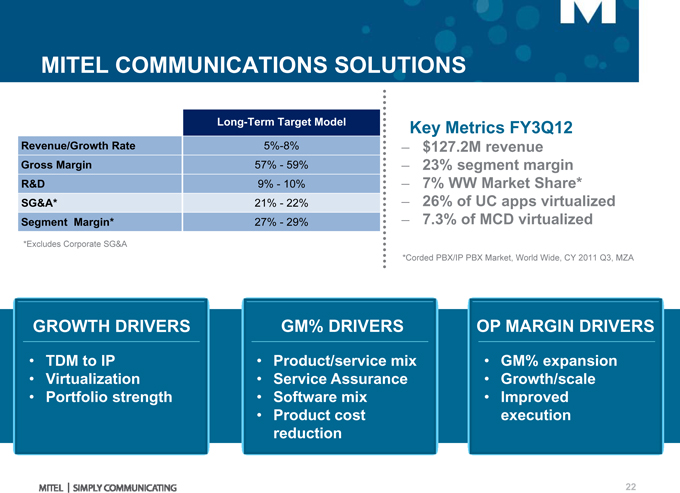
MITEL COMMUNICATIONS SOLUTIONS
Long-Term Target Model Revenue/Growth Rate 5%-8% Gross Margin 57%—59%
R&D 9%—10% SG&A* 21%—22%
Segment Margin* 27%—29%
*Excludes Corporate SG&A
Key Metrics FY3Q12
$127.2M revenue
23% segment margin
7% WW Market Share*
26% of UC apps virtualized
7.3% of MCD virtualized
*Corded PBX/IP PBX Market, World Wide, CY 2011 Q3, MZA
GROWTH DRIVERS
• TDM to IP
• Virtualization
• Portfolio strength
GM% DRIVERS
• Product/service mix
• Service Assurance
• Software mix
• Product cost reduction
OP MARGIN DRIVERS
• GM% expansion
• Growth/scale
• Improved execution
22
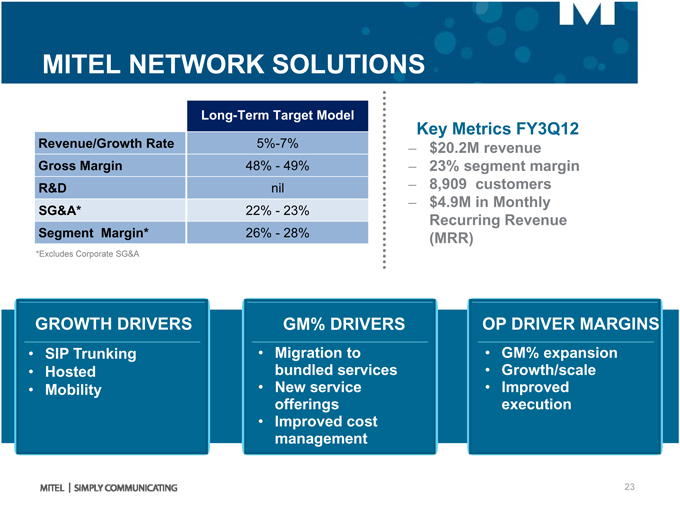
MITEL NETWORK SOLUTIONS
Long-Term Target Model Revenue/Growth Rate 5%-7% Gross Margin 48%—49% R&D nil
SG&A* 22%—23%
Segment Margin* 26%—28%
*Excludes Corporate SG&A
Key Metrics FY3Q12
$20.2M revenue
23% segment margin
8,909 customers
$4.9M in Monthly Recurring Revenue (MRR)
GROWTH DRIVERS
• SIP Trunking
• Hosted
• Mobility
GM% DRIVERS
• Migration to bundled services
• New service offerings
• Improved cost management
OP DRIVER MARGINS
• GM% expansion
• Growth/scale
• Improved execution
23
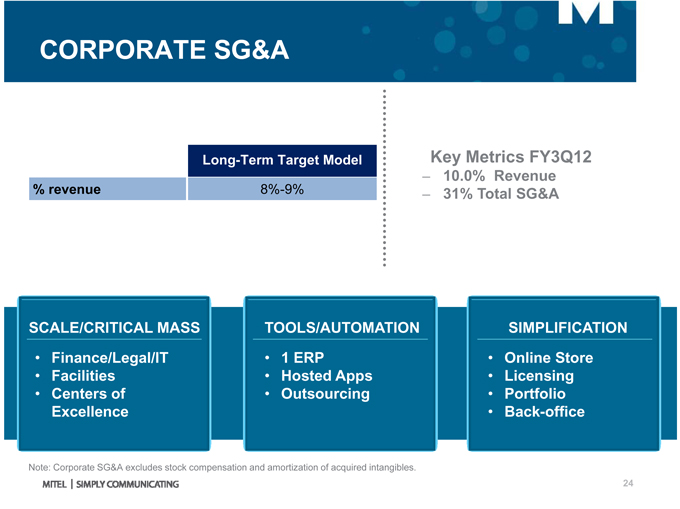
CORPORATE SG&A
Long-Term Target Model % revenue 8%-9%
Key Metrics FY3Q12
10.0% Revenue
31% Total SG&A
SCALE/CRITICAL MASS
• Finance/Legal/IT
• Facilities
• Centers of Excellence
TOOLS/AUTOMATION
• Hosted Apps
• Outsourcing
SIMPLIFICATION
• Online Store
• Licensing
• Portfolio
• Back-office
Note: Corporate SG&A excludes stock compensation and amortization of acquired intangibles.
24
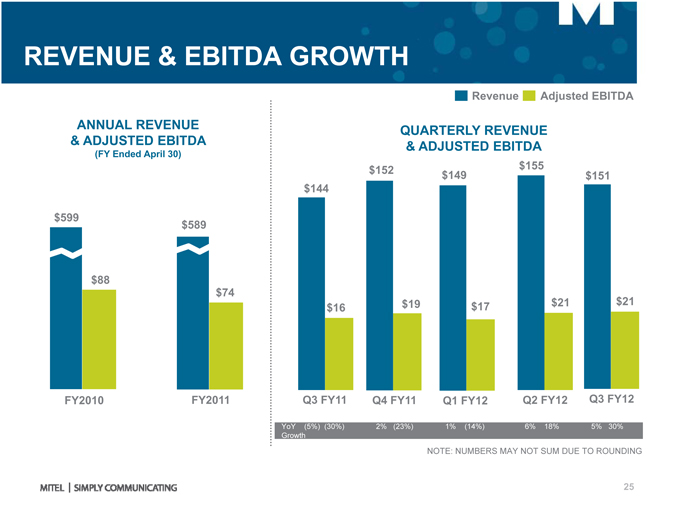
REVENUE & EBITDA GROWTH
ANNUAL REVENUE
& ADJUSTED EBITDA
(FY Ended April 30)
$599 $589
$88 $74
FY2010 FY2011
Revenue Adjusted EBITDA
QUARTERLY REVENUE
& ADJUSTED EBITDA
$152 $155 $149 $151 $144
$19 $21 $21
$16 $17
Q3 FY11 Q4 FY11 Q1 FY12 Q2 FY12 Q3 FY12
YoY (5%) (30%) 2% (23%) 1% (14%) 6% 18% 5% 30% Growth NOTE: NUMBERS MAY NOT SUM DUE TO ROUNDING
25
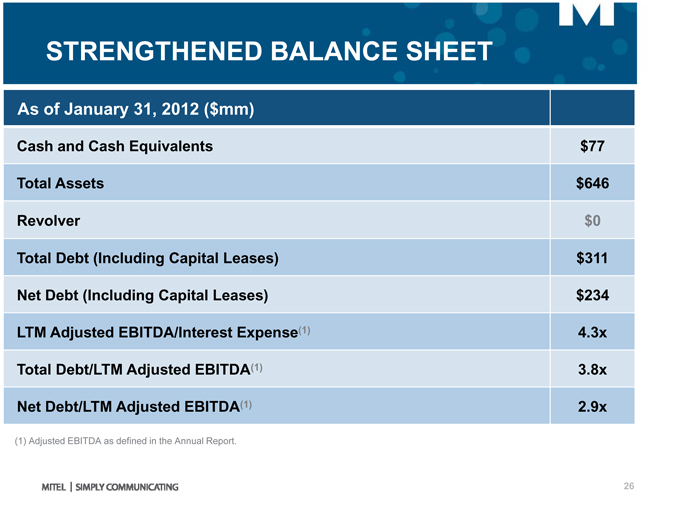
STRENGTHENED BALANCE SHEET
As of January 31, 2012 ($mm)
Cash and Cash Equivalents $77 Total Assets $646 Revolver $0 Total Debt (Including Capital Leases) $311 Net Debt (Including Capital Leases) $234 LTM Adjusted EBITDA/Interest Expense(1) 4.3x Total Debt/LTM Adjusted EBITDA(1) 3.8x Net Debt/LTM Adjusted EBITDA(1) 2.9x
(1) | | Adjusted EBITDA as defined in the Annual Report. |
26
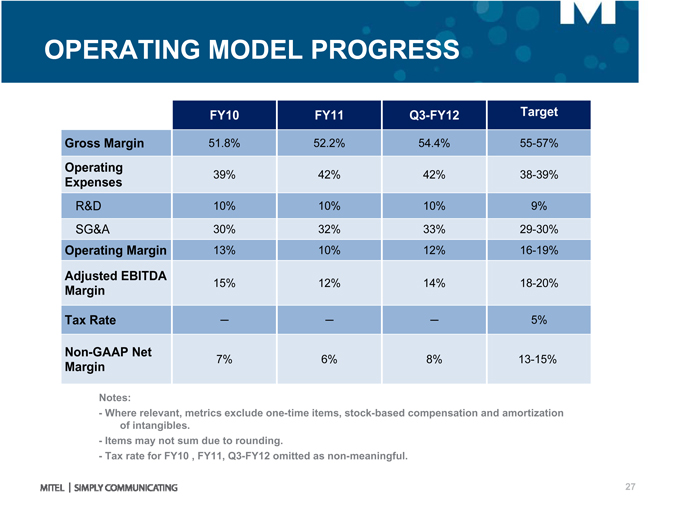
OPERATING MODEL PROGRESS
FY10 FY11 Q3-FY12 Target Gross Margin 51.8% 52.2% 54.4% 55-57%
Operating
39% 42% 42% 38-39%
Expenses
R&D 10% 10% 10% 9% SG&A 30% 32% 33% 29-30% Operating Margin 13% 10% 12% 16-19%
Adjusted EBITDA
15% 12% 14% 18-20%
Margin
Tax Rate ? ? ? 5%
Non-GAAP Net
7% 6% 8% 13-15%
Margin
Notes:
- Where relevant, metrics exclude one-time items, stock-based compensation and amortization of intangibles.
- Items may not sum due to rounding.
- Tax rate for FY10 , FY11, Q3-FY12 omitted as non-meaningful.
27
CREATING SHAREHOLDER VALUE
Driving top line growth
Commitment to innovation
Expanding gross margins/operating leverage
Debt reduction
Liquidity/investor base/analyst coverage

THANK YOU
VISIT WWW.MITEL.COM FOR MORE INFO
The information conveyed in this presentation, including oral comments and written materials, is confidential and proprietary to Mitel® and is intended solely for Mitel employees and members of Mitel’s reseller channel. If you are not a Mitel employee or a Mitel authorized PARTNER, you are not the intended recipient of this information and are not invited to the conference, and cannot participate in or listen to and/or view the presentation. Please delete or return any related material. Mitel will enforce its rights to protect its confidential and proprietary information, and failure to comply with the foregoing may result in legal action against you or your company.