Exhibit 99.1
Mitel –
Positioned for Profitable Growth
Financial Analyst Presentation
September 19th, 2013

Mitel –
Positioned for Profitable Growth
Steve Spooner
Chief Financial Officer

The Mitel Management Team
Presenters Panelists
Rich McBee Joe Vitalone
President and CEO EVP Americas
Steve Spooner Graham Bevington
Chief Financial Officer EVP International
Ron Wellard, EVP & GM Martyn Etherington
Communications Solutions EVP & Chief Marketing Officer
Jon Brinton, GM Jim Davies
Cloud and Network Solutions Chief Technology Officer
Attendees:
Mike McCarthy Amy MacLeod
Vice President, Investor Relations Director, Corporate Communications
4
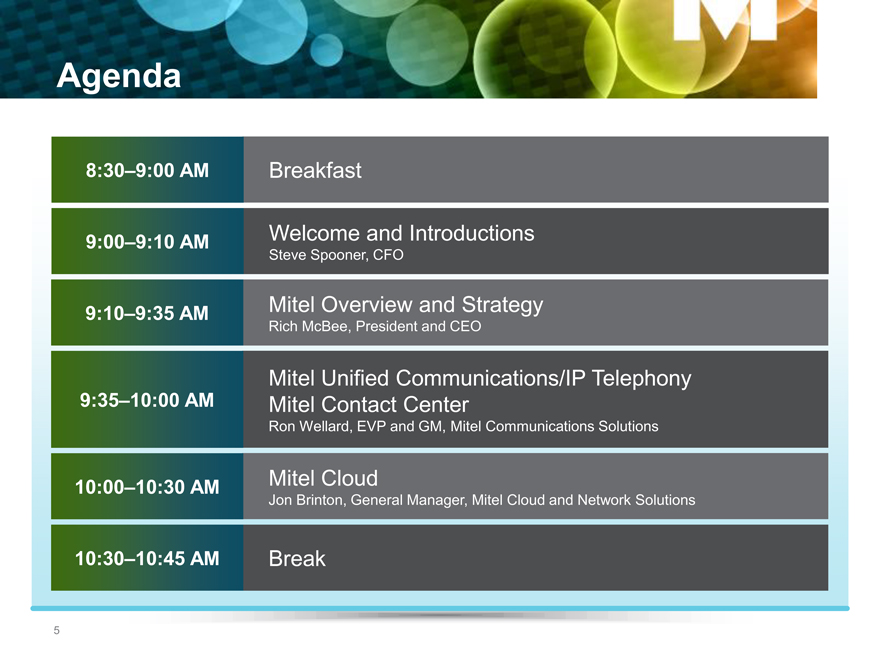
Agenda
8:30–9:00 AM Breakfast
9:00–9:10 AM Welcome and Introductions
Steve Spooner, CFO
9:10–9:35 AM Mitel Overview and Strategy
Rich McBee, President and CEO
Mitel Unified Communications/IP Telephony
9:35–10:00 AM Mitel Contact Center
Ron Wellard, EVP and GM, Mitel Communications Solutions
10:00–10:30 AM Mitel Cloud
Jon Brinton, General Manager, Mitel Cloud and Network Solutions
10:30–10:45 AM Break
5

Agenda
Voice of the Customer Panel:
10:45–11:10 AM Moderator: Joe Vitalone, EVP Americas Almin Surani, CIO, Canadian Red Cross
Erin Ostler Director of Global Wholesale Kevin Portillo, IT Director, Kaplan
and Emerging Solutions, Sprint International Colleges
Mitel Go-to-Market Panel
10:45–11:10 AM Moderator: Steve Spooner, CFO Martyn Etherington, CMO
Graham Bevington, EVP International Joe Vitalone, EVP Americas
11:30–12:00 PM Financial Update
Steve Spooner, CFO
12:00–12:30 PM Executive Q&A
Mitel Management Team
12:30–1:00 PM Lunch
6
Safe Harbor Statement
Forward Looking Statements
Some of the statements in this presentation are forward-looking statements (or forward-looking information) within the meaning of applicable U.S. and Canadian securities laws. These include statements using the words target, outlook, may, will, should, could, estimate, continue, expect, intend, plan, predict, potential, project and anticipate, and similar statements which do not describe the present or provide information about the past. Actual results may differ materially from those presented in forward-looking statements. Material risks that could cause actual results to differ include: our ability to achieve or sustain profitability in the future; fluctuations in our quarterly and annual revenues and operating results; fluctuations in foreign exchange rates; current and ongoing global economic instability; intense competition; our reliance on channel partners for a significant component of our sales; our dependence upon a small number of outside contract manufacturers to manufacture our products; our ability to successfully integrate acquisitions; and, our ability to implement and achieve our business strategies successfully. Additional risks are described under the heading “Risk Factors” in Mitel’s Annual Report on Form 10-K. We have made assumptions regarding, among other things: no unforeseen changes occurring in the competitive landscape that would affect our industry generally or Mitel in particular; a stable or recovering economic environment; no significant event occurring outside the ordinary course of our business; and, stable foreign exchange and interest rates. Forward-looking information is intended to help you understand management’s current views of our future prospects, and it may not be appropriate for other purposes. Except as required by law, Mitel will not necessarily update forward-looking statements.
Non-GAAP Financial Measurements
This presentation includes references to non-GAAP financial measures including adjusted EBITDA, non-GAAP income and non-GAAP operating expenses. Non-GAAP financial measures do not have any standardized meaning and are therefore unlikely to be comparable to similar measures presented by other companies. We use these non-GAAP financial measures to assist management and investors in understanding our past financial performance and prospects for the future, including changes in our operating results, trends and marketplace performance, exclusive of unusual events or factors which do not directly affect what we consider to be our core operating performance. Non-GAAP measures are among the primary indicators management uses as a basis for our planning and forecasting of future periods. Investors are cautioned that non-GAAP financial measures should not be relied upon as a substitute for financial measures prepared in accordance with generally accepted accounting principles. Please see the reconciliation of non-GAAP financial measures to the most directly comparable U.S. GAAP measure included in this presentation and, if not contained in this presentation, contained in Mitel’s
Reports on Form 8-K which have been filed with the U.S. Securities and Exchange Commission on June 24, 2013 (fiscal 2013) and August 29, 2013 (Q1 of fiscal 2014).
7

Mitel –
Positioned for Profitable Growth
Rich McBee
President and CEO
A Celebration of Accomplishment
A History of Renewal
Adapting, changing and always innovating
9
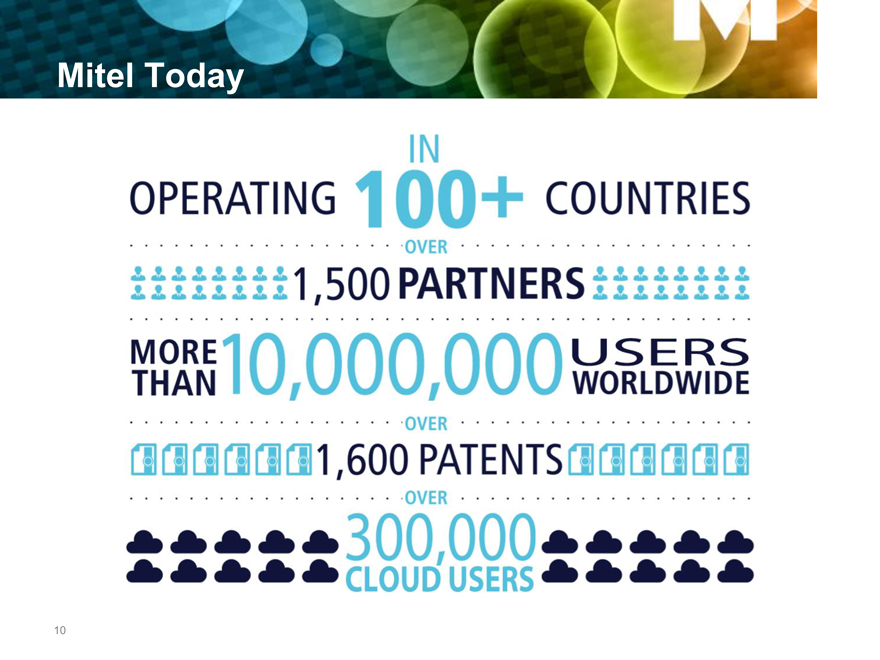
Mitel Today
OPERATING IN 100+ COUNTRIES OVER 1,500 PARTNERS
MORE THAN 10,000,000 USERS WORLDWIDE OVER
1,600 PATENTS OVER 300,000 CLOUD USERS
10

Mitel Today:
Customers Across All Market Segments
OT2012 Department of
Foreign Affairs Canada
11
Mitel Today:
Recognized for Innovation
12
Mitel Today:
Financial Performance
Significant revenues from our growth initiatives
Expanding operating margins
Four consecutive years of increasing profitability
Generating positive cash flow
Consistently paying down debt
13
Our Vision
To be the premier business communications and collaboration company in our industry
Not the Largest —Simply the Best
Delivering superior financial results
Loyal customers and partners
A place where people want to work
14
Our Mission
To deliver solutions that enable our customers to communicate and collaborate; anytime, anywhere, over any medium with the device of their choice.
15

We are Focused on Creating
Shareholder Value
Three things we hear from investors:
We evaluate our business progress and every strategic choice through these lenses
16
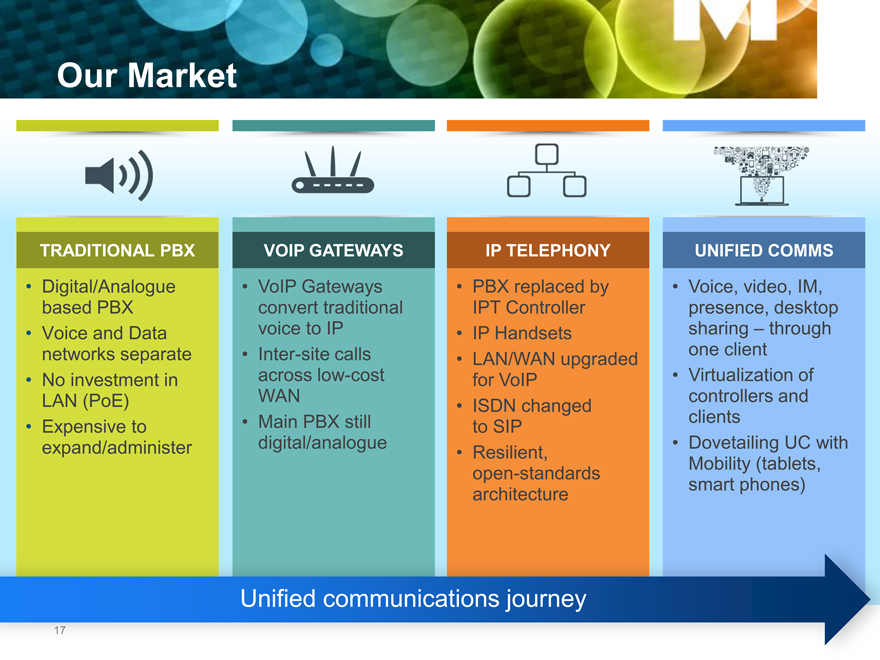
Our Market
TRADITIONAL PBX
Digital/Analogue based PBX
Voice and Data networks separate
No investment in
LAN (PoE)
Expensive to expand/administer
VOIP GATEWAYS
VoIP Gateways convert traditional voice to IP
Inter-site calls across low-cost
WAN
Main PBX still digital/analogue
IP TELEPHONY
PBX replaced by IPT Controller
IP Handsets
LAN/WAN upgraded for VoIP
ISDN changed to SIP
Resilient, open-standards architecture
UNIFIED COMMS
Voice, video, IM, presence, desktop sharing – through one client
Virtualization of controllers and clients
Dovetailing UC with Mobility (tablets, smart phones)
Unified communications journey
17
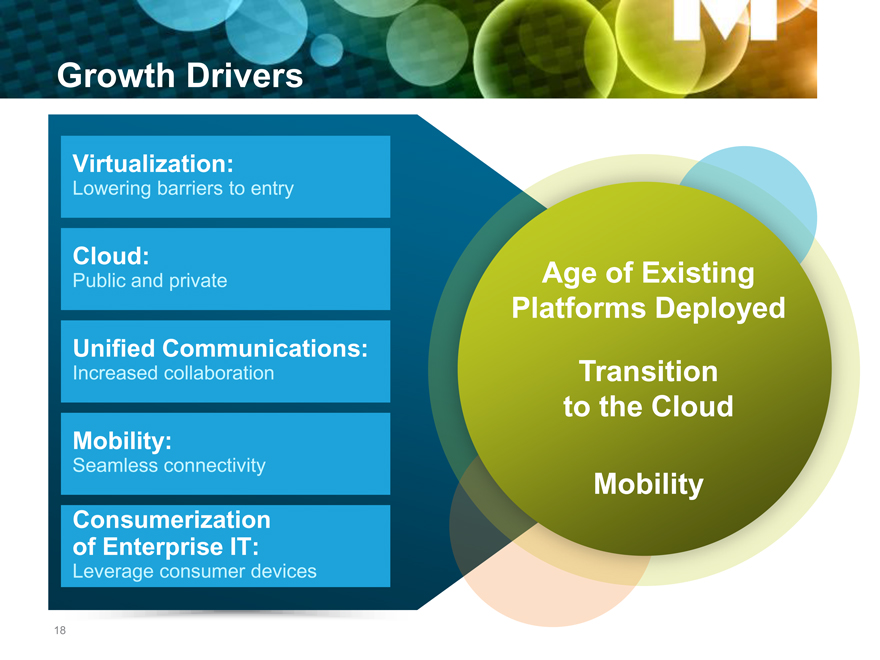
Growth Drivers
Virtualization:
Lowering barriers to entry
Cloud:
Public and private
Unified Communications:
Increased collaboration
Mobility:
Seamless connectivity
Consumerization of Enterprise IT:
Leverage consumer devices
Age of Existing Platforms Deployed
Transition to the Cloud
Mobility
18
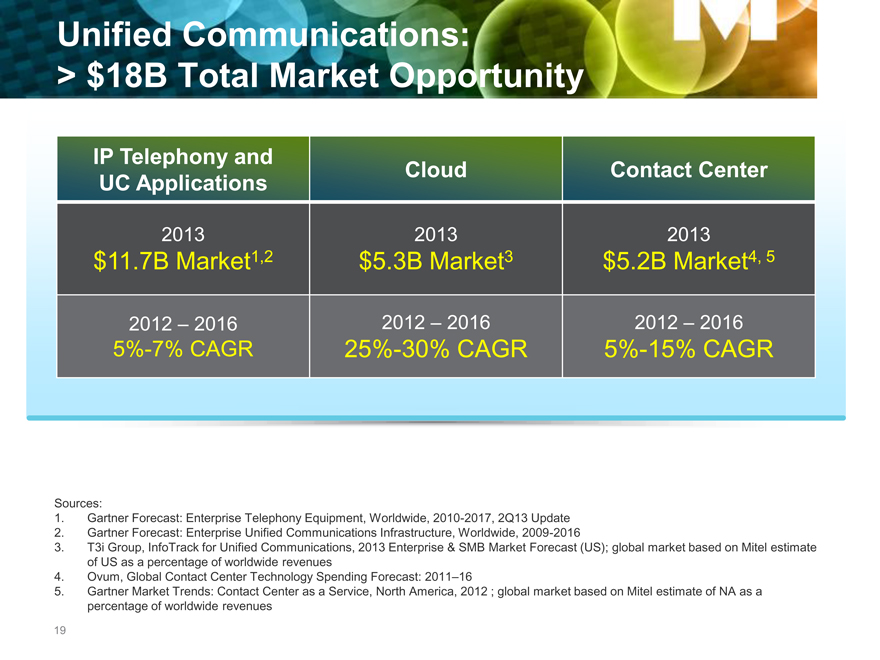
Unified Communications:
$18B Total Market Opportunity
IP Telephony and Cloud Contact Center
UC Applications
2013 2013 2013
$11.7B Market1,2 $5.3B Market3 $5.2B Market4, 5
2012 – 2016 2012 – 2016 2012 – 2016
5%-7% CAGR 25%-30% CAGR 5%-15% CAGR
Sources:
1. Gartner Forecast: Enterprise Telephony Equipment, Worldwide, 2010-2017, 2Q13 Update
2. Gartner Forecast: Enterprise Unified Communications Infrastructure, Worldwide, 2009-2016
3. T3i Group, InfoTrack for Unified Communications, 2013 Enterprise & SMB Market Forecast (US); global market based on Mitel estimate of US as a percentage of worldwide revenues
4. Ovum, Global Contact Center Technology Spending Forecast: 2011–16
5. Gartner Market Trends: Contact Center as a Service, North America, 2012 ; global market based on Mitel estimate of NA as a percentage of worldwide revenues
19
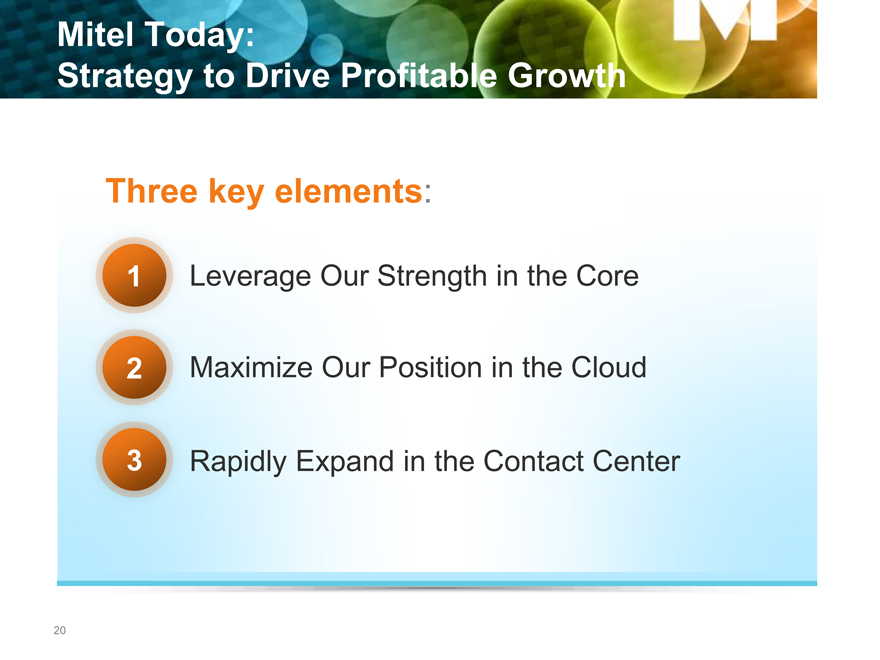
Mitel Today:
Strategy to Drive Profitable Growth
Three key elements:
1 | | Leverage Our Strength in the Core |
2 | | Maximize Our Position in the Cloud |
3 | | Rapidly Expand in the Contact Center |
20
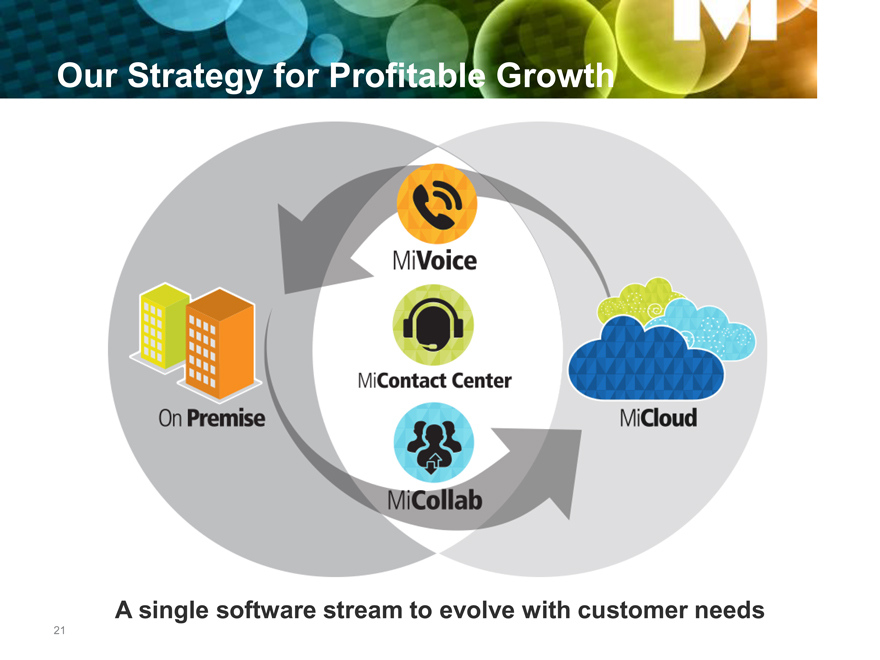
Our Strategy for Profitable Growth
Mivoice
On Premise
Mi Contact Center
MiCloud
MiCollab
A single software stream to evolve with customer needs
21
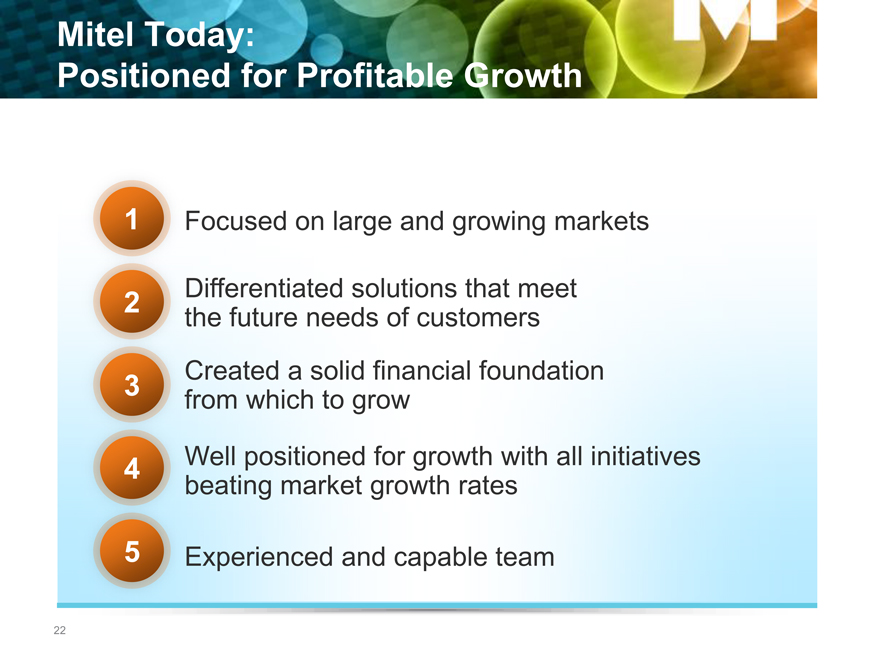
Mitel Today:
Positioned for Profitable Growth
1Focused on large and growing markets
2 | | Differentiated solutions that meet the future needs of customers |
3 | | Created a solid financial foundation from which to grow |
4 | | Well positioned for growth with all initiatives beating market growth rates |
5Experienced and capable team
22
Mitel Core: Positioned for Profitable Growth
Ron Wellard, EVP & General Manager
Mitel Communications Solutions
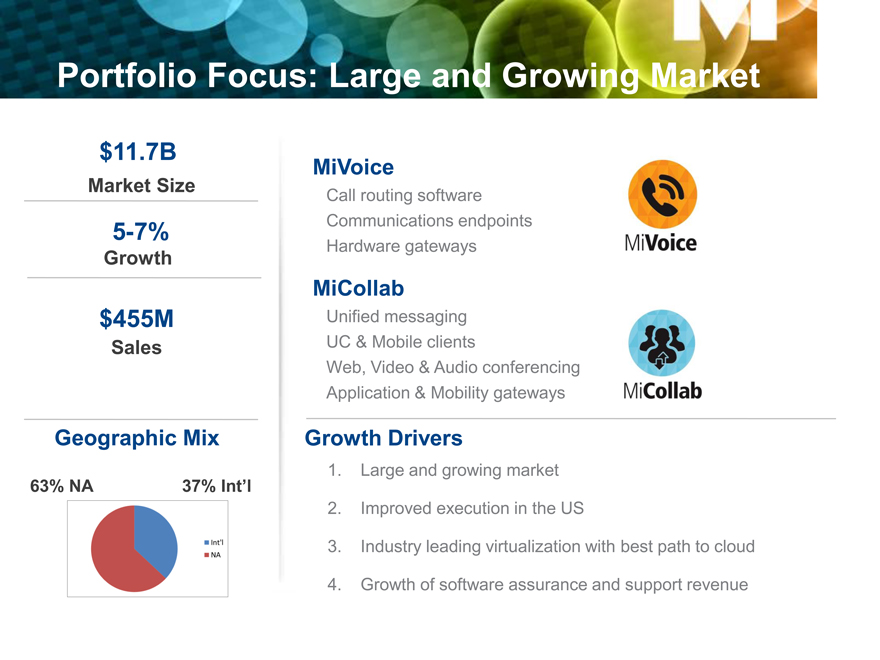
Portfolio Focus: Large and Growing Market
$11.7B
Market Size
5-7%
Growth
$455M
Sales
MiVoice
Call routing software Communications endpoints Hardware gateways
MiCollab
Unified messaging UC & Mobile clients
Web, Video & Audio conferencing Application & Mobility gateways
Geographic Mix
63% NA 37% Int’l
Growth Drivers
1. Large and growing market
2. Improved execution in the US
3. Industry leading virtualization with best path to cloud
4. Growth of software assurance and support revenue
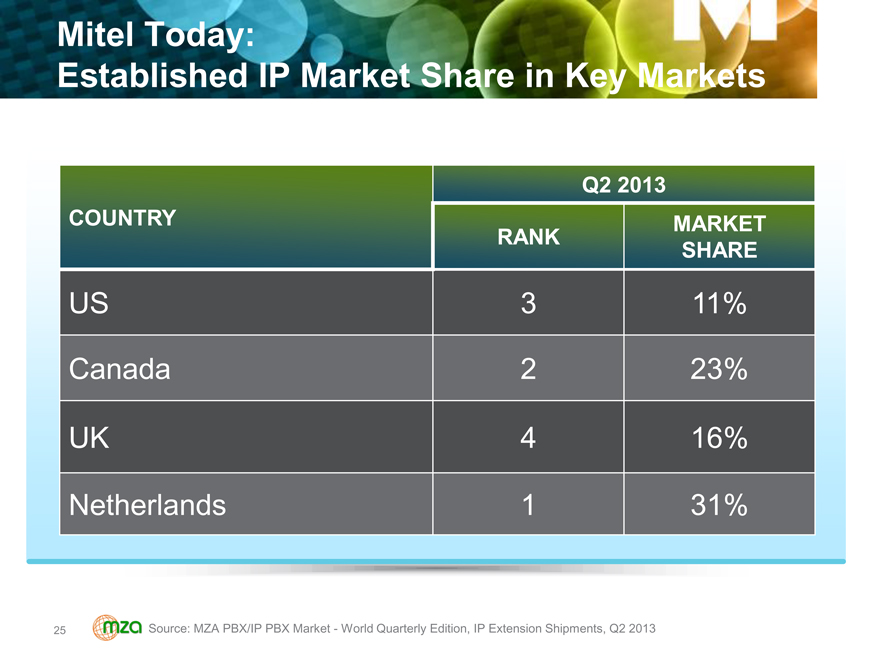
Mitel Today:
Established IP Market Share in Key Markets
Q2 2013
COUNTRY MARKET
RANK SHARE
US 3 11%
Canada 2 23%
UK 4 16%
Netherlands 1 31%
25 Source: MZA PBX/IP PBX Market—World Quarterly Edition, IP Extension Shipments, Q2 2013
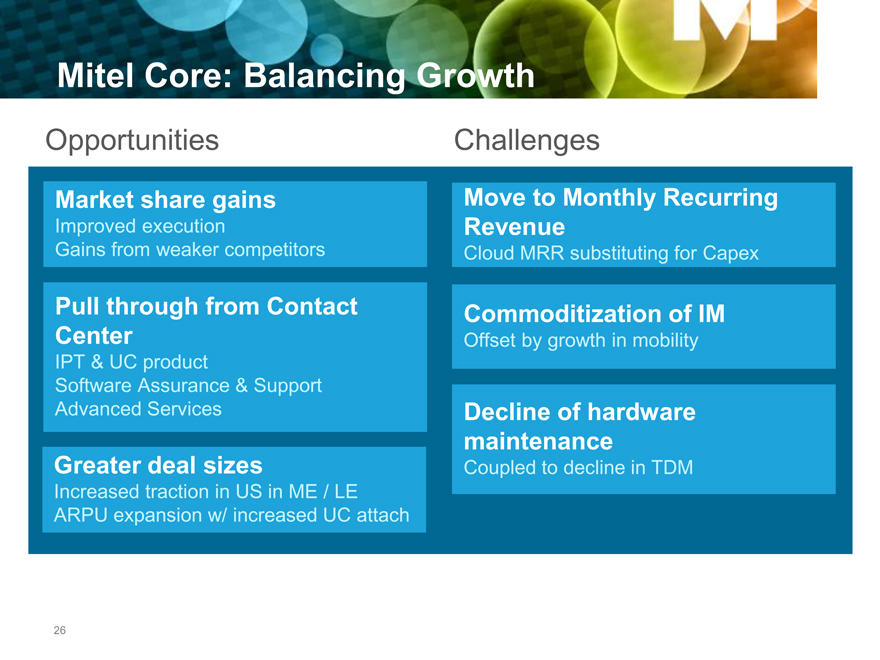
Mitel Core: Balancing Growth
Opportunities Challenges
Market share gains
Improved execution
Gains from weaker competitors
Move to Monthly Recurring Revenue
Cloud MRR substituting for Capex
Pull through from Contact Center
IPT & UC product
Software Assurance & Support Advanced Services
Commoditization of IM
Offset by growth in mobility
Greater deal sizes
Increased traction in US in ME / LE ARPU expansion w/ increased UC attach
Decline of hardware maintenance
Coupled to decline in TDM
26
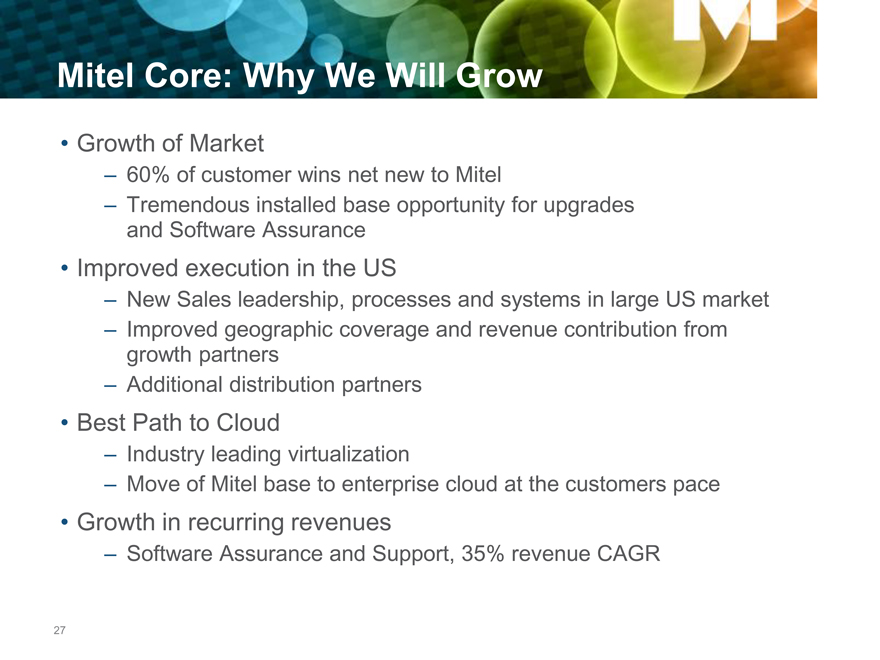
Mitel Core: Why We Will Grow
Growth of Market
60% of customer wins net new to Mitel
Tremendous installed base opportunity for upgrades and Software Assurance
Improved execution in the US
New Sales leadership, processes and systems in large US market
Improved geographic coverage and revenue contribution from growth partners
Additional distribution partners
Best Path to Cloud
Industry leading virtualization
Move of Mitel base to enterprise cloud at the customers pace
Growth in recurring revenues
Software Assurance and Support, 35% revenue CAGR
27
Mitel Core: Recent Growth Highlights
Growth of Software Assurance and Support, 40%+ over last 2 years MiCollab virtualized deployments, ~60%, revenue up 15% YoY
MiVoice port shipments up 16% YoY, revenue up 9% YoY
28
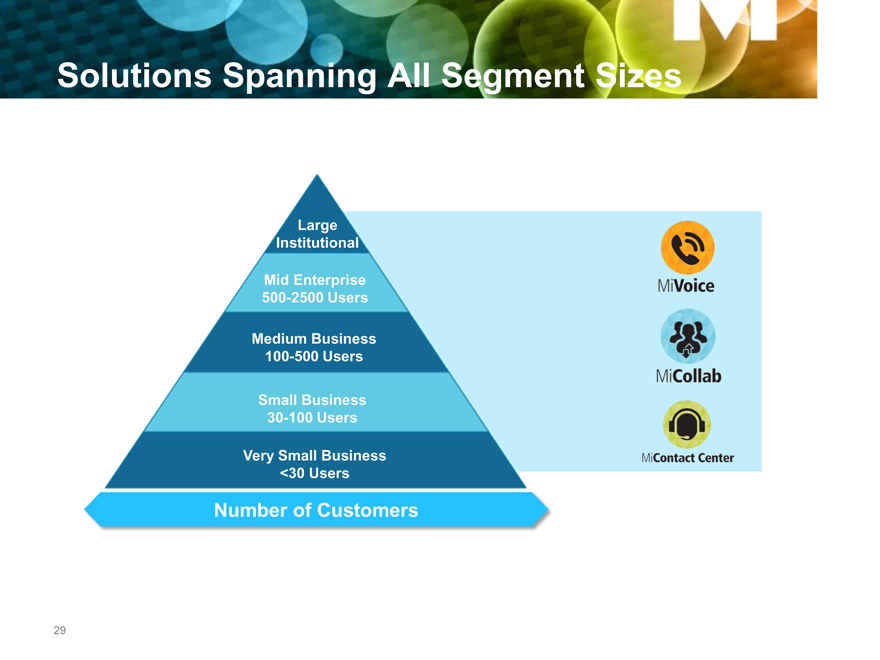
Solutions Spanning All Segment Sizes
Large Institutional
Mid Enterprise 500-2500 Users
Medium Business 100-500 Users
Small Business 30-100 Users
Very Small Business <30 Users
Number of Customers
29
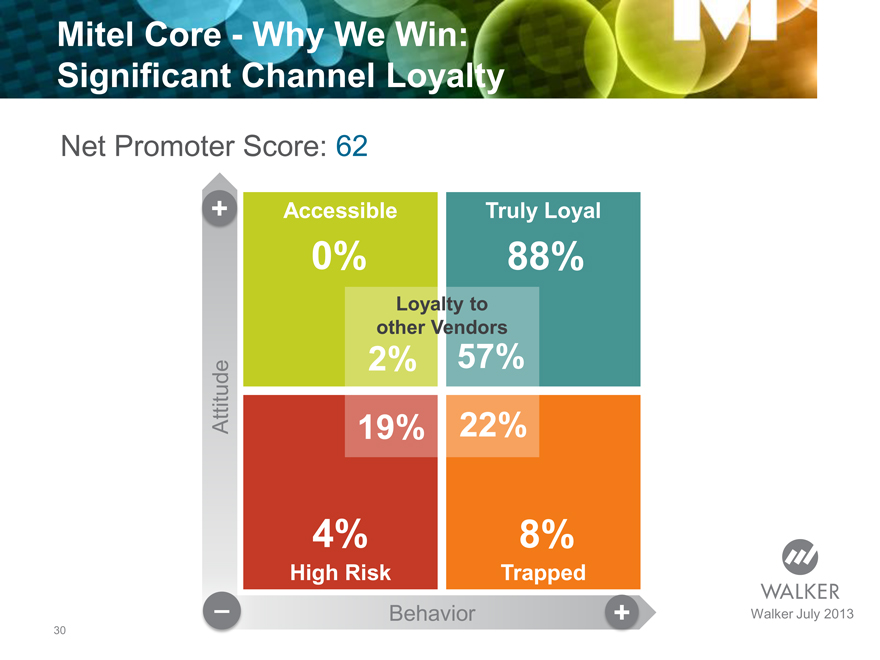
Mitel Core—Why We Win:
Significant Channel Loyalty
Net Promoter Score: 62
Attitude
Accessible Truly Loyal
0% 88%
Loyalty to other Vendors
2%
57%
19% 22%
4% 8%
High Risk Trapped
Behavior
Walker July 2013
30
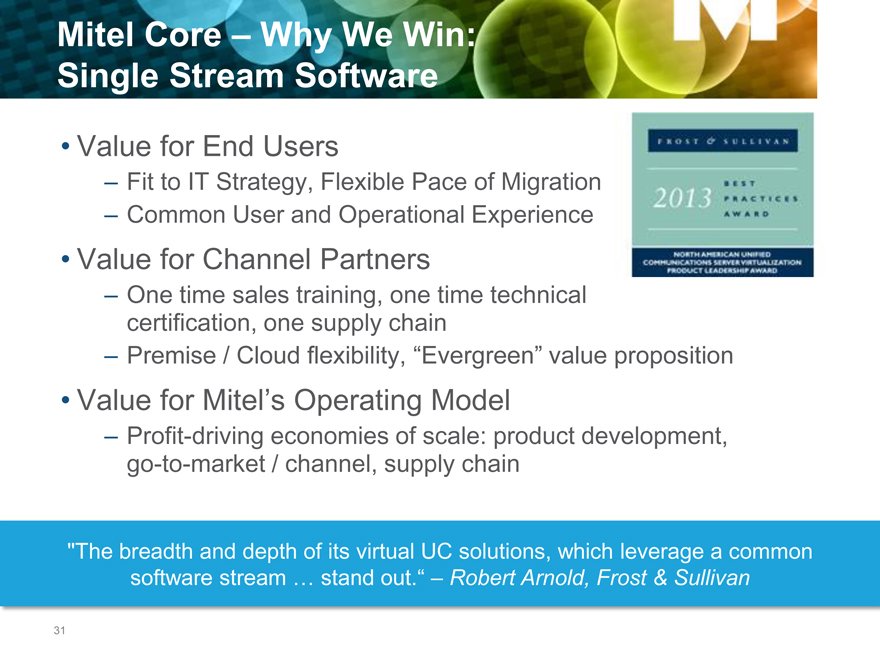
Mitel Core – Why We Win:
Single Stream Software
Value for End Users
Fit to IT Strategy, Flexible Pace of Migration
Common User and Operational Experience
Value for Channel Partners
One time sales training, one time technical certification, one supply chain
Premise / Cloud flexibility, “Evergreen” value proposition
Value for Mitel’s Operating Model
Profit-driving economies of scale: product development, go-to-market / channel, supply chain
“The breadth and depth of its virtual UC solutions, which leverage a common software stream … stand out.” ? Robert Arnold, Frost & Sullivan
31
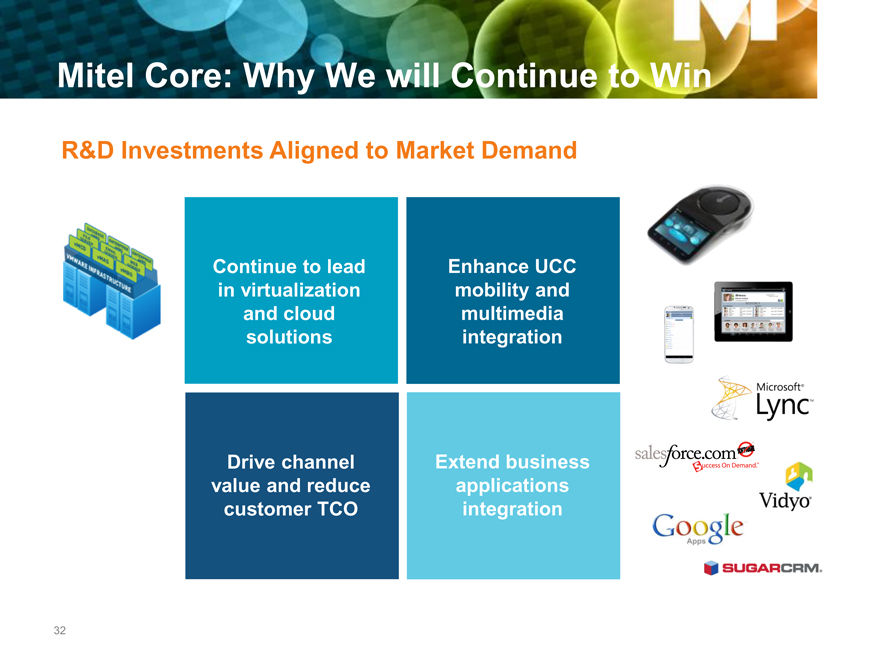
Mitel Core: Why We will Continue to Win
R&D Investments Aligned to Market Demand
Continue to lead Enhance UCC
in virtualization mobility and
and cloud multimedia
solutions integration
Drive channel Extend business
value and reduce applications
customer TCO integration
32
Summary
Mitel is well positioned for
growth & to take share in the
large IP Telephony and UCC
market Mitel is winning new
customers with a
differentiated offer
Growing highly profitable Mitel is migrating massive
recurring revenue stream installed base with single
from Software Assurance stream software
and Support
33
Mitel Contact Center: Positioned for Profitable Growth
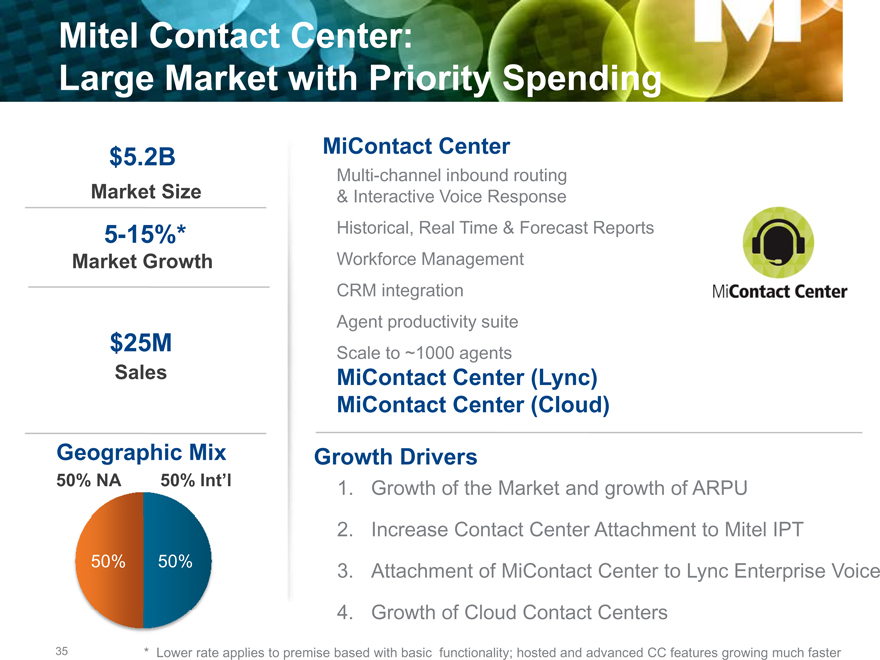
Mitel Contact Center:
Large Market with Priority Spending
$5.2B
Market Size
5-15%*
Market Growth
$25M
Sales
Geographic Mix
50% NA 50% Int’l
MiContact Center
Multi-channel inbound routing
& Interactive Voice Response
Historical, Real Time & Forecast Reports
Workforce Management
CRM integration
Agent productivity suite
Scale to ~1000 agents
MiContact Center (Lync)
MiContact Center (Cloud)
Growth Drivers
1. Growth of the Market and growth of ARPU
2. Increase Contact Center Attachment to Mitel IPT
3. Attachment of MiContact Center to Lync Enterprise Voice
4. Growth of Cloud Contact Centers
* | | Lower rate applies to premise based with basic functionality; hosted and advanced CC features growing much faster |
35
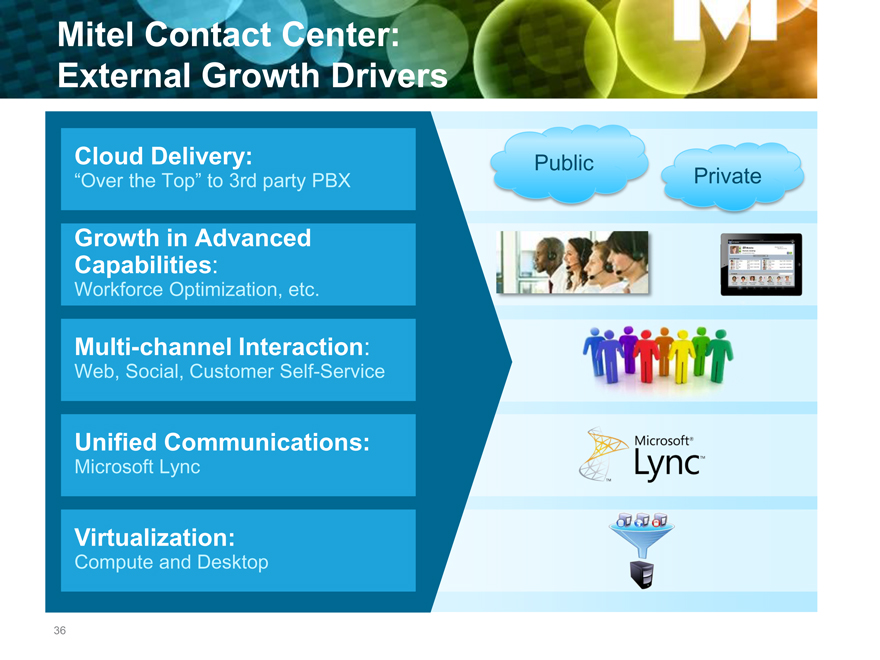
Mitel Contact Center:
External Growth Drivers
Cloud Delivery:
“Over the Top” to 3rd party PBX
Growth in Advanced
Capabilities:
Workforce Optimization, etc.
Multi-channel Interaction:
Web, Social, Customer Self-Service
Unified Communications:
Microsoft Lync
Virtualization:
Compute and Desktop
Public Private
36
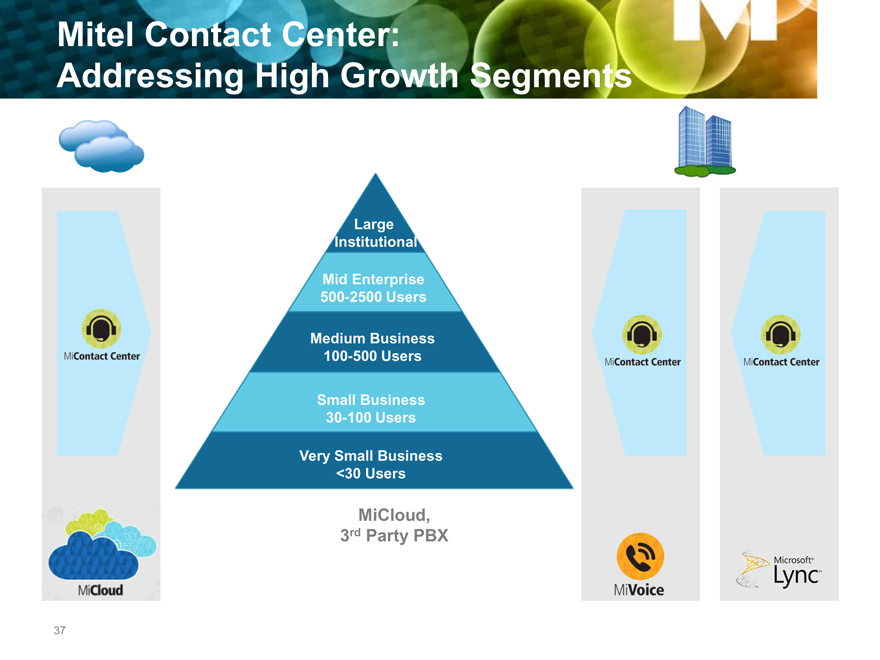
Mitel Contact Center:
Addressing High Growth Segments
Large
Institutional
Mid Enterprise
500-2500 Users
Medium Business
100-500 Users
Small Business
30-100 Users
Very Small Business
<30 Users
MiCloud,
3rd Party PBX
37
Mitel Contact Center:
History of Profitable Growth
Revenue growth, 3 Year track record of >20% growth
Average Contact Center size up 23%
Average revenue per seat up 17%
38
Mitel Contact Center ? Why We Win:
Simplicity and Value
Best technical integration to MiVoice
prairieFyre acquisition very well received by Mitel channel partners and customers
Superior value for the money relative to the competition
Flexible range of high value offerings to meet Small Business to Enterprise needs
Best technical integration to Microsoft Lync
Superior scalability, reliability and business analytics relative to the competition, Differentiated functionality
Single Software Stream across MiVoice, Lync and MiCloud
39
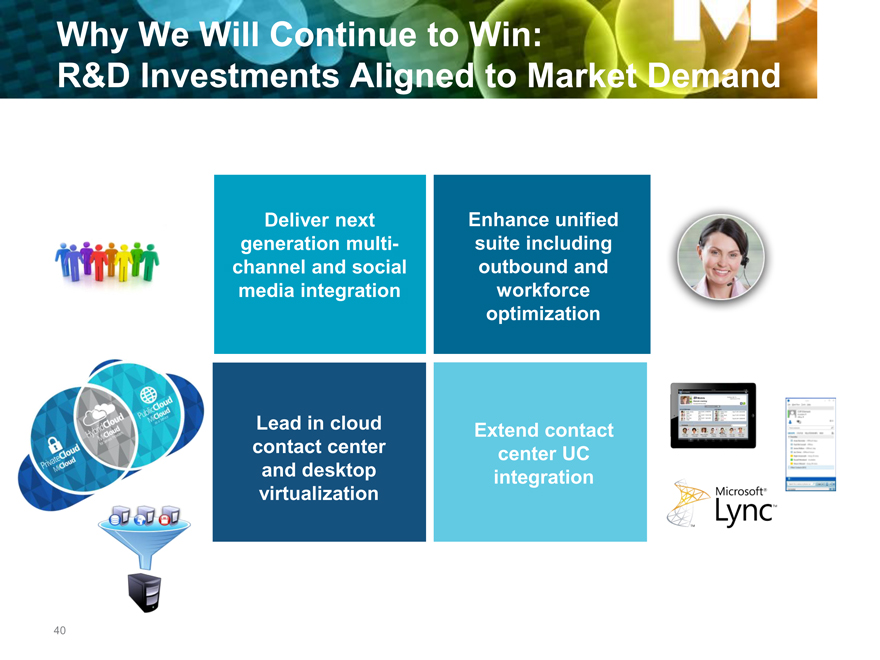
Why We Will Continue to Win:
R&D Investments Aligned to Market Demand
Deliver next Enhance unified
generation multi- suite including
channel and social outbound and
media integration workforce
optimization
Lead in cloud Extend contact
contact center center UC
and desktop integration
virtualization
40
Summary
MiContact Center 3 year track record of revenue growth Substantial investment increase in
(>20% CAGR) Contact Centers …
Research and Development Service Sales and Marketing
Mitel is well positioned to grow Contact Center share with a single stream software approach addressing MiVoice, Lync and Cloud integrations
41

Mitel Cloud: Positioned for Profitable Growth
Jon Brinton, General Manager
Cloud and Mitel Network Solutions
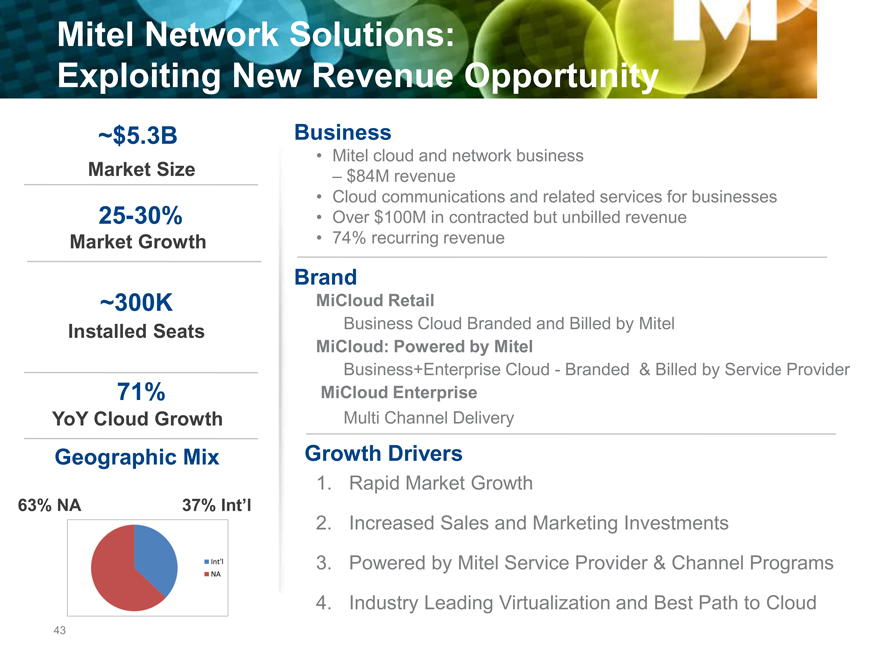
Mitel Network Solutions:
Exploiting New Revenue Opportunity
~$5.3B Business
Mitel cloud and network business
Market Size – $84M revenue
Cloud communications and related services for businesses
25-30% • Over $100M in contracted but unbilled revenue
Market Growth • 74% recurring revenue
Brand
~300K MiCloud Retail
Installed Seats Business Cloud Branded and Billed by Mitel
MiCloud: Powered by Mitel
Business+Enterprise Cloud—Branded & Billed by Service Provider
71% MiCloud Enterprise
YoY Cloud Growth Multi Channel Delivery
Geographic Mix Growth Drivers
1. Rapid Market Growth
63% NA 37% Int’l
2. Increased Sales and Marketing Investments
3. Powered by Mitel Service Provider & Channel Programs
4. Industry Leading Virtualization and Best Path to Cloud
43
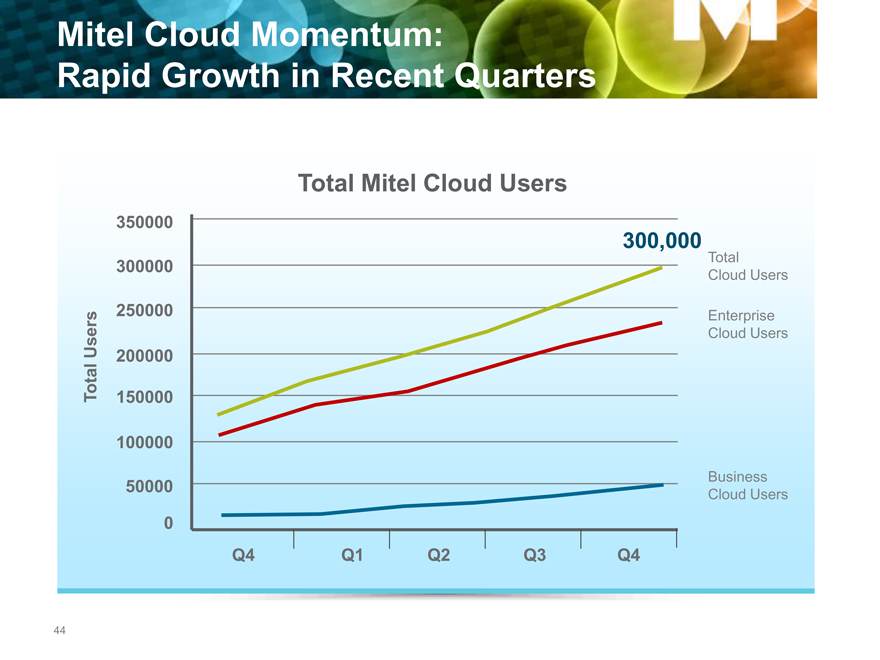
Mitel Cloud Momentum:
Rapid Growth in Recent Quarters
Total Mitel Cloud Users
350000
300,000
Total
300000 Cloud Users
250000 Enterprise
Users Cloud Users
200000
Total 150000
100000
Business
50000 Cloud Users
0
Q4 Q1 Q2 Q3 Q4
44
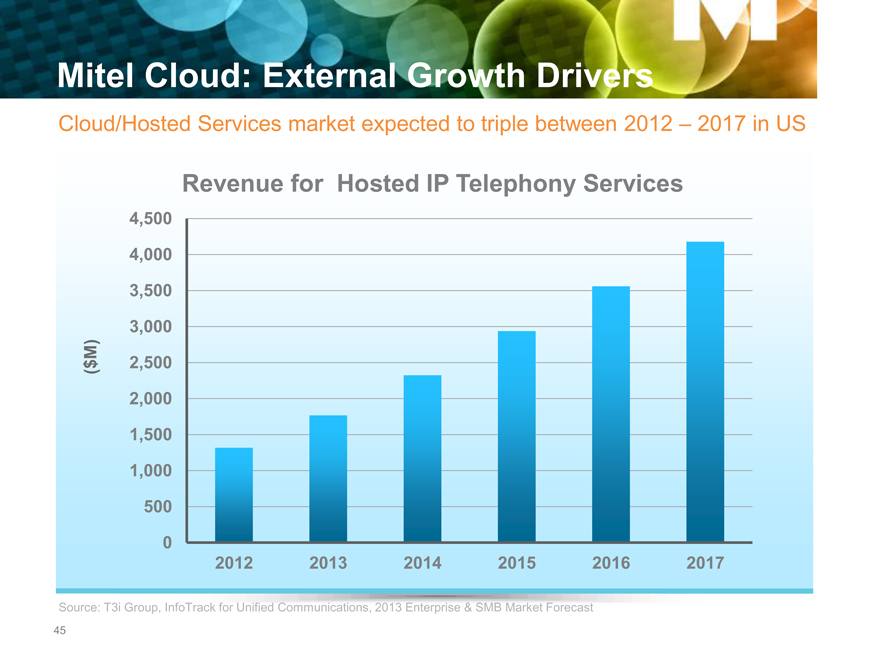
Mitel Cloud: External Growth Drivers
Cloud/Hosted Services market expected to triple between 2012 – 2017 in US
Revenue for Hosted IP Telephony Services
4,500
4,000
3,500
3,000
(M)
$ 2,500
2,000
1,500
1,000
500
0
2012 2013 2014 2015 2016 2017
Source: T3i Group, InfoTrack for Unified Communications, 2013 Enterprise & SMB Market Forecast
45
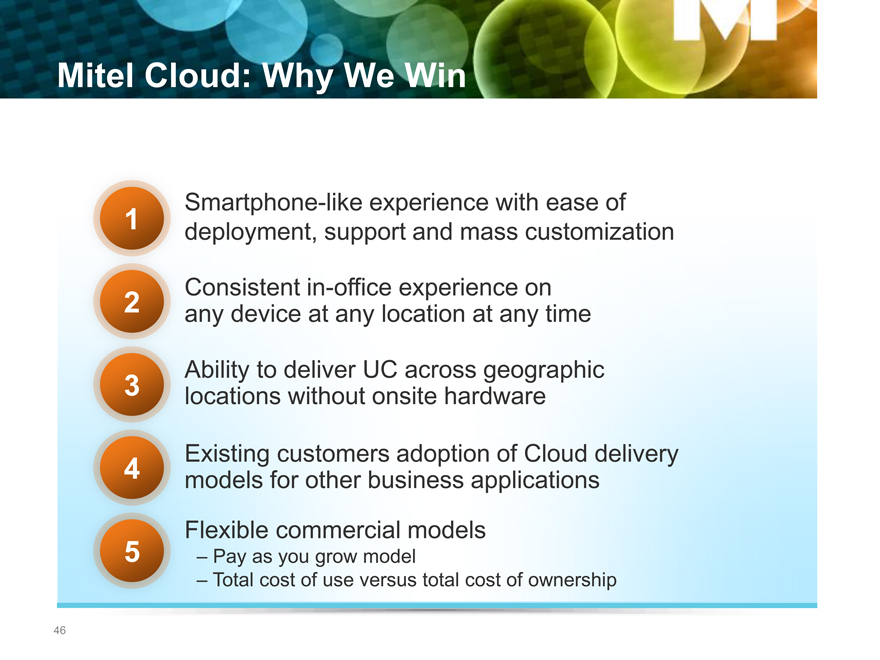
Mitel Cloud: Why We Win
Smartphone-like experience with ease of 1 deployment, support and mass customization Consistent in-office experience on 2 any device at any location at any time Ability to deliver UC across geographic 3 locations without onsite hardware Existing customers adoption of Cloud delivery 4 models for other business applications Flexible commercial models
5 – Pay as you grow model
– Total cost of use versus total cost of ownership
46
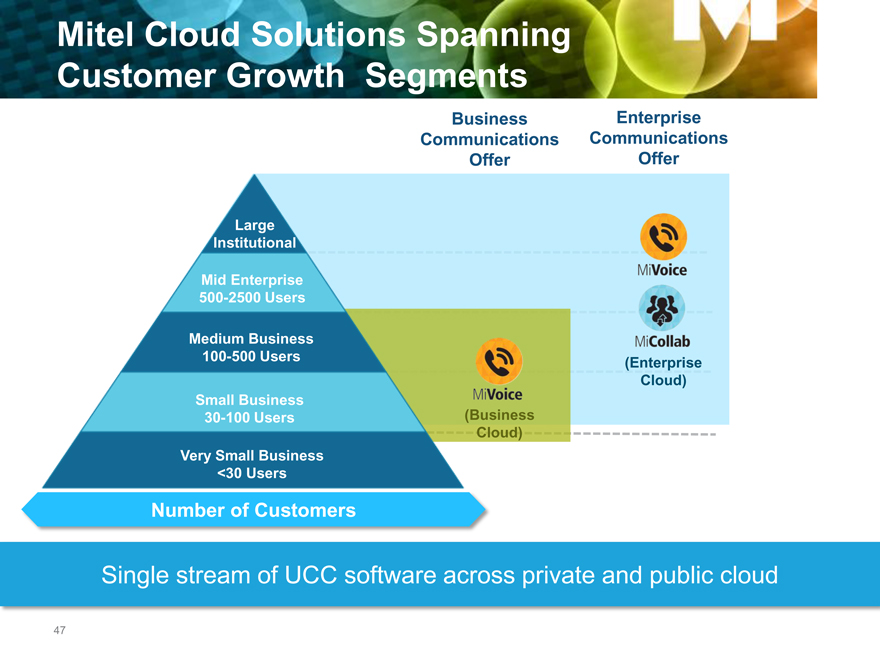
Mitel Cloud Solutions Spanning
Customer Growth Segments
Business Enterprise Communications Communications Offer Offer
Large Institutional
Mid Enterprise 500-2500 Users
Medium Business
100-500 Users (Enterprise Cloud) Small Business 30-100 Users (Business Cloud) Very Small Business <30 Users
Number of Customers
Single stream of UCC software across private and public cloud
47
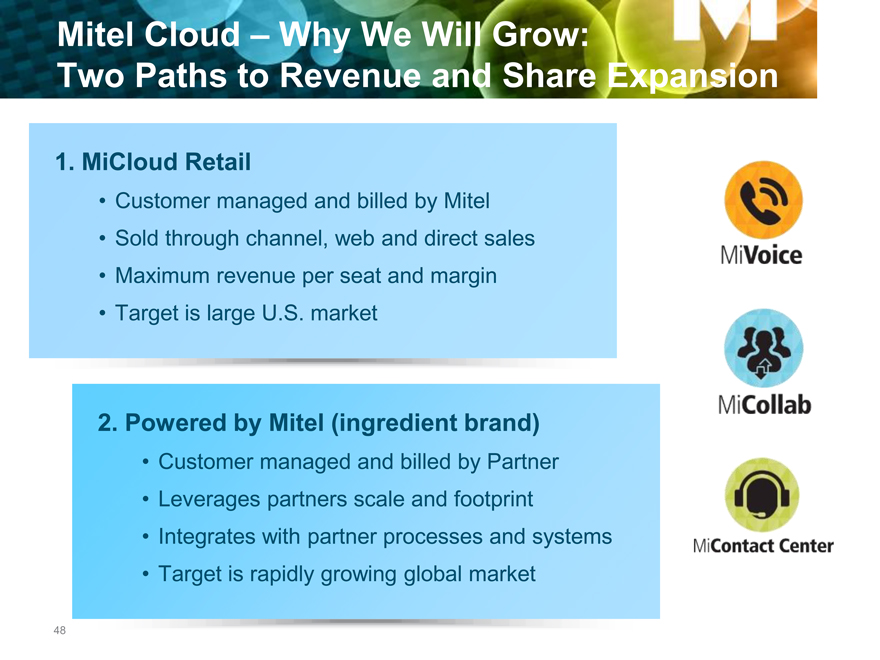
Mitel Cloud ? Why We Will Grow:
Two Paths to Revenue and Share Expansion
1. MiCloud Retail
Customer managed and billed by Mitel
Sold through channel, web and direct sales
Maximum revenue per seat and margin
Target is large U.S. market
2. Powered by Mitel (ingredient brand)
Customer managed and billed by Partner
Leverages partners scale and footprint
Integrates with partner processes and systems
Target is rapidly growing global market
48
Mitel Cloud – Business:
Growing Market Presence
Purpose built all in one solution for pay as you grow demand
Targeted up to 500+
Mitel Cloud – Business Channel Representative Customers
49
Mitel Cloud – Enterprise:
Rapidly Growing Global Installed Based
Leveraging Mitel Virtual Applications portfolio
for global Enterprise demand
Targeted up to 50,000+
Mitel Cloud – Enterprise Channel Representative Customers
Department of
Foreign Affairs Canada
50
MiCloud Business: Metrics, Momentum and
Investment Driving Growth
MRR
? ARPU of $48 – up 15%
? Average Revenue Per Customer—$1,400 per – up 8%
Average of 29 Seats per installed customer Largest customer approximately 1,000 seats 196% YoY installed seat growth Over 75% of customers are new logos to Mitel
Ability to layer in contact center, rich video, collaboration Investing in:
Increased Cloud marketing driving web generated sales Ramping traditional and new channels as Agents of MiCloud Direct sales in target geographies and verticals
51
Powered by Mitel: Metrics, Momentum and
Investment Driving Growth
40 Powered By Mitel Service Providers live or in process of deployment 10 countries with Powered by Mitel Partners Over 100% YoY seat growth Implementation in process with 25,000 plus users for a single customer Investing in:
Global cloud sales and partner support Service Provider channel development
New on-boarding, operations and support resources Enhanced service provider tools and programs Consolidated and centralized global cloud strategy
52
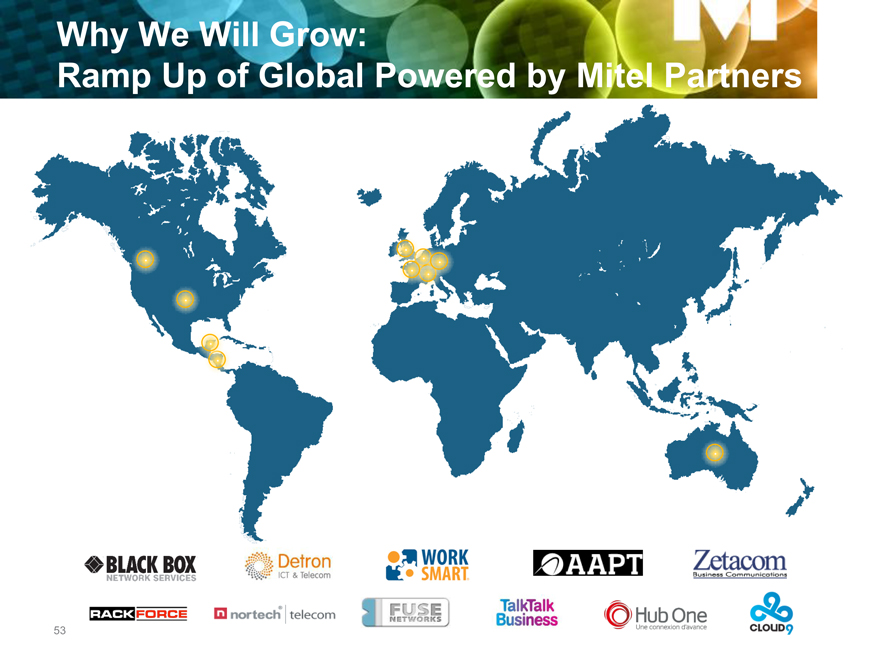
Why We Will Grow:
Ramp Up of Global Powered by Mitel Partners
53
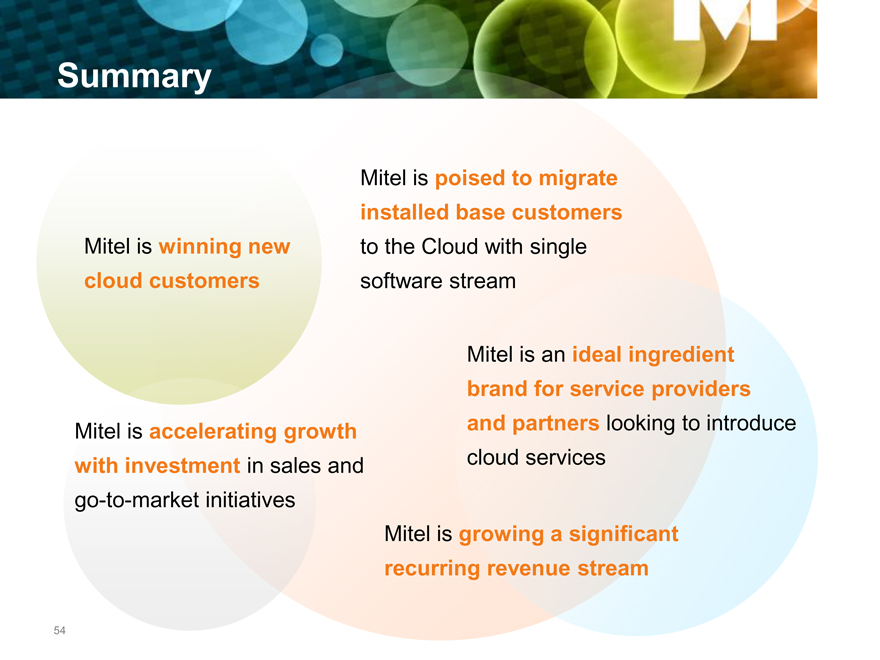
Summary
Mitel is poised to migrate installed base customers to the Cloud with single software stream
Mitel is winning new cloud customers
Mitel is accelerating growth with investment in sales and go-to-market initiatives
Mitel is an ideal ingredient brand for service providers and partners looking to introduce cloud services
Mitel is growing a significant recurring revenue stream
54
Mitel Voice of the Customer Panel
Almin Surani
Erin Ostler
Kevin Portillo
CIO, Canadian
Director of Global Wholesale
IT Director, Kaplan
Red Cross
and Emerging Solutions, Sprint
International Colleges
55

Mitel Go-To-Market Panel
Graham Bevington
Martyn Etherington
Joe Vitalone
EVP International
EVP and Chief Marketing Officer
EVP Americas
56

Mitel Financials:
Positioned for
Profitable Growth
Steve Spooner, Chief Financial Officer
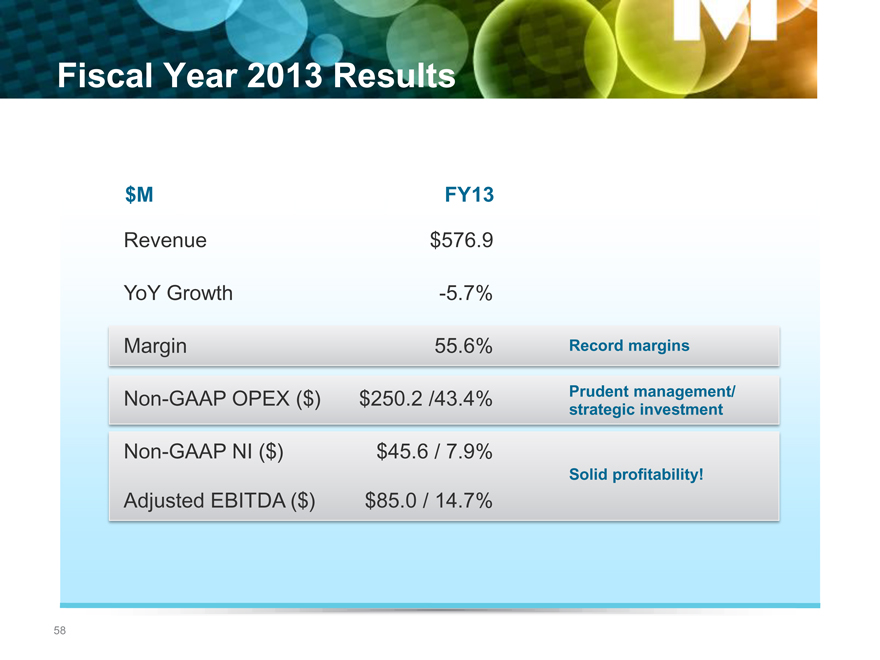
Fiscal Year 2013 Results
$M FY13
Revenue $576.9
YoY Growth -5.7%
Margin 55.6% Record margins
Non-GAAP OPEX ($) $250.2 /43.4% Prudent management/
strategic investment
Non-GAAP NI ($) $45.6 / 7.9%
Solid profitability!
Adjusted EBITDA ($) $85.0 / 14.7%
58
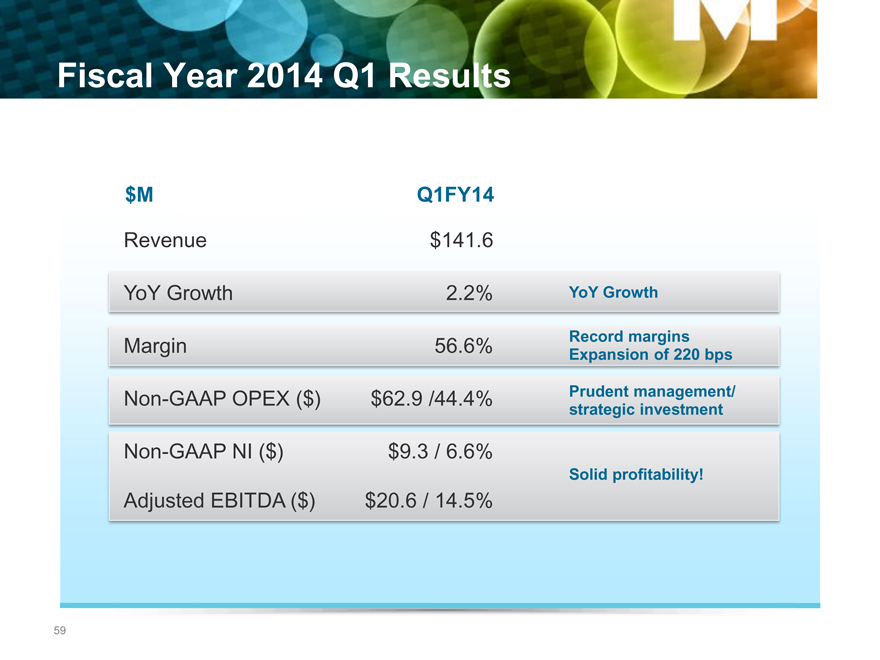
Fiscal Year 2014 Q1 Results
$M Q1FY14
Revenue $141.6
YoY Growth 2.2% YoY Growth
Margin 56.6% Record margins
Expansion of 220 bps
Non-GAAP OPEX ($) $62.9 /44.4% Prudent management/
strategic investment
Non-GAAP NI ($) $9.3 / 6.6%
Solid profitability!
Adjusted EBITDA ($) $20.6 / 14.5%
59
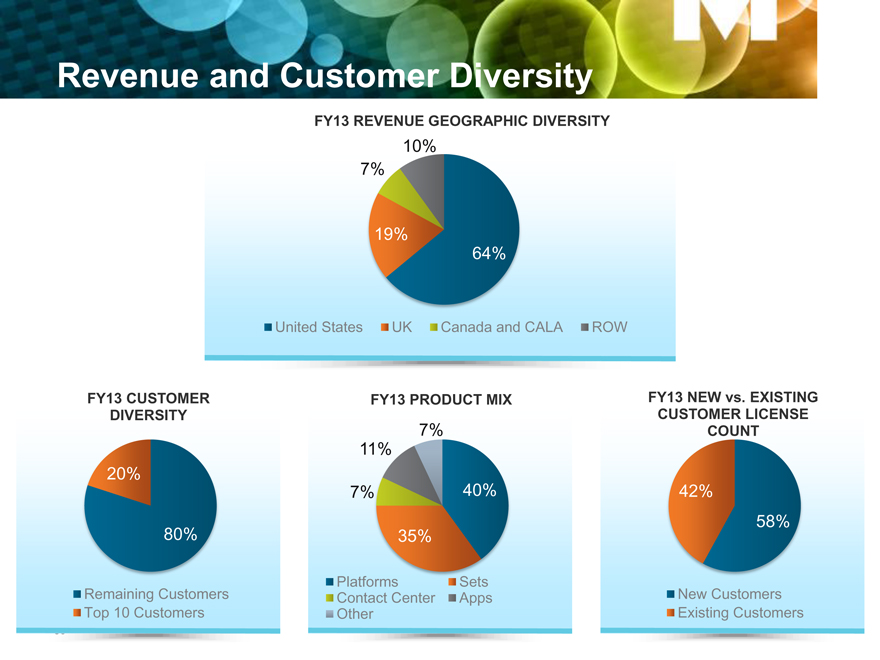
Revenue and Customer Diversity
FY13 REVENUE GEOGRAPHIC DIVERSITY
10% 7%
19%
64%
United States UK Canada and CALA ROW
FY13 CUSTOMER FY13 PRODUCT MIX FY13 NEW vs. EXISTING DIVERSITY CUSTOMER LICENSE
7% COUNT
11% 20%
7% 40% 42%
58% 80% 35%
Remaining Customers Platforms Sets New Customers Contact Center Apps Top 10 Customers Other Existing Customers
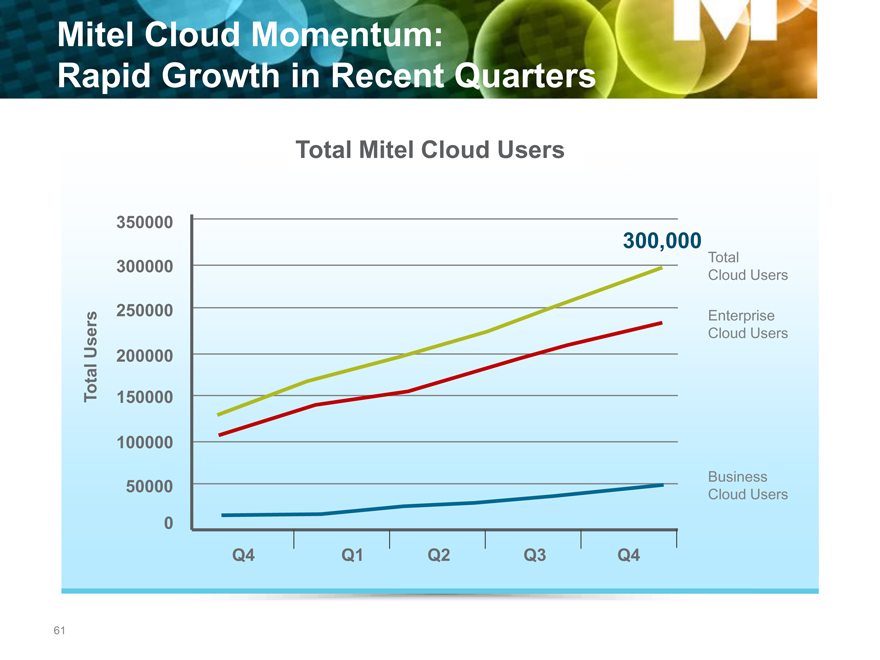
Mitel Cloud Momentum:
Rapid Growth in Recent Quarters
Total Mitel Cloud Users
350000
300,000
Total
300000 Cloud Users
250000 Enterprise
Users Cloud Users
200000
Total 150000
100000
Business
50000 Cloud Users
0
Q4 Q1 Q2 Q3 Q4
61
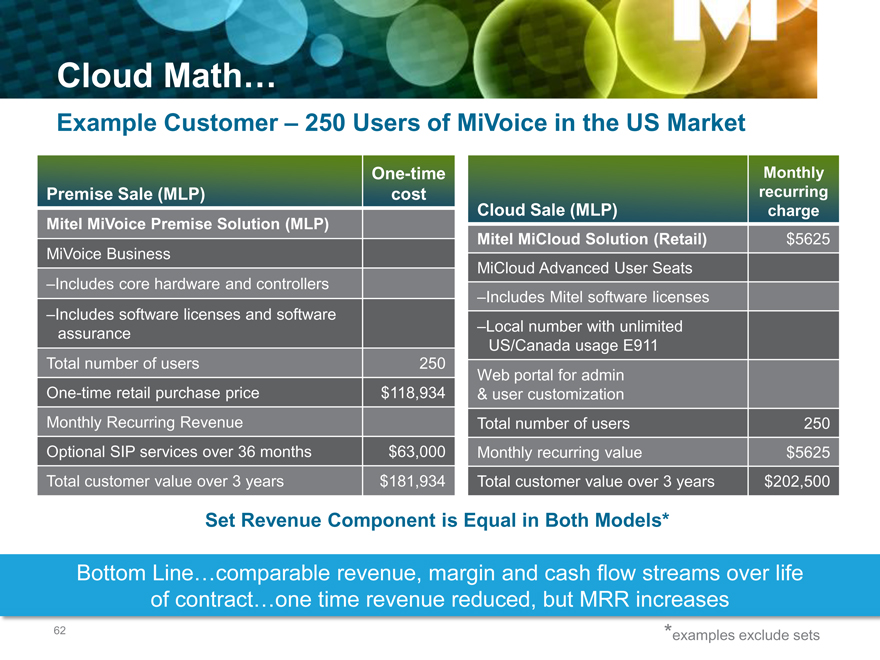
Cloud Math…
Example Customer – 250 Users of MiVoice in the US Market
One-time Monthly
Premise Sale (MLP) cost recurring
Cloud Sale (MLP) charge
Mitel MiVoice Premise Solution (MLP)
Mitel MiCloud Solution (Retail) $5625
MiVoice Business
MiCloud Advanced User Seats
–Includes core hardware and controllers
–Includes Mitel software licenses
–Includes software licenses and software
assurance –Local number with unlimited
US/Canada usage E911
Total number of users 250
Web portal for admin
One-time retail purchase price $118,934 & user customization
Monthly Recurring Revenue Total number of users 250
Optional SIP services over 36 months $63,000 Monthly recurring value $5625
Total customer value over 3 years $181,934 Total customer value over 3 years $202,500
Set Revenue Component is Equal in Both Models*
Bottom Line…comparable revenue, margin and cash flow streams over life of contract…one time revenue reduced, but MRR increases
examples exclude sets
62

Recurring Revenue Growth
Driven by Software Assurance and Cloud
Decrease in Legacy MRR offset by growth in Software Assurance Cloud growth to drive additional MRR
FY11 Revenue FY13 Revenue Target Revenue
26% 26% 35%
74% 65% 74%
Capital Sale Capital Sale Capital Sale
Recurring Revenue Recurring Revenue Recurring Revenue
63
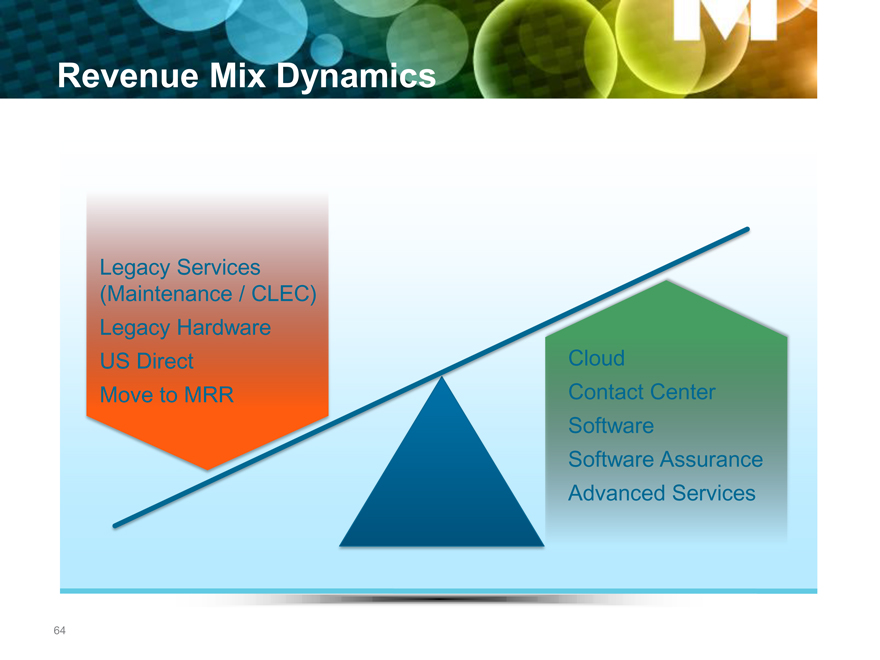
Revenue Mix Dynamics
64
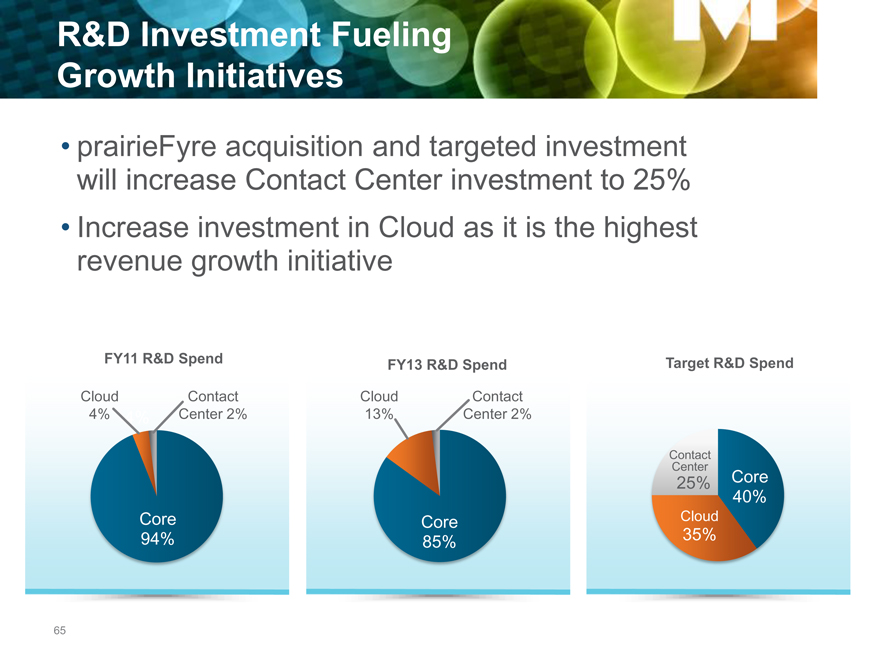
R&D Investment Fueling
Growth Initiatives
prairieFyre acquisition and targeted investment will increase Contact Center investment to 25% Increase investment in Cloud as it is the highest revenue growth initiative
FY11 R&D Spend FY13 R&D Spend Target R&D Spend
Cloud Contact Cloud Contact
4% 4% Center 2% 13% Center 2%
Contact
Center
25% Core
40%
Core Core Cloud
94% 85% 35%
65
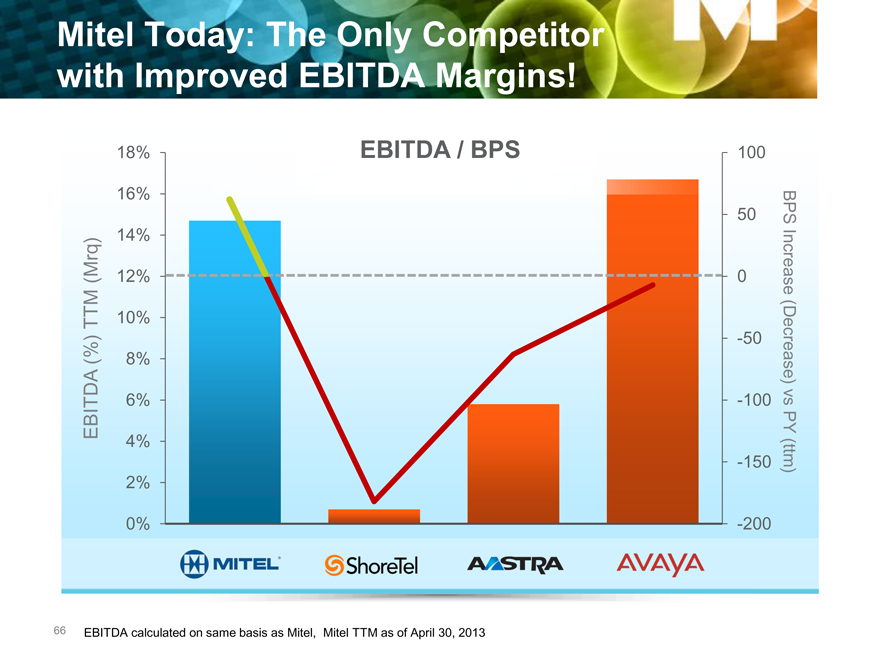
Mitel Today: The Only Competitor with Improved EBITDA Margins!
18% EBITDA / BPS 100
16%
50 BPS
14%
(Mrq) 12% 0 Increase
TTM 10%
-50
(%) 8% (Decrease)
6% -100 vs
EBITDA PY
4%
-150 (ttm)
2%
0% -200
EBITDA calculated on same basis as Mitel, Mitel TTM as of April 30, 2013
66
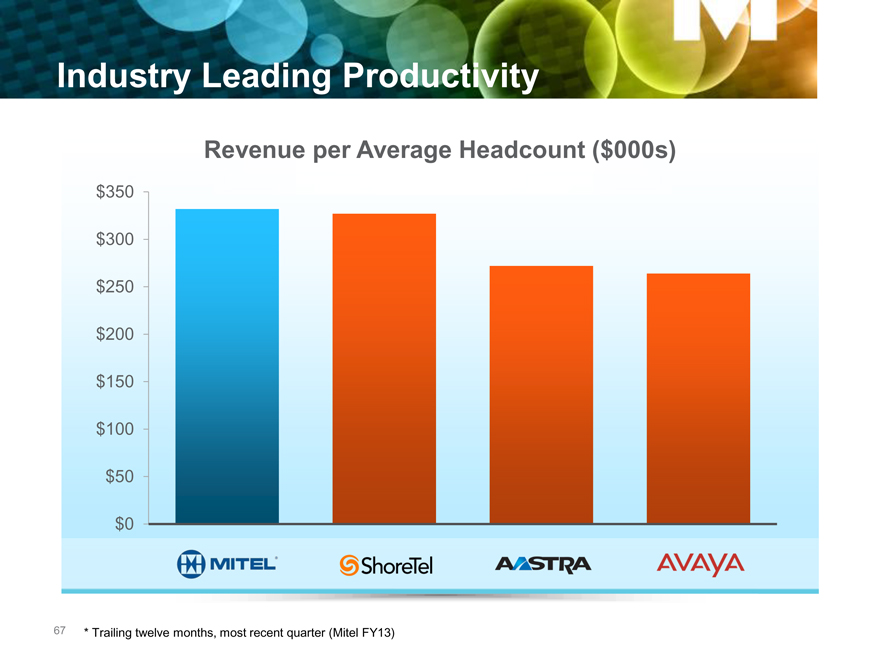
Industry Leading Productivity
Revenue per Average Headcount ($000s)
$350
$300
$250
$200
$150
$100
$50
$0
* | | Trailing twelve months, most recent quarter (Mitel FY13) |
67
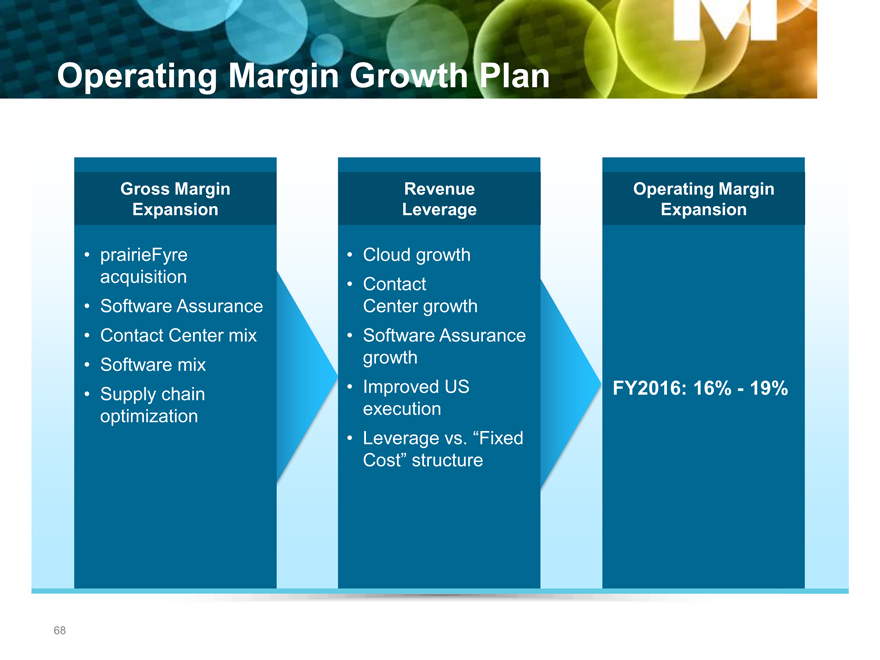
Operating Margin Growth Plan
Gross Margin Expansion
prairieFyre acquisition
Software Assurance Contact Center mix Software mix Supply chain optimization
Revenue Leverage
Operating Margin Expansion
Cloud growth Contact Center growth Software Assurance growth Improved US execution
Leverage vs. “Fixed
Cost” structure
FY2016: 16%—19%
68
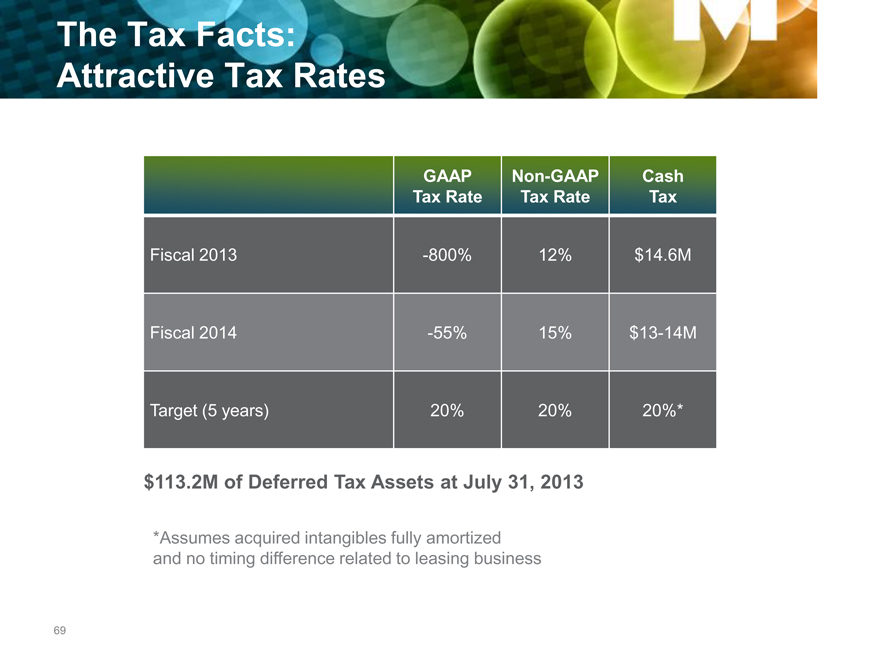
The Tax Facts:
Attractive Tax Rates
GAAP Non-GAAP Cash
Tax Rate Tax Rate Tax
Fiscal 2013 -800% 12% $14.6M
Fiscal 2014 -55% 15% $13-14M
Target (5 years) 20% 20% 20%*
$113.2M of Deferred Tax Assets at July 31, 2013
*Assumes acquired intangibles fully amortized and no timing difference related to leasing business
69
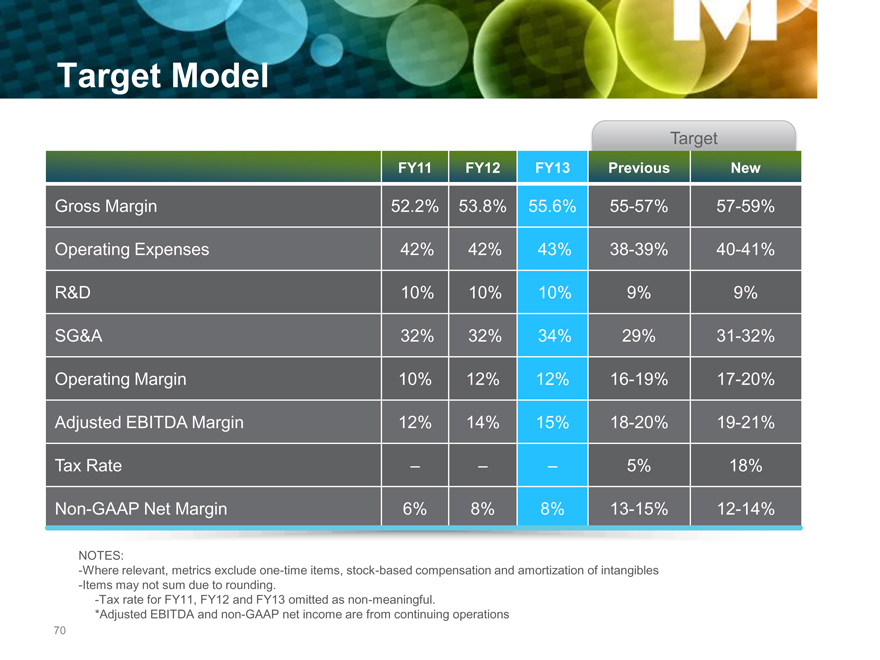
Target Model
Target
FY11 FY12 FY13 Previous New
Gross Margin 52.2% 53.8% 55.6% 55-57% 57-59%
Operating Expenses 42% 42% 43% 38-39% 40-41%
R&D 10% 10% 10% 9% 9%
SG&A 32% 32% 34% 29% 31-32%
Operating Margin 10% 12% 12% 16-19% 17-20%
Adjusted EBITDA Margin 12% 14% 15% 18-20% 19-21%
Tax Rate – – – 5% 18%
Non-GAAP Net Margin 6% 8% 8% 13-15% 12-14%
NOTES:
-Where relevant, metrics exclude one-time items, stock-based compensation and amortization of intangibles -Items may not sum due to rounding.
-Tax rate for FY11, FY12 and FY13 omitted as non-meaningful.
*Adjusted EBITDA and non-GAAP net income are from continuing operations
70
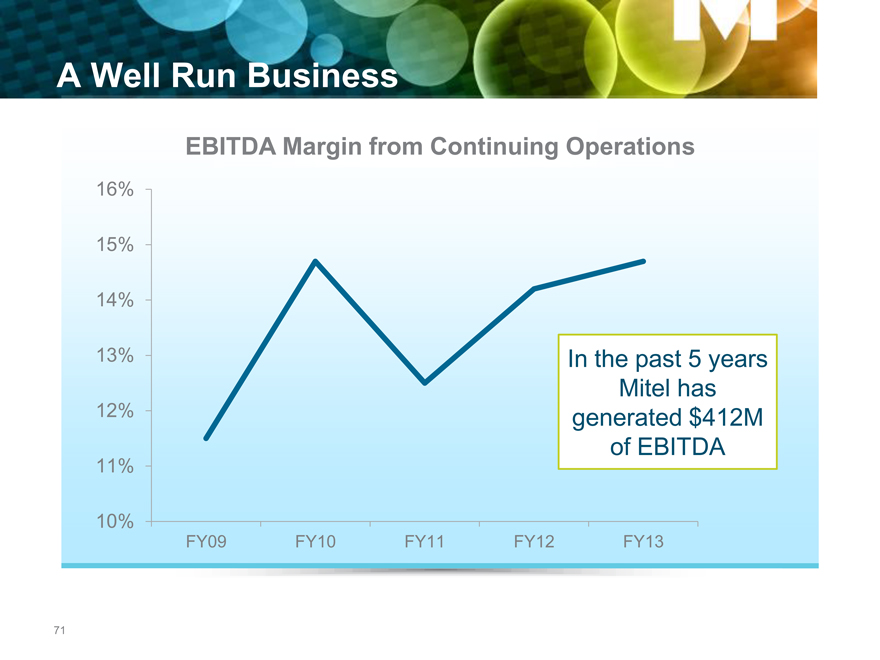
A Well Run Business
EBITDA Margin from Continuing Operations
16%
15%
14%
13% In the past 5 years
Mitel has
12% generated $412M
of EBITDA
11%
10%
FY09 FY10 FY11 FY12 FY13
71
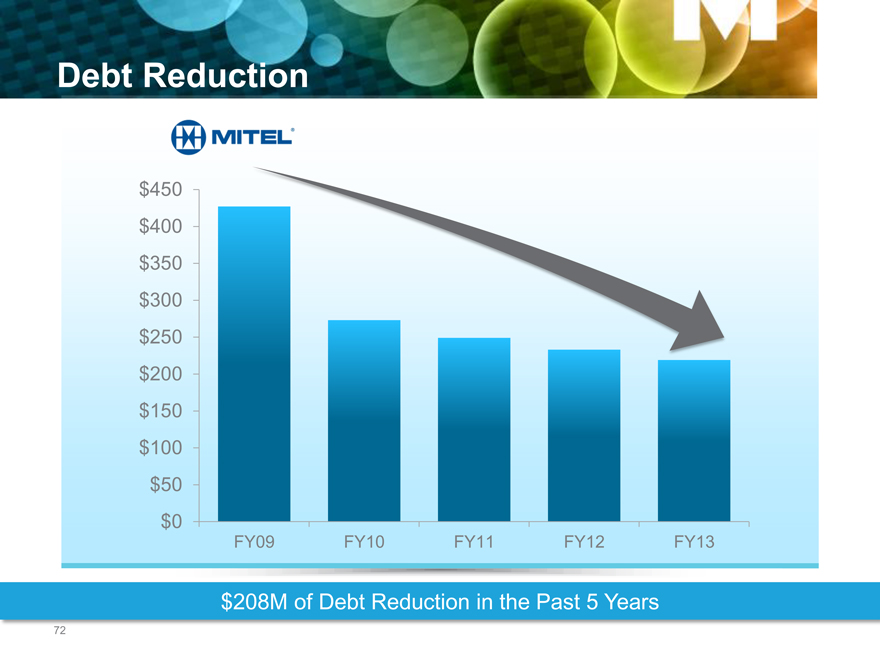
Debt Reduction
$450
$400
$350
$300
$250
$200
$150
$100
$50
$0
FY09 FY10 FY11 FY12 FY13
$208M of Debt Reduction in the Past 5 Years
72
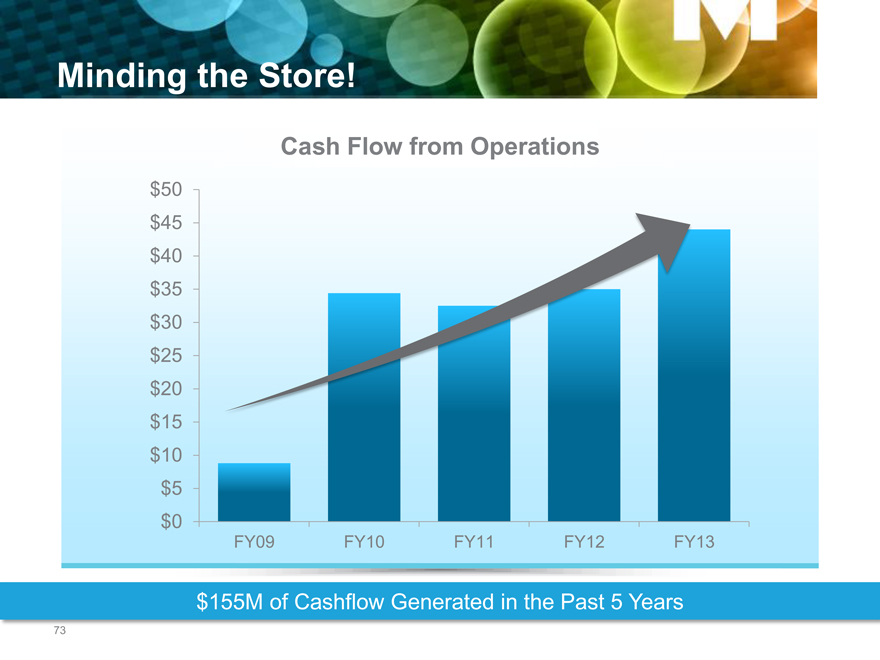
Minding the Store!
Cash Flow from Operations
$50 $45 $40 $35 $30 $25 $20 $15 $10 $5 $0
FY09 FY10 FY11 FY12 FY13
$155M of Cashflow Generated in the Past 5 Years
73
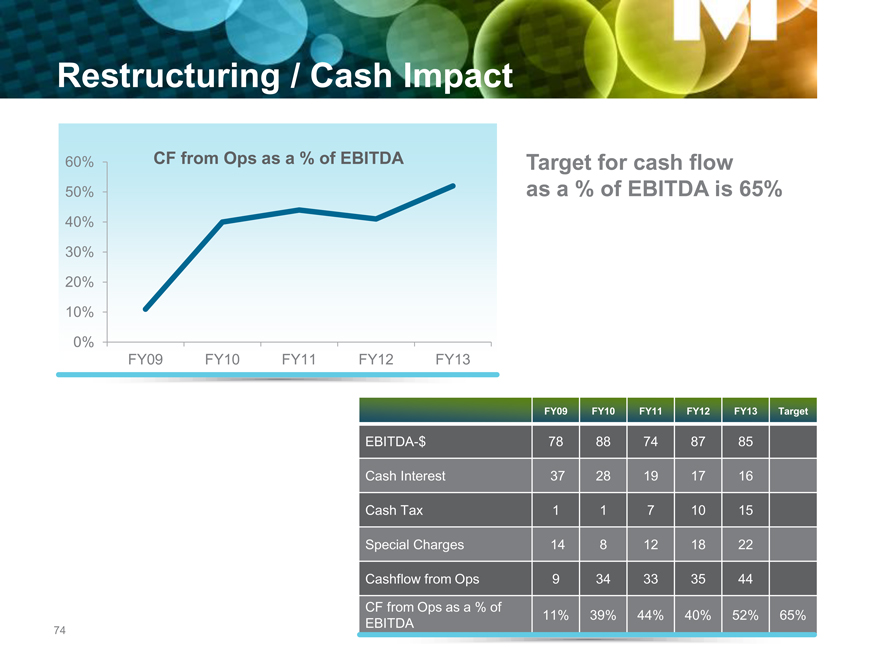
Restructuring / Cash Impact
60% CF from Ops as a % of EBITDA Target for cash flow
50% as a % of EBITDA is 65%
40%
30%
20%
10%
0%
FY09 FY10 FY11 FY12 FY13
FY09 FY10 FY11 FY12 FY13 Target
EBITDA-$ 78 88 74 87 85
Cash Interest 37 28 19 17 16
Cash Tax 1 1 7 10 15
Special Charges 14 8 12 18 22
Cashflow from Ops 9 34 33 35 44
CF from Ops as a % of
74 EBITDA 11% 39% 44% 40% 52% 65%

Why Invest in Mitel
A multi-billion dollar market opportunity
Technology leadership position
single software stream, virtualization, “Powered by Mitel”
Revenue growth in all investment initiatives
Profitable with demonstrated operating leverage
Generating cash/continued debt reduction
Experienced management team
Mitel is positioned for profitable growth
75

MITEL