Exhibit 99.1
|

Mitel Q1 2016 Earnings Call Presentation
May 5, 2016
|
Safe Harbor Statement
Forward Looking Statements
Some of the statements in this communication are forward-looking statements (or forward-looking information) within the meaning of applicable U.S. and Canadian securities laws. These include statements using the words believe, target, outlook, may, will, should, could, estimate, continue, expect, intend, plan, predict, potential, project and anticipate, and similar statements which do not describe the present or provide information about the past. There is no guarantee that the expected events or expected results will actually occur. Such statements reflect the current views of management of Mitel and are subject to a number of risks and uncertainties. These statements are based on many assumptions and factors, including general economic and market conditions, industry conditions, operational and other factors. Any changes in these assumptions or other factors could cause actual results to differ materially from current expectations. All forward-looking statements attributable to Mitel or Polycom, or persons acting on either of their behalf, are expressly qualified in their entirety by the cautionary statements set forth in this paragraph. Undue reliance should not be placed on such statements. In addition, material risks that could cause actual results to differ from forward-looking statements include: the inherent uncertainty associated with financial or other projections; the integration of Mitel and Polycom and the ability to recognize the anticipated benefits from the combination of Mitel and Polycom; the ability to obtain required regulatory approvals for the transaction, the timing of obtaining such approvals and the risk that such approvals may result in the imposition of conditions that could adversely affect the expected benefits of the transaction; the risk that the conditions to the transaction are not satisfied on a timely basis or at all and the failure of the transaction to close for any other reason; risks relating to the value of the Mitel common shares to be issued in connection with the transaction; the anticipated size of the markets and continued demand for Mitel and Polycom products and services, the impact of competitive products and pricing and disruption to
Mitel’s and Polycom’s respective businesses that could result from the announcement of the transaction; access to available financing on a timely basis and on reasonable terms, including the refinancing of Mitel and Polycom debt to fund the cash portion of the consideration in connection with the transaction; the integration of Mavenir and the ability to recognize the anticipated benefits from the acquisition of Mavenir; Mitel’s ability to achieve or sustain profitability in the future; fluctuations in quarterly and annual revenues and operating results; fluctuations in foreign exchange rates; current and ongoing global economic instability, political unrest and related sanctions; intense competition; reliance on channel partners for a significant component of sales; dependence upon a small number of outside contract manufacturers to manufacture products; and, Mitel’s ability to successfully implement and achieve its business strategies, including its growth of the company through acquisitions and the integration of recently acquired businesses and realization of synergies, including the pending acquisition of Polycom. Additional risks are described under the heading “Risk Factors” in Mitel’s Annual Report on Form 10-K for the year ended December 31, 2015 and in Mitel’s Quarterly Report on Form 10-Q for the quarter ended March 31, 2016 filed with the U.S. Securities and Exchange Commission (the “SEC”) and Canadian securities regulatory authorities on February 29, 2016 and May 5, 2016, respectively, and in Polycom’s Annual Report on Form 10-K for the year ended December 31, 2015 and in Polycom’s Quarterly Report on Form 10-Q for the quarter ended March 31, 2016 filed with the SEC on February 29, 2016 and April 28, 2016, respectively. Forward-looking statements speak only as of the date they are made. Except as required by law, neither Mitel nor Polycom has any intention or obligation to update or to publicly announce the results of any revisions to any of the forward-looking statements to reflect actual results, future events or developments, changes in assumptions or changes in other factors affecting the forward-looking statements.
2 | ©2015 Mitel. Proprietary and Confidential.
|
Non-GAAP Financial Measurements
In an effort to provide investors with additional information regarding the company’s results as determined by generally accepted accounting principles (GAAP), the company also discusses, in its earnings press release and earnings presentation materials, the following Non-GAAP information which management believes provides useful information to investors. Mitel provides a reconciliation between GAAP and non-GAAP financial information in our quarterly results announcements and in the supplemental slides used in conjunction with the company’s quarterly call. This information is available on our website at www.mitel.com under the “Investor Relations” section http://investor.mitel.com/events.cfm.
Non-GAAP Financial Measures
This presentation includes references to non-GAAP financial measures including Adjusted EBITDA, non-GAAP net income, non-GAAP operating expenses, non-GAAP Revenues and non-GAAP Gross Margin. Non-GAAP financial measures do not have any standardized meaning and are therefore unlikely to be comparable to similar measures presented by other companies. We use these non-GAAP financial measures to assist management and investors in understanding our past financial performance and prospects for the future, including changes in our operating results, trends and marketplace performance, exclusive of unusual events or factors which do not directly affect what we consider to be our core operating performance. Non-GAAP measures are among the primary indicators management uses as a basis for our planning and forecasting of future periods. Investors are cautioned that non-GAAP financial measures should not be relied upon as a substitute for financial measures prepared in accordance with generally accepted accounting principles. Please see the reconciliation of non-GAAP financial measures to the most directly comparable U.S. GAAP measure attached to our quarterly results announcement.
Mitel completed the acquisition of Mavenir Systems Inc. on April 29, 2015. “As reported” results in our quarterly results announcement and the attached tables refer to the U.S. GAAP results of Mitel, which include the results of Mavenir from the date of acquisition. Pro-forma results reflect the results of the company as if it had been fully combined with Mavenir Systems for the full presented period. Non-GAAP Revenues and non-GAAP Gross Margin have been adjusted to exclude the effect of purchase accounting. These adjustments have no impact on Mitel’s business or cash flows, but adversely affect the
Company`s reported revenues and gross margin in the period following an acquisition. For a reconciliation of Mitel’s as-reported results to the pro-forma results and non-GAAP results, please see the tables attached to our quarterly announcement as well as the Form 8-K presenting combined historical results of Mitel and Mavenir filed with the SEC on August 6, 2015.
Constant Currency Estimates
Management refers to growth rates at constant currency or adjusting for currency so that certain financial results can be viewed without the impact of fluctuations in foreign currency exchange rates, thereby facilitating period-to-period comparisons of the company’s business performance. Financial results adjusted for currency are calculated by translating prior period activity in local currency using the current period currency conversion rate. This approach is used for countries where the functional currency is the local currency. Generally, when the US dollar either strengthens or weakens against other currencies, the growth at constant currency rates or adjusting for currency will be higher or lower than growth reported at actual exchange rates.
Annualized Exit Monthly Cloud Recurring Revenue
Annualized Exit Monthly Cloud Recurring Revenue is a leading indicator of our anticipated cloud recurring revenues. We believe that trends in revenue are important to understanding the overall health of our cloud business. Our Annualized Exit Monthly Cloud Recurring Revenue equals our Monthly Cloud Recurring Revenue multiplied by 12. Our Monthly Cloud Recurring Revenue equals the monthly value of all customer subscriptions in effect at the end of a given month. For example, our Monthly Recurring Subscriptions at March 31, 2016 were $10.07 million. As such, our Annualized Exit Monthly Cloud Recurring Revenues at March 31, 2016 were $120.9 million.
3 | ©2015 Mitel. Proprietary and Confidential.
|
Additional Disclosures
No Offer or Solicitation
This communication is not intended to and does not constitute an offer to sell or the solicitation of an offer to subscribe for or buy or an invitation to purchase or subscribe for any securities or the solicitation of any vote or approval in any jurisdiction, nor shall there be any sale, issuance or transfer of securities in any jurisdiction in contravention of applicable law.
Important Information For investors
In connection with the proposed transaction between Mitel and Polycom, Mitel will file with the SEC a registration statement on Form S-4 that is expected to include a Proxy Statement of Polycom that also constitutes a Prospectus of Mitel (the “Proxy Statement/Prospectus”). Mitel will also prepare a proxy circular in accordance with applicable Canadian securities and corporate law (the “Proxy Circular”). Polycom plans to mail to its shareholders the definitive Proxy Statement/Prospectus in connection with the transaction. INVESTORS AND SECURITY HOLDERS OF POLYCOM ARE URGED TO READ THE PROXY STATEMENT/PROSPECTUS AND OTHER RELEVANT DOCUMENTS FILED OR TO BE FILED WITH THE SEC CAREFULLY WHEN IT BECOMES AVAILABLE BECAUSE IT WILL CONTAIN IMPORTANT INFORMATION ABOUT MITEL, POLYCOM, THE TRANSACTION AND RELATED MATTERS. Investors and security holders will be able to obtain free copies of the Proxy Statement/Prospectus and the Proxy Circular (when available) and other documents filed with the SEC by Mitel and Polycom through the website maintained by the SEC at www.sec.gov. Investors will also be able to obtain free copies of the Proxy Statement/Prospectus and the Proxy Circular (when available) and other documents filed with Canadian securities regulatory authorities by Mitel, through the website maintained by the Canadian Securities Administrators at www.sedar.com. In addition, investors and security holders will be able to obtain free copies of the documents filed with the SEC and Canadian securities regulatory authorities on Mitel’s website at investor.Mitel.com or by contacting Mitel’s Investor Relations Department at 469-574-8134. Copies of the documents filed with the SEC by Polycom will be available free of charge on Polycom’s website at http://investor.polycom.com/company/investor-relations/default.aspx or by contacting Polycom’s Investor Relations Department at 408-586-4271.
Participants in the Merger Solicitation
Mitel, Polycom and certain of their respective directors, executive officers and employees may be considered participants in the solicitation of proxies in connection with the proposed transaction. Information regarding the persons who may, under the rules of the SEC, be deemed participants in the solicitation of the shareholders of Polycom in connection with the transaction, including a description of their respective direct or indirect interests, by security holdings or otherwise, will be included in the Proxy Statement/Prospectus described above when it is filed with the SEC and Canadian securities regulatory authorities. Additional information regarding Mitel’s directors and executive officers is also included in Mitel’s Annual Report on Form 10-K/A, which was filed with the SEC and Canadian securities regulatory authorities on April 27, 2016, and information regarding Polycom’s directors and executive officers is also included in Polycom’s Annual Report on Form 10-K/A, which was filed with the SEC on April 28, 2016. These documents are available free of charge as described above.
4 | ©2015 Mitel. Proprietary and Confidential.
|
Q1 2016 Business Highlights
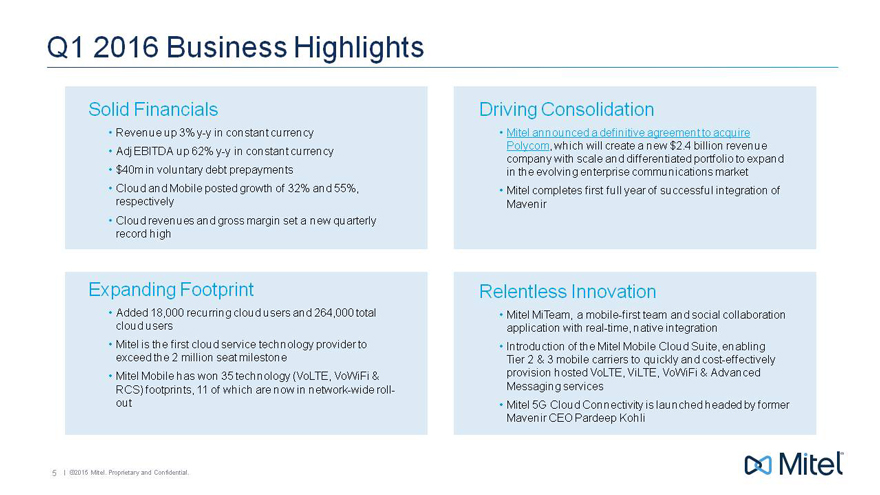
Solid Financials
Revenue up 3% y-y in constant currency
Adj EBITDA up 62% y-y in constant currency
$40m in voluntary debt prepayments
Cloud and Mobile posted growth of 32% and 55%, respectively
Cloud revenues and gross margin set a new quarterly record high
Driving Consolidation
Mitel announced a definitive agreement to acquire Polycom, which will create a new $2.4 billion revenue company with scale and differentiated portfolio to expand in the evolving enterprise communications market
Mitel completes first full year of successful integration of Mavenir
Expanding Footprint
Added 18,000 recurring cloud users and 264,000 total cloud users
Mitel is the first cloud service technology provider to exceed the 2 million seat milestone
Mitel Mobile has won 35 technology (VoLTE, VoWiFi & RCS) footprints, 11 of which are now in network-wide roll-out
Relentless Innovation
Mitel MiTeam, a mobile-first team and social collaboration application with real-time, native integration
Introduction of the Mitel Mobile Cloud Suite, enabling Tier 2 & 3 mobile carriers to quickly and cost-effectively provision hosted VoLTE, ViLTE, VoWiFi & Advanced Messaging services
Mitel 5G Cloud Connectivity is launched headed by former Mavenir CEO Pardeep Kohli
5 | ©2015 Mitel. Proprietary and Confidential.
|
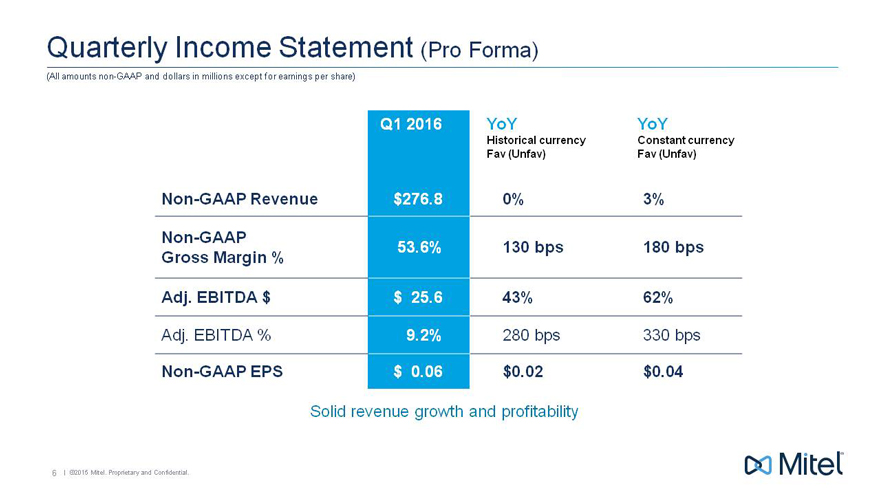
Quarterly Income Statement (Pro Forma)
(All amounts non-GAAP and dollars in millions except for earnings per share)
Q1 2016 YoY YoY
Historical currency Constant currency
Fav (Unfav) Fav (Unfav)
Non-GAAP Revenue $276.8 0% 3%
Non-GAAP 53.6% 130 bps 180 bps
Gross Margin %
Adj. EBITDA $ $ 25.6 43% 62%
Adj. EBITDA % 9.2% 280 bps 330 bps
Non-GAAP EPS $ 0.06 $0.02 $0.04
Solid revenue growth and profitability
6 | ©2015 Mitel. Proprietary and Confidential.
|
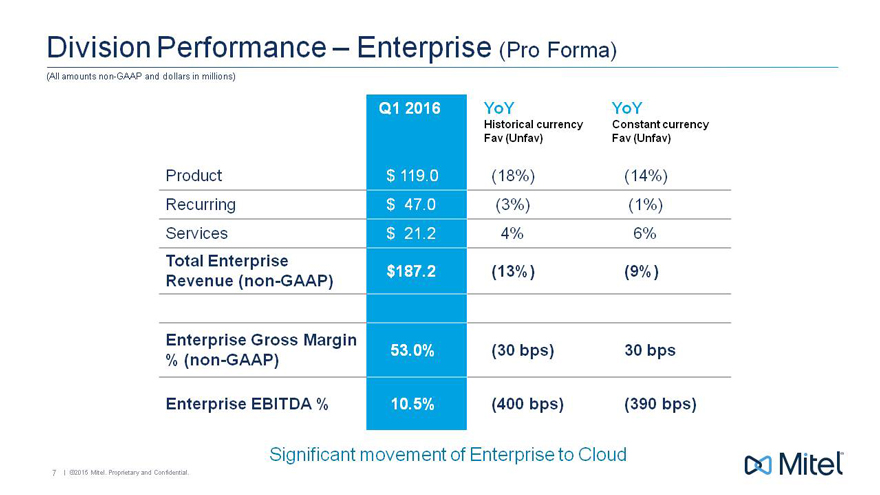
Division Performance – Enterprise (Pro Forma)
(All amounts non-GAAP and dollars in millions)
Q1 2016 YoY YoY
Historical currency Constant currency
Fav (Unfav) Fav (Unfav)
Product $ 119.0(18%)(14%)
Recurring $ 47.0(3%)(1%)
Services $ 21.2 4% 6%
Total Enterprise $ 187.2(13%)(9%)
Revenue (non-GAAP)
Enterprise Gross Margin 53.0%(30 bps) 30 bps
% (non-GAAP)
Enterprise EBITDA % 10.5%(400 bps)(390 bps)
Significant movement of Enterprise to Cloud
7 | ©2015 Mitel. Proprietary and Confidential.
|
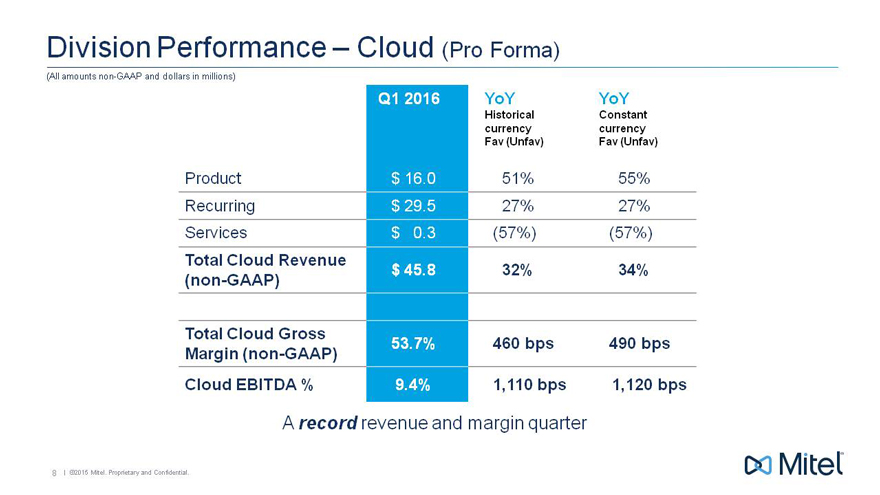
Division Performance – Cloud (Pro Forma)
(All amounts non-GAAP and dollars in millions)
Q1 2016 YoY YoY
Historical Constant
currency currency
Fav (Unfav) Fav (Unfav)
Product $ 16.0 51% 55%
Recurring $ 29.5 27% 27%
Services $ 0.3(57%)(57%)
Total Cloud Revenue $ 45.8 32% 34%
(non-GAAP)
Total Cloud Gross 53.7% 460 bps 490 bps
Margin (non-GAAP)
Cloud EBITDA % 9.4% 1,110 bps 1,120 bps
A record revenue and margin quarter
8 | ©2015 Mitel. Proprietary and Confidential.
|
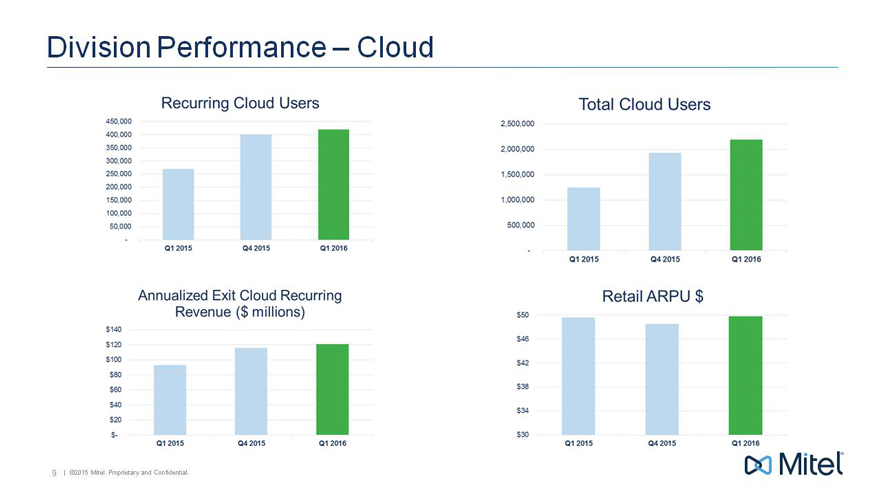
Division Performance – Cloud
450,000 400,000 350,000 250,000 200,000 150,000 100,000 50,000
Q1 2015 Q4 2015 Q1 2016
Total Cloud Users
2,500,000 2,000,000 1,500,000 1,000,000 500,000
Q1 2015 Q4 2015 Q1 2016
Annualized Exit Cloud Recurring Revenue ($ millions)
$140 $120 $100 $80 $60 $40 $20 $-
Q1 2015 Q4 2015 Q1 2016
Retail ARPU $
$60 $46 $42 $36 $34 $30
Q1 2015 Q4 2015 Q1 2016
9 | ©2015 Mitel. Proprietary and Confidential.
|
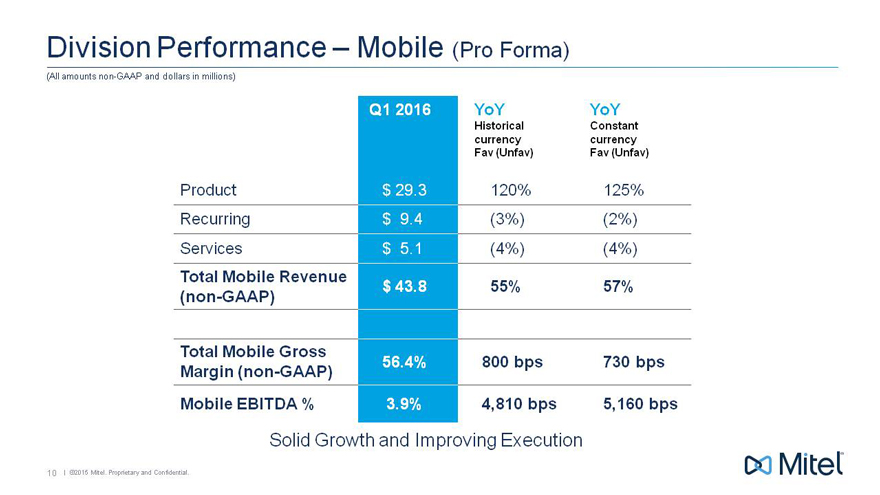
Division Performance – Mobile (Pro Forma)
(All amounts non-GAAP and dollars in millions)
Q1 2016 YoY YoY
Historical Constant
currency currency
Fav (Unfav) Fav (Unfav)
Product $ 29.3 120% 125%
Recurring $ 9.4(3%)(2%)
Services $ 5.1(4%)(4%)
Total Mobile Revenue $ 43.8 55% 57%
(non-GAAP)
Total Mobile Gross 56.4% 800 bps 730 bps
Margin (non-GAAP)
Mobile EBITDA % 3.9% 4,810 bps 5,160 bps
Solid Growth and Improving Execution
10 | ©2015 Mitel. Proprietary and Confidential.
|
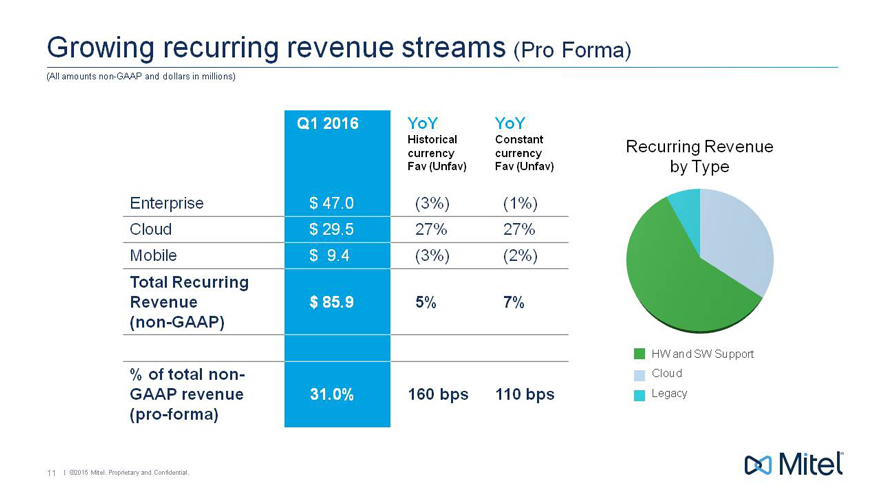
Growing recurring revenue streams (Pro Forma)
(All amounts non-GAAP and dollars in millions)
Q1 2016 YoY YoY
Historical Constant
currency currency
Fav (Unfav) Fav (Unfav)
Enterprise $ 47.0(3%)(1%)
Cloud $ 29.5 27% 27%
Mobile $ 9.4(3%)(2%)
Total Recurring
Revenue $ 85.9 5% 7%
(non-GAAP)
% of total non-
GAAP revenue 31.0% 160 bps 110 bps
(pro-forma)
Recurring Revenue by Type
HW and SW Support Cloud Legacy
11 | ©2015 Mitel. Proprietary and Confidential.
|
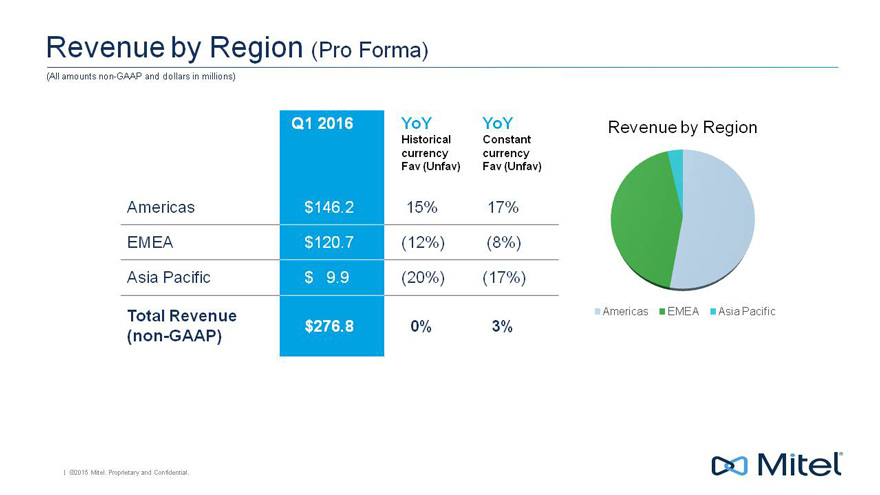
Revenue by Region (Pro Forma)
(All amounts non-GAAP and dollars in millions)
Q1 2016 YoY YoY
Historical Constant
currency currency
Fav (Unfav) Fav (Unf
Americas $146.2 15% 17%
EMEA $120.7(12%)(8%)
Asia Pacific $ 9.9(20%)(17%)
Total Revenue
(non-GAAP) $276.8 0% 3%
Revenue by Region
Americas EMEA Asia Pacific
| ©2015 Mitel. Proprietary and Confidential.
|
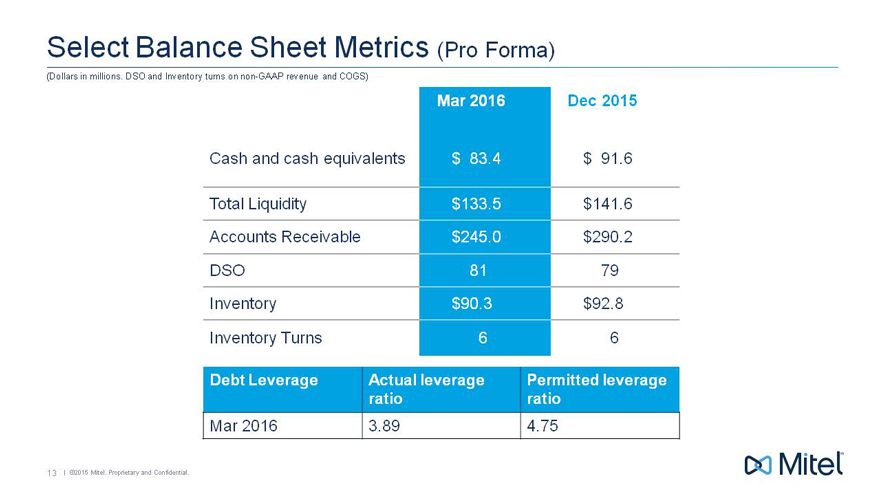
Select Balance Sheet Metrics (Pro Forma)
(Dollars in millions. DSO and Inventory turns on non-GAAP revenue and COGS)
Mar 2016 Dec 2015
Cash and cash equivalents $ 83.4 $ 91.6
Total Liquidity $ 133.5 $ 141.6
Accounts Receivable $ 245.0 $ 290.2
DSO 81 79
Inventory $ 90.3 $ 92.8
Inventory Turns 6 6
Debt Leverage Actual leverage Permitted leverage
ratio ratio
Mar 2016 3.89 4.75
13 | ©2015 Mitel. Proprietary and Confidential.
|
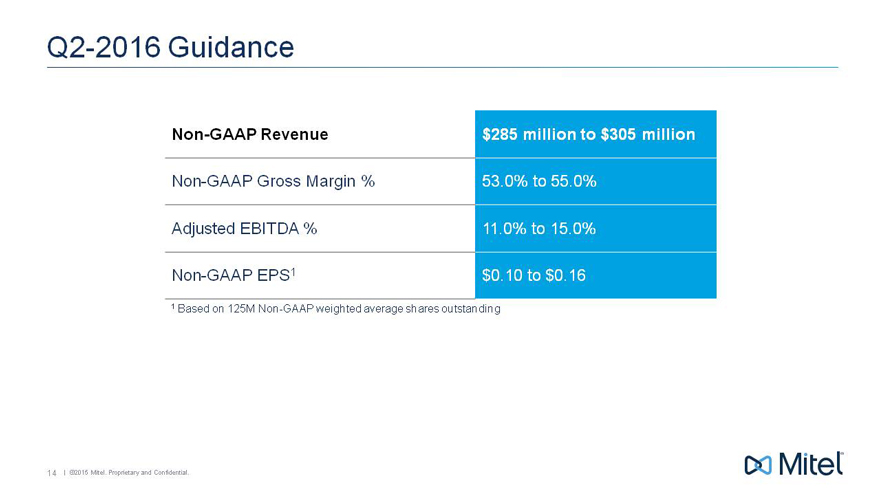
Q2-2016 Guidance
Non-GAAP Revenue $285 million to $305 million
Non-GAAP Gross Margin % 53.0% to 55.0%
Adjusted EBITDA % 11.0% to 15.0%
Non-GAAP EPS1 $0.10 to $0.16
1 Based on 125M Non-GAAP weighted average shares outstanding
14 | ©2015 Mitel. Proprietary and Confidential.
|

Recent Events
15 | ©2015 Mitel. Proprietary and Confidential.
|
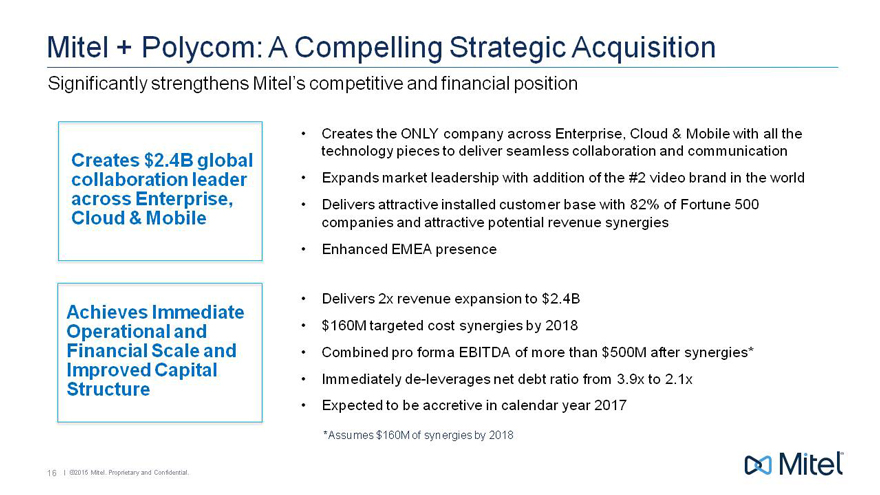
Mitel + Polycom: A Compelling Strategic Acquisition
Significantly strengthens Mitel’s competitive and financial position
Creates $2.4B global collaboration leader across Enterprise, Cloud & Mobile
Achieves Immediate Operational and Financial Scale and Improved Capital Structure
Creates the ONLY company across Enterprise, Cloud & Mobile with all the technology pieces to deliver seamless collaboration and communication
Expands market leadership with addition of the #2 video brand in the world
Delivers attractive installed customer base with 82% of Fortune 500 companies and attractive potential revenue synergies
Enhanced EMEA presence
Delivers 2x revenue expansion to $2.4B
$160M targeted cost synergies by 2018
Combined pro forma EBITDA of more than $500M after synergies*
Immediately de-leverages net debt ratio from 3.9x to 2.1x
Expected to be accretive in calendar year 2017
*Assumes $160M of synergies by 2018
16 | ©2015 Mitel. Proprietary and Confidential.
|

Transaction Highlights
Transaction Summary
Mitel to acquire Polycom in a $1.96 billion transaction
Polycom shareholders will receive $3.12 per share in cash and 1.31 Mitel common shares for each share they hold
Represents 22% premium to Polycom’s “unaffected” share price on April 5, 2016
Transaction Structure
Combined company to be owned 40% by current Mitel shareholders and 60% by current Polycom shareholders
Polycom brand to be retained
Rich McBee to become CEO; Steve Spooner to become CFO
Combined company to be headquartered in Ottawa, Canada
2 Polycom directors to join Mitel board
Approvals and Timing
Unanimously approved by the Boards of Directors of both companies
Polycom and Mitel shareholder and regulatory approvals required
Expected to close in Q3 2016
17 | ©2015 Mitel. Proprietary and Confidential.
|
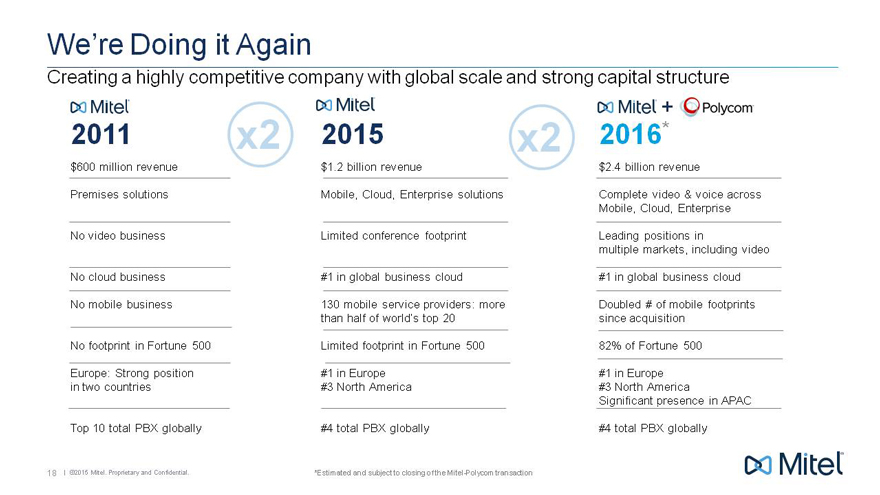
We’re Doing it Again
Creating a highly competitive company with global scale and strong capital structure
2011
$600 million revenue
Premises solutions
No video business
No cloud business
No mobile business
No footprint in Fortune 500
Europe: Strong position in two countries
Top 10 total PBX globally
x2
2015
$1.2 billion revenue
Mobile, Cloud, Enterprise solutions
Limited conference footprint
#1 in global business cloud
130 mobile service providers: more than half of world’s top 20
Limited footprint in Fortune 500
#1 in Europe
#3 North America #4 total PBX globally
2016*
$2.4 billion revenue
Complete video & voice across Mobile, Cloud, Enterprise
Leading positions in multiple markets, including video
#1 in global business cloud
Doubled # of mobile footprints since acquisition
82% of Fortune 500
#1 in Europe
#3 North America
Significant presence in APAC
#4 total PBX globally
x2
*Estimated and subject to closing of the Mitel-Polycom transaction
18 | ©2015 Mitel. Proprietary and Confidential.
|
Synergies Plan Update
Mitel/Polycom
May 2016
|
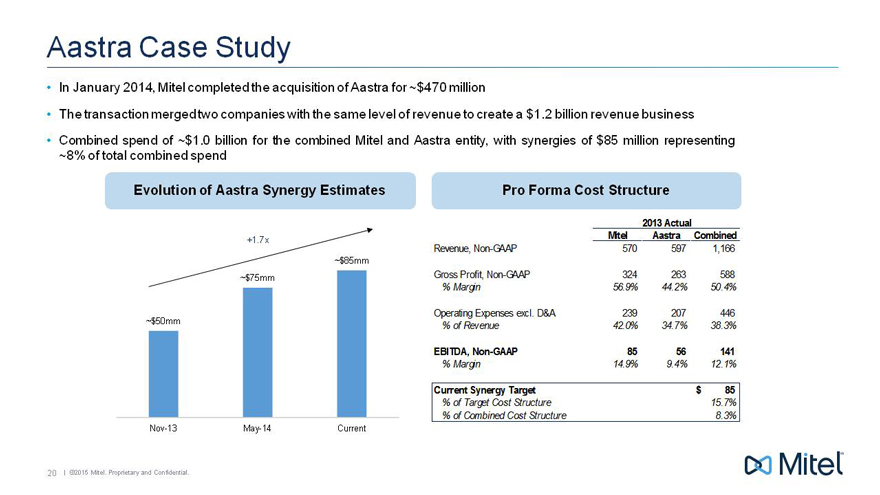
Aastra Case Study
In January 2014, Mitel completed the acquisition of Aastra for ~$470 million
The transaction merged two companies with the same level of revenue to create a $1.2 billion revenue business
Combined spend of ~$1.0 billion for the combined Mitel and Aastra entity, with synergies of $85 million representing ~8% of total combined spend
Evolution of Aastra Synergy Estimates
+1.7x
~$85mm
~$75mm
~$50mm
Nov-13 May-14 Current
Pro Forma Cost Structure
2013 Actual
Mitel Aastra Combined
Revenue, Non-GAAP 570 597 1,166
Gross Profit, Non-GAAP 324 263 588
% Margin 56.9% 44.2% 50.4%
Operating Expenses excl. D&A 239 207 446
% of Revenue 42.0% 34.7% 38.3%
EBITDA, Non-GAAP 85 56 141
% Margin 14.9% 9.4% 12.1%
Current Synergy Target $ 85
% of Target Cost Structure 15.7%
% of Combined Cost Structure 8.3%
20 | ©2015 Mitel. Proprietary and Confidential.
|
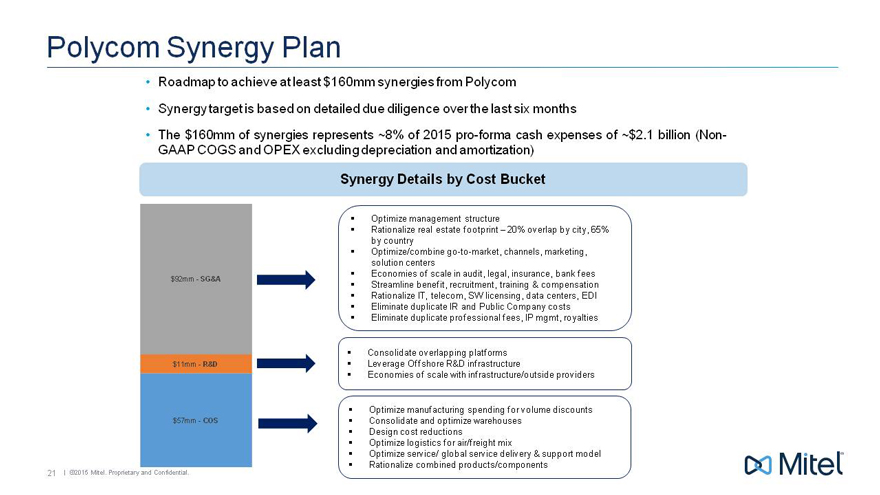
Polycom Synergy Plan
Roadmap to achieve at least $160mm synergies from Polycom
Synergy target is based on detailed due diligence over the last six months
The $160mm of synergies represents ~8% of 2015 pro-forma cash expenses of ~$2.1 billion (Non- GAAP COGS and OPEX excluding depreciation and amortization)
Synergy Details by Cost Bucket
$92mm—SG&A $11mm—R&D $57mm—COS
Optimize management structure
Rationalize real estate footprint – 20% overlap by city, 65% by country
Optimize/combine go-to-market, channels, marketing, solution centers
Economies of scale in audit, legal, insurance, bank fees
Streamline benefit, recruitment, training & compensation
Rationalize IT, telecom, SW licensing, data centers, EDI
Eliminate duplicate IR and Public Company costs
Eliminate duplicate professional fees, IP mgmt, royalties
Consolidate overlapping platforms
Leverage Offshore R&D infrastructure
Economies of scale with infrastructure/outside providers
Optimize manufacturing spending for volume discounts
Consolidate and optimize warehouses
Design cost reductions
Optimize logistics for air/freight mix
Optimize service/ global service delivery & support model
Rationalize combined products/components
21 | ©2015 Mitel. Proprietary and Confidential.
|
Appendix
22 | ©2015 Mitel. Proprietary and Confidential.
|
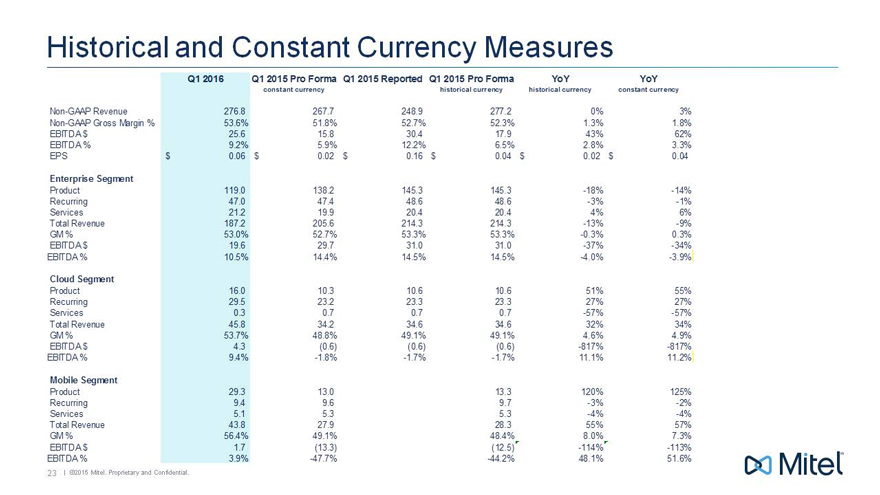
Historical and Constant Currency Measures
Q1 2016 Q1 2015 Pro Forma Q1 2015 Reported Q1 2015 Pro Forma YoY YoY
constant currency historical currency historical currency constant currency
Non-GAAP Revenue 276.8 267.7 248.9 277.2 0% 3%
Non-GAAP Gross Margin % 53.6% 51.8% 52.7% 52.3% 1.3% 1.8%
EBITDA $ 25.6 15.8 30.4 17.9 43% 62%
EBITDA % 9.2% 5.9% 12.2% 6.5% 2.8% 3.3%
EPS $ 0.06 $ 0.02 $ 0.16 $ 0.04 $ 0.02 $ 0.04
Enterprise Segment
Product 119.0 138.2 145.3 145.3 -18% -14%
Recurring 47.0 47.4 48.6 48.6 -3% -1%
Services 21.2 19.9 20.4 20.4 4% 6%
Total Revenue 187.2 205.6 214.3 214.3 -13% -9%
GM % 53.0% 52.7% 53.3% 53.3% -0.3% 0.3%
EBITDA $ 19.6 29.7 31.0 31.0 -37% -34%
EBITDA % 10.5% 14.4% 14.5% 14.5% -4.0% -3.9%
Cloud Segment
Product 16.0 10.3 10.6 10.6 51% 55%
Recurring 29.5 23.2 23.3 23.3 27% 27%
Services 0.3 0.7 0.7 0.7 -57% -57%
Total Revenue 45.8 34.2 34.6 34.6 32% 34%
GM % 53.7% 48.8% 49.1% 49.1% 4.6% 4.9%
EBITDA $ 4.3(0.6)(0.6)(0.6) -817% -817%
EBITDA % 9.4% -1.8% -1.7% -1.7% 11.1% 11.2%
Mobile Segment
Product 29.3 13.0 13.3 120% 125%
Recurring 9.4 9.6 9.7 -3% -2%
Services 5.1 5.3 5.3 -4% -4%
Total Revenue 43.8 27.9 28.3 55% 57%
GM % 56.4% 49.1% 48.4% 8.0% 7.3%
EBITDA $ 1.7(13.3)(12.5) -114% -113%
EBITDA % 3.9% -47.7% -44.2% 48.1% 51.6%
23 | ©2015 Mitel. Proprietary and Confidential.
|

#Mitel