UNITED STATES SECURITIES AND EXCHANGE COMMISSION
Washington, D.C. 20549
FORM N-CSR
CERTIFIED SHAREHOLDER REPORT OF REGISTERED
MANAGEMENT INVESTMENT COMPANIES
INVESTMENT COMPANY ACT FILE NUMBER: 811-21080
EXACT NAME OF REGISTRANT AS SPECIFIED IN CHARTER: Calamos Convertible Opportunities and Income Fund
| | | |
| ADDRESS OF PRINCIPAL EXECUTIVE OFFICES: | | 2020 Calamos Court, Naperville, |
| | | Illinois 60563-2787 |
| | | |
| NAME AND ADDRESS OF AGENT FOR SERVICE: | | James S. Hamman, Jr., Secretary, |
| | | Calamos Advisors LLC |
| | | 2020 Calamos Court |
| | | Naperville, Illinois |
| | | 60563-2787 |
REGISTRANT’S TELEPHONE NUMBER, INCLUDING AREA CODE: (630) 245-7200
DATE OF FISCAL YEAR END: October 31, 2007
DATE OF REPORTING PERIOD: November 1, 2006 through April 30, 2007
TABLE OF CONTENTS
ITEM 1. REPORTS TO SHAREHOLDERS
Include a copy of the report transmitted to stockholders pursuant to Rule 30e-1 under the Act (17 CFR 270.30e-1).
| Calamos Convertible Opportunities and Income Fund (CHI) |
| Semiannual Report April 30, 2007 |
Managing Your Calamos Funds Investments
Calamos Investments offers several convenient means to monitor, manage and feel confident about your Calamos investment choice.
TABLE OF CONTENTS
| | | | | |
| Letter to Shareholders | | | 1 | |
| | | | | |
| Economic and Market Review | | | 3 | |
| | | | | |
| Investment Team Interview | | | 4 | |
| | | | | |
| Schedule of Investments | | | 7 | |
| | | | | |
| Statement of Assets and Liabilities | | | 15 | |
| | | | | |
| Statement of Operations | | | 16 | |
| | | | | |
| Statements of Changes In Net Assets | | | 17 | |
| | | | | |
| Notes to Financial Statements | | | 18 | |
| | | | | |
| Financial Highlights | | | 24 | |
| | | | | |
| Report of Independent Registered Public Accounting Firm | | | 25 | |
| | | | | |
| About Closed-End Funds | | | 29 | |
| | | | | |
| Leverage | | | 30 | |
| | | | | |
| Level Rate Distribution Policy and Automatic Dividend Reinvestment Plan | | | 31 | |
| | | | | |
| The Calamos Investments Advantage | | | 32 | |
| | | | | |
| Calamos Closed-End Funds | | | 33 | |
| | | |
| 24-HOUR AUTOMATED SHAREHOLDER ASSISTANCE |
| | | |
800.823.7386 | | Through a single toll-free number, Calamos 24-Hour Shareholder Assistance is fast and easy. |
| | | |
| | | • Get fund prices and account balances |
| | | • Review recent transactions |
| | | • Order statements, literature and more |
| | | |
| PERSONAL ASSISTANCE |
| | | |
800.582.6959 | | Dial this toll-free number to speak with a knowledgeable Client Services Representative who can help answer questions or address issues concerning your Calamos Fund. |
| | | |
| YOUR FINANCIAL ADVISOR |
| | | |
| | | We encourage you to talk to your financial advisor to determine how Calamos Investments can benefit your investment portfolio based on your financial goals, risk tolerance, time horizon and income needs. |
Go Paperless!
Sign Up for e-Delivery
It’s convenient, it’s timely and it helps reduce mailbox clutter.
You can view shareholder communications, including fund prospectuses, annual reports and proxy statements online long before the printed publications would have arrived by traditional mail.
Visit www.calamos.com and sign up for e-delivery.
Visit www.calamos.com for timely fund performance, detailed fund profiles,
fund news and insightful market commentary.
Letter to Shareholders
Dear Fellow Shareholders:
Enclosed is your semiannual report for the six months ended April 30, 2007. As always, we value the opportunity to communicate with you and encourage you to review these materials with care. You’ll find share price and NAV performance information, commentary about the Fund and markets, portfolio allocations, as well as a complete listing of holdings and financial highlights.
As you’ll learn in this report, the Fund posted a solid gain for the period and continued to provide a stable monthly dividend to shareholders. We believe the Fund’s performance—both during the period and since its inception—speaks to the value of dynamically blending securities from different asset classes to pursue returns and manage risk.
This year marks an important milestone for us—30 years of helping investors achieve their long-term goals. When I look back to 1977, in many ways, it was a very different world. Personal computers were years away from being standard office equipment, and we still did calculations with pencils, paper and French curves. The Dow Jones Industrial Average was trading well below the 13,000 close it achieved in April. In fact, it was trading below 1,000! Without the benefit of today’s technologies, we were less connected to other countries and markets.
Although much has changed since 1977, the core values that guided Calamos Investments then continue to inform each decision we make today. We place you, our shareholders, first. We recognize the assets you entrust with us are the result of hard work and carefully thought-out choices. We regard the management of your assets as both a responsibility and an honor—one which we welcome with the utmost dedication.
We continue to believe strongly in the value of teamwork. Each Calamos fund is managed by a team of investment professionals. In our view, teams maximize individual talent and the best ideas emerge from an environment of collaboration. As we have grown, we have continued to strengthen our team by adding new and talented associates. I’m pleased to announce that during these past six months, this growth has continued with the addition of seasoned fixed-income and cash management investment professionals to our ranks.
Thirty years ago, innovative and entrepreneurial spirit served to set us apart. Then, we were using convertible securities—which were little understood—to maximize return potential while managing risk. Throughout our history, we have continually challenged ourselves to understand and maximize the potential of the evolving marketplace—indeed, the world. We believe that globalization has given rise to truly exciting opportunities for growth and progress, and believe that this fund is well positioned to participate in the dynamic global marketplace.
| | | | | | | |
| | | Convertible Opportunities and Income Fund | | | | |
| | | Letter to Shareholders SEMIANNUAL REPORT | | | 1 | |
Letter to Shareholders
We view the long-term results we achieve for you as the most important measure of our success. Consistent with this, we seek to invest ahead of events rather than chase performance, and always keep a close eye on understanding and managing risk. As we have for 30 years, we view this focus on risk management—on protecting your principal over the long-term—as a key differentiator of our investment process.
If you have any questions about your portfolio, please contact your financial advisor, or, contact us at 800.582.6959, Monday through Friday from 8:00 a.m. to 6:00 p.m., Central Time.
We thank you for your trust and look forward to helping you achieve your financial goals in the years to come.
Sincerely,
John P. Calamos, Sr.
Chairman, CEO and Co-CIO
Calamos Advisors LLC
This report is for informational purposes only and should not be considered investment advice.
| | | |
| | | Convertible Opportunities and Income Fund |
| 2 | | SEMIANNUAL REPORT Letter to Shareholders |
Economic and Market Review
For the latest market and
economic outlook, please visit
our website at www.calamos.com
and select the
“Individual Investors” button.
We believe the U.S. economy has entered a period of mid-cycle slowdown, as evidenced by factors such as softness in first-quarter gross domestic product, the slide of sub-prime mortgage market and the slump in the housing market.
That said, periods of more subdued growth are normal and do not necessarily signal an imminent recession. In fact, we believe the economy is sound. While gas prices have increased again, core inflation is in an acceptable range. Under Chairman Bernanke, the Fed has done a good job of managing the economy and has sufficient room to move rates either up or down. On the whole, consumers have access to credit. Productivity and labor trends remain positive. Despite higher prices at the gas pump, consumer trends are strong, with good gains in wage growth supporting consumer spending. Earnings growth seems likely to drop from double-digit levels in 2006, but we believe this is simply a return to more normal levels. Merger-and-acquisition activity and stock buy-backs also further the case that corporate America appears to be on solid ground.
Although the housing market remains a source of apprehension for many, it is important to remember that many factors in the global economy suggest the potential for continued strength, including its diversification, productivity gains, inflation containment and global reach. As evidence of this, consider that since the 1980s, the U.S. economy has experienced rolling recessions in various sectors (including agriculture, commodities, banking, and information technology)—while avoiding a significant overall decline.
The high-yield market benefited from strong issuance, particularly in 2007; and defaults have remained near record lows. Unlike the equity markets, which experienced considerable volatility throughout the period, the high-yield market climbed at a fairly steady pace. Lower-quality credits outperformed the higher tiers of the high-yield universe for the period. Credit spreads remained narrow, particularly in the CCC segment of the market.
Convertible securities continued to offer investors compelling opportunities. Issuance remained strong, particularly in 2007, and valuations continued to improve. For the six-month period overall, investors rewarded lower-quality convertible securities most; speculative-grade issues outperformed investment-grade issues. From a sector perspective, cyclical and value-oriented companies outperformed growth sectors. However, as in the equity markets, indications emerged that the tide may be turning away from cyclical and lower-quality issues. After the February market correction, investors began to return their attention to higher-quality, growth-oriented convertibles.
History has shown that even during periods of economic slowdown, the markets may offer considerable upside potential. This has held true during the semiannual period. Looking forward, we believe many opportunities exist for long-term investors, across asset classes. With its focus on higher-yielding securities with good fundamentals, we believe the Fund is well positioned for this environment.
This report is presented for informational purposes and should not be considered investment advice.
| | | | | | | |
| | | Convertible Opportunities and Income Fund | | | | |
| | | Economic and Market Review SEMIANNUAL REPORT | | | 3 | |
Investment Team Interview
In the following interview, the Calamos Investment Team, led by Co-Chief Investment Officers John P. Calamos, Sr. and Nick P. Calamos, CFA, discuss the Fund’s performance, strategy and positioning during the six-month period ended April 30, 2007.
TOTAL RETURN*
Common Shares — Inception 06/26/02
| | | | | | | | | | | | | |
| | | 6 | | | | | | Since |
| | | Months | | 1 Year | | Inception ** |
| On Share Price | | | 8.38 | % | | | 10.60 | % | | | 19.15 | % |
| On NAV | | | 8.66 | | | | 11.52 | | | | 15.88 | |
| | |
| * | | Total return measures net investment income and capital gain or loss from portfolio investments, assuming reinvestment of income and capital gains distributions. |
| |
| ** | | Annualized since inception. |
Q. How did the Fund perform over the reporting period?
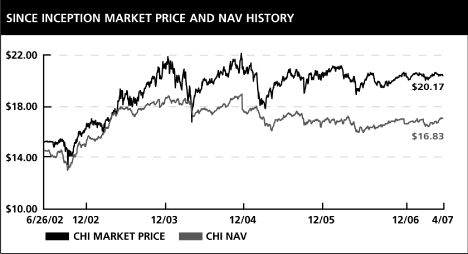
A. Calamos Convertible Opportunities and Income Fund (CHI) posted strong gains over the semiannual period. Its underlying portfolio (as represented by net asset value, or NAV) returned 8.66% for the six-month period, outpacing the CS High Yield Index,1 up 7.65%. On a market price basis, the Fund returned 8.38%.
The Fund continued to provide shareholders with a steady level of income. Throughout the period, the Fund delivered a stable monthly distribution of $0.1500 per share. Since June 2003, the Fund has maintained a distribution of at least this level.
As of April 30, 2007, the Fund traded at a premium of 19.85% to its NAV, reflecting continued strong investor demand for shares.
DISTRIBUTION HISTORY
(LATEST 12 MONTHS)
| | | | | |
| Date Paid | | Per share |
| April | | $ | 0.1500 | |
| March | | | 0.1500 | |
| February | | | 0.1500 | |
| January | | | 0.3701 | ‡ |
| December | | | 0.1500 | |
| November | | | 0.1500 | |
| October | | | 0.1500 | |
| September | | | 0.1500 | |
| August | | | 0.1500 | |
| July | | | 0.1500 | |
| June | | | 0.1500 | |
| May | | | 0.1500 | |
| | |
| ‡ | | Includes $0.3201 in net realized short-term capital gains and $0.0500 in net investment income. |
Monthly distributions are from net investment income, short-term capital gains and/or long-term capital gains. For more details please go to the Tax Center located at www.calamos.com.
Q. What do you believe to be the most compelling merits of the Fund?
A. The Fund has demonstrated its ability to deliver a steady distribution and good total return through varying interest rate and market climates. Despite rising short-term rates, this continued through the period, thanks to the Fund’s focus on less-interest rate sensitive issues.
We believe that the Fund provides investors with an attractive complement to a traditional fixed income investment. We think of the Fund as an “enhanced fixed-income” strategy, in that it is focused on delivering an attractive income stream with the potential for capital gains. Our strategy involves opportunistically blending “straight” (non-convertible) corporate bonds with convertible securities to create a risk-managed portfolio of the most compelling high yield issues.
| | | |
| | | Convertible Opportunities and Income Fund |
| 4 | | SEMIANNUAL REPORT Investment Team Interview |
Investment Team Interview
As we noted, the securities in the portfolio tend to have considerably less interest-rate sensitivity compared with traditional fixed-income securities. Moreover, high-yield and convertible bonds tend to have greater sensitivity to the equity markets. This was beneficial during the reporting period as the equity market advanced briskly, particularly after the brief correction that began in February.
Q. Tell us more about the potential benefits of blending non-convertible (“straight”) corporate bonds with a complementary allocation to convertible bonds.
A. Having the flexibility to invest in both straight corporate bonds and convertible bonds provides us with a larger universe of choices. Also, including convertible securities opportunistically helps us to manage risk and enhance return potential over full market cycles. During periods of volatility in advancing equity markets—such as we experienced in 2007—convertibles may be particularly advantageous, because higher volatility increases the value of the conversion feature of a convertible issue.
SECTOR ALLOCATION
| | | | | |
| Consumer Discretionary | | | 27.7 | % |
| Financials | | | 16.5 | |
| Information Technology | | | 9.9 | |
| Energy | | | 9.3 | |
| Consumer Staples | | | 7.6 | |
| Materials | | | 6.8 | |
| Industrials | | | 5.8 | |
| Health Care | | | 5.7 | |
| Utilities | | | 5.5 | |
| Telecommunication Services | | | 2.7 | |
Sector allocations are based on net assets and may vary over time.
Q. What specific factors contributed to the Fund’s gains?
A. The Fund’s advance was broad based, fuelled by positive returns across all market sectors. On an absolute basis, the Fund’s consumer staples, financials and health care positions were among those posting the highest returns. Performance relative to the index benefited from security selection in financials (specifically, companies with capital market sensitivity) and in consumer staples.
Both the allocations to straight and convertible bonds delivered positive returns. Against the backdrop of a rising equity market, convertibles performed most strongly.
Q. What factors hindered performance?
A. Relative to the CS High Yield index, the Fund’s performance was tempered by security selection in the consumer discretionary and information technology sectors. Also, our bias toward higher quality credits slowed the Fund’s pace versus the index, as the most speculative issues outperformed. That said, we believe that our more prudent approach makes sense, particularly in a slowing economic environment. Simply put, in our view, a higher coupon or income stream can’t make up for a default.
Q. How did your leverage strategy mitigate the negative influence of interest rate increases?
A. Leverage strategies typically involve borrowing at very short-term rates and investing the proceeds at long-term rates. As short-term rates rise, the profitability of leverage activities may decrease if there is not a commensurate increase in long-term rates. During the period, short-term and long-term rates generally held steady.
| | | | | | | |
| | | Convertible Opportunities and Income Fund | | | | |
| | | Investment Team Interview SEMIANNUAL REPORT | | | 5 | |
Investment Team Interview
However, we have been able to mitigate the influence of rate increases through our use of interest rate swaps. We had locked in a majority of the cost of leverage earlier in the interest rate cycle, when rates were lower. (For more on the Fund’s use of leverage and interest rate swaps, see the section “Leverage.”)
QUALITY ALLOCATION
| | | | | |
| Weighted Average Credit Quality | | | BB | + |
| AAA | | | 1.6 | % |
| AA | | | 3.9 | |
| A | | | 11.4 | |
| BBB | | | 17.6 | |
| BB | | | 24.8 | |
| B | | | 30.9 | |
| CCC or below | | | 4.2 | |
| Not Rated | | | 5.6 | |
Data is based on portfolio holdings. Credit quality shown reflects the higher of the ratings of Standard & Poor’s Corporation or Moody’s Investors Service, Inc. Ratings are relative, subjective and not absolute standards of quality. Excludes equity securities and cash.
Q. What is your outlook for the Fund?
A. We’re optimistic about the prospects of the Fund. Through rigorous individual security research, we have built a portfolio of companies with respectable balance sheets and good prospects for sustainable growth.
The health of corporate America should continue to provide support for financially sound high-yield issuers. However, given that the economy is slowing, we believe that the most speculative high-yield securities merit particular caution. Consistent with our view that the U.S. economy has entered a period of mid-cycle slowdown, we’re continuing to emphasize investment grade issues and issues from the higher tiers of the high yield universe, while avoiding truly distressed issues. A great deal of credit has been extended during the past few years, and investors seem to be complacent in owning virtually any corporate debt; this is underscored by historically tight spreads in the CCC rated segment of the debt market. We believe a more prudent approach is the better course.
We believe that the inclusion of convertible securities in the Fund will continue to benefit shareholders. As we noted, convertible securities tend to benefit from rising equity markets and volatility. Higher volatility tends to increase the value of the bond’s conversion feature. Although valuations have improved, our research shows that the convertible market still offers attractively valued securities.
| | |
| 1 | | The CS High Yield Index is an unmanaged index of high yield debt securities. |
| |
| Source: Russell/Mellon Analytical Services LLC. |
| | | |
| | | Convertible Opportunities and Income Fund |
| 6 | | SEMIANNUAL REPORT Investment Team Interview |
Schedule of Investments
APRIL 30, 2007 (UNAUDITED)
| | | | | | | | | |
| PRINCIPAL | | | | | | |
| AMOUNT | | | | | VALUE | |
| |
| CORPORATE BONDS (76.4%) | | | | |
| | | | | Consumer Discretionary (27.9%) | | | | |
| $ | 3,184,000 | | | Asbury Automotive Group, Inc.*
7.625%, 03/15/17 | | $ | 3,215,840 | |
| | 11,827,000 | | | Beazer Homes USA, Inc.
8.375%, 04/15/12 | | | 11,797,432 | |
| | 4,549,000 | | | DEX Media, Inc.
8.000%, 11/15/13 | | | 4,787,823 | |
| | 11,063,000 | | | DIRECTV Financing Company, Inc.
8.375%, 03/15/13 | | | 11,726,780 | |
| | 4,799,000 | | | EchoStar DBS Corp.
7.125%, 02/01/16 | | | 5,020,954 | |
| 7,251,000 GBP | | EMI Group, PLC
9.750%, 05/20/08 | | | 15,007,319 | |
| | 6,368,000 | | | Expedia, Inc.
7.456%, 08/15/18 | | | 6,689,909 | |
| | 5,459,000 | | | Ford Motor Company
8.625%, 11/01/10 | | | 5,592,751 | |
| | 5,004,000 | | | GameStop Corp.^
8.000%, 10/01/12 | | | 5,360,535 | |
| | 1,365,000 | | | General Motors Acceptance Corp.
6.875%, 09/15/11 | | | 1,370,863 | |
| | | | | General Motors Corp.^
| | | | |
| | 8,188,000 | | | 7.200%, 01/15/11
| | | 7,840,010 | |
| | 1,365,000 | | | 7.125%, 07/15/13 | | | 1,264,331 | |
| | | | | Goodyear Tire & Rubber Company
| | | | |
| | 7,733,000 | | | 7.000%, 03/15/28
| | | 7,501,010 | |
| | 3,639,000 | | | 7.857%, 08/15/11^ | | | 3,825,499 | |
| | 2,729,000 | | | Group 1 Automotive, Inc.
8.250%, 08/15/13 | | | 2,838,160 | |
| | 5,231,000 | | | Hanes Brands, Inc.^*‡
8.735%, 12/15/14 | | | 5,401,007 | |
| | 3,639,000 | | | Hasbro, Inc.
6.600%, 07/15/28 | | | 3,615,954 | |
| | 5,231,000 | | | Idearc, Inc.*
8.000%, 11/15/16 | | | 5,479,472 | |
| | 2,729,000 | | | Interpublic Group of Companies, Inc.
7.250%, 08/15/11 | | | 2,827,926 | |
| | 12,737,000 | | | Isle of Capri Casinos, Inc.
9.000%, 03/15/12 | | | 13,357,929 | |
| | 2,511,000 | | | Jarden Corp.
7.500%, 05/01/17 | | | 2,583,191 | |
| | 2,522,000 | | | Kellwood Company^
7.625%, 10/15/17 | | | 2,350,781 | |
| | 3,639,000 | | | Landry’s Restaurants, Inc.^
7.500%, 12/15/14 | | | 3,639,000 | |
| | 2,729,000 | | | Liberty Media Corp.
8.250%, 02/01/30 | | | 2,749,326 | |
| | 3,412,000 | | | Linens ‘n Things, Inc.^‡
10.981%, 01/15/14 | | | 3,228,605 | |
| | 15,921,000 | | | MGM Mirage^
8.375%, 02/01/11 | | | 16,975,766 | |
| | 7,096,000 | | | NCL Holding, ASA
10.625%, 07/15/14 | | | 7,096,000 | |
| | 4,094,000 | | | Oxford Industries, Inc.
8.875%, 06/01/11 | | | 4,267,995 | |
| | 4,549,000 | | | Phillips-Van Heusen Corp.^
8.125%, 05/01/13 | | | 4,821,940 | |
| | 1,820,000 | | | Rent-A-Center, Inc.
7.500%, 05/01/10 | | | 1,847,300 | |
| | 2,593,000 | | | RH Donnelley Financial Corp.*
10.875%, 12/15/12 | | | 2,819,888 | |
| | 4,549,000 | | | Royal Caribbean Cruises, Ltd.^
7.500%, 10/15/27 | | | 4,527,415 | |
| | 6,368,000 | | | Service Corporation International*
7.500%, 04/01/27 | | | 6,399,840 | |
| | 728,000 | | | Station Casinos, Inc.
6.875%, 03/01/16 | | | 687,960 | |
| | 7,278,000 | | | Time Warner, Inc.
7.625%, 04/15/31 | | | 8,256,345 | |
| | 11,554,000 | | | Vail Resorts, Inc.
6.750%, 02/15/14 | | | 11,727,310 | |
| | 4,549,000 | | | Warnaco Group, Inc.
8.875%, 06/15/13 | | | 4,861,744 | |
| | | | | Warner Music Group
| | | | |
| | 7,233,000 | | | 7.375%, 04/15/14
| | | 6,979,845 | |
| 910,000 GBP | | 8.125%, 04/15/14 | | | 1,815,178 | |
| | 728,000 | | | Wynn Las Vegas, LLC
6.625%, 12/01/14 | | | 733,460 | |
| | | | | | | | |
| | | | | | | | 222,890,393 | |
| | | | | | | | |
| | | | | | | | | |
| | | | | Consumer Staples (8.6%) | | | | |
| | 910,000 | | | Alimentation Couche-Tard Inc.
7.500%, 12/15/13 | | | 944,125 | |
| | 2,156,000 | | | Alliance One International, Inc.*
8.500%, 05/15/12 | | | 2,236,850 | |
| | 2,684,000 | | | Central Garden & Pet Company
9.125%, 02/01/13 | | | 2,811,490 | |
| | 4,549,000 | | | Chattem, Inc.^
7.000%, 03/01/14 | | | 4,571,745 | |
| | 3,639,000 | | | Chiquita Brands International, Inc.^
8.875%, 12/01/15 | | | 3,511,635 | |
| | 5,641,000 | | | Del Monte Foods Company
8.625%, 12/15/12 | | | 5,951,255 | |
| | 11,372,000 | | | Dole Food Company, Inc.^
8.875%, 03/15/11 | | | 11,571,010 | |
| | 3,184,000 | | | NBTY, Inc.
7.125%, 10/01/15 | | | 3,239,720 | |
| | | | | Pilgrim’s Pride Corp.
| | | | |
| | 5,959,000 | | | 8.375%, 05/01/17^
| | | 6,063,282 | |
| | 1,547,000 | | | 7.625%, 05/01/15 | | | 1,574,073 | |
| | 5,095,000 | | | Playtex Products, Inc.
8.000%, 03/01/11 | | | 5,349,750 | |
| | | | | Reynolds American, Inc.
| | | | |
| | 5,004,000 | | | 7.300%, 07/15/15
| | | 5,368,101 | |
| | 2,729,000 | | | 7.625%, 06/01/16 | | | 2,999,417 | |
| | 9,098,000 | | | Smithfield Foods, Inc.
7.750%, 05/15/13 | | | 9,507,410 | |
See accompanying Notes to Schedule of Investments.
| | | | | |
Convertible Opportunities and Income Fund
Schedule of Investments SEMIANNUAL REPORT | | | 7 | |
Schedule of Investments
APRIL 30, 2007 (UNAUDITED)
| | | | | | | | | |
| PRINCIPAL | | | | | | |
| AMOUNT | | | | | VALUE | |
| |
| $ | 2,729,000 | | | SUPERVALU, Inc.
7.500%, 11/15/14 | | $ | 2,865,450 | |
| | | | | | | | |
|
| | | | | | | | 68,565,313 | |
| | | | | | | | |
| | | | | | | | | |
| | | | | Energy (11.0%) | | | | |
| | 6,323,000 | | | Arch Western Finance, LLC
6.750%, 07/01/13 | | | 6,307,192 | |
| | 8,188,000 | | | Chesapeake Energy Corp.
7.500%, 06/15/14 | | | 8,617,870 | |
| | 5,914,000 | | | Comstock Resources, Inc.
6.875%, 03/01/12 | | | 5,810,505 | |
| | 2,729,000 | | | Forest Oil Corp.
8.000%, 12/15/11 | | | 2,872,272 | |
| | 4,247,000 | | | Giant Industries, Inc.
11.000%, 05/15/12 | | | 4,507,129 | |
| | 2,274,000 | | | Hanover Compressor Company
9.000%, 06/01/14 | | | 2,467,290 | |
| | 1,820,000 | | | Mariner Energy, Inc.
7.500%, 04/15/13 | | | 1,815,450 | |
| | 5,095,000 | | | Petrohawk Energy Corp.
7.125%, 04/01/12 | | | 5,069,525 | |
| | 10,280,000 | | | Petróleo Brasileiro, SA
8.375%, 12/10/18 | | | 12,438,800 | |
| | | | | Premcor Refining Group, Inc.
| | | | |
| | 5,823,000 | | | 9.500%, 02/01/13
| | | 6,267,889 | |
| | 2,479,000 | | | 7.500%, 06/15/15 | | | 2,560,938 | |
| | 2,729,000 | | | Range Resources Corp.
7.375%, 07/15/13 | | | 2,831,338 | |
| | 3,184,000 | | | Superior Energy Services, Inc.
6.875%, 06/01/14 | | | 3,247,680 | |
| | 6,368,000 | | | Swift Energy Company
9.375%, 05/01/12 | | | 6,686,400 | |
| | 4,549,000 | | | Whiting Petroleum Corp.^
7.250%, 05/01/13
| | | 4,480,765 | |
| | | | | Williams Companies, Inc.
| | | | |
| | 9,098,000 | | | 7.750%, 06/15/31
| | | 9,848,585 | |
| | 1,820,000 | | | 7.500%, 01/15/31^ | | | 1,938,300 | |
| | | | | | | | |
| | | | | | | | 87,767,928 | |
| | | | | | | | |
| | | | | | | | | |
| | | | | Financials (2.8%) | | | | |
| | | | | E*TRADE Financial Corp.
| | | | |
| | 6,005,000 | | | 7.375%, 09/15/13
| | | 6,297,744 | |
| | 4,094,000 | | | 7.875%, 12/01/15
| | | 4,436,873 | |
| | 1,092,000 | | | 8.000%, 06/15/11 | | | 1,153,425 | |
| | 6,823,000 | | | Leucadia National Corp.
7.000%, 08/15/13 | | | 6,874,172 | |
| | 1,547,000 | | | Omega Healthcare Investors, Inc.
7.000%, 04/01/14 | | | 1,576,006 | |
| | 2,286,000 | | | Senior Housing Properties Trust
7.875%, 04/15/15 | | | 2,406,015 | |
| | | | | | | | |
| | | | | | | | 22,744,235 | |
| | | | | | | | |
| | | | | | | | | |
| | | | | Health Care (5.0%) | | | | |
| | 3,730,000 | | | Ameripath, Inc.^
10.500%, 04/01/13 | | | 4,079,687 | |
| | 3,639,000 | | | Angiotech Pharmaceuticals, Inc.^
7.750%, 04/01/14 | | | 3,375,173 | |
| | 7,688,000 | | | Bausch & Lomb, Inc.
7.125%, 08/01/28 | | | 7,813,630 | |
| | 1,547,000 | | | Bio-Rad Laboratories, Inc.
7.500%, 08/15/13 | | | 1,610,814 | |
| | 682,000 | | | DaVita, Inc.
7.250%, 03/15/15 | | | 700,755 | |
| | 4,094,000 | | | Psychiatric Solutions, Inc.
7.750%, 07/15/15 | | | 4,206,585 | |
| | 7,733,000 | | | Tenet Healthcare Corp.^
9.250%, 02/01/15 | | | 7,771,665 | |
| | 4,094,000 | | | Valeant Pharmaceuticals International | | | | |
| | | | | 7.000%, 12/15/11 | | | 3,991,650 | |
| | 5,914,000 | | | Vanguard Health Systems, Inc.
9.000%, 10/01/14 | | | 6,157,952 | |
| | | | | | | | |
| | | | | | | | 39,707,911 | |
| | | | | | | | |
| | | | | | | | | |
| | | | | Industrials (3.9%) | | | | |
| | 2,274,000 | | | Armor Holdings, Inc.
8.250%, 08/15/13 | | | 2,399,070 | |
| | 682,000 | | | Belden CDT, Inc.*
7.000%, 03/15/17 | | | 700,920 | |
| | 910,000 | | | FTI Consulting, Inc.^
7.625%, 06/15/13 | | | 944,125 | |
| | 2,729,000 | | | Gardner Denver, Inc.
8.000%, 05/01/13 | | | 2,906,385 | |
| | 2,729,000 | | | GATX Corp.^
8.875%, 06/01/09 | | | 2,920,611 | |
| | 1,163,000 | | | Global Cash Access, Inc.
8.750%, 03/15/12 | | | 1,224,058 | |
| | 1,456,000 | | | H&E Equipment Service, Inc.
8.375%, 07/15/16 | | | 1,587,040 | |
| | | | | IKON Office Solutions, Inc.
| | | | |
| | 1,820,000 | | | 7.750%, 09/15/15
| | | 1,915,550 | |
| | 1,820,000 | | | 6.750%, 12/01/25 | | | 1,653,936 | |
| | 1,365,000 | | | Sequa Corp.
8.875%, 04/01/08 | | | 1,409,362 | |
| | 6,368,000 | | | Terex Corp.
7.375%, 01/15/14 | | | 6,686,400 | |
| | 1,820,000 | | | Trinity Industries, Inc.
6.500%, 03/15/14 | | | 1,820,000 | |
| | 3,161,000 | | | WESCO International, Inc.
7.500%, 10/15/17 | | | 3,255,830 | |
| | 1,820,000 | | | Williams Scotsman International, Inc. | | | | |
| | | | | 8.500%, 10/01/15 | | | 1,938,300 | |
| | | | | | | | |
| | | | | | | | 31,361,587 | |
| | | | | | | | |
| | | | | | | | | |
| | | | | Information Technology (5.8%) | | | | |
| | 5,307,000 | | | Advanced Micro Devices, Inc.^
7.750%, 11/01/12 | | | 5,227,395 | |
| | 4,094,000 | | | Amkor Tech, Inc.^
9.250%, 06/01/16 | | | 4,360,110 | |
| | 637,000 | | | Avago Technologies^
11.875%, 12/01/15 | | | 730,957 | |
See accompanying Notes to Schedule of Investments.
| | | |
| 8 | | Convertible Opportunities and Income Fund
SEMIANNUAL REPORT Schedule of Investments |
Schedule of Investments
APRIL 30, 2007 (UNAUDITED)
| | | | | | | | | |
| PRINCIPAL | | | | | | |
| AMOUNT | | | | | VALUE | |
| |
| $ | 3,639,000 | | | Celestica, Inc.^
7.875%, 07/01/11 | | $ | 3,602,610 | |
| | 4,549,000 | | | Flextronics International, Ltd.
6.500%, 05/15/13 | | | 4,531,941 | |
| | 5,231,000 | | | Freescale Semiconductor, Inc.^*
8.875%, 12/15/14 | | | 5,263,694 | |
| | 6,232,000 | | | SunGard Data Systems, Inc.
9.125%, 08/15/13 | | | 6,714,980 | |
| | | | | Xerox Corp.
| | | | |
| | 8,643,000 | | | 8.000%, 02/01/27^ | | | 8,859,075 | |
| | 6,368,000 | | | 7.625%, 06/15/13 | | | 6,718,240 | |
| | | | | | | | |
| | | | | | | | 46,009,002 | |
| | | | | | | | | |
| | | | | Materials (6.9%) | | | | |
| | 2,729,000 | | | Boise Cascade Company
7.125%, 10/15/14 | | | 2,729,000 | |
| | 910,000 | | | Crown Holdings, Inc.
7.750%, 11/15/15 | | | 966,875 | |
| | 4,549,000 | | | Equistar Chemicals, LP
10.625%, 05/01/11 | | | 4,821,940 | |
| | 728,000 | | | Gibraltar Industries, Inc.
8.000%, 12/01/15 | | | 737,100 | |
| | | | | Ineos Group Holdings, PLC*
| | | | |
| 4,367,000 | | EUR | 7.875%, 02/15/16
| | | 5,646,554 | |
| | 910,000 | | | 8.500%, 02/15/16^ | | | 884,975 | |
| | 6,782,000 | | | IPSCO, Inc.
8.750%, 06/01/13 | | | 7,289,762 | |
| | 4,549,000 | | | Mosaic Company*
7.625%, 12/01/16 | | | 4,878,802 | |
| | 3,639,000 | | | Neenah Paper, Inc.
7.375%, 11/15/14 | | | 3,548,025 | |
| | 7,278,000 | | | Sealed Air Corp.*
6.875%, 07/15/33 | | | 7,312,258 | |
| | 5,299,000 | | | Terra Industries, Inc.*
7.000%, 02/01/17 | | | 5,219,515 | |
| | 1,820,000 | | | Texas Industries, Inc.
7.250%, 07/15/13
| | | 1,895,075 | |
| | | | | Union Carbide Corp.
| | | | |
| | 3,639,000 | | | 7.500%, 06/01/25
| | | 3,738,345 | |
| | 2,820,000 | | | 7.875%, 04/01/23 | | | 3,019,092 | |
| | 2,911,000 | | | Westlake Chemical Corp.
6.625%, 01/15/16 | | | 2,845,502 | |
| | | | | | | | |
| | | | | | | | 55,532,820 | |
| | | | | | | | |
| | | | | Telecommunication Services (3.6%) | | | | |
| | 2,729,000 | | | CenturyTel, Inc.
6.875%, 01/15/28 | | | 2,718,480 | |
| | 546,000 | | | Citizens Communications Company
9.000%, 08/15/31 | | | 601,965 | |
| | 5,459,000 | | | Leap Wireless International, Inc.^*
9.375%, 11/01/14 | | | 5,854,777 | |
| | 2,729,000 | | | Qwest Communications International, Inc.^
7.750%, 02/15/31 | | | 2,783,580 | |
| 4,094,000 | | CAD | Rogers Wireless, Inc.
7.625%, 12/15/11 | | | 4,107,132 | |
| | 9,098,000 | | | Sprint Nextel Corp.
7.375%, 08/01/15 | | | 9,420,169 | |
| | 3,639,000 | | | Syniverse Technologies, Inc.
7.750%, 08/15/13 | | | 3,584,415 | |
| | | | | | | | |
| | | | | | | | 29,070,518 | |
| | | | | | | | |
| | | | | Utilities (0.9%) | | | | |
| | 1,137,000 | | | Edison International
7.730%, 06/15/09 | | | 1,199,535 | |
| | 910,000 | | | NRG Energy, Inc.
7.250%, 02/01/14 | | | 944,125 | |
| | 5,459,000 | | | TXU Corp.
6.500%, 11/15/24 | | | 4,751,590 | |
| | | | | | | | 6,895,250 | |
| | | | | | | | |
| | | | | TOTAL CORPORATE BONDS | | | | |
| | | | | (Cost $588,313,159) | | | 610,544,957 | |
| | | | | | | | |
| | | | | | | | | |
| CONVERTIBLE BONDS (23.8%) | | | | |
| | | | | Consumer Discretionary (6.6%) | | | | |
| | 16,500,000 | | | Interpublic Group of Companies, Inc.*‡
5.705%, 06/15/09 | | | 20,658,940 | |
| | 1,870,000 | | | Liberty Media Corp. (CBS Corp.)8
3.250%, 03/15/31 | | | 1,612,875 | |
| 5,500,000 | | GBP | Punch Taverns Redwood Jersey Company Ltd.
5.000%, 12/14/10 | | | 14,652,218 | |
| 35,000,000 | | ZAR | Steinhoff International Holdings, Ltd.
5.700%, 07/31/13 | | | 5,404,287 | |
| | | | | United Auto Group, Inc.
| | | | |
| | 790,000 | | | 3.500%, 04/01/26^
| | | 840,362 | |
| | 570,000 | | | 3.500%, 04/01/26* | | | 606,338 | |
| | 7,500,000 | | | Walt Disney Company^
2.125%, 04/15/23 | | | 9,206,250 | |
| | | | | | | | |
| | | | | | | | 52,981,270 | |
| | | | | | | | |
| | | | | Consumer Staples (0.7%) | | | | |
| | 3,500,000 | | | Church & Dwight Company, Inc.
5.250%, 08/15/33 | | | 5,928,125 | |
| | | | | | | | |
| | | | | | | | | |
| | | | | Financials (1.5%) | | | | |
| | 11,000,000 | | | Prudential Financial, Inc.‡
2.600%, 11/15/35 | | | 11,722,480 | |
| | | | | | | | |
| | | | | | | | | |
| | | | | Health Care (0.9%) | | | | |
| | 6,500,000 | | | Wyeth^‡
4.877%, 01/15/24 | | | 7,210,450 | |
| | | | | | | | |
| | | | | | | | | |
| | | | | Industrials (4.4%) | | | | |
| | 4,000,000 | | | FTI Consuting, Inc.
3.750%, 07/15/12 | | | 5,535,000 | |
| | 10,500,000 | | | L-3 Communications Holdings, Inc.
3.000%, 08/01/35 | | | 11,405,625 | |
| | 8,250,000 | | | Lockheed Martin Corp.^‡
5.110%, 08/15/33 | | | 11,298,128 | |
| | 5,000,000 | | | Quanta Services, Inc.*
3.750%, 04/30/26 | | | 6,950,000 | |
| | | | | | | | |
| | | | | | | | 35,188,753 | |
| | | | | | | | |
See accompanying Notes to Schedule of Investments.
| | | | | |
Convertible Opportunities and Income Fund
Schedule of Investments SEMIANNUAL REPORT | | | 9 | |
Schedule of Investments
APRIL 30, 2007 (UNAUDITED)
| | | | | | | | | |
| PRINCIPAL | | | | | | |
| AMOUNT | | | | | VALUE | |
| |
| | | | | Information Technology (7.6%) | | | | |
| $ | 3,000,000 | | | Andrew Corp.
3.250%, 08/15/13 | | $ | 3,030,000 | |
| | 2,000,000 | | | ASM International NV
4.250%, 12/06/11 | | | 2,519,000 | |
| | 16,250,000 | | | Electronic Data Systems Corp.^
3.875%, 07/15/23 | | | 16,981,250 | |
| | 25,250,000 | | | Intel Corp.^
2.950%, 12/15/35 | | | 23,103,750 | |
| | 6,000,000 | | | Linear Technology Corp.*^
3.000%, 05/01/27 | | | 6,202,500 | |
| | | | | Mentor Graphics Corp.
| | | | |
| | 5,000,000 | | | 6.250%, 03/01/26* | | | 6,118,750 | |
| | 2,500,000 | | | 6.250%, 03/01/26^ | | | 3,059,375 | |
| | | | | | | | |
| | | | | | | | 61,014,625 | |
| | | | | | | | |
| | | | | | | | | |
| | | | | Utilities (2.1%) | | | | |
| 3,500,000 | | EUR | International Power, PLC
3.250%, 07/20/13 | | | 6,432,144 | |
| 2,950,000 | | GBP | Scottish & Southern Energy, PLC
3.750%, 10/29/09 | | | 9,957,366 | |
| | | | | | | | |
| | | | | | | | 16,389,510 | |
| | | | | | | | |
| | | | | | | | | |
| | | | | TOTAL CONVERTIBLE BONDS | | | | |
| | | | | (Cost $176,227,721) | | | 190,435,213 | |
| | | | | | | | |
| | | | | | | | | |
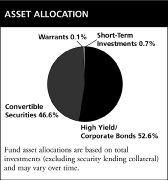
| SYNTHETIC CONVERTIBLE SECURITIES (8.9%) | | | | |
| Corporate Bonds (7.6%) | | | | |
| | | | | Consumer Discretionary (2.8%) | | | | |
| | 316,000 | | | Asbury Automotive Group, Inc.*
7.625%, 03/15/17 | | | 319,160 | |
| | 1,173,000 | | | Beazer Homes USA, Inc.
8.375%, 04/15/12 | | | 1,170,067 | |
| | 451,000 | | | DEX Media, Inc.
8.000%, 11/15/13 | | | 474,677 | |
| | 1,097,000 | | | DIRECTV Financing Company, Inc.
8.375%, 03/15/13 | | | 1,162,820 | |
| | 476,000 | | | EchoStar DBS Corp.
7.125%, 02/01/16 | | | 498,015 | |
| 719,000 | | GBP | EMI Group, PLC
9.750%, 05/20/08 | | | 1,488,107 | |
| | 632,000 | | | Expedia,Inc.
7.456%, 08/15/18 | | | 663,948 | |
| | 541,000 | | | Ford Motor Company
8.625%, 11/01/10 | | | 554,255 | |
| | 496,000 | | | GameStop Corp.^
8.000%, 10/01/12 | | | 531,340 | |
| | 135,000 | | | General Motors Acceptance Corp.
6.875%, 09/15/11 | | | 135,580 | |
| | | | | General Motors Corp.^
| | | | |
| | 812,000 | | | 7.200%, 01/15/11
| | | 777,490 | |
| | 135,000 | | | 7.125%, 07/15/13 | | | 125,044 | |
| | | | | Goodyear Tire & Rubber Company
| | | | |
| | 767,000 | | | 7.000%, 03/15/28
| | | 743,990 | |
| | 361,000 | | | 7.857%, 08/15/11^ | | | 379,501 | |
| | 271,000 | | | Group 1 Automotive, Inc.
8.250%, 08/15/13 | | | 281,840 | |
| | 519,000 | | | Hanes Brands, Inc.^*‡
8.735%, 12/15/14 | | | 535,867 | |
| | 361,000 | | | Hasbro, Inc.
6.600%, 07/15/28 | | | 358,714 | |
| | 519,000 | | | Idearc, Inc.*
8.000%, 11/15/16 | | | 543,652 | |
| | 271,000 | | | Interpublic Group of Companies, Inc.
7.250%, 08/15/11 | | | 280,824 | |
| | 1,263,000 | | | Isle of Capri Casinos, Inc.
9.000%, 03/15/12 | | | 1,324,571 | |
| | 249,000 | | | Jarden Corp.
7.500%, 05/01/17 | | | 256,159 | |
| | 250,000 | | | Kellwood Company^
7.625%, 10/15/17 | | | 233,028 | |
| | 361,000 | | | Landry’s Restaurants, Inc.^
7.500%, 12/15/14 | | | 361,000 | |
| | 271,000 | | | Liberty Media Corp.
8.250%, 02/01/30 | | | 273,018 | |
| | 338,000 | | | Linens ‘n Things, Inc.^‡
10.981%, 01/15/14 | | | 319,833 | |
| | 1,579,000 | | | MGM Mirage^
8.375%, 02/01/11 | | | 1,683,609 | |
| | 704,000 | | | NCL Holding, ASA
10.625%, 07/15/14 | | | 704,000 | |
| | 406,000 | | | Oxford Industries, Inc.
8.875%, 06/01/11 | | | 423,255 | |
| | 451,000 | | | Phillips-Van Heusen Corp.^
8.125%, 05/01/13 | | | 478,060 | |
| | 180,000 | | | Rent-A-Center, Inc.
7.500%, 05/01/10 | | | 182,700 | |
| | 257,000 | | | RH Donnelley Financial Corp.*
10.875%, 12/15/12 | | | 279,488 | |
| | 451,000 | | | Royal Caribbean Cruises, Ltd.^
7.500%, 10/15/27 | | | 448,860 | |
| | 632,000 | | | Service Corporation International*
7.500%, 04/01/27 | | | 635,160 | |
| | 72,000 | | | Station Casinos, Inc.
6.875%, 03/01/16 | | | 68,040 | |
| | 722,000 | | | Time Warner, Inc.
7.625%, 04/15/31 | | | 819,055 | |
| | 1,146,000 | | | Vail Resorts, Inc.
6.750%, 02/15/14 | | | 1,163,190 | |
| | 451,000 | | | Warnaco Group, Inc.
8.875%, 06/15/13 | | | 482,006 | |
| | | | | Warner Music Group
| | | | |
| | 717,000 | | | 7.375%, 04/15/14
| | | 691,905 | |
| 90,000 | | GBP | 8.125%, 04/15/14 | | | 179,523 | |
| | 72,000 | | | Wynn Las Vegas, LLC
6.625%, 12/01/14 | | | 72,540 | |
| | | | | | | | |
| | | | | | | | 22,103,891 | |
| | | | | | | | |
| | | | | | | | | |
| | | | | Consumer Staples (0.8%) | | | | |
| | 90,000 | | | Alimentation Couche-Tard Inc.
7.500%, 12/15/13 | | | 93,375 | |
See accompanying Notes to Schedule of Investments.
| | | |
| 10 | | Convertible Opportunities and Income Fund
SEMIANNUAL REPORT Schedule of Investments |
Schedule of Investments
APRIL 30, 2007 (UNAUDITED)
| | | | | | | | | |
| PRINCIPAL | | | | | | |
| AMOUNT | | | | | VALUE | |
| |
| $ | 214,000 | | | Alliance One International, Inc.*
8.500%, 05/15/12 | | $ | 222,025 | |
| | 266,000 | | | Central Garden & Pet Company
9.125%, 02/01/13 | | | 278,635 | |
| | 451,000 | | | Chattem, Inc.^
7.000%, 03/01/14 | | | 453,255 | |
| | 361,000 | | | Chiquita Brands International, Inc.^
8.875%, 12/01/15 | | | 348,365 | |
| | 559,000 | | | Del Monte Foods Company
8.625%, 12/15/12 | | | 589,745 | |
| | 1,128,000 | | | Dole Food Company, Inc.^
8.875%, 03/15/11 | | | 1,147,740 | |
| | 316,000 | | | NBTY, Inc.
7.125%, 10/01/15 | | | 321,530 | |
| | | | | Pilgrim’s Pride Corp.
| | | | |
| | 591,000 | | | 8.375%, 05/01/17^
| | | 601,342 | |
| | 153,000 | | | 7.625%, 05/01/15 | | | 155,678 | |
| | 505,000 | | | Playtex Products, Inc.
8.000%, 03/01/11 | | | 530,250 | |
| | | | | Reynolds American, Inc.
| | | | |
| | 496,000 | | | 7.300%, 07/15/15 | | | 532,090 | |
| | 271,000 | | | 7.625%, 06/01/16 | | | 297,853 | |
| | 902,000 | | | Smithfield Foods, Inc.
7.750%, 05/15/13 | | | 942,590 | |
| | 271,000 | | | SUPERVALU, Inc.
7.500%, 11/15/14 | | | 284,550 | |
| | | | | | | | |
| | | | | | | | 6,799,023 | |
| | | | | | | | |
| | | | | | | | | |
| | | | | Energy (1.1%) | | | | |
| | 627,000 | | | Arch Western Finance, LLC
6.750%, 07/01/13 | | | 625,432 | |
| | 812,000 | | | Chesapeake Energy Corp.
7.500%, 06/15/14 | | | 854,630 | |
| | 586,000 | | | Comstock Resources, Inc.
6.875%, 03/01/12 | | | 575,745 | |
| | 271,000 | | | Forest Oil Corp.
8.000%, 12/15/11 | | | 285,228 | |
| | 421,000 | | | Giant Industries, Inc.
11.000%, 05/15/12 | | | 446,786 | |
| | 226,000 | | | Hanover Compressor Company
9.000%, 06/01/14 | | | 245,210 | |
| | 180,000 | | | Mariner Energy, Inc.
7.500%, 04/15/13 | | | 179,550 | |
| | 505,000 | | | Petrohawk Energy Corp.
7.125%, 04/01/12 | | | 502,475 | |
| | 1,020,000 | | | Petróleo Brasileiro, SA
8.375%, 12/10/18 | | | 1,234,200 | |
| | | | | Premcor Refining Group, Inc.
| | | | |
| | 577,000 | | | 9.500%, 02/01/13
| | | 621,084 | |
| | 246,000 | | | 7.500%, 06/15/15 | | | 254,131 | |
| | 271,000 | | | Range Resources Corp.
7.375%, 07/15/13 | | | 281,163 | |
| | 316,000 | | | Superior Energy Services, Inc.
6.875%, 06/01/14 | | | 322,320 | |
| | 632,000 | | | Swift Energy Company
9.375%, 05/01/12 | | | 663,600 | |
| | 451,000 | | | Whiting Petroleum Corp.^
7.250%, 05/01/13 | | | 444,235 | |
| | | | | Williams Companies, Inc.
| | | | |
| | 902,000 | | | 7.750%, 06/15/31
| | | 976,415 | |
| | 180,000 | | | 7.500%, 01/15/31^ | | | 191,700 | |
| | | | | | | | |
| | | | | | | | 8,703,904 | |
| | | | | | | | |
| | | | | | | | | |
| | | | | Financials (0.3%) | | | | |
| | | | | E*TRADE Financial Corp.
| | | | |
| | 595,000 | | | 7.375%, 09/15/13
| | | 624,006 | |
| | 406,000 | | | 7.875%, 12/01/15
| | | 440,002 | |
| | 108,000 | | | 8.000%, 06/15/11 | | | 114,075 | |
| | 677,000 | | | Leucadia National Corp.
7.000%, 08/15/13 | | | 682,077 | |
| | 153,000 | | | Omega Healthcare Investors, Inc.
7.000%, 04/01/14 | | | 155,869 | |
| | 227,000 | | | Senior Housing Properties Trust
7.875%, 04/15/15 | | | 238,918 | |
| | | | | | | | |
| | | | | | | | 2,254,947 | |
| | | | | | | | |
| | | | | | | | | |
| | | | | Health Care (0.5%) | | | | |
| | 370,000 | | | Ameripath, Inc.^
10.500%, 04/01/13 | | | 404,688 | |
| | 361,000 | | | Angiotech Pharmaceuticals, Inc.^
7.750%, 04/01/14 | | | 334,828 | |
| | 762,000 | | | Bausch & Lomb, Inc.
7.125%, 08/01/28 | | | 774,452 | |
| | 153,000 | | | Bio-Rad Laboratories, Inc.
7.500%, 08/15/13 | | | 159,311 | |
| | 68,000 | | | DaVita, Inc.
7.250%, 03/15/15 | | | 69,870 | |
| | 406,000 | | | Psychiatric Solutions, Inc.
7.750%, 07/15/15 | | | 417,165 | |
| | 767,000 | | | Tenet Healthcare Corp.^
9.250%, 02/01/15 | | | 770,835 | |
| | 406,000 | | | Valeant Pharmaceuticals International
7.000%, 12/15/11 | | | 395,850 | |
| | 586,000 | | | Vanguard Health Systems, Inc.
9.000%, 10/01/14 | | | 610,172 | |
| | | | | | | | |
| | | | | | | | 3,937,171 | |
| | | | | | | | |
| | | | | | | | | |
| | | | | Industrials (0.4%) | | | | |
| | 226,000 | | | Armor Holdings, Inc.
8.250%, 08/15/13 | | | 238,430 | |
| | 68,000 | | | Belden CDT, Inc.*
7.000%, 03/15/17 | | | 69,886 | |
| | 90,000 | | | FTI Consulting, Inc.^
7.625%, 06/15/13 | | | 93,375 | |
| | 271,000 | | | Gardner Denver, Inc.
8.000%, 05/01/13 | | | 288,615 | |
| | 271,000 | | | GATX Corp.^
8.875%, 06/01/09 | | | 290,028 | |
| | 115,000 | | | Global Cash Access, Inc.
8.750%, 03/15/12 | | | 121,038 | |
See accompanying Notes to Schedule of Investments.
| | | | | |
Convertible Opportunities and Income Fund
Schedule of Investments SEMIANNUAL REPORT | | | 11 | |
Schedule of Investments
APRIL 30, 2007 (UNAUDITED)
| | | | | | | | | |
| PRINCIPAL | | | | | | |
| AMOUNT | | | | | VALUE | |
| |
| $ | 144,000 | | | H&E Equipment Service, Inc.
8.375%, 07/15/16 | | $ | 156,960 | |
| | | | | IKON Office Solutions, Inc.
| | | | |
| | 180,000 | | | 7.750%, 09/15/15
| | | 189,450 | |
| | 180,000 | | | 6.750%, 12/01/25 | | | 163,576 | |
| | 135,000 | | | Sequa Corp.
8.875%, 04/01/08 | | | 139,387 | |
| | 632,000 | | | Terex Corp.
7.375%, 01/15/14 | | | 663,600 | |
| | 180,000 | | | Trinity Industries, Inc.
6.500%, 03/15/14 | | | 180,000 | |
| | 314,000 | | | WESCO Distribution, Inc.
7.500%, 10/15/17 | | | 323,420 | |
| | 180,000 | | | Williams Scotsman International, Inc.
8.500%, 10/01/15 | | | 191,700 | |
| | | | | | | | |
| | | | | | | | 3,109,465 | |
| | | | | | | | |
| | | | | | | | | |
| | | | | Information Technology (0.6%) | | | | |
| | 526,000 | | | Advanced Micro Devices, Inc.^
7.750%, 11/01/12 | | | 518,110 | |
| | 406,000 | | | Amkor Tech, Inc.^
9.250%, 06/01/16 | | | 432,390 | |
| | 63,000 | | | Avago Technologies^
11.875%, 12/01/15 | | | 72,292 | |
| | 361,000 | | | Celestica, Inc.^
7.875%, 07/01/11 | | | 357,390 | |
| | 451,000 | | | Flextronics International, Ltd.
6.500%, 05/15/13 | | | 449,309 | |
| | 519,000 | | | Freescale Semiconductor, Inc.^*
8.875%, 12/15/14 | | | 522,244 | |
| | 618,000 | | | SunGard Data Systems, Inc.
9.125%, 08/15/13 | | | 665,895 | |
| | | | | Xerox Corp.
| | | | |
| | 857,000 | | | 8.000%, 02/01/27^
| | | 878,425 | |
| | 632,000 | | | 7.625%, 06/15/13 | | | 666,760 | |
| | | | | | | | |
| | | | | | | | 4,562,815 | |
| | | | | | | | |
| | | | | | | | | |
| | | | | Materials (0.7%) | | | | |
| | 271,000 | | | Boise Cascade Company
7.125%, 10/15/14 | | | 271,000 | |
| | 90,000 | | | Crown Holdings, Inc.
7.750%, 11/15/15 | | | 95,625 | |
| | 451,000 | | | Equistar Chemicals, LP
10.625%, 05/01/11 | | | 478,060 | |
| | 72,000 | | | Gibraltar Industries, Inc.
8.000%, 12/01/15 | | | 72,900 | |
| | | | | Ineos Group Holdings, PLC*
| | | | |
| 433,000 | | EUR | 7.875%, 02/15/16
| | | 559,871 | |
| | 90,000 | | | 8.500%, 02/15/16^ | | | 87,525 | |
| | 673,000 | | | IPSCO, Inc.
8.750%, 06/01/13 | | | 723,387 | |
| | 451,000 | | | Mosaic Company*
7.625%, 12/01/16 | | | 483,698 | |
| | 361,000 | | | Neenah Paper, Inc.
7.375%, 11/15/14 | | | 351,975 | |
| | 722,000 | | | Sealed Air Corp.*
6.875%, 07/15/33 | | | 725,398 | |
| | 526,000 | | | Terra Industries, Inc.*
7.000%, 02/01/17 | | | 518,110 | |
| | 180,000 | | | Texas Industries, Inc.
7.250%, 07/15/13 | | | 187,425 | |
| | | | | Union Carbide Corp.
| | | | |
| | 361,000 | | | 7.500%, 06/01/25
| | | 370,855 | |
| | 280,000 | | | 7.875%, 04/01/23 | | | 299,768 | |
| | 289,000 | | | Westlake Chemical Corp.
6.625%, 01/15/16 | | | 282,498 | |
| | | | | | | | |
| | | | | | | | 5,508,095 | |
| | | | | | | | |
| | | | | | | | | |
| | | | | Telecommunication Services (0.3%) | | | | |
| | 271,000 | | | CenturyTel, Inc.
6.875%, 01/15/28 | | | 269,955 | |
| | 54,000 | | | Citizens Communications Company
9.000%, 08/15/31 | | | 59,535 | |
| | 541,000 | | | Leap Wireless International, Inc.^*
9.375%, 11/01/14 | | | 580,223 | |
| | 271,000 | | | Qwest Communications International, Inc.^
7.750%, 02/15/31 | | | 276,420 | |
| 406,000 | | CAD | Rogers Wireless, Inc.
7.625%, 12/15/11 | | | 407,302 | |
| | 902,000 | | | Sprint Nextel Corp.
7.375%, 08/01/15 | | | 933,941 | |
| | 361,000 | | | Syniverse Technologies, Inc.
7.750%, 08/15/13 | | | 355,585 | |
| | | | | | | | |
| | | | | | | | 2,882,961 | |
| | | | | | | | |
| | | | | | | | | |
| | | | | Utilities (0.1%) | | | | |
| | 113,000 | | | Edison International
7.730%, 06/15/09 | | | 119,215 | |
| | 90,000 | | | NRG Energy, Inc.
7.250%, 02/01/14 | | | 93,375 | |
| | 541,000 | | | TXU Corp.
6.500%, 11/15/24 | | | 470,894 | |
| | | | | | | | |
| | | | | | | | 683,484 | |
| | | | | | | | |
| | | | | TOTAL CORPORATE BONDS | | | 60,545,756 | |
| | | | | | | | |
| | | | | | | | | |
| NUMBER OF | | | | | | |
| CONTRACTS | | | | | VALUE | |
| |
| Options (1.3%) | | | | |
| | | | | Consumer Discretionary (0.2%) | | | | |
| | 1,088 | | | Comcast Corp.#
Call, 01/17/09, Strike $28.37 | | | 396,938 | |
| | 105 | | | Garmin, Ltd.#
Call, 01/19/09, Strike $55.00 | | | 127,050 | |
| | 470 | | | Harley-Davidson, Inc.#
Call, 01/17/09, Strike $70.00 | | | 293,750 | |
| | | | | Nike, Inc.#
| | | | |
| | 360 | | | Call, 01/17/09, Strike $55.00 | | | 235,800 | |
| | 360 | | | Call, 01/17/09, Strike $50.00 | | | 338,400 | |
See accompanying Notes to Schedule of Investments.
| | | |
| 12 | | Convertible Opportunities and Income Fund
SEMIANNUAL REPORT Schedule of Investments |
Schedule of Investments
APRIL 30, 2007 (UNAUDITED)
| | | | | | | | | |
| NUMBER OF | | | | | | |
| CONTRACTS | | | | | VALUE | |
| |
| | 350 | | | Omnicom Group, Inc.#
Call, 01/17/09, Strike $100.00 | | $ | 567,000 | |
| | | | | | | | |
| | | | | | | | 1,958,938 | |
| | | | | | | | |
| | | | | | | | | |
| | | | | Consumer Staples (0.1%) | | | | |
| | 820 | | | Coca-Cola Company#
Call, 01/17/09, Strike $45.00 | | | 795,400 | |
| | 430 | | | Kroger Company#
Call, 01/17/09, Strike $30.00 | | | 156,950 | |
| | | | | | | | |
| | | | | | | | 952,350 | |
| | | | | | | | |
| | | | | | | | | |
| | | | | Financials (0.3%) | | | | |
| | 460 | | | A.G. Edwards, Inc.#
Call, 01/17/09, Strike $70.00 | | | 561,200 | |
| | 15 | | | Chicago Mercantile Exchange Holdings, Inc.#
Call, 01/19/08, Strike $510.00 | | | 86,475 | |
| | 450 | | | Franklin Resouces, Inc.#
Call, 01/17/09, Strike $125.00 | | | 1,107,000 | |
| | | | | Goldman Sachs Group, Inc.#
| | | | |
| | 85 | | | Call, 01/17/09, Strike $195.00
| | | 428,825 | |
| | 40 | | | Call, 01/17/09, Strike $220.00 | | | 144,000 | |
| | 120 | | | Lehman Brothers Holdings, Inc.#
Call, 01/19/08, Strike $75.00 | | | 100,800 | |
| | 130 | | | Merrill Lynch & Company, Inc.#
Call, 01/19/08, Strike $85.00 | | | 144,950 | |
| | | | | | | | |
| | | | | | | | 2,573,250 | |
| | | | | | | | |
| | | | | | | | | |
| | | | | Health Care (0.1%) | | | | |
| | 75 | | | Allergan, Inc.#
Call, 01/19/08, Strike $110.00 | | | 140,250 | |
| | 650 | | | Johnson & Johnson#
Call, 01/17/09, Strike $65.00 | | | 373,750 | |
| | | | | | | | |
| | | | | | | | 514,000 | |
| | | | | | | | |
| | | | | | | | | |
| | | | | Industrials (0.1%) | | | | |
| | 460 | | | General Dynamics Corp.#
Call, 01/17/09, Strike $75.00 | | | 591,100 | |
| | | | | | | | |
| | | | | | | | | |
| | | | | Information Technology (0.5%) | | | | |
| | 70 | | | Apple Computer, Inc.#
Call, 01/19/08, Strike $90.00 | | | 128,100 | |
| | 960 | | | Cisco Systems, Inc.#
Call, 01/17/09, Strike $27.50 | | | 432,000 | |
| | 280 | | | Hewlett-Packard Company#
Call, 01/19/08, Strike $40.00 | | | 148,400 | |
| | 500 | | | Infosys Technologies, Ltd.#
Call, 01/17/09, Strike $55.00 | | | 447,500 | |
| | 1,300 | | | Microsoft Corp.#
Call, 01/17/09, Strike $30.00 | | | 507,000 | |
| | 275 | | | Motorola, Inc.#
Call, 01/19/08, Strike $22.50 | | | 10,312 | |
| | 2,850 | | | Nokia Corp.#
Call, 01/17/09, Strike $22.50 | | | 1,467,750 | |
| | 1,600 | | | Oracle Corp.#
Call, 01/17/09, Strike $17.50 | | | 640,000 | |
| | | | | | | | |
| | | | | | | | 3,781,062 | |
| | | | | | | | |
| | | | | | | | | |
| | | | | Telecommunication Services (0.0%) | | | | |
| | 150 | | | America Movil, S.A. de C.V.#
Call, 01/17/09, Strike $50.00 | | | 165,000 | |
| | 100 | | | NII Holdings, Inc.#
Call, 01/17/09, Strike $80.00 | | | 149,000 | |
| | | | | | | | |
| | | | | | | | 314,000 | |
| | | | | | | | |
| | | | | TOTAL OPTIONS | | | 10,684,700 | |
| | | | | | | | |
| | | | | | | | | |
| | | | | TOTAL SYNTHETIC
CONVERTIBLE SECURITIES
(Cost $69,218,175) | | | 71,230,456 | |
| | | | | | | | |
| | | | | | | | | |
| NUMBER OF | | | | | | |
| SHARES | | | | | VALUE | |
| |
| CONVERTIBLE PREFERRED STOCKS (35.0%) | | | | |
| | | | | Consumer Discretionary (3.3%) | | | | |
| | 610,000 | | | Ford Motor Company Capital Trust II
6.500% | | | 21,838,000 | |
| | 4,000 | | | Stanley Works‡
6.975% | | | 4,293,500 | |
| | | | | | | | |
| | | | | | | | 26,131,500 | |
| | | | | | | | |
| | | | | | | | | |
| | | | | Consumer Staples (0.9%) | | | | |
| | 5,000 | | | Universal Corp.
6.750% | | | 7,408,750 | |
| | | | | | | | |
| | | | | | | | | |
| | | | | Energy (1.7%) | | | | |
| | 50,000 | | | Chesapeake Energy Corp.
6.250% | | | 13,925,000 | |
| | | | | | | | |
| | | | | | | | | |
| | | | | Financials (19.6%) | | | | |
| | 525,000 | | | Citigroup, Inc. (Genworth Financial, Inc.)‡ ¥
5.683% | | | 17,718,750 | |
| | 16,000 | | | Fortis Insurance, N.V. (Assurant, Inc.)*¥
7.750% | | | 23,286,256 | |
| | 240,000 | | | Lazard, Ltd.
6.625% | | | 11,102,400 | |
| | 850,000 | | | Lehman Brothers Holdings, Inc.
(General Mills, Inc.)
6.250% | | | 23,970,000 | |
| | 190,000 | | | Merrill Lynch & Company, Inc.
(Nuveen Investments, Inc.)¥
6.750% | | | 8,609,375 | |
| | 785,000 | | | MetLife, Inc.
6.375% | | | 25,818,650 | |
| | 55,000 | | | Reinsurance Group of America, Inc.
5.750% | | | 4,290,000 | |
| | 13,000 | CHF | | Swiss Re
6.000% | | | 12,040,083 | |
| | 310,000 | | | Washington Mutual, Inc.
5.375% | | | 17,065,500 | |
| | 450,000 | | | XL Capital, Ltd.
7.000% | | | 12,330,000 | |
| | | | | | | | |
| | | | | | | | 156,231,014 | |
| | | | | | | | |
See accompanying Notes to Schedule of Investments.
| | | | | |
Convertible Opportunities and Income Fund
Schedule of Investments SEMIANNUAL REPORT | | | 13 | |
Schedule of Investments
APRIL 30, 2007 (UNAUDITED)
| | | | | | | | | |
| NUMBER OF | | | | |
| SHARES | | | VALUE | | |
| |
| | | | | Health Care (1.9%) | | | | |
| | 215,000 | | | Schering-Plough Corp.
6.000% | | | $15,507,950 | |
| | | | | |
| | | | | Materials (2.5%) | | | | |
| | 105,000 | | | Freeport-McMoRan Copper & Gold, Inc.
6.750% | | | 11,396,700 | |
| | 1,000 | CHF | | Givaudan SA
5.375% | | | 8,484,568 | |
| | | | | | | | | |
| | | | | | | | 19,881,268 | |
| | | | | | | | | |
| | | | | Utilities (5.1%) | | | | |
| | 410,000 | | | AES Corp. Trust III
6.750% | | | 20,487,700 | |
| | 435,000 | | | CenterPoint Energy, Inc. (Time Warner, Inc.)‡3
2.000% | | | 16,572,630 | |
| | 65,000 | | | Southern Union Company
5.000% | | | 3,637,400 | |
| | | | | | | | | |
| | | | | | | | 40,697,730 | |
| | | | | | | | | |
| | | | | | | | | |
| | | | | TOTAL CONVERTIBLE
PREFERRED STOCKS | | | | |
| | | | | (Cost $240,134,962) | | | 279,783,212 | |
| | | | | | | | | |
| | | | | | | | | |
| WARRANTS (0.1%) | | | | | | |
| | | | | Consumer Discretionary (0.1%) | | | | |
| | 100,000 | | | Expedia, Inc.#
05/07/12, Strike $24.46 | | | 309,370 | |
| | 100,000 | | | IAC/InterActiveCorp#
05/07/12, Strike $30.54 | | | 740,620 | |
| | | | | | | | | |
| | | | | | | | 1,049,990 | |
| | | | | | | | | |
| | | | | | | | | |
| | | | | TOTAL WARRANTS | | | | |
| | | | | (Cost $831,500) | | | 1,049,990 | |
| | | | | | | | | |
| | | | | | | | | |
| PRINCIPAL | | | | | | |
| AMOUNT | | | | | VALUE | |
| |
| SHORT-TERM INVESTMENT (1.1%) | | | | |
| | | | | Commercial Paper (1.1%) | | | | |
| $ | 8,301,000 | | | Citigroup, Inc.
5.250 %, 05/01/07
(Cost $8,301,000) | | | 8,301,000 | |
| | | | | | | | |
| | | | | | | | | |
| NUMBER OF | | | | | | |
| SHARES | | | | | VALUE | |
| |
INVESTMENTS OF CASH COLLATERAL
FOR SECURITIES ON LOAN (21.5%) | | | | |
| | 172,103,311 | | | Bank of New York Institutional
Cash Reserve Fund
current rate 5.378%
(Cost $172,103,311) | | $ | 172,103,311 | |
| | | | | | | | |
| | | | | | | | | |
| TOTAL INVESTMENTS (166.8%) | | | | |
| (Cost $1,255,129,828) | | | 1,333,448,139 | |
| | | | | | | | |
| | | | | | | | | |
| PAYABLE UPON RETURN OF SECURITIES ON LOAN (-21.5%) | | | (172,103,311 | ) |
| | | | | | | | |
| | | | | | | | | |
| OTHER ASSETS, LESS LIABILITIES (2.8%) | | | 22,342,162 | |
| | | | | | | | |
| | | | | | | | | |
PREFERRED SHARES AT LIQUIDATION VALUE INCLUDING
DIVIDENDS PAYABLE (-48.1%) | | | (384,535,863 | ) |
| | | | | | | | |
| | | | | | | | | |
NET ASSETS APPLICABLE TO
COMMON SHAREHOLDERS (100.0%) | | $ | 799,151,127 | |
| | | | | | | | |
NOTES TO SCHEDULE OF INVESTMENTS
Note: Market Value for Securities denominated in foreign currencies are shown in U.S. dollars.
| | | |
| * | | 144A securities are those that are exempt from registration under Rule 144A of the Securities Act of 1933, as amended. These securities are generally issued to qualified institutional buyers (“QIBs”), such as the Fund. Any resale of these securities must generally be effected through a sale that is exempt from registration (e.g. a sale to another QIB), or the security must be registered for public sale. At April 30, 2007, the market value of 144A securities that were not subject to mandatory issuer registration obligations is $114,445,022 or 14.3% of net assets. |
| |
| ^ | | Security, or portion of security, is on loan. |
| |
| # | | Non-income producing security. |
| |
| ‡ | | Variable rate or step bond security. The rate shown is the rate in effect at April 30, 2007. |
| |
| ¥ | | Securities exchangeable or convertible into securities of an entity different than the issuer. Such entity is identified in the parenthetical. |
FOREIGN CURRENCY ABBREVIATIONS
| | |
| EUR | | European Monetary Unit |
| | |
| GBP | | British Pound Sterling |
See accompanying Notes to Financial Statements.
| | | |
| 14 | | Convertible Opportunities and Income Fund
SEMIANNUAL REPORT Schedule of Investments |
Statement of Assets and Liabilities
| | | | | |
| April 30, 2007 (unaudited) | | | | |
| |
ASSETS | | | | |
| Investments, at value* (cost $1,255,129,828) | | $ | 1,333,448,139 | |
| Cash with custodian (interest bearing) | | | 779,247 | |
| Foreign currency (cost $2,343,792) | | | 2,343,784 | |
| Receivable for investments sold | | | 212,804 | |
| Accrued interest and dividends receivable | | | 17,988,283 | |
| Unrealized appreciation on interest rate swaps | | | 4,590,313 | |
| Prepaid expenses | | | 66,884 | |
| Other assets | | | 59,995 | |
| |
| Total assets | | | 1,359,489,449 | |
| |
LIABILITIES | | | | |
| Payables: | | | | |
| Cash collateral for securities on loan | | | 172,103,311 | |
| Investments purchased | | | 2,897,396 | |
| Affiliates: | | | | |
| Investment advisory fees | | | 530,039 | |
| Deferred compensation to Trustees | | | 59,995 | |
| Financial accounting fees | | | 10,920 | |
| Trustee fees and officer compensation | | | 552 | |
| Accounts payable and accrued liabilities | | | 200,246 | |
| |
| Total liabilities | | | 175,802,459 | |
| |
PREFERRED SHARES | | | | |
| $25,000 liquidation value per share applicable to 15,360 shares, including dividends payable | | | 384,535,863 | |
| |
| NET ASSETS APPLICABLE TO COMMON SHAREHOLDERS | | $ | 799,151,127 | |
| |
COMPOSITION OF NET ASSETS APPLICABLE TO COMMON SHAREHOLDERS | | | | |
| Common stock, no par value, unlimited shares authorized, 47,487,291 shares issued and outstanding | | $ | 693,320,736 | |
| Undistributed net investment income (loss) | | | (18,792,202 | ) |
| Accumulated net realized gain (loss) on investments, foreign currency transactions and interest rate swaps | | | 41,626,163 | |
| Net unrealized appreciation (depreciation) on investments, foreign currency translations and interest rate swaps | | | 82,996,430 | |
| |
| NET ASSETS APPLICABLE TO COMMON SHAREHOLDERS | | $ | 799,151,127 | |
| |
| Net asset value per common share based on 47,487,291 shares issued and outstanding | | $ | 16.83 | |
| |
| | |
| * | | Including securities on loan with a value of $165,813,571. |
See accompanying Notes to Financial Statements.
| | | | | | | |
| | | Convertible Opportunities and Income Fund | | | | |
| | | Statement of Assets and Liabilities SEMIANNUAL REPORT | | | 15 | |
Statement of Operations
| | | | | |
| Six Months Ended April 30, 2007 (unaudited) | | | | |
| |
INVESTMENT INCOME | | | | |
| Interest | | $ | 31,981,038 | |
| Dividends | | | 6,497,671 | |
| Securities lending income | | | 95,143 | |
| |
| Total investment income | | | 38,573,852 | |
| |
EXPENSES | | | | |
| Investment advisory fees | | | 4,629,651 | |
| Financial accounting fees | | | 65,489 | |
| Auction agent and rating agency fees | | | 508,879 | |
| Printing and mailing fees | | | 81,948 | |
| Audit and legal fees | | | 41,116 | |
| Custodian fees | | | 33,798 | |
| Accounting fees | | | 30,513 | |
| Registration fees | | | 23,230 | |
| Trustees’ fees and officer compensation | | | 21,754 | |
| Investor support services | | | 18,894 | |
| Transfer agent fees | | | 17,122 | |
| Other | | | 37,140 | |
| |
| Total expenses | | | 5,509,534 | |
| Less expense waived | | | (1,446,766 | ) |
| Less earnings credits | | | (23,972 | ) |
| |
| Net expenses | | | 4,038,796 | |
| |
| NET INVESTMENT INCOME (LOSS) | | | 34,535,056 | |
| |
REALIZED AND UNREALIZED GAIN (LOSS) FROM INVESTMENTS, FOREIGN CURRENCY AND INTEREST RATE SWAPS | | | | |
Net realized gain (loss) from: | | | | |
| Investments | | | 39,742,257 | |
| Foreign currency transactions | | | 262,753 | |
| Interest rate swaps | | | 3,192,663 | |
| | | | | |
Change in net unrealized appreciation/depreciation on: | | | | |
| Investments | | | 5,573,896 | |
| Foreign currency translations | | | 57,256 | |
| Interest rate swaps | | | (2,622,221 | ) |
| |
| NET REALIZED AND UNREALIZED GAIN (LOSS) FROM INVESTMENTS, FOREIGN CURRENCY AND INTEREST RATE SWAPS | | | 46,206,604 | |
| |
| NET INCREASE (DECREASE) IN NET ASSETS RESULTING FROM OPERATIONS | | | 80,741,660 | |
| |
DISTRIBUTIONS TO PREFERRED SHAREHOLDERS FROM | | | | |
| Net investment income | | | (8,829,201 | ) |
| Capital gains | | | (1,079,741 | ) |
| |
| NET INCREASE (DECREASE) IN NET ASSETS APPLICABLE TO COMMON SHAREHOLDERS RESULTING FROM OPERATIONS | | $ | 70,832,718 | |
| |
See accompanying Notes to Financial Statements.
| | | |
| | | Convertible Opportunities and Income Fund |
| 16 | | SEMIANNUAL REPORT Statement of Operations |
Statements of Changes in Net Assets
| | | | | | | | | |
| | | Six Months Ended | | Year Ended |
| | | April 30, 2007 | | October 31, |
| | | (unaudited) | | 2006 |
| |
OPERATIONS | | | | | | | | |
| Net investment income (loss) | | $ | 34,535,056 | | | $ | 70,104,535 | |
| Net realized gain (loss) from investments, foreign currency transactions and interest rate swaps | | | 43,197,673 | | | | 37,879,589 | |
| Change in net unrealized appreciation/depreciation on investments, foreign currency translations and interest rate swaps | | | 3,008,931 | | | | (2,551,087 | ) |
| Distributions to preferred shareholders from: | | | | | | | | |
| Net investment income | | | (8,829,201 | ) | | | (16,629,373 | ) |
| Capital gains | | | (1,079,741 | ) | | | (1,505,459 | ) |
| |
| Net increase (decrease) in net assets applicable to common shareholders resulting from operations | | | 70,832,718 | | | | 87,298,205 | |
| |
| | | | | | | | | |
DISTRIBUTIONS TO COMMON SHAREHOLDERS FROM | | | | | | | | |
| Net investment income | | | (37,780,270 | ) | | | (74,885,047 | ) |
| Capital gains | | | (15,087,591 | ) | | | (22,474,437 | ) |
| |
| Net decrease in net assets from distributions to common shareholders | | | (52,867,861 | ) | | | (97,359,484 | ) |
| |
| | | | | | | | | |
CAPITAL STOCK TRANSACTIONS | | | | | | | | |
| Reinvestment of distributions resulting in the issuance of common stock | | | 9,192,144 | | | | 17,552,931 | |
| |
| Net increase (decrease) in net assets from capital stock transactions | | | 9,192,144 | | | | 17,552,931 | |
| |
| TOTAL INCREASE (DECREASE) IN NET ASSETS APPLICABLE TO COMMON SHAREHOLDERS | | | 27,157,001 | | | | 7,491,652 | |
| |
| | | | | | | | | |
NET ASSETS APPLICABLE TO COMMON SHAREHOLDERS | | | | | | | | |
| Beginning of period | | | 771,994,126 | | | | 764,502,474 | |
| |
| End of period | | $ | 799,151,127 | | | $ | 771,994,126 | |
| |
| Undistributed net investment income (loss) | | $ | (18,792,202 | ) | | $ | (6,717,787 | ) |
See accompanying Notes to Financial Statements.
| | | | | | | |
| | | Convertible Opportunities and Income Fund | | | | |
| | | Statements of Changes in Net Assets SEMIANNUAL REPORT | | | 17 | |
Notes to Financial Statements (unaudited)
NOTE 1 — ORGANIZATION AND SIGNIFICANT ACCOUNTING POLICIES
Organization. CALAMOS Convertible Opportunities and Income Fund (the “Fund”) was organized as a Delaware statutory trust on April 17, 2002 and is registered under the Investment Company Act of 1940 (the “1940 Act”) as a diversified, closed-end management investment company. The Fund commenced operations on June 26, 2002.
The Fund’s investment objective is to provide total return through a combination of capital appreciation and current income. Under normal circumstances, the Fund invests at least 80% of its managed assets in a diversified portfolio of convertible and non-convertible income securities. “Managed assets” means the Fund’s total assets (including any assets attributable to any leverage that may be outstanding) minus total liabilities (other than debt representing financial leverage).
Portfolio Valuation. The valuation of the Fund’s portfolio securities is in accordance with policies and procedures adopted by and under the ultimate supervision of the Board of Trustees.
Portfolio securities that are traded on U.S. securities exchanges, except option securities, are valued at the last current reported sales price at the time as of which the Fund determines its net asset value (“NAV”). Securities traded in the over-the-counter (“OTC”) market and quoted on The Nasdaq Stock Market are valued at the Nasdaq Official Closing Price (“NOCP”), as determined by Nasdaq, or lacking a NOCP, at the last current reported sale price on Nasdaq at the time as of which the Fund determines its NAV.
When a most recent last sale or closing price is not available, portfolio securities, other than option securities, that are traded on a U.S. securities exchange and other securities traded in the OTC market are valued at the mean between the most recent bid and asked quotations in accordance with guidelines adopted by the Board of Trustees. Each option security traded on a U.S. securities exchange is valued at the mid-point of the consolidated bid/ask quote for the option security, also in accordance with guidelines adopted by the Board of Trustees. Each OTC option that is not traded through the Options Clearing Corporation is valued by the counterparty to such option.
Trading in securities on European and Far Eastern securities exchanges and OTC markets is typically completed at various times before the close of business on each day on which the New York Stock Exchange (“NYSE”) is open. Each security trading on these exchanges or OTC markets is evaluated utilizing a systematic fair valuation model provided by an independent pricing service approved by the Board of Trustees. The valuation of each security that meets certain criteria in relation to the valuation model is systematically adjusted to reflect the impact of movement in the U.S. market after the foreign markets close. Securities that do not meet the criteria, or that are principally traded in other foreign markets, are valued as of the last current sale price at the time as of which the Fund determines its NAV, or when reliable market prices or quotations are not readily available, at the mean between the most recent bid and asked quotations as of the close of the appropriate exchange or other designated time, in accordance with guidelines adopted by the Board of Trustees. Trading of foreign securities may not take place on every NYSE business day. In addition, trading may take place in various foreign markets on Saturdays or on other days when the NYSE is not open and on which the Fund’s NAV is not calculated.
If the pricing committee determines that the valuation of a security in accordance with the methods described above is not reflective of a fair value for such security, the security, including any thinly-traded security, junk bond or synthetic convertible instrument, is valued at a fair value by the pricing committee, under the ultimate supervision of the Board of Trustees, following the guidelines and/or procedures adopted by the Board of Trustees.
The Fund also may use fair value pricing, pursuant to Board of Trustees guidelines and under the ultimate supervision of the Board of Trustees if the value of a foreign security it holds is materially affected by events occurring before their valuation time but after the close of the primary market or exchange on which the security is traded. Those procedures may utilize valuations furnished by pricing services approved by the Board of Trustees, which may be based on market transactions for comparable securities and various relationships between securities that are generally recognized by institutional traders, a computerized matrix system, or appraisals derived from information concerning the securities or similar securities received from recognized dealers in those securities.
When fair value pricing of securities is employed, the prices of securities used by the Fund to calculate its NAV may differ from market quotations or official closing prices.
Investment Transactions and Investment Income. Short-term investment transactions are recorded on a trade date basis. Long-term investment transactions are recorded on a trade date plus one basis, except for fiscal quarter ends, which are recorded on trade date. Net
| | | |
| | | Convertible Opportunities and Income Fund |
| 18 | | SEMIANNUAL REPORT Notes to Financial Statements |
Notes to Financial Statements (unaudited)
realized gains and losses from investment transactions are reported on an identified cost basis. Interest income is recognized using the accrual method and includes accretion of original issue and market discount and amortization of premium. Dividend income is recognized on the ex-dividend date, except that certain dividends from foreign securities are recorded as soon as the information becomes available.
Foreign Currency Translation. Values of investments and other assets and liabilities denominated in foreign currencies are translated into U.S. dollars using a rate quoted by a major bank or dealer in the particular currency market, as reported by a recognized quotation dissemination service.
The Fund does not isolate that portion of the results of operations resulting from changes in foreign exchange rates on investments from the fluctuations arising from changes in market prices of securities held. Such fluctuations are included with the net realized and unrealized gain or loss from investments.
Reported net realized foreign currency gains or losses arise from disposition of foreign currency, the difference in the foreign exchange rates between the trade and settlement dates on securities transactions, and the difference between the amounts of dividends, interest and foreign withholding taxes recorded on the ex-date or accrual date and the U.S. dollar equivalent of the amounts actually received or paid. Net unrealized foreign exchange gains and losses arise from changes (due to the changes in the exchange rate) in the value of foreign currency and other assets and liabilities denominated in foreign currencies held at period end.
Option Transactions. For hedging and investment purposes, the Fund may purchase or write (sell) put and call options. One of the risks associated with purchasing an option is that the Fund pays a premium whether or not the option is exercised. Additionally, the Fund bears the risk of loss of premium and change in market value should the counterparty not perform under the contract. Put and call options purchased are accounted for in the same manner as portfolio securities. The cost of securities acquired through the exercise of purchased call options is increased by premiums paid. The proceeds from securities sold through the exercise of purchased put options are decreased by the premiums paid.
When the Fund writes an option, an amount equal to the premium received by the Fund is recorded as a liability and is subsequently adjusted to the current value of the option written. Premiums received from writing options that expire unexercised are treated by the Fund on the expiration date as realized gains from written options. The difference between the premium and the amount paid on effecting a closing purchase transaction, including brokerage commissions, is also treated as a realized gain, or, if the premium is less than the amount paid for the closing purchase transaction, as a realized loss. If a written call option is exercised, the premium is added to the proceeds from the sale of the underlying security or currency in determining whether the Fund has realized a gain or loss. If a written put option is exercised, the premium reduces the cost basis of the securities purchased by the Fund. The Fund as writer of an option bears the market risk of an unfavorable change in the price of the security underlying the written option.
Use of Estimates. The preparation of financial statements in conformity with U.S. generally accepted accounting principles requires management to make estimates and assumptions that affect the amounts reported in the financial statements and accompanying notes. Actual results may differ from those estimates.
Income Taxes. No provision has been made for U.S. income taxes because the Fund’s policy is to continue to qualify as a regulated investment company under the Internal Revenue Code of 1986, as amended (the “Code”), and distribute to shareholders substantially all of its taxable income and net realized gains.
Dividends and distributions paid to shareholders are recorded on the ex-dividend date. The amount of dividends and distributions from net investment income and net realized capital gains is determined in accordance with federal income tax regulations, which may differ from U.S. generally accepted accounting principles. To the extent these “book/tax” differences are permanent in nature such amounts are reclassified within the capital accounts based on their federal tax-basis treatment. These differences are primarily due to differing treatments for contingent payment debt instruments and methods of amortizing and accreting fixed income securities. Financial records are not adjusted for temporary differences.
Indemnifications. Under the Fund’s organizational documents, its officers and trustees are indemnified against certain liabilities incurred by them by reason of having been an officer or trustee of the Fund. In addition, in the normal course of business, the Fund enters into contracts that provide general indemnifications to other parties. The Fund’s maximum exposure under these arrangements is unknown as
| | | | | | | |
| | | Convertible Opportunities and Income Fund | | | | |
| | | Notes to Financial Statements SEMIANNUAL REPORT | | | 19 | |
Notes to Financial Statements (unaudited)
this would involve future claims that may be made against the Fund that have not yet occurred. However, the Fund has not had prior claims or losses pursuant to these contracts and expects the risk of loss to be remote.
New Accounting Pronouncements. On July 13, 2006, the Financial Accounting Standards Board (FASB) released FASB Interpretation No. 48 Accounting for Uncertainty in Income Taxes (FIN 48). FIN 48 provides guidance for how uncertain tax positions should be recognized, measured, presented and disclosed in the financial statements. FIN 48 requires the evaluation of tax positions taken in the course of preparing the Fund’s tax returns to determine whether the tax positions are “more-likely-than-not” of being sustained by the applicable tax authority. Tax benefits of positions not deemed to meet the more-likely-than-not threshold would be recorded as a tax expense in the current year. Adoption of FIN 48 is required for fiscal years beginning after December 15, 2006 and is to be applied to all open tax years as of the effective date. At this time, management is evaluating the implications of FIN 48, and its impact on the financial statements has not yet been determined.
In addition, in September 2006, the Statement of Financial Accounting Standards No. 157, Fair Value Measurements (SFAS 157), was issued and is effective for fiscal years beginning after November 15, 2007. SFAS 157 defines fair value, establishes a framework for measuring fair value and expands disclosures about fair value measurements. Management is currently evaluating the impact the adoption of SFAS 157 will have on the Fund’s financial statements and their disclosures, and its impact has not yet been determined.
NOTE 2 — INVESTMENT ADVISER AND TRANSACTIONS WITH AFFILIATES OR CERTAIN OTHER PARTIES
Pursuant to an investment advisory agreement with Calamos Advisors LLC (“Calamos Advisors”), the Fund pays an annual fee, payable monthly, equal to .80% based on the average weekly managed assets. Calamos Advisors has contractually agreed to waive a portion of its management fee at the annual rate of 0.25% of the average weekly managed assets of the Fund for the first five full years of the Fund’s operation (through June 30, 2007) and to waive a declining amount for an additional three years (0.18% of the average weekly managed assets in 2008, 0.11% in 2009, and 0.04% in 2010).
Pursuant to a financial accounting services agreement, Calamos Advisors receives a fee payable monthly at the annual rate of 0.0175% on the first $1 billion of combined assets; 0.0150% on the next $1 billion of combined assets; and 0.0110% on combined assets above $2 billion for financial accounting services (for purposes of this calculation “combined assets” means the total of the average daily managed net assets of Calamos Investment Trust, and Calamos Advisors Trust and the average weekly managed net assets of Calamos Convertible and High Income Fund, Calamos Convertible Opportunities and Income Fund, Calamos Strategic Total Return Fund and Calamos Global Total Return Fund). Financial accounting services include, but are not limited to, the following: managing expenses and expense payment processing; monitoring the calculation of expense accrual amounts; calculating, tracking, and reporting tax adjustments on all assets; and monitoring trustee deferred compensation plan accruals and valuations. The Fund pays its pro rata share of the financial accounting services fee payable to Calamos Advisors based on the Fund’s relative portion of combined assets.
The Fund reimburses the Calamos Advisors for a portion of compensation paid to the Fund’s Chief Compliance Officer. This compensation is reported as part of “Trustees’ fees and officer compensation” expenses on the Statement of Operations.
Included in the statement of operations under the caption “Earnings Credits” is an expense offset of $23,972, arising from credits on cash balances maintained on deposit.
Certain officers and trustees of the Fund are also officers and directors of Calamos Financial Services LLC (“CFS”) and Calamos Advisors. All officers and affiliated trustees serve without direct compensation from the Fund, except for the Chief Compliance Officer as described above.
The Fund has adopted a deferred compensation plan (the “Plan”). Under the Plan, a trustee who is not an “interested person” (as defined in the 1940 Act) of the Fund and has elected to participate in the Plan (a “participating trustee”) may defer receipt of all or a portion of his compensation from the Fund. The deferred compensation payable to the participating trustee is credited to the trustee’s deferral account as of the business day such compensation would have been paid to the participating trustee. The value of amounts deferred for a participating trustee is determined by reference to the change in value of Class I shares of one or more funds of Calamos Investment Trust designated by the participant. The value of the account increases with contributions to the account or with increases in the value of the measuring shares, and the value of the account decreases with withdrawals from the account or with declines in the value of the measuring
| | | |
| | | Convertible Opportunities and Income Fund |
| 20 | | SEMIANNUAL REPORT Notes to Financial Statements |
Notes to Financial Statements (unaudited)
shares. Deferred compensation of $59,995 is included in “Other assets” on the Statement of Assets and Liabilities at April 30, 2007. The Fund’s obligation to make payments under the Plan is a general obligation of the Fund and is included in “Payable for deferred compensation to Trustees” on the Statement of Assets and Liabilities at April 30, 2007.
NOTE 3 — INVESTMENTS
Purchases and sales of investments, other than short-term investments for the six months ended April 30, 2007 were as follows:
| | | | | |
| Purchases | | $ | 307,607,992 | |
| Proceeds from sales | | | 325,053,564 | |
The following information is presented on a Federal income tax basis as of April 30, 2007. Differences between the cost basis under U.S. generally accepted accounting principles and Federal income tax purposes are primarily due to timing differences.
The cost basis of investments for Federal income tax purposes at April 30, 2007 was as follows:
| | | | | |
| Cost basis of investments | | $ | 1,268,267,724 | |
| | | | |
| Gross unrealized appreciation | | | 80,302,667 | |
| Gross unrealized depreciation | | | (15,122,252 | ) |
| | | | |
| Net unrealized appreciation (depreciation) | | $ | 65,180,415 | |
| | | | |
NOTE 4 — INCOME TAXES
The tax character of distributions for the period ended April 30, 2007 will be determined at the end of the Fund’s current fiscal year.
Distributions during the fiscal year ended October 31, 2006 were characterized for Federal income tax purposes as follows:
Distributions paid from:
| | | | | |
| Ordinary income | | $ | 100,262,231 | |
| Long-term capital gains | | | 15,105,921 | |
As of October 31, 2006, the components of accumulated earnings/(loss) on a tax basis were as follows:
| | | | | |
| Undistributed ordinary income | | $ | 18,547,877 | |
| Undistributed capital gains | | | 1,079,740 | |
| | | | |
| Total undistributed earnings | | | 19,627,617 | |
| Accumulated capital and other losses | | | — | |
| Net unrealized gains/(losses) | | | 68,760,211 | |
| | | | |
| Total accumulated earnings/(losses) | | | 88,387,828 | |
| Other | | | (522,294 | ) |
| Paid-in capital | | | 684,128,592 | |
| | | | |
| Net assets applicable to common shareholders | | $ | 771,994,126 | |
| | | | |
NOTE 5 — COMMON SHARES
There are unlimited common shares of beneficial interest authorized and 47,487,291 shares outstanding at April, 30, 2007. Calamos Advisors owned 10,465 of the outstanding shares at April 30, 2007. Transactions in common shares were as follows:
| | | | | | | | | |
| | | For the | | For the |
| | | Six Months Ended | | Year Ended |
| | | April 30, 2007 | | October 31, 2006 |
| |
| Beginning shares | | | 47,005,186 | | | | 46,079,867 | |
| Shares issued through reinvestment of distributions | | | 482,105 | | | | 925,319 | |
| | | |
| Ending shares | | | 47,487,291 | | | | 47,005,186 | |
| | | |
| | | | | | | |
| | | Convertible Opportunities and Income Fund | | | | |
| | | Notes to Financial Statements SEMIANNUAL REPORT | | | 21 | |
Notes to Financial Statements (unaudited)
NOTE 6 — FORWARD FOREIGN CURRENCY CONTRACTS
The Fund may engage in portfolio hedging with respect to changes in currency exchange rates by entering into forward foreign currency contracts to purchase or sell currencies. A forward foreign currency contract is a commitment to purchase or sell a foreign currency at a future date at a negotiated forward rate. Risks associated with such contracts include, among other things, movement in the value of the foreign currency relative to the U.S. dollar and the ability of the counterparty to perform. The net unrealized gain, if any, represents the credit risk to the Fund on a forward foreign currency contract. The contracts are valued daily at forward exchange rates, and an unrealized gain or loss is recorded. The Fund realizes a gain or loss when a position is closed or upon settlement of the contracts. There were no open forward foreign currency contracts at April 30, 2007.
NOTE 7 — SYNTHETIC CONVERTIBLE SECURITIES
The Fund may establish a “synthetic” convertible instrument by combining separate securities that possess the economic characteristics similar to a convertible security, i.e., fixed-income securities (“fixed-income component”, which may be a convertible or non-convertible security) and the right to acquire equity securities (“convertible component”). The fixed-income component is achieved by investing in fixed-income securities such as bonds, preferred stocks or money market instruments. The convertible component is achieved by investing in warrants or options to buy common stock at a certain exercise price, or options on a stock index. In establishing a synthetic instrument, the Fund may pool a basket of fixed-income securities and a basket of warrants or options that produce the economic characteristics similar to a convertible security. Within each basket of fixed-income securities and warrants or options, different companies may issue the fixed-income and convertible components, which may be purchased separately and at different times.
The Fund may also purchase synthetic convertible instruments created by other parties, typically investment banks, including convertible structured notes. Convertible structured notes are fixed-income debentures linked to equity. Convertible structured notes have the attributes of a convertible security; however, the investment bank that issued the convertible note assumes the credit risk associated with the investment, rather than the issuer of the underlying common stock into which the note is convertible. Purchasing synthetic convertible securities may offer more flexibility than purchasing a convertible security.
NOTE 8 — PREFERRED SHARES
There are unlimited shares of Auction Rate Cumulative Preferred Shares (“Preferred Shares”) authorized. The Preferred Shares have rights as determined by the Board of Trustees. The 15,360 Preferred Shares outstanding consist of seven series, 2,040 shares of M, 2,040 shares of TU, 2,040 shares of W7, 2,400 shares of W28, 2,400 shares of TH7, 2,040 shares of TH28, and 2,400 shares of F. The Preferred Shares have a liquidation value of $25,000 per share plus any accumulated but unpaid dividends, whether or not declared.
Dividends on the Preferred Shares are cumulative at a rate typically reset every seven or twenty-eight days based on the results of an auction. Dividend rates ranged from 4.80% to 5.32% for the six months ended April 30, 2007. Under the 1940 Act, the Fund may not declare dividends or make other distributions on common shares or purchase any such shares if, at the time of the declaration, distribution or purchase, asset coverage with respect to the outstanding Preferred Shares would be less than 200%.
The Preferred Shares are redeemable at the Fund’s option, in whole or in part, on any dividend payment date at $25,000 per share plus any accumulated but unpaid dividends. The Preferred Shares are also subject to mandatory redemption at $25,000 per share plus any accumulated but unpaid dividends, whether or not declared, if certain requirements relating to the composition of the assets and liabilities of the Fund as set forth in the Statement of Preferences are not satisfied.
The holders of Preferred Shares have voting rights equal to the holders of common shares (one vote per share) and will vote together with holders of common shares as a single class except, on matters affecting only the holders of Preferred Shares or only the holders of common shares, when the respective classes vote separately or alone.
| | | |
| | | Convertible Opportunities and Income Fund |
| 22 | | SEMIANNUAL REPORT Notes to Financial Statements |
Notes to Financial Statements (unaudited)
NOTE 9 — INTEREST RATE TRANSACTIONS
The Fund may engage in swaps primarily to manage duration and yield curve risk, or as alternatives to direct investments. Unrealized gains are reported as an asset and unrealized losses are reported as a liability on the Statement of Assets and Liabilities. The change in value of swaps, including accruals of periodic amounts of interest to be paid or received on swaps, is reported as unrealized gains or losses in the Statement of Operations. A realized gain or loss is recorded upon payment or receipt of a periodic payment or termination of the swap agreements. Swap agreements are stated at fair value. Notional principal amounts are used to express the extent of involvement in these transactions, but the amounts potentially subject to credit risk are much smaller.
Amounts paid to or by the Fund are accrued daily and included in realized gain (loss) when paid on swaps in the accompanying Statement of Operations. The contracts are marked-to-market daily based on dealer-supplied valuations and changes in value are recorded as unrealized appreciation (depreciation). Gains or losses are realized upon early termination of the contract. Risks may exceed amounts recognized in the Statement of Assets and Liabilities. These risks include changes in the returns of the underlying instruments, failure of the counterparties to perform under the contracts’ terms and the possible lack of liquidity with respect to the contracts.
If the Fund is required to terminate any swap or cap early due to the Fund’s failure to maintain a required 200% asset coverage of the liquidation value of the outstanding Preferred Shares or the Fund loses its credit rating on its Preferred Shares, then the Fund could be required to make a termination payment, in addition to redeeming all or some of the Preferred Shares.
Details of the interest rate swap agreements outstanding as of April 30, 2007 were as follows:
| | | | | | | | | | | | | | | | | | | | | |
| | | | | | | | | | | | | | | | | | | Unrealized | |
| | | Termination | | | Notional | | | Fixed Rate | | | Floating Rate | | | Appreciation | |
| Counterparty | | Date | | | Amount (000) | | | (Fund Pays) | | | (Fund Receives) | | | (Depreciation) | |
| |
| Citibank NA | | | 7/3/2007 | | | $ | 65,000,000 | | | | 2.325 | % | | 1 month LIBOR | | $ | 485,307 | |
| Citibank NA | | | 7/3/2008 | | | | 70,000,000 | | | | 2.685 | % | | 1 month LIBOR | | | 2,105,483 | |
| Citibank NA | | | 11/28/2007 | | | | 60,000,000 | | | | 3.258 | % | | 1 month LIBOR | | | 700,250 | |
| Citibank NA | | | 11/28/2008 | | | | 60,000,000 | | | | 3.598 | % | | 1 month LIBOR | | | 1,299,273 | |
| | | | | | | | | | | | | | | | | | | | |
| | | | | | | | | | | | | | | | | | | $ | 4,590,313 | |
| | | | | | | | | | | | | | | | | | | | |
NOTE 10 — SECURITIES LENDING
For the six months ended April 30, 2007, the Fund loaned certain of its securities to broker-dealers and banks. Any such loan must be continuously secured by collateral in cash or cash equivalents maintained on a current basis in an amount at least equal to the market value of the securities loaned by the Fund. The Fund continues to receive the equivalent of the interest or dividends paid by the issuer on the securities loaned and also receives an additional return that may be in the form of a fixed fee or a percentage of the income earned on the collateral. The Fund may pay reasonable fees to persons unaffiliated with the Fund for services in arranging these loans. The Fund has the right to call the loan and obtain the securities loaned at any time on notice of not more than five business days. The Fund does not have the right to vote the securities during the existence of the loan but could call the loan in an attempt to permit voting of the securities in certain circumstances. Upon return of the securities loaned, the cash or cash equivalent collateral will be returned to the borrower. In the event of bankruptcy or other default of the borrower, the Fund could experience both delays in liquidating the loan collateral or recovering the loaned securities and losses, including (a) possible decline in the value of the collateral or in the value of the securities loaned during the period while the Fund seeks to enforce its rights thereto, (b) possible subnormal levels of income and lack of access to income during this period, and (c) the expenses of enforcing its rights. In an effort to reduce these risks, the Fund’s securities lending agent monitors, and reports to Calamos Advisors on, the creditworthiness of the firms to which the Fund lends securities. At April 30, 2007, the Fund had securities valued at $165,813,571 that were on loan to broker-dealers and banks and $172,103,311 in cash or cash equivalent collateral.
| | | | | | | |
| | | Convertible Opportunities and Income Fund | | | | |
| | | Notes to Financial Statements SEMIANNUAL REPORT | | | 23 | |
Financial Highlights
Selected data for a common share outstanding throughout each period were as follows:
The financial highlights table is intended to help you understand the Fund’s financial performance for the periods indicated below. Certain information reflects financial results for a single Fund share. The total returns in the table represent the rate that an investor would have earned (or lost) on an investment in the Fund (assuming reinvestment of all dividends and distributions). The information for the period ended April 30, 2007 is unaudited. Deloitte & Touche LLP, an independent registered public accounting firm, has audited the information for the fiscal years ended October 31, 2006, 2005, 2004 and 2003.
| | | | | | | | | | | | | | | | | | | | | |
| | | Six Months | | |
| | | Ended | | |
| | | April 30, | | |
| | | (unaudited) | | For the Year Ended October 31, |
| | | 2007 | | 2006 | | 2005 | | 2004 | | 2003 |
| |
| Net asset value, beginning of period | | $ | 16.42 | | | $ | 16.59 | | | $ | 18.03 | | | $ | 18.01 | | | $ | 13.56 | |
| Income from investment operations: | | | | | | | | | | | | | | | | | | | | |
| Net investment income (loss) | | | 0.73 | | | | 1.50 | | | | 1.65 | | | | 1.91 | | | | 1.77 | (a) |
| Net realized and unrealized gain (loss) from investments, foreign currency and interest rate swaps | | | 1.01 | | | | 0.81 | | | | 0.03 | | | | 0.52 | | | | 4.38 | (a) |
| Distributions to preferred shareholders from: | | | | | | | | | | | | | | | | | | | | |
| Net investment income (common share equivalent basis) | | | (0.19 | ) | | | (0.36 | ) | | | (0.19 | ) | | | (0.11 | ) | | | (0.06 | ) |
| Capital gains (common share equivalent basis) | | | (0.02 | ) | | | (0.03 | ) | | | (0.06 | ) | | | — | (b) | | | — | |
| |
| Total from investment operations | | | 1.53 | | | | 1.92 | | | | 1.43 | | | | 2.32 | | | | 6.09 | |
| |
| Less distributions to common shareholders from: | | | | | | | | | | | | | | | | | | | | |
| Net investment income | | | (0.80 | ) | | | (1.61 | ) | | | (1.65 | ) | | | (1.80 | ) | | | (1.64 | ) |
| Capital gains | | | (0.32 | ) | | | (0.48 | ) | | | (1.22 | ) | | | (0.45 | ) | | | — | |
| Capital charge resulting from issuance of common and preferred shares | | | — | | | | — | | | | — | | | | (0.05 | ) | | | — | (b) |
| Net asset value, end of period | | $ | 16.83 | | | $ | 16.42 | | | $ | 16.59 | | | $ | 18.03 | | | $ | 18.01 | |
| Market value, end of period | | $ | 20.17 | | | $ | 19.73 | | | $ | 19.52 | | | $ | 20.50 | | | $ | 19.60 | |
Total investment return based on(c): | | | | | | | | | | | | | | | | | | | | |
| Net asset value | | | 8.66 | % | | | 10.47 | % | | | 6.69 | % | | | 12.65 | % | | | 46.48 | % |
| Market value | | | 8.38 | % | | | 12.81 | % | | | 10.40 | % | | | 17.69 | % | | | 52.22 | % |
| Ratios and supplemental data: | | | | | | | | | | | | | | | | | | | | |
| Net assets applicable to common shareholders, end of period (000’s omitted) | | $ | 799,151 | | | $ | 771,994 | | | $ | 764,502 | | | $ | 808,278 | | | $ | 790,764 | |
| Preferred shares, at redemption value ($25,000 per share liquidation preference) (000’s omitted) | | $ | 384,000 | | | $ | 384,000 | | | $ | 384,000 | | | $ | 384,000 | | | $ | 204,000 | |
| Ratios to average net assets applicable to common shareholders: | | | | | | | | | | | | | | | | | | | | |
Net expenses(d)(e) | | | 1.04 | % | | | 1.04 | % | | | 1.06 | % | | | 1.00 | % | | | 0.86 | % |
Gross expenses prior to waiver of expenses by the advisor and earnings credits(d)(e) | | | 1.42 | % | | | 1.42 | % | | | 1.43 | % | | | 1.37 | % | | | 1.18 | % |
Net investment income (loss)(d)(e) | | | 8.89 | % | | | 9.17 | % | | | 9.59 | % | | | 10.56 | % | | | 10.89 | %(a) |
Preferred share distributions(d) | | | 2.27 | % | | | 2.18 | % | | | 1.11 | % | | | 0.65 | % | | | 0.39 | % |
Net investment income (loss), net of preferred share distributions(d) | | | 6.62 | % | | | 6.99 | % | | | 8.48 | % | | | 9.91 | % | | | 10.50 | %(a) |
| Portfolio turnover rate | | | 27 | % | | | 48 | % | | | 76 | % | | | 54 | % | | | 42 | % |
Asset coverage per preferred share, at end of period(f) | | $ | 77,063 | | | $ | 75,291 | | | $ | 74,795 | | | $ | 77,624 | | | $ | 121,907 | |
| | |
| (a) | | Interest rate swap payment reclassified from net investment income (loss) to net realized and unrealized gain (loss) on investments, foreign currency and interest rate swaps. |
| |
| (b) | | Amount equated to less than $0.005 per common share. |
| |
| (c) | | Total investment return is calculated assuming a purchase of common shares on the opening of the first day and a sale on the closing of the last day of the period reported. Dividends and distributions are assumed, for purposes of this calculation, to be reinvested at prices obtained under the Fund’s dividend reinvestment plan. Total return is not annualized for periods less than one year. Brokerage commissions are not reflected. NAV per share is determined by dividing the value of the Fund’s portfolio securities, cash and other assets, less all liabilities, by the total number of common shares outstanding. The common share market price is the price the market is willing to pay for shares of the Fund at a given time. Common share market price is influenced by a range of factors, including supply and demand and market conditions. |
| |
| (d) | | Annualized for periods less than one year. |
| |
| (e) | | Does not reflect the effect of dividend payments to Preferred Shareholders. |
| |
| (f) | | Calculated by subtracting the Fund’s total liabilities (not including Preferred Shares) from the Fund’s total assets and dividing this by the number of Preferred Shares outstanding. |
| | | |
| | | Convertible Opportunities and Income Fund |
| 24 | | SEMIANNUAL REPORT Financial Highlights |
Report of Independent Registered Public Accounting Firm
To the Board of Trustees and Shareholders of CALAMOS Convertible Opportunities and Income Fund
We have reviewed the accompanying statement of assets and liabilities, including the schedule of investments, of Calamos Convertible Opportunities and Income Fund (the “Fund”) as of April 30, 2007, and the related statements of operations and changes in net assets and the financial highlights for the semi-annual period then ended. These interim financial statements and financial highlights are the responsibility of the Fund’s management.
We conducted our review in accordance with the standards of the Public Company Accounting Oversight Board (United States). A review of interim financial information consists principally of applying analytical procedures and making inquiries of persons responsible for financial and accounting matters. It is substantially less in scope than an audit conducted in accordance with the standards of the Public Company Accounting Oversight Board (United States), the objective of which is the expression of an opinion regarding the financial statements and financial highlights taken as a whole. Accordingly, we do not express such an opinion.
Based on our review, we are not aware of any material modifications that should be made to such interim financial statements and financial highlights for them to be in conformity with accounting principles generally accepted in the United States of America.
We have previously audited, in accordance with the standards of the Public Company Accounting Oversight Board (United States), the statement of changes in net assets of the Fund for the year ended October 31, 2006 and the financial highlights for each of the four years then ended; and in our report dated December 19, 2006, we expressed an unqualified opinion on such statement of changes in net assets and financial highlights. The Fund’s financial highlights for the period ended October 31, 2002 were audited by other auditors whose report, dated December 16, 2002, expressed an unqualified opinion on those financial highlights.
Chicago, Illinois
June 21, 2007
| | | | | | | |
| | | Convertible Opportunities and Income Fund | | | | |
| | | Report of Independent Registered Public Accounting Firm SEMIANNUAL REPORT | | | 25 | |
This page intentionally left blank.
This page intentionally left blank.
This page intentionally left blank.
About Closed-End Funds
What is a Closed-End Fund?
A closed-end fund is a publicly traded investment company that raises its initial investment capital through the issuance of a fixed number of shares to investors in a public offering. Shares of a closed-end fund are listed on a stock exchange or traded in the over-the-counter market. Like all investment companies, a closed-end fund is professionally managed and offers investors a unique investment solution based on its investment objective approved by the fund’s Board of Directors.
Potential Advantages of Closed-End Fund Investing
| • | | Defined Asset Pool Allows Efficient Portfolio Management—Although closed-end fund shares trade actively on a securities exchange, this doesn’t affect the closed-end fund manager because there are no new investors buying into or selling out of the fund’s portfolio. |
| |
| • | | More Flexibility in the Timing and Price of Trades—Investors can purchase and sell shares of closed-end funds throughout the trading day, just like the shares of other publicly traded securities. |
| |
| • | | Lower Expense Ratios—The expense ratios of closed-end funds are oftentimes less than those of mutual funds. Over time, a lower expense ratio could enhance investment performance. |
| |
| • | | Closed-End Structure Makes Sense for Less-Liquid Asset Classes—A closed-end structure makes sense for investors considering less-liquid asset classes, such as high-yield bonds or micro-cap stocks. |
| |
| • | | Ability to Put Leverage to Work—Closed-end funds may issue senior securities (such as preferred stock or debentures) or borrow money to “leverage” their investment positions. |
| |
| • | | No Minimum Investment Requirements |
OPEN-END MUTUAL FUNDS VERSUS CLOSED-END FUNDS
| | | |
Open-End Fund | | Closed-End Fund |
| Issues new shares on an ongoing basis | | Issues a fixed number of shares |
| Issues equity shares | | Can issue senior securities such as preferred stock and bonds |
| Sold at NAV plus any sales charge | | Price determined by the marketplace |
| Sold through the fund’s distributor | | Traded in the secondary market |
| Fund redeems shares at NAV calculated at the close of business day | | Fund does not redeem shares |
| | | | | |
Convertible Opportunities and Income Fund
About Closed-End Funds SEMIANNUAL REPORT | | | 29 | |
Leverage
Using Leverage to Enhance Total Return
Closed-end funds can use leverage which utilizes borrowed money in an attempt to increase the return on invested capital. The Fund invests the borrowed assets into securities, which we believe will provide a greater total return to investors than the cost of the borrowing.
Highlights on Leverage
| • | | Leveraging the portfolio allows the investment team to potentially enhance the income and total returns of the Fund. |
| |
| • | | In a rising-rate environment, the cost of leverage typically increases. To protect against increases, the investment team has locked in the cost of leverage for a longer term. In leveraged closed-end funds that invest in interest-rate sensitive securities (high-quality traditional fixed income), rising rates can negatively impact a fund in two ways: increasing the cost of leverage and decreasing the value of securities. |
| |
| • | | This portfolio does not have notable sensitivity to rising interest rates. Much of the cost of leverage has been locked in, and the portfolio seeks to invest in securities that should be more economically sensitive and less interest rate-sensitive. |
Managing the Interest Rate Risk of Leverage
In general, leverage can expose a closed-end fund to the risk of fluctuations in short-term interest rates. As we discussed in the Investment Team Interview, Calamos Advisors has taken steps to mitigate some of this risk to our shareholders. Specifically, we hedged the Fund’s preferred shares (used these shares as principal) to enter into interest rate swap agreements. In its simplest form, an interest rate swap involves two parties agreeing to exchange or “swap” one set of cash flows for another set. In essence, the agreement allows a party that desires to avoid a variable rate (the Fund) to pay a fixed rate to a party that desires variability.
Under these agreements, the Fund pays a potentially higher rate for borrowing initially, but that rate is fixed for a period of three to five years, thereby potentially reducing the interest costs that the Fund would otherwise pay over the period based on a floating or variable rate.
| | | |
| 30 | | Convertible Opportunities and Income Fund
SEMIANNUAL REPORT Leverage |
Level Rate Distribution Policy
Using a Level Rate Distribution Policy to Promote Dependable Income and Total Return
The goal of the level rate distribution policy is to provide investors a predictable, though not assured, level of cash flow, which can either serve as a stable income stream or, through reinvestment, contribute significantly to long-term total return.
We understand the importance that investors place on the stability of dividends and their ability to contribute to long-term total return, which is why we have instituted a level rate distribution policy for the Fund. Under the policy, monthly distributions paid may include net investment income, net realized short-term capital gains and, if necessary, return of capital. In addition, a limited number of distributions per calendar year may include net realized long-term capital gains. There is no guarantee that the Fund will realize capital gains in any given year. Distributions are subject to re-characterization for tax purposes after the end of the fiscal year. All shareholders with taxable accounts will receive written notification regarding the components and tax treatment for distributions via Form 1099-DIV.
Distributions from the Fund are generally subject to Federal income taxes. For purposes of maintaining the level rate distribution policy, the Fund may realize short-term capital gains on securities that, if sold at a later date, would have resulted in long-term capital gains. Maintenance of a level rate distribution policy may increase transaction and tax costs associated with the Fund.
Automatic Dividend Reinvestment Plan
Maximizing Investment with an Automatic Dividend Reinvestment Plan
The Automatic Dividend Reinvestment Plan offers a simple, cost-efficient and convenient way to reinvest your dividends and capital gains distributions in additional shares of the Fund, allowing you to increase your investment in the Fund.
Potential Benefits
| • | | Compounded Growth: By automatically reinvesting with the Plan, you gain the potential to allow your dividends and capital gains to compound over time. |
| |
| • | | Potential for Lower Commission Costs: Additional shares are purchased in large blocks, with brokerage commissions shared among all plan participants. There is no cost to enroll in the Plan. |
| |
| • | | Convenience: After enrollment, the Plan is automatic and includes detailed statements for participants. Participants can terminate their enrollment at any time. |
For additional information about the Plan, please contact the Plan Agent, The Bank of New York, at 800.432.8224 or visit us on the web at www.calamos.com/chi.aspx. If you wish to participate in the Plan and your shares are held in your own name, simply call the Plan Agent. If your shares are not held in your name, please contact your brokerage firm, bank, or other nominee to request that they participate in the Plan on your behalf. If your brokerage firm, bank, or other nominee is unable to participate on your behalf, you may request that your shares be re-registered in your own name.
We’re pleased to provide our shareholders with the additional benefit of the Fund’s Dividend Reinvestment Plan and hope that it may serve your financial plan.
| | | | | |
Convertible Opportunities and Income Fund
Level Rate Distribution Policy and Automatic Dividend Reinvestment Plan SEMIANNUAL REPORT | | | 31 | |
The Calamos Investments Advantage
Calamos’ history is one of performing well for our clients through nearly 30 years of advances and declines in the market. We use proprietary risk-management strategies designed to control volatility, and maintain a balance between risk and reward throughout a market cycle.
Disciplined Investment Philosophy and Process
Calamos Investments has developed a proprietary research and monitoring process that goes far beyond traditional security analysis. This process applies to each of our investment strategies, with emphasis varying by strategy. When combined with the company-specific research and industry insights of our investment team, the goal is nimble, dynamic management of a portfolio that allows us to anticipate and adapt to changing market conditions. In each of our investment strategies, from the most conservative to the most aggressive, our goals include maximizing return while controlling risk, protecting principal during volatile markets, avoiding short-term market timing, and maintaining a vigilant long-term outlook.
Comprehensive Risk Management
Our approach to risk management includes continual monitoring, adherence to our discipline, and a focus on assuring a consistent risk profile during all phases of the market cycle. Incorporating qualitative and quantitative factors as well as a strong sell discipline, this risk-control policy seeks to help preserve investors’ capital over the long term.
Proven Management Team
The Calamos Family of Funds benefits from our team’s decades of experience in the investment industry. We follow a one-team, one-process approach that leverages the expertise of more than 50 investment professionals, led by John P. Calamos, Sr. and Nick P. Calamos, whose investment industry experience dates back to 1970 and 1983, respectively. Through the collective industry experience and educational achievements of our research and portfolio staff, we can respond to the challenges of the market with innovative and timely ideas.
Sound Proprietary Research
Over the years, we have invested significant time and resources in developing and refining sophisticated analytical models that are the foundation of the firm’s research capabilities, which we apply in conjunction with our assessment of broad themes. We believe evolving domestic policies, the growing global economy, and new technologies present long-term investment opportunities for those who can detect them.
| | | |
| 32 | | Convertible Opportunities and Income Fund
SEMIANNUAL REPORT The Calamos Investments Advantage |
Calamos Closed-End Funds
Intelligent Asset Allocation in Four Distinct Closed-End Funds
Depending on which Calamos closed-end fund you currently own, you may want to consider one or more of our other closed-end strategies to further diversify your investment portfolio.
Seek the advice of your financial advisor, who can help you determine your financial goals, risk tolerance, time horizon and income needs. To learn more, you can also visit our website at www.calamos.com.
| | | |
Fund Asset Allocation as of 4/30/07 | | Fund Profile |
Calamos Convertible Opportunities and Income Fund (CHI) | | |
| | Providing Enhanced Fixed Income Potential
Objective: The Fund seeks total return through a combination of capital appreciation and current income by investing in a diversified portfolio of convertible securities and below investment-grade (high-yield) fixed-income securities. |
| | | |
Calamos Convertible and High Income Fund (CHY) | | |
| | Providing Enhanced Fixed Income Potential
Objective: The Fund seeks total return through a combination of capital appreciation and current income by investing in a diversified portfolio of convertible securities and below investment-grade (high-yield) fixed-income securities. |
| | | |
Calamos Strategic Total Return Fund (CSQ) | | |
| | Providing Defensive Equity
Objective: The Fund seeks total return through a combination of capital appreciation and current income by investing in a diversified portfolio of equity, convertible and below investment-grade (high-yield) fixed-income securities. |
| | | |
Calamos Global Total Return Fund (CGO) | | |
| | Providing Defensive Global Equity
Objective: The Fund seeks total return through a combination of capital appreciation and current income by investing in a diversified portfolio of global equity, global convertible and below investment-grade (high-yield) fixed-income securities. |
| | | | | |
Convertible Opportunities and Income Fund
Calamos Closed-End Funds SEMIANNUAL REPORT | | | 33 | |
| A description of the Calamos Proxy Voting Policies and Procedures and the Fund’s proxy voting record for the 12 month period ended June 30, 2006 are available free of charge upon request by calling 800.582.6959, by visiting the Calamos website at www.calamos.com, by writing Calamos at: Calamos Investments, Attn: Client Services, 2020 Calamos Court, Naperville, IL 60563 or by visiting the SEC website at http://www.sec.gov. |
| The Fund files its complete list of portfolio holdings with the SEC for the first and third quarters each fiscal year on Form N-Q. The Forms N-Q are available free of charge, upon request, by calling or writing Calamos Investments at the phone number or address provided above or by visiting the SEC website at http://www.sec.gov. You may also review or, for a fee, copy the forms at the SEC’s Public Reference Room in Washington, D.C. Information on the operation of the Public Reference Room may be obtained by calling 800.732.0330. |
| FOR 24 HOUR AUTOMATED SHAREHOLDER ASSISTANCE 800.823.7386 |
| TO OBTAIN INFORMATION 800.582.6959 |
| VISIT OUR WEB SITE www.calamos.com |
| INVESTMENT ADVISER Calamos Advisors LLC 2020 Calamos Court Naperville, Il 60563-2787 |
| State Street Bank and Trust Company 225 Franklin Street Boston, MA 02111 |
| CUSTODIAN AND TRANSFER AGENT The Bank of New York P.O. Box 11258 Church Street Station New York, NY 10286 800.524.4458 |
| INDEPENDENT REGISTERED PUBLIC ACCOUNTING FIRM |
| Deloitte & Touche LLP Chicago, IL |
| LEGAL COUNSEL Bell, Boyd & Lloyd LLP Chicago, IL |
| 2020 Calamos Court Naperville, IL 60563-2787 800.582.6959 |
| © 2007 Calamos Holdings LLC. All Rights Reserved. Calamos ®, Calamos Investments ®, Investment strategies for your serious money TM and the Calamos ® logo are registered trademarks of Calamos Holdings LLC. |
ITEM 2. CODE OF ETHICS.
Not applicable.
ITEM 3. AUDIT COMMITTEE FINANCIAL EXPERT.
Not applicable.
ITEM 4. PRINCIPAL ACCOUNTANT FEES AND SERVICES.
Not applicable.
ITEM 5. AUDIT COMMITTEE OF LISTED REGISTRANTS.
Not applicable.
ITEM 6. SCHEDULE OF INVESTMENTS
Included in the Report to Shareholders in Item 1.
ITEM 7. DISCLOSURE OF PROXY VOTING POLICIES AND PROCEDURES FOR CLOSED-END MANAGEMENT INVESTMENT COMPANIES.
Not applicable.
ITEM 8. PORTFOLIO MANAGERS OF CLOSED-END MANAGEMENT INVESTMENT COMPANIES.
Not Applicable
ITEM 9. PURCHASES OF EQUITY SECURITIES BY CLOSED-END MANAGEMENT INVESTMENT COMPANY AND AFFILIATED PURCHASERS.
| | | | | | | | | | | | | | | | | |
| | | | | | | | | | | (c) Total | | |
| | | | | | | | | Number of | | (d) Maximum |
| | | (a) | | | | | | Shares (or | | Number (or |
| | | Total | | (b) | | Units) | | Approximate |
| | | Number | | Average | | Purchased as | | Dollar Value) of |
| | | of | | Price | | Part of | | Shares (or Units) |
| | | Shares | | Paid per | | Publicly | | that May Yet Be |
| | | (or | | Share | | Announced | | Purchased Under |
| | | Units) | | (or | | Plans or | | the Plans or |
| Period | | Purchased | | Unit) | | Programs | | Programs |
| November 1 to November 30 | | | N/A | | | | N/A | | | | N/A | | | | N/A | |
| December 1 to December 31 | | | N/A | | | | N/A | | | | N/A | | | | N/A | |
| January 1 to January 31 | | | N/A | | | | N/A | | | | N/A | | | | N/A | |
| February 1 to February 28 | | | N/A | | | | N/A | | | | N/A | | | | N/A | |
| March 1 to March 31 | | | N/A | | | | N/A | | | | N/A | | | | N/A | |
| April 1 to April 30 | | | N/A | | | | N/A | | | | N/A | | | | N/A | |
| Total | | | N/A | | | | N/A | | | | N/A | | | | N/A | |
ITEM 10. SUBMISSION OF MATTERS TO A VOTE OF SECURITY HOLDERS
No material changes.
ITEM 11. CONTROLS AND PROCEDURES.
a) The registrant’s principal executive officer and principal financial officer have evaluated the registrant’s disclosure controls and procedures within 90 days of this filing and have concluded that the registrant’s disclosure controls and procedures were effective, as of that date, in ensuring that information required to be disclosed by the registrant in this Form N-CSR was recorded, processed, summarized, and reported timely.
b) There were no changes in the registrant’s internal controls over financial reporting (as defined in Rule 30a-3(d) under the Investment Company Act of 1940) that occurred during the second fiscal quarter of the period covered by this report that has materially affected, or is reasonably likely to materially affect, the registrant’s internal control over financial reporting.
ITEM 12. EXHIBITS.
(a)(2)(i) Certification of Principal Executive Officer.
(a)(2)(ii) Certification of Principal Financial Officer.
SIGNATURES
Pursuant to the requirements of the Securities Exchange Act of 1934 and the Investment Company Act of 1940, the registrant has duly caused this report to be signed on its behalf by the undersigned, thereunto duly authorized.
Calamos Convertible Opportunities and Income Fund
| | | | | |
| By: | | /s/ John P. Calamos, Sr. | | |
| | | | | |
| Name: John P. Calamos, Sr. | | |
| Title: Principal Executive Officer | | |
| Date: June 25, 2007 | | |
| | | | | |
| By: | | /s/ Patrick H. Dudasik | | |
| | | | | |
| Name: Patrick H. Dudasik | | |
| Title: Principal Financial Officer | | |
| Date: June 25, 2007 | | |
Pursuant to the requirements of the Securities Exchange Act of 1934 and the Investment Company Act of 1940, this report has been signed by the following persons on behalf of the registrant and in the capacities and on the dates indicated.
Calamos Convertible Opportunities and Income Fund
| | | | | |
| By: | | /s/ John P. Calamos, Sr. | | |
| | | | | |
| Name: John P. Calamos, Sr. | | |
| Date: June 25, 2007 | | |
| | | | | |
| By: | | /s/ Patrick H. Dudasik | | |
| | | | | |
| Name: Patrick H. Dudasik | | |
| Title: Principal Financial Officer | | |
| Date: June 25, 2007 | | |