
| Wachovia Securities 15th Annual Nantucket Equity Conference June 27 - 30, 2005 Gregory E.A. Morrison, CEO Joseph F. Fisher, CFO |

| Forward-Looking Statements This presentation, contains "forward-looking statements" within the meaning of Section 27A of the Securities Act of 1933 and Section 21E of the Securities Exchange Act of 1934. Forward-looking statements include all statements that do not relate solely to historical or current facts, and can be identified by the use of words such as "may," "should," "estimate," "expect," "anticipate," "intend," "believe," "predict," "potential," or words of similar import. Forward-looking statements are necessarily based on estimates and assumptions that are inherently subject to significant business, economic and competitive uncertainties and risks, many of which are subject to change. These uncertainties and risks include, but are not limited to, conducting operations in a competitive environment; our ability to maintain our A.M. Best Company rating; significant weather-related or other natural or man-made disasters over which the Company has no control; the effectiveness of our loss limitation methods and pricing models; the adequacy of the Company's liability for unpaid losses and loss adjustment expenses; the availability of retrocessional reinsurance on acceptable terms; our ability to maintain our business relationships with reinsurance brokers; general political and economic conditions, including the effects of civil unrest, war or a prolonged US or global economic downturn or recession; the cyclicality of the property and casualty reinsurance business; market volatility and interest rate and currency exchange rate fluctuation; tax, regulatory or legal restrictions or limitations applicable to the Company or the property and casualty reinsurance business generally; and changes in the Company's plans, strategies, objectives, expectations or intentions, which may happen at any time at the Company's discretion. As a consequence, current plans, anticipated actions and future financial condition and results may differ from those expressed in any forward-looking statements made by or on behalf of the Company. Additionally, forward-looking statements speak only as of the date they are made, and we undertake no obligation to release publicly the results of any future revisions or updates we may make to forward-looking statements to reflect new information or circumstances after the date hereof or to reflect the occurrence of future events. |
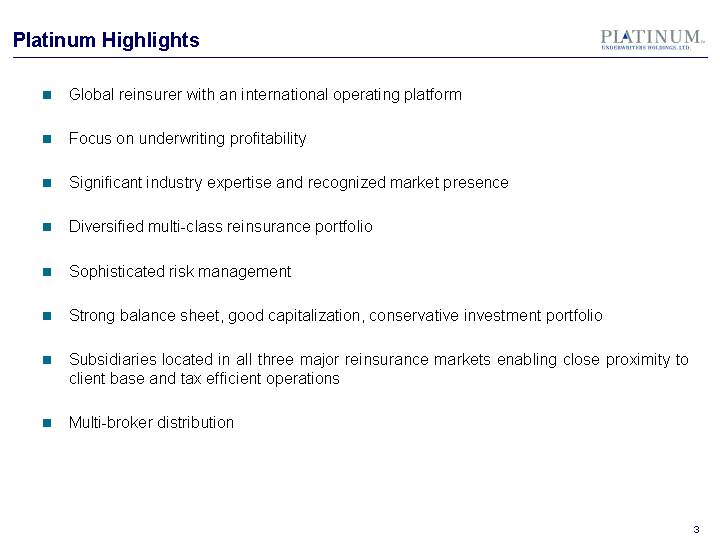
| Platinum Highlights Global reinsurer with an international operating platform Focus on underwriting profitability Significant industry expertise and recognized market presence Diversified multi-class reinsurance portfolio Sophisticated risk management Strong balance sheet, good capitalization, conservative investment portfolio Subsidiaries located in all three major reinsurance markets enabling close proximity to client base and tax efficient operations Multi-broker distribution |

| Company Overview Global reinsurance company Experienced management team Proximity to clients Tax efficient structure Financial strength Strong balance sheet and capital position High quality investment portfolio Strong underwriting profitability International US East 18 82 International 18% United States 82% 2004 NPW by Geography Finite P&C Casualty East 28 30 42 Finite 28% Property & Marine 30% Casualty 42% 2004 NPW by Segment Total: $1,646 mm Total: $1,646 mm |

| Executive Management Name Title Years in Industry Years at Platinum/ Predecessor Steven H. Newman Chairman 42 3 Gregory E.A. Morrison Chief Executive Officer 25 2 Michael D. Price President & Chief Underwriting Officer, Platinum US 17 3 Joseph F. Fisher Chief Financial Officer 28 1 Michael E. Lombardozzi General Counsel 18 3 Neal J. Schmidt Chief Actuary, EVP, Platinum US 27 19 H. Elizabeth Mitchell Chief Operating Officer & EVP, Platinum US 21 12 Gregory J. Richardson EVP, Platinum US 13 13 Eleni Kourou EVP, Platinum US 19 9 Barton W. Hedges President & Chief Operating Officer, Platinum Bermuda 18 3 Robert S. Porter Chief Executive Officer, Platinum UK 18 23 15 8 Average: Avg. 10 |

| Competitive Strengths/Market Positioning Strength Why? Strong position relative to start-ups Attractive initial portfolio Existing US and UK operating platforms Multi-class underwriting Reinsurance only Not competing as a primary insurer against our reinsurance clients Less regulation than primary insurance Less infrastructure than primary insurance Treaty reinsurer Treaty platform less expensive than facultative platform Easier to control and manage portfolio Broker market Faster access to business Lower fixed cost base than direct market Easier to move in and out of markets |
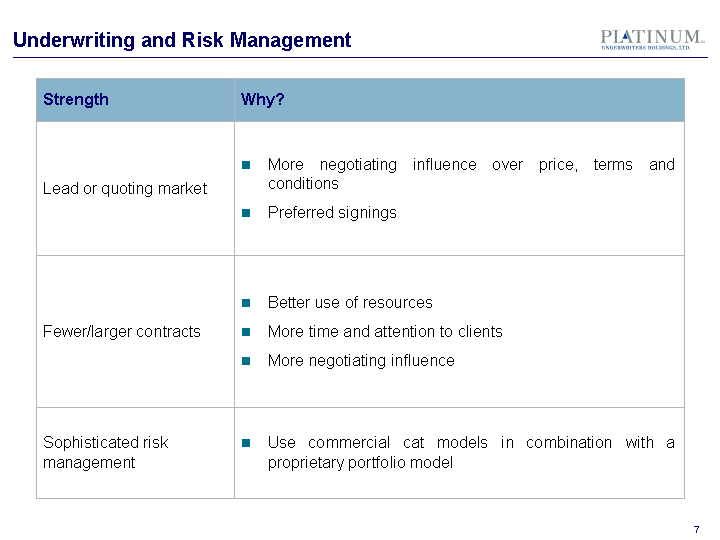
| Underwriting and Risk Management Strength Why? Lead or quoting market More negotiating influence over price, terms and conditions Preferred signings Fewer/larger contracts Better use of resources More time and attention to clients More negotiating influence Sophisticated risk management Use commercial cat models in combination with a proprietary portfolio model |
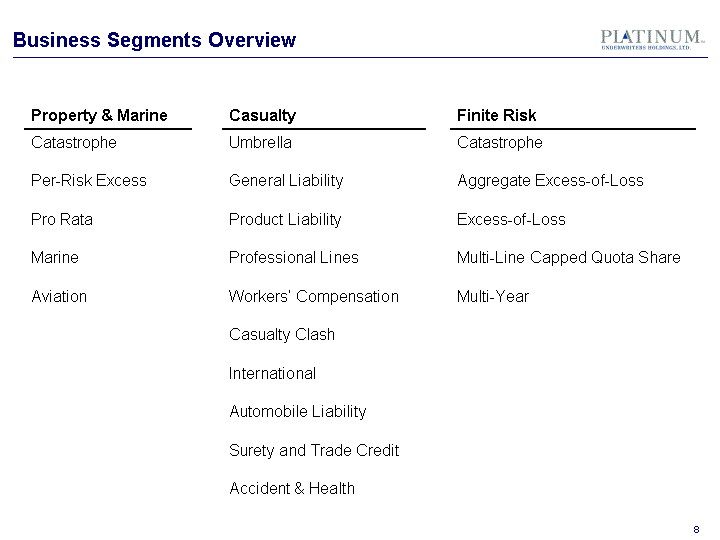
| Business Segments Overview Property & Marine Casualty Finite Risk Catastrophe Per-Risk Excess Pro Rata Marine Aviation Umbrella General Liability Product Liability Professional Lines Workers' Compensation Casualty Clash International Automobile Liability Surety and Trade Credit Accident & Health Catastrophe Aggregate Excess-of-Loss Excess-of-Loss Multi-Line Capped Quota Share Multi-Year |

| Property & Marine Segment International United States East 36 64 Proportional Excess of Loss East 27 73 Proportional 27% Excess-of-Loss 73% 2004 Property & Marine NPW by Type International 36% United States 64% 2004 Property & Marine NPW by Geography Inherited an attractive, sizeable and diversified portfolio of Property & Marine business Sophisticated portfolio pricing approach - rigorous, actuarially-based pricing 43% growth in net premiums written from 2003 to $504 million in 2004, reflecting favorable market conditions Total: $504 mm |
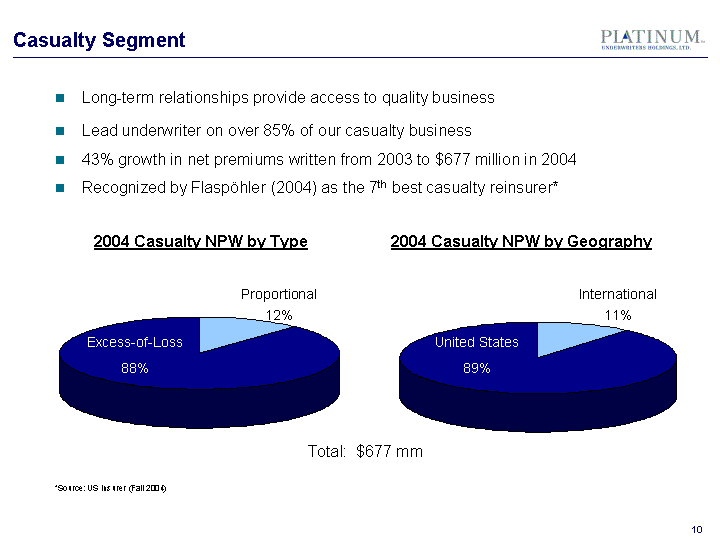
| Casualty Segment Proportional Excess of Loss west 12 88 Proportional 12% Excess-of-Loss 88% International United States west 11 89 United States 89% International 11% Long-term relationships provide access to quality business Lead underwriter on over 85% of our casualty business 43% growth in net premiums written from 2003 to $677 million in 2004 Recognized by Flaspohler (2004) as the 7th best casualty reinsurer* 2004 Casualty NPW by Type 2004 Casualty NPW by Geography *Source: US Insurer (Fall 2004) Total: $677 mm |
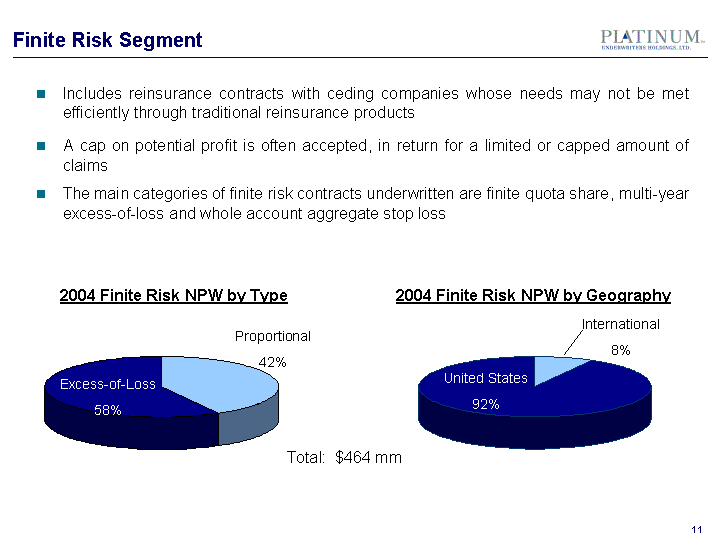
| Finite Risk Segment Includes reinsurance contracts with ceding companies whose needs may not be met efficiently through traditional reinsurance products A cap on potential profit is often accepted, in return for a limited or capped amount of claims The main categories of finite risk contracts underwritten are finite quota share, multi-year excess-of-loss and whole account aggregate stop loss Proportional Excess of Loss East 42 58 International United States East 8 92 2004 Finite Risk NPW by Type 2004 Finite Risk NPW by Geography Proportional 42% International 8% Excess-of-Loss 58% United States 92% Total: $464 mm |

| Finite Risk Segment What we don't do: Retroactive covers such as loss portfolio transfers and adverse development covers Rely on any undisclosed side agreements Seek clients in financial distress Create special purpose vehicles Provide accounting advice Conceal our activities |

| Distribution Channels Products are marketed worldwide through our underwriting offices and non-exclusive relationships with the leading reinsurance brokers active in the United States and abroad Provides access to a broad range of potential ceding companies through our close relationships with our brokers Minimize fixed costs associated with marketing activities benfield blanch marsh AON willis Group Tower Perrin Other East 28 25 16 8 7 16 Benfield Blanch 28% Marsh & McLennan 25% Aon 16% Willis 8% Towers Perrin 7% Others 16% |

| Financial Results - Income Statements Summary Income statements ($ in millions) 2003 2004 Q1 2005 Net premiums w ritten $ 1,172.1 $ 1,646.0 $ 493.8 Net premiums earned 1,067.5 1,447.9 411.0 Underw riting gain 162.6 47.1 63.5 Investment income 57.6 84.5 26.9 Other (26.5) (16.5) (7.4) Net income before tax 193.7 115.1 83.0 Income tax expense 48.9 30.3 9.9 Net income $ 144.8 $ 84,8 $ 73.1 GAAP ratios Loss LAE 54.7% 70.4% 57.8% Acquisition expense 23.5% 22.6% 22.7% Other underwriting expense 6.5% 3.7% 4.0% Combined ratio: 84.7% 96.7% 84.5% |

| Financial Results - Balance Sheets Summary Balance Sheets ($ in millions) 31-Dec-03 31-Dec-04 31-Mar-05 Assets: Investable assets $ 1,790.5 $ 2,456.9 $2,584.9 Premium receivables 487.4 580.0 638.3 Accrued investment income 17.5 23.7 27.1 Reinsurance receivables 5.1 2.0 8.0 DAC 79.3 136.0 149.6 Other assets 105.8 223.4 256.6 Total assets $ 2,485.6 $ 3,422.0 $ 3,664.5 Liabilities: Loss and LAE reserves 736.9 1,381.0 1,507.2 Unearned premium reserves 305.6 502.4 589.8 Hybrid obligations (ESUs) 137.5 137.5 137.5 Other liabilities 238.4 268.1 257.0 Total liabilities 1,418.4 2,289.0 2,491.5 Shareholders' equity 1,067.2 1,133.0 1,173.0 Total liabilities and shareholders' equity $ 2,485.6 $ 3,422.0 $ 3,664.5 |

| Financial Results - Cash Flow Statements Summary Cash Flow Statements ($ in millions) 2003 2004 Q1 Operating activities Trading activities $ 469,168 (85,861) $ 698,223 16,510 $ 174,788 4,860 Cash flow provided by operations Cash flow used in investing Cash flow provided by /(used in) financing 383,307 (546,763) (12,569) 714,733 (595,478) (14,819) 179,648 (89,838) 310 Net increase / (decrease) in cash $ (176,025) $ 104,436 $ 90,120 |

| Investment Portfolio Average duration - 3.6 years Average credit quality - Aa3 Bonds by Industry* Aaa Aa - Aa3 A- A3 Baa East 34.1 20 40.6 5.3 US Govt mortgage and ABS Municipal foreign govt, states and foreign corporate redeemable pref. Stock Corporate East 22.8 9.6 15.5 0.16 51.7 Mortgage and Asset- Backed Securities 22.8% Municipal Bonds 9.6% Other 0.4% Aaa 34% Aa - Aa3 20% A - A3 41% Baa 5% Bonds by Ratings* Corporate 51.7% *As of December 31, 2004 Foreign governments, states and foreign corporate 15.5% |

| Loss Reserves Net Loss and LAE Reserves = $732M As of December 31, 2003 As of December 31, 2004 Net Loss and LAE Reserves = $1,379M Finite 24% $180M Property 32% $232M Casualty 44% $320M Finite 18% $254M Property 30% $410M Casualty 52% $715M |

| Sound Capitalization Q1 2005 Plus Senior Notes1 $1.5 Billion $1.0 Billion Debt / total adjusted capital ratio2 0.0% 16.4% Notes: 1 $250 million of Senior Notes were issued in May, 2005 2 Equity Security Units are treated as equity, due to their forward purchase contract component (i.e. "mandatory conversion") and therefore are not included as debt in this ratio |

| Reinsurance Outlook Property Adequate profitability Rate reductions expected We will continue to deploy most of our property capacity Casualty Not a uniform market Profitability good in many casualty classes Rate reductions expected Finite Increased accounting and regulatory scrutiny Limited short-term demand for finite Long-term demand will persist after accounting rules clarified and regulatory risk has receded |

| Investment Highlights Global reinsurer with an international operating platform Focus on underwriting profitability Significant industry expertise and recognized market presence Diversified multi-class reinsurance portfolio Sophisticated risk management Strong balance sheet, good capitalization, conservative investment portfolio Subsidiaries located in all three major reinsurance markets enabling close proximity to client base and tax efficient operations Multi-broker distribution |