Table of Contents
UNITED STATES SECURITIES AND EXCHANGE COMMISSION
WASHINGTON, D.C. 20549
FORM 10-K
| þ | ANNUAL REPORT PURSUANT TO SECTION 13 OR 15(d) OF THE SECURITIES EXCHANGE ACT OF 1934 |
For the fiscal year ended December 31, 2006
OR
| o | TRANSITION REPORT PURSUANT TO SECTION 13 OR 15(d) OF THE SECURITIES EXCHANGE ACT OF 1934 |
For the transition period from ___ to ___
Commission File Number 001-31341
PLATINUM UNDERWRITERS HOLDINGS, LTD.
(Exact name of registrant as specified in its charter)
| Bermuda (State or other jurisdiction of incorporation or organization) | 98-0416483 (I.R.S. Employer Identification No.) |
| The Belvedere Building 69 Pitts Bay Road Pembroke, Bermuda (Address of principal executive offices) | HM 08 (Zip Code) |
Registrant’s telephone number, including area code: (441) 295-7195
Securities registered pursuant to Section 12(b) of the Act:
| Title of each class | Name of each exchange on which registered | |
| Common Shares, par value $0.01 per share | New York Stock Exchange | |
| 6.00% Series A Mandatory Convertible | ||
| Preferred Shares par value $0.01 per share, | ||
| liquidation preference $30.15 per share | New York Stock Exchange |
Securities registered pursuant to Section 12(g) of the Act: None
Indicate by check mark if the registrant is a well-known seasoned issuer, as defined in Rule 405 of the Securities Act. Yesþ Noo
Indicate by check mark if the registrant is not required to file reports pursuant to Section 13 or Section 15(d) of the Act. Yeso Noþ
Indicate by check mark whether the registrant: (1) has filed all reports required to be filed by Section 13 or 15(d) of the Securities Exchange Act of 1934 during the preceding 12 months (or for such shorter period that the registrant was required to file such reports), and (2) has been subject to such filing requirements for the past 90 days. Yesþ Noo
Indicate by check mark if disclosure of delinquent filers pursuant to Item 405 of Regulation S-K is not contained herein, and will not be contained, to the best of registrant’s knowledge, in definitive proxy or information statements incorporated by reference in Part III of this Form 10-K or any amendment to this Form 10-K. Yesþ Noo
Indicate by check mark whether the registrant is a large accelerated filer, an accelerated filer or a non-accelerated filer.
Large accelerated filerþ Accelerated filero Non-accelerated filero
Indicate by check mark whether the registrant is a shell company (as defined in Rule 12b-2 of the Exchange Act). Yeso Noþ
The aggregate market value of common shares held by non-affiliates of the registrant as of June 30, 2006, the last business day of our most recently completed second fiscal quarter, was $1,656,814,743 based on the closing sale price of $27.98 per common share on the New York Stock Exchange on that date. For purposes of this computation only, all executive officers, directors, and 10% beneficial owners of the registrant are deemed to be affiliates.
As of February 16, 2007, there were outstanding 59,756,604 common shares, par value $0.01 per share, of the registrant.
DOCUMENTS INCORPORATED BY REFERENCE
Portions of the registrant’s definitive proxy statement for the 2007 Annual General Meeting of Shareholders are incorporated by reference into Part III of this report.
TABLE OF CONTENTS
Table of Contents
PART I
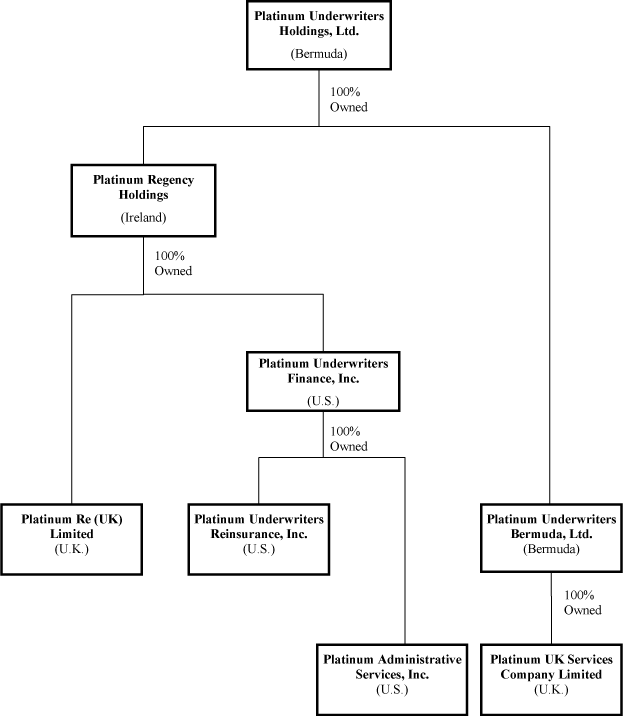
Platinum Underwriters Holdings, Ltd. (“Platinum Holdings”) is a Bermuda holding company organized in 2002. Platinum Holdings and its subsidiaries are collectively referred to as the “Company”. The terms “we”, “us”, and “our” also refer to Platinum Holdings and its consolidated subsidiaries, unless the context otherwise indicates. “Platinum Bermuda” refers to Platinum Underwriters Bermuda, Ltd., a Bermuda reinsurance company and wholly owned subsidiary of Platinum Holdings. “Platinum Regency” refers to Platinum Regency Holdings, an intermediate holding company domiciled in Ireland and a wholly owned subsidiary of Platinum Holdings. “Platinum UK” refers to Platinum Re (UK) Limited, a reinsurance company domiciled in the United Kingdom and a wholly owned subsidiary of Platinum Regency. “Platinum Finance” refers to Platinum Underwriters Finance, Inc., an intermediate holding company in the U.S. and a wholly owned subsidiary of Platinum Regency. “Platinum US” refers to Platinum Underwriters Reinsurance, Inc., a reinsurance company based in the United States and a wholly owned subsidiary of Platinum Finance. Platinum Administrative Services, Inc. is a U.S. company and a wholly owned subsidiary of Platinum Finance that provides administrative services to various subsidiaries of the Company. Platinum UK Services Company Limited is a wholly owned subsidiary of Platinum Bermuda based in the United Kingdom that provides administrative services to Platinum Bermuda.
Note On Forward-Looking Statements
This Report on Form 10-K contains forward-looking statements within the meaning of Section 27A of the Securities Act of 1933 and Section 21E of the Securities Exchange Act of 1934 (the “Exchange Act”). Forward-looking statements are necessarily based on estimates and assumptions that are inherently subject to significant business, economic and competitive uncertainties and contingencies, many of which are subject to change. These uncertainties and contingencies can affect actual results and could cause actual results to differ materially from those expressed in any forward-looking statements made by, or on behalf of, us.
In particular, statements using words such as “may,” “should,” “estimate,” “expect,” “anticipate,” “intend,” “believe,” “predict,” “potential,” or words of similar import generally involve forward-looking statements. For example, we have included certain forward-looking statements in Management’s Discussion and Analysis of Financial Condition and Results of Operations with regard to trends in results, prices, volumes, operations, investment results, margins, risk management and exchange rates. This Form 10-K also contains forward-looking statements with respect to our business and industry, such as those relating to our strategy and management objectives and trends in market conditions, market standing, product volumes, investment results and pricing conditions.
In light of the risks and uncertainties inherent in all future projections, the inclusion of forward-looking statements in this Form 10-K should not be considered as a representation by us or any other person that our objectives or plans will be achieved. Numerous factors could cause our actual results to differ materially from those in forward-looking statements, including the following:
| (1) | significant weather-related or other natural or man-made disasters over which we have no control; | ||
| (2) | the adequacy of our liability for unpaid losses and loss adjustment expenses, including, but not limited to, losses from Hurricanes Katrina, Rita and Wilma and the possibility that ultimate losses and loss adjustment expenses from these hurricanes may prove to be materially different from estimates made to date; | ||
| (3) | the effectiveness of our loss limitation methods and pricing models; |
- 1 -
Table of Contents
| (4) | our ability to maintain our A.M. Best Company, Inc. rating; | ||
| (5) | conducting operations in a competitive environment; | ||
| (6) | the cyclicality of the property and casualty reinsurance business; | ||
| (7) | tax, regulatory or legal restrictions or limitations applicable to us or the property and casualty reinsurance business generally; | ||
| (8) | our ability to maintain our business relationships with reinsurance brokers; | ||
| (9) | the availability of retrocessional reinsurance on acceptable terms; | ||
| (10) | market volatility and interest rate and currency exchange rate fluctuation; | ||
| (11) | general political and economic conditions, including the effects of civil unrest, acts of terrorism, war or a prolonged U.S. or global economic downturn or recession; and | ||
| (12) | changes in our plans, strategies, objectives, expectations or intentions, which may happen at any time at our discretion. |
As a consequence, current plans, anticipated actions and future financial condition and results may differ from those expressed in any forward-looking statements made by or on behalf of us. The foregoing factors, which are discussed in more detail in “Management’s Discussion and Analysis of Financial Condition and Results of Operations — Risk Factors,” should not be construed as exhaustive. Additionally, forward-looking statements speak only as of the date they are made, and we undertake no obligation to release publicly the results of any future revisions or updates we may make to forward-looking statements to reflect new information or circumstances after the date hereof or to reflect the occurrence of future events.
Item 1. Business
Industry Overview
General
Reinsurance is an arrangement in which an insurance company, referred to as the reinsurer, agrees to assume from another insurance company, referred to as the ceding company, all or a portion of the insurance risks that the ceding company has underwritten under one or more insurance policies. In return, the reinsurer receives a premium for the risks that it assumes from the ceding company. Reinsurance, however, does not discharge the ceding company from its liabilities to policyholders. Reinsurance can provide ceding companies with four principal benefits: a reduction in net liability on individual risks, catastrophe protection from multiple losses, assistance in maintaining acceptable financial ratios, and additional underwriting capacity permitting the ceding company to accept larger risks or write more business than would be possible without an accompanying increase in capital.
Types of Reinsurance
Reinsurance is typically classified into two categories based on the underlying insurance coverage: property and casualty reinsurance, and life and annuity reinsurance.
- 2 -
Table of Contents
Property and Casualty Reinsurance
We write property and casualty reinsurance. Property reinsurance protects a ceding company against financial loss arising out of damage to property or loss of its use caused by an insured peril. Examples of property reinsurance are property catastrophe and property per-risk coverages. Property catastrophe reinsurance protects a ceding company against losses arising out of multiple claims for a single event while property per-risk reinsurance protects a ceding company against loss arising out of a single claim for a single event.
Casualty reinsurance protects a ceding company against financial loss arising out of the obligation to others for loss or damage to persons or property. Examples of casualty reinsurance are general and automobile liability, professional liability, workers’ compensation, accident and health, surety and trade credit coverages.
Although property reinsurance involves a high degree of volatility, property reinsurance claims are generally reported soon after the event giving rise to the claim and tend to be assessed and paid relatively expeditiously. In comparison, there tends to be a greater time lag between the occurrence, reporting and payment of casualty reinsurance claims.
Life and Annuity Reinsurance
We do not currently write any life or annuity reinsurance although we may do so in the future. Life reinsurance provides coverage with respect to individual and group life risks to primary life insurers. Annuity reinsurance provides coverage to insurers that issue annuity contracts to consumers seeking to accumulate personal wealth or as protection against outliving their financial resources.
Excess-of-Loss and Proportional Reinsurance
Reinsurance can be written on either an excess-of-loss basis or a proportional basis (which is also referred to as pro-rata). In the case of excess-of-loss reinsurance, the reinsurer assumes all or a specified portion of the ceding company’s risks in excess of a specified claim amount, referred to as the ceding company’s retention or the reinsurer’s attachment point, subject to a negotiated reinsurance contract limit. For example, property catastrophe excess-of-loss reinsurance provides coverage to a ceding company when its aggregate claims, arising from a single occurrence during a covered period, such as a hurricane or an earthquake, exceed the attachment point specified in the reinsurance contract. Other forms of excess-of-loss reinsurance respond when one or more individual claims exceed the ceding company’s retention. Premiums for excess-of-loss reinsurance may be a specified dollar amount or a percentage of the premium charged by the ceding company.
Reinsurers manage their underwriting risk from excess-of-loss contracts by charging reinsurance premiums at specific retention levels, independent of the premiums charged by primary insurers, and based upon their own underwriting assumptions. Because primary insurers typically retain a larger loss exposure under excess-of-loss contracts, we believe that they typically have a strong incentive to underwrite risks and adjust losses in a prudent manner.
In the case of proportional reinsurance, the reinsurer assumes a predetermined portion of the ceding company’s risks under the covered primary insurance contract or contracts. The frequency of claims under a proportional contract is usually greater than under an excess-of-loss contract, since the reinsurer shares proportionally in all losses. Premiums for proportional reinsurance are typically a predetermined portion of the premiums the ceding company receives from its insureds.
- 3 -
Table of Contents
Treaty and Facultative Reinsurance
Reinsurance can be written either through treaty or facultative reinsurance arrangements. In treaty reinsurance, the ceding company cedes, and the reinsurer assumes, a specified portion of a type or category of policies insured by the ceding company. In facultative reinsurance, the ceding company cedes, and the reinsurer assumes, all or part of a specific policy or policies. Substantially all of the reinsurance that we underwrite is on a treaty basis. We underwrite facultative reinsurance in limited and opportunistic circumstances.
Generally, treaty reinsurers do not separately evaluate each of the individual risks assumed under their treaties and are largely dependent on the original risk underwriting decisions made by the ceding company’s underwriters. Accordingly, reinsurers will carefully evaluate the ceding company’s risk management and underwriting practices, as well as claims settlement practices and procedures, in deciding whether to provide treaty reinsurance and in appropriately pricing the treaty.
Generally, reinsurers who provide facultative reinsurance do so separately from their treaty operations. Facultative reinsurance is normally purchased by ceding companies for risks not covered by their reinsurance treaties, for amounts in excess of the claims limits of their reinsurance treaties and for unusual and complex risks. In addition, facultative reinsurance often provides coverages for relatively large exposures, which may result in greater potential claims volatility. Facultative reinsurance typically has higher underwriting and other expenses than treaty reinsurance because each risk is individually underwritten and administered.
Finite Reinsurance
Finite reinsurance, often referred to as non-traditional reinsurance, includes principally structured reinsurance contracts with ceding companies whose needs may not be met efficiently through traditional reinsurance products. In exchange for contractual features that limit our downside risk, reinsurance contracts we classify as finite risk provide the potential for significant profit commission to the ceding company. The classes of risks underwritten through finite risk contracts are generally consistent with the classes covered by traditional products.
Broker and Direct Reinsurance
Reinsurance can be written through reinsurance brokers or directly with ceding companies. We believe that a ceding company’s decision to select either the broker market or the direct market is influenced by various factors including, among others, market capacity, market competition, flexibility in the terms and conditions, the ability to efficiently compare the analysis and quotes of several reinsurers and the historical relationship with the reinsurer.
We underwrite substantially all of our reinsurance through brokers, as we believe that the use of reinsurance brokers enables us to operate on a more cost-effective basis and to maintain the flexibility to enter and exit reinsurance lines in a quick and efficient manner. We believe that brokers are particularly useful in assisting with placements of excess-of-loss reinsurance programs.
Retrocession
Reinsurers typically purchase reinsurance to reduce their own risk exposure. Reinsurance of a reinsurer’s risks is called retrocession. Reinsurance companies cede risks under retrocessional agreements to other reinsurers, known as retrocessionaires, for reasons that include reducing liability on
- 4 -
Table of Contents
individual risks, protecting against catastrophic losses, stabilizing financial ratios and obtaining additional underwriting capacity. We purchase and issue retrocessional contracts on an opportunistic basis.
Our Business
General
Platinum Holdings is a Bermuda holding company organized in 2002. We provide property and marine, casualty and finite risk reinsurance coverages, through reinsurance intermediaries, to a diverse clientele of insurers and select reinsurers on a worldwide basis. We operate through two licensed reinsurance subsidiaries: Platinum Bermuda and Platinum US. Platinum US had been an inactive licensed insurance company with no underwriting activity prior to January 1, 2002. Through December 31, 2006 we also underwrote business in Platinum UK. Platinum Bermuda and Platinum UK were formed in 2002 and have no prior operating history or loss reserves subject to development prior to January 1, 2002. In 2007 we ceased underwriting reinsurance business in Platinum UK.
Platinum Regency is an intermediate holding company. Platinum Finance’s activities have generally been limited to activities relating to holding company functions as well as activities relating to debt obligations. The activities of Platinum Administrative Services, Inc. and Platinum UK Services Company Limited are limited to providing inter-company administrative services. The following chart depicts our corporate structure:
- 5 -
Table of Contents
Our Strategy
Our goal is to achieve attractive long-term returns for our shareholders, while establishing Platinum as a disciplined risk manager and market leader in selected classes of property and casualty reinsurance, through the following strategies:
- 6 -
Table of Contents
| • | Operate as a multi-class reinsurer.We seek to offer a broad range of reinsurance coverage to our ceding companies. We believe that this approach enables us to more effectively serve our clients, diversify our risk and leverage our capital. | ||
| • | Focus on profitability, not market share.Our management team pursues a strategy that emphasizes profitability rather than market share. Key elements of this strategy are prudent risk selection, appropriate pricing and adjustment of our business mix to respond to changing market conditions. | ||
| • | Exercise disciplined underwriting and risk management.We exercise underwriting and risk management discipline by: (i) maintaining a diverse spread of risk in our book of business across product lines and geographic zones, (ii) emphasizing excess-of-loss contracts over proportional contracts, (iii) managing our aggregate catastrophe exposure through the application of sophisticated property catastrophe modeling tools and (iv) monitoring our accumulating exposures on non-property catastrophe exposed coverages. | ||
| • | Operate from a position of financial strength.As of December 31, 2006, we had a total capitalization of $2,108,061,000. Our capital position is unencumbered by any potential adverse development of unpaid losses for business written prior to January 1, 2002. Our investment strategy focuses on security and stability in our investment portfolio by maintaining a portfolio that consists of diversified, high quality, predominantly publicly traded fixed maturity securities. |
We believe these factors, combined with our strict underwriting discipline, allow us to maintain our strong financial position and to be opportunistic when market conditions are most attractive.
Operating Segments
We have organized our worldwide reinsurance business into the following three operating segments: Property and Marine, Casualty and Finite Risk. In each of our operating segments, we offer our reinsurance products to providers of commercial and personal lines of insurance and reinsurance. The following table sets forth our net premiums written for the years ended December 31, 2006, 2005 and 2004 by operating segment and by type of reinsurance ($ in thousands):
| Years Ended December 31, | ||||||||||||||||||||||||
| 2006 | 2005 | 2004 | ||||||||||||||||||||||
| Property and Marine | ||||||||||||||||||||||||
| Excess-of-loss | $ | 318,260 | 27 | % | 412,781 | 24 | % | $ | 366,184 | 22 | % | |||||||||||||
| Proportional | 106,669 | 9 | % | 162,274 | 9 | % | 138,255 | 8 | % | |||||||||||||||
| Subtotal Property and Marine | 424,929 | 36 | % | 575,055 | 33 | % | 504,439 | 30 | % | |||||||||||||||
| Casualty | ||||||||||||||||||||||||
| Excess-of-loss | 663,338 | 56 | % | 676,276 | 39 | % | 593,752 | 37 | % | |||||||||||||||
| Proportional | 94,337 | 8 | % | 132,755 | 8 | % | 83,647 | 5 | % | |||||||||||||||
| Subtotal Casualty | 757,675 | 64 | % | 809,031 | 47 | % | 677,399 | 42 | % | |||||||||||||||
| Finite Risk | ||||||||||||||||||||||||
| Excess-of-loss | 50,220 | 4 | % | 63,628 | 4 | % | 155,090 | 9 | % | |||||||||||||||
| Proportional | (56,211 | ) | (4 | %) | 270,008 | 16 | % | 309,085 | 19 | % | ||||||||||||||
| Subtotal Finite Risk | (5,991 | ) | 0 | % | 333,636 | 20 | % | 464,175 | 28 | % | ||||||||||||||
- 7 -
Table of Contents
| Years Ended December 31, | ||||||||||||||||||||||||
| 2006 | 2005 | 2004 | ||||||||||||||||||||||
| Combined Segments | ||||||||||||||||||||||||
| Excess-of-loss | 1,031,818 | 87 | % | 1,152,685 | 67 | % | 1,115,026 | 68 | % | |||||||||||||||
| Proportional | 144,795 | 13 | % | 565,037 | 33 | % | 530,987 | 32 | % | |||||||||||||||
| Total | $ | 1,176,613 | 100 | % | 1,717,722 | 100 | % | $ | 1,646,013 | 100 | % | |||||||||||||
The following table sets forth our net premiums written for the years ended December 31, 2006, 2005 and 2004 by operating segment and by geographic location of the ceding company ($ in thousands):
| Years Ended December 31, | ||||||||||||||||||||||||
| 2006 | 2005 | 2004 | ||||||||||||||||||||||
| Property and Marine | ||||||||||||||||||||||||
| United States | $ | 275,870 | 23 | % | 401,270 | 23 | % | $ | 320,506 | 19 | % | |||||||||||||
| International | 149,059 | 13 | % | 173,785 | 10 | % | 183,933 | 11 | % | |||||||||||||||
| Subtotal Property and Marine | 424,929 | 36 | % | 575,055 | 33 | % | 504,439 | 30 | % | |||||||||||||||
| Casualty | ||||||||||||||||||||||||
| United States | 686,278 | 58 | % | 718,103 | 42 | % | 601,878 | 37 | % | |||||||||||||||
| International | 71,397 | 6 | % | 90,928 | 5 | % | 75,521 | 5 | % | |||||||||||||||
| Subtotal Casualty | 757,675 | 64 | % | 809,031 | 47 | % | 677,399 | 42 | % | |||||||||||||||
| Finite Risk | ||||||||||||||||||||||||
| United States | (12,626 | ) | (1 | %) | 329,843 | 19 | % | 428,024 | 26 | % | ||||||||||||||
| International | 6,635 | 1 | % | 3,793 | 1 | % | 36,151 | 2 | % | |||||||||||||||
| Subtotal Finite Risk | (5,991 | ) | 0 | % | 333,636 | 20 | % | 464,175 | 28 | % | ||||||||||||||
| Combined Segments | ||||||||||||||||||||||||
| United States | 949,522 | 80 | % | 1,449,216 | 84 | % | 1,350,408 | 82 | % | |||||||||||||||
| International | 227,091 | 20 | % | 268,506 | 16 | % | 295,605 | 18 | % | |||||||||||||||
| Total | $ | 1,176,613 | 100 | % | 1,717,722 | 100 | % | $ | 1,646,013 | 100 | % | |||||||||||||
Property and Marine
The Property and Marine operating segment includes principally property and marine coverages that are written in the United States and select international markets. This business includes property per-risk excess-of-loss treaties, proportional treaties and catastrophe excess-of-loss treaties. We write a limited amount of other types of reinsurance on an opportunistic basis. We employ underwriters and actuaries with expertise in each of the following areas:
| • | Property.We provide reinsurance coverage for damage to property and crops. Our catastrophe excess-of-loss reinsurance contracts provide a defined limit of liability, permitting us to quantify our aggregate maximum loss exposure for various catastrophe events. Quantification of loss exposure is fundamental to our ability to manage our loss exposure through geographical zone limits and program limits. In addition, when our pricing standards are met, we write other property coverages, including per-risk excess-of-loss or proportional treaties. We have also entered into an agreement with an underwriting manager to underwrite property facultative and program reinsurance risks. |
- 8 -
Table of Contents
| • | Marine.We provide reinsurance coverage for marine and offshore energy insurance programs. Coverages reinsured include hull damage, protection and indemnity, cargo damage, satellite damage and general marine liability. Within Marine, we also write commercial and general aviation reinsurance. Marine reinsurance treaties include excess-of-loss as well as proportional treaties. We emphasize excess-of-loss treaties that allow our evaluation using experience and exposure pricing models. |
Casualty
The Casualty operating segment includes principally reinsurance treaties that cover umbrella liability, general and product liability, professional liability, workers’ compensation, casualty clash, automobile liability, surety, trade credit and political risk. This segment also includes accident and health reinsurance treaties, which are predominantly reinsurance of health insurance products. We generally write casualty reinsurance on an excess-of-loss basis. Most frequently, we respond to claims on an individual risk basis, providing coverage when a claim for a single, original insured event or occurrence reaches our attachment point. We write some excess-of-loss treaties on an occurrence basis that respond when all of a ceding company’s claims from multiple original insureds arising from a single claims event exceed our attachment point. On an opportunistic basis, we may write proportional treaties.
We seek reinsurance treaties covering established books of insurance products where we believe that past experience permits a reasonable estimation of the reinsurance premium adequacy. We underwrite new exposures selectively and only after a comprehensive evaluation of the risk being reinsured and the capabilities of the ceding company. We employ underwriters and pricing actuaries with expertise in one or more of the following areas:
| • | Umbrella Liability.An umbrella policy is an excess insurance policy that provides coverage, typically for general liability or automobile liability, when claims, individually or in the aggregate, exceed the limit of the original policy underlying the excess policy. A claim must exceed the limit of some underlying policy for the claim to be considered under an umbrella policy. We primarily reinsure commercial umbrella liability policies. | ||
| • | General and Product Liability.We provide reinsurance of various third party liability coverages to both small and large insureds in both commercial and personal lines predominantly on an excess-of-loss basis. This business includes commercial, farmowners and homeowners policies as well as third party liability coverages such as product liability. | ||
| • | Professional Liability.We write reinsurance treaties for professional liability programs, including directors and officers, employment practices, and errors and omissions for professionals such as accountants, lawyers, medical professionals, architects and engineers. In most circumstances, the underlying insurance products for these lines of business are written on a claims made basis, which requires claims related to the liabilities insured under the policy to be submitted to the insurer during a specified coverage period. | ||
| • | Workers’ Compensation.We reinsure workers’ compensation on a catastrophic basis as well as on a per-claimant basis. We may provide full statutory coverage or coverage that is subject to specific carve-outs. Our predominant exposure to workers’ compensation would generally arise from a single occurrence, such as a factory explosion or earthquake, involving claims from more than one employer. |
- 9 -
Table of Contents
| • | Casualty Clash.Casualty clash reinsurance responds to claims arising from a single set of circumstances covered by more than one insurance policy or multiple claimants on one policy. This type of reinsurance is analogous to property catastrophe reinsurance, but written for casualty lines of business. Our casualty clash treaties are generally excess-of-loss contracts with both occurrence limits and aggregate limits. | ||
| • | Automobile Liability.Automobile insurance policies provide first party coverage for damage to the insured’s vehicle and third party coverage for the insured’s liability to other parties for injuries and for damage to their property due to the use of the insured vehicle. These insurance policies may also provide coverage for uninsured motorists and medical payments. We generally reinsure automobile liability on an excess-of-loss basis. Our predominant exposure arises from third party liability claims and the related legal defense costs. | ||
| • | Surety.Our surety business relates to the reinsurance of risks associated with commercial and contract surety bonds issued to third parties to guarantee the performance of an obligation by the principal under the bond. Commercial bonds guarantee the performance of compliance obligations arising out of regulatory or statutory requirements. Contract bonds guarantee the performance of contractual obligations between two parties and include payment and performance bonds. The majority of our surety treaties are written on an excess-of-loss basis with an aggregate limit. | ||
| • | Trade Credit.Trade credit insurance is purchased by companies to ensure that invoices for goods and services provided to their customers are paid on time. Our trade credit coverages provide reinsurance for financial losses sustained through the failure of an insured’s customers to pay for goods or services supplied to them. We reinsure trade credit both on a proportional and an excess-of-loss basis. | ||
| • | Accident and Health.We provide accident and health reinsurance, most often covering employer self-insured or fully insured health plans, on a quota share and excess-of-loss basis. We also write reinsurance of student health insurance, sports disability, Medicare and Medicare supplement and other forms of accident and health insurance. |
Finite Risk
The Finite Risk operating segment includes principally structured reinsurance contracts with ceding companies whose needs may not be met efficiently through traditional reinsurance products. In exchange for contractual features that limit our downside risk, reinsurance contracts we classify as finite risk typically provide the potential for a significant profit commission to the ceding company. The classes of risks underwritten through finite risk contracts are generally consistent with the classes covered by traditional products. The finite risk contracts that we underwrite generally provide prospective protection, meaning coverage is provided for losses that are incurred after inception of the contract, as contrasted with retrospective coverage, which covers losses that are incurred prior to inception of the contract. The three main categories of our finite risk contracts are quota share, multi-year excess-of-loss and whole account aggregate stop loss:
| • | Finite quota share.Under finite quota share reinsurance contracts, the reinsurer agrees to indemnify a ceding company for a percentage of its losses up to an aggregate maximum or cap in return for a percentage of the ceding company’s premium, less a ceding commission. The expected benefit to the ceding company provided by finite quota share reinsurance is increased underwriting capacity of the ceding company and a sharing of premiums and losses with the |
- 10 -
Table of Contents
| reinsurer. These contracts often provide broad protection and may cover multiple classes of a ceding company’s business. Unlike traditional quota share reinsurance agreements, these contracts often provide for profit commissions which take into account investment income for purposes of calculating the reinsurer’s profit on business ceded. Additionally, finite quota share contracts are often written on a funds withheld basis, meaning the parties agree that funds that would normally be remitted to a reinsurer are withheld by the ceding company. |
| • | Multi-year excess-of-loss.These reinsurance contracts often complement ceding companies’ traditional excess-of-loss reinsurance programs. This type of contract often carries an up-front premium plus additional premiums which are dependent on the magnitude of losses claimed by the ceding company under the contract. The expected benefit to the ceding company on multi-year excess-of-loss reinsurance is that the ceding company has the ability to negotiate specific terms and conditions that remain applicable over multiple years of coverage. These contracts may cover multiple classes of a ceding company’s business and typically provide the benefit of reducing the impact of large or catastrophic losses on a ceding company’s underwriting results. In general, these contracts are designed so that the ceding company funds the expected level of loss activity over the multi-year period. The reinsurer incorporates a profit margin to cover its costs and the risk that losses are worse than expected. The payment of premiums based on the magnitude of losses claimed is intended to benefit the ceding company by linking its own loss experience to the actual cost of reinsurance over time. The multiple year term and premium structure of multi-year excess-of-loss reinsurance contracts are not typically found in traditional reinsurance contracts. | ||
| • | Whole account aggregate stop loss.Aggregate stop loss reinsurance contracts provide broad protection against a wide range of contingencies that are difficult to address with traditional reinsurance, including inadequate pricing by a ceding company or higher frequency of claims than the ceding company expected. The reinsurer on a whole account aggregate stop loss contract agrees to indemnify a ceding company for aggregate losses in excess of a deductible specified in the contract. These contracts can be offered on a single or multi-year basis, and may provide catastrophic and attritional loss protection. The benefit of whole account aggregate stop loss contracts to ceding companies is that such contracts provide the broadest possible protection of a ceding company’s underwriting results which is not generally available in the traditional reinsurance market. Unlike traditional reinsurance contracts, these contracts often contain sub-limits of coverage for losses on certain classes of business or exposures. These contracts are often written on a funds withheld basis. In addition, these contracts often include provisions for profit commissions which take into account investment income for purposes of calculating the reinsurer’s profit on business ceded. |
Marketing
We market our reinsurance products worldwide primarily through non-exclusive relationships with the leading reinsurance brokers. Based on in-force premiums written by us as of December 31, 2006, the five brokers from which we derived the largest portions of our business (with the approximate percentage of business derived from such brokers and their affiliates) are Marsh & McLennan Companies (30%), Aon Corporation (22%), Willis Group Holdings (16%), Benfield Blanch Inc. (14%), and Towers Perrin (4%). The loss of business relationships with any of these top five brokers could have a material adverse effect on our business.
In addition to their role as intermediaries in placing risk, brokers perform data collection, contract preparation and other administrative tasks. We believe that by relying largely on reinsurance brokers we
- 11 -
Table of Contents
are able to avoid the expense and regulatory complications of a worldwide network of offices, thereby minimizing fixed costs associated with marketing activities.
Underwriting and Risk Management
Our approach to underwriting and risk management emphasizes discipline and profitability rather than premium volume or market share. We seek to limit our overall exposure to risk by limiting the amount of reinsurance we write by geographic zone, by peril and by type of program or contract. Our risk management practices include the use of contract terms, diversification criteria, probability analysis and analysis of comparable historical loss experience. We estimate the impact of catastrophic events using catastrophe modeling software and reinsurance contract information to evaluate our exposure to losses from individual contracts and in the aggregate.
In connection with the review of any program proposal, we consider the quality of the ceding company, including the experience and reputation of its management, its capital and its risk management strategy. In addition, we seek to obtain information on the nature of the perils to be covered and, in the case of natural peril catastrophe exposures, aggregate information as to the location or locations of the risks covered under the reinsurance contract. We request information on the ceding company’s loss history for the perils proposed to be covered, together with relevant underwriting considerations, which would impact our exposures. If the program meets all these initial underwriting criteria, we then evaluate the proposal’s risk/reward profile to assess the adequacy of the proposed pricing and its potential impact on our overall return on capital.
Many of our reinsurance contracts do not contain an aggregate loss limit or a loss ratio limit, which means that there is no contractual limit to the number of claims that we may be required to pay pursuant to such reinsurance contracts. However, substantially all of our property reinsurance contracts with natural catastrophe exposure have occurrence limits that limit our exposure. In addition, substantially all of our high layer property, casualty and marine excess-of-loss contracts contain aggregate loss limits. Our actuaries and underwriters work together to establish appropriate pricing models for these purposes.
For catastrophe coverages exposed to natural perils, we measure our exposure to aggregate catastrophe claims using a catastrophe model that analyzes the effect of wind speed and earthquakes on the exposed property values within our portfolio. We seek to limit the amount of capital that we expect to lose from a severe catastrophic event; however, there can be no assurance that we will successfully limit actual losses from such a catastrophe event. We also monitor our exposures to man-made peril catastrophe exposed accumulating risks, including surety, umbrella liability, directors and officers liability, trade credit and terrorism reinsurance.
We use sophisticated modeling techniques to measure and estimate loss exposure under both simulated and actual loss scenarios and in comparing exposure portfolios to both single and multiple events. We take an active role in the evaluation of commercial catastrophe exposure models, which form the basis for our own proprietary pricing models. These computer-based loss modeling systems primarily utilize direct exposure information obtained from our clients and data compiled by A.M. Best Company, Inc. (“A.M. Best”), to assess each client’s potential for catastrophe losses. We believe that modeling is an important part of the underwriting process for catastrophe exposure pricing. Commercial catastrophe models were modified following the 2005 catastrophes by recalibrating loss assumptions with higher frequency and severity. Ceding companies may also use one or more of the various modeling consulting firms in their exposure management analysis. We also have access to the historical loss experience of the
- 12 -
Table of Contents
former reinsurance segment of The St. Paul Travelers Companies, Inc. (“St. Paul Re”) to assist us in pricing individual treaties and overall lines of business.
In 2002, we entered into a Services and Capacity Reservation Agreement with Renaissance Re effective October 1, 2002 (the “RenRe Agreement”) pursuant to which RenaissanceRe provides consulting services to us in connection with our property catastrophe book of business. No more than twice per year, at our request, RenaissanceRe analyzes our property catastrophe treaties and contracts and assists us in measuring risk and managing our aggregate catastrophe exposures. Also pursuant to the RenRe Agreement and at our request, RenaissanceRe will provide us with quotations for non-marine property catastrophe retrocessional coverage with aggregate limits up to $100 million annually, either on an excess-of-loss or proportional basis. These quotations, which are in RenaissanceRe’s sole discretion, reflect, among other things, an analysis of exposure, limit, retention, exclusions and other treaty terms. The annual fee that we pay to RenaissanceRe for this coverage commitment and the consulting services is the greater of: (i) $4 million, or (ii) 3.5% of our aggregate gross written non-marine non-finite property catastrophe premium (including reinstatements), adjusted annually 30 days after each anniversary. The fees under this agreement were $7,829,000, $6,538,000 and $6,395,000 for the years ended December 31, 2006, 2005 and 2004, respectively. The RenRe Agreement expires in September 2007.
Risk Diversification
In addition to the strategies described above to manage our risks, we seek to diversify our property catastrophe exposure across geographic zones around the world in order to obtain a favorable spread of risk. We attempt to limit our coverage for risks located in a particular zone to a predetermined level. Currently, our greatest property exposures are in states on the west coast, gulf coast and southeastern part of the United States, as well as in the Caribbean, Japan and northern Europe.
We maintain a database of our exposures in each geographic zone and estimate our probable maximum loss for each zone and for each peril (e.g., earthquakes and hurricanes) to which that zone is subject based on catastrophe models and underwriting assessments. We also use catastrophe modeling to review exposures from events that cross country borders such as wind events that may affect the Caribbean and Florida or the United Kingdom and continental Europe. Our largest exposures are in the United States for hurricane and earthquake, in Europe for flood and wind, and in Japan for earthquake and typhoons.
We seek to diversify our casualty exposure by writing casualty business throughout the United States and internationally. In addition, we seek to diversify our casualty exposure by writing casualty reinsurance across a broad range of product lines.
Retrocessional Reinsurance
We obtain retrocessional reinsurance to reduce liability on individual risks, protect against catastrophic losses and obtain additional underwriting capacity. The major types of retrocessional coverage that we purchase or may purchase include specific coverage for certain property and casualty exposures.
We may purchase other retrocessional coverage on a selective basis. Our decisions with respect to purchasing retrocessional coverage take into account both the potential coverage and market conditions such as pricing, terms, conditions and availability of such coverage, with the aim of securing cost-effective protection. We expect that the type and level of retrocessional coverage will vary over time, reflecting our view of the changing dynamics of both the underlying exposure and the reinsurance
- 13 -
Table of Contents
markets. There can be no assurance that retrocessional coverage will be available on terms we find acceptable.
We consider the financial strength of retrocessionaires when determining whether to purchase retrocessional coverage from them. Retrocessional coverage is generally obtained from companies rated “A-” or better by A.M. Best unless the retrocessionaire’s obligations are fully collateralized. For exposures where losses become known and are paid in a relatively short period of time, we may obtain retrocessional coverage from companies that may not be rated but that provide adequate collateral. The financial performance and rating status of all material retrocessionaires is routinely monitored. Retrocessional agreements do not relieve us from our obligations to the insurers and reinsurers from whom we assume business. Consequently, the failure of retrocessionaires to honor their obligations would result in losses to us.
Claims Administration
Our claims personnel administer claims arising from our reinsurance contracts, including validating and monitoring claims, posting case reserves and approving payment of claims. Authority for establishing reserves and payment of claims is based upon the level and experience of claims personnel.
Our claims personnel conduct periodic audits of specific claims and the overall claims procedures of our ceding companies at their offices. We rely on our ability to effectively monitor the claims handling and claims reserving practices of ceding companies in order to help establish the proper reinsurance premium for reinsurance agreements and to establish proper loss reserves. Moreover, prior to accepting certain risks, our underwriters will often request that our claims personnel conduct pre-underwriting claims audits of prospective ceding companies. Through these audits, we attempt to evaluate the ceding company’s claims-handling practices, fact-finding and investigation techniques, loss notification process, the historical adequacy of reserves, negotiation and settlement practices and adherence to claims-handling guidelines. Following these audits, our claims personnel provide feedback to the ceding company, including our assessment of the claims operation and recommendations, if any, regarding procedures, processing and personnel.
In November 2002, we entered into several agreements with subsidiaries of The St. Paul Travelers Companies, Inc., formerly The St. Paul Companies, Inc., (“St. Paul”) in order to transfer to us the liabilities, related assets and rights and risks under substantially all of the reinsurance contracts entered into by St. Paul’s subsidiaries on or after January 1, 2002. Among these agreements were quota share retrocession agreements under which we assumed unpaid losses and loss adjustment expenses (“LAE”), unearned premiums and certain other liabilities on reinsurance contracts becoming effective in 2002, subject to certain exclusions (the “Quota Share Retrocession Agreements”). Claims related to business assumed under the Quota Share Retrocession Agreements are managed by the claims department of St. Paul Re, subject to our supervision and oversight. We reimburse St. Paul for its costs of managing these claims. We may, at our discretion and expense, take over administration of any specific claims.
Unpaid Losses and Loss Adjustment Expenses
Unpaid losses and LAE represent our best estimates, at a given point in time, of our liabilities for payment of losses and LAE that we are liable to pay for reinsured claims for events that have occurred on or before the balance sheet date. Such estimates are not precise as they are based on predictions of future developments and estimates of future trends in claim severity and frequency and other trends. Consequently, it is possible that the ultimate liability for the final settlement and claim administration costs may materially differ from such estimates. Subsequent adjustments of unpaid losses and LAE are
- 14 -
Table of Contents
accounted for as changes in estimates and are reflected in our results of operations in the period in which they are made. We do not establish liabilities until the occurrence of an event that may give rise to a loss. These practices conform with and are required under applicable insurance laws and regulations and accounting principles generally accepted in the United States of America (“U.S. GAAP”).
Unpaid losses and LAE fall into two categories: (1) case basis estimates for reported losses and LAE, generally referred to as “case reserves” and (2) estimates of liabilities for losses and LAE incurred but not reported (“IBNR”).
Upon receipt of a notice of claim from a ceding company, we establish a case reserve for our portion of the estimated ultimate settlement. Case reserves are usually based upon the liability estimate and other information reported by the ceding company and our claims management may increase or reduce such estimate as they deem appropriate. During the claim settlement period, it often becomes necessary to refine and adjust the case basis estimates of liability, and thus the case reserves may be adjusted either upward or downward, based on periodic reviews of developments.
Estimates of IBNR are liabilities established to provide for losses for claims arising from occurrences or events that have given rise to a covered loss before any claims are reported. Significant periods of time can elapse between the occurrence of a reinsured claim and its reporting by the insured to the primary insurer and from the primary insurer to the reinsurer. We establish liabilities for IBNR based on historical loss experience (including the historical loss experience of St. Paul Re), current developments and likely trends.
Because estimation of unpaid losses and LAE is an inherently uncertain process, we believe that quantitative techniques are enhanced by professional and managerial judgment. The uncertainty inherent in loss estimation is particularly pronounced for casualty coverages, such as umbrella, general and product liability, professional liability and automobile liability, where information, such as required medical treatment and costs for bodily injury claims, emerges over time. In the overall reserve setting process, provisions for economic inflation and changes in the social and legal environment are considered. The uncertainty inherent in the reserving process for primary insurers becomes even greater for the reinsurer. This is because of, but not limited to, the time lag inherent in reporting information from the primary insurer to the reinsurer and differing reserving practices among ceding companies.
In the following section, we provide the estimates for net unpaid losses and LAE for the last three years and discuss changes in those estimates. We report changes in estimates for net unpaid losses and LAE in our consolidated statement of operations in the same year we make the change. The table below shows the changes in our loss and LAE reserves for 2006, 2005 and 2004 ($ in thousands):
- 15 -
Table of Contents
| 2006 | 2005 | 2004 | ||||||||||
| Net unpaid losses and LAE as of the beginning of the year | $ | 2,268,655 | 1,379,227 | $ | 731,918 | |||||||
| Net incurred related to: | ||||||||||||
| Current year | 811,250 | 1,577,944 | 1,101,820 | |||||||||
| Prior years | (50,648 | ) | (72,519 | ) | (82,016 | ) | ||||||
| Total net incurred losses and LAE | 760,602 | 1,505,425 | 1,019,804 | |||||||||
| Net paid losses and LAE: | ||||||||||||
| Current year | 96,112 | 210,306 | 174,870 | |||||||||
| Prior years | 624,477 | 390,598 | 205,889 | |||||||||
| Total net paid losses and LAE | 720,589 | 600,904 | 380,759 | |||||||||
| Effects of foreign currency exchange rate changes | 17,559 | (15,093 | ) | 8,264 | ||||||||
| Net unpaid losses and LAE as of the end of the year | 2,326,227 | 2,268,655 | 1,379,227 | |||||||||
| Reinsurance recoverable | 42,255 | 55,335 | 1,728 | |||||||||
| Gross unpaid losses and LAE at end of the year | $ | 2,368,482 | 2,323,990 | $ | 1,380,955 | |||||||
The net favorable loss development in 2006, 2005 and 2004 related to prior years includes $60,746,000, $97,314,000 and $57,151,000, respectively, of net favorable loss development primarily from property and certain other lines of business with relatively short patterns of reported losses. The net favorable loss development in 2006, 2005 and 2004 related to prior years also include increases in incurred losses and LAE associated with changes in estimates of premiums and the patterns of their earnings. The net increases (decreases) of losses and LAE related to prior accident years arising from changes in premium estimates were $10,098,000, $24,795,000, and ($24,865,000), in 2006, 2005 and 2004, respectively. The net effect of changes in premium estimates, after considering corresponding changes in related losses, LAE and acquisition expenses, was not significant.
The lines producing favorable loss development are primarily property coverages in both the Property and Marine and Finite Risk segments as well as certain casualty classes with short loss development periods. During 2006, 2005 and 2004, actual reported losses were significantly less than expected for these short-tailed property and casualty lines resulting in reductions in estimated ultimate losses.
The following table shows the development of liability for net unpaid losses and LAE from December 31, 2002 through December 31, 2006. The re-estimated liabilities reflect additional information regarding claims incurred prior to the end of each year. A redundancy or deficiency will result from changes in estimates of liabilities recorded at the end of the prior year. The cumulative redundancy reflects the cumulative differences between the original estimate and the currently re-estimated liability. Changes in the estimates are reflected in the consolidated statement of operations of the year that the liabilities are revalued. Unpaid losses and LAE denominated in foreign currencies are restated at the foreign exchange rates in effect as of December 31, 2006 and the resulting cumulative foreign exchange effect is shown as an adjustment to the cumulative redundancy. Each amount in the tables includes the effects of all changes in amounts for the prior year. The table does not present accident year or underwriting year development data nor does it include any corresponding adjustments that may accompany loss redundancies or deficiencies such as premium or commission adjustments. Conditions and trends that have affected the development of liabilities in the past may not necessarily
- 16 -
Table of Contents
exist in the future. Therefore, it would not be appropriate to extrapolate future deficiencies or redundancies based on the following table ($ in thousands):
| 2002 | 2003 | 2004 | 2005 | 2006 | ||||||||||||||||
| Net unpaid losses and LAE at end of year | $ | 281,659 | 731,918 | 1,379,227 | 2,268,655 | $ | 2,326,227 | |||||||||||||
| Net unpaid losses and LAE re-estimated as of: | ||||||||||||||||||||
| One year later | 224,693 | 649,902 | 1,306,708 | 2,215,635 | ||||||||||||||||
| Two years later | 194,422 | 604,891 | 1,277,627 | |||||||||||||||||
| Three years later | 176,884 | 603,293 | ||||||||||||||||||
| Four years later | 175,683 | |||||||||||||||||||
| Net cumulative redundancy | 105,976 | 128,625 | 101,600 | 53,020 | ||||||||||||||||
| Adjustment for foreign currency exchange | 13,736 | 5,620 | (9,782 | ) | 3,984 | |||||||||||||||
| Cumulative redundancy excluding foreign currency exchange | 119,712 | 134,245 | 91,818 | 57,004 | ||||||||||||||||
| Net cumulative paid losses and LAE as of: | ||||||||||||||||||||
| One year later | 41,709 | 205,889 | 388,700 | 624,006 | ||||||||||||||||
| Two years later | 62,604 | 265,376 | 536,351 | |||||||||||||||||
| Three years later | 73,908 | 320,399 | ||||||||||||||||||
| Four years later | 90,982 | |||||||||||||||||||
| Gross liability-end of year | 281,659 | 736,934 | 1,380,955 | 2,323,990 | 2,368,482 | |||||||||||||||
| Reinsurance recoverable | — | 5,016 | 1,728 | 55,335 | 42,255 | |||||||||||||||
| Net liability-end of year | 281,659 | 731,918 | 1,379,227 | 2,268,655 | 2,326,227 | |||||||||||||||
| Gross liability-re-estimated | 175,683 | 608,404 | 1,279,319 | 2,269,819 | ||||||||||||||||
| Gross cumulative redundancy | $ | 105,976 | 128,530 | 101,636 | 54,171 | |||||||||||||||
Investments
Reinsurance company investments must comply with applicable laws and regulations, which prescribe the kind, quality and concentration of investments. In general, these laws and regulations permit investments in federal, state and municipal obligations, corporate bonds, mortgage and asset backed securities, preferred and common equity securities, sovereign and supranational securities, mortgage loans, real estate and some other investments within specified limits and subject to some qualifications. In May 2005, we entered into investment management agreements with BlackRock Financial Management, Inc. (“BlackRock”) and Hyperion Capital Management, Inc. (“Hyperion”). BlackRock and Hyperion together are the “Investment Advisors” and serve as investment managers for certain of our invested assets.
General Investment Guidelines
We have developed investment guidelines for the management of our investment portfolio by the Investment Advisors. Although these guidelines stress diversification of risk, preservation of capital and market liquidity, investments are subject to market risks and fluctuations, as well as risks inherent in particular securities. Interest rates and levels of inflation also affect investment returns. The primary objective of the portfolio, set forth in the guidelines, is to maximize investment returns consistent with appropriate safety, diversification, tax and regulatory considerations and to provide sufficient liquidity to enable us to meet our obligations on a timely basis.
- 17 -
Table of Contents
Our investment strategy takes into consideration the risks inherent in our business as well as investment risks. For this reason, our investment policy is conservative with a strong emphasis on diversified, high quality, predominantly publicly traded fixed maturity securities. Consistent with this policy, the target duration of our portfolio considers the estimated duration of our reinsurance liabilities and other contractual liabilities. When determining asset allocation and duration, we evaluate the expected return over a risk free rate that the market offers for accepting investment risk.
Within our fixed maturity portfolio we invest only in investment grade securities. We typically do not invest in real estate or common equity securities. We may, from time to time make investments of a strategic or opportunistic nature. Our investment guidelines generally contain restrictions on the portion of the portfolio that may be invested in the securities of any single issue or issuer, with the exception of U.S. government securities. Our Investment Advisors may be instructed to invest some of the investment portfolio in currencies other than U.S. dollars based upon our underwriting exposures, including premiums and unpaid losses and LAE denominated in foreign currencies or regulatory requirements. Our investment guidelines provide that financial futures and options and foreign exchange contracts may not be used in a speculative manner but may be used only as part of a defensive hedging strategy.
From time to time, we expect to reevaluate our investment guidelines to reflect any changes in our assumptions about liability duration, market conditions, prevailing interest rates and other factors discussed above. Any change in our guidelines will be subject to the ongoing oversight and approval of the board of directors.
Classification and Valuation
We classify our investments as available-for-sale, trading or other invested asset. Our available-for-sale and trading portfolios are primarily composed of diversified, high quality, predominantly publicly traded fixed maturity securities. Other invested asset currently represents an equity investment in Inter-Ocean Holdings Ltd., a non-public reinsurance company.
Our investments are carried at their estimated fair value. We determine the fair value based on quoted market prices, as reported by reputable market data providers. If quoted market prices are not available, fair values are estimated either based on values of securities of like grade, yield and duration or obtained from independent pricing services or based on cash flow estimates. We routinely review our available-for-sale investments to determine whether unrealized losses represent temporary changes in fair value or are the result of “other-than-temporary impairments”. The process of determining whether a security is other than temporarily impaired is subjective and involves analyzing many factors. These factors include, but are not limited to, the duration and magnitude of an unrealized loss, specific issuer/security credit events, the overall financial condition of the issuer, and our ability and intent to hold a security for a sufficient period of time to recover the unrealized loss. This is based on our expectation that future positive cash flows from operations will generate sufficient liquidity in order to meet our obligations. However, there is no assurance that we will not sell investments at a loss. If we determine that an unrealized loss on a security is other than temporary, we write down the carrying value of the security and record a realized loss in our consolidated statement of operations.
- 18 -
Table of Contents
The following table shows, in the aggregate, the fair value of our portfolio of invested assets (except for other invested asset) as of December 31, 2006 ($ in thousands):
| U.S. Government | $ | 153,794 | ||
| Corporate bonds | 1,527,211 | |||
| Mortgage-backed and asset-backed securities | 1,328,967 | |||
| Municipal bonds | 197,598 | |||
| Foreign governments and states | 127,075 | |||
| Subtotal — fixed maturity securities | 3,334,645 | |||
| Preferred stocks | 10,772 | |||
| Short-term investments | 27,123 | |||
| Total | $ | 3,372,540 | ||
During 2006, based on a definitive agreement to sell our interest in Inter-Ocean Holdings, Ltd., we wrote down the carrying value of this other investment and recorded a realized loss of $255,000. During 2005 as a result of a routine evaluation of investments, we wrote down the carrying value of the investment in Inter-Ocean Holdings, Ltd. to its estimated net realizable value and recorded a realized loss of $1,769,000. We had no ceded or assumed reinsurance business with Inter-Ocean Holdings, Ltd. Other than these adjustments, we do not believe that our investment portfolio at December 31, 2006 contains any securities with an unrealized loss that is other-than-temporary.
Quality
Our current investment guidelines call for our invested asset portfolio to have an average rating of at least A2 as measured by Moody’s Investors Service (“Moody’s”). As of December 31, 2006, our fixed maturity portfolio had a dollar weighted average rating of Aa2.
The following table summarizes the composition of the fair value of our fixed maturity and preferred stock portfolio as of December 31, 2006 by rating as assigned by Moody’s ($ in thousands):
| Fair Value | % of Total | |||||||
| Aaa | $ | 2,068,357 | 61.8 | % | ||||
| Aa | 512,978 | 15.3 | % | |||||
| A | 670,974 | 20.1 | % | |||||
| Baa | 93,108 | 2.8 | % | |||||
| Total | $ | 3,345,417 | 100.0 | % | ||||
Duration and maturity
As of December 31, 2006, our fixed maturity portfolio had a weighted average duration of 2.7 years. The following table summarizes the fair value of our available-for-sale fixed maturity portfolio by contractual maturities as of December 31, 2006; actual maturities may differ from contractual maturities because borrowers may have the right to call or prepay obligations ($ in thousands):
- 19 -
Table of Contents
| Amortized | ||||||||
| Cost | Fair Value | |||||||
| Due in one year or less | $ | 400,723 | $ | 397,408 | ||||
| Due from one to five years | 1,065,670 | 1,051,975 | ||||||
| Due from five to ten years | 258,003 | 249,685 | ||||||
| Due in ten or more years | 202,988 | 198,319 | ||||||
| Mortgage and asset backed securities | 1,349,586 | 1,328,967 | ||||||
| Total | $ | 3,276,970 | $ | 3,226,354 | ||||
Competition
The property and casualty reinsurance industry is highly competitive. We compete based upon security, service and price with reinsurers worldwide, some of which have greater financial, marketing and management resources than ours. Some of our competitors are large financial institutions that have reinsurance operations, while others are specialty reinsurance companies. Financial institutions have also created alternative capital market products that compete with reinsurance products, such as reinsurance securitization. Our principal competitors vary by type of business. Bermuda-based reinsurers are significant competitors on property catastrophe business. Lloyd’s of London syndicates are significant competitors on marine business. On international business, the large European reinsurers are significant competitors. Large U.S. direct reinsurers, as well as lead U.S.-based broker market reinsurers, are significant competitors on U.S. casualty business.
Traditional as well as new capital market participants from time to time produce alternative products (such as reinsurance securitizations, catastrophe bonds and various derivative instruments) that may compete with certain types of reinsurance, such as property catastrophe. Over time, these initiatives could significantly affect supply, pricing and competition in our industry and partially displace traditional reinsurance products we offer.
Ratings and Collateral
A.M. Best is generally considered to be a significant rating agency for the evaluation of insurance and reinsurance companies. A.M. Best’s ratings are based on a quantitative evaluation of performance with respect to profitability, capital adequacy and liquidity and a qualitative evaluation of risk management, competitive position, investments, unpaid losses and company management.
A.M. Best has assigned a financial strength rating of “A” (Excellent) with a stable outlook to our operating subsidiaries. This rating is the third highest of sixteen rating levels. According to A.M. Best, a rating of “A” indicates A.M. Best’s opinion that a company has an excellent ability to meet its ongoing obligations to policyholders. This rating is subject to periodic review by A.M. Best and may be revised downward or revoked at the sole discretion of A.M. Best. A.M. Best may increase its scrutiny of rated companies, revise their rating standards or take other action. If A.M. Best revises the rating standard associated with our current rating, our rating may be downgraded or we may need to raise additional capital to maintain our rating.
Financial strength ratings are used by ceding companies and reinsurance intermediaries as an important means of assessing the financial strength and quality of reinsurers. In addition, a ceding company’s own rating may be adversely affected by a downgrade in the rating of its reinsurer. Therefore, a downgrade of our financial strength rating may dissuade a ceding company from reinsuring with us and may influence a ceding company to reinsure with a competitor of ours that has a higher rating.
- 20 -
Table of Contents
Furthermore, it is increasingly common for our reinsurance contracts to contain terms that would allow the ceding companies to cancel the contract or require us to collateralize all or part of our obligations if our financial strength rating were downgraded below a certain rating level. Whether a client would exercise a cancellation right would depend, among other factors, on the reason for such downgrade, the extent of the downgrade, the prevailing market conditions and the pricing and availability of replacement reinsurance coverage. Therefore, we cannot predict the extent to which a cancellation right would be exercised, if at all, or what effect any such cancellations would have on our financial condition or future operations, but such effect potentially could be material.
We may from time to time collateralize our obligations under our various reinsurance contracts by delivering letters of credit to the ceding company, depositing assets into trust for the benefit of the ceding company or permitting the ceding company to withhold funds that would otherwise be delivered to us under the reinsurance contract. We have entered into reinsurance contracts with several ceding companies that may require us to provide varying levels of collateral for our obligations to these ceding companies. These amounts may vary depending on our rating from A.M. Best or other rating agencies or a downgrade in such ratings. The amount of collateral we are required to provide typically represents a portion of the obligations we may owe the ceding company, often including estimates of IBNR made by the ceding company. Since we may be required to provide collateral based on the ceding company’s estimate, we may be obligated to provide collateral that exceeds our estimates of the ultimate liability to the ceding company.
In addition to our financial strength rating, A.M. Best has assigned issuer credit ratings of “bbb” to the debt obligations of Platinum Holdings and Platinum Finance. A.M. Best has also assigned indicative ratings to our unallocated universal shelf registration statement of “bbb” for senior unsecured debt, “bbb-” on subordinated debt and “bb+” on preferred stock.
Standard & Poor’s Ratings Services, a Division of the McGraw-Hill Companies, Inc. (“Standard & Poor’s”), has assigned issuer credit ratings of “BBB” to the debt obligations of Platinum Finance. They have also assigned indicative ratings to our unallocated universal shelf registration statement of “BBB” for senior unsecured debt, “BBB-” on subordinated debt and “BB+” on preferred stock.
Employees
As of December 31, 2006, we employed 160 people. None of our employees are subject to collective bargaining agreements and we are not aware of any efforts to implement such agreements.
Under Bermuda law, non-Bermudians (other than spouses of Bermudians) may not engage in any gainful occupation in Bermuda without the specific permission of the appropriate governmental authority. None of our executive officers is a Bermudian, and all such officers are working in Bermuda under work permits. The Bermuda government announced a policy that places a six-year term limit on individuals with work permits, subject to certain exceptions for key employees.
Certain of our Bermuda based employees, including the Chief Executive Officer, Chief Financial Officer and General Counsel of Platinum Holdings and other officers of Platinum Holdings and Platinum Bermuda, are employed pursuant to work permits granted by Bermuda authorities. These permits expire at various times during the next several years. We have no reason to believe that these permits would not be extended at expiration upon request, although no assurance can be given in this regard.
- 21 -
Table of Contents
Regulation
General
The business of reinsurance is regulated in most countries, although the degree and type of regulation varies significantly from one jurisdiction to another. Reinsurers are generally subject to less direct regulation than primary insurers. Platinum Bermuda is registered with and regulated by the Bermuda Monetary Authority (the “Authority”). In the United States and in the United Kingdom, licensed reinsurers must comply with financial supervision standards comparable to those governing primary insurers. Accordingly, Platinum US and Platinum UK are subject to extensive regulation under applicable statutes. In the United States, those statutes delegate regulatory, supervisory and administrative powers to state insurance commissioners.
Bermuda Regulation
Platinum Holdings and Platinum Bermuda are incorporated in Bermuda. As a holding company, Platinum Holdings is not subject to Bermuda insurance regulations.
The Insurance Act 1978 of Bermuda and related regulations, as amended (the “Insurance Act”), which regulates the insurance business of Platinum Bermuda, provides that no person may carry on any insurance business in or from within Bermuda unless registered as an insurer under the Insurance Act by the Authority, which is responsible for the day-to-day supervision of insurers. Under the Insurance Act, insurance business includes reinsurance business.
An insurer’s registration may be canceled by the Authority on certain grounds specified in the Insurance Act, including failure of the insurer to comply with its obligations under the Insurance Act or if, in the opinion of the Authority, the insurer has not been carrying on business in accordance with sound insurance principles. The Insurance Act also imposes solvency and liquidity standards and auditing and reporting requirements on Bermuda insurance companies and grants to the Authority powers to supervise, investigate and intervene in the affairs of insurance companies. Certain significant aspects of the Bermuda insurance regulatory framework are set forth below.
The Insurance Act distinguishes between long-term business and general business. Long-term business consists of life, annuity, accident and disability contracts in effect for not less than five years and certain other types of contracts. General business is any insurance business that is not long-term business. Bermuda introduced a multi-license system of regulation in 1995 that categorized non-life insurance company operations into four classes depending upon the nature of the risks underwritten and relationship of such risks to the owners of the insurer or reinsurer. A company can be registered as a Class 4 insurer when it intends to write non-affiliated business and when: (a) it has at the time of its application for registration, or will have before it carries on insurance business, a total statutory capital and surplus of not less than $100,000,000; and (b) it intends to carry on insurance business including excess liability business or property catastrophe reinsurance business. Platinum Bermuda is registered as both a Class 4 and long-term insurer and is regulated as such under the Insurance Act.
Principal Representative.Platinum Bermuda is required to maintain a principal office in Bermuda and to appoint and maintain a principal representative in Bermuda. For the purpose of the Insurance Act, the principal office of Platinum Bermuda is at our principal executive offices in Bermuda, and Platinum Bermuda’s principal representative is Allan C. Decleir, the Chief Financial Officer of Platinum Bermuda. Without a reason acceptable to the Authority, an insurer may not terminate the appointment of its principal representative, and the principal representative may not cease to act as such,
- 22 -
Table of Contents
unless 30 days’ notice in writing is given to the Authority of the intention to do so. It is the duty of the principal representative, upon reaching the view that there is a likelihood of the insurer for which the principal representative acts becoming insolvent or that a reportable “event” has, to the principal representative’s knowledge, occurred or is believed to have occurred, to immediately notify the Authority and to make a report in writing to the Authority within 14 days setting out all the particulars of the case that are available to the principal representative. Examples of such a reportable “event” include failure by the insurer to comply substantially with a condition imposed upon the insurer by the Authority relating to a solvency margin or liquidity or other ratio.
Independent Approved Auditor.Platinum Bermuda must appoint an independent auditor who will annually audit and report on the statutory financial statements and the statutory financial return of the insurer, both of which, are required to be filed annually with the Authority. The independent auditor of Platinum Bermuda must be approved by the Authority and may be the same person or firm that audits Platinum Bermuda’s financial statements and reports for presentation to its shareholders. No person having an interest in Platinum Bermuda otherwise than as an insured, and no officer, servant or agent of Platinum Bermuda, shall be eligible for appointment as an approved auditor for Platinum Bermuda and any person appointed as an approved auditor to Platinum Bermuda who subsequently acquires such interest or becomes an officer, servant or agent of that insurer shall cease to be an approved auditor. Platinum Bermuda’s independent auditor is KPMG Bermuda.
Loss Reserve Specialist.Platinum Bermuda is required to submit an opinion of its approved loss reserve specialist with its statutory financial return in respect of its loss and LAE provisions. The loss reserve specialist, who will normally be a qualified casualty actuary, must be approved by the Authority. Platinum Bermuda’s loss reserve specialist is Neal J. Schmidt, our Chief Actuary. Mr. Schmidt is a Fellow of the Casualty Actuarial Society and a Member of the American Academy of Actuaries.
Approved Actuary.Platinum Bermuda is required to submit an annual actuary’s certificate when filing its statutory financial return. The actuary’s certificate shall state whether or not (in the opinion of the insurer’s approved actuary) the aggregate amount of the liabilities of the insurer in relation to long-term business at the end of the relevant year, exceeds the aggregate amount of those liabilities as shown in the insurer’s statutory balance sheet. The actuary must be approved by the Authority and will normally be a qualified life actuary. Platinum Bermuda’s approved actuary is William Hines. Mr. Hines is a Fellow of the Society of Actuaries and a Member of the American Academy of Actuaries.
Statutory Financial Statements.Platinum Bermuda, as a general business insurer, will be required to submit its annual statutory financial statements as part of its annual statutory financial return. The Insurance Act prescribes rules for the preparation and substance of such statutory financial statements (which include, in statutory form, a balance sheet, an income statement, a statement of capital and surplus and notes thereto). The statutory financial statements are not prepared in accordance with U.S. GAAP and are distinct from the financial statements prepared for presentation to the insurer’s shareholders under the Bermuda Companies Act 1981 (the “Companies Act”).
Annual Statutory Financial Return.Platinum Bermuda is required to file with the Authority a statutory financial return no later than four months after its financial year-end (unless specifically extended). The statutory financial return for an insurer registered as a Class 4 general business and long-term insurer includes, among other matters, a report of the approved independent auditor on the statutory financial statements of such insurer, a general business solvency certificate, a long-term business solvency certificate, the statutory financial statements themselves, the opinion of the loss reserve specialist, an actuary’s certificate and a schedule of reinsurance ceded. The solvency certificates must be signed by the principal representative and at least two directors of the insurer who are required to certify,
- 23 -
Table of Contents
among other matters, whether the minimum solvency margin has been met and whether the insurer complied with the conditions attached to its certificate of registration. The independent approved auditor is required to state whether in its opinion it was reasonable for the directors to so certify.
Minimum Solvency Margin and Restrictions on Dividends and Distributions.Under the Insurance Act, the value of long-term business assets of a Class 4 insurer must exceed the amount of its long-term liabilities by at least $250,000. The Insurance Act also provides that the general business assets of a Class 4 insurer, such as Platinum Bermuda, must exceed the amount of an insurer’s general business liabilities by an amount greater than the prescribed minimum solvency margin. Platinum Bermuda:
| (1) | is required, with respect to its general business, to maintain a minimum solvency margin equal to the greatest of: |
| (A) | $100,000,000; | ||
| (B) | 50% of net premiums written (being gross premiums written less any premiums ceded by Platinum Bermuda, but Platinum Bermuda may not deduct more than 25% of gross premiums when computing net premiums written); and | ||
| (C) | 15% of loss and other insurance reserves; |
| (2) | is prohibited from declaring or paying any dividends during any financial year if it is in breach of its minimum solvency margin or minimum liquidity ratio or if the declaration or payment of such dividends would cause it to fail to meet such margin or ratio (and if it has failed to meet its minimum solvency margin or minimum liquidity ratio on the last day of any financial year, Platinum Bermuda is prohibited, without the approval of the Authority, from declaring or paying any dividends during the next financial year); | ||
| (3) | is prohibited from declaring or paying in any financial year dividends of more than 25% of its total statutory capital and surplus (as shown on its previous financial year’s statutory balance sheet) unless it files with the Authority (at least seven days before payment of such dividends) an affidavit stating that it will continue to meet the required margins; | ||
| (4) | is prohibited, without the approval of the Authority, from reducing by 15% or more its total statutory capital as set out in its previous year’s financial statements, and any application for such approval must include an affidavit stating that it will continue to meet the required margins; and | ||
| (5) | is required, at any time it fails to meet its solvency margin, within 30 days (45 days where total statutory capital and surplus falls to $75 million or less) after becoming aware of that failure or having reason to believe that such failure has occurred, to file with the Authority a written report containing certain information. |
Additionally, under the Companies Act, Platinum Holdings and Platinum Bermuda may not declare or pay a dividend if Platinum Holdings or Platinum Bermuda, as the case may be, has reasonable grounds for believing that it is, or after the payment would be, unable to pay its liabilities as they become due, or that the realizable value of its assets would thereby be less than the aggregate of its liabilities and its issued share capital and share premium accounts.
Minimum Liquidity Ratio.The Insurance Act provides a minimum liquidity ratio for general business insurers. An insurer engaged in general business is required to maintain the value of its relevant assets at not less than 75% of the amount of its relevant liabilities. Relevant assets include cash and time deposits, quoted investments, unquoted bonds and debentures, first liens on real estate, investment income due and accrued, accounts and premiums receivable and reinsurance balances receivable. There are
- 24 -
Table of Contents
certain categories of assets which, unless specifically permitted by the Authority, do not automatically qualify as relevant assets, such as unquoted equity securities, investments in and advances to affiliates and real estate and collateral loans. The relevant liabilities are total general business insurance reserves and total other liabilities less deferred income tax and sundry liabilities (by interpretation, those not specifically defined).
Long-term Business Fund.An insurer carrying on long-term business is required to keep its accounts in respect of its long-term business separate from any accounts kept in respect of any other business. All receipts of its long-term business form part of its long-term business fund. No payment may be made directly or indirectly from an insurer’s long-term business fund for any purpose other than a purpose related to the insurer’s long-term business, unless such payment can be made out of any surplus (certified by the insurer’s approved actuary) to be available for distribution otherwise than to policyholders. Platinum Bermuda may not declare or pay a dividend to any person other than a policyholder unless the value of the assets in its long-term business fund (as certified by its approved actuary) exceeds the liabilities of the insurer’s long-term business (as certified by the insurer’s approved actuary) by the amount of the dividend and at least the $250,000 minimum solvency margin prescribed by the Insurance Act, and the amount of any such dividend may not exceed the aggregate of that excess (excluding the said $250,000) and any other funds properly available for payment of dividends, such as funds arising out of business of the insurer other than long-term business.
Restrictions on Transfer of Business and Winding-Up. As a long-term insurer, Platinum Bermuda is subject to the following provisions of the Insurance Act:
| (1) | all or any part of the long-term business, other than long-term business that is reinsurance business, may be transferred only with and in accordance with the sanction of the applicable Bermuda court; and | ||
| (2) | an insurer or reinsurer carrying on long-term business may only be wound-up or liquidated by order of the applicable Bermuda court, and this may increase the length of time and costs incurred in the winding-up of Platinum Bermuda when compared with a voluntary winding-up or liquidation. |
Supervision and Intervention.If it appears to the Authority that there is a risk of the insurer becoming insolvent, or that it is in breach of the Insurance Act or any conditions imposed upon its registration, the Authority may, among other things, direct the insurer (i) not to take on any new insurance business, (ii) not to vary any insurance contract if the effect would be to increase the insurer’s liabilities, (iii) not to make certain investments, (iv) to realize certain investments, (v) to maintain in, or transfer to the custody of, a specified bank, certain assets, (vi) not to declare or pay any dividends or other distributions or to restrict the making of such payments, and/or (vii) to limit its premium income.
Although Platinum Bermuda is incorporated in Bermuda, it is classified as a non-resident of Bermuda for exchange control purposes by the Authority. Pursuant to its non-resident status, Platinum Bermuda may hold any currency other than Bermuda dollars and convert that currency into any other currency (other than Bermuda dollars) without restriction. Platinum Bermuda is permitted to hold Bermuda dollars to the extent necessary to pay its expenses in Bermuda.
As “exempted” companies, Platinum Holdings and Platinum Bermuda may not, without the express authorization of the Bermuda legislature or under a license granted by the Minister of Finance, participate in certain business transactions. Platinum Bermuda is a licensed reinsurer in Bermuda and so may carry on activities in Bermuda that are related to and in support of its reinsurance business.
- 25 -
Table of Contents
The Bermuda government actively encourages foreign investment in “exempted” entities like Platinum Holdings that are based in Bermuda, but do not operate in competition with local businesses. As well as having no restrictions on the degree of foreign ownership, Platinum Holdings and Platinum Bermuda are not currently subject to taxes on income or dividends or to any foreign exchange controls in Bermuda. In addition, currently there is no capital gains tax in Bermuda.
As part of its ongoing review of Bermuda’s insurance supervisory framework, the Authority is currently consulting with the Class 4 insurance sector regarding further enhancement of the capital adequacy framework. The current proposal includes a risk-based capital adequacy model and will enhance the Authority’s ability to assess an insurer’s solvency position. The Authority is still evaluating the proposed new model, including the means by which it will be incorporated within the regulatory framework. The expectation is that the first phase of implementation will apply only to Class 4 insurers and will be effective for the 2007 year-end. We do not expect the new enhancements to the capital adequacy framework for Bermuda insurers will result in any regulatory actions by the Authority with respect to Platinum Bermuda. We are uncertain what effect, if any, the enhancement of the capital adequacy framework will have on the amount of dividends that Platinum Bermuda is able to pay without regulatory approval.
U.S. Regulation
Platinum US is organized and domiciled in the State of Maryland, is licensed in Maryland as a property and casualty insurer, and is licensed, authorized or accredited to write reinsurance in all 50 states of the United States and the District of Columbia. Although Platinum US is regulated by state insurance departments and applicable state insurance laws in each state where it is licensed, authorized or accredited, the principal insurance regulatory authority of Platinum US is the Maryland Insurance Administration.
U.S. Insurance Holding Company Regulation of Platinum Holdings, Platinum Regency and Platinum Finance.Platinum Holdings and Platinum Regency as the indirect parent companies of Platinum US, and Platinum Finance as the direct parent company of Platinum US, are subject to the insurance holding company laws of Maryland. These laws generally require an authorized insurer that is a member of a holding company system to register with the Maryland Insurance Administration and to furnish annually financial and other information about the operations of companies within the holding company system. Generally, all transactions between Platinum US and another company in the holding company system, including sales, loans, reinsurance agreements, service agreements and dividend payments, must be fair and, if material or of a specified category, require prior notice and approval or non-disapproval by the Maryland Insurance Commissioner (the “Commissioner”).
The insurance laws of Maryland prohibit any person from acquiring control of Platinum Holdings, Platinum Regency, Platinum Finance or Platinum US unless that person has filed a notification with specified information with the Commissioner and has obtained the Commissioner’s prior approval. Under the Maryland statutes, acquiring 10% or more of the voting stock of an insurance company or its parent company is presumptively considered a change of control, although such presumption may be rebutted. Accordingly, any person or entity that acquires, directly or indirectly, 10% or more of the voting securities of Platinum Holdings without the prior approval of the Commissioner will be in violation of these laws and may be subject to injunctive action requiring the disposition or seizure of those securities by the Commissioner or prohibiting the voting of those securities, or to other actions that may be taken by the Commissioner. In addition, many U.S. state insurance laws require prior notification to state insurance departments of a change in control of a non-domiciliary insurance company doing business in that state. While these pre-notification statutes do not authorize the state insurance
- 26 -
Table of Contents
departments to disapprove the change in control, they authorize regulatory action in the affected state if particular conditions exist, such as undue market concentration. In addition, any transactions that would constitute a change in control of Platinum Holdings, Platinum Regency or Platinum Finance may require prior notification in those states that have adopted pre-acquisition notification laws.
These laws may discourage potential acquisition proposals and may delay, deter or prevent a change of control of Platinum Holdings, including through transactions, and in particular unsolicited transactions, that some or all of the shareholders of Platinum Holdings might consider to be desirable.
U.S. Insurance Regulation of Platinum US.The rates, form, terms and conditions of our reinsurance agreements generally are not subject to regulation by any state insurance department. This contrasts with primary insurance where the policy forms and premium rates are generally closely regulated by state insurance departments. As a practical matter, however, the rates charged by primary insurers can have an effect on the rates that are charged by reinsurers.
State insurance authorities have broad administrative powers with respect to various aspects of the reinsurance business, including licensing to transact business, admittance of assets to statutory surplus, regulating unfair trade and claims practices, establishing reserve requirements and solvency standards, and regulating investments and dividends. State insurance laws and regulations require Platinum US to file statutory basis financial statements with insurance departments in each state where it is licensed, authorized or accredited to do business. The operations of Platinum US are subject to examination by those insurance departments at any time. Platinum US prepares statutory basis financial statements in accordance with accounting practices and procedures prescribed or permitted by these insurance departments. State insurance departments conduct periodic examinations of the books and records of insurance companies domiciled in their states as well as perform market conduct examinations of insurance companies doing business in their states. State insurance departments generally conduct their various examinations at least once every three to five years. Examinations are generally carried out in cooperation with the insurance departments of other states under guidelines promulgated by the National Association of Insurance Commissioners (“NAIC”). The Maryland Insurance Administration has conducted an examination of the statutory basis financial statements of Platinum US as of December 31, 2003. There were no adjustments in the examination report to the statutory basis income or equity of Platinum US.
Under Maryland insurance law, Platinum US must give ten days’ prior notice to the Commissioner of its intention to pay any dividend or make any distribution other than an extraordinary dividend or extraordinary distribution. The Commissioner has the right to prevent payment of such a dividend or such a distribution if the Commissioner determines, in the Commissioner’s discretion, that after the payment thereof, the policyholders’ surplus of Platinum US would be inadequate or could cause Platinum US to be in a hazardous financial condition. Platinum US must give at least 30 days prior notice to the Commissioner before paying an extraordinary dividend or making an extraordinary distribution out of earned surplus. Extraordinary dividends and extraordinary distributions are dividends or distributions which, together with any other dividends and distributions paid during the immediately preceding twelve-month period, would exceed the lesser of:
| (1) | 10% of statutory policyholders’ surplus (as determined under statutory accounting principles) as of December 31 of the prior year; or | ||
| (2) | net investment income excluding realized capital gains (as determined under statutory accounting principles) for the twelve-month period ending on December 31 of the prior year and pro rata distribution of any class of securities of Platinum US, plus any amounts of net |
- 27 -
Table of Contents
| investment income (excluding realized capital gains) in the three calendar years prior to the preceding year which have not been distributed. |
The NAIC uses a risk-based capital (“RBC”) model to monitor and regulate the solvency of life, health, and property and casualty insurance and reinsurance companies. The Maryland Insurance Administration has adopted the NAIC’s model law. The RBC calculation is used to measure an insurer’s capital adequacy with respect to: the risk characteristics of the insurer’s premiums written and loss and LAE reserves, rate of growth and quality of assets, among other measures. Depending on the results of the RBC calculation, insurers may be subject to varying degrees of regulatory action depending upon the level of their capital inadequacy. The statutory capital of Platinum US is above the level that would require any regulatory or corrective action or reporting.
The ability of a primary insurer to take credit for the reinsurance purchased from reinsurance companies is a significant component of reinsurance regulation. Typically, a primary insurer will only enter into a reinsurance agreement if it can obtain credit to its reserves on its statutory basis financial statements for the reinsurance ceded to the reinsurer. With respect to U.S. domiciled reinsurers that reinsure U.S. insurers, credit is usually granted when the reinsurer is licensed or accredited in a state where the primary insurer is domiciled. Most states, however, permit credit for reinsurance ceded to a non-licensed or non-accredited reinsurer to the extent that such reinsurer secures its obligation. A few states allow credit for reinsurance ceded to non-licensed reinsurers only in certain limited circumstances and other states impose requirements that make it difficult to become licensed or accredited.
Platinum Bermuda is not licensed, accredited or approved in any state in the U.S. and, consequently, Platinum Bermuda must collateralize its obligations to Platinum US in order for Platinum US to obtain credit to its reserves on its statutory basis financial statements. Premiums ceded to foreign reinsurers not licensed, accredited or approved in the U.S. are subject to a 1% reinsurance premium excise tax in the United States.
U.K. Regulation
The framework for supervision of insurance and reinsurance companies in the U.K. is largely formed by European Union Directives (“Directives”), which are required to be implemented in member states through national legislation. The objective of the Directives is to harmonize insurance regulation and supervision throughout the European Union by establishing minimum standards in key areas, and requiring member states to give mutual recognition to each other’s standards of prudential supervision. The Financial Services Authority (the “FSA”) assumed its full powers and responsibilities under the Financial Services and Markets Act 2000 (“FSMA”) and is the single statutory regulator responsible for regulating deposit-taking, insurance (which includes reinsurance), investment and most other financial services business.
Supervision.The FSA has adopted a risk-based approach to the supervision of insurance companies. Under this approach, the FSA performs a formal risk assessment of every insurance company or group carrying on business in the U.K. during each supervisory period, which varies in length according to the risk profile of the insurer. After each risk assessment, the FSA will inform the insurer of its views on the insurer’s risk profile. This report will include details of any remedial action which the FSA requires and the likely consequences if this action is not taken.
Solvency Requirements.Insurance companies are required to maintain a margin of solvency at all times in respect of any general insurance undertaken by the insurance company, the calculation of which in any particular case depends on the type and amount of insurance business a company writes. The
- 28 -
Table of Contents
method of calculation of the solvency margin is set out in the FSA rules, and for these purposes, an insurer’s assets and liabilities are subject to specific valuation rules. Failure to maintain the required solvency margin is one of the grounds on which wide powers of intervention conferred upon the FSA may be exercised.
Restrictions on Dividend Payments.English law prohibits Platinum UK from declaring a dividend to its shareholders unless it has “profits available for distribution.” The determination of whether a company has profits available for distribution is based on its accumulated realized profits less its accumulated realized losses. While U.K. insurance regulatory laws impose no statutory restrictions on a general insurer’s ability to declare a dividend, the FSA strictly controls the maintenance of the solvency margin of each insurance company within its jurisdiction and may, therefore, restrict Platinum UK from declaring a dividend at a level that the FSA determines would adversely affect the solvency requirements of Platinum UK. It is common practice in the U.K. to notify the FSA in advance of any significant dividend payment.
Supervision of Management.The FSA closely supervises the management of insurance companies through the approved persons regime, by which any appointment of a person to a position of significant influence within an insurance company must be approved by the FSA. The FSA also has the authority to require there to be one or more independent directors on the board of directors of an insurance company.
Change of Control.FSMA regulates changes in “control” of any insurance company authorized under FSMA. Any company or individual that (together with the associates thereof) directly or indirectly holds 10% or more of the shares in the parent company of a U.K. authorized insurance company, or is entitled to exercise or control the exercise of 10% or more of the voting power in such a parent company, would be considered to be a “controller” for the purposes of the relevant legislation, as would a person who had significant influence over the management of such parent company by virtue of his shareholding in it. A purchaser of 10% or more of the common shares of Platinum Holdings would therefore be considered to have acquired “control” of Platinum UK.
Under FSMA, any person proposing to acquire “control” over an authorized insurance company must give prior notification to the FSA of his intention to do so. In addition, if an existing controller proposes to increase its control in excess of certain thresholds set out in FSMA, that person must also notify the FSA in advance. The FSA then has three months to consider that person’s application to acquire or increase “control”. In considering whether to approve such application, the FSA must be satisfied both that the person is a fit and proper person to have such “control” and that the interests of consumers would not be threatened by such acquisition of or increase in “control”. Failure to make the relevant prior application would constitute a criminal offense.
Intervention and Enforcement.The FSA has extensive powers to intervene in the affairs of an authorized person. FSMA imposes on the FSA statutory obligations to monitor compliance with the requirements imposed by FSMA, and to enforce the provisions of FSMA and its related secondary legislation and take disciplinary measures.
The FSA has a general power on giving notice to require authorized persons to provide information and documents within their possession or control which the FSA reasonably requires in connection with the exercise of its functions under the regulatory regime. The FSA also has distinct statutory powers to appoint investigators under FSMA.
- 29 -
Table of Contents
Prudential Regulation.The rules which govern the prudential regulation of insurance companies are set out in the FSA’s prudential rules which, for insurers, are principally contained in the General Prudential Sourcebook (“GENPRU”) and Prudential Sourcebook for Insurers (“INSPRU”), which came into force on January 1, 2007. Certain other prudential requirements applicable to insurers, including reporting requirements, are set out in the FSA’s Interim Prudential Sourcebook for Insurers.
The rules in GENPRU and INSPRU require the calculation by insurance companies of a Minimum Capital Requirement and maintenance of capital resources equal to this capital requirement. The rules also require Platinum UK to calculate an Enhanced Capital Requirement (“ECR”), which is intended to provide a risk-responsive, but standardized, method for benchmarking an insurance company’s capital requirements.
The rules in GENPRU and INSPRU also establish the FSA’s Individual Capital Adequacy Standards framework for insurance companies, which require Platinum UK to make an individual assessment of its capital needs (an “ICA”). The FSA takes an insurance company’s ECR and ICA calculations as the starting point for its review of that company’s own capital adequacy assessment. This review is undertaken prior to the FSA giving individual capital guidance (“ICG”) to an insurance company reflecting the FSA’s own view as to the level of capital that would be adequate for that company’s particular business. The FSA considers that a decrease in an insurance company’s capital below the level of its ICG represents a regulatory intervention point. The prudential rules also contain provisions aimed at ensuring adequate diversification of an insurer’s or reinsurer’s exposures to reinsurers (whether intra- or extra-group).
In 2006 we began to renew business previously written by Platinum UK in Platinum Bermuda. After successfully renewing substantially all of the reinsurance business written by Platinum UK in Platinum Bermuda, we decided to cease underwriting reinsurance in Platinum UK in 2007 and seek to return its capital to Platinum Holdings to redeploy elsewhere. This plan will allow us to concentrate our capital in our two other operating reinsurance subsidiaries. Platinum UK will file a Scheme of Operation with the FSA which includes actions to be taken in 2007 for its transition to a non-underwriting operation and to allow the release of a significant portion of its capital. These actions may include a 100% loss portfolio transfer of Platinum UK’s reinsurance business to Platinum Bermuda and a plan for the administration of inforce contracts and related claims. Platinum UK may also seek to novate certain of its reinsurance contracts to Platinum Bermuda.
Ireland Regulation
Platinum Regency is incorporated in Ireland. As a holding company, Platinum Regency is not subject to Irish insurance regulation. Irish law prohibits Platinum Regency from declaring a dividend to its shareholders unless it has “profits available for distribution.” The determination of whether a company has profits available for distribution is based on its accumulated realized profits less its accumulated realized losses.
Available Information
Our annual reports on Form 10-K, quarterly reports on Form 10-Q, current reports on Form 8-K, and any amendments to those reports, are available free of charge on our Internet website atwww.platinumre.com as soon as reasonably practicable after such reports are electronically filed with the Securities and Exchange Commission (“SEC”). We also post on our website the charters of our Audit, Compensation, Governance and Executive Committees, our Corporate Governance Guidelines, our Code of Business Conduct and Ethics and Compliance Procedures, and any amendments or waivers thereto, and
- 30 -
Table of Contents
any other corporate governance materials required to be posted by SEC or New York Stock Exchange (“NYSE”) regulations. These documents are also available in print to any shareholder requesting a copy from our corporate secretary at our principal executive offices. Information contained on the Platinum Holdings website is not part of this report.
On May10, 2006, our Chief Executive Officer submitted to the NYSE his Section 303A.12(a) Annual CEO Certification in which he stated that he is not aware of any violations by us of the NYSE’s Corporate Governance listing standards.
Item 1A. Risk Factors
Numerous factors could cause our actual results to differ materially from those in the forward-looking statements set forth in this Form 10-K and in other documents that we file with the SEC. Those factors include the following:
1. The occurrence of severe catastrophic events could have a material adverse effect on our financial condition or results of operations.
We underwrite property and casualty reinsurance and have large aggregate exposures to natural and man-made disasters, including terrorism and, consequently, we expect that our loss experience generally will include infrequent events of great severity. The frequency and severity of catastrophe losses are inherently difficult to predict. Consequently, the occurrence of losses from a severe catastrophe or series of catastrophes could have a material adverse effect on our results of operations and financial condition. In addition, catastrophes are an inherent risk of our business and a severe catastrophe or series of catastrophes could have a material adverse effect on our ability to write new business, and our financial condition and results of operations, possibly to the extent of eliminating our shareholders’ equity. Increases in the values and geographic concentrations of insured property and the effects of inflation have historically resulted in increased severity of industry losses in recent years, and, although we seek to limit our overall exposure to risk by limiting the amount of reinsurance we write by geographic zone, we expect that those factors will increase the severity of catastrophe losses in the future.
2. If we are required to increase our liabilities for losses and LAE, our operating results may be adversely affected.
We establish liabilities for losses and LAE that we are or will be liable to pay for reinsured claims for events that have occurred on or before the balance sheet date. At any time, these liabilities may prove to be inadequate to cover our actual losses and LAE. To the extent these liabilities are determined to be insufficient to cover actual losses or LAE, we will have to increase these liabilities and incur a charge to our earnings, which could have a material adverse effect on our future financial condition, results of operations. In accordance with laws, regulations and generally accepted accounting principles in the United States (“U.S. GAAP”), we do not establish liabilities until an event occurs which may give rise to a loss. Once such an event occurs, liabilities are established based upon estimates of the total losses incurred by the ceding companies and an estimate of the portion of such loss we have reinsured.
The liabilities established on our consolidated balance sheet do not represent an exact calculation of liability, but rather are estimates of the expected cost of the ultimate settlement of losses. We do not separately evaluate each of the individual contracts assumed under our treaties and we are largely dependent on the original underwriting decisions made by ceding companies. All of our liability estimates are based on actuarial and statistical projections at a given time, facts and circumstances known at that time and estimates of trends in loss severity and other variable factors, including new concepts of
- 31 -
Table of Contents
liability and general economic conditions. Changes in these trends or other variable factors could result in claims in excess of the liabilities that we have established.
Unforeseen losses, the type or magnitude of which we cannot predict, may emerge in the future. These additional losses could arise from changes in the legal environment, prior catastrophic events, extraordinary events affecting our clients such as reorganizations and liquidations or changes in general economic conditions.
In 2005 three significant named hurricanes, Katrina, Rita and Wilma (the “2005 Hurricanes”), caused severe damage in the Gulf Coast region of the United States, including the states of Louisiana, Mississippi, Texas and Florida, as well as in Mexico and the Caribbean. Our estimates with respect to Hurricane Katrina are subject to a high level of uncertainty arising from complex and unique causation and coverage issues associated with the attribution of losses to wind or flood damage or other perils such as fire, business interruption or riot and civil commotion. For example, the underlying policies often do not cover flood damage; however, water damage associated with wind may be covered. We expect that these issues will not be resolved for a considerable period of time and may be influenced by evolving legal and regulatory developments. Our actual losses from the 2005 Hurricanes may exceed our estimates as a result of, among other things, the receipt of additional information from clients, the attribution of losses to coverages that for the purpose of our estimates we assumed would not be exposed, which may be affected by class action lawsuits or state regulatory action, and inflation in repair costs due to the limited availability of labor and materials, in which case our financial results could be further materially adversely affected.
3. If the loss limitation methods and pricing models we employ are not effective, our financial condition or results of operations could be materially adversely affected.
Our property and casualty reinsurance contracts cover unpredictable events such as hurricanes, windstorms, hailstorms, earthquakes, volcanic eruptions, fires, industrial explosions, freezes, riots, floods and other natural or man-made disasters. We seek to limit our overall exposure to risk by limiting the amount of reinsurance we write by geographic zone, peril and type of program or contract. Our risk management practices include the use of contract terms, diversification criteria, probability analysis and analysis of comparable historical loss experience. We estimate the impact of certain catastrophic events using catastrophe modeling software and contract information to evaluate our exposure to losses from individual contracts and in the aggregate. For example, the majority of the natural peril catastrophe reinsurance we write relates to exposures within the United States, Europe and Japan. Accordingly, we monitor our exposure to events that affect these regions, such as hurricanes and earthquakes in the United States, flood and wind in Europe and typhoons and earthquakes in Japan. Underwriting is a matter of judgment, involving assumptions about matters that are inherently difficult to predict and beyond our control, and for which historical experience and probability analysis may not provide sufficient guidance. One or more catastrophic or other events could result in claims that substantially exceed our expectations, which could have a material adverse effect on our financial condition or our results of operations, possibly to the extent of eliminating our shareholders’ equity.
We take an active role in the evaluation of commercial catastrophe exposure models, which form the basis for our own proprietary pricing models. These computer-based loss modeling systems utilize direct exposure information obtained from our clients and independent data to assess each client’s potential for catastrophe losses. We believe that modeling is an important part of the underwriting process for catastrophe exposure pricing. However, these models depend on the quality of the information obtained from our clients and the independent data we obtain from third parties and may prove inadequate for determining the pricing for certain catastrophe exposures.
- 32 -
Table of Contents
Many of our reinsurance contracts do not contain an aggregate loss limit or a loss ratio limit, which means that there is no contractual limit to the amount of losses that we may be required to pay pursuant to such reinsurance contracts. However, substantially all of our property reinsurance contracts with natural catastrophe exposure have occurrence limits that limit our exposure. In addition, substantially all of our high layer property, casualty and marine excess-of-loss contracts also contain aggregate loss limits, with limited reinstatements of an occurrence limit, which restore the original limit under the contract after the limit has been depleted by losses incurred on that treaty. Various provisions of our contracts, such as limitations or exclusions from coverage or choice of forum, may be difficult to enforce in the manner we intend, due to, among other things, disputes relating to coverage and choice of legal forum.
4. A downgrade in our financial strength ratings could adversely affect our ability to write new business.
A.M. Best is generally considered to be the significant rating agency with respect to the evaluation of insurance and reinsurance companies. Ratings are used by ceding companies and reinsurance intermediaries as an important means of assessing the financial strength and quality of reinsurers. In addition, a ceding company’s own rating may be adversely affected by a downgrade in the rating of its reinsurer. Therefore, a downgrade of our rating may dissuade a ceding company from reinsuring with us and may influence a ceding company to reinsure with a competitor of ours that has a higher insurance rating.
A.M. Best has assigned a financial strength rating of “A” (Excellent) to our operating subsidiaries. This rating is the third highest of sixteen rating levels. According to A.M. Best, a rating of “A” indicates A.M. Best’s opinion that a company has an excellent ability to meet its ongoing obligations to policyholders. This rating is subject to periodic review by A.M. Best and may be revised downward or revoked at the sole discretion of A.M. Best. A.M. Best may increase its scrutiny of rated companies, revise their rating standards or take other action. If A.M. Best revises the rating standard associated with our current rating, our rating may be downgraded or we may need to raise additional capital to maintain our rating.
It is increasingly common for our reinsurance contracts to contain terms that would allow the ceding companies to cancel the contract or require us to collateralize all or part of our obligations if our financial strength rating was downgraded below a certain rating level. Whether a client would exercise a cancellation right would depend, among other factors, on the reason for such downgrade, the extent of the downgrade, the prevailing market conditions and the pricing and availability of replacement reinsurance coverage. Therefore, we cannot predict the extent to which a cancellation right would be exercised, if at all, or what effect any such cancellations would have on our financial condition or future operations, but such effect potentially could be material.
We may from time to time collateralize our obligations under our various reinsurance contracts by delivering letters of credit to the ceding company, depositing assets into trust for the benefit of the ceding company or permitting the ceding company to withhold funds that would otherwise be delivered to us under the reinsurance contract. We have entered into reinsurance contracts with several ceding companies that require us to provide varying levels of collateral for our obligations under various circumstances, including when our obligations to these ceding companies exceed negotiated amounts. These amounts may vary depending on our rating from A.M. Best or other rating agencies. The amount of collateral we are required to provide typically represents a portion of the obligations we may owe the ceding company, often including estimates of IBNR made by the ceding company. Since we may be
- 33 -
Table of Contents
required to provide collateral based on the ceding company’s estimate, we may be obligated to provide collateral that exceeds our estimates of the ultimate liability to the ceding company.
5. Increased competition could adversely affect our profitability.
The property and casualty reinsurance industry is highly competitive. We compete based upon security, service and price with reinsurers worldwide, many of which have greater financial, marketing and management resources than we do. Some of our competitors are large financial institutions that have reinsurance segments, while others are specialty reinsurance companies. Financial institutions have also created alternative capital market products that compete with reinsurance products, such as reinsurance securitization.
Following the 2005 Hurricanes, a number of individuals and entities established new Bermuda reinsurers, and many of our competitors raised additional capital. There may also be established companies or new companies of which we are not aware that may be planning to commit capital to this market. The full effect of this additional capital on the reinsurance market and on the terms and conditions of the reinsurance contracts of the types we expect to underwrite may not be known for some time. Competition in the types of reinsurance business that we underwrite is based on many factors, including premium charges and other terms and conditions offered, services provided, ratings assigned by independent rating agencies, speed of claims payment, claims experience, perceived financial strength and experience and reputation of the reinsurer in the line of reinsurance to be underwritten.
Our success depends to a significant extent upon our ability to retain senior management and to continue to attract talented new personnel. Competition within the reinsurance industry to attract senior management, particularly in Bermuda, has increased following the establishment of a number of new, well-capitalized Bermuda reinsurers in the wake of the 2005 Hurricanes. We believe these new entrants will recruit from established reinsurers to hire their new management teams.
Traditional as well as new capital market participants from time to time produce alternative products (such as reinsurance securitizations, catastrophe bonds and various derivatives such as swaps) that may compete with certain types of reinsurance, such as property catastrophe. Over time, these numerous initiatives could significantly affect supply, pricing and competition in our industry.
6. The property and casualty reinsurance business is historically cyclical, and we expect to experience periods with excess underwriting capacity and unfavorable pricing.
�� Historically, property and casualty reinsurers have experienced significant fluctuations in operating results. Demand for reinsurance is influenced significantly by underwriting results of primary insurers and prevailing general economic and market conditions, all of which affect ceding companies’ decisions as to the amount or portion of risk that they retain for their own accounts and consequently reinsurance premium rates. The supply of reinsurance is related to prevailing prices, the levels of insured losses and levels of industry surplus which, in turn, may fluctuate in response to changes in rates of return on investments being earned in the reinsurance industry. As a result, the property and casualty reinsurance business historically has been a cyclical industry, characterized by periods of intense price competition due to excessive underwriting capacity as well as periods when shortages of capacity permitted favorable pricing. We can expect to experience the effects of such cyclicality.
The cyclical trends in the industry and the industry’s profitability can also be affected significantly by volatile and unpredictable developments, including what management believes to be a trend of courts to grant increasingly larger awards for certain damages, natural disasters (such as
- 34 -
Table of Contents
catastrophic hurricanes, windstorms, tornadoes, earthquakes and floods), acts of terrorism, fluctuations in interest rates, changes in the investment environment that affect market prices of and income and returns on investments and inflationary pressures that may tend to affect the size of losses experienced by primary insurers. We cannot predict whether market conditions will improve, remain constant or deteriorate. A return to unfavorable market conditions from the current favorable conditions may affect our ability to write reinsurance at rates that we consider appropriate relative to the risk assumed. If we cannot write property and casualty reinsurance at appropriate rates, our ability to transact reinsurance business would be significantly and adversely affected.
7. The imposition of U.S. corporate income tax on Platinum Holdings and its non-U.S. subsidiaries could adversely affect our results of operations.
We believe that Platinum Holdings, Platinum Bermuda, Platinum UK, and Platinum Regency each operate in such a manner that none of these companies are subject to U.S. corporate income tax because they are not engaged in a trade or business in the U.S. Nevertheless, because definitive identification of activities which constitute being engaged in a trade or business in the U.S. is not provided by the tax authorities, the U.S. Internal Revenue Service might contend that any of these companies is engaged in a trade or business in the U.S., which could subject such non-U.S. subsidiary to U.S. tax at regular corporate rates on the income that is effectively connected with the U.S. trade or business, plus an additional 30% “branch profits” tax on such income remaining after the regular tax in certain circumstances. Any such tax could materially adversely affect our results of operations.
8. We are dependent on the business provided to us by reinsurance brokers and we may be exposed to liability for brokers’ failure to make payments to clients for their claims.
We market substantially all of our reinsurance products through reinsurance brokers. The reinsurance brokerage industry generally, and our sources of business specifically, are concentrated. The loss of business relationships with any of our top five brokers could have a material adverse effect on our business.
In accordance with industry practice, we frequently pay amounts owing in respect of claims under our contracts to reinsurance brokers, for payment over to the ceding companies. In the event that a broker fails to make such a payment, depending on the jurisdiction, we may remain liable to the ceding company for the deficiency. Conversely, in certain jurisdictions, when premiums for such contracts are paid to reinsurance brokers for payment over to us, such premiums will be deemed to have been paid and the ceding company will no longer be liable to us for those amounts whether or not actually received by us. Consequently, we assume a degree of credit risk associated with our brokers during the payment process.
9. Retrocessional reinsurance may become unavailable on acceptable terms.
In order to limit the effect on our financial condition of large and multiple losses, we may buy retrocessional reinsurance, which is reinsurance for our own account. From time to time, market conditions have limited, and in some cases have prevented, insurers and reinsurers from obtaining the types and amounts of reinsurance that they consider adequate for their business needs. If we are unable or unwilling to obtain retrocessional reinsurance, our financial position and results of operations may be materially adversely affected by catastrophic losses. Elimination of all or portions of our retrocessional coverage could subject us to increased, and possibly material, exposure or could cause us to underwrite less business.
- 35 -
Table of Contents
Our retrocessions subject us to credit risk because the ceding of risk to retrocessionaires does not relieve a reinsurer of its liability to the ceding companies. Therefore, a retrocessionaire’s insolvency or its inability or unwillingness to make payments under the terms of its reinsurance treaty with us could have a material adverse effect on us.
10. Our invested assets are subject to market volatility and interest rate and currency exchange rate fluctuation.
Our principal invested assets are fixed maturities, which are subject to the market risk of potential losses from adverse changes in interest rates. Depending on our classification of our investments as available-for-sale, trading or other assets, changes in the market value of our securities are reflected in either our consolidated balance sheet or consolidated statement of operations. Our investment portfolio is also subject to credit risk resulting from adverse changes in the issuer’s ability to repay the debt. These risks could materially adversely affect our financial condition or our results of operations.
Our principal exposure to foreign currency risk is our obligation to settle claims in foreign currencies. The possibility exists that we may incur foreign currency exchange gains or losses as we ultimately settle claims required to be paid in foreign currencies. To the extent we do not seek to hedge our foreign currency risk or hedges prove ineffective, the resulting impact of a movement in foreign currency exchange rate could materially adversely affect our financial condition or our results of operations.
11. We could be adversely affected by the loss of one or more key executives or by an inability to retain or replace qualified senior management.
Our success depends on our ability to retain the services of key executives and to attract and retain additional qualified personnel in the future. The loss of the services of our key executives or the inability to hire and retain other highly qualified personnel in the future could adversely affect our business plans and strategies or cause us to lose clients or other key business contacts. We do not maintain key person life insurance policies with respect to our employees.
12. The current investigations into finite risk reinsurance products could have a material adverse effect on our financial condition or results of operations.
In November and December 2004, we received subpoenas from the SEC and the Office of the Attorney General for the State of New York for documents and information relating to certain finite risk reinsurance products. We have fully cooperated in responding to all such requests. Other reinsurance companies have reported receiving similar subpoenas and requests. We are unable to predict the direction these investigations will take and the impact, if any, they may have on our business.
On June 14, 2005, we received a grand jury subpoena from the United States Attorney for the Southern District of New York requesting documents relating to our finite risk reinsurance products. We have been informed that other companies in the industry have received similar subpoenas. We have fully cooperated in responding to this request.
In the Finite Risk segment, we expect that the ongoing investigations by the SEC, New York Attorney General and United States Attorney for the Southern District of New York will significantly diminish demand for finite risk products.
- 36 -
Table of Contents
13. It may be difficult to enforce service of process and judgments against us and our officers and directors.
We are a Bermuda company and certain of our officers and directors are residents of various jurisdictions outside the U.S. A substantial portion of our assets and our officers and directors, at any one time, are or may be located in jurisdictions outside the U.S. It may be difficult for investors to effect service of process within the U.S. on our directors and officers who reside outside the U.S. or to enforce against us or our directors and officers judgments of U.S. courts predicated upon civil liability provisions of the U.S. federal securities laws.
14.There are limitations on the ownership, transfer and voting rights of our common shares.
Under our Bye-laws, our directors are required to decline to register any transfer of common shares that would result in a person (or any group of which such person is a member) beneficially owning, directly or indirectly, 10% or more of the voting shares, or in the case of our two former principal shareholders beneficially owning, directly or indirectly, 25% or more of such shares or of the total combined value of our issued shares. Similar restrictions apply to our ability to issue or repurchase shares. The directors also may, in their discretion, decline to register the transfer of any shares if they have reason to believe (1) that the transfer may lead to adverse tax or regulatory consequences in any jurisdiction or (2) that the transfer would violate the registration requirements of the U.S. federal securities laws or of any other jurisdiction. These restrictions would apply to a transfer of shares even if the transfer has been executed on the NYSE. A transferor of common shares will be deemed to own those shares for dividend, voting and reporting purposes until a transfer of those common shares has been registered on our register of shareholders. We are authorized to request information from any holder or prospective acquirer of common shares as necessary to give effect to the transfer issuance and repurchase restrictions referred to above, and may decline to effect any transaction if complete and accurate information is not received as requested.
In addition, our Bye-laws generally provide that any person (or any group of which such person is a member) beneficially owning, directly or indirectly, shares carrying 10% or more of the total voting rights attached to all of our outstanding voting shares, will have the voting rights attached to our issued shares reduced so that it may not exercise 10% or more of such total voting rights. Because of the attribution provisions of the U.S. Internal Revenue Code of 1986, as amended (the “Code”), and the rules of the SEC regarding determination of beneficial ownership, this requirement may have the effect of reducing the voting rights of a shareholder whether or not such shareholder directly holds 10% or more of our common shares. Further, the directors have the authority to require from any shareholder certain information for the purpose of determining whether that shareholder’s voting rights are to be reduced. Failure to respond to such a notice, or submitting incomplete or inaccurate information, gives the directors (or their designees) discretion to disregard all votes attached to that shareholder’s common shares.
The insurance law of Maryland prevents any person from acquiring control of us or of Platinum US unless that person has filed a notification with specified information with the Maryland Insurance Commissioner and has obtained his prior approval. Under the Maryland statute, acquiring 10% or more of the voting stock of an insurance company or its parent company is presumptively considered a change of control, although such presumption may be rebutted. Accordingly, any person who acquires, directly or indirectly, 10% or more of the voting securities of Platinum Holdings without the prior approval of the Maryland Insurance Commissioner will be in violation of this law and may be subject to injunctive action requiring the disposition or seizure of those securities by the Maryland Insurance Commissioner or prohibiting the voting of those securities and to other actions determined by the Maryland Insurance
- 37 -
Table of Contents
Commissioner. In addition, many U.S. state insurance laws require prior notification of state insurance departments of a change in control of a non-domiciliary insurance company doing business in that state. While these pre-notification statutes do not authorize the state insurance departments to disapprove the change in control, they authorize regulatory action in the affected state if particular conditions exist such as undue market concentration. Any future transactions that would constitute a change in control of Platinum Holdings may require prior notification in those states that have adopted pre-acquisition notification laws.
Common shares may be offered or sold in Bermuda only in compliance with the provisions of the Investment Business Act 2003 of Bermuda. In addition, sales of common shares to persons resident in Bermuda for Bermuda exchange control purposes may require the prior approval of the Bermuda Monetary Authority. Consent under the Exchange Control Act 1972 (and its related regulations) has been obtained from the Bermuda Monetary Authority for the issue and transfer of the common shares between non-residents of Bermuda for exchange control purposes, provided our shares remain listed on an appointed stock exchange, which includes the NYSE. In giving such consent, neither the Bermuda Monetary Authority nor the Registrar of Companies accepts any responsibility for the financial soundness of any proposal or for the correctness of any of the statements made or opinions expressed herein or therein.
The Financial Services and Markets Act 2000, as amended (“FSMA”), regulates changes in “control” of any U.K. insurance company authorized under FSMA. Any company or individual that (together with its or his associates) directly or indirectly holds 10% or more of the shares in the parent company of a U.K. authorized insurance company, or is entitled to exercise or control the exercise of 10% or more of the voting power in such a parent company, would be considered a “controller” for the purposes of the relevant legislation, as would a person who had significant influence over the management of such parent company by virtue of his shareholding in it. A purchaser of 10% or more of the common shares would therefore be considered to have acquired “control” of Platinum UK.
Under FSMA, any person proposing to acquire “control” over a U.K. authorized insurance company must give prior notification to the Financial Services Authority (“FSA”) of his intention to do so. In addition, if an existing controller proposes to increase its control in excess of certain thresholds set out in FSMA, that person must also notify the FSA in advance. The FSA would then have three months to consider that person’s application to acquire or increase “control”. In considering whether to approve such application, the FSA must be satisfied both that the person is a fit and proper person to have such “control” and that the interests of consumers would not be threatened by such acquisition of or increase in “control”. Failure to make the relevant prior application would constitute a criminal offense.
The foregoing provisions of our Bye-laws and legal restrictions will have the effect of rendering more difficult or discouraging unsolicited takeover bids from third parties or the removal of incumbent management.
15. Platinum Holdings is a holding company and, consequently, its cash flow is dependent on dividends, interest and other permissible payments from its subsidiaries.
Platinum Holdings is a holding company that conducts no reinsurance operations of its own. All operations are conducted by its wholly owned operating subsidiaries, Platinum Bermuda, Platinum US and Platinum UK. As a holding company, Platinum Holdings’ cash flow consists primarily of dividends, interest and other permissible payments from its subsidiaries. Platinum Holdings depends on such payments for general corporate purposes and to meet its obligations, including the payment of any dividends to its shareholders, including the holders of common shares.
- 38 -
Table of Contents
Additionally, under the Bermuda Companies Act 1981 (the “Companies Act”), Platinum Holdings may declare or pay a dividend out of distributable reserves only if it has reasonable grounds for believing that it is, or after the payment would be, able to pay its liabilities as they become due and if the realizable value of its assets would thereby not be less than the aggregate of its liabilities and issued share capital and share premium accounts.
16. Losses from operations may deplete our capital base and create a need to obtain additional capital that may not be readily available in the capital markets or only be available on unfavorable terms.
Losses from operations, including severe catastrophic events, could cause a material decline in our shareholders’ equity. We are dependent on our financial strength and ratings, as evaluated by independent rating agencies, to underwrite reinsurance. A material decline in our existing capital below a level necessary to maintain our ratings would require that we raise additional capital through financings or the capital markets. To the extent that our existing capital is insufficient to fund our future operating requirements, we may need to raise additional funds through financings or limit our growth. Any equity or debt financing, if available at all, may be on terms that are unfavorable to us. In the case of equity financings, dilution to our shareholders could result, and, in any case, such securities may have rights, preferences and privileges that are senior to those of our outstanding securities. If we are not able to obtain adequate capital, our business, results of operations and financial condition could be adversely affected.
17. Under certain circumstances, you may be required to pay taxes on your pro rata share of the related person insurance income of Platinum Bermuda and of Platinum UK.
If the related person insurance income (“RPII”) of Platinum Bermuda or Platinum UK were to equal or exceed 20% of the gross insurance income of Platinum Bermuda or Platinum UK in any taxable year and direct or indirect insureds (and persons related to such insureds) own (or are treated as owning directly or indirectly) 20% or more of the voting power or value of the shares of Platinum Bermuda or Platinum UK, a U.S. person who owns the common shares of Platinum Holdings directly or indirectly on the last day of the taxable year would be required to include in its income for U.S. federal income tax purposes the shareholder’s pro rata share of the RPII of Platinum Bermuda or Platinum UK for the entire taxable year, determined as if such RPII were distributed proportionately to such United States shareholders at that date regardless of whether such income is distributed. In addition, U.S. tax-exempt organizations would be required to treat RPII as unrelated business taxable income if the RPII of Platinum Bermuda or Platinum UK equaled or exceeded 20% of the gross insurance income of Platinum Bermuda or Platinum UK in any taxable year. The amount of RPII earned by Platinum Bermuda or Platinum UK (generally, premium and related investment income from the direct or indirect insurance or reinsurance of any direct or indirect U.S. shareholder of Platinum Bermuda or Platinum UK or any person related to such shareholder) will depend on a number of factors, including the geographic distribution of the business of Platinum Bermuda or Platinum UK and the identity of persons directly or indirectly insured or reinsured by Platinum Bermuda or Platinum UK. Some of the factors which determine the extent of RPII in any period may be beyond the control of Platinum Bermuda or Platinum UK. Consequently, the RPII of Platinum Bermuda or Platinum UK could equal or exceed 20% of its gross insurance income in any taxable year and ownership of its shares by direct or indirect insureds and related persons could equal or exceed the 20% threshold described above.
The RPII rules provide that if a shareholder who is a U.S. person disposes of shares in a foreign insurance corporation that has RPII (even if the amount of RPII is less than 20% of the corporation’s gross insurance income) and in which U.S. persons own 25% or more of the shares, any gain from the
- 39 -
Table of Contents
disposition will generally be treated as ordinary income to the extent of the shareholder’s share of the corporation’s undistributed earnings and profits that were accumulated during the period that the shareholder owned the shares (whether or not such earnings and profits are attributable to RPII). In addition, such a shareholder will be required to comply with certain reporting requirements, regardless of the amount of shares owned by the shareholder. These rules should not apply to dispositions of common shares because Platinum Holdings will not itself be directly engaged in the insurance business and because proposed U.S. Treasury regulations appear to apply only in the case of shares of corporations that are directly engaged in the insurance business. However, the IRS might interpret the proposed regulations in a different manner and the applicable proposed regulations may be promulgated in final form in a manner that would cause these rules to apply to dispositions of our common shares.
18. A recently published IRS Revenue Ruling could be applied to recharacterize the insurance arrangements between Platinum US and Platinum Bermuda.
Recently, the IRS published Revenue Ruling 2005-04, which sets forth guidelines for when there is adequate “risk distribution” for primary insurance arrangements to constitute insurance for U.S. federal tax purposes. Revenue Ruling 2005-04 does not address what constitutes risk distribution in the context of reinsurance (which includes retrocession). However, if the IRS were to successfully contend that the principles enunciated in Revenue Ruling 2005-04 apply to reinsurance (including retrocession) and find that under those principles Platinum Bermuda does not have adequate risk distribution, this could have a negative effect on our book value and potentially on the value of our common shares, particularly for those shareholders subject to the passive foreign investment company rules.
19. We may become subject to taxes in Bermuda after 2016.
We have received a standard assurance from the Bermuda Minister of Finance, under Bermuda’s Exempted Undertakings Tax Protection Act 1966, that if any legislation is enacted in Bermuda that would impose tax computed on profits or income, or computed on any capital asset, gain or appreciation, or any tax in the nature of estate duty or inheritance tax, then the imposition of any such tax will not be applicable to us or to any of our operations or our shares, debentures or other obligations until March 28, 2016. Consequently, if our Bermuda tax exemption is not extended past March 28, 2016, we may be subject to any Bermuda tax after that date.
20. Bermuda could be subject to sanctions by a number of multinational organizations which could adversely affect Bermuda companies.
A number of multinational organizations, including the European Union, the Organization for Economic Cooperation and Development, (“OECD”), including its Financial Action Task Force, and the Financial Stability Forum, have identified certain countries as not participating in adequate information exchange, engaging in harmful tax competition or not maintaining adequate controls to prevent corruption, such as money laundering activities. Recommendations to limit such harmful practices are under consideration by these organizations, and a report published on November 27, 2001 by the OECD contains an extensive discussion of specific recommendations. The OECD has threatened non-member jurisdictions that do not agree to cooperate with the OECD with punitive sanctions by OECD member countries. It is unclear what these sanctions will be and if they will be imposed. In a June 26, 2000 report, Bermuda was not listed as a tax haven jurisdiction by the OECD. However, we cannot assure you that this situation will not change. The OECD can adopt measures that could adversely affect Bermuda companies.
- 40 -
Table of Contents
21. The regulatory system under which we operate and potential changes thereto could significantly and adversely affect our business.
The business of reinsurance is regulated in most countries, although the degree and type of regulation varies significantly from one jurisdiction to another. Reinsurers are generally subject to less direct regulation than primary insurers. In Bermuda, we operate under relatively less intensive regulatory requirements. However, in the United States and in the United Kingdom licensed reinsurers are highly regulated and must comply with financial supervision standards comparable to those governing primary insurers. For additional discussion of the regulatory requirements to which Platinum Holdings and its subsidiaries are subject, see Business - Regulation. Any failure to comply with applicable laws could result in the imposition of significant restrictions on our ability to do business, and could also result in fines and other sanctions, any or all of which could materially adversely affect our financial results and operations. In addition, these statutes and regulations may, in effect, restrict the ability of our subsidiaries to write new business or, as indicated above, distribute funds to Platinum Holdings. In recent years, some state legislatures have considered or enacted laws that may alter or increase state authority to regulate insurance companies and insurance holding companies. Moreover, the National Association of Insurance Commissioners, (“NAIC”) and state insurance regulators regularly reexamine existing laws and regulations, interpretations of existing laws and the development of new laws that may be more restrictive or may result in higher costs to us than current statutory requirements.
Platinum Bermuda is not registered or licensed as an insurance company in any jurisdiction outside Bermuda. Platinum Bermuda conducts its business solely through its offices in Bermuda and does not maintain an office, and its personnel do not conduct any insurance activities, outside Bermuda. Although Platinum Bermuda does not believe it is in violation of insurance laws of any jurisdiction outside Bermuda, inquiries or challenges to Platinum Bermuda’s insurance activities may still be raised in the future.
The offshore insurance and reinsurance regulatory framework recently has become subject to increased scrutiny in many jurisdictions, including the U.S. federal and various state jurisdictions. In the past, there have been congressional and other proposals in the United States regarding increased supervision and regulation of the insurance industry, including proposals to supervise and regulate reinsurers domiciled outside the United States. If Platinum Bermuda were to become subject to any insurance laws and regulations of the United States or any U.S. state, which are generally more restrictive than those applicable to it in Bermuda, Platinum Bermuda might be required to post deposits or maintain minimum surplus levels and might be prohibited from engaging in lines of business or from writing specified types of policies or contracts. Complying with those laws could have a material adverse effect on our ability to conduct our business.
Item 1B. Unresolved Staff Comments
None.
Item 2. Properties
Platinum Holdings and Platinum Bermuda lease offices located at The Belvedere Building, 69 Pitts Bay Road, Pembroke, Bermuda. The term of this lease ends on December 31, 2009. The principal offices of Platinum US and all other U.S. based subsidiaries are located at Two World Financial Center, New York, New York. The term of this lease ends on September 29, 2013. Platinum US also leases 4,000 square feet of office space in Chicago. The term of the lease in Chicago ends on February 28, 2011. The principal offices of Platinum UK are located at St. Clare House, 30/33 Minories, London,
- 41 -
Table of Contents
where Platinum UK leases approximately 3,200 square feet of office space. The term of this lease ends on October 22, 2011. We anticipate no difficulty in extending these leases or obtaining comparable office facilities in suitable locations and consider our facilities to be adequate for our current needs.
Item 3. Legal Proceedings
As previously disclosed, in November and December 2004 we received subpoenas from the SEC and the Office of the Attorney General for the State of New York for documents and information relating to certain non-traditional, or loss mitigation, insurance products. We have fully cooperated in responding to all such requests. Other reinsurance companies have reported receiving similar subpoenas and requests. We are unable to predict the direction the investigation will take and the impact, if any, it may have on our business. In view of the ongoing industry investigations, we retained the law firm of Dewey Ballantine LLP to conduct a review of our finite reinsurance practices. They informed us that they identified no evidence of improprieties.
On June 14, 2005, we received a grand jury subpoena from the United States Attorney for the Southern District of New York requesting documents relating to our finite reinsurance products. We have been informed that other companies in the industry have received similar subpoenas. We have fully cooperated in responding to this request.
In the normal course of business, we may become involved in various claims and legal proceedings. We are not currently aware of any pending or threatened material litigation.
Item 4. Submission of Matters to a Vote of Security Holders
No matters were submitted to a vote of Platinum Holdings shareholders during the fourth quarter of 2006.
PART II
Item 5. Market For Registrant’s Common Equity, Related Shareholder Matters and Issuer Purchases of Equity Securities
Our common shares are listed on the NYSE under the symbol “PTP.” The following table shows the high and low per share trading prices of our common shares, as reported on the NYSE for the periods indicated:
| Price Range of | ||||||||
| Common Shares | ||||||||
| Year | High | Low | ||||||
| 2006: | ||||||||
| First Quarter | $ | 32.30 | $ | 28.00 | ||||
| Second Quarter | 30.00 | 26.14 | ||||||
| Third Quarter | 31.11 | 27.34 | ||||||
| Fourth Quarter | $ | 31.41 | $ | 29.51 | ||||
- 42 -
Table of Contents
| Price Range of | ||||||||
| Common Shares | ||||||||
| Year | High | Low | ||||||
| 2005: | ||||||||
| First Quarter | $ | 32.03 | $ | 29.02 | ||||
| Second Quarter | 32.15 | 26.43 | ||||||
| Third Quarter | 35.21 | 27.45 | ||||||
| Fourth Quarter | $ | 31.70 | $ | 27.10 | ||||
On February 16, 2007, the last reported sale price for our common shares on the NYSE was $30.76 per share. At February 16, 2007, there were approximately 25 holders of record and approximately 4,200 beneficial holders of our common shares.
During the years ended December 31, 2006 and 2005 we paid quarterly cash dividends of $0.08 per common share. The Board has declared a dividend for the first quarter of 2007 of $0.08 per common share, payable on March 31, 2007 to shareholders of record at the close of business on March 1, 2007. The declaration and payment of both preferred and common share dividends are at the discretion of the Board of Directors and depend upon our results of operations, cash flows, the financial positions and capital requirements of Platinum Bermuda, Platinum US and Platinum UK, general business conditions, legal, tax and regulatory restrictions on the payment of dividends and other factors the Board of Directors deems relevant. Unless all accrued, cumulated and unpaid dividends on our preferred shares for all past quarterly dividend periods have been paid in full we cannot declare or pay any dividends or make any distributions to any of our common shareholders. See Sources of Liquidity under Financial Condition, Liquidity and Capital resources on page 72 for further discussion of potential limitations of dividends.
The conversion rate of our preferred shares to common shares is subject to anti-dilution adjustments under certain circumstances, including the payment of dividends on our common shares in common shares, the issuance to all holders of common share rights or warrants to acquire common shares at less than market price, and the payment of cash dividends per common share in excess of $0.08 per quarter, subject to adjustment whenever the conversion rate is adjusted.
Platinum US is subject to regulatory constraints imposed by Maryland insurance law, Platinum UK is subject to regulatory constraints imposed by U.K. insurance law, Platinum Regency is subject to constraints imposed by Irish law, and Platinum Bermuda is subject to regulatory constraints imposed by Bermuda insurance law. Such constraints affect the ability of each to pay dividends to Platinum Holdings. See Business — Regulation.
We have agreed to adjust the exercise price of the options granted to St. Paul and RenaissanceRe to the extent common share dividend increases exceed 10% per year; however, we do not expect that common share dividend increases, if any, will exceed such rate.
We did not issue any common shares that were not registered under the Securities Act and no repurchases of our common shares were made during the year ended December 31, 2006.
Performance Graph
The Company commenced operations on November 1, 2002 upon completion of the Initial Public Offering. The graph below compares cumulative total return on the Common Shares with the cumulative total return on the Standard & Poor’s (“S&P”) 500 Composite Stock Price Index (the “S&P 500 Index”) and the S&P Property-Casualty Industry Group Stock Price Index (the “S&P Property-Casualty Index”),
- 43 -
Table of Contents
for the period commencing November 1, 2002 and ending on December 31, 2006. The graph shows the value at December 31 of each calendar year since the commencement of operations by the Company of $100 invested on November 1, 2002 in the Common Shares, the S&P 500 Index, and the S&P Property-Casualty Index as measured by the last sale price on the last trading day of each such period.
Total Return to Shareholders
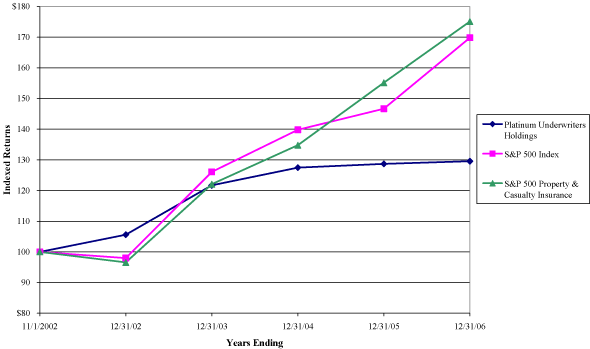
| Indexed Returns * | ||||||||||||||||||||
| Years Ending December 31, | ||||||||||||||||||||
| 2002 | 2003 | 2004 | 2004 | 2006 | ||||||||||||||||
| Platinum | 105.61 | 121.69 | 127.49 | 128.69 | 129.55 | |||||||||||||||
| S&P 500 Index | 97.98 | 126.08 | 139.80 | 146.67 | 169.84 | |||||||||||||||
| S&P 500 Property & Casualty Index | 96.57 | 122.07 | 134.79 | 155.16 | 175.14 | |||||||||||||||
| * | Index value at November 1, 2002 — 100.00 |
The foregoing Performance Graphs shall not be deemed to be “soliciting material” or “filed” with the SEC or incorporated by reference in any previous or future document filed by the Company with the SEC under the Securities Act or the Exchange Act, except to the extent that the Company specifically incorporates such Performance Graph by reference in any such document.
Item 6. Selected Financial Data
The following table sets forth certain of our selected financial data as of and for the years ended December 31, 2006, 2005, 2004 and 2003, and for the period from April 19, 2002 through December 31,
- 44 -
Table of Contents
2002 and of St. Paul Re for the period from January 1, 2002 through November 1, 2002. Our data as of and for the years ended December 31, 2006, 2005 and 2004 were derived from our consolidated financial statements beginning on page F-1 of this Form 10-K. Our data as of and for the year ended December 31, 2003 and as of and for the period from April 19, 2002 through December 31, 2002 were derived from our audited consolidated financial statements not included in this Form 10-K. The data for St. Paul Re for the period ended November 1, 2002 was derived from the audited combined financial statements of St. Paul Re prior to our initial public offering in 2002 (the “Predecessor Business”) not included in this Form 10-K. You should read the selected financial data in conjunction with our consolidated financial statements as of December 31, 2006 and 2005 and for each of the three years in the period ended December 31, 2006 beginning on page F-1 of this Form 10-K, and the related “Management’s Discussion and Analysis of Financial Condition and Results of Operations” beginning on page 46 of this Form 10-K.
The underwriting results and the audited historical combined financial statements of St. Paul Re (the Predecessor Business) are not indicative of our actual results subsequent November 1, 2002.
Five-Year Summary of Selected Financial Data
($ in millions, except per share amounts)
($ in millions, except per share amounts)
| St. Paul Re | ||||||||||||||||||||||||
| Platinum Underwriters Holdings, Ltd. | (Predecessor) | |||||||||||||||||||||||
| As of and | ||||||||||||||||||||||||
| for the | Period from | |||||||||||||||||||||||
| period from | January 1, | |||||||||||||||||||||||
| April 19, 2002 | 2002 | |||||||||||||||||||||||
| through | through | |||||||||||||||||||||||
| Years ended December 31, | December 31, | November 1, | ||||||||||||||||||||||
| 2006 | 2005 | 2004 | 2003 | 2002 | 2002 | |||||||||||||||||||
| Statement of Operations Data: | ||||||||||||||||||||||||
| Net premiums written | $ | 1,176.6 | 1,717.7 | 1,646.0 | 1,172.1 | $ | 298.1 | $ | 1,007.0 | |||||||||||||||
| Net premiums earned | 1,336.7 | 1,714.7 | 1,447.9 | 1,067.5 | 107.1 | 1,102.0 | ||||||||||||||||||
| Net investment income | 188.0 | 129.4 | 84.5 | 57.6 | 5.2 | |||||||||||||||||||
| Net losses and LAE | 760.6 | 1,505.4 | 1,019.8 | 584.2 | 60.4 | 791.0 | ||||||||||||||||||
| Underwriting expenses | 357.2 | 458.8 | 381.0 | 320.7 | 37.6 | $ | 319.0 | |||||||||||||||||
| Net income (loss) | 329.7 | (137.5 | ) | 84.8 | 144.8 | 6.4 | ||||||||||||||||||
| Basic earnings (loss) per common share | 5.38 | (3.01 | ) | 1.96 | 3.37 | 0.15 | ||||||||||||||||||
| Diluted earnings (loss) per common share | 4.96 | (3.01 | ) | 1.81 | 3.09 | 0.15 | ||||||||||||||||||
| Dividends declared per common share | $ | 0.32 | 0.32 | 0.32 | 0.32 | $ | — | |||||||||||||||||
- 45 -
Table of Contents
| Platinum Underwriters Holdings, Ltd. | ||||||||||||||||||||
| As of and | ||||||||||||||||||||
| for the | ||||||||||||||||||||
| period from | ||||||||||||||||||||
| April 19, 2002 | ||||||||||||||||||||
| through | ||||||||||||||||||||
| Years ended December 31, | December 31, | |||||||||||||||||||
| 2006 | 2005 | 2004 | 2003 | 2002 | ||||||||||||||||
| Balance Sheet Data: | ||||||||||||||||||||
| Total investments and cash | $ | 4,228.9 | 3,830.4 | 2,456.9 | 1,790.5 | $ | 1,346.7 | |||||||||||||
| Premiums receivable | 377.2 | 567.4 | 580.0 | 487.4 | 5.6 | |||||||||||||||
| Total assets | 5,093.6 | 5,154.4 | 3,422.0 | 2,485.6 | 1,644.9 | |||||||||||||||
| Unpaid losses and LAE | 2,368.5 | 2,324.0 | 1,381.0 | 736.9 | 281.7 | |||||||||||||||
| Unearned premiums | 349.8 | 502.0 | 502.4 | 306.0 | 191.0 | |||||||||||||||
| Debt obligations | 292.8 | 292.8 | 137.5 | 137.5 | 137.5 | |||||||||||||||
| Shareholders’ equity | 1,858.1 | 1,540.2 | 1,133.0 | 1,067.2 | 921.2 | |||||||||||||||
| Book value per common share | $ | 28.33 | 23.22 | 26.30 | 24.79 | $ | 21.42 | |||||||||||||
Item 7. Management’s Discussion and Analysis of Financial Condition and Results of Operations
The following discussion and analysis should be read in conjunction with our consolidated financial statements and the related notes included on pages F-1 through F-46 of this Form 10-K and Note on Forward-Looking Statements on page 1. Our consolidated financial statements have been prepared in accordance with accounting principles generally accepted in the United States of America (“U.S. GAAP”).
Overview
Platinum Holdings is a Bermuda holding company organized in 2002. We operate through our two licensed reinsurance subsidiaries: Platinum Bermuda and Platinum US. Through December 31, 2006 we also underwrote business in Platinum UK. We provide property and marine, casualty and finite risk reinsurance coverages, through reinsurance intermediaries, to a diverse clientele of insurers and select reinsurers on a worldwide basis.
In November 2002, we completed an initial public offering and entered into several agreements with St. Paul for the transfer of continuing reinsurance business and certain related assets of St. Paul to us. Among these agreements were the Quota Share Retrocession Agreements.
Critical Accounting Estimates
It is important to understand our accounting estimates in order to understand our financial position and results of operations. We consider certain of these estimates to be critical to the presentation of the financial results since they require management to make estimates and valuation assumptions.
- 46 -
Table of Contents
These estimates and assumptions affect the reported amounts of assets, liabilities, revenues, expenses and related disclosures. Certain of the estimates and assumptions result from judgments that are necessarily subjective and consequently actual results may materially differ from these estimates. Our critical accounting estimates include premiums written and earned, unpaid losses and LAE, valuation of investments and evaluation of risk transfer.
Premiums Written and Earned
Assumed reinsurance premiums are recognized as revenues as premiums become earned, which generally occurs proportionately over the coverage period. Net premiums earned are recorded in the consolidated statement of operations, net of the cost of retrocession. Net premiums written not yet recognized as revenue are recorded on the consolidated balance sheet as unearned premiums, gross of any ceded unearned premiums.
Due to the nature of reinsurance, ceding companies routinely report and remit premiums subsequent to the contract coverage period. Consequently, reinsurance premiums written include amounts reported by the ceding companies, supplemented by estimates of premiums that are written but not reported (“WBNR”). The premium estimation process considers the terms and conditions of the reinsurance contracts and assumes that the contracts will remain in force until expiration. The estimation of written premiums could be affected by early cancellation, election of contract provisions for cut-off and return of unearned premiums or other contract disruptions. In addition to estimating WBNR, we estimate the portion of premiums earned but not reported (“EBNR”). We also estimate the expenses associated with these premiums in the form of losses, LAE and commissions. The time lag involved in the process of reporting premiums is shorter than the lag in reporting losses. Premiums are generally reported within two years.
When estimating premiums written and earned, we segregate the business of each of our reinsurance subsidiaries into classes by type of coverage and type of contract (approximately 90 classes). Within each class, business is further segregated by the year in which the contract incepted (the “Underwriting Year”), starting with 2002. Estimates of WBNR and EBNR are made for each class and Underwriting Year. Premiums are estimated based on ceding company estimates and our own judgment after considering factors such as the ceding company’s historical premium versus projected premium, the ceding company’s history of providing accurate estimates, anticipated changes in the marketplace and the ceding company’s competitive position therein, reported premiums to date and the anticipated impact of proposed underwriting changes. The net impact on the results of operations of changes in estimated premiums earned is reduced by the losses and acquisition expenses related to such premiums earned.
Premiums receivable include premiums billed and in the course of collection as well as WBNR. WBNR is the component of premiums receivable that is subject to judgment and uncertainty. Premiums receivable as of December 31, 2006 of $377,183,000 included $315,243,,000 of WBNR that is based upon estimates. The appropriateness of WBNR is evaluated in light of the actual premium reported by the ceding companies and any adjustments to WBNR and EBNR that represent premiums earned are accounted for as changes in estimates and are reflected in results of operations in the period in which they are made. The initial estimates of premiums derived by our underwriting function in respect of the year ended December 31, 2006 were evaluated. The cumulative impact of our evaluation in respect of premiums receivable as of December 31, 2006 was to reduce WBNR by approximately $19,412,000 or 5.1%. For example, WBNR premium receivable in our North American casualty claims-made excess-of-loss reinsurance class was $68,065,000 of the $315,243,000 as of December 31, 2006 and reflects a $5,799,000 reduction from initial premium estimates. We believe that we reasonably could have made an adjustment of between $0 and $5,799,000 with respect to this reinsurance class as of December 31, 2006.
- 47 -
Table of Contents
Had we not made this adjustment, the reinsurance premiums receivable for this class would have been $73,864,000 as of December 31, 2006.
Due to the time lag inherent in the reporting of premiums by ceding companies, a significant portion of amounts included as premiums written and premiums earned represents estimated premiums and are not currently due based on the terms of the underlying contracts. Premiums earned, including EBNR, are a measure of exposure to losses, LAE and acquisition expenses. Consequently, when previous estimates of premiums earned are increased or decreased, the related provisions for losses and LAE and acquisition expenses previously recorded are also adjusted accordingly. An allowance for uncollectible premiums is established for possible non-payment of such amounts due, as deemed necessary. As of December 31, 2006, based on our historical experience, the general profile of our ceding companies and our ability in most cases to contractually offset those premium receivables against losses and LAE or other amounts payable to the same parties, we did not establish an allowance for uncollectible premiums receivable.
Certain of our reinsurance contracts include provisions that adjust premiums or acquisition expenses based upon the loss experience under the contracts. Reinstatement premiums are the premiums charged for the restoration of the reinsurance limit of a reinsurance contract to its full amount, generally coinciding with the payment by the reinsurer of losses. These premiums relate to the future coverage obtained for the remainder of the initial contract term and are earned over the remaining contract term. Additional premiums are those premiums triggered by losses and not related to reinstatement of limits and are immediately earned. Reinstatement premiums and additional premiums are recognized in accordance with the provisions of assumed reinsurance contracts, based on loss experience under such contracts. Any unearned premium existing at the time a contract limit is exhausted is immediately earned.
Unpaid Losses and LAE
One of the most significant estimates made by management in the preparation of our financial statements is the estimation of unpaid losses and LAE, also referred to as “loss reserves.” Unpaid losses and LAE include estimates of the cost of claims that were reported but not yet paid, generally referred to as case reserves, and IBNR. These liabilities are estimates of future amounts required to pay losses and LAE for reinsured claims for which we are liable and that have occurred at or before the balance sheet date. Every quarter, our actuaries prepare estimates of the loss reserves based on established actuarial techniques. Because the ultimate amount of unpaid losses and LAE is uncertain, we believe that the quantitative techniques used to estimate these amounts are enhanced by management’s professional judgment. We review these estimates and determine our best estimate of the liabilities to record in our consolidated financial statements. From time to time we may obtain third party actuarial reviews of a portion or all of our unpaid losses and LAE to assist in the reserve valuation process.
While we commenced operations in 2002, the business written is sufficiently similar to the historical reinsurance business of St. Paul Re such that we use the historical loss experience of this business, which is periodically updated by St. Paul Re, to estimate our initial expected ultimate losses and the expected patterns of reported losses. These patterns can span more than a decade and, given our own limited history, the availability of the St. Paul Re data is a valuable asset.
We do not establish liabilities until the occurrence of an event that may give rise to a loss. When an event of sufficient magnitude occurs, we may establish IBNR specific to such an event. Generally, this is done following a catastrophe that affects many ceding companies. Ultimate losses and LAE are based on management’s judgment and reflect estimates gathered from ceding companies, estimates of insurance industry losses gathered from public sources and estimates derived from catastrophe modeling software.
- 48 -
Table of Contents
Unpaid losses and LAE represent management’s best estimate, at a given point in time, of the ultimate settlement and administration costs of claims incurred, and it is possible that the ultimate liability may materially differ from such estimates. Such estimates are not precise due to the fact that, among other things, they are based on predictions of future developments and estimates of future trends in claim severity and frequency and other factors. Because of the degree of reliance that we necessarily place on ceding companies for claims reporting, the associated time lag, the low frequency/high severity nature of some of the business that we underwrite and the varying reserving practices among ceding companies, our reserve estimates are highly dependent on management judgment and are therefore uncertain. Estimates of unpaid losses and LAE are periodically reviewed and adjusted as new information becomes available. Any such adjustments are accounted for as changes in estimates and are reflected in results of operations in the period in which they are made.
The gross liabilities recorded on our consolidated balance sheets as of December 31, 2006 and 2005 for unpaid losses and LAE were $2,368,482,000 and $2,323,990,000 respectively. The following table sets forth a breakdown between gross case reserves and gross IBNR by segment as of December 31, 2006 and 2005 ($ in thousands):
| Property | ||||||||||||||||
| and Marine | Casualty | Finite Risk | Total | |||||||||||||
| December 31, 2006 | ||||||||||||||||
| Gross case reserves | $ | 336,503 | 269,447 | 113,897 | $ | 719,847 | ||||||||||
| Gross IBNR | 235,932 | 1,198,432 | 214,271 | 1,648,635 | ||||||||||||
| Total gross unpaid losses and LAE | $ | 572,435 | 1,467,879 | 328,168 | $ | 2,368,482 | ||||||||||
| December 31, 2005 | ||||||||||||||||
| Gross case reserves | $ | 292,722 | 152,872 | 66,151 | $ | 511,745 | ||||||||||
| Gross IBNR | 570,783 | 954,444 | 287,018 | 1,812,245 | ||||||||||||
| Total gross unpaid losses and LAE | $ | 863,505 | 1,107,316 | 353,169 | $ | 2,323,990 | ||||||||||
Case reserves are usually based upon claim reports received from ceding companies. The information we receive varies by ceding company and includes paid losses and case reserves and may include an estimated provision for IBNR. Case reserves may be increased or decreased by our claims personnel based on receipt of additional information, including information received from ceding companies. IBNR is based on actuarial methods including the loss ratio method, the Bornhuetter-Ferguson method and the chain ladder method. IBNR related to a specific event may be based on our estimated exposure to an industry loss and may rely on the use of catastrophe modeling software.
Generally, initial actuarial estimates of IBNR not related to a specific event are based on the loss ratio method applied to each Underwriting Year for each class of business. Actual paid losses and case reserves, generally referred to collectively as reported losses, are subtracted from expected ultimate losses to determine IBNR. The initial expected ultimate losses involve management judgment and are based on: (i) contract by contract expected loss ratios developed during our pricing process, and (ii) our historical loss ratios and those of St. Paul Re adjusted for rate changes and trends. These judgments take into account management’s view of past, current and future: (i) market conditions, (ii) changes in the business underwritten, (iii) changes in timing of the emergence of claims and (iv) other factors that may influence expected ultimate losses.
Over time, as a greater number of claims are reported, actuarial estimates of IBNR are based on the Bornhuetter-Ferguson and the chain ladder techniques. The Bornhuetter-Ferguson technique utilizes
- 49 -
Table of Contents
actual reported losses and expected patterns of reported losses, taking the initial expected ultimate losses into account to determine an estimate of expected ultimate losses. This technique is most appropriate when there are few reported claims and a relatively less stable pattern of reported losses. The chain ladder technique utilizes actual reported losses and expected patterns of reported losses to determine an estimate of expected ultimate losses that is independent of the initial expected ultimate losses. This technique is most appropriate when there are a large number of reported losses with significant statistical credibility and a relatively stable pattern of reported losses.
When estimating unpaid losses and LAE, we segregate the business of each of our reinsurance subsidiaries into classes by type of coverage and type of contract (approximately 90 classes). Within each class the business is further segregated by Underwriting Year, starting with 2002.
Multiple point estimates using a variety of actuarial techniques are calculated for many, but not all, of our 90 classes of coverage for each Underwriting Year. We do not believe that these multiple point estimates are or should be considered a range. Our actuaries consider each class and determine the most appropriate point estimate based on the characteristics of the particular class and other relevant factors such as historical ultimate loss ratios, the presence of individual large losses and known occurrences that have not yet resulted in reported losses. For some classes of business our actuaries believe that a review of individual contract information improves the loss reserve estimate. For example, individual contract review is particularly important for the Finite Risk segment and the accident and health class within the Casualty segment. Our actuaries make their determinations of the most appropriate point estimate of loss for each class. This information is aggregated and reviewed and approved by management and is included in the liability for unpaid losses and LAE.
Generally, North American casualty excess business has the longest pattern of reported losses and, therefore, loss estimates have a higher degree of uncertainty than other reinsurance classes. IBNR for these classes as of December 31, 2006 was $929,671,000, which was 57% of the total IBNR at that date. Because estimates of unpaid losses and LAE related to North American casualty excess business have a higher degree of uncertainty, we would not consider a variance of five percentage points from the initial expected loss ratio to be unusual. As an example, a change in the initial expected loss ratio from 66% to 71% would result in an increase of the IBNR for these classes by $88,135,000. This equates to approximately 8% of the liability for total unpaid losses and LAE for these classes as of December 31, 2006. As another example, if the estimated pattern of reported losses was accelerated by 5% the IBNR for these classes would decrease by $4,904,000, which is less than 1%. We have selected these two inputs as examples of sensitivity analyses because we believe that the two most important inputs to the reserve estimation methodologies described above are the initial expected loss ratio and the estimated pattern of reported losses.
The pattern of reported losses is determined utilizing actuarial analysis, including management’s judgment, and is based on historical patterns of paid losses and reporting of case reserves to us, as well as industry patterns. Information that may cause historical patterns to differ from future patterns is considered and reflected in expected patterns as appropriate. For property and health coverages these patterns indicate that a substantial portion of the ultimate losses are reported within 2 to 3 years after the contract is effective. Casualty patterns can vary from 3 years to over 20 years depending on the type of business.
In property classes, there can be additional uncertainty in loss estimation related to large catastrophe events. With wind events, such as hurricanes, the damage assessment process may take more than a year. The cost of rebuilding is subject to increase due to supply shortages for construction materials and labor. In the case of earthquakes, the damage assessment process may take several years as
- 50 -
Table of Contents
buildings are discovered to have structural weaknesses not initially detected. The uncertainty inherent in loss estimation is particularly pronounced for casualty coverages, such as umbrella liability, general and product liability, professional liability and automobile liability, where information, such as required medical treatment and costs for bodily injury claims, emerges over time. In the overall loss reserving process, provisions for economic inflation and changes in the social and legal environment are considered.
Loss reserve calculations for primary insurance business are not precise in that they deal with the inherent uncertainty of future developments. Primary insurers must estimate their own losses, often based on incomplete and changing information. Reserving for reinsurance business introduces further uncertainties compared with reserving for primary insurance business. The uncertainty in the reserving process for reinsurers is due, in part, to the time lags inherent in reporting from the original claimant to the primary insurer and then to the reinsurer. As a predominantly broker market reinsurer for both excess-of-loss and proportional contracts, we are subject to a potential additional time lag in the receipt of information as the primary insurer reports to the broker who in turn reports to us. As of December 31, 2006, we did not have any significant back-log related to our processing of assumed reinsurance information.
Since we rely on information regarding paid losses, case reserves and IBNR provided by ceding companies in order to assist us in estimating our liability for unpaid losses and LAE, we maintain certain procedures in order to help determine the completeness and accuracy of such information. Periodically, management assesses the reporting activities of these companies on the basis of qualitative and quantitative criteria. In addition to conferring with ceding companies or brokers on claims matters, our claims personnel conduct periodic audits of specific claims and the overall claims procedures of our ceding companies at their offices. We rely on our ability to effectively monitor the claims handling and claims reserving practices of ceding companies in order to help establish the proper reinsurance premium for reinsurance agreements and to establish proper loss reserves. Disputes with ceding companies have been rare and generally have been resolved through negotiation.
In addition to the inherent uncertainty of estimating unpaid losses and LAE, our estimates with respect to the 2005 Hurricanes are subject to an unusually high level of uncertainty arising out of complex and unique causation and coverage issues associated with the attribution of losses to wind or flood damage or other perils such as fire, business interruption or riot and civil commotion. For example, the underlying policies generally do not cover flood damage; however, water damage caused by wind may be covered. Our actual losses from the 2005 Hurricanes may exceed our estimates as a result of, among other things, the attribution of losses to coverages that for the purpose of our estimates we assumed would not be exposed, which may be affected by class action lawsuits or state regulatory actions. We expect that these issues will not be resolved for a considerable period of time and may be influenced by evolving legal and regulatory developments.
Valuation of Investments
Fixed maturity securities for which we may not have the positive intent to hold until maturity are classified as available-for-sale and reported at fair value, with unrealized gains and losses excluded from net income and reported in other comprehensive income as a separate component of shareholders’ equity, net of deferred taxes. Fixed maturity securities for which we have the intent to sell prior to maturity are classified as trading securities and reported at fair value, with unrealized gains and losses included in other income and the related deferred income tax included in income tax expense.
- 51 -
Table of Contents
We routinely review our investments to determine whether unrealized losses represent temporary changes in fair value or are the result of “other-than-temporary impairments.” The process of determining whether a security is other than temporarily impaired is subjective and involves analyzing many factors. These factors include, but are not limited to, the overall financial condition of the issuer, the duration and magnitude of an unrealized loss, specific credit events and our ability and intent to hold a security for a sufficient period of time for the value to recover the unrealized loss. If we determine that an unrealized loss on a security is other than temporary, we write down the carrying value of the security to its current fair value and record a realized loss in the consolidated statement of operations. During 2006, based on a definitive agreement to sell our other invested asset, we wrote down the carrying value of the investment and recorded a realized loss of $255,000. During 2005, as a result of the routine evaluation of investments, we wrote down the carrying value of the same other invested asset to its estimated net realizable value and recorded a realized loss of $1,769,000.
Risk Transfer
Reinsurance accounting is followed for assumed and ceded transactions when risk transfer requirements have been met. Risk transfer analysis evaluates significant assumptions relating to the amount and timing of expected cash flows, as well as the interpretation of underlying contract terms.
Reinsurance contracts that do not transfer sufficient insurance risk are accounted for as reinsurance deposit liabilities with interest expense charged to other income and credited to the liability.
Reinsurance Industry Conditions and Trends
The reinsurance industry historically has been cyclical, characterized by periods of price competition due to excessive underwriting capacity as well as periods of favorable pricing due to shortages of underwriting capacity. Cyclical trends in the industry and the industry’s profitability can also be significantly affected by volatile developments, including natural and other catastrophes, such as hurricanes, windstorms, earthquakes, floods, fires, explosions and terrorist attacks, the frequency and severity of which are inherently difficult to predict. Property and casualty reinsurance rates often rise in the aftermath of significant catastrophe losses. To the extent that actual claim liabilities are higher than anticipated, the industry’s capacity to write new business diminishes. The industry is also affected by changes in the propensity of courts to expand insurance coverage and grant large liability awards, as well as fluctuations in interest rates, inflation and other changes in the economic environment that affect market prices of investments.
In 2005 an unprecedented level of hurricane losses caused many reinsurers to report significant net losses. Many reinsurers were able to raise additional capital in the third and fourth quarters of 2005 and a number of new reinsurers were formed. Nonetheless, the magnitude of the hurricane losses caused rating agencies to tighten capital requirements and both reinsurers and their insurance company clients to reassess their catastrophe pricing and aggregate loss monitoring parameters and procedures. The result has been an increase in catastrophe pricing, particularly for wind exposures in the U.S. The impact on non-catastrophe pricing has been to mitigate the trend towards rate weakening with many markets experiencing an environment of little or no rate change. We believe that current rates should provide adequate returns.
- 52 -
Table of Contents
Results of Operations
Year Ended December 31, 2006 as Compared with the Year Ended December 31, 2005
Net income (loss) for the years ended December 31, 2006 and 2005 was as follows ($ in thousands):
| 2006 | 2005 | Increase | ||||||||||
| Net income (loss) | $ | 329,657 | (137,487 | ) | $ | 467,144 | ||||||
The most significant factor in the comparison of net income in 2006 with the net loss in 2005 was the difference in underwriting income in 2006 as compared with 2005. Underwriting income, which consists of net premiums earned, less losses and LAE, acquisition expenses and operating expenses related to the reinsurance company subsidiaries, was $218,880,000 in 2006 and was favorably impacted by a low level of major catastrophes. In 2005 we incurred an underwriting loss of $249,506,000 primarily resulting from losses arising out of the 2005 Hurricanes that caused severe damage in the Gulf Coast region of the United States, including the states of Louisiana, Mississippi, Texas and Florida as well as in Mexico and the Caribbean. As a result of losses from the 2005 Hurricanes, certain reinsurance contracts generated additional premiums and adjustments to accrued profit commissions. The aggregate net adverse impact on our net loss for the year ended December 31, 2005 from the 2005 Hurricanes is summarized as follows ($ in thousands):
| Gross losses and LAE | $ | 654,090 | ||
| Retrocessional reinsurance | (73,800 | ) | ||
| Net losses and LAE | 580,290 | |||
| Additional net premiums earned | (46,666 | ) | ||
| Profit commissions | (3,654 | ) | ||
| Net adverse impact on income before income taxes | $ | 529,970 | ||
Net favorable development, which includes the development of prior years’ unpaid losses and LAE and the related impact on premiums and commissions, also contributed to underwriting income. Net favorable development was $55,768,000 in 2006 as compared with $79,256,000 in 2005. The net favorable development in 2006 includes $4,160,000 of net unfavorable development from the 2005 Hurricanes. In addition to the increase in underwriting income, net income in 2006 as compared with the net loss in 2005 was also favorably impacted by an increase in investment income of $58,542,000 and unfavorably impacted by increases in operating expenses related to Platinum Holdings and operating expenses not allocated to segments of $10,036,000 and income tax expense of $55,134,000 in 2006.
Gross, ceded and net premiums written and earned for the years ended December 31, 2006 and 2005 were as follows ($ in thousands):
| Increase | ||||||||||||
| 2006 | 2005 | (decrease) | ||||||||||
| Gross premiums written | $ | 1,275,200 | 1,765,155 | $ | (489,955 | ) | ||||||
| Ceded premiums written | 98,587 | 47,433 | 51,154 | |||||||||
| Net premiums written | 1,176,613 | 1,717,722 | (541,109 | ) | ||||||||
- 53 -
Table of Contents
| Increase | ||||||||||||
| 2006 | 2005 | (decrease) | ||||||||||
| Gross premiums earned | 1,434,282 | 1,757,138 | (322,856 | ) | ||||||||
| Ceded premiums earned | 97,581 | 42,415 | 55,166 | |||||||||
| Net premiums earned | $ | 1,336,701 | 1,714,723 | $ | (378,022 | ) | ||||||
The decrease in net premiums written and earned in 2006 as compared with 2005 was attributable to reductions in business written in all three of our segments. These reductions were partially offset by increases in estimates of net written premiums of approximately $68,937,000 in the North American excess casualty classes related to business written in prior periods. We also commenced ceding premiums under a quota share retrocession agreement effective January 1, 2006 (the “Property Quota Share Agreement”) under which Platinum US and Platinum UK ceded 30% of their new and renewal property catastrophe business effective on or after January 1, 2006 to a non-affiliated reinsurer. The decrease in net premiums written and earned in 2006 is also partially due to additional net premiums written and earned in 2005 of approximately $49,451,000 and $46,666,000, respectively, related to losses arising from the 2005 Hurricanes. The reduction in net premiums earned was also affected by changes in the mix of business and the structure of the underlying reinsurance contracts.
Net investment income for the years ended December 31, 2006 and 2005 was $187,987,000 and $129,445,000, respectively. Net investment income increased during 2006 primarily due to increased invested assets attributable to positive cash flow from operations, excluding trading securities activities, which was $525,025,000 in 2006 as well as proceeds from the issuance of common and preferred shares and debt obligations in 2005. The book basis yields on fixed maturity securities were 4.6% and 4.4% as of December 31, 2006 and 2005, respectively. Net investment income included $7,998,000 and $8,172,000 of interest earned on funds held for the years ended December 31, 2006 and 2005, respectively. Net realized gains (losses) on investments were $1,090,000 and ($3,046,000) for the years ended December 31, 2006 and 2005, respectively. Net realized losses in 2006 and 2005 included $255,000 and $1,769,000, respectively, relating to the write-down of our investment in Inter-Ocean Holdings, Ltd. The remaining net realized gains and losses on investments in 2006 and 2005 primarily result from our efforts to manage credit quality, duration, foreign currency exposure, investment sector allocation as well as to balance our investment risk and reinsurance risk.
Other income (expense) for the years ended December 31, 2006 and 2005 was ($2,872,000) and ($586,000), respectively. Other expense in 2006 included ($2,221,000) of net unrealized losses relating to changes in fair value of fixed maturity securities classified as trading and ($706,000) of net expense on reinsurance contracts accounted for as deposits. Other expense in 2005 included ($102,000) of net unrealized losses relating to changes in fair value of fixed maturity securities classified as trading and ($53,000) of net expense on reinsurance contracts accounted for as deposits.
Net losses and LAE and the resulting loss and LAE ratios for the years ended December 31, 2006 and 2005 were as follows ($ in thousands):
| 2006 | 2005 | Decrease | ||||||||||
| Net losses and LAE | $ | 760,602 | 1,505,425 | $ | (744,823 | ) | ||||||
| Net loss and LAE ratios | 56.9 | % | 87.8 | % | (30.9) points | |||||||
- 54 -
Table of Contents
The decreases in net losses and LAE and the resulting net loss and LAE ratio in 2006 as compared with 2005 were primarily due to the significant difference in major catastrophe losses. Major catastrophe losses were $5,500,000 representing 0.4% of net premiums earned in 2006 as compared with $604,890,000 representing 35.3% of net premiums earned in 2005. Included in the major catastrophe losses in 2005 were $580,290,000 from the 2005 Hurricanes representing 33.8% of net premiums earned. Net losses and LAE and the resulting net loss and LAE ratios were also impacted by net favorable loss development of $60,746,000, representing 4.5% of net premiums earned in 2006 and $97,314,000, representing 5.7% of net premiums earned in 2005. The net favorable loss development in 2006 included net unfavorable loss development on the 2005 Hurricanes of $3,596,000.
Exclusive of the effects of the catastrophe losses, including additional premiums generated by such catastrophe losses, and net favorable loss development, the net loss and LAE ratio in 2006 increased by approximately 1% as compared 2005. The increase is attributable to higher loss ratios in the Casualty segment reflecting decreases in price adequacy. The decrease in net premiums earned also contributed to the decrease in losses and LAE in 2006. Some of the most significant decreases in net premiums earned have been in the finite casualty, crop, trade credit and accident and health classes, which have loss ratios higher than our overall book of business. The net loss and LAE ratios were also affected by changes in the mix of business.
Net acquisition expenses and resulting net acquisition expense ratios for the years ended December 31, 2006 and 2005 were as follows ($ in thousands):
| 2006 | 2005 | Decrease | ||||||||||
| Net acquisition expenses | $ | 285,923 | 403,135 | $ | (117,212 | ) | ||||||
| Net acquisition expense ratios | 21.4 | % | 23.5 | % | (2.1) points | |||||||
The decrease in net acquisition expenses was primarily due to the decrease in net premiums earned in 2006 as compared with 2005. The decrease in the acquisition expense ratio in 2006 as compared with 2005 was partially due to the decrease in assumed quota share contracts in the Property and Marine and Finite Risk segments that had higher ceding commissions than the remaining business. Net acquisition expenses also included increases in adjustable commissions of approximately $2,285,000 in 2006 relating to prior years’ loss development, representing 0.2% of net premiums earned as compared with $15,790,000, representing 0.9% of net premiums earned in 2005. Also contributing to the decrease in the acquisition expense ratio in 2006 as compared with 2005 was a ceding commission and override on the Property Quota Share Agreement.
Operating expenses for the years ended December 31, 2006 and 2005 were $95,490,000 and $69,827,000, respectively. Operating expenses include costs such as salaries, rent and like items related to reinsurance operations as well as costs associated with Platinum Holdings. The increase in operating expenses was primarily due to increased incentive-based compensation accruals. In 2006, operating expenses included approximately $17,000,000 of accruals for incentive-based compensation as compared with $1,000,000 in 2005. The increase in incentive-based compensation was the result of the significant increase in net income. The remainder of the increase in operating expenses is primarily due to the expansion of operations in Bermuda, including Platinum Bermuda which has increased its underwriting activity and increased its staff accordingly. The increase is also partially attributable to costs related to equity grants under long term performance based incentive plans.
Net foreign currency exchange gains (losses) for the years ended December 31, 2006 and 2005 were $738,000 and ($2,111,000), respectively. We routinely transact business in various foreign
- 55 -
Table of Contents
currencies. Foreign currency exchange gains and losses result from the re-valuation into U.S. dollars of assets and liabilities denominated in foreign currencies. We periodically monitor our largest foreign currency exposures and purchase or sell foreign currency denominated invested assets to match these exposures. Net foreign currency exchange gains and losses arise as a result of fluctuations in the amounts of assets and liabilities denominated in foreign currencies as well as fluctuations in the currency exchange rates.
Interest expense for the years ended December 31, 2006 and 2005 was $21,805,000 and $20,006,000, respectively, and includes interest related to our Equity Security Units (“ESU’s”) as well as interest on other debt obligations. The increase in 2006 as compared with 2005 was due to the increase in average outstanding debt during the comparable periods. Interest expense in 2006 includes interest on $250,000,000 of Series B 7.5% Notes due June 1, 2017 (the “Series B Notes”) as well as interest on the remaining balance of $42,840,000 of the Series B 6.371% Remarketed Senior Guaranteed Notes due November 16, 2007 (the “Remarketed Notes”). The Series B Notes were originally issued as Series A and then subsequently exchanged for Series B Notes that have substantially the same terms and which were registered under the Securities Act. Interest expense in 2005 includes interest on the Series B Notes from issuance in May 2005 and interest on $137,500,000 of the Remarketed Notes at 5.25% per annum until remarketed in August 2005 at 6.371% per annum. The Remarketed Notes were then partially repurchased in December 2005. As a result of a repurchase of $94,660,000 of the Remarketed Notes in December 2005, we incurred a loss on repurchase of debt of $2,486,000. This includes a premium paid to the debt holders of $1,644,000, and related unamortized debt issuance costs, dealer/manager fees, and professional fees and expenses of $842,000.
Income taxes (benefit) and the effective tax rate for the years ended December 31, 2006 and 2005 were as follows ($ in thousands):
| Increase | ||||||||||||
| 2006 | 2005 | (decrease) | ||||||||||
| Income taxes (benefit) | $ | 30,167 | (24,967 | ) | $ | 55,134 | ||||||
| Effective tax rates | 8.4 | % | 15.4 | % | (7.0) points | |||||||
The increase in income tax expense in 2006 as compared with the income tax benefit in 2005 was primarily due to net income in 2006 as compared with a net loss in 2005. The effective tax rate in any given year is based on income before tax expense of our subsidiaries that operate in several jurisdictions with varying corporate income tax rates. Platinum Holdings and Platinum Bermuda are not subject to corporate income tax. The decrease in the effective tax rate was due to several factors. A higher percentage of income before income taxes was generated by Platinum Holdings and Platinum Bermuda in 2006, which are not subject to corporate income tax. In 2006, the combined income before income taxes derived from Platinum Holdings and Platinum Bermuda was approximately 73% of the total income before income tax expense as compared with approximately 45% of the loss before income tax benefit in 2005. Additionally, in 2005, $6,500,000 of income tax was incurred as a result the transfer from Platinum Finance to Platinum Holdings of a portion of the proceeds from the issuance of debt obligations in May 2005. This transfer was considered to be a taxable distribution under U.S. tax law and, accordingly, subject to U.S. withholding tax.
- 56 -
Table of Contents
Year Ended December 31, 2005 as Compared with the Year Ended December 31, 2004
Net income (loss) for the years ended December 31, 2005 and 2004 was as follows ($ in thousands):
| 2005 | 2004 | Decrease | ||||||||||
| Net income (loss) | $ | (137,487 | ) | 84,783 | $ | (222,270 | ) | |||||
The net loss in 2005 was primarily due to losses arising from the 2005 Hurricanes. In 2004, four significant named hurricanes, Charley, Frances, Ivan and Jeanne (the “2004 Hurricanes”), caused severe damage in the Caribbean and the southeastern United States, principally Florida. As a result of losses arising from these catastrophic events, certain reinsurance contracts generated additional premiums and adjustments to accrued profit commissions. The aggregate net adverse impact on our net income (loss) for the years ended December 31, 2005 and 2004 from the above mentioned hurricanes is summarized as follows ($ in thousands):
| 2005 | 2004 | |||||||
| Gross losses and LAE | $ | 654,090 | $ | 230,475 | ||||
| Retrocessional reinsurance | (73,800 | ) | — | |||||
| Net losses and LAE | 580,290 | 230,475 | ||||||
| Additional net premiums earned | (46,666 | ) | (29,265 | ) | ||||
| Profit commissions | (3,654 | ) | (10,243 | ) | ||||
| Net adverse impact on underwriting results | $ | 529,970 | $ | 190,967 | ||||
The net unfavorable impact on income before income taxes in 2006 from changes in estimates of the 2005 Hurricanes was $4,160,000. The effect on income before income taxes of net development of the 2004 Hurricanes was immaterial in 2005 and 2006.
The most significant factor in the comparison of net loss in 2005 with the net income in 2004 was the difference in underwriting income in 2005 as compared with 2004. Underwriting income decreased by $296,679,000 in 2005 as compared with 2004 and was primarily due to significantly greater losses arising from the 2005 Hurricanes than the 2004 Hurricanes. The hurricane losses in both 2005 and 2004 were partially offset by growth of profitable business in the Casualty segment and net favorable development. Net favorable development includes the development of prior years’ unpaid losses and LAE and the related impact on premiums and commissions. Net favorable development was $79,256,000 and $55,520,000 in 2005 and 2004, respectively. The net loss in 2005 as compared with net income in 2004 was also favorably impacted by an increase in net investment income of $44,913,000 and a decrease in income tax expense of $55,316,000, partially offset by an increase in operating expenses of $3,494,000 and loss on repurchase of debt of $2,486,000.
Gross, ceded and net premiums written and earned for the years ended December 31, 2005 and 2004 were as follows ($ in thousands):
| 2005 | 2004 | Increase | ||||||||||
| Gross premiums written | $ | 1,765,155 | 1,659,790 | $ | 105,365 | |||||||
| Ceded premiums written | 47,433 | 13,777 | 33,656 | |||||||||
| Net premiums written | 1,717,722 | 1,646,013 | 71,709 | |||||||||
- 57 -
Table of Contents
| 2005 | 2004 | Increase | ||||||||||
| Gross premiums earned | 1,757,138 | 1,465,058 | 292,080 | |||||||||
| Ceded premiums earned | 42,415 | 17,123 | 25,292 | |||||||||
| Net premiums earned | $ | 1,714,723 | 1,447,935 | $ | 266,788 | |||||||
The increase in net premiums written in 2005 as compared with 2004 was attributable to growth in Property and Marine and Casualty segments offset by a decline in the Finite Risk segment. Net premiums written and earned in 2005 included approximately $49,451,000 and $46,666,000, respectively, of additional premiums related to losses arising from the 2005 Hurricanes. Net premiums written and earned in 2004 included approximately $29,265,000 of additional premiums related to losses arising from the 2004 Hurricanes. Net premiums written and earned in 2005 also included $2,268,000 of net additional premiums relating loss development of prior years. There were no significant premium adjustments relating to loss development in 2004. The remaining increase in net premiums earned was related to the growth in current and prior periods’ net premiums written and was also affected by changes in the mix of business and the structure of the underlying reinsurance contracts.
Net investment income for the years ended December 31, 2005 and 2004 was $129,445,000 and $84,532,000, respectively. Net investment income increased during 2005 primarily due to increased invested assets attributable to positive cash flow from operations, excluding trading securities activities, which was $618,909,000 and $698,223,000 in 2005 and 2004, respectively. Also contributing to the increase in invested assets in 2005 were the net proceeds from the issuances of: debt of $246,900,000, preferred shares of $168,162,000 and common shares of $426,293,000. The book basis yields on fixed maturity securities were 4.4% and 4.3% as of December 31, 2005 and 2004, respectively. Net investment income included $8,172,000 and $2,651,000 of interest earned on funds held for the years ended December 31, 2005 and 2004, respectively. Net realized gains (losses) on investments were ($3,046,000) and $1,955,000 for the years ended December 31, 2005 and 2004, respectively. Net realized losses in 2005 included $1,769,000 relating to the write-down of our investment in Inter-Ocean Holdings, Ltd. The remaining net realized gains and losses on investments in 2005 and 2004 primarily result from our efforts to manage credit quality, duration, foreign currency exposure, investment sector allocation as well as to balance our investment risk and reinsurance risk.
Other income (expense) for the years ended December 31, 2005 and 2004 was ($586,000) and $3,211,000, respectively. Other expense in 2005 included ($102,000) of net unrealized losses relating to changes in fair value of fixed maturity securities classified as trading, and ($53,000) of net expense on reinsurance contracts accounted for as deposits. Other income in 2004 included $1,036,000 of net unrealized gains relating to changes in fair value of fixed maturity securities classified as trading, $758,000 of earnings on reinsurance contracts accounted for as deposits and a gain of $1,000,000 on the sale of assets.
Net losses and LAE and the resulting loss and LAE ratios for the years ended December 31, 2005 and 2004 were as follows ($ in thousands):
| 2005 | 2004 | Increase | ||||||||||
| Net losses and LAE | $ | 1,505,425 | 1,019,804 | $ | 485,621 | |||||||
| Net loss and LAE ratios | 87.8 | % | 70.4 | % | 17.4 points | |||||||
- 58 -
Table of Contents
The increase in net losses and LAE in 2005 as compared with 2004 was primarily the result of more significant losses arising from the 2005 Hurricanes than from the 2004 Hurricanes. Net losses and LAE from the 2005 Hurricanes were $349,815,000 more than the net losses and LAE from the 2004 Hurricanes. The increase in net losses and LAE was also due to the growth in business in the Property and Marine and Casualty segments. The increase in the loss ratio in 2005 from 2004 was due primarily to losses from the 2005 Hurricanes that represented 33.8% of net premiums earned in 2005 as compared with losses from the 2004 Hurricanes that represented 15.9% of net premiums earned in 2004. Losses from major catastrophes in 2005 other than the 2005 Hurricanes were approximately $24,600,000 or 1.4% of net premiums earned. There were no significant catastrophe losses in 2004 other than from the 2004 Hurricanes. The net losses and LAE from the hurricanes in 2005 and 2004 were partially offset by net favorable loss development of $97,314,000, representing 5.7% of net premiums earned in 2005 and $57,151,000, representing 3.9% of net premiums earned in 2004.
Net acquisition expenses and resulting net acquisition expense ratios for the years ended December 31, 2005 and 2004 were as follows ($ in thousands):
| 2005 | 2004 | Increase | ||||||||||
| Net acquisition expenses | $ | 403,135 | 327,821 | $ | 75,314 | |||||||
| Net acquisition expense ratios | 23.5 | % | 22.6 | % | 0.9 points | |||||||
The increase in net acquisition expenses in 2005 as compared with 2004 was consistent with the growth in business in the Property and Marine and Casualty segments. Contributing to the increase in the net acquisition expense ratio in 2005 as compared with 2004 were greater reductions of profit commissions under reinsurance contracts that incurred losses from the 2004 Hurricanes as compared with similar reductions of profit commissions in 2005 relating to the 2005 Hurricanes. Profit commission reductions relating to the 2005 Hurricanes were $3,654,000 representing 0.2% of net premiums earned as compared with profit commission reductions relating to the 2004 Hurricanes of $10,243,000 representing 0.7% of net premiums earned. Net acquisition expenses also included increases in adjustable commissions of approximately $15,790,000 in 2005 relating to prior years’ loss development, representing 0.9% of net premiums earned as compared with increases of $1,631,000 of adjustable commissions in 2004, representing 0.1% of net premiums earned. The net acquisition expense ratios in 2005 and 2004 were also affected by changes in the mix of business.
Operating expenses for the years ended December 31, 2005 and 2004 were $69,827,000 and $66,333,000, respectively. Operating expenses include costs such as salaries, rent and like items related to reinsurance operations as well as costs associated with Platinum Holdings. The increase of $3,494,000 in operating expenses in 2005 as compared with 2004 was attributable to increased compensation costs.
Net foreign currency exchange gains (losses) for the years ended December 31, 2005 and 2004 were ($2,111,000) and $725,000, respectively. We routinely do business in various foreign currencies. Foreign currency exchange gains and losses result from the re-valuation into U.S. dollars of assets and liabilities denominated in foreign currencies. We periodically monitor our largest foreign currency exposures and purchase or sell foreign currency denominated invested assets to match these exposures. Net foreign currency exchange gains and losses arise as a result of fluctuations in the amounts of assets and liabilities denominated in foreign currencies as well as fluctuations in the currency exchange rates.
Interest expense for the years ended December 31, 2005 and 2004 was $20,006,000 and $9,268,000, respectively, and included interest related to the ESU’s as well as interest on debt obligations. The increase in 2005 as compared with 2004 was primarily due to interest on the Series B Notes issued in
- 59 -
Table of Contents
May 2005. In December 2005, we repurchased $94,660,000 of the Remarketed Notes and incurred a loss on repurchase of debt of $2,486,000.
Income taxes (benefit) and the effective tax rate for the years ended December 31, 2005 and 2004 were as follows ($ in thousands):
| 2005 | 2004 | Decrease | ||||||||||
| Income tax expense (benefit) | $ | (24,967 | ) | 30,349 | $ | (55,316 | ) | |||||
| Effective tax rates | 15.4 | % | 26.4 | % | (11.0) points | |||||||
The income tax benefit in 2005 as compared with income tax expense in 2004 was due to the loss before income tax benefit in 2005. In 2005, approximately 45.0% of the loss before income tax benefit was derived from Platinum Holdings and Platinum Bermuda. In 2004, approximately 16.9% of the income before income tax expense was derived from Platinum Holdings and Platinum Bermuda. Additionally, we incurred approximately $6,500,000 of income tax expense in 2005 associated with the transfer from Platinum Finance to Platinum Holdings of a portion of the proceeds from the issuance of debt obligations in May 2005. This transaction was deemed to be a taxable distribution under U.S. tax law and subject to U.S. withholding tax.
Segment Information
We conduct our worldwide reinsurance business through three operating segments: Property and Marine, Casualty and Finite Risk. In managing our operating segments, management uses measures such as underwriting income and underwriting ratios to evaluate segment performance. We do not allocate assets or certain income and expenses such as investment income, interest expense and certain corporate expenses by segment. Segment underwriting income is reconciled to income before income taxes. The measures we used in evaluating our operating segments should not be used as a substitute for measures determined under U.S. GAAP. The following table summarizes underwriting activity and ratios for the three operating segments for the years ended December 31, 2006, 2005 and 2004 ($ in thousands):
- 60 -
Table of Contents
| Property | ||||||||||||||||
| and Marine | Casualty | Finite Risk | Total | |||||||||||||
| Year ended December 31, 2006: | ||||||||||||||||
| Net premiums written | $ | 424,929 | 757,675 | (5,991 | ) | $ | 1,176,613 | |||||||||
| Net premiums earned | 448,959 | 764,341 | 123,401 | 1,336,701 | ||||||||||||
| Net losses and LAE | 145,900 | 522,815 | 91,887 | 760,602 | ||||||||||||
| Net acquisition expenses | 70,905 | 188,717 | 26,301 | 285,923 | ||||||||||||
| Other underwriting expenses | 39,887 | 27,022 | 4,387 | 71,296 | ||||||||||||
| Segment underwriting income | $ | 192,267 | 25,787 | 826 | 218,880 | |||||||||||
| Net investment income | 187,987 | |||||||||||||||
| Net realized gains on investments | 1,090 | |||||||||||||||
| Net foreign currency exchange gains | 738 | |||||||||||||||
| Other expense | (2,872 | ) | ||||||||||||||
| Corporate expenses not allocated to segments | (24,194 | ) | ||||||||||||||
| Interest expense | (21,805 | ) | ||||||||||||||
| Income before income tax expense | $ | 359,824 | ||||||||||||||
| Ratios: | ||||||||||||||||
| Net loss and LAE | 32.5 | % | 68.4 | % | 74.5 | % | 56.9 | % | ||||||||
| Net acquisition expense | 15.8 | % | 24.7 | % | 21.3 | % | 21.4 | % | ||||||||
| Other underwriting expense | 8.9 | % | 3.5 | % | 3.6 | % | 5.3 | % | ||||||||
| Combined | 57.2 | % | 96.6 | % | 99.4 | % | 83.6 | % | ||||||||
| Year ended December 31, 2005: | ||||||||||||||||
| Net premiums written | $ | 575,055 | 809,031 | 333,636 | $ | 1,717,722 | ||||||||||
| Net premiums earned | 569,173 | 789,629 | 355,921 | 1,714,723 | ||||||||||||
| Net losses and LAE | 756,742 | 511,609 | 237,074 | 1,505,425 | ||||||||||||
| Net acquisition expenses | 93,983 | 194,397 | 114,755 | 403,135 | ||||||||||||
| Other underwriting expenses | 26,074 | 24,690 | 4,905 | 55,669 | ||||||||||||
| Segment underwriting income (loss) | $ | (307,626 | ) | 58,933 | (813 | ) | (249,506 | ) | ||||||||
| Net investment income | 129,445 | |||||||||||||||
| Net realized losses on investments | (3,046 | ) | ||||||||||||||
| Net foreign currency exchange losses | (2,111 | ) | ||||||||||||||
| Other expense | (586 | ) | ||||||||||||||
| Corporate expenses not allocated to segments | (14,158 | ) | ||||||||||||||
| Interest expense | (20,006 | ) | ||||||||||||||
| Loss on repurchase of debt | (2,486 | ) | ||||||||||||||
| Loss before income tax benefit | $ | (162,454 | ) | |||||||||||||
- 61 -
Table of Contents
| Property | ||||||||||||||||
| and Marine | Casualty | Finite Risk | Total | |||||||||||||
| Ratios: | ||||||||||||||||
| Net loss and LAE | 133.0 | % | 64.8 | % | 66.6 | % | 87.8 | % | ||||||||
| Net acquisition expense | 16.5 | % | 24.6 | % | 32.2 | % | 23.5 | % | ||||||||
| Other underwriting expense | 4.6 | % | 3.1 | % | 1.4 | % | 3.2 | % | ||||||||
| Combined | 154.1 | % | 92.5 | % | 100.2 | % | 114.5 | % | ||||||||
| Year ended December 31, 2004 | ||||||||||||||||
| Net premiums written | $ | 504,439 | 677,399 | 464,175 | $ | 1,646,013 | ||||||||||
| Net premiums earned | 485,135 | 611,893 | 350,907 | 1,447,935 | ||||||||||||
| Net losses and LAE | 349,557 | 418,355 | 251,892 | 1,019,804 | ||||||||||||
| Net acquisition expenses | 76,360 | 151,649 | 99,812 | 327,821 | ||||||||||||
| Other underwriting expenses | 27,827 | 19,086 | 6,224 | 53,137 | ||||||||||||
| Segment underwriting income | $ | 31,391 | 22,803 | (7,021 | ) | 47,173 | ||||||||||
| Net investment income | 84,532 | |||||||||||||||
| Net realized gains on investments | 1,955 | |||||||||||||||
| Net foreign currency exchange gains | 725 | |||||||||||||||
| Other income | 3,211 | |||||||||||||||
| Corporate expenses not allocated to segments | (13,196 | ) | ||||||||||||||
| Interest expense | (9,268 | ) | ||||||||||||||
| Income before income tax expense | $ | 115,132 | ||||||||||||||
| Ratios: | ||||||||||||||||
| Net loss and LAE | 72.1 | % | 68.4 | % | 71.8 | % | 70.4 | % | ||||||||
| Net acquisition expense | 15.7 | % | 24.8 | % | 28.4 | % | 22.6 | % | ||||||||
| Other underwriting expense | 5.7 | % | 3.1 | % | 1.8 | % | 3.7 | % | ||||||||
| Combined | 93.5 | % | 96.3 | % | 102.0 | % | 96.7 | % | ||||||||
Property and Marine
The Property and Marine operating segment includes principally property (including crop), marine, aviation and aerospace reinsurance coverages that are written in the United States and international markets. This business includes catastrophe excess-of-loss treaties, per-risk excess-of-loss treaties and proportional treaties. This operating segment generated 36.1%, 33.5% and 30.6% of our net premiums written in 2006, 2005 and 2004, respectively.
Year Ended December 31, 2006 as Compared with the Year Ended December 31, 2005
Gross, ceded and net premiums written and earned for the years ended December 31, 2006 and 2005 were as follows ($ in thousands):
| Increase | ||||||||||||
| 2006 | 2005 | (decrease) | ||||||||||
| Gross premiums written | $ | 514,316 | 596,576 | $ | (82,260 | ) | ||||||
| Ceded premiums written | 89,387 | 21,521 | 67,866 | |||||||||
| Net premiums written | 424,929 | 575,055 | (150,126 | ) | ||||||||
- 62 -
Table of Contents
| Increase | ||||||||||||
| 2006 | 2005 | (decrease) | ||||||||||
| Gross premiums earned | 535,988 | 586,500 | (50,512 | ) | ||||||||
| Ceded premiums earned | 87,029 | 17,327 | 69,702 | |||||||||
| Net premiums earned | $ | 448,959 | 569,173 | $ | (120,214 | ) | ||||||
Net premiums written decreased in 2006 in almost all classes within this segment, most notably North American property proportional, property risk excess, crop and aviation classes of business. Contributing to the decrease in net premiums written was our decision to reduce our exposure to North American hurricanes. The reduction in North American property proportional and property risk excess was due to our decision to favor North American catastrophe excess business over North American property proportional and property risk excess catastrophe exposed business. Net premiums written and net premiums earned in 2005 included additional premiums of $45,409,000 and $42,624,000, respectively, from reinsurance contracts that incurred losses arising from the 2005 Hurricanes. Excluding the additional premiums related to the 2005 Hurricanes, gross premiums written in the North American catastrophe excess class increased in 2006. Net premiums written and earned in 2006 as compared with 2005 also decreased in the catastrophe classes as a result of the commencement of the Property Quota Share Agreement under which we ceded approximately $55,455,000 of premiums written. The reductions in the crop and aviation classes were primarily due to the expiration of a significant proportional contract in each class. The decreases of net premiums written were partially offset by increased pricing in the catastrophe exposed classes, primarily in North America.
Net losses and LAE and the resulting loss ratios for the years ended December 31, 2006 and 2005 were as follows ($ in thousands):
| 2006 | 2005 | Decrease | ||||||||||
| Net losses and LAE | $ | 145,900 | 756,742 | $ | (610,842 | ) | ||||||
| Net loss and LAE ratios | 32.5 | % | 133.0 | % | (100.5) points | |||||||
The decreases in net losses and LAE and the resulting net loss and LAE ratio in 2006 as compared with 2005 were primarily due to the significant difference in major catastrophe losses. Major catastrophe losses were $5,500,000 representing 1.2% of net premiums earned in 2006 as compared with $573,900,000 representing 100.8% of net premiums earned in 2005. Included in the major catastrophe losses in 2005 were $549,050,000 from the 2005 Hurricanes representing 96.5% of net premiums earned. Net losses and LAE and the resulting net loss and LAE ratios in 2006 and 2005 were also impacted by favorable net loss development of $54,317,000, representing 12.1% of net premiums earned in 2006 and $51,298,000 representing 9.0% of net premiums earned in 2005. Exclusive of the favorable net loss development, effects of the catastrophe losses and additional premiums generated by such catastrophe losses, the net loss and LAE ratio in 2006 improved by approximately 1% as compared 2005. The slight improvement is due to changes in the mix of business.
Net acquisition expenses and resulting net acquisition expense ratios for the years ended December 31, 2006 and 2005 were as follows ($ in thousands):
| 2006 | 2005 | Decrease | ||||||||||
| Net acquisition expenses | $ | 70,905 | 93,983 | $ | (23,078 | ) | ||||||
| Net acquisition expense ratios | 15.8 | % | 16.5 | % | (0.7) point | |||||||
- 63 -
Table of Contents
The decrease in net acquisition expenses in 2006 as compared with 2005 was primarily due to the decrease in net premiums earned. The decrease in the net acquisition expense ratio was due in part to the commencement of the Property Quota Share Agreement which has an override and profit commission. Net acquisition expenses included increases in commissions of $3,067,000 in 2006, representing 0.7% of net premiums earned related to favorable loss development from prior years as compared with $6,489,000 representing 1.1% of net premiums earned in 2005. The net acquisition expense ratios were also impacted by changes in the mix of business.
Other underwriting expenses for the years ended December 31, 2006 and 2005 were $39,887,000 and $26,074,000, respectively. The increase in other underwriting expenses was due to an increase in property underwriting activity in Bermuda and a corresponding increase in its staff. In 2006, both Platinum US and Platinum UK sold significant portions of their property catastrophe books of business to Platinum Bermuda. While other underwriting expense increases at Platinum Bermuda were partially offset by declines in operating expenses at Platinum US, the increased legal and other costs related to the cessation of underwriting activity of Platinum UK more than offset declines in its ongoing operating costs. Additionally, a greater percentage of common operating and administrative costs were allocated to the Property segment due to an increase in property underwriting in Bermuda and a decline in underwriting activity company wide in the Finite Risk segment. Other underwriting expenses for the years ended December 31, 2006 and 2005 included fees of $7,829,000 and $6,538,000, respectively, relating to the RenRe Agreement that provides for a periodic review of aggregate property catastrophe exposures by RenaissanceRe. These fees increased in 2006 as gross written premiums in the property catastrophe classes increased. The RenRe Agreement expires in September 2007.
Year Ended December 31, 2005 as Compared with the Year Ended December 31, 2004
Gross, ceded and net premiums written and earned for the years ended December 31, 2005 and 2004 were as follows ($ in thousands):
| 2005 | 2004 | Increase | ||||||||||
| Gross premiums written | $ | 596,576 | 517,468 | $ | 79,108 | |||||||
| Ceded premiums written | 21,521 | 13,029 | 8,492 | |||||||||
| Net premiums written | 575,055 | 504,439 | 70,616 | |||||||||
| Gross premiums earned | 586,500 | 501,040 | 85,460 | |||||||||
| Ceded premiums earned | 17,327 | 15,905 | 1,422 | |||||||||
| Net premiums earned | $ | 569,173 | 485,135 | $ | 84,038 | |||||||
Net premiums written and earned increased in 2005 as compared with 2004 due to growth primarily in the North American pro-rata and catastrophe classes. The most significant increase was in the property pro-rata class where we increased our net premiums written in catastrophe exposed business in Florida. Net premiums written and earned in 2005 also included additional premiums of approximately $45,409,000 and $42,624,000, respectively, from reinsurance contracts that incurred losses arising from the 2005 Hurricanes. Net premiums written and earned in 2004 included approximately $16,198,000 of additional premiums resulting from losses arising from the 2004 Hurricanes. Net premiums written and earned in 2005 also included $2,685,000 of additional net premiums relating to unfavorable loss development on the 2004 Hurricanes. There were no significant premium changes relating to loss development in 2004.
- 64 -
Table of Contents
Net losses and LAE and the resulting loss ratios for the years ended December 31, 2005 and 2004 were as follows ($ in thousands):
| 2005 | 2004 | Increase | ||||||||||
| Net losses and LAE | $ | 756,742 | 349,557 | $ | 407,185 | |||||||
| Net loss and LAE ratios | 133.0 | % | 72.1 | % | 60.9 points | |||||||
The increase in net losses and LAE and the related net loss and LAE ratio in 2005 as compared with 2004 was due to losses of $549,050,000 arising from the 2005 Hurricanes as compared with losses of $169,652,000 arising from the 2004 Hurricanes. Net losses from the 2005 Hurricanes represent representing 96.5% of net premiums earned as compared with net losses from the 2004 Hurricanes that represent 35.0% of net premiums earned. The net losses and LAE from the 2005 Hurricanes and 2004 Hurricanes were partially offset by net favorable loss development of approximately $51,298,000 representing 9.0% of net premiums earned in 2005 and approximately $48,478,000 representing 10.0% of net premiums earned in 2004. During 2005 and 2004, actual reported losses were significantly less than expected for the short-tailed non-catastrophe property lines resulting in reductions in estimated ultimate losses for such lines. The net loss and LAE ratio was also affected by the growth in business and the additional premiums arising from the 2005 Hurricanes and 2004 Hurricanes.
Net acquisition expenses and resulting net acquisition expense ratios for the years ended December 31, 2005 and 2004 were as follows ($ in thousands):
| 2005 | 2004 | Increase | ||||||||||
| Net acquisition expenses | $ | 93,983 | 76,360 | $ | 17,623 | |||||||
| Net acquisition expense ratios | 16.5 | % | 15.7 | % | 0.8 point | |||||||
The increase in net acquisition expenses in 2005 as compared with 2004 was consistent with the growth in business. The increase in the net acquisition expense ratio was primarily due to increases in commissions of $6,489,000 in 2005 related to the net favorable development of non-catastrophe net losses and LAE, partially offset by commission reductions of $3,654,000 in 2005 related to reinsurance contracts with catastrophe losses. There were no significant commission adjustments in 2004. The net acquisition expense ratios in 2005 and 2004 were also affected by changes in the mix of business.
Other underwriting expenses for the years ended December 31, 2005 and 2004 were $26,074,000 and $27,827,000, respectively. The decrease in other underwriting expenses was due to cost reductions in the Property and Marine segment in 2005, partially offset by the allocation of a greater percentage of common operating and administrative costs to the Property segment due to a decline in underwriting activity in the Finite Risk segment. Other underwriting expenses for the years ended December 31, 2005 and 2004 included fees of $6,538,000 and $6,396,000, respectively, relating to the RenRe Agreement that provides for a periodic review of aggregate property catastrophe exposures by RenaissanceRe.
Casualty
The Casualty operating segment principally includes reinsurance treaties that cover umbrella liability, general and product liability, professional liability, workers’ compensation, casualty clash, automobile liability, surety and trade credit. This operating segment also includes accident and health treaties, which are predominantly reinsurance of health insurance products. This operating segment generated 64.4%, 47.1% and 41.2% of our net premiums written for the years ended December 31, 2006, 2005 and 2004, respectively.
- 65 -
Table of Contents
Year Ended December 31, 2006 as Compared with the Year Ended December 31, 2005
Gross, ceded and net premiums written and earned for the years ended December 31, 2006 and 2005 were as follows ($ in thousands):
| 2006 | 2005 | Decrease | ||||||||||
| Gross premiums written | $ | 757,749 | 809,164 | $ | (51,415 | ) | ||||||
| Ceded premiums written | 74 | 133 | (59 | ) | ||||||||
| Net premiums written | 757,675 | 809,031 | (51,356 | ) | ||||||||
| Gross premiums earned | 764,414 | 790,290 | (25,876 | ) | ||||||||
| Ceded premiums earned | 73 | 661 | (588 | ) | ||||||||
| Net premiums earned | $ | 764,341 | 789,629 | $ | (25,288 | ) | ||||||
The decrease in net premiums written in 2006 was primarily due to reductions of business written across most casualty classes in the 2006 underwriting year, most significantly in the accident and health and trade credit classes. The reduction in business written is primarily due to decreases in price adequacy which caused us to non-renew some contracts. The decrease in net premiums written in the 2006 underwriting year was partially offset by increases in estimates of net written premiums of $68,937,000 in the North American excess casualty classes related to business written in prior underwriting years as compared with similar increases of estimates of $55,500,000 in 2005. Net premiums written and earned were also affected by changes in the mix of business and the structure of the underlying reinsurance contracts.
Net losses and LAE and the resulting loss ratios for the years ended December 31, 2006 and 2005 were as follows ($ in thousands):
| 2006 | 2005 | Increase | ||||||||||
| Net losses and LAE | $ | 522,815 | 511,609 | $ | 11,206 | |||||||
| Net loss and LAE ratios | 68.4 | % | 64.8 | % | 3.6 points | |||||||
The increase in net losses and LAE in 2006 as compared with 2005 was primarily due to an increase in the net loss and LAE ratio. The increase in the net loss and LAE ratio in 2006 as compared with 2005 was due to less net favorable loss development in 2006 than in 2005 and higher initial expected loss ratios in certain significant classes reflecting a decline in price adequacy. Net losses and LAE included net favorable loss development of approximately $9,424,000, representing 1.2% of net premiums earned in 2006, and approximately $15,913,000 of net favorable loss development, representing 2.0% of net premiums earned in 2005. The net favorable loss development was primarily in casualty classes with short loss development periods. The net loss and LAE ratio was also affected by the changes in the mix of business within the segment.
Net acquisition expenses and resulting net acquisition expense ratios for the years ended December 31, 2006 and 2005 were as follows ($ in thousands):
| Increase | ||||||||||||
| 2006 | 2005 | (decrease) | ||||||||||
| Net acquisition expenses | $ | 188,717 | 194,397 | $ | (5,680 | ) | ||||||
| Net acquisition expense ratios | 24.7 | % | 24.6 | % | 0.1 point | |||||||
- 66 -
Table of Contents
The decrease in net acquisition expenses was due primarily to the decrease in net premiums earned in 2006 as compared with 2005. The net acquisition expense ratios were comparable for the years ended December 31, 2006 and 2005 and were impacted by changes in the mix of business.
Other underwriting expenses for the years ended December 31, 2006 and 2005 were $27,022,000 and $24,690,000, respectively. The increase in other underwriting expenses in 2006 as compared with 2005 was primarily due to an increase in incentive-based compensation. The increase in incentive-based compensation in 2006 as compared with 2005 was due to increased net income in 2006.
Year Ended December 31, 2005 as Compared with the Year Ended December 31, 2004
Gross, ceded and net premiums written and earned for the years ended December 31, 2005 and 2004 were as follows ($ in thousands):
| Increase | ||||||||||||
| 2005 | 2004 | (decrease) | ||||||||||
| Gross premiums written | $ | 809,164 | 678,147 | $ | 131,017 | |||||||
| Ceded premiums written | 133 | 748 | (615 | ) | ||||||||
| Net premiums written | 809,031 | 677,399 | 131,632 | |||||||||
| Gross premiums earned | 790,290 | 613,111 | 177,179 | |||||||||
| Ceded premiums earned | 661 | 1,218 | (557 | ) | ||||||||
| Net premiums earned | $ | 789,629 | 611,893 | $ | 177,736 | |||||||
The increase in net premiums written and earned was due to growth primarily in the casualty excess class as well as expanded participation in proportional general liability, surety and trade credit business. Also, net premiums written and earned in 2005 as compared with 2004 were affected by revisions of prior years’ estimates resulting in increases in net premiums written and earned in 2005 of approximately $55,500,000 and $37,600,000, respectively. This increase was due to growth in the casualty business and increased ultimate premiums from prior underwriting years’ excess-of-loss classes due to greater than expected premiums being reported from ceding companies. This compares with revisions of prior years’ estimates resulting in reductions of net premiums written and earned in 2004 of approximately $21,300,000 and $14,300,000, respectively. These adjustments were based on reported premiums from ceding companies and revised projections of ultimate premiums written under reinsurance contracts. The net effect of changes in premium estimates, net of corresponding changes in related losses, LAE and expenses, did not have a significant net effect on underwriting income. The increase in net premiums earned was related to the growth in current and prior years’ written premiums and was affected by changes in the mix of business and the structure of the underlying reinsurance contracts.
Net losses and LAE and the resulting loss ratios for the years ended December 31, 2005 and 2004 were as follows ($ in thousands):
| Increase | ||||||||||||
| 2005 | 2004 | (decrease) | ||||||||||
| Net losses and LAE | $ | 511,609 | 418,355 | $ | 93,254 | |||||||
| Net loss and LAE ratios | 64.8 | % | 68.4 | % | (3.6) points | |||||||
The increase in net losses and LAE in 2005 as compared with 2004 was consistent with the growth in net premiums earned. Net losses and LAE in 2005 included net favorable loss development of
- 67 -
Table of Contents
approximately $15,913,000, representing 2.0% of net premiums earned in 2005, and approximately $675,000 of net unfavorable loss development, representing 0.1% of net premiums earned in 2004. The decrease in the net loss and LAE ratio in 2005 was also due, in part, to changes in the mix of business toward classes with lower loss ratios.
Net acquisition expenses and resulting net acquisition expense ratios for the years ended December 31, 2005 and 2004 were as follows ($ in thousands):
| Increase | ||||||||||||
| 2005 | 2004 | (decrease) | ||||||||||
| Net acquisition expenses | $ | 194,397 | 151,649 | $ | 42,748 | |||||||
| Net acquisition expense ratios | 24.6 | % | 24.8 | % | (0.2) point | |||||||
The increase in acquisition expenses was due primarily to the increase in net premiums earned in 2005 as compared with 2004. The acquisition expense ratios were comparable for the years ended December 31, 2005 and 2004.
Other underwriting expenses for the years ended December 31, 2005 and 2004 were $24,690,000 and $19,086,000, respectively. The increase in other underwriting expenses was due to the growth of business in the segment as well as the allocation of a greater percentage of common operating and administrative costs to the segment due to a decline in underwriting activity in the Finite Risk segment. The other underwriting expense ratios in 2005 and 2004 remained comparable at 3.1%.
Finite Risk
The Finite Risk operating segment includes principally structured reinsurance contracts with ceding companies whose needs may not be met efficiently through traditional reinsurance products. In exchange for contractual features that limit our downside risk, reinsurance contracts we classify as finite risk provide the potential for significant profit commission to the ceding company. The classes of risks underwritten through finite risk contracts are generally consistent with the classes covered by traditional products. The finite risk contracts that we underwrite generally provide prospective protection, meaning coverage is provided for losses that are incurred after inception of the contract, as contrasted with retrospective coverage, which covers losses that are incurred prior to inception of the contract. The three main categories of our finite risk contracts are quota share, multi-year excess-of-loss and whole account aggregate stop loss. The ongoing industry-wide investigations by legal and regulatory authorities into potential misuse of finite products have curtailed demand for finite risk products in 2006 and 2005. This operating segment generated (0.5%), 19.4% and 28.2% of our net premiums written for the years ended December 31, 2006, 2005, and 2004, respectively.
Year Ended December 31, 2006 as Compared with the Year Ended December 31, 2005
Gross, ceded and net premiums written and earned for the years ended December 31, 2006 and 2005 were as follows ($ in thousands):
| 2006 | 2005 | Decrease | ||||||||||
| Gross premiums written | $ | 3,135 | 359,415 | $ | (356,280 | ) | ||||||
| Ceded premiums written | 9,126 | 25,779 | (16,653 | ) | ||||||||
| Net premiums written | (5,991 | ) | 333,636 | (339,627 | ) | |||||||
- 68 -
Table of Contents
| 2006 | 2005 | Decrease | ||||||||||
| Gross premiums earned | 133,880 | 380,348 | (246,468 | ) | ||||||||
| Ceded premiums earned | 10,479 | 24,427 | (13,948 | ) | ||||||||
| Net premiums earned | $ | 123,401 | 355,921 | $ | (232,520 | ) | ||||||
The Finite Risk portfolio consists of a small number of contracts that can be large in premium size and, consequently, overall premium volume may vary significantly from year to year. The decrease in net premiums written and earned in 2006 as compared with 2005 was primarily attributable to the termination of two significant finite casualty quota share contracts. One of the contracts was terminated effective January 1, 2006 on a cut-off basis, which resulted in the return of previously written but unearned premium. Net premiums written and earned in 2005 included approximately $4,042,000 of additional premiums resulting from losses arising from the 2005 Hurricanes. Additionally in 2005, favorable development of losses in this segment related to the 2004 Hurricanes resulted in a reduction of net premiums written and earned of $4,953,000.
Due to the often significant inverse relationship between losses and commissions for this segment, we believe it is important to evaluate the overall combined ratio, rather than its component parts of loss and LAE and acquisition expense ratios. Net losses and LAE, net acquisition expenses and the resulting ratios for the years ended December 31, 2006 and 2005 were as follows ($ in thousands):
| 2006 | 2005 | Decrease | ||||||||||
| Net losses and LAE | $ | 91,887 | 237,074 | $ | (145,187 | ) | ||||||
| Net acquisition expenses | 26,301 | 114,755 | (88,454 | ) | ||||||||
| Net losses, LAE and acquisition expenses | $ | 118,188 | 351,829 | $ | (233,641 | ) | ||||||
| Net loss, LAE and acquisition expense ratios | 95.8 | % | 98.8 | % | (3.0) points | |||||||
The decrease in net losses, LAE and acquisition expenses in 2006 as compared with 2005 was primarily due to the reduction in net premiums earned. The decrease in the loss, LAE and acquisition expense ratio in 2006 was due to an absence of major catastrophe losses in 2006 as compared with losses of $31,000,000 from the 2005 Hurricanes representing 8.7% of net premiums earned in 2005. This was partially offset by net unfavorable development in 2006 of $2,531,000, representing 2.1% of net premiums earned as compared with net favorable development of approximately $21,187,000, representing 6.0% of net premiums earned in 2005. The unfavorable development in 2006 included unfavorable development on the 2005 Hurricanes of $3,500,000. Also contributing to the decrease in the net loss, LAE and acquisition ratio in 2006 was the termination of two finite casualty quota share contracts that had higher combined ratios than the remainder of the Finite Risk portfolio. The loss, LAE and acquisition expense ratio was also affected by the changes in the mix of business within the segment.
Other underwriting expenses for the years ended December 31, 2006 and 2005 were $4,387,000 and $4,905,000, respectively. The decrease in other underwriting expenses was due to the allocation of a greater percentage of direct and common operating costs to the other two segments due to a decline in underwriting activity in the Finite Risk segment.
Year Ended December 31, 2005 as Compared with the Year Ended December 31, 2004
Gross, ceded and net premiums written and earned for the years ended December 31, 2005 and 2004 were as follows ($ in thousands):
- 69 -
Table of Contents
| Increase | ||||||||||||
| 2005 | 2004 | (decrease) | ||||||||||
| Gross premiums written | $ | 359,415 | 464,175 | $ | (104,760 | ) | ||||||
| Ceded premiums written | 25,779 | — | 25,779 | |||||||||
| Net premiums written | 333,636 | 464,175 | (130,539 | ) | ||||||||
| Gross premiums earned | 380,348 | 350,907 | 29,441 | |||||||||
| Ceded premiums earned | 24,427 | — | 24,427 | |||||||||
| Net premiums earned | $ | 355,921 | 350,907 | $ | 5,014 | |||||||
Net premiums written decreased significantly in 2005 as compared with 2004 as fewer contracts were in force. The decrease in net premiums written was primarily attributable to several large accident and health capped quota share contracts that were written in 2004 and not renewed in 2005. The resulting decline in finite accident and health net premiums earned was offset by an increase in finite casualty net premiums earned. Net premiums earned are related to current and prior years’ net premiums written and are affected by changes in the mix of business and the structure of the underlying reinsurance contracts. Net premiums written and earned in 2005 and 2004 included approximately $4,042,000 and $13,067,000 of additional premiums resulting from losses arising from the 2005 Hurricanes and 2004 Hurricanes, respectively. Additionally in 2005, favorable development of losses in this segment related to the 2004 Hurricanes resulted in a reduction of net premiums written and earned of $4,953,000.
Net losses and LAE, acquisition expenses and the resulting ratios for the years ended December 31, 2005 and 2004 were as follows ($ in thousands):
| Increase | ||||||||||||
| 2005 | 2004 | (decrease) | ||||||||||
| Net losses and LAE | $ | 237,074 | 251,892 | $ | (14,818 | ) | ||||||
| Net acquisition expenses | 114,755 | 99,812 | 14,943 | |||||||||
| Net losses, LAE and acquisition expenses | $ | 351,829 | 351,704 | $ | 125 | |||||||
| Net loss, LAE and acquisition expense ratios | 98.8 | % | 100.2 | % | (1.4) points | |||||||
Net losses, LAE and acquisition expenses in 2005 are comparable to 2004 as a result of a small increase in net premiums earned offset by a decrease in the net loss, LAE and acquisition expense ratio. . Net losses, LAE and acquisition expenses arising from the 2005 Hurricanes were $31,000,000 representing 8.7% of net premiums earned in 2005 as compared with losses, LAE and acquisition expenses arising from the 2004 Hurricanes of $50,580,000 representing 14.4% of net premiums earned in 2004. Net favorable development impacting both losses and LAE and acquisition expenses occurred in both 2005 and 2004. Net favorable development in 2005 and 2004 amounted to $21,187,000 representing 6.0% of net premiums earned in 2005 as compared with $7,717,000 representing 2.2% of net premiums earned in 2004. Exclusive of hurricane losses and net favorable development, the overall loss, LAE and acquisition expense ratio increased in 2005 as compared with 2004 due to the shift toward casualty business that generally has a higher combined ratio.
Other underwriting expenses for the years ended December 31, 2005 and 2004 were $4,905,000 and $6,224,000, respectively. The decrease in other underwriting expenses was due to less direct expenses and the allocation of a greater percentage of common operating costs to the Casualty segment due to a decline in underwriting activity in the Finite Risk segment.
- 70 -
Table of Contents
Financial Condition, Liquidity and Capital Resources
Financial Condition
Cash and cash equivalents and investments as of December 31, 2006 and 2005 were as follows ($ in thousands):
| 2006 | 2005 | Increase | ||||||||||
| Cash and cash equivalents | $ | 851,652 | 820,746 | $ | 30,906 | |||||||
| Fixed maturity securities | 3,334,645 | 2,987,703 | 346,942 | |||||||||
| Preferred stocks | 10,772 | 8,186 | 2,586 | |||||||||
| Short-term investments | 27,123 | 8,793 | 18,330 | |||||||||
| Total | $ | 4,224,192 | 3,825,428 | $ | 398,764 | |||||||
The increase in cash and cash equivalents in 2006 as compared to 2005 was due, in part, to a sale of certain fixed maturity securities at year end. The total increase in cash and cash equivalents and investments was due to positive cash flow from operations, excluding trading securities activities, which was $525,025,000 in 2006. Our available-for-sale and trading portfolios are primarily composed of diversified, high quality, predominantly publicly traded fixed maturity securities. The investment portfolio, excluding cash and cash equivalents, had a weighted average duration of 2.7 years as of December 31, 2006. We routinely monitor the composition of our investment portfolio and cash flows in order to maintain liquidity necessary to meet our obligations.
Other invested asset represents an investment in Inter-Ocean Holdings, Ltd., a non-public reinsurance company. During 2006, based on a definitive agreement to sell our interest in Inter-Ocean Holdings, Ltd., we wrote down the carrying value of the investment and recorded a realized loss of $255,000. As a result of routine evaluations of investments during 2005, we wrote down the carrying value of the investment in Inter-Ocean Holdings, Ltd. to its estimated net realizable value and recorded a realized loss of $1,769,000. We have no ceded or assumed reinsurance business with Inter-Ocean Holdings, Ltd.
Premiums receivable include significant estimates. Premiums receivable as of December 31, 2006 of $377,183,000 included $315,243,000 that is based upon estimates. Premiums receivable as of December 31, 2005 of $567,449,000 included $496,603,000 that is based upon estimates. An allowance for uncollectible premiums is established for possible non-payment of such amounts due, as deemed necessary. As of December 31, 2006 and 2005, no such allowance was made based on our historical experience, the general profile of our ceding companies and our ability in most cases to contractually offset premiums receivable with losses and LAE or other amounts payable to the same parties.
Gross unpaid losses and LAE as of December 31, 2006 of $2,368,482,000 include $1,648,635,000 of IBNR. Gross unpaid losses and LAE as of December 31, 2005 of $2,323,990,000 includes $1,812,245,000 of IBNR. IBNR decreased in 2006 as losses related to the 2005 Hurricanes and 2004 Hurricanes were reported and paid. Gross losses paid in 2006 related to the 2005 Hurricanes and 2004 Hurricanes were approximately $287,040,000. There remains approximately $312,173,000 of gross unpaid losses related to the 2005 Hurricanes and the 2004 Hurricanes, of which
- 71 -
Table of Contents
$91,151,000 is IBNR. These unpaid losses may result in a large amount of loss payments over the next year that could adversely affect net cash flows from operations.
Commissions payable as of December 31, 2006 of $140,835,000 include $124,906,000 that is based upon estimates. Commissions payable as of December 31, 2005 of $186,654,000 include $167,949,000 that is based upon estimates.
Sources of Liquidity
Our consolidated sources of funds consist primarily of premiums written, investment income, proceeds from sales and redemption of investments, losses recovered from retrocessionaires, issuances of securities and actual cash and cash equivalents held by us. Net cash flows provided by operations, excluding trading securities activities, for the years ended December 31, 2006, 2005 and 2004 were $525,025,000, $618,909,000 and $698,223,000, respectively, and were used primarily to acquire additional investments.
Platinum Holdings is a holding company that conducts no reinsurance operations of its own. All of its reinsurance operations are conducted through its wholly owned operating subsidiaries Platinum Bermuda, Platinum US and Platinum UK. As a holding company, the cash flow of Platinum Holdings consists primarily of dividends, interest and other permissible payments from its subsidiaries and issuances of securities. Platinum Holdings depends on such payments for general corporate purposes and to meet its obligations, including the payment of any dividends to its preferred and common shareholders.
In November 2002, we issued the ESU’s each of which consisted of a contract to purchase our common shares in 2005 and an ownership interest in a Senior Guaranteed Note. On August 16, 2005, Platinum Finance successfully completed the remarketing of $137,500,000 aggregate principal amount of the Senior Guaranteed Notes due November 16, 2007 at a price of 100.7738% with a reset interest rate of 6.371%, referred to as the Remarketed Notes. The remarketing was conducted on behalf of holders of the ESU’s and neither Platinum Holdings nor Platinum Finance received any cash proceeds from the remarketing. Proceeds from the remarketing were used to purchase a portfolio of U.S. Treasury securities to collateralize the obligations of the holders of the ESU’s under the related common share purchase contract and to pay the remarketing fee. There were no excess proceeds distributed to holders of the ESU’s in connection with the remarketing. On November 16, 2005, Platinum settled the common share purchase contract component of the ESU’s by issuing 5,008,850 common shares, which generated cash proceeds to us of $137,500,000, less related fees and expenses. As a result of the settlement of the purchase contract component, the ESUs ceased to exist and are no longer traded on the New York Stock Exchange.
In May 2005, Platinum Finance issued $250,000,000 aggregate principal amount of Series A Notes due June 1, 2017, unconditionally guaranteed by Platinum Holdings. The Series A Notes were issued in a transaction exempt from the registration requirements under the Securities Act and then subsequently exchanged for Series B Notes that have substantially the same terms and which were registered under the Securities Act. The proceeds were used primarily to increase the capital of Platinum Bermuda and Platinum US.
We filed an unallocated universal shelf registration statement with the SEC, which the SEC declared effective on November 8, 2005. Under this shelf registration statement we may issue and sell, in one or more offerings, up to $750,000,000 of debt, equity and other types of securities or a combination of the above, including debt securities of Platinum Finance, unconditionally guaranteed by Platinum Holdings. To affect any such sales from time to time, Platinum Holdings and/or Platinum Finance will
- 72 -
Table of Contents
file one or more supplements to the prospectus forming a part of such registration statement, which will provide details of any proposed offering. In December 2005, Platinum Holdings issued $132,909,000 of common shares and $173,363,000 of mandatory convertible preferred shares under the unallocated shelf registration statement. On December 1, 2005, certain reform measures simplifying the process for conducting registered securities offerings under the Securities Act came into effect. The new rules provide that shelf registration statements of certain well-known seasoned issuers, such as Platinum Holdings, are eligible for effectiveness automatically upon filing. Should Platinum Holdings seek to issue securities in the future, it may make use of such new rules.
On October 21, 2005 we entered into a three-year $200,000,000 credit agreement with a syndicate of lenders. On September 13, 2006, we amended and restated the existing agreement, increasing the term to five years and increasing the facility to $400,000,000. The amended and restated credit agreement consists of a $150,000,000 senior unsecured credit facility available for revolving borrowings and letters of credit and a $250,000,000 senior secured credit facility available for letters of credit. The revolving line of credit generally will be available for our working capital, liquidity and general corporate requirements and those of our subsidiaries. Platinum Holdings and Platinum Finance guarantee borrowings by our reinsurance subsidiaries under the credit facility. The interest rate on borrowings under the credit facility is based on our election of either: (1) LIBOR plus 50 basis points or (2) the higher of: (a) the prime interest rate of the lead bank providing the credit facility, or (b) the federal funds rate plus 50 basis points. The interest rate based on LIBOR rate would increase or decrease by up to 12.5 basis points should our senior unsecured debt credit rating increase or decrease.
Liquidity Requirements
Our principal consolidated cash requirements are the payment of losses and LAE, commissions, brokerage, operating expenses, dividends to our preferred and common shareholders, the servicing of debt, the acquisition of and investment in businesses, capital expenditures, purchase of retrocessional contracts and payment of taxes. The catastrophe losses of 2005 may result in a surge of loss payments over the next year that could adversely affect net cash flows from operations.
In May 2005, Platinum Finance issued $250,000,000 aggregate principal amount of Series A Notes due June 1, 2017, unconditionally guaranteed by Platinum Holdings which were subsequently exchanged for the Series B Notes. Interest at a rate of 7.5% per annum is payable on the Series B Notes on each June 1 and December 1 commencing on December 1, 2005. Platinum Finance may redeem the Series B Notes, at its option, at any time in whole, or from time to time in part, prior to maturity. The redemption price will be equal to the greater of: (i) 100 percent of the principal amount of the Series B Notes, or (ii) the sum of the present values of the remaining scheduled payments of principal and interest, discounted to the redemption date on a semiannual basis at a comparable treasury rate plus 50 basis points, plus in each case, interest accrued but not paid to the date of redemption.
In December 2005, Platinum Holdings issued 5,750,000 shares of mandatory convertible preferred shares for $173,363,000 under its unallocated shelf registration statement. Dividends on the preferred shares are $0.4525 per preferred share per quarter. Unless all accrued, cumulated and unpaid dividends on our preferred shares for all past quarterly dividend periods have been paid in full we cannot declare or pay any dividends or make any distributions to any of our common shareholders. Additionally, under the Companies Act, Platinum Holdings may declare or pay a dividend only if, among other things, it has reasonable grounds for believing that it is, or after the payment would be, able to pay its liabilities as they become due and if the realizable value of its assets would thereby not be less than the aggregate of its liabilities and issued share capital and share premium accounts. Accordingly, there is no assurance
- 73 -
Table of Contents
that dividends will be declared or paid in the future. Currently, there is no Bermuda withholding tax on dividends paid by Platinum Holdings.
In December 2005, we repurchased $94,660,000 of the Remarketed Notes leaving an outstanding balance of $42,840,000. Interest at the rate of 6.371% per annum is payable on the outstanding Remarketed Notes on May 16 and November 16 of each year. The Remarketed Notes are unconditionally guaranteed by Platinum Holdings.
Platinum Bermuda and Platinum UK are not licensed, approved or accredited as reinsurers anywhere in the United States and, therefore, under the terms of most of their contracts with United States ceding companies, they are required to provide collateral to their ceding companies for unpaid ceded liabilities in a form acceptable to state insurance commissioners. Typically, this type of collateral takes the form of letters of credit issued by a bank, the establishment of a trust, or funds withheld. Platinum Bermuda and Platinum UK provide letters of credit through the credit agreement described above and through other commercial banks and may be required to provide the banks with a security interest in certain investments of Platinum Bermuda and Platinum UK.
Platinum US is obligated to collateralize the liabilities assumed from St. Paul under the Quota Share Retrocession Agreements. Platinum Bermuda and Platinum US have reinsurance and other contracts that also require them to provide collateral to ceding companies should certain events occur, such as a decline in the rating by A.M. Best below specified levels or a decline in statutory equity below specified amounts, or when certain levels of liabilities assumed from ceding companies are attained. Some reinsurance contracts also have special termination provisions that permit early termination should certain events occur.
Investments with a carrying value of $190,045,000 and cash and cash equivalents of $4,594,000 as of December 31, 2006 were held in trust to collateralize obligations under the Quota Share Retrocession Agreements. Investments with a carrying value of $241,533,000 and cash and cash equivalents of $11,637,000 as of December 31, 2006 were held in trust and letters of credit of $80,769,000 were issued to collateralize obligations under various other reinsurance contracts. Investments with a carrying value of $53,364,000 and cash and cash equivalents of $36,333,000 as of December 31, 2006 were held in trust to collateralize letters of credit.
The payment of dividends and other distributions from our regulated reinsurance subsidiaries is limited by applicable laws and statutory requirements of the jurisdictions in which the subsidiaries operate, including Bermuda, the United States and the United Kingdom. Based on the regulatory restrictions of the applicable jurisdictions, the maximum amount available for payment of dividends or other distributions by our reinsurance subsidiaries in 2007 without prior regulatory approval is estimated to be approximately $307,000,000.
On August 4, 2004, the board of directors of Platinum Holdings approved a plan to purchase up to $50,000,000 of our common shares. During the year ended December 31, 2004 we purchased 349,700 of our common shares in the open market at an aggregate amount of $9,985,000 at a weighted average price of $28.55 per share. The shares we purchased were canceled. No repurchases of our common shares were made during 2006 or 2005.
We believe that the net cash flows generated by the operating activities of our subsidiaries in combination with cash and cash equivalents on hand will provide sufficient funds to meet our liquidity needs over the next twelve months. Beyond the next twelve months, cash flows available to us may be influenced by a variety of factors, including economic conditions in general and in the insurance and
- 74 -
Table of Contents
reinsurance markets, legal and regulatory changes as well as fluctuations from year to year in claims experience and the occurrence or absence of large catastrophic events. If our liquidity needs accelerate beyond our ability to fund such obligations from current operating cash flows, we may need to liquidate a portion of our investment portfolio, borrow under the credit facility described above or raise additional capital in the capital markets. Our ability to meet our liquidity needs by selling investments or raising additional capital is subject to the timing and pricing risks inherent in the capital markets.
Economic Conditions
Periods of moderate economic recession or inflation tend not to have a significant direct effect on our underwriting operations. Significant unexpected inflationary or recessionary periods can, however, impact our underwriting operations and investment portfolio. Management considers the potential impact of economic trends in the estimation process for establishing unpaid losses and LAE.
Capital Expenditures
We do not have any material commitments for capital expenditures as of December 31, 2006.
Off-Balance Sheet Arrangements
We do not have any off-balance sheet arrangements, as defined for purposes of SEC rules, which are not accounted for or disclosed in the consolidated financial statements as of December 31, 2006.
Contractual Obligations
Our contractual obligations by estimated maturity are presented below ($ in thousands):
| 1 - 3 | 3 - 5 | |||||||||||||||||||
| Contractual Obligations | Total | Less than 1 year | years | Years | More than 5 years | |||||||||||||||
Series B Remarketed Notes due November 16, 2007(1) | $ | 42,840 | 42,840 | — | — | $ | — | |||||||||||||
Series B Notes due June 1, 2017(1) | 250,000 | — | — | — | 250,000 | |||||||||||||||
| Scheduled interest payments | 199,604 | 21,479 | 37,500 | 37,500 | 103,125 | |||||||||||||||
| Subtotal — Debt Obligations | 492,444 | 64,319 | 37,500 | 37,500 | 353,125 | |||||||||||||||
Operating Leases(2) | 14,748 | 2,707 | 7,194 | 3,880 | 967 | |||||||||||||||
Gross unpaid losses and LAE(3) | $ | 2,368,482 | 646,063 | 779,970 | 427,186 | $ | 515,263 | |||||||||||||
| (1) | See note 5 of the Notes to the Consolidated Financial Statements. | |
| (2) | See note 12 of the Notes to the Consolidated Financial Statements. | |
| (3) | There are generally no stated amounts related to reinsurance contracts. Both the amounts and timing of future loss and LAE payments are estimates and subject to the inherent variability of legal and market conditions affecting the obligations and make the timing of cash outflows uncertain. The ultimate amount and timing of unpaid losses and LAE could differ materially from the amounts in the table above. Further, the gross unpaid losses and LAE do not represent all of the obligations that will arise under the contracts, but rather only the estimated liability incurred through December 31, 2006. There are reinsurance contracts that have terms extending into 2007 under which additional obligations will be incurred. |
- 75 -
Table of Contents
Current Outlook
The renewal season for contracts effective January 1, 2007 (the “January 1 Renewal Season”) has recently been completed. The January 1 renewal season is generally considered the most significant underwriting period of the year for the reinsurance industry. We were able to modestly grow our portfolio of business as terms and conditions improved in some lines of business and deteriorated in others.
For the Property and Marine segment, underlying primary rates and reinsurance rates increased considerably in 2006, particularly for risks exposed to Atlantic hurricanes. During the January 1 Renewal Season we achieved average rate increases of over 20% on our U.S. property catastrophe excess renewal business while rates on our non-U.S. property catastrophe excess renewal business were down slightly.
In addition, we achieved average rate increases of approximately 10% on our marine renewal business. Per risk excess rates were approximately equal to expiring in both our U.S. and non-U.S. renewal business.
During 2006 we wrote more property catastrophe excess-of-loss business and less property per risk excess-of-loss and proportional business. Property per risk excess-of-loss and proportional business typically generates relatively more premium than property catastrophe excess-of-loss business having a similar catastrophe risk level. However, we believe property catastrophe excess-of-loss business generally provides more quantifiable catastrophe exposure and is currently priced more attractively. During the January 1 Renewal Season we wrote approximately 15% more U.S. catastrophe excess-of-loss premium than we had during the January 1, 2006 renewal season. We elected not to renew the collateralized quota share contract that covered our catastrophe excess of loss portfolio in 2006. As a consequence of reducing our use of retrocession and writing a larger gross portfolio of catastrophe excess-of-loss business at January 1, our net retained risk and expected profit has increased for 2007. For 2007 we plan to deploy capacity such that up to approximately 22.5% of our total capital could be exposed to an event with a probability of 1 in 250 years.
The lack of significant catastrophe activity in 2006 contributed to excellent financial results and stronger balance sheets for many reinsurers. In January 2007, there were a number of government initiatives in Florida designed to decrease insurance rates in the state. Of most significance to reinsurers was the large increase in the capacity of the Florida Hurricane Catastrophe Fund (“FHCF”), a state-run reinsurer. We believe the increase in capacity of private reinsurers and the FHCF will cause downward pressure on windstorm catastrophe rates for the remainder of the 2007, particularly for Florida residential exposures. We believe that most other classes within the Property and Marine segment will also experience some rate deterioration for the remainder of 2007.
For the Casualty segment, although we believe that the market generally offers adequate returns, pricing has been softening. Ceding companies are willing to increase retentions and reinsurers are competing for participation on the best treaties. During the January 1 Renewal Season rate changes by class of business ranged from an increase of approximately 5% to a decrease of approximately 10%. The overall average remained close to expiring, losing some ground against upward trending loss costs. As a result, we believe the business underwritten in 2007 will have a slightly lower level of expected profitability as compared with the business underwritten in 2006.
During the January 1 Renewal Season we wrote approximately the same amount of casualty business as we had during the January 1, 2006 renewal season. We expect market conditions to continue to weaken through the remainder of 2007 and that fewer casualty opportunities will be attractive. We believe that financial security remains a significant concern for buyers of long-tailed reinsurance
- 76 -
Table of Contents
protection who typically seek reinsurers with strong balance sheets, quality ratings, and a proven claims-paying record. We believe that our rating, capitalization and reputation as a lead casualty reinsurer position us well to write profitable business as the opportunities arise.
In the Finite Risk segment, we believe that the ongoing investigations by the SEC, the office of the Attorney General for the State of New York, the U.S. Attorney for the Southern District of New York as well as various non-U.S. regulatory authorities continues to reduce demand for limited risk transfer products in 2006. We believe we can deploy our human and financial capital more profitably in other lines of business. As a result, we are devoting fewer underwriting and pricing resources to this segment than in prior years and wrote a relatively small amount of finite business during 2006 relative to last year. We expect the relatively low level of demand will continue during 2007. We expect to continue de-emphasizing this segment and instead focus our efforts on our Property and Marine and Casualty segments.
In 2006 we expanded the operations of Platinum Bermuda in order to make it our principal reinsurer of global catastrophe reinsurance and financial lines. As part of this plan, we began to renew business previously written by Platinum UK in Platinum Bermuda. We also renewed certain property catastrophe contracts of Platinum US in Platinum Bermuda. After successfully renewing substantially all of the reinsurance business written by Platinum UK in Platinum Bermuda, we decided to cease underwriting reinsurance in Platinum UK in 2007. We plan to take steps in 2007 that will transition Platinum UK to a non-underwriting operation and to allow the release of a significant portion of its capital. These actions may include a 100% loss portfolio transfer of Platinum UK’s reinsurance business to Platinum Bermuda. We may also seek to novate Platinum UK reinsurance contracts to Platinum Bermuda.
Item 7A. Quantitative and Qualitative Disclosures about Market Risk
Market and Credit Risk
Our principal invested assets are fixed maturity securities, which are subject to the risk of potential losses from adverse changes in market rates and prices and credit risk resulting from adverse changes in the borrower’s ability to meet its debt service obligations. Our strategy to limit this risk is to place our investments in high quality credit issues and to limit the amount of credit exposure with respect to any one issuer or asset class. We also select investments with characteristics such as duration, yield, currency and liquidity to reflect, in the aggregate, the underlying characteristics of our unpaid losses and LAE. We attempt to minimize the credit risk by actively monitoring the portfolio and requiring a minimum average credit rating for our portfolio of A2 as defined by Moody’s Investor Service. As of December 31, 2006, our portfolio, excluding cash and cash equivalents, had a dollar weighted average rating of Aa2.
We have other receivable amounts subject to credit risk. The most significant of these are reinsurance premiums receivable from ceding companies. We also have reinsurance recoverable amounts from our retrocessionaires. To mitigate credit risk related to premium receivables, we have established standards for ceding companies and, in most cases, have a contractual right of offset thereby allowing us to settle claims net of any premium receivable. To mitigate credit risk related to our reinsurance recoverable amounts, we consider the financial strength of our retrocessionaires when determining whether to purchase coverage from them. Retrocessional coverage is generally obtained from companies rated “A-” or better by A.M. Best unless the retrocessionaire’s obligations are fully collateralized. For exposures where losses become known and are paid in a relatively short period of time, we may obtain
- 77 -
Table of Contents
retrocessional coverage from companies that may not be rated but that provide adequate collateral. The financial performance and rating status of all material retrocessionaires is routinely monitored.
In accordance with industry practice, we frequently pay amounts in respect of claims under contracts to reinsurance brokers, for payment over to the ceding companies. In the event that a broker fails to make such a payment, depending on the jurisdiction, we may remain liable to the ceding company for the payment. Conversely, in certain jurisdictions, when ceding companies remit premiums to reinsurance brokers, such premiums are deemed to have been paid to us and the ceding company is no longer liable to us for those amounts whether or not we actually receive the funds. Consequently, we assume a degree of credit risk associated with our brokers during the premium and loss settlement process. To mitigate credit risk related to reinsurance brokers, we have established guidelines for brokers and intermediaries.
Interest Rate Risk
We are exposed to fluctuations in interest rates. Movements in rates can result in changes in the market value of our fixed maturity portfolio and can cause changes in the actual timing of receipt of certain principal payments. Rising interest rates result in a decline in the market value of our fixed maturity portfolio and can expose our portfolio, in particular our mortgage backed securities, to extension risk. Conversely, a decline in interest rates will result in a rise in the market value of our fixed maturity portfolio and can expose our portfolio, in particular our mortgage-backed securities, to prepayment risk. The aggregate hypothetical impact on our fixed maturity portfolio, generated from an immediate parallel shift in the treasury yield curve, as of December 31, 2006 is approximately as follows ($ in thousands):
| Interest Rate Shift in Basis Points | ||||||||||||||||||||
| - 100 bp | - 50 bp | Current | + 50 bp | + 100 bp | ||||||||||||||||
| Total market value | $ | 3,423,278 | 3,379,953 | 3,334,645 | 3,287,573 | $ | 3,239,193 | |||||||||||||
| Percent change in market value | 2.7 | % | 1.4 | % | — | (1.4 | %) | (2.9 | %) | |||||||||||
| Resulting unrealized appreciation / (depreciation) | $ | 35,463 | (7,862 | ) | (53,170 | ) | (100,242 | ) | $ | (148,622 | ) | |||||||||
Foreign Currency Exchange Rate Risk
We write business on a worldwide basis. Consequently, our principal exposure to foreign currency exchange rate risk is the transaction of business in foreign currencies. Changes in foreign currency exchange rates can impact revenues, costs, receivables and liabilities, as measured in the U.S. dollar, our financial reporting currency. We seek to minimize our exposure to large foreign currency rate changes by holding invested assets denominated in foreign currencies to offset liabilities denominated in the same foreign currencies.
Sources of Fair Value
The following table presents the carrying amounts and estimated fair values of our financial instruments as of December 31, 2006 ($ in thousands):
- 78 -
Table of Contents
| Carrying | ||||||||
| Amount | Fair Value | |||||||
| Financial assets: | ||||||||
| Fixed maturity securities | $ | 3,334,645 | $ | 3,334,645 | ||||
| Preferred stocks | 10,772 | 10,772 | ||||||
| Other invested asset | 4,745 | 4,745 | ||||||
| Short-term investments | 27,123 | 27,123 | ||||||
| Financial liabilities: | ||||||||
| Debt obligations | $ | 292,840 | $ | 303,589 | ||||
The fair value of fixed maturity securities, preferred stocks and short-term investments are based on quoted market prices at the reporting date for those or similar investments. Other invested asset represents an investment in Inter-Ocean Holdings, Ltd., a non-public reinsurance company. During 2006, based on a definitive agreement to sell our interest in Inter-Ocean Holdings, Ltd., we wrote down the carrying value of the investment and recorded a realized loss of $255,000. During 2005 as a result of a routine evaluation of investments, we wrote down the carrying value of the investment in Inter-Ocean Holdings, Ltd. to its estimated net realizable value and recorded a realized loss of $1,769,000. We have no ceded or assumed reinsurance business with Inter-Ocean Holdings, Ltd. The fair values of debt obligations are based on quoted market prices.
Item 8. Financial Statements and Supplementary Data
Our consolidated financial statements as of December 31, 2006 and 2005 and for each of the three years in the period ended December 31, 2006, together with the report thereon by KPMG LLP, our independent registered public accounting firm, are set forth on pages F-1 through F-47 hereto.
Item 9. Changes in and Disagreements With Accountants on Accounting and Financial Disclosure
None.
Item 9A. Controls and Procedures
Disclosure Controls and Procedures
Our management, including the Chief Executive Officer and Chief Financial Officer, carried out an evaluation of the effectiveness of the design and operation of our disclosure controls and procedures (as such term is defined in Rules 13a-15(e) and 15d-15(e) under the Exchange Act) as of the end of the period covered by this report. Based on that evaluation, our management, including the Chief Executive Officer and Chief Financial Officer, concluded that our disclosure controls and procedures are effective to provide reasonable assurance that information required to be disclosed by us in reports that we file or submit under the Exchange Act is recorded, processed, summarized and timely reported as specified in the SEC’s rules and forms.
- 79 -
Table of Contents
Management’s Annual Report on Internal Control Over Financial Reporting
Our management, including the Chief Executive Officer and Chief Financial Officer, is responsible for establishing and maintaining adequate internal control over financial reporting (as such term is defined in Rules 13a-15(f) and 15(d)-15(f) under the Exchange Act). Our management, under the supervision and with the participation of the Chief Executive Officer and Chief Financial Officer, conducted an evaluation of the effectiveness of our internal control over financial reporting as of December 31, 2006 based on the integrated framework published in September 1992 by the Committee of Sponsoring Organizations of the Treadway Commission. Based on this evaluation, our management, including the Chief Executive Officer and Chief Financial Officer, concluded that our internal control over financial reporting was effective in that it provides reasonable assurance regarding the reliability of financial reporting and the preparation of financial statements for external purposes in accordance with accounting principles generally accepted in the United States of America and includes those policies and procedures that provide reasonable assurance that transactions are recorded as necessary and that expenditures are being made only with proper authorization.
Our management, including the Chief Executive Officer and Chief Financial Officer, does not expect that our disclosure controls and procedures or our internal control over financial reporting will prevent all error and all fraud. A control system, no matter how well conceived and operated, can provide only reasonable, not absolute, assurance that the objectives of the control system are met. Further, the design of a control system must reflect the fact that there are resource constraints, and the benefits of controls must be considered relative to their costs. Because of the inherent limitations in all control systems, no evaluation of controls can provide absolute assurance that all control issues and instances of fraud, if any, within the Company have been detected.
KPMG LLP, the independent registered public accounting firm that audited the consolidated financial statements in this report, has issued an attestation report on management’s assessment of our internal control over financial reporting, which report is set forth on page 81 of this Report on Form 10-K.
Changes in Internal Control over Financial Reporting
No changes occurred during the quarter ended December 31, 2005 in our internal control over financial reporting that have materially affected, or are reasonably likely to materially affect, our internal control over financial reporting.
New York Stock Exchange Certification
On May 10, 2006, we filed with the New York Stock Exchange the annual certification of our President and Chief Executive Officer, certifying that he was not aware of any violation by us of the New York Stock Exchange’s corporate governance listing standards.
- 80 -
Table of Contents
REPORT OF INDEPENDENT REGISTERED PUBLIC ACCOUNTING FIRM
The Board of Directors and Shareholders
Platinum Underwriters Holdings, Ltd.:
Platinum Underwriters Holdings, Ltd.:
We have audited management’s assessment, included in the accompanying Management’s Report on Internal Control Over Financial Reporting, that Platinum Underwriters Holdings, Ltd. maintained effective internal control over financial reporting as of December 31, 2006, based on criteria established in Internal Control—Integrated Framework issued by the Committee of Sponsoring Organizations of the Treadway Commission (COSO). The Company’s management is responsible for maintaining effective internal control over financial reporting and for its assessment of the effectiveness of internal control over financial reporting. Our responsibility is to express an opinion on management’s assessment and an opinion on the effectiveness of the Company’s internal control over financial reporting based on our audit.
We conducted our audit in accordance with the standards of the Public Company Accounting Oversight Board (United States). Those standards require that we plan and perform the audit to obtain reasonable assurance about whether effective internal control over financial reporting was maintained in all material respects. Our audit included obtaining an understanding of internal control over financial reporting, evaluating management’s assessment, testing and evaluating the design and operating effectiveness of internal control, and performing such other procedures as we considered necessary in the circumstances. We believe that our audit provides a reasonable basis for our opinion.
A company’s internal control over financial reporting is a process designed to provide reasonable assurance regarding the reliability of financial reporting and the preparation of financial statements for external purposes in accordance with generally accepted accounting principles. A company’s internal control over financial reporting includes those policies and procedures that (1) pertain to the maintenance of records that, in reasonable detail, accurately and fairly reflect the transactions and dispositions of the assets of the company; (2) provide reasonable assurance that transactions are recorded as necessary to permit preparation of financial statements in accordance with generally accepted accounting principles, and that receipts and expenditures of the company are being made only in accordance with authorizations of management and directors of the company; and (3) provide reasonable assurance regarding prevention or timely detection of unauthorized acquisition, use, or disposition of the company’s assets that could have a material effect on the financial statements.
Because of its inherent limitations, internal control over financial reporting may not prevent or detect misstatements. Also, projections of any evaluation of effectiveness to future periods are subject to the risk that controls may become inadequate because of changes in conditions, or that the degree of compliance with the policies or procedures may deteriorate.
In our opinion, management’s assessment that Platinum Underwriters Holdings, Ltd. maintained effective internal control over financial reporting as of December 31, 2006, is fairly stated, in all material respects, based on criteria established in Internal Control—Integrated Framework issued by the Committee of Sponsoring Organizations of the Treadway Commission (COSO). Also in our opinion, Platinum Underwriters Holdings, Ltd. maintained, in all material respects, effective internal control over financial reporting as of December 31, 2006, based on criteria established in Internal Control — Integrated Framework issued by the Committee of Sponsoring Organizations of the Treadway Commission (COSO).
- 81 -
Table of Contents
We have also audited, in accordance with the standards of the Public Company Accounting Oversight Board (United States), the consolidated balance sheets of Platinum Underwriters Holdings, Ltd. and subsidiaries as of December 31, 2006 and 2005, and the related consolidated statements of operations and comprehensive income (loss), shareholders’ equity, and cash flows for each of the years in the three-year period ended December 31, 2006, and our report dated February 27, 2007 expressed an unqualified opinion on these consolidated financial statements. Our report refers to a change in the method of accounting for share-based payments in 2006.
/s/ KPMG LLP
New York, New York
February 27, 2007
February 27, 2007
- 82 -
Table of Contents
Item 9B. Other Information
None.
PART III
Item 10. Directors, Executive Officers and Corporate Governance
The information required by this Item relating to our directors, executive officers and corporate governance is incorporated herein by reference to “Proposal 1 — Election of Directors” under the headings “Information Concerning Nominees,” “Information Concerning Executive Officers,” “Board of Directors,” “Audit Committee” and “Section 16(a) Beneficial Ownership Reporting Compliance” of our definitive proxy statement to be filed pursuant to Regulation 14A of the Exchange Act for our 2007 Annual General Meeting of Shareholders (our “Proxy Statement”). We intend to file the Proxy Statement prior to April 30, 2007.
Code of Ethics
We have adopted a written Code of Ethics within the meaning of Item 406 of Regulation S-K of the Exchange Act. Our Code of Ethics applies to all of our directors and employees including, without limitation, our principal executive officer, our principal financial officer, our principal accounting officer and all of our employees performing financial or accounting functions. A copy of our Code of Ethics is posted on our website atwww.platinumre.com and may be found under the “Investor Relations” section by clicking on “Corporate Governance.” In the event that we make any amendment to, or grant any waiver from, a provision of our Code of Ethics that requires disclosure under Item 5.05 of Form 8-K, we will post such information on our website at the location specified above. We will provide, without charge, a copy of our Code of Ethics to any person submitting such request to our corporate secretary at our principal executive offices.
Item 11. Executive Compensation
The information required by this Item relating to executive compensation is incorporated herein by reference to “Proposal 1 — Election of Directors” under the heading “Executive Compensation” of our Proxy Statement.
Item 12. Security Ownership of Certain Beneficial Owners and Management and Related Shareholder Matters
The information required by this Item relating to security ownership of certain beneficial owners and management and related shareholder matters is incorporated herein by reference to “Proposal 1 — Election of Directors” under the headings “Security Ownership of Certain Beneficial Owners” and “Security Ownership of Management” of our Proxy Statement.
Equity Based Compensation Information
The following table summarizes information as of December 31, 2006 relating to our equity based compensation plans pursuant to which grants of options, restricted shares, share appreciation rights, share units or other rights to acquire shares may be granted from time to time.
- 83 -
Table of Contents
| (a) | (b) | (c) | ||||||||||
| Number of | Weighted- | Number of Securities | ||||||||||
| Securities to be | Average | Remaining Available | ||||||||||
| Issued upon | Exercise Price | for Future Issuance | ||||||||||
| Exercise of | of Outstanding | under Equity | ||||||||||
| Outstanding | Options, | Compensation Plans | ||||||||||
| Options, Warrants | Warrants and | (excluding securities | ||||||||||
| Plan Category | and Rights | Rights | reflected in column (a)) | |||||||||
| Equity compensation plans approved by security holders (1) | 3,786,915 | $ | 24.20 | 5,564,492 | ||||||||
| Equity compensation plans not approved by security holders | — | — | — | |||||||||
| Total | 3,786,915 | $ | 24.20 | 5,564,492 | ||||||||
| (1) | These plans consist of the 2002 Share Incentive Plan, which was approved by our shareholders at the 2004 Annual General Meeting of Shareholders, the 2006 Share Incentive Plan, which was approved by our shareholders at the 2006 Annual General Meeting of Shareholders and replaced the 2002 Share Incentive Plan, and the Share Incentive Plan for Nonemployee Directors which was approved by our sole shareholder prior to our initial public offering in 2002. |
Item 13. Certain Relationships and Related Transactions, and Director Independence
The information required by this Item relating to certain relationships and related transactions and director independence is incorporated by reference to “Proposal 1 — Election of Directors” under the headings “Transactions with Related Persons” and “Independence of Directors” of our Proxy Statement.
Item 14. Principal Accountant Fees and Services
The information required by this Item relating to principal accountant fees and services is incorporated herein by reference to “Proposal 2 — Ratification of Selection of the Independent Registered Public Accounting Firm for the 2007 Fiscal Year” of our Proxy Statement.
PART IV
Item 15. Exhibits and Financial Statement Schedules
Financial Statements
Our consolidated financial statements as of December 31, 2006 and 2005 and for each of the years in the three-year period ended December 31, 2006, together with the report thereon by KPMG LLP, our independent registered public accounting firm, are set forth on pages F-1 through F-47 hereto.
Schedules Supporting Financial Statements
The schedules relating to our consolidated financial statements as of December 31, 2006 and 2005 and for each of the three years in the period ended December 31, 2006, together with the independent registered public accounting firm’s report thereon, are set forth on pages S-1 through S-8 hereto. Schedules not referred to have been omitted as inapplicable or not required by Regulation S-X.
- 84 -
Table of Contents
Exhibits
| Exhibit | ||
| Number | Description | |
| 2.1 | Formation and Separation Agreement dated October 28, 2002 between The St. Paul Companies, Inc. and Platinum Holdings.(2) | |
| 3(i).1 | Memorandum of Association of Platinum Holdings.(1) | |
| 3(ii).1 | Bye-Laws of Platinum Holdings.(27) | |
| 3(ii).2 | Certificate of Designation of 6% Series A Mandatory Convertible Preferred Shares of Platinum Holdings dated December 1, 2005.(22) | |
| 4.1 | Form of Certificate of the Common Shares of Platinum Holdings.(2) | |
| 4.2 | Indenture dated October 10, 2002 among Platinum Holdings, Platinum Finance and JP Morgan Chase.(2) | |
| 4.3 | Indenture Supplement dated November 1, 2002 among Platinum Holdings, Platinum Finance and JP Morgan Chase.(2) | |
| 4.4 | Second Supplemental Indenture dated August 16, 2005 between Platinum Holdings, Platinum Finance and JP Morgan Chase.(18) | |
| 4.5 | Indenture dated May 26, 2005 between Platinum Holdings, Platinum Finance and JP Morgan Chase.(15) | |
| 4.6 | First Supplemental Indenture dated May 26, 2005 between Platinum Holdings, Platinum Finance and JP Morgan Chase.(15) | |
| 4.7 | Second Supplemental Indenture dated as of November 2, 2005 among Platinum Finance, Platinum Holdings and JP Morgan Chase.(20) | |
| 4.8 | Purchase Contract Agreement dated November 1, 2002 between Platinum Holdings and JP Morgan Chase.(2) | |
| 4.9 | Form of Senior Note of Platinum Finance.(2) | |
| 4.10 | Form of Guarantee of Platinum Holdings.(2) | |
| 4.11 | Exchange and Registration Rights Agreement dated May 26, 2005 among Platinum Holdings, Platinum Finance and Goldman, Sachs & Co.(15) | |
| 4.12 | Exchange and Registration Rights Agreement dated August 16, 2005 between Platinum Holdings, Platinum Finance, and Goldman, Sachs & Co. and Merrill Lynch.(18) | |
| 4.13 | Transfer Restrictions, Registration Rights and Standstill Agreement dated November 1, 2002 between Platinum Holdings and Renaissance Re.(2) | |
| 4.14 | Amendment No. 1 dated December 5, 2005 to the Transfer Restrictions, Registration Rights and Standstill Agreement dated November 1, 2002 between Platinum Holdings and RenaissanceRe.(22) | |
| 10.1* | Share Unit Plan for Non-Employee Directors.(24) | |
| 10.2* | Form of Nonemployee Director Share Unit Award Agreement.(23) |
- 85 -
Table of Contents
| Exhibit | ||
| Number | Description | |
| 10.3* | 2002 Share Incentive Plan (2004 Update).(5) | |
| 10.4* | 2002 Share Incentive Plan (UK Sub-Plan) (included in Exhibit 10.3).(5) | |
| 10.5* | 2006 Share Incentive Plan.(30) | |
| 10.6 * | Amended and Restated Annual Incentive Plan.(26) | |
| 10.7* | Section 162(m) Performance Incentive Plan.(5) | |
| 10.8* | Executive Retirement Savings Plan.(5) | |
| 10.9* | Executive Bonus Deferral Plan.(5) | |
| 10.10* | Amended and Restated Executive Incentive Plan.(26) | |
| 10.11* | Form of EIP Share Unit Award Agreement.(23) | |
| 10.12* | Capital Accumulation Plan.(2) | |
| 10.13* | Form of Nonqualified Share Option Agreement (Employee).(9) | |
| 10.14* | Form of Nonqualified Share Option Agreement (New Nonemployee Director).(9) | |
| 10.15* | Form of Nonqualified Share Option Agreement (Annual Nonemployee Director).(9) | |
| 10.16* | Form of Time-Based Share Unit Award Agreement.(9) | |
| 10.17* | Form of Special Share Unit Award Agreement.(9) | |
| 10.18* | Form of Restricted Share Award Agreement.(9) | |
| 10.19* | Employment Agreement dated November 1, 2005 between Platinum Holdings and Michael E. Lombardozzi.(21) | |
| 10.20* | Amended Letter Agreement dated October 27, 2005 between Platinum Holdings and Steven H. Newman.(19) | |
| 10.21* | Amended Consulting Agreement dated October 27, 2005 between Platinum US, Steven H. Newman and SHN Enterprises, Inc.(19) | |
| 10.22* | Amendment dated April 27, 2005 to the Letter Agreement between Platinum US and SHN dated March 1, 2002.(11) | |
| 10.23* | Employment Agreement dated August 4, 2004 between Michael D. Price and Platinum Holdings.(6) | |
| 10.24* | Amendment dated February 21, 2007 to the Employment Agreement dated August 4, 2004 between Michael D. Price and Platinum Holdings.(26) | |
| 10.25* | Employment Agreement dated June 24, 2004 between Joseph F. Fisher and Platinum Holdings.(6) | |
| 10.26* | Amended and Restated Letter Agreement dated February 26, 2006 between Platinum Holdings and Gregory E.A. Morrison.(23) |
- 86 -
Table of Contents
| Exhibit | ||
| Number | Description | |
| 10.27* | Employment Agreement dated February 26, 2006 between Platinum Bermuda and Robert S. Porter.(23) | |
| 10.28* | Letter Agreement dated July 25, 2006 between H. Elizabeth Mitchell and Platinum US.(24) | |
| 10.29 | Capital Support Agreement dated November 26, 2002 between Platinum Holdings and Platinum US.(2) | |
| 10.30 | Option Agreement dated November 1, 2002 between St. Paul and Platinum Holdings.(2) | |
| 10.31 | Amendment dated January 10, 2005 to the Option Agreement dated November 1, 2002 among St. Paul Reinsurance Company Limited, Platinum Holdings and St. Paul.(8) | |
| 10.32 | Amendment dated January 10, 2005 to the Option Agreement dated November 1, 2002 between St. Paul and Platinum Holdings.(8) | |
| 10.33 | Investment Management Agreement dated May 12, 2005 between Platinum US and Hyperion Capital Management, Inc.(12) | |
| 10.34 | Investment Management Agreement dated May 12, 2005 between Platinum Bermuda and Hyperion Capital Management, Inc. (12) | |
| 10.35 | Investment Management Agreement dated May 12, 2005 between Platinum Holdings, Platinum Bermuda, Platinum Regency and BlackRock Financial Management, Inc.(12) | |
| 10.36 | Investment Management Agreement dated May 12, 2005 between Platinum UK and BlackRock Financial Management, Inc.(12) | |
| 10.37 | Investment Management Agreement dated May 12, 2005 between Platinum US, Platinum Finance and BlackRock Financial Management, Inc.(12) | |
| 10.38 | Investment Agreement dated September 20, 2002 among Platinum Holdings, St. Paul, and RenaissanceRe.(2) | |
| 10.39 | First Amendment dated November 1, 2002 to the Investment Agreement dated September 20, 2002 among Platinum Holdings, St. Paul, and RenaissanceRe.(2) | |
| 10.40 | Option Agreement dated November 1, 2002 between Platinum Holdings and RenaissanceRe.(2) | |
| 10.41 | Amended and Restated Option Agreement dated November 18, 2004 between Platinum Holdings and RenaissanceRe.(7) | |
| 10.42 | Services and Capacity Reservation Agreement dated November 1, 2002 between Platinum Holdings and RenaissanceRe.(2) | |
| 10.43 | Quota Share Retrocession Agreement dated November 26, 2002 between Platinum Bermuda and Platinum UK.(2) | |
| 10.44 | Quota Share Retrocession Agreement dated March 27, 2003 between Platinum Bermuda and Platinum UK.(5) | |
| 10.45 | Addendum No. 1 effective April 1, 2003 to the Quota Share Retrocession Agreement dated March 27, 2003, between Platinum Bermuda and Platinum UK.(5) |
- 87 -
Table of Contents
| Exhibit | ||
| Number | Description | |
| 10.46 | Addendum No. 2 effective March 27, 2003 to the Quota Share Retrocession Agreement dated March 27, 2003, between Platinum Bermuda and Platinum UK.(5) | |
| 10.47 | Addendum No. 3 effective April 1, 2005 to the Quota Share Reinsurance Agreement dated March 27, 2003 between Platinum Bermuda and Platinum UK.(10) | |
| 10.48 | Security Agreement dated November 26, 2002 between Platinum Bermuda and Platinum UK.(2) | |
| 10.49 | Addendum No. 1 effective January 1, 2004 to the Security Agreement dated November 26, 2002, between Platinum Bermuda and Platinum UK.(5) | |
| 10.50 | Control Agreement dated November 26, 2002 among Platinum Bermuda, Platinum UK and State Street Bank.(2) | |
| 10.51 | Discretionary Investment Advisory Agreement dated November 26, 2002 between Platinum Bermuda and Platinum UK.(2) | |
| 10.52 | Trust Agreement effective January 1, 2003 among Platinum Bermuda, Platinum US and State Street Bank.(3) | |
| 10.53 | Quota Share Retrocession Agreement dated May 13, 2003 between Platinum Bermuda and Platinum US.(3) | |
| 10.54 | Addendum No. 1 dated December 31, 2003 to the Quota Share Retrocession Agreement dated May 13, 2003, between Platinum Bermuda and Platinum US.(4) | |
| 10.55 | Addendum No. 2 effective as of April 1, 2005 to the Quota Share Retrocession Agreement between Platinum Bermuda and Platinum US.(13) | |
| 10.56 | Quota Share Retrocession Agreement dated May 6, 2004 between Platinum Bermuda and Platinum US.(6) | |
| 10.57 | Amended and Restated Quota Share Retrocession Agreement dated January 1, 2006 between Platinum Bermuda and Platinum US.(27) | |
| 10.58 | Excess of Loss Retrocession Agreement by and between Platinum Bermuda and Platinum US dated as of April 1, 2006.(28) | |
| 10.59 | Quota Share Retrocession Agreement by and between Platinum Underwriters Bermuda, Ltd. and Platinum Re (UK) Limited dated as of January 1, 2006.(28) | |
| 10.60 | Excess of Loss Retrocession Agreement effective as of April 1, 2005 between Platinum US and Platinum UK.(13) | |
| 10.61 | Termination Addendum effective December 31, 2006 to Amended and Restated Quota Share Retrocession Agreement dated April 11, 2006 between Platinum Bermuda and Platinum US. | |
| 10.62 | Casualty and Specialty Quota Share Retrocession Agreement between Platinum Bermuda and Platinum US dated as of January 1, 2007. |
- 88 -
Table of Contents
| Exhibit | ||
| Number | Description | |
| 10.63 | Amended and Restated Credit Agreement, dated as of September 13, 2006, by and among the Company, certain subsidiaries of the Company, Wachovia Bank, National Association, Citibank, N.A., HSBC Bank USA, National Association, Bayerische Hypo-Und Vereinsbank AG and Comerica Bank as the Lenders, and Wachovia Bank, National Association, as Administrative Agent.(25) | |
| 10.64 | List of Contents of exhibits and Schedules to the Amended and Restated Credit Agreement.(25) | |
| 10.65 | Referral Agreement between Platinum Bermuda and Renaissance Underwriting Managers Ltd.(3) | |
| 10.66 | Referral Agreement between Platinum US and Renaissance Underwriting Managers Ltd.(4) | |
| 10.67 | Guaranty dated December 31, 2003 between Platinum Holdings and Platinum US.(4) | |
| 10.68 | Amendment No. 1 dated January 1, 2005 to Guaranty dated December 31, 2003 between Platinum Holdings and Platinum US.(16) | |
| 10.69 | Guarantee dated December 31, 2003 between Platinum Holdings and Platinum UK.(4) | |
| 10.70 | Purchase Agreement dated May 20, 2005 among Platinum Holdings, Platinum Finance and Goldman, Sachs & Co.(14) | |
| 10.71 | Remarketing Agreement dated August 8, 2005 among Platinum Holdings, Platinum Finance, Goldman, Sachs & Co. and Merrill Lynch.(16) | |
| 10.72 | Pledge Agreement dated November 1, 2002 among Platinum Holdings, State Street Bank and Trust Company and JP Morgan Chase.(2) | |
| 21.1 | Subsidiaries of Platinum Holdings. | |
| 23.1 | Independent Registered Public Accounting Firm’s Consent. | |
| 31.1 | Certification of Michael D. Price, Chief Executive Officer of Platinum Holdings, pursuant to Rule 13a-14(a) or Rule 15d-14(a) of the Securities Exchange Act of 1934, as amended. | |
| 31.2 | Certification of Joseph F. Fisher, Chief Financial Officer of Platinum Holdings, pursuant to Rule 13a-14(a) or Rule 15d-14(a) of the Securities Exchange Act of 1934, as amended. | |
| 32.1 | Certification of Michael D. Price, Chief Executive Officer of Platinum Holdings, pursuant to 18 U.S.C. Section 1350, as adopted pursuant to section 906 of the Sarbanes-Oxley Act of 2002. | |
| 32.2 | Certification of Joseph F. Fisher, Chief Financial Officer of Platinum Holdings, pursuant to 18 U.S.C. Section 1350, as adopted pursuant to section 906 of the Sarbanes-Oxley Act of 2002. |
| * | Items denoted with an asterisk represent management contracts or compensatory plans or arrangements. | |
| (1) | Incorporated by reference from the Registration Statement on Form S-1 (Registration No. 333-86906) of Platinum Holdings. |
- 89 -
Table of Contents
| (2) | Incorporated by reference from Platinum Holdings’ Annual Report on Form 10-K for the year ended December 31, 2002, filed with the SEC on March 31, 2003. | |
| (3) | Incorporated by reference from Platinum Holdings’ Quarterly Report on Form 10-Q for the quarter ended June 30, 2003, filed with the SEC on August 14, 2003. | |
| (4) | Incorporated by reference from Platinum Holdings’ Annual Report on Form 10-K for the year ended December 31, 2003, filed with the SEC on March 15, 2004. | |
| (5) | Incorporated by reference from Platinum Holdings’ Quarterly Report on Form 10-Q for the quarter ended March 31, 2004, filed with the SEC on May 10, 2004. | |
| (6) | Incorporated by reference from Platinum Holdings’ Quarterly Report on Form 10-Q for the quarter ended June 30, 2004, filed with the SEC on August 6, 2004. | |
| (7) | Incorporated by reference from Platinum Holdings’ Current Report on Form 8-K, filed with the SEC on November 18, 2004. | |
| (8) | Incorporated by reference from Platinum Holdings’ Current Report on Form 8-K, filed with the SEC on January 11, 2005. | |
| (9) | Incorporated by reference from Platinum Holdings’ Current Report on Form 8-K, filed with the SEC on February 23, 2005. | |
| (10) | Incorporated by reference from Platinum Holdings’ Current Report on Form 8-K, filed with the SEC on April 14, 2005. | |
| (11) | Incorporated by reference from Platinum Holdings’ Current Report on Form 8-K, filed with the SEC on April 28, 2005. | |
| (12) | Incorporated by reference from Platinum Holdings’ Current Report on Form 8-K, filed with the SEC on May 13, 2005. | |
| (13) | Incorporated by reference from Platinum Holdings’ Current Report on Form 8-K, filed with the SEC on May 18, 2005. | |
| (14) | Incorporated by reference from Platinum Holdings’ Current Report on Form 8-K, filed with the SEC on May 24, 2005. | |
| (15) | Incorporated by reference from Platinum Holdings’ Current Report on Form 8-K, filed with the SEC on May 27, 2005. | |
| (16) | Incorporated by reference from Platinum Holdings’ Quarterly Report on Form 10-Q for the quarter ended June 30, 2005, filed with the SEC on August 5, 2005. | |
| (17) | Incorporated by reference from Platinum Holdings’ Current Report on Form 8-K, filed with the SEC on August 9, 2005. | |
| (18) | Incorporated by reference from Platinum Holdings’ Current Report on Form 8-K, filed with the SEC on August 17, 2005. | |
| (19) | Incorporated by reference from Platinum Holdings’ Current Report on Form 8-K, filed with the SEC on October 28, 2005. | |
| (20) | Incorporated by reference from Platinum Holdings’ Current Report on Form 8-K, filed with the SEC on November 3, 2005. | |
| (21) | Incorporated by reference from Platinum Holdings’ Current Report on Form 8-K, filed with the SEC on November 21, 2005. |
- 90 -
Table of Contents
| (22) | Incorporated by reference from Platinum Holdings’ Current Report on Form 8-K, filed with the SEC on December 6, 2005. | |
| (23) | Incorporated by reference from Platinum Holdings’ Current Report on Form 8-K, filed with the SEC on February 27, 2006. | |
| (24) | Incorporated by reference from Platinum Holdings’ Current Report on Form 8-K, filed with the SEC on July 26, 2006. | |
| (25) | Incorporated by reference from Platinum Holdings’ Current Report on Form 8-K, filed with the SEC on September 18, 2006. | |
| (26) | Incorporated by reference from Platinum Holding’s Current Report on Form 8-K, filed with the SEC on February 22, 2007. | |
| (27) | Incorporated by reference from Platinum Holdings’ Quarterly Report on Form 10-Q for the quarter ended March 31, 2006, filed with the SEC on April 28, 2006. | |
| (28) | Incorporated by reference from Platinum Holdings’ Quarterly Report on Form 10-Q for the quarter ended June 30, 2006, filed with the SEC on July 31, 2006. | |
| (29) | Incorporated by reference from Platinum Holdings’ Quarterly Report on Form 10-Q for the quarter ended September 30, 2006, filed with the SEC on October 30, 2006. | |
| (30) | Incorporated by reference from the Registration Statement on Form S-8 (Registration No. 333-133521) of Platinum Holdings, filed with the SEC on April 25, 2006. |
- 91 -
Table of Contents
SIGNATURES
Pursuant to the requirements of Section 13 or 15(d) of the Securities Exchange Act of 1934, the Registrant has duly caused this report to be signed on its behalf by the undersigned, thereunto duly authorized.
Date: February 21, 2007
| PLATINUM UNDERWRITERS HOLDINGS, LTD. | ||||
| /s/ Michael D. Price | ||||
| Michael D. Price | ||||
| President and Chief Executive Officer | ||||
Pursuant to the requirements of the Securities Exchange Act of 1934, this report has been signed below by the following persons on behalf of the registrant and in the capacities and on the dates indicated.
| Signature | Title | Date | ||
| /s/ Michael D. Price | President, Chief Executive Officer and Director | February 21, 2007 | ||
| Michael D. Price | (Principal Executive Officer) | |||
| /s/ Joseph F. Fisher | Executive Vice President and Chief Financial Officer | February 21, 2007 | ||
| Joseph F. Fisher | (Principal Financial Officer) | |||
| /s/ James A. Krantz | Senior Vice President and Chief Accounting Officer | February 21, 2007 | ||
| James A. Krantz | (Principal Accounting Officer) | |||
| /s/ Steven H. Newman | Chairman of the Board of Directors | February 21, 2007 | ||
| Steven H. Newman | ||||
| /s/ H. Furlong Baldwin | Director | February 21, 2007 | ||
| H. Furlong Baldwin | ||||
| /s/ Jonathan F. Bank | Director | February 21, 2007 | ||
| Jonathan F. Bank | ||||
| /s/ Dan R. Carmichael | Director | February 21, 2007 | ||
| Dan R. Carmichael | ||||
| /s/ Robert V. Deutsch | Director | February 21, 2007 | ||
| Robert V. Deutsch | ||||
| /s/ Peter T. Pruitt | Director | February 21, 2007 | ||
| Peter T. Pruitt |
- 92 -
Table of Contents
PLATINUM UNDERWRITERS HOLDINGS, LTD. AND SUBSIDIARIES
CONSOLIDATED FINANCIAL STATEMENTS
CONSOLIDATED FINANCIAL STATEMENTS
Table of Contents Page
| Page | ||
| F-2 | ||
| F-3 | ||
| F-4 | ||
| F-5 | ||
| F-6 | ||
| F-7 |
F-1
Table of Contents
REPORT OF INDEPENDENT REGISTERED PUBLIC ACCOUNTING FIRM
The Board of Directors and Shareholders
Platinum Underwriters Holdings, Ltd.:
Platinum Underwriters Holdings, Ltd.:
We have audited the accompanying consolidated balance sheets of Platinum Underwriters Holdings, Ltd. and subsidiaries as of December 31, 2006 and 2005, and the related consolidated statements of operations and comprehensive income (loss), shareholders’ equity, and cash flows for each of the years in the three-year period ended December 31, 2006. These consolidated financial statements are the responsibility of the Company’s management. Our responsibility is to express an opinion on these consolidated financial statements based on our audits.
We conducted our audits in accordance with the standards of the Public Company Accounting Oversight Board (United States). Those standards require that we plan and perform the audit to obtain reasonable assurance about whether the financial statements are free of material misstatement. An audit includes examining, on a test basis, evidence supporting the amounts and disclosures in the financial statements. An audit also includes assessing the accounting principles used and significant estimates made by management, as well as evaluating the overall financial statement presentation. We believe that our audits provide a reasonable basis for our opinion.
In our opinion, the consolidated financial statements referred to above present fairly, in all material respects, the financial position of Platinum Underwriters Holdings, Ltd. and subsidiaries as of December 31, 2006 and 2005, and the results of their operations and their cash flows for each of the years in the three-year period ended December 31, 2006 in conformity with U. S. generally accepted accounting principles.
As discussed in Note 1 to the consolidated financial statements, in 2006, the Company changed its method of accounting for share-based payments.
We also have audited, in accordance with the standards of the Public Company Accounting Oversight Board (United States), the effectiveness of Platinum Underwriters Holdings, Ltd. and subsidiaries’ internal control over financial reporting as of December 31, 2006, based on criteria established in Internal Control—Integrated Framework issued by the Committee of Sponsoring Organizations of the Treadway Commission (COSO), and our report dated February 27, 2007 expressed an unqualified opinion on management’s assessment of, and the effective operation of, internal control over financial reporting.
/s/ KPMG LLP
New York, New York
February 27, 2007
February 27, 2007
F-2
Table of Contents
Platinum Underwriters Holdings, Ltd. and Subsidiaries
Consolidated Balance Sheets
December 31, 2006 and 2005
(amounts in thousands, except share data)
December 31, 2006 and 2005
(amounts in thousands, except share data)
| 2006 | 2005 | |||||||
ASSETS | ||||||||
| Investments: | ||||||||
| Fixed maturity available-for-sale securities at fair value (amortized cost – $3,276,970 and $2,936,152, respectively) | $ | 3,226,354 | $ | 2,888,922 | ||||
| Fixed maturity trading securities at fair value (amortized cost – $110,845 and $99,141, respectively) | 108,291 | 98,781 | ||||||
| Preferred stocks (cost – $11,246 and $8,735, respectively) | 10,772 | 8,186 | ||||||
| Other invested asset | 4,745 | 5,000 | ||||||
| Short-term investments | 27,123 | 8,793 | ||||||
| Total investments | 3,377,285 | 3,009,682 | ||||||
| Cash and cash equivalents | 851,652 | 820,746 | ||||||
| Accrued investment income | 32,682 | 29,230 | ||||||
| Reinsurance premiums receivable | 377,183 | 567,449 | ||||||
| Reinsurance recoverable on ceded losses and loss adjustment expenses | 57,956 | 68,210 | ||||||
| Prepaid reinsurance premiums | 9,680 | 7,899 | ||||||
| Funds held by ceding companies | 238,499 | 291,629 | ||||||
| Deferred acquisition costs | 82,610 | 130,800 | ||||||
| Income tax recoverable | 7,515 | 24,522 | ||||||
| Deferred tax assets | 38,577 | 31,934 | ||||||
| Due from investment broker | 5,631 | 157,930 | ||||||
| Other assets | 14,297 | 14,344 | ||||||
| Total assets | $ | 5,093,567 | $ | 5,154,375 | ||||
LIABILITIES AND SHAREHOLDERS’ EQUITY | ||||||||
| Liabilities | ||||||||
| Unpaid losses and loss adjustment expenses | $ | 2,368,482 | $ | 2,323,990 | ||||
| Unearned premiums | 349,792 | 502,018 | ||||||
| Reinsurance deposit liabilities | 4,009 | 6,048 | ||||||
| Debt obligations | 292,840 | 292,840 | ||||||
| Ceded premiums payable | 17,597 | 22,544 | ||||||
| Commissions payable | 140,835 | 186,654 | ||||||
| Deferred tax liabilities | 4,234 | 118 | ||||||
| Due to investment broker | — | 259,834 | ||||||
| Other liabilities | 57,717 | 20,080 | ||||||
| Total liabilities | 3,235,506 | 3,614,126 | ||||||
| Shareholders’ Equity | ||||||||
| Preferred shares, $.01 par value, 25,000,000 shares authorized, 5,750,000 shares issued and outstanding | 57 | 57 | ||||||
| Common shares, $.01 par value, 200,000,000 shares authorized, 59,671,959 and 59,126,675 shares issued and outstanding, respectively | 597 | 590 | ||||||
| Additional paid-in capital | 1,545,979 | 1,527,316 | ||||||
| Unearned share grant compensation | — | (2,467 | ) | |||||
| Accumulated other comprehensive loss | (44,289 | ) | (40,718 | ) | ||||
| Retained earnings | 355,717 | 55,471 | ||||||
| Total shareholders’ equity | 1,858,061 | 1,540,249 | ||||||
| Total liabilities and shareholders’ equity | $ | 5,093,567 | $ | 5,154,375 | ||||
See accompanying notes to consolidated financial statements.
F-3
Table of Contents
Platinum Underwriters Holdings, Ltd. and Subsidiaries
Consolidated Statements of Operations and Comprehensive Income (Loss)
For the years ended December 31, 2006, 2005 and 2004
For the years ended December 31, 2006, 2005 and 2004
(amounts in thousands, except share data)
| 2006 | 2005 | 2004 | ||||||||||
| Revenue: | ||||||||||||
| Net premiums earned | $ | 1,336,701 | 1,714,723 | $ | 1,447,935 | |||||||
| Net investment income | 187,987 | 129,445 | 84,532 | |||||||||
| Net realized gains (losses) on investments | 1,090 | (3,046 | ) | 1,955 | ||||||||
| Other income (expense) | (2,872 | ) | (586 | ) | 3,211 | |||||||
| Total revenue | 1,522,906 | 1,840,536 | 1,537,633 | |||||||||
| Expenses: | ||||||||||||
| Net losses and loss adjustment expenses | 760,602 | 1,505,425 | 1,019,804 | |||||||||
| Net acquisition expenses | 285,923 | 403,135 | 327,821 | |||||||||
| Operating expenses | 95,490 | 69,827 | 66,333 | |||||||||
| Net foreign currency exchange losses (gains) | (738 | ) | 2,111 | (725 | ) | |||||||
| Interest expense | 21,805 | 20,006 | 9,268 | |||||||||
| Loss on repurchase of debt | — | 2,486 | — | |||||||||
| Total expenses | 1,163,082 | 2,002,990 | 1,422,501 | |||||||||
| Income (loss) before income tax expense (benefit) | 359,824 | (162,454 | ) | 115,132 | ||||||||
| Income tax expense (benefit) | 30,167 | (24,967 | ) | 30,349 | ||||||||
| Net income (loss) | 329,657 | (137,487 | ) | 84,783 | ||||||||
| Preferred dividends | 10,382 | 737 | — | |||||||||
| Net income (loss) attributable to common shareholders | $ | 319,275 | (138,224 | ) | $ | 84,783 | ||||||
| Earnings (loss) per common share: | ||||||||||||
| Basic earnings (loss) per common share | $ | 5.38 | (3.01 | ) | $ | 1.96 | ||||||
| Diluted earnings (loss) per common share | $ | 4.96 | (3.01 | ) | $ | 1.81 | ||||||
| Comprehensive income (loss): | ||||||||||||
| Net income (loss) | $ | 329,657 | (137,487 | ) | $ | 84,783 | ||||||
| Other comprehensive income (loss): | ||||||||||||
| Net change in unrealized gains and losses on available-for-sale securities, net of deferred tax | (3,887 | ) | (52,454 | ) | (6,910 | ) | ||||||
| Cumulative translation adjustments, net of deferred tax | 316 | (516 | ) | 388 | ||||||||
| Comprehensive income (loss) | $ | 326,086 | (190,457 | ) | $ | 78,261 | ||||||
| Shareholder dividends: | ||||||||||||
| Preferred dividends declared | 9,818 | — | — | |||||||||
| Preferred dividends declared per share | 1.71 | — | — | |||||||||
| Common shareholder dividends declared | $ | 19,029 | 14,775 | $ | 13,807 | |||||||
| Dividends declared per common share | $ | 0.32 | 0.32 | $ | 0.32 | |||||||
See accompanying notes to consolidated financial statements.
F-4
Table of Contents
Platinum Underwriters Holdings, Ltd. and Subsidiaries
Consolidated Statements of Shareholders’ Equity
For the years ended December 31, 2006, 2005 and 2004
For the years ended December 31, 2006, 2005 and 2004
(amounts in thousands)
| 2006 | 2005 | 2004 | ||||||||||
| Preferred shares: | ||||||||||||
| Balances at beginning of year | $ | 57 | — | $ | — | |||||||
| Issuance of preferred shares | — | 57 | — | |||||||||
| Balances at end of year | 57 | 57 | — | |||||||||
| Common shares: | ||||||||||||
| Balances at beginning of year | 590 | 430 | 430 | |||||||||
| Exercise of share options | 6 | 7 | 2 | |||||||||
| Issuance of restricted shares and shares for share units | — | 1 | — | |||||||||
| Issuance of common shares | 1 | 152 | 1 | |||||||||
| Purchase of common shares | — | — | (3 | ) | ||||||||
| Balances at end of year | 597 | 590 | 430 | |||||||||
| Additional paid-in-capital: | ||||||||||||
| Balances at beginning of year | 1,527,316 | 911,851 | 910,505 | |||||||||
| Transfer of unearned common share grant compensation | (2,467 | ) | — | — | ||||||||
| Exercise of share options | 12,969 | 15,020 | 7,405 | |||||||||
| Issuance of restricted shares and shares for share units | — | 3,274 | — | |||||||||
| Share based compensation | 7,995 | 3,516 | 2,358 | |||||||||
| Issuance of common shares | — | 425,604 | 1,565 | |||||||||
| Issuance of preferred shares | — | 167,451 | — | |||||||||
| Purchase of common shares | — | — | (9,982 | ) | ||||||||
| Tax benefit of share options | 166 | 600 | — | |||||||||
| Balances at end of year | 1,545,979 | 1,527,316 | 911,851 | |||||||||
| Unearned share grant compensation: | ||||||||||||
| Balances at beginning of year | (2,467 | ) | — | — | ||||||||
| Transfer of unearned common share grant compensation | 2,467 | — | — | |||||||||
| Shares issued | — | (3,275 | ) | — | ||||||||
| Amortization | — | 808 | — | |||||||||
| Balances at end of year | — | (2,467 | ) | ��� | ||||||||
| Accumulated other comprehensive income (loss): | ||||||||||||
| Balances at beginning of year | (40,718 | ) | 12,252 | 18,774 | ||||||||
| Net change in unrealized gains and losses on available-for-sale securities, net of deferred tax | (3,887 | ) | (52,454 | ) | (6,910 | ) | ||||||
| Net change in cumulative translation adjustments, net of deferred tax | 316 | (516 | ) | 388 | ||||||||
| Balances at end of year | (44,289 | ) | (40,718 | ) | 12,252 | |||||||
| Retained earnings: | ||||||||||||
| Balances at beginning of year | 55,471 | 208,470 | 137,494 | |||||||||
| Net income (loss) | 329,657 | (137,487 | ) | 84,783 | ||||||||
| Preferred share dividends | (10,382 | ) | (737 | ) | — | |||||||
| Common share dividends | (19,029 | ) | (14,775 | ) | (13,807 | ) | ||||||
| Balances at end of year | 355,717 | 55,471 | 208,470 | |||||||||
| Total shareholders’ equity | $ | 1,858,061 | 1,540,249 | $ | 1,133,003 | |||||||
See accompanying notes to consolidated financial statements.
F-5
Table of Contents
Platinum Underwriters Holdings, Ltd. and Subsidiaries
Consolidated Statements of Cash Flows
For the years ended December 31, 2006, 2005 and 2004
(amounts in thousands)
For the years ended December 31, 2006, 2005 and 2004
(amounts in thousands)
| 2006 | 2005 | 2004 | ||||||||||
| Operating Activities: | ||||||||||||
| Net income (loss) | $ | 329,657 | (137,487 | ) | $ | 84,783 | ||||||
| Adjustments to reconcile net income to cash used in operations: | ||||||||||||
| Depreciation and amortization | 16,213 | 14,993 | 20,642 | |||||||||
| Net realized (gains) losses on investments | (1,090 | ) | 3,046 | (1,955 | ) | |||||||
| Loss on repurchase of debt | — | 2,486 | — | |||||||||
| Net foreign currency exchange (gains) losses | (738 | ) | 2,111 | (725 | ) | |||||||
| Share based compensation | 7,995 | 4,424 | 2,358 | |||||||||
| Deferred income tax expense (benefit) | (2,613 | ) | (24,590 | ) | 2,216 | |||||||
| Trading securities activities | 1,776 | (21,235 | ) | 16,510 | ||||||||
| Changes in assets and liabilities: | ||||||||||||
| Increase in accrued investment income | (3,452 | ) | (5,567 | ) | (6,171 | ) | ||||||
| (Increase) decrease in reinsurance premiums receivable | 195,094 | 12,599 | (92,607 | ) | ||||||||
| (Increase) decrease in funds held by ceding companies | 53,130 | (93,581 | ) | (132,988 | ) | |||||||
| (Increase) decrease in deferred acquisition costs | 48,190 | 5,238 | (56,731 | ) | ||||||||
| Increase (decrease) in net unpaid losses and loss adjustment expenses | 37,188 | 887,563 | 641,062 | |||||||||
| Increase (decrease) in net unearned premiums | (154,007 | ) | (5,417 | ) | 199,680 | |||||||
| Increase (decrease) in reinsurance deposit liabilities | (2,039 | ) | (14,141 | ) | 14,490 | |||||||
| Increase (decrease) in ceded premiums payable | (4,947 | ) | 20,160 | (3,821 | ) | |||||||
| Increase (decrease) in commissions payable | (45,819 | ) | 4,729 | 5,615 | ||||||||
| Increase (decrease) in funds withheld | — | (11,999 | ) | 11,999 | ||||||||
| (Increase) decrease in income tax recoverable | 17,174 | (22,595 | ) | 8,035 | ||||||||
| Changes in other assets and liabilities | 35,496 | (23,598 | ) | 1,944 | ||||||||
| Other net | (407 | ) | 535 | 397 | ||||||||
| Net cash provided by operating activities | 526,801 | 597,674 | 714,733 | |||||||||
| Investing Activities: | ||||||||||||
| Proceeds from sale of available-for-sale securities | 348,142 | 891,799 | 498,945 | |||||||||
| Proceeds from maturity or paydown of available-for-sale securities | 270,939 | 97,931 | 136,472 | |||||||||
| Acquisition of available-for-sale securities | (1,083,282 | ) | (1,711,505 | ) | (1,230,895 | ) | ||||||
| Increase in short-term investments | (15,822 | ) | (8,793 | ) | — | |||||||
| Net cash used in investing activities | (480,023 | ) | (730,568 | ) | (595,478 | ) | ||||||
| Financing Activities: | ||||||||||||
| Dividends paid to preferred shareholders | (9,818 | ) | — | — | ||||||||
| Dividends paid to common shareholders | (19,029 | ) | (14,775 | ) | (13,807 | ) | ||||||
| Proceeds from exercise of share options | 12,975 | 15,027 | 7,406 | |||||||||
| Net proceeds from issuance of common shares | — | 425,756 | 1,567 | |||||||||
| Net proceeds from issuance of preferred shares | — | 167,509 | — | |||||||||
| Net proceeds from issuance of debt securities | — | 246,900 | — | |||||||||
| Purchase of common shares | — | — | (9,985 | ) | ||||||||
| Repurchase of debt obligations | — | (96,674 | ) | — | ||||||||
| Net cash provided by (used in) financing activities | (15,872 | ) | 743,743 | (14,819 | ) | |||||||
| Net increase in cash and cash equivalents | 30,906 | 610,849 | 104,436 | |||||||||
| Cash and cash equivalents at beginning of year | 820,746 | 209,897 | 105,461 | |||||||||
| Cash and cash equivalents at end of year | $ | 851,652 | 820,746 | $ | 209,897 | |||||||
| Supplemental disclosures of cash flow information: | ||||||||||||
| Income taxes paid | $ | 15,602 | 33,569 | $ | 8,549 | |||||||
| Interest paid | $ | 21,479 | 17,662 | $ | 7,442 | |||||||
See accompanying notes to consolidated financial statements.
F-6
Table of Contents
Platinum Underwriters Holdings, Ltd. and Subsidiaries
Notes to Consolidated Financial Statements
1.Basis of Presentation and Summary of Significant Accounting Policies
Basis of Presentation and Consolidation
Platinum Underwriters Holdings, Ltd. (“Platinum Holdings”) is a Bermuda holding company organized in 2002. Platinum Holdings and its subsidiaries (the “Company”) operate through three licensed reinsurance subsidiaries: Platinum Underwriters Bermuda, Ltd. (“Platinum Bermuda”), Platinum Underwriters Reinsurance, Inc. (“Platinum US”) and Platinum Re (UK) Limited (“Platinum UK”). We provide property and marine, casualty and finite risk reinsurance coverages, through reinsurance intermediaries, to a diverse clientele of insurers and select reinsurers on a worldwide basis.
The consolidated financial statements have been prepared in conformity with accounting principles generally accepted in the United States of America (“U.S. GAAP”). These financial statements reflect the consolidated position of the Company, including Platinum Bermuda, Platinum US, Platinum UK, Platinum Underwriters Finance, Inc. (“Platinum Finance”), Platinum Regency Holdings (“Platinum Regency”), Platinum Administrative Services, Inc. and Platinum UK Services Company Limited. Platinum Regency is an intermediate holding company based in Ireland and a wholly owned subsidiary of Platinum Holdings. Platinum Finance is a U.S. based intermediate holding company and a wholly owned subsidiary of Platinum Regency. Platinum Administrative Services, Inc. is a U.S. based service company providing financial, legal and information systems support services to various subsidiaries of the Company. Platinum UK Services Company Limited is a wholly owned subsidiary of Platinum Bermuda based in the United Kingdom that provides administrative services to Platinum Bermuda. All material intercompany transactions have been eliminated in preparing these consolidated financial statements.
Summary of Significant Accounting Policies
Investments
Fixed maturity securities we own that we may not have the positive intent to hold until maturity and preferred stocks are classified as available-for-sale and reported at fair value, with unrealized gains and losses excluded from net income and reported in other comprehensive income (loss) as a separate component of shareholders’ equity, net of deferred tax. Fixed maturity securities we own and have the intent to sell prior to maturity are classified as trading securities and reported at fair value, with unrealized gains and losses included in other income and the related deferred income tax included in income tax expense. Securities classified as trading securities are generally foreign currency denominated securities intended to match net liabilities denominated in foreign currencies in order to minimize net exposures arising from fluctuations in foreign currency exchange rates. The fair values of fixed maturity securities and preferred stocks are based on quoted market prices at the reporting date for those or similar securities.
Premiums and discounts on fixed maturity securities are amortized into interest income over the life of the security under the effective yield method. Premiums and discounts on mortgage-backed and asset-backed securities are amortized into interest income based on prepayment assumptions obtained from outside investment managers. These assumptions are consistent with the current interest rate and economic environment. The prospective adjustment method is used to value mortgage-backed and asset-backed securities.
Realized gains and losses on sales of securities are determined on the basis of the specific identification method. If we determine that an unrealized loss on a security is “other than temporary”, we
F-7
Table of Contents
Platinum Underwriters Holdings, Ltd. and Subsidiaries
Notes to Consolidated Financial Statements, continued
write down the carrying value of the security to fair value and record a realized loss in the consolidated statement of operations.
Other invested asset represents an investment in Inter-Ocean Holdings, Ltd., a non-public reinsurance company, and is carried at estimated net realizable value.
Short-term investments are carried at cost, which approximates fair value. Short-term investments mature within one year from the purchase date.
Cash and Cash Equivalents
Cash and cash equivalents are carried at cost, which approximates fair value, and include all securities that, at their purchase date, have a maturity of less than 90 days. Cash and cash equivalents consist primarily of investments in money market funds, time deposits and short-term obligations of the U.S. government and its agencies.
Premium Revenues
Assumed reinsurance premiums are recognized as revenues when premiums become earned, which generally occurs proportionately over the coverage period. Net premiums earned are recorded in the consolidated statement of operations, net of the cost of retrocession. Net premiums written not yet recognized as revenue are recorded in the consolidated balance sheet as unearned premiums, gross of any ceded unearned premiums.
Due to the nature of reinsurance, ceding companies routinely report and remit premiums subsequent to the contract coverage period. Consequently, reinsurance premiums written include estimates of premiums that are written but not reported (“WBNR”). In addition to estimating WBNR, we estimate the portion of premium earned but not reported (“EBNR”). The estimates of WBNR and EBNR are based on amounts reported by the ceding companies, information obtained during audits and other information received from ceding companies. We also estimate the expenses associated with EBNR in the form of losses, loss adjustment expenses (“LAE”) and commissions. As actual premiums are reported by ceding companies, management evaluates the appropriateness of the premium estimates and any adjustments to these estimates, to the extent they represent earned premiums, are accounted for as changes in estimates and are reflected in the results of operations in the period in which they are made. Adjustments to original premium estimates could be material and could significantly impact earnings in the period they are recorded.
Certain of our reinsurance contracts include provisions that adjust premiums or acquisition expenses based upon the experience under the contracts. Premiums or commissions are adjusted in such instances based on actual loss experience under the contracts. Reinstatement premiums are the premiums charged for the restoration of the reinsurance limit of a reinsurance contract to its full amount, generally coinciding with the payment by the reinsurer of losses. These premiums relate to the future coverage obtained for the remainder of the initial contract term and are earned over the remaining contract term. Any unearned premium existing at the time a contract limit is exhausted or reinstated is immediately earned. Additional premiums are premiums triggered by losses and are immediately earned. Reinstatement premiums and additional premiums are recognized in accordance with the provisions of assumed reinsurance contracts, based on loss experience under such contracts. An allowance for
F-8
Table of Contents
Platinum Underwriters Holdings, Ltd. and Subsidiaries
Notes to Consolidated Financial Statements, continued
uncollectible premiums is established for possible non-payment of such amounts due, as deemed necessary. As of December 31, 2006 and 2005 no such allowances were made based on our historical experience, the general profile of our ceding companies and our ability in most cases to contractually offset those premium receivables with losses and LAE or other amounts payable to the same parties.
Funds Held by Ceding Companies
We write business on a funds held basis. Under these contractual arrangements, the ceding company holds the net funds that would otherwise be remitted to us and generally credits the funds held balance with interest income. The general objective of the funds held balances is to provide the ceding company with collateral for our obligations to them. We bear the credit risk in the event that the ceding company fails to remit the net funds held balances, however, that credit risk is mitigated by the contractual ability to offset funds held balances with any loss amounts owed by us.
Deferred Acquisition Costs
Costs of acquiring business, consisting primarily of commissions and other underwriting expenses that vary with and are directly related to the production of business, are deferred and amortized over the period that the corresponding premiums are earned. On a regular basis, an analysis of the recoverability of deferred acquisition costs is performed based on the estimated profitability of the underlying reinsurance contracts including anticipated investment income. Any adjustments are reflected in the results of operations in the period in which they are made. A liability is established, if necessary, to provide for losses that may exceed the related unearned premiums. Deferred acquisition costs amortized in 2006, 2005 and 2004 were $220,758,000, $299,560,000 and $224,307,000, respectively.
Debt Obligations and Deferred Debt Issuance Costs
Costs incurred in issuing debt are capitalized and amortized over the life of the debt. In 2002, the net proceeds from the sale of our Equity Security Units (“ESU’s”) were allocated between the purchase contracts and the senior notes based on the underlying fair value of each instrument. The present value of the purchase contract adjustment payments was initially charged to shareholders’ equity, with an offsetting credit to liabilities. Subsequent contract adjustment payments were allocated between this liability account and interest expense based on a constant rate calculation over the life of the transaction.
Unpaid Losses and LAE
Unpaid losses and LAE are estimated based upon reports received from ceding companies, supplemented by our estimates of losses for which ceding company reports have not been received, our historical experience for unreported claims and industry experience for unreported claims. Unpaid losses and LAE include estimates of the cost of claims that were reported, but not yet paid, and the cost of claims incurred but not yet reported (“IBNR”).
Unpaid losses and LAE represent management’s best estimate at a given point in time and are subject to the effects of trends in loss severity and frequency. These estimates are reviewed regularly and adjusted as experience develops or new information becomes available. Any such adjustments are accounted for as changes in estimates and reflected in the results of operations in the period in which they are made. It is possible that the ultimate liability may materially differ from such estimates.
F-9
Table of Contents
Platinum Underwriters Holdings, Ltd. and Subsidiaries
Notes to Consolidated Financial Statements, continued
Reinsurance Ceded
Premiums written, premiums earned and net losses and LAE reflect the net effects of assumed and ceded reinsurance transactions. Reinsurance accounting is followed for assumed and ceded transactions when risk transfer requirements have been met. Risk transfer analysis evaluates significant assumptions relating to the amount and timing of expected cash flows, as well as the interpretation of underlying contract terms. Reinsurance contracts that do not transfer sufficient insurance risk are accounted for as deposits.
Estimated amounts recoverable from retrocessionaires on unpaid losses and LAE are determined based on our estimate of assumed ultimate losses and LAE and the terms and conditions of our retrocessional contracts. The estimates of retroceded amounts recoverable are reflected as assets.
Reinsurance Deposit Liabilities
Reinsurance contracts that we enter into which are not deemed to transfer sufficient insurance risk are accounted for as deposits, whereby liabilities are initially recorded for the same amount as assets received. Interest expense related to the deposit is recognized as incurred. Profit margins are earned over the settlement period of the contractual obligations.
Earnings Per Common Share
Basic earnings per common share is computed by dividing net income (loss) attributable to common shareholders by the weighted average number of common shares outstanding for the period. Diluted earnings per common share reflects the basic earnings per share adjusted for the potential dilution that would occur if outstanding common share options were exercised and considers the conversion of preferred shares and the outstanding purchase contracts relating to the ESU’s that were outstanding as of December 31, 2004. Securities that are convertible into common shares that are anti-dilutive are not included in the calculation of diluted earnings per share.
If the effect of either the issuance of common shares in exchange for debt or preferred shares is dilutive to earnings per share, it is included in the calculation of diluted earnings per share as if the common shares were exchanged or issued and the proceeds received were used to pay down the debt at the beginning of the reporting period.
Income Taxes
We apply the asset and liability method of accounting for income taxes. Under the asset and liability method, deferred tax assets and liabilities are recognized for the future tax consequences attributable to differences between the financial statement carrying amounts of existing assets and liabilities and their respective tax bases. Deferred tax assets and liabilities are measured using enacted tax rates applicable to taxable income in the years in which those temporary differences are expected to be recovered or settled. The effect on deferred tax assets and liabilities of a change in tax rates is recognized in income in the period the change is enacted. A valuation allowance is established for deferred tax assets where it is more likely than not that future tax benefits will not be realized.
In July 2006, the FASB issued Interpretation No. 48, “Accounting for Uncertainty in Income Taxes — an Interpretation of FASB Statement No. 109” (“FIN 48”). FIN 48 prescribes a recognition
F-10
Table of Contents
Platinum Underwriters Holdings, Ltd. and Subsidiaries
Notes to Consolidated Financial Statements, continued
threshold and measurement attribute for the financial statement recognition and measurement of a tax position taken or expected to be taken in a tax return and provides guidance on derecognition, classification, interest and penalties, accounting in interim periods, disclosure, and transition.
Under FIN 48, evaluation of a tax position is a two-step process. The first step is to determine whether it is more-likely-than-not that a tax position will be sustained upon examination, including the resolution of any related appeals or litigation based on the technical merits of the position. The second step is to measure a tax position that meets the more-likely-than-not threshold to determine the amount of benefit to be recognized in the financial statements. The tax position is measured at the largest amount of benefit that is greater than 50 percent likely of being realized upon ultimate settlement. Tax positions that previously failed to meet the more-likely-than-not recognition threshold should be recognized in the first subsequent period in which the threshold is met. Previously recognized tax positions that no longer meet the more-likely-than-not criteria should be de-recognized in the first subsequent financial reporting period in which the threshold is no longer met.
FIN 48 is effective for fiscal years beginning after December 15, 2006. We do not expect the provisions of FIN 48 will have a material effect on our results of operations, financial condition or liquidity.
Share-Based Compensation
We adopted Statement of Financial Accounting Standards No. 123R “Share-Based Payment” (“SFAS 123R”) using the modified prospective method effective January 1, 2006. SFAS 123R establishes standards for the accounting for transactions in which an entity exchanges its equity instruments for goods or services. SFAS 123R requires that, prospectively, compensation costs be recognized for the fair value of all share options over their vesting period, including the cost related to the unvested portion of all outstanding share options as of December 31, 2005. The fair value of option awards is determined on the grant date using the Black-Scholes option pricing model and is amortized into earnings over the vesting period. The cumulative effect of the adoption of SFAS 123R was not material.
Prior to January 1, 2006, we accounted for share-based compensation using Statement of Financial Accounting Standards No. 123 “Accounting for Awards of Stock Based Compensation to Employees” and Statement of Financial Accounting Standards No. 148 “Accounting for Stock-Based Compensation-Transition and Disclosure” (“SFAS 148”). In accordance with the transition rules of SFAS 148, we elected to continue using the intrinsic value method of accounting established by Accounting Principles Board Opinion No. 25 “Accounting for Stock Issued to Employees” (“APB 25”) for our share-based awards granted to employees in 2002. Under APB 25, if the exercise price of our employee share options is equal to or greater than the fair market value of the underlying shares on the date of the grant, no compensation expense is recorded.
Had we calculated and recorded compensation expense for share option grants based on the “fair value” method described in SFAS 123R for options granted in 2002, net income (loss) and earnings (loss) per share, net of tax, for the years ended December 31, 2005 and 2004 would have been the pro forma amounts as indicated below ($ in thousands, except per share data):
F-11
Table of Contents
Platinum Underwriters Holdings, Ltd. and Subsidiaries
Notes to Consolidated Financial Statements, continued
| As | ||||||||
| Reported | Pro Forma | |||||||
| Year Ended December 31, 2005: | ||||||||
| Share-based compensation expense | $ | 3,799 | $ | 8,149 | ||||
| Net loss | (138,224 | ) | (142,574 | ) | ||||
| Basic loss per share | (3.01 | ) | (3.11 | ) | ||||
| Diluted loss per share | (3.01 | ) | (3.11 | ) | ||||
| Year Ended December 31, 2004: | ||||||||
| Share-based compensation expense | 2,358 | 7,026 | ||||||
| Net income | 84,783 | 80,115 | ||||||
| Basic earnings per share | 1.96 | 1.86 | ||||||
| Diluted earnings per share | $ | 1.81 | $ | 1.72 | ||||
The fair values of restricted share and restricted share unit awards are determined on the grant date and are amortized into earnings over the vesting period. There are limits on the transferability of the restricted shares and such restricted shares may be forfeited in the event of certain types of termination of the recipient’s employment. The cost of performance based share awards are based on the estimated number of shares or share units that are expected to be issued at the end of the performance period. Through December 31, 2005, the unearned or unvested portion of the restricted shares issued is presented as a separate component of shareholders’ equity.
Foreign Currency Exchange Gains and Losses
Our reporting currency is U.S. dollars. The functional currency of our subsidiaries is generally the currency of the local operating environment. Transactions conducted in other than functional and reporting currencies are remeasured into the subsidiary’s functional currency, and the resulting foreign exchange gains and losses are included in net foreign currency exchange gains or losses. Functional currency based assets and liabilities are translated into U.S. dollars using current rates of exchange prevailing at the balance sheet date and the related translation adjustments are recorded as a separate component of accumulated other comprehensive income (loss), net of applicable deferred income tax. Foreign currency exchange gains and losses related to securities classified as trading securities are included in foreign currency exchange gains and losses.
Use of Estimates
Our financial statements include estimates and valuation assumptions that have an effect on the amounts reported. The most significant estimates are those relating to unpaid losses and LAE, written and unearned premium, valuation of investments and evaluation of risk transfer. These estimates are continually reviewed and adjustments made as necessary, but actual results could be significantly different than expected at the time such estimates are made. Results of changes in estimates are reflected in results of operations in the period in which the change is made.
Recently Issued Accounting Standards
In February 2006, the Financial Accounting Standards Board (the “FASB”) issued Statement of
F-12
Table of Contents
Platinum Underwriters Holdings, Ltd. and Subsidiaries
Notes to Consolidated Financial Statements, continued
Financial Accounting Standards No. 155, “Accounting for Certain Hybrid Instruments, an amendment of FASB Statements No. 133 and 140” (“SFAS 155”). SFAS 155 becomes effective in 2007 and requires that investments in securitized financial instruments, such as mortgage-backed and asset-backed securities, be evaluated to identify whether they are freestanding derivatives or hybrid financial instruments containing an embedded derivative that requires bifurcation. The FASB subsequently issued additional guidance in the form of Implementation Issue B40. Implementation Issue B40 provides a narrow scope exception for certain securitized interests in prepayable financial assets, subject to certain criteria. Securitized financial instruments with the potential for prepayment will be evaluated under SFAS 155 and related guidance, possibly resulting in the bifurcation of an embedded derivative. The embedded derivative will be recorded at fair value, with unrealized gains and losses included in other income and the related deferred income tax included in income tax expense. SFAS 155 and related guidance is effective for all financial instruments acquired, issued, or subject to a remeasurement event occurring for the Company after December 31, 2006.
The Securities and Exchange Commission (“SEC”) issued Staff Accounting Bulletin No. 108 (“SAB 108”) that provides guidance to SEC registrants on evaluating the effects of misstatements from prior year(s) when quantifying misstatements in the current year. We have adopted the provisions of SAB 108 as of January 1, 2007 and it did not have a material effect on our results of operations or financial condition.
2.Investments
Our available-for-sale fixed maturity securities and preferred stocks as of December 31, 2006 and 2005 were as follows ($ in thousands):
| Gross | Gross | |||||||||||||||
| Amortized | Unrealized | Unrealized | Fair | |||||||||||||
| Cost | Gains | Losses | Value | |||||||||||||
| December 31, 2006: | ||||||||||||||||
| U.S. Government | $ | 155,766 | 64 | 2,036 | $ | 153,794 | ||||||||||
| Corporate bonds | 1,529,400 | 609 | 24,853 | 1,505,156 | ||||||||||||
| Mortgage-backed and asset-backed securities | 1,349,586 | 1,098 | 21,717 | 1,328,967 | ||||||||||||
| Municipal bonds | 200,445 | 4 | 2,851 | 197,598 | ||||||||||||
| Foreign governments and states | 41,773 | — | 934 | 40,839 | ||||||||||||
| Total available-for-sale fixed maturity securities | 3,276,970 | 1,775 | 52,391 | 3,226,354 | ||||||||||||
| Preferred stocks | 11,246 | — | 474 | 10,772 | ||||||||||||
| Total available-for-sale securities | $ | 3,288,216 | 1,775 | 52,865 | $ | 3,237,126 | ||||||||||
F-13
Table of Contents
Platinum Underwriters Holdings, Ltd. and Subsidiaries
Notes to Consolidated Financial Statements, continued
| Gross | Gross | |||||||||||||||
| Amortized | Unrealized | Unrealized | Fair | |||||||||||||
| Cost | Gains | Losses | Value | |||||||||||||
| December 31, 2005: | ||||||||||||||||
| U.S. Government | $ | 140,218 | 11 | 644 | $ | 139,585 | ||||||||||
| Corporate bonds | 1,379,702 | 991 | 26,389 | 1,354,304 | ||||||||||||
| Mortgage-backed and asset-backed securities | 1,159,250 | 598 | 17,917 | 1,141,931 | ||||||||||||
| Municipal bonds | 215,237 | 125 | 3,001 | 212,361 | ||||||||||||
| Foreign governments and states | 41,745 | — | 1,004 | 40,741 | ||||||||||||
| Total available-for-sale fixed maturity securities | 2,936,152 | 1,725 | 48,955 | 2,888,922 | ||||||||||||
| Preferred stocks | 8,735 | — | 549 | 8,186 | ||||||||||||
| Total available-for-sale securities | $ | 2,944,887 | 1,725 | 49,504 | $ | 2,897,108 | ||||||||||
Amortized cost and fair value of available-for-sale fixed maturity securities by contractual maturity as of December 31, 2006 are shown below; actual maturities could differ from contractual maturities due to call or prepayment provisions ($ in thousands):
| Amortized | ||||||||
| Cost | Fair Value | |||||||
| Due in one year or less | $ | 400,723 | $ | 397,408 | ||||
| Due from one to five years | 1,065,670 | 1,051,975 | ||||||
| Due from five to ten years | 258,003 | 249,685 | ||||||
| Due in ten or more years | 202,988 | 198,319 | ||||||
| Mortgage and asset backed securities | 1,349,586 | 1,328,967 | ||||||
| Total | $ | 3,276,970 | $ | 3,226,354 | ||||
Investment income for the years ended December 31, 2006, 2005 and 2004 is summarized as follows ($ in thousands):
| 2006 | 2005 | 2004 | ||||||||||
| Fixed maturity securities | $ | 148,708 | 114,234 | $ | 82,038 | |||||||
| Cash and cash equivalents | 35,684 | 11,063 | 2,261 | |||||||||
| Funds held | 7,998 | 8,172 | 2,651 | |||||||||
| 192,390 | 133,469 | 86,950 | ||||||||||
| Less investment expenses | 4,403 | 4,024 | 2,418 | |||||||||
| Net investment income | $ | 187,987 | 129,445 | $ | 84,532 | |||||||
Net realized gains and losses from investments for the years ended December 31, 2006, 2005 and 2004 were as follows ($ in thousands):
F-14
Table of Contents
Platinum Underwriters Holdings, Ltd. and Subsidiaries
Notes to Consolidated Financial Statements, continued
| 2006 | 2005 | 2004 | ||||||||||
| Available-for-sale securities and other invested asset: | ||||||||||||
| Gross realized gains | $ | 1,591 | 4,333 | $ | 5,554 | |||||||
| Gross realized losses | 316 | 7,503 | 3,144 | |||||||||
| Subtotal | 1,275 | (3,170 | ) | 2,410 | ||||||||
| Trading securities: | ||||||||||||
| Gross realized gains | 1 | 272 | 151 | |||||||||
| Gross realized losses | 186 | 148 | 606 | |||||||||
| Subtotal | (185 | ) | 124 | (455 | ) | |||||||
| Net realized gains (losses) | $ | 1,090 | (3,046 | ) | $ | 1,955 | ||||||
Proceeds from sales, maturities and calls of available-for-sale fixed maturity securities were $619,081,000, $989,730,000 and $635,417,000 for the years ended December 31, 2006, 2005 and 2004, respectively. Proceeds from sales, maturities and calls of trading securities were $24,562,000, $71,238,000 and $50,542,000 for the years ended December 31, 2006, 2005 and 2004, respectively. There were no sales of preferred stocks in 2006, 2005 or 2004. There were purchases of preferred stocks of $4,985,000 in 2005. There were no purchases of preferred stocks in 2006 or 2004.
Net change in unrealized investment gains and losses for the years ended December 31, 2006, 2005 and 2004 were as follows ($ in thousands):
| 2006 | 2005 | 2004 | ||||||||||
| Available for sale securities | $ | (3,311 | ) | (61,018 | ) | $ | (9,459 | ) | ||||
| Less deferred tax | (576 | ) | 8,564 | 2,549 | ||||||||
| Net change in unrealized gains and losses | $ | (3,887 | ) | (52,454 | ) | $ | (6,910 | ) | ||||
Net change in unrealized investment gains (losses) on trading securities for the years ended December 31, 2006, 2005 and 2004 were ($2,193,000), ($102,000) and $1,036,000, respectively, and is included in other income (expense).
Investments with a carrying value of $4,319,000 were on deposit with regulatory authorities as of December 31, 2006. Investments with a carrying value of $190,045,000 and cash and cash equivalents of $4,594,000 as of December 31, 2006 were held in trust to collateralize liabilities ceded by The St. Paul Travelers Companies, Inc., formerly The St. Paul Companies, Inc., (“St. Paul”) to us under the reinsurance contracts entered into on or after January 1, 2002 (the “Quota Share Retrocession Agreements”). Investments with a carrying value of $241,533,000 and cash and cash equivalents of $11,637,000 as of December 31, 2006 were held in trust to collateralize obligations under various other reinsurance contracts. Investments with a carrying value of $53,364,000 and cash and cash equivalents of $36,333,000 as of December 31, 2006 were held in trust to collateralize letters of credit issued under a credit facility.
The unrealized losses of securities available-for-sale as of December 31, 2006 aggregated by investment category and length of time that individual securities have been in a continuous unrealized loss position were as follows ($ in thousands):
F-15
Table of Contents
Platinum Underwriters Holdings, Ltd. and Subsidiaries
Notes to Consolidated Financial Statements, continued
| Unrealized | ||||||||
| Fair Value | Loss | |||||||
| Less than twelve months: | ||||||||
| U.S. Government | $ | 46,214 | $ | 741 | ||||
| Corporate bonds | 399,866 | 1,854 | ||||||
| Mortgage-backed and asset-backed securities | 302,707 | 1,630 | ||||||
| Municipal bonds | 15,871 | 73 | ||||||
| Foreign governments and states | 5,976 | 96 | ||||||
| Preferred stocks | 2,406 | 105 | ||||||
| Total | $ | 773,040 | $ | 4,499 | ||||
| Twelve months or more: | ||||||||
| U.S. Government | $ | 85,450 | $ | 1,295 | ||||
| Corporate bonds | 1,028,912 | 22,999 | ||||||
| Mortgage-backed and asset-backed securities | 767,217 | 20,087 | ||||||
| Municipal bonds | 174,468 | 2,778 | ||||||
| Foreign governments and states | 34,863 | 838 | ||||||
| Preferred stocks | 8,365 | 369 | ||||||
| Total | $ | 2,099,275 | $ | 48,366 | ||||
| Total unrealized losses: | ||||||||
| U.S. Government | $ | 131,664 | $ | 2,036 | ||||
| Corporate bonds | 1,428,778 | 24,853 | ||||||
| Mortgage-backed and asset-backed securities | 1,069,924 | 21,717 | ||||||
| Municipal bonds | 190,339 | 2,851 | ||||||
| Foreign governments and states | 40,839 | 934 | ||||||
| Preferred stocks | 10,771 | 474 | ||||||
| Total | $ | 2,872,315 | $ | 52,865 | ||||
We routinely review our available-for-sale investments to determine whether unrealized losses represent temporary changes in fair value or are the result of “other-than-temporary impairments.” The process of determining whether a security is other than temporarily impaired is subjective and involves analyzing many factors. These factors include but are not limited to: the overall financial condition of the issuer, the length and magnitude of an unrealized loss, specific credit events, and our ability and intent to hold a security for a sufficient period of time for the value to recover the unrealized loss, which is based in part, on current and anticipated future positive net cash flows from operations that generate sufficient liquidity in order to meet our obligations. If we determine that an unrealized loss on a security is other than temporary, we write down the carrying value of the security and record a realized loss in the consolidated statement of operations.
Corporate and mortgage-backed and asset-backed securities represent our largest categories within our available-for-sale portfolio and consequently account for the greatest amount of our overall unrealized loss as of December 31, 2006. Investment holdings within our corporate sector are diversified across approximately 30 sub-sectors, ranging from aerospace to telecommunications, and within each
F-16
Table of Contents
Platinum Underwriters Holdings, Ltd. and Subsidiaries
Notes to Consolidated Financial Statements, continued
sub-sector across many individual issuers and issues. As of December 31, 2006 there were 279 corporate issues in an unrealized loss position, with the single largest unrealized loss being $652,000. Investment holdings within our mortgage-backed and asset-backed sector are diversified across a number of sub-categories, including asset-backed securities, collateralized mortgage obligations and federal and government agency mortgage-backed securities, with the single largest unrealized loss being $997,000.
Overall, our unrealized loss position as of December 31, 2006 was primarily the result of interest rate increases that impacted all investment categories. We do not consider any of our available-for-sale investments to be other-than-temporarily impaired as of December 31, 2006.
During 2006, we entered into a definitive agreement to sell our interest in Inter-Ocean Holdings Ltd., our other invested asset. We wrote down the carrying value of the investment based on expected proceeds from this sale and recorded a realized loss of $255,000. During 2005, as a result of the routine evaluation of investments, we wrote down the carrying value of the same other invested asset to its estimated net realizable value and recorded a realized loss of $1,769,000. Other than these adjustments, we do not believe that our investment portfolio at December 31, 2006 contains any securities with an unrealized loss that is other-than-temporary.
The following table presents the carrying amounts and estimated fair values of our financial instruments as of December 31, 2006 and 2005 ($ in thousands):
| December 31, 2006 | December 31, 2005 | |||||||||||||||
| Carrying | Fair | Carrying | Fair | |||||||||||||
| Amount | Value | Amount | Value | |||||||||||||
| Financial assets: | ||||||||||||||||
| Fixed maturity securities | $ | 3,334,645 | 3,334,645 | 2,987,703 | $ | 2,987,703 | ||||||||||
| Preferred stocks | 10,772 | 10,772 | 8,186 | 8,186 | ||||||||||||
| Short-term investments | 27,123 | 27,123 | 8,793 | 8,793 | ||||||||||||
| Other invested asset | 4,745 | 4,745 | 5,000 | 5,000 | ||||||||||||
| Financial liabilities: | ||||||||||||||||
| Debt obligations | $ | 292,840 | 303,589 | 292,840 | $ | 296,708 | ||||||||||
The fair value of fixed maturity securities, preferred stocks, short-term investments and debt obligations are based on quoted market prices at the reporting date for those or similar investments. The fair value of the other invested asset is based on its estimated net realizable value.
3.Unpaid Losses and LAE
In 2005, three significant named hurricanes, Katrina, Rita and Wilma (the “2005 Hurricanes”), caused severe damage in Louisiana, Mississippi, Texas, Florida and several other states in the Gulf Coast region of the United States as well as Mexico and the Caribbean. In 2004, four significant named hurricanes, Charley, Frances, Ivan and Jeanne (the “2004 Hurricanes”), caused severe damage in the Caribbean and the southeastern United States, principally Florida.
F-17
Table of Contents
Platinum Underwriters Holdings, Ltd. and Subsidiaries
Notes to Consolidated Financial Statements, continued
As a result of losses arising from these catastrophic events, certain reinsurance contracts generated additional premiums and adjustments to accrued profit commissions. The aggregate net adverse impact on income before income taxes for the years ended December 31, 2005 and 2004 from the above mentioned hurricanes is summarized as follows ($ in thousands):
| 2005 | 2004 | |||||||
| Gross losses and LAE | $ | 654,090 | $ | 230,475 | ||||
| Retrocessional reinsurance | (73,800 | ) | — | |||||
| Net losses and LAE | 580,290 | 230,475 | ||||||
| Additional net premiums earned | (46,666 | ) | (29,265 | ) | ||||
| Profit commissions | (3,654 | ) | (10,243 | ) | ||||
| Net adverse impact on income before income taxes | $ | 529,970 | $ | 190,967 | ||||
The net unfavorable impact on income before income taxes in 2006 from changes in estimates of the 2005 Hurricanes was $4,160,000. The effect on income before income taxes of net development of the 2004 Hurricanes was immaterial in 2005 and 2006.
Activity in the liability for unpaid losses and LAE for the years ended December 31, 2006, 2005 and 2004 is summarized as follows ($ in thousands):
| 2006 | 2005 | 2004 | ||||||||||
| Net unpaid losses and LAE as of the beginning of year | $ | 2,268,655 | 1,379,227 | $ | 731,918 | |||||||
| Net incurred related to: | ||||||||||||
| Current year | 811,250 | 1,577,944 | 1,101,820 | |||||||||
| Prior years | (50,648 | ) | (72,519 | ) | (82,016 | ) | ||||||
| Total incurred net losses and LAE | 760,602 | 1,505,425 | 1,019,804 | |||||||||
| Net paid losses and LAE: | ||||||||||||
| Current year | 96,112 | 210,306 | 174,870 | |||||||||
| Prior year | 624,477 | 390,598 | 205,889 | |||||||||
| Total net paid losses and LAE | 720,589 | 600,904 | 380,759 | |||||||||
| Effects of foreign currency exchange rate changes | 17,559 | (15,093 | ) | 8,264 | ||||||||
| Net unpaid losses and LAE as of the end of year | 2,326,227 | 2,268,655 | 1,379,227 | |||||||||
| Reinsurance recoverable | 42,255 | 55,335 | 1,728 | |||||||||
| Gross unpaid losses and LAE at end of year | $ | 2,368,482 | 2,323,990 | $ | 1,380,955 | |||||||
The net favorable loss development in 2006, 2005 and 2004 related to prior years includes $60,746,000, $97,314,000 and $57,151,000, respectively, of net favorable loss development primarily from property and certain other lines of business with relatively short patterns of reported losses. The net favorable loss development in 2006, 2005 and 2004 related to prior years also include increases in incurred losses and LAE associated with changes in estimates of premiums and the patterns of their earnings. The net increases (decreases) of losses and LAE related to prior accident years arising from changes in premium estimates were $10,098,000, $24,795,000, and ($24,865,000), in 2006, 2005 and
F-18
Table of Contents
Platinum Underwriters Holdings, Ltd. and Subsidiaries
Notes to Consolidated Financial Statements, continued
2004, respectively. The net effect of changes in premium estimates, after considering corresponding changes in related losses, LAE and acquisition expenses, was not significant.
The lines experiencing favorable loss development are primarily property coverages provided in both of the Property and Marine and Finite Risk segments as well as certain casualty classes with short loss development periods. During 2006, 2005 and 2004, actual reported losses were significantly less than expected for these short-tailed property and casualty lines resulting in reductions in estimated ultimate losses.
Because many of the reinsurance coverages we offer will likely involve claims that may not ultimately be settled for many years after they are incurred, subjective judgments as to ultimate exposure to losses are an integral and necessary component of the process of estimating unpaid losses and LAE. With respect to reinsurers, the inherent uncertainties of estimating unpaid losses and LAE are further exacerbated by the significant amount of time that often elapses between the occurrence of an insured loss, the reporting of that loss to the primary insurer and then to the reinsurer, and the primary insurer’s payment of that loss to the insured and subsequent payment by the reinsurer to the primary insurer. Unpaid losses and LAE are reviewed quarterly using a variety of statistical and actuarial techniques to analyze current claim costs, frequency and severity data and prevailing economic, social and legal factors. While we commenced operations in 2002, the business we write is sufficiently similar to the historical reinsurance business of St. Paul that we are able to use the historical loss experience of this reinsurance business, which is periodically updated by St. Paul, to estimate our ultimate losses and LAE. Unpaid losses and LAE established in prior years are adjusted as loss experience develops and new information becomes available. Adjustments to previously estimated unpaid losses and LAE are reflected in financial results in the periods in which they are made.
In addition to the inherent uncertainty of estimating unpaid losses and LAE, our estimates with respect to the 2005 Hurricanes are subject to an unusually high level of uncertainty arising out of complex and unique causation and coverage issues associated with the attribution of losses to wind or flood damage or other perils such as fire, business interruption or riot and civil commotion. For example, the underlying policies generally do not cover flood damage; however, water damage caused by wind may be covered. Our actual losses from the 2005 Hurricanes may exceed our estimates as a result of, among other things, the attribution of losses to coverages that for the purpose of our estimates we assumed would not be exposed, which may be affected by class action lawsuits or state regulatory actions. We expect that these issues will not be resolved for a considerable period of time and may be influenced by evolving legal and regulatory developments.
4.Retrocessional Reinsurance
Reinsurance is the transfer of risk, by contract, from one insurance company to another for consideration of premium. Retrocessional reinsurance is reinsurance ceded by a reinsurer to insure against all or a portion of its reinsurance written. Retrocessional reinsurance agreements provide us with increased capacity to write larger risks, limit our maximum loss arising from any one occurrence and maintain our exposure to loss within our capital resources. Retrocessional reinsurance contracts do not relieve us from our obligations under our contracts. Failure of retrocessionaires to honor their obligations could result in losses to us. Consequently, we have a contingent liability to the extent of any unpaid losses and LAE ceded to another company. We evaluate the financial condition of our reinsurers and
F-19
Table of Contents
Platinum Underwriters Holdings, Ltd. and Subsidiaries
Notes to Consolidated Financial Statements, continued
monitor concentrations of credit risk arising from similar geographic regions, activities, or economic characteristics of the reinsurers to minimize our exposure to significant losses from reinsurer insolvencies.
During 2006, Platinum US and Platinum UK also entered into a retrocessional reinsurance agreement under which they cede, on a quota share basis, 30% of new and renewal property catastrophe business effective on or after January 1, 2006. Under this agreement, the retrocessionnaire is obligated to place premiums ceded, net of commissions, in trust for the benefit of Platinum US and Platinum UK as well as provide a letter of credit such that the combination of the two amounts will ultimately collateralize the limit of loss under this treaty. This agreement was not renewed in 2007. Platinum US also obtained from third party retrocessionaires $42,500,000 of excess-of-loss retrocession limit with respect to its property catastrophe business and $10,000,000 of aggregate excess-of-loss retrocession limit with respect to crop business.
The effects of retrocessional reinsurance on premiums, losses and LAE for the years ended December 31, 2006, 2005 and 2004 are as follows ($ in thousands):
| Assumed | Ceded | Net | ||||||||||
| As of and for the year ended December 31, 2006: | ||||||||||||
| Premiums written | $ | 1,275,200 | 98,587 | $ | 1,176,613 | |||||||
| Premiums earned | 1,434,282 | 97,581 | 1,336,701 | |||||||||
| Losses and LAE | 778,836 | 18,234 | 760,602 | |||||||||
| Unpaid losses and LAE | 2,368,482 | 42,255 | 2,326,227 | |||||||||
| As of and for the year ended December 31, 2005: | ||||||||||||
| Premiums written | 1,765,155 | 47,433 | 1,717,722 | |||||||||
| Premiums earned | 1,757,139 | 42,416 | 1,714,723 | |||||||||
| Losses and LAE | 1,594,737 | 89,312 | 1,505,425 | |||||||||
| Unpaid losses and LAE | 2,323,990 | 55,335 | 2,268,655 | |||||||||
| As of and for the year ended December 31, 2004: | ||||||||||||
| Premiums written | 1,659,790 | 13,777 | 1,646,013 | |||||||||
| Premiums earned | 1,465,058 | 17,123 | 1,447,935 | |||||||||
| Losses and LAE | 1,018,106 | (1,698 | ) | 1,019,804 | ||||||||
| Unpaid losses and LAE | $ | 1,380,955 | 1,728 | $ | 1,379,227 | |||||||
In 2003, Platinum US and Platinum UK entered into a quota share retrocession agreement with Platinum Bermuda. Platinum US retrocedes approximately 75% of its business to Platinum Bermuda and Platinum UK retrocedes approximately 55% of its business to Platinum Bermuda. In addition, effective April 1, 2005 Platinum UK and Platinum Bermuda entered into an excess-of-loss reinsurance agreement covering substantially all North American business assumed by Platinum Bermuda under which Platinum UK provides $55,000,000 of coverage in excess of $145,000,000 for each loss occurrence. This agreement was terminated effective December 31, 2005. Platinum US also reinsured Platinum UK for $50,000,000 per occurrence on an excess-of-loss basis in excess of $60,000,000 with respect to international property
F-20
Table of Contents
Platinum Underwriters Holdings, Ltd. and Subsidiaries
Notes to Consolidated Financial Statements, continued
business.
Effective January 1, 2006, Platinum US provided an excess-of-loss cover to Platinum UK, replacing the prior agreement terminated as of December 31, 2005. Pursuant to the excess-of-loss agreement Platinum US provides $35,000,000 of coverage in excess of $50,000,000. This agreement was terminated effective March 31, 2006. Effective April 1, 2006, Platinum US and Platinum Bermuda entered into an excess-of-loss reinsurance agreement under which Platinum US provides $65,000,000 of coverage in excess of $185,000,000 with respect to international property business. Effective January 1, 2006, Platinum UK also reinsured Platinum Bermuda for $35,000,000 per occurrence on an excess-of-loss basis in excess of $145,000,000 with respect to their business in North America and certain other territories . Following is a summary of the premiums earned and losses ceded from Platinum US and Platinum UK to Platinum Bermuda, from Platinum Bermuda to Platinum UK and Platinum US and from Platinum UK to Platinum US for the years ended December 31, 2006, 2005 and 2004 ($ in thousands):
| 2006 | 2005 | 2004 | ||||||||||
| Retroceded by Platinum US to Platinum Bermuda: | ||||||||||||
| Premiums earned | $ | 666,331 | 697,992 | $ | 515,869 | |||||||
| Incurred losses and LAE | 457,447 | 893,237 | 562,193 | |||||||||
| Retroceded by Platinum UK to Platinum Bermuda: | ||||||||||||
| Premiums earned | 79,173 | 86,163 | 89,394 | |||||||||
| Incurred losses and LAE | 28,113 | 54,657 | 57,830 | |||||||||
| Retroceded by Platinum Bermuda to Platinum UK: | ||||||||||||
| Premiums earned | 4,583 | 8,250 | — | |||||||||
| Incurred losses and LAE | 19,678 | 55,000 | — | |||||||||
| Retroceded by Platinum UK to Platinum US: | ||||||||||||
| Premiums earned | 250 | 1,800 | — | |||||||||
| Incurred losses and LAE | — | — | — | |||||||||
| Retroceded by Platinum Bermuda to Platinum US | ||||||||||||
| Premiums earned | 977 | — | — | |||||||||
| Incurred losses and LAE | $ | — | — | $ | — | |||||||
These transactions had no net effect on underwriting results in the consolidated financial statements.
5.Debt, Equity Security Units and Credit Facility
Debt
In May 2005, Platinum Finance issued $250,000,000 aggregate principal amount of Series A 7.5% Notes due June 1, 2017 (the “Series A Notes”), unconditionally guaranteed by Platinum Holdings. The Series A Notes were issued in a transaction exempt from the registration requirements under the Securities Act of 1933, as amended (the “Securities Act”). The proceeds of the Series A Notes were used
F-21
Table of Contents
Platinum Underwriters Holdings, Ltd. and Subsidiaries
Notes to Consolidated Financial Statements, continued
primarily to increase the capital of Platinum Bermuda and Platinum US. In November 2005, Platinum Finance completed an exchange offer through which they exchanged all of the Series A Notes for Series B Notes that have substantially the same terms and which were registered under the Securities Act (the “Series B Notes”). Interest is payable on the Series B Notes at a rate of 7.5% per annum on each June 1 and December 1, commencing on December 1, 2005. Platinum Finance may redeem the Series B Notes, at its option, at any time in whole, or from time to time in part, prior to maturity. The redemption price will be equal to the greater of: (i) 100 percent of the principal amount of the Series B Notes and (ii) the sum of the present values of the remaining scheduled payments of principal and interest, discounted to the redemption date on a semiannual basis at a comparable U.S. Treasury rate plus 50 basis points, plus in each case, interest accrued but not paid to the date of redemption.
Equity Security Units
In November 2002, we issued the ESU’s each of which consisted of a contract to purchase our common shares in 2005 (the “Purchase Contract”) and an ownership interest in a 5.25% Senior Guaranteed Note, due November 16, 2005. On August 16, 2005, Platinum Finance successfully completed the remarketing of $137,500,000 aggregate principal amount of the Senior Guaranteed Notes due November 16, 2007 at a price of 100.7738% with a reset interest rate of 6.371% (the “Original Remarketed Notes”). The Original Remarketed Notes were remarketed as 6.371% Senior Guaranteed Notes and then subsequently exchanged for Series B 6.371% Senior Guaranteed Notes (the “Remarketed Notes”) that have substantially the same terms and which were registered under the Securities Act. Interest is payable on the Remarketed Notes on May 16 and November 16 of each year. The Remarketed Notes are unconditionally guaranteed by Platinum Holdings. The remarketing was conducted on behalf of holders of the ESU’s and neither Platinum Holdings nor Platinum Finance received any cash proceeds from the remarketing. Proceeds from the remarketing were used to purchase a portfolio of U.S. Treasury securities to collateralize the obligations of the holders of the ESU’s under the related common share purchase contract and to pay the remarketing fee. There were no excess proceeds distributed to holders of the ESU’s in connection with the remarketing. On November 16, 2005, we settled the Purchase Contract component by issuing 5,008,850 common shares, which generated cash proceeds to us of $137,500,000. As a result of the settlement of the Purchase Contract component of the ESUs, the ESUs ceased to exist and are no longer traded on the New York Stock Exchange.
In December 2005, Platinum Finance completed a tender offer to repurchase all of the outstanding Original Remarketed Notes and Remarketed Notes. As a result, Platinum Finance repurchased $94,660,000 of this debt and $42,840,000 of the Remarketed Notes remains outstanding.
The following table shows the amount and maturities of debt obligations as of December 31, 2006 and 2005 ($ in thousands):
| 2006 | 2005 | |||||||
| Series B Notes, 7.5%, due June 1, 2017 | $ | 250,000 | $ | 250,000 | ||||
| Series B Remarketed Notes, 6.371%, due November 16, 2007 | 42,840 | 42,840 | ||||||
| Total debt obligations | $ | 292,840 | $ | 292,840 | ||||
F-22
Table of Contents
Platinum Underwriters Holdings, Ltd. and Subsidiaries
Notes to Consolidated Financial Statements, continued
Credit Facility
On October 21, 2005 we entered into a three-year $200,000,000 credit agreement with a syndicate of lenders. On September 13, 2006, we amended and restated the existing agreement, increasing the term to five years and increasing the facility to $400,000,000 (the “Credit Facility”). The amended and restated credit agreement consists of a $150,000,000 senior unsecured credit facility available for revolving borrowings and letters of credit and a $250,000,000 senior secured credit facility available for letters of credit. The revolving line of credit generally will be available for our working capital, liquidity and general corporate requirements and those of our subsidiaries. Platinum Holdings and Platinum Finance have guaranteed borrowings by our reinsurance subsidiaries. The interest rate on borrowings under the Credit Facility is based on our election of either: (1) LIBOR plus 50 basis points or (2) the higher of: (a) the prime interest rate of the lead bank providing the credit facility, or (b) the federal funds rate plus 50 basis points. The interest rate based on LIBOR rate would increase or decrease by up to 12.5 basis points should our senior unsecured debt credit rating increase or decrease. The Credit Facility requires us to satisfy various covenants, including several financial covenants. As of December 31, 2006, we were in compliance with all covenants under the Credit Facility.
We had approximately $80,769,000 of letters of credit outstanding in favor of various cedants as of December 31, 2006. Letters of credit outstanding under the Credit Facility were $80,694,000 as of December 31, 2006. Cash and cash equivalents of $36,333,000 as of December 31, 2006 were held in trust to collateralize secured letters of credit issued under the Credit Facility. As of December 31, 2006, $144,922,000 was available for borrowing on an unsecured basis and $174,384,000 was available for borrowing on a secured basis under the Credit Facility.
6.Income Taxes
We provide income taxes based upon amounts reported in the financial statements and the provisions of currently enacted tax laws. Platinum Holdings and Platinum Bermuda are incorporated under the laws of Bermuda and are subject to Bermuda law with respect to taxation. Under current Bermuda law, they are not taxed on any Bermuda income or capital gains and they have received an assurance from the Bermuda Minister of Finance that if any legislation is enacted in Bermuda that would impose tax computed on profits or income, or computed on any capital asset, gain or appreciation, or any tax in the nature of estate duty or inheritance tax, then the imposition of any such tax will not be applicable to Platinum Holdings or Platinum Bermuda or any of their respective operations, shares, debentures or other obligations until March 28, 2016. Platinum Holdings has subsidiaries based in the United States, the United Kingdom and Ireland that are subject to the tax laws thereof.
Under current United States law, Platinum US is subject to a 35 percent U.S. corporate income tax rate. Under current United Kingdom law, Platinum UK is taxed at the U.K. corporate income tax rate (generally 30 percent). There is no withholding tax on dividends distributed from Platinum UK to Platinum Regency. Under current Irish law, Platinum Regency is taxed at a 25 percent corporate income tax rate on non-trading income and a 12.5 percent corporate income tax rate on trading income. There is no withholding tax on dividends distributed from Platinum Regency to Platinum Holdings.
We incurred approximately $6,500,000 of withholding taxes associated with the transfer from Platinum Finance to Platinum Holdings of $183,350,000 of the proceeds from the issuance of the Series A Notes in May 2005. This transaction is deemed to be a taxable distribution under U.S. tax law and
F-23
Table of Contents
Platinum Underwriters Holdings, Ltd. and Subsidiaries
Notes to Consolidated Financial Statements, continued
subject to U.S. withholding tax.
Income (loss) before income tax expense (benefit) for the years ended December 31, 2006, 2005 and 2004 by location is as follows ($ in thousands):
| 2006 | 2005 | 2004 | ||||||||||
| United States | $ | 75,374 | (66,181 | ) | $ | 73,020 | ||||||
| Bermuda | 263,327 | (73,165 | ) | 19,423 | ||||||||
| Other | 21,123 | (23,108 | ) | 22,689 | ||||||||
| Income before income tax expense (benefit) | $ | 359,824 | (162,454 | ) | $ | 115,132 | ||||||
Income tax expense (benefit) for the years ended December 31, 2006, 2005 and 2004 is comprised of current and deferred taxes as follows ($ in thousands):
| 2006 | 2005 | 2004 | ||||||||||
| Current tax expense (benefit) | $ | 32,780 | (377 | ) | $ | 28,133 | ||||||
| Deferred tax expense (benefit) | (2,613 | ) | (24,590 | ) | 2,216 | |||||||
| Total | $ | 30,167 | (24,967 | ) | $ | 30,349 | ||||||
A reconciliation of expected income tax expense (benefit), computed by applying a 35 percent income tax rate to income (loss) before income taxes (benefit), to income tax expense (benefit) for the years ended December 31, 2006, 2005 and 2004 is as follows ($ in thousands):
| 2006 | 2005 | 2004 | ||||||||||
| Expected income tax expense (benefit) at 35% | $ | 125,938 | (56,859 | ) | $ | 40,296 | ||||||
| Effect of income or loss subject to tax at rates other than 35% | (93,347 | ) | 26,474 | (8,222 | ) | |||||||
| Tax exempt investment income | (2,062 | ) | (2,932 | ) | (1,084 | ) | ||||||
| U.S. withholding taxes deemed taxable transfer to foreign affiliate | (450 | ) | 6,500 | — | ||||||||
| Other, net | 88 | 1,850 | (641 | ) | ||||||||
| Income tax expense (benefit) | $ | 30,167 | (24,967 | ) | $ | 30,349 | ||||||
The tax effects of temporary differences that give rise to the deferred tax assets and deferred tax liabilities as of December 31, 2006 and 2005 are as follows ($ in thousands):
F-24
Table of Contents
Platinum Underwriters Holdings, Ltd. and Subsidiaries
Notes to Consolidated Financial Statements, continued
| 2006 | 2005 | |||||||
| Deferred tax assets: | ||||||||
| Unpaid losses and LAE | $ | 34,433 | $ | 45,516 | ||||
| Timing differences in recognition of expenses | 1,448 | — | ||||||
| Unearned premiums | 7,499 | 12,555 | ||||||
| Net unrealized losses on investments | 5,985 | 6,565 | ||||||
| Other deferred tax assets | 6,586 | 41 | ||||||
| Total deferred tax assets | $ | 55,951 | $ | 64,677 | ||||
| Deferred tax liabilities: | ||||||||
| Deferred acquisition costs | 11,051 | 31,716 | ||||||
| Timing differences in recognition of expenses | — | 261 | ||||||
| Unrealized net foreign currency exchange losses | 10,557 | 884 | ||||||
| Total deferred tax liabilities | 21,608 | 32,861 | ||||||
| Total net deferred tax assets (liabilities) | $ | 34,343 | $ | 31,816 | ||||
Income tax assets and liabilities are recorded by offsetting assets and liabilities by tax jurisdiction. The deferred tax assets and liabilities as of December 31, 2006 and 2005 are included in the consolidated balance sheets as follows ($ in thousands):
| 2006 | 2005 | |||||||
| Platinum US deferred tax assets | $ | 49,627 | $ | 64,871 | ||||
| Platinum US deferred tax liabilities | 11,051 | 32,937 | ||||||
| Net Platinum US deferred tax assets | 38,576 | 31,934 | ||||||
| Platinum UK deferred tax assets | 6,585 | 1,073 | ||||||
| Platinum UK deferred tax liabilities | 10,818 | 1,191 | ||||||
| Net Platinum UK deferred tax liabilities | 4,233 | 118 | ||||||
| Total net deferred tax assets (liabilities) | $ | 34,343 | $ | 31,816 | ||||
To evaluate the realization of the deferred tax assets, we consider the timing of the reversal of deferred income and expense items as well as the likelihood that we will generate sufficient taxable income to realize the future tax benefits. We believe that we will generate sufficient taxable income to realize the deferred assets and, consequently, no valuation allowance was established as of December 31, 2006 or 2005.
Income taxes paid in 2006, 2005 and 2004 were $15,602,000, $33,569,000 and $8,549,000, respectively.
7.Shareholders’ Equity and Regulation
Platinum Holdings is authorized to issue up to 200,000,000 common shares, $0.01 par value, and 25,000,000 preferred shares, $0.01 par value. As of December 31, 2006 we had
F-25
Table of Contents
Platinum Underwriters Holdings, Ltd. and Subsidiaries
Notes to Consolidated Financial Statements, continued
59,671,959 common shares and 5,750,000 preferred shares issued and outstanding. As of December 31, 2005 we had 59,126,675 common shares and 5,750,000 preferred shares issued and outstanding. No common or preferred shares were repurchased in 2006 or 2005.
In 2002 Platinum Holdings completed an initial public offering of common shares. Concurrently, Platinum Holdings sold 6,000,000 common shares and issued options to purchase 6,000,000 common shares to St. Paul and sold 3,960,000 common shares and issued options to purchase 2,500,000 common shares to RenaissanceRe. The options have a $27.00 per share purchase price and a term of ten years from November 2, 2002. Both St. Paul and RenaissanceRe have amended their options to provide that in lieu of paying $27.00 per share, any option exercise will be settled on a net share basis, which will result in Platinum Holdings issuing a number of common shares equal to the excess of the market price per share, determined in accordance with the amendments, over $27.00, less the par value per share, multiplied by the number of common shares issuable upon exercise of the option divided by that market price per share.
We filed an allocated universal shelf registration statement with the SEC, which the SEC declared effective on April 5, 2004. The securities registered under the shelf registration statement for sales include up to $750,000,000 of common shares, preferred shares and various types of debt securities. Common shares sold by St. Paul and RenaissanceRe and common shares issuable upon exercise of options owned by St. Paul and RenaissanceRe accounted for $586,381,900 of the $750,000,000 of securities registered under the allocated universal shelf registration statement. On June 30, 2004, St. Paul completed the sale of its 6,000,000 common shares in an underwritten public offering, which was effected pursuant to a prospectus supplement to the shelf registration statement dated June 28, 2004. We did not sell any common shares in the offering and did not receive any proceeds from the sale of the common shares by St Paul. The proceeds from the sale of 6,000,000 common shares by St. Paul amounted to $177,330,000 of the securities registered under the $750,000,000 shelf registration statement. On December 6, 2005, Renaissance Re sold its 3,960,000 common shares in a public offering, which was effected pursuant to a prospectus supplement to the allocated universal shelf registration statement effective April 5, 2004. The proceeds from the sale of 3,960,000 common shares by Renaissance Re amounted to $119,394,000. On September 22, 2005, Platinum Holdings completed an offering of 5,839,286 common shares at a price to the public of $28.00 per share, less related expenses. All shares were offered by Platinum Holdings and were sold pursuant to its effective allocated shelf registration statement. The net proceeds of $161,865,000 were used to make contributions to the capital and surplus of the reinsurance subsidiaries and for general corporate purposes. This common share offering utilized substantially all of the remaining capacity allocated to us under the allocated shelf registration statement.
We filed an unallocated universal shelf registration statement with the SEC, which the SEC declared effective on November 8, 2005. Under this shelf registration statement we may issue and sell, in one or more offerings, up to $750,000,000 of debt, equity and other types of securities or a combination of the above, including debt securities of Platinum Finance, unconditionally guaranteed by Platinum Holdings. On December 6, 2005, Platinum Holdings completed an offering of 4,408,263 common shares at a price to the public of $30.15 per share, less related expenses.
On December 6, 2005, Platinum Holdings completed an offering pursuant to a prospectus supplement to the unallocated universal shelf registration statement of 5,750,000 6.0% Series A Mandatory Convertible Preferred Shares at a price to the public of $30.15 per share, less related expenses. The net proceeds of $167,508,000 were used to make contributions to the capital and surplus of the
F-26
Table of Contents
Platinum Underwriters Holdings, Ltd. and Subsidiaries
Notes to Consolidated Financial Statements, continued
reinsurance subsidiaries and for general corporate purposes. On February 15, 2009, the mandatory conversion date, each preferred share will automatically convert into a number of our common shares based on the volume-weighted average price per common share on the 20 consecutive trading days ending on the third trading day prior to February 15, 2009. The conversion rate will not be more than one to one and not less than 0.7874 per preferred share, depending on the market value of our common shares. Based on the conversion rate of .7874 applicable to any conversion of preferred shares prior to February 15, 2009, we would issue 4,527,550 common shares. The conversion rate of our preferred shares to common shares is subject to anti-dilution adjustments under certain circumstances, including the payment of dividends on our common shares in common shares, the issuance of common share rights or warrants to acquire common shares at less than market price to all holders, and the payment of cash dividends per common share in excess of $0.08 per quarter, subject to adjustment whenever the conversion rate is adjusted. Unless all accrued, cumulated and unpaid dividends on our preferred shares for all past quarterly dividend periods have been paid in full we cannot declare or pay any dividend or make any distribution of assets on our common shares. If dividends on the preferred shares outstanding have not been paid in an amount equal to six full quarterly dividends, holders of the outstanding preferred shares will be entitled to elect two additional directors to our board of directors. These voting rights continue until all accrued, cumulated and unpaid dividends on the preferred shares then outstanding are paid in full. Each preferred share has a liquidation preference of $30.15 per preferred share.
On August 4, 2004, the board of directors of Platinum Holdings approved a plan to purchase up to $50,000,000 of our common shares. During the year ended December 31, 2004 we purchased 349,700 of our common shares in the open market at an aggregate amount of $9,985,000 at a weighted average price of $28.55 per share. The common shares we purchased were canceled. No repurchases of our common shares were made during 2006 or 2005.
Accumulated Other Comprehensive Income (Loss)
Accumulated other comprehensive income (loss) is a component of shareholders’ equity and includes all changes in unrealized appreciation and depreciation; reclassification adjustments for investment losses and gains included in net income; and translation adjustments. The components of comprehensive income (loss) for the years ended December 31, 2006, 2005 and 2004 are as follows ($ in thousands, except per share data):
| 2006 | 2005 | 2004 | ||||||||||
| Before tax amounts: | ||||||||||||
| Foreign currency translation adjustment | $ | 452 | (737 | ) | $ | 555 | ||||||
| Net change in unrealized holding gains and losses arising during the period | (1,786 | ) | (62,441 | ) | (6,866 | ) | ||||||
| Less: reclassification adjustment for net gains (losses) realized in net income | 1,522 | (1,423 | ) | 2,594 | ||||||||
| Other comprehensive income (loss) before tax | (2,856 | ) | (61,755 | ) | (8,905 | ) | ||||||
F-27
Table of Contents
Platinum Underwriters Holdings, Ltd. and Subsidiaries
Notes to Consolidated Financial Statements, continued
| 2006 | 2005 | 2004 | ||||||||||
| Deferred income tax (expense) benefit on: | ||||||||||||
| Foreign currency translation adjustment | (136 | ) | 221 | (167 | ) | |||||||
| Net change in unrealized holding gains and losses arising during the period | (654 | ) | 8,536 | 2,337 | ||||||||
| Less: reclassification adjustment for net gains (losses) realized in net income | (75 | ) | (28 | ) | (213 | ) | ||||||
| Deferred tax on other comprehensive income (loss) | (715 | ) | 8,785 | 2,383 | ||||||||
| Net of tax amounts: | ||||||||||||
| Net foreign currency translation adjustment | 316 | (516 | ) | 388 | ||||||||
| Net change in unrealized holding gains and losses arising during the period | (2,440 | ) | (53,905 | ) | (4,529 | ) | ||||||
| Less: reclassification adjustment for net (gains) losses realized in net income | 1,447 | (1,451 | ) | 2,381 | ||||||||
| Other comprehensive income (loss), net of tax | $ | (3,571 | ) | (52,970 | ) | $ | (6,522 | ) | ||||
Statutory Basis Equity, Income and Regulation
Our ability to pay dividends is subject to certain regulatory restrictions on the payment of dividends by our subsidiaries. The payment of dividends from our regulated reinsurance subsidiaries is limited by applicable laws and statutory requirements of the jurisdictions in which the subsidiaries operate, including Bermuda, the United States and the United Kingdom. Based on the regulatory restrictions of the applicable jurisdictions, the maximum amount available for payment of dividends or other distributions by our reinsurance subsidiaries in 2007 without prior regulatory approval is estimated to be approximately $307,000,000.
The combined statutory capital and surplus and statutory net income as reported to relevant regulatory authorities for our reinsurance subsidiaries were as follows ($ in thousands):
| 2006 | 2005 | 2004 | ||||||||||
| Statutory capital and surplus | ||||||||||||
| Bermuda | $ | 1,178,261 | 930,072 | $ | 535,054 | |||||||
| United States | 530,822 | 447,207 | 403,121 | |||||||||
| United Kingdom | 174,474 | 156,927 | 186,270 | |||||||||
| Total statutory capital and surplus | 1,883,557 | 1,534,206 | 1,124,445 | |||||||||
| Statutory net income (loss) | ||||||||||||
| Bermuda | 281,247 | (68,459 | ) | 29,356 | ||||||||
| United States | 117,980 | (21,884 | ) | 20,575 | ||||||||
| United Kingdom | (7,927 | ) | (4,685 | ) | 1,872 | |||||||
| Total statutory net income (loss) | $ | 391,300 | (95,028 | ) | $ | 51,803 | ||||||
Our reinsurance subsidiaries file financial statements prepared in accordance with statutory accounting practices prescribed or permitted by domestic or foreign insurance regulatory authorities. The differences between statutory basis financial statements and financial statements prepared in accordance
F-28
Table of Contents
Platinum Underwriters Holdings, Ltd. and Subsidiaries
Notes to Consolidated Financial Statements, continued
with U.S. GAAP vary between domestic and foreign jurisdictions. The principal differences in Bermuda are that statutory financial statements do not reflect deferred acquisition costs, prepaid assets, or fixed assets. Also, reinsurance assets and liabilities are presented net of retrocessional reinsurance and there is no cash flow statement. The principal differences in the United States are that statutory financial statements do not reflect deferred acquisition costs, bonds are carried at amortized cost, deferred income tax is charged or credited directly to equity, subject to limitations, and reinsurance assets and liabilities are presented net of retrocessional reinsurance. We have not used any statutory accounting practices that are not prescribed. The principal differences in the United Kingdom are that bonds are carried at amortized cost, all foreign currency exchange gains and losses are recognized in the consolidated statement of operations and a claims equalization reserve is established.
8.Earnings (Loss) Per Common Share
Following is a reconciliation of the basic and diluted earnings per common share computations for the years ended December 31, 2006, 2005 and 2004 ($ in thousands, except per share data):
| Earnings | ||||||||||||
| Weighted | (Loss) | |||||||||||
| Net | Average | Per | ||||||||||
| Income | Shares | Common | ||||||||||
| (Loss) | Outstanding | Share | ||||||||||
| Year Ended December 31, 2006: | ||||||||||||
| Basic earnings per common share: | ||||||||||||
| Net income attributable to common shareholders | $ | 319,275 | 59,371 | $ | 5.38 | |||||||
| Effect of dilutive securities: | ||||||||||||
| Common share options, restricted common shares and restricted share units | — | 1,377 | ||||||||||
| Conversion of preferred shares | — | 5,750 | ||||||||||
| Preferred shares dividends | 10,382 | — | ||||||||||
| Adjusted net income for diluted earnings per common share | $ | 329,657 | 66,498 | $ | 4.96 | |||||||
| Year Ended December 31, 2005: | ||||||||||||
| Basic and diluted loss per common share: | ||||||||||||
| Loss attributable to common shareholders | $ | (138,224 | ) | 45,915 | $ | (3.01 | ) | |||||
F-29
Table of Contents
Platinum Underwriters Holdings, Ltd. and Subsidiaries
Notes to Consolidated Financial Statements, continued
| Earnings | ||||||||||||
| Weighted | (Loss) | |||||||||||
| Net | Average | Per | ||||||||||
| Income | Shares | Common | ||||||||||
| (Loss) | Outstanding | Share | ||||||||||
| Year Ended December 31, 2004: | ||||||||||||
| Basic earnings per common share: | ||||||||||||
| Net income | $ | 84,783 | 43,158 | $ | 1.96 | |||||||
| Effect of dilutive securities: | ||||||||||||
| Common share options, restricted common shares and restricted share units | — | 2,094 | ||||||||||
| Interest expense related to ESU’s | 6,097 | — | ||||||||||
| Common share conversion of ESU’s | — | 5,009 | ||||||||||
| Adjusted net income for diluted earnings per common share | $ | 90,880 | 50,261 | $ | 1.81 | |||||||
9.Share Incentive Compensation and Employee Benefit Plans
Share Incentive Compensation
We have a share incentive plan under which our key employees and directors may be granted options, restricted shares, share units, share appreciation rights, or other rights to acquire shares. Our 2006 share incentive plan provides for the granting of up to an aggregate 5,500,000 shares of common stock to employees and directors at a price equal to the closing price of common shares on the New York Stock Exchange on the date immediately preceding the date of the grant. Share incentive plan awards are granted periodically and generally vest based on three or four years of continuous employment with the Company. The common shares issuable under the share incentive plan will be made available from authorized but unissued common shares. Option awards expire ten years from the date of grant.
The following summary sets forth option activity for the years ended December 31, 2006, 2005 and 2004 (amounts in thousands, except per share exercise price):
F-30
Table of Contents
Platinum Underwriters Holdings, Ltd. and Subsidiaries
Notes to Consolidated Financial Statements, continued
| As of and for the years ended | ||||||||||||||||||||||||
| December 31, 2006 | December 31, 2005 | December 31, 2004 | ||||||||||||||||||||||
| Weighted | Weighted | Weighted | ||||||||||||||||||||||
| Average | Average | Average | ||||||||||||||||||||||
| Exercise | Exercise | Exercise | ||||||||||||||||||||||
| Options | Price | Options | Price | Options | Price | |||||||||||||||||||
| Outstanding — beginning of the year | 3,918 | $ | 23.93 | 4,428 | $ | 23.40 | 4,614 | $ | 22.92 | |||||||||||||||
| Granted | 249 | 30.47 | 333 | 29.78 | 227 | 31.43 | ||||||||||||||||||
| Exercised | 530 | 24.49 | 663 | 22.65 | 329 | 22.50 | ||||||||||||||||||
| Forfeited | 171 | 26.24 | 180 | 25.20 | 84 | 22.50 | ||||||||||||||||||
| Outstanding — end of the year | 3,466 | $ | 24.20 | 3,918 | $ | 23.93 | 4,428 | $ | 23.40 | |||||||||||||||
| Options exercisable at year-end | 2,930 | 2,896 | 3,636 | |||||||||||||||||||||
| Weighted average exercise price of options exercisable at year-end | $ | 23.11 | $ | 23.04 | $ | 22.99 | ||||||||||||||||||
The fair value of each option grant was estimated on the date of grant using the Black-Scholes option pricing model with the following weighted average assumptions for the years ended December 31, 2006, 2005 and 2004:
| 2006 | 2005 | 2004 | ||||||||||
| Dividend yield | 1.0 | % | 1.0 | % | 1.4 | % | ||||||
| Risk free interest rate | 4.6 | % | 3.0 | % | 3.0 | % | ||||||
| Expected volatility | 22.0 | % | 30.0 | % | 30.0 | % | ||||||
| Expected option life | 5.4 years | 7 years | 7 years | |||||||||
| Weighted average grant fair value | $ | 8.08 | $ | 9.92 | $ | 9.76 | ||||||
The weighted average remaining contractual terms of all outstanding options and options exercisable were 6.29 years and 5.89 years, respectively as of December 31, 2006. The total intrinsic value, which is the difference between the market value and strike price on the date of exercise, of options exercised during the years ended December 31, 2006, 2005 and 2004 was $1,903,000, $6,012,000 and $3,040,452, respectively. The total fair value, based on the Black-Scholes option pricing model, of options exercised during the years ended December 31, 2006, 2005 and 2004 was $4,087,000, $4,768,000 and $2,334,000, respectively. The total fair value, based on the Black-Scholes option pricing model, of options vested during the years ended December 31, 2006, 2005 and 2004 was $4,518,000, $7,752,000 and $7,647,000, respectively. Estimated unrecognized compensation cost, net of estimated forfeitures, related to outstanding options as of December 31, 2006 was $3,339,000. Such cost is expected to be recognized over a weighted-average period of 1.6 years.
The Company’s computation of expected volatility for the year ended December 31, 2006 is based on 3.5 years of historical volatility using daily price observations. Our computation of expected option life is based on historical data analysis of exercises, forfeitures, and post-vest cancellations. The forfeitures are used to determine the outstanding pool of options and do not affect the expected term calculation (either historical or projected). The exercises and post-vest cancellations are used to calculate the time between grant and settlement date (exercise date or post-vest cancel date), and then weighted by the shares settled (options exercised or canceled).
F-31
Table of Contents
Platinum Underwriters Holdings, Ltd. and Subsidiaries
Notes to Consolidated Financial Statements, continued
The following summary sets forth share unit activity for the years ended December 31, 2006 and 2005 (amounts in thousands, except grant date fair value):
| As of and for the years ended | ||||||||||||||||
| December 31, 2006 | December 31, 2005 | |||||||||||||||
| Weighted | Weighted | |||||||||||||||
| Average | Average | |||||||||||||||
| Share | Grant Date | Share | Grant Date | |||||||||||||
| Units | Fair Value | Units | Fair Value | |||||||||||||
| Outstanding — beginning of the year | 112 | $ | 30.93 | — | — | |||||||||||
| Granted | 82 | 30.31 | 122 | $ | 30.91 | |||||||||||
| Converted | — | — | 3 | 30.75 | ||||||||||||
| Forfeited | 13 | 30.73 | 7 | 30.75 | ||||||||||||
| Outstanding — end of the year | 181 | $ | 30.66 | 112 | $ | 30.93 | ||||||||||
The total fair value of share units converted during the year ended December 31, 2005 was $82,000. There were no share units converted in 2006. As of December 31, 2006, there was $2,729,000, of estimated unrecognized compensation cost related to share unit awards. That cost is expected to be recognized over a weighted-average period of 2.1 years.
During 2006, we granted 15,534 restricted shares, with a fair value at the grant date of $475,000, that vest over a three year period. During 2005, we granted 18,428 restricted shares, with a fair value at the grant date of $525,000, that vest over a three-year period. During 2004, we granted 98,531 restricted shares, with a fair value at the grant date of $2,750,000, that vest over a five-year period. During 2006, 45,555 restricted shares vested. As of December 31, 2006, there were 86,938 remaining unvested restricted shares and $1,989,000, of estimated unrecognized compensation cost related to unvested restricted shares. Such cost is expected to be recognized over a weighted-average period of 1.7 years.
In 2006, the Company granted 85,168 long-term incentive awards under the 2006 Executive Incentive Plan which had a grant date fair value of $2,604,000. This plan provides for a payout at 100% of the award if the Company achieves an average return on equity for a three year period, beginning in 2006, of 12%, with a range of payout from 0% (for return on equity of less than 6%) to 200% (for a return on equity of 18% or more), determined through straight line interpolation. These awards are to be settled in common shares at the completion of the performance period and are conditioned upon the continued employment of the participant throughout the performance period. In 2006, the Company recognized $1,439,000 of share-based compensation related to this award which is based on the estimated payout as of December 31, 2006. As of December 31, 2006, there was $2,878,000 of estimated unrecognized compensation cost related to these awards which is expected to be recognized over 2 years.
The following table provides the total share-based compensation expense recognized during the year ended December 31, 2006 ($ in thousands):
| Share-based compensation expense | $ | 7,995 | ||
| Tax benefit | (995 | ) | ||
| Share-based compensation expense, net of tax | $ | 7,000 |
F-32
Table of Contents
Platinum Underwriters Holdings, Ltd. and Subsidiaries
Notes to Consolidated Financial Statements, continued
Defined Contribution Plan
In 2003, Platinum US adopted an employee savings plan as a defined contribution plan intended to qualify under Section 401(a) of the Internal Revenue Code of 1986, as amended (the “Code”) and covering substantially all U.S. based employees and certain other non-U.S. based employees. The savings plan allows eligible employees to contribute up to 50 percent of their annual compensation on a tax-deferred basis up to limits under the Code and we will match up to the first four percent. In addition, Platinum US may, at its discretion, make additional contributions. Expenses related to the savings plan were $2,164,000, $1,638,000 and $1,255,000 for the years ended December 31, 2006, 2005 and 2004, respectively.
10.Related Party Transactions and Agreements
In connection with our initial public offering in 2002 and the transfer of business, we entered into various agreements with St. Paul and its affiliates and RenaissanceRe and its affiliates including the Quota Share Retrocession Agreements. We also entered into several agreements with St. Paul pursuant to which St. Paul provides various services, including accounting and administration of the business assumed under the Quota Share Retrocession Agreements. We paid St. Paul a total of $283,000, $381,000 and $326,000 for such services provided in 2006, 2005 and 2004, respectively.
Platinum Holdings also entered into a five-year Services and Capacity Reservation Agreement with RenaissanceRe, effective October 1, 2002, pursuant to which RenaissanceRe provides services to our subsidiaries in connection with their property catastrophe book of business. At our request, RenaissanceRe analyzes our property catastrophe treaties and contracts no more than twice per year and assists us in measuring risk and managing our property catastrophe treaties and contracts. Based upon such analysis, RenaissanceRe provides us with quotations for rates for non-marine non-finite property catastrophe retrocessional coverage with aggregate limits up to $100 million annually, either on an excess-of-loss or proportional basis. We may then enter into retrocessional agreements with RenaissanceRe on the basis of the quotations. The fee for the coverage commitment and the services provided by RenaissanceRe under this agreement is 3.5 percent of our gross written non-marine non-finite property catastrophe premium for the contract year, subject to a minimum of $4 million. Fees related to this agreement were $7,829,000, $6,538,000 and $6,395,000 for the years ended December 31, 2006, 2005 and 2004, respectively. Fees related to this agreement are included in operating expenses. This agreement expires in September 2007.
Renaissance Underwriting Managers Ltd. (“RUM”), a subsidiary of RenaissanceRe, and Platinum Bermuda entered into an agreement whereby RUM will, from time to time, provide referrals of treaty and facultative reinsurance contracts to Platinum Bermuda for a fee. The fee is 1.0% of gross premiums written for all pro-rata business, 2.5% of gross premiums written on all excess-of-loss business, and 7.5% of the margin on all finite business. We paid $12,000, $57,000 and $846,000 in fees for such referrals for the years ended December 31, 2006, 2005 and 2004, respectively. The business referred is also subject to profit commissions which were $191,000, $341,000 and $727,000 in 2006, 2005 and 2004, respectively.
Platinum US is a party to two property catastrophe excess-of-loss programs with the Glencoe Group of Companies, which are affiliates of RenaissanceRe. Platinum US has a 5% participation across
F-33
Table of Contents
Platinum Underwriters Holdings, Ltd. and Subsidiaries
Notes to Consolidated Financial Statements, continued
four layers of reinsurance on one program and a 15% participation on the other program. Platinum US is also a party to a quota share retrocession agreement with Glencoe Insurance Ltd. pursuant to which Platinum US cedes to Glencoe Insurance Ltd. 60% of all liabilities under the subject property facultative certificates. Premium ceded in 2006, 2005 and 2004 under this agreement was approximately $16,533,000, $5,058,000 and 3,400,000, respectively.
11.Operating Segment Information
We have organized our worldwide reinsurance business around three operating segments: Property and Marine, Casualty and Finite Risk. The Property and Marine operating segment includes principally property (including crop) and marine reinsurance coverages that are written in the United States and international markets. This business includes property per-risk excess-of-loss treaties, property proportional treaties and catastrophe excess-of-loss treaties. The Casualty operating segment includes principally reinsurance treaties that cover umbrella liability, general and product liability, professional liability, workers’ compensation, casualty clash, automobile liability, surety and trade credit. This segment also includes accident and health reinsurance treaties, which are predominantly reinsurance of health insurance products. The Finite Risk operating segment includes principally structured reinsurance contracts with ceding companies whose needs may not be met efficiently through traditional reinsurance products. In exchange for contractual features that limit our downside risk, reinsurance contracts we classify as finite risk provide the potential for significant profit commission to the ceding company. The classes of risks underwritten through finite risk contracts are generally consistent with the classes covered by traditional products. The finite risk contracts that we underwrite generally provide prospective protection, meaning coverage is provided for losses that are incurred after inception of the contract, as contrasted with retrospective coverage, which covers losses that are incurred prior to inception of the contract. The three main categories of finite risk contracts are quota share, multi-year excess-of-loss and whole account aggregate stop loss.
In managing our operating segments, management uses measures such as underwriting income and underwriting ratios to evaluate segment performance. We do not allocate assets or certain income and expenses such as investment income, interest expense and certain corporate expenses by segment. The measures used by management in evaluating our operating segments should not be used as a substitute for measures determined under U.S. GAAP. The following table summarizes underwriting activity and ratios for the three operating segments together with a reconciliation of underwriting income (loss) to income before income tax expense (benefit) for the years ended December 31, 2006, 2005 and 2004 ($ in thousands):
F-34
Table of Contents
Platinum Underwriters Holdings, Ltd. and Subsidiaries
Notes to Consolidated Financial Statements, continued
| Property | ||||||||||||||||
| and Marine | Casualty | Finite Risk | Total | |||||||||||||
| Year ended December 31, 2006: | ||||||||||||||||
| Net premiums written | $ | 424,929 | 757,675 | (5,991 | ) | $ | 1,176,613 | |||||||||
| Net premiums earned | 448,959 | 764,341 | 123,401 | 1,336,701 | ||||||||||||
| Net losses and LAE | 145,900 | 522,815 | 91,887 | 760,602 | ||||||||||||
| Net acquisition expenses | 70,905 | 188,717 | 26,301 | 285,923 | ||||||||||||
| Other underwriting expenses | 39,887 | 27,022 | 4,387 | 71,296 | ||||||||||||
| Segment underwriting income | $ | 192,267 | 25,787 | 826 | 218,880 | |||||||||||
| Net investment income | 187,987 | |||||||||||||||
| Net realized gains on investments | 1,090 | |||||||||||||||
| Net foreign currency exchange gains | 738 | |||||||||||||||
| Other expense | (2,872 | ) | ||||||||||||||
| Corporate expenses not allocated to segments | (24,194 | ) | ||||||||||||||
| Interest expense | (21,805 | ) | ||||||||||||||
| Income before income tax expense | $ | 359,824 | ||||||||||||||
| Ratios: | ||||||||||||||||
| Net loss and LAE | 32.5 | % | 68.4 | % | 74.5 | % | 56.9 | % | ||||||||
| Net acquisition expense | 15.8 | % | 24.7 | % | 21.3 | % | 21.4 | % | ||||||||
| Other underwriting expense | 8.9 | % | 3.5 | % | 3.6 | % | 5.3 | % | ||||||||
| Combined | 57.2 | % | 96.6 | % | 99.4 | % | 83.6 | % | ||||||||
| Year ended December 31, 2005: | ||||||||||||||||
| Net premiums written | $ | 575,055 | 809,031 | 333,636 | $ | 1,717,722 | ||||||||||
| Net premiums earned | 569,173 | 789,629 | 355,921 | 1,714,723 | ||||||||||||
| Net losses and LAE | 756,742 | 511,609 | 237,074 | 1,505,425 | ||||||||||||
| Net acquisition expenses | 93,983 | 194,397 | 114,755 | 403,135 | ||||||||||||
| Other underwriting expenses | 26,074 | 24,690 | 4,905 | 55,669 | ||||||||||||
| Segment underwriting income (loss) | $ | (307,626 | ) | 58,933 | (813 | ) | (249,506 | ) | ||||||||
| Net investment income | 129,445 | |||||||||||||||
| Net realized losses on investments | (3,046 | ) | ||||||||||||||
| Net foreign currency exchange losses | (2,111 | ) | ||||||||||||||
| Other expense | (586 | ) | ||||||||||||||
| Corporate expenses not allocated to segments | (14,158 | ) | ||||||||||||||
| Interest expense | (20,006 | ) | ||||||||||||||
| Loss on repurchase of debt | (2,486 | ) | ||||||||||||||
| Loss before income tax benefit | $ | (162,454 | ) | |||||||||||||
F-35
Table of Contents
Platinum Underwriters Holdings, Ltd. and Subsidiaries
Notes to Consolidated Financial Statements, continued
| Property | ||||||||||||||||
| and Marine | Casualty | Finite Risk | Total | |||||||||||||
| Ratios: | ||||||||||||||||
| Net loss and LAE | 133.0 | % | 64.8 | % | 66.6 | % | 87.8 | % | ||||||||
| Net acquisition expense | 16.5 | % | 24.6 | % | 32.2 | % | 23.5 | % | ||||||||
| Other underwriting expense | 4.6 | % | 3.1 | % | 1.4 | % | 3.2 | % | ||||||||
| Combined | 154.1 | % | 92.5 | % | 100.2 | % | 114.5 | % | ||||||||
| Year ended December 31, 2004 | ||||||||||||||||
| Net premiums written | $ | 504,439 | 677,399 | 464,175 | $ | 1,646,013 | ||||||||||
| Net premiums earned | 485,135 | 611,893 | 350,907 | 1,447,935 | ||||||||||||
| Net losses and LAE | 349,557 | 418,355 | 251,892 | 1,019,804 | ||||||||||||
| Net acquisition expenses | 76,360 | 151,649 | 99,812 | 327,821 | ||||||||||||
| Other underwriting expenses | 27,827 | 19,086 | 6,224 | 53,137 | ||||||||||||
| Segment underwriting income | $ | 31,391 | 22,803 | (7,021 | ) | 47,173 | ||||||||||
| Net investment income | 84,532 | |||||||||||||||
| Net realized gains on investments | 1,955 | |||||||||||||||
| Net foreign currency exchange gains | 725 | |||||||||||||||
| Other income | 3,211 | |||||||||||||||
| Corporate expenses not allocated to segments | (13,196 | ) | ||||||||||||||
| Interest expense | (9,268 | ) | ||||||||||||||
| Income before income tax expense | $ | 115,132 | ||||||||||||||
| Ratios: | ||||||||||||||||
| Net loss and LAE | 72.1 | % | 68.4 | % | 71.8 | % | 70.4 | % | ||||||||
| Net acquisition expense | 15.7 | % | 24.8 | % | 28.4 | % | 22.6 | % | ||||||||
| Other underwriting expense | 5.7 | % | 3.1 | % | 1.8 | % | 3.7 | % | ||||||||
| Combined | 93.5 | % | 96.3 | % | 102.0 | % | 96.7 | % | ||||||||
Corporate expenses, interest expenses, net investment income, net realized investment gains, loss on repurchase of debt and other income or expense items that are not specifically attributable to operating segments are not allocated.
The following table sets forth our net premiums written for the years ended December 31, 2006, 2005 and 2004 by geographic location of the ceding company ($ in thousands):
| 2006 | 2005 | 2004 | ||||||||||
| United States | $ | 949,522 | 1,449,216 | $ | 1,350,408 | |||||||
| International | 227,091 | 268,506 | 295,605 | |||||||||
| Total | $ | 1,176,613 | 1,717,722 | $ | 1,646,013 | |||||||
F-36
Table of Contents
Platinum Underwriters Holdings, Ltd. and Subsidiaries
Notes to Consolidated Financial Statements, continued
12.Commitments and Contingencies
Litigation
In the normal course of business, we may become involved in various claims and legal proceedings. We are not currently aware of any pending or threatened material litigation.
Lease Commitments
Future minimum annual lease commitments under various non-cancelable operating leases for our office facilities are as follows: ($ in thousands):
| Years Ending December 31, | ||||
| 2007 | $ | 2,707 | ||
| 2008 | 2,613 | |||
| 2009 | 2,579 | |||
| 2010 | 2,002 | |||
| 2011 | 1,945 | |||
| Thereafter | 2,902 | |||
| Total | $ | 14,748 | ||
Rent expense was $2,887,000, $2,750,000 and $3,070,000 for the years ended December 31, 2006, 2005 and 2004, respectively.
Contingencies
In November and December 2004, we received subpoenas from the SEC and the Office of the Attorney General for the State of New York for documents and information relating to certain non-traditional, or loss mitigation, insurance products. On June 14, 2005, we received a grand jury subpoena from the United States Attorney for the Southern District of New York requesting documents relating to our finite reinsurance products. We have fully cooperated in responding to all such requests. We are unable to predict the direction the investigation will take and the impact, if any, it may have on our business.
13.Quarterly Financial Data (Unaudited)
The following quarterly financial information for each of the three months ended March 31, June 30, September 30 and December 31, 2006 and 2005 is unaudited. However, in the opinion of management, all adjustments (consisting of normal recurring adjustments) necessary to present fairly the results of operations for such periods, have been made for a fair presentation of the results shown ($ in thousands, except per share data):
F-37
Table of Contents
Platinum Underwriters Holdings, Ltd. and Subsidiaries
Notes to Consolidated Financial Statements, continued
| Three months ended | ||||||||||||||||
| March 31, | June 30, | September 30, | December 31, | |||||||||||||
| 2006 | 2006 | 2006 | 2006 | |||||||||||||
| Net premiums earned | $ | 344,301 | 337,065 | 339,609 | $ | 315,726 | ||||||||||
| Net investment income | 43,515 | 45,348 | 48,302 | 50,822 | ||||||||||||
| Net losses and LAE | 206,774 | 187,464 | 191,428 | 174,936 | ||||||||||||
| Net acquisition expenses | 69,239 | 76,052 | 74,994 | 65,638 | ||||||||||||
| Operating expenses | 22,988 | 23,392 | 25,348 | 23,762 | ||||||||||||
| Net income attributable to common shareholders | 74,460 | 79,146 | 82,321 | 83,348 | ||||||||||||
| Earnings per common share: | ||||||||||||||||
| Basic | 1.26 | 1.34 | 1.38 | 1.40 | ||||||||||||
| Diluted | $ | 1.16 | 1.24 | 1.28 | $ | 1.28 | ||||||||||
| Average common shares outstanding: | ||||||||||||||||
| Basic | 59,097 | 59,224 | 59,537 | 59,621 | ||||||||||||
| Diluted | 66,597 | 65,725 | 66,520 | 67,091 | ||||||||||||
| Three months ended | ||||||||||||||||
| March 31, | June 30, | September 30, | December 31, | |||||||||||||
| 2005 | 2005 | 2005 | 2005 | |||||||||||||
| Net premiums earned | $ | 411,040 | 431,470 | 429,388 | $ | 442,825 | ||||||||||
| Net investment income | 26,905 | 28,904 | 36,441 | 37,195 | ||||||||||||
| Net losses and LAE | 237,698 | 240,852 | 564,618 | 462,257 | ||||||||||||
| Net acquisition expenses | 93,249 | 103,928 | 98,858 | 107,100 | ||||||||||||
| Operating expenses | 20,008 | 23,480 | 8,080 | 18,259 | ||||||||||||
| Net income (loss) attributable to common shareholders | 73,088 | 67,985 | (176,024 | ) | (103,273 | ) | ||||||||||
| Earnings (loss) per common share: | ||||||||||||||||
| Basic | 1.69 | 1.57 | (4.02 | ) | (1.94 | ) | ||||||||||
| Diluted | $ | 1.49 | 1.39 | (4.02 | ) | $ | (1.94 | ) | ||||||||
| Average common shares outstanding: | ||||||||||||||||
| Basic | 43,163 | 43,293 | 43,785 | 53,339 | ||||||||||||
| Diluted | 50,032 | 50,009 | 43,785 | 53,339 | ||||||||||||
14.Condensed Consolidating Financial Information
Platinum Finance is a U.S. based intermediate holding company and a wholly owned subsidiary
F-38
Table of Contents
Platinum Underwriters Holdings, Ltd. and Subsidiaries
Notes to Consolidated Financial Statements, continued
of Platinum Regency. The outstanding Series B Notes, due June 1, 2017 issued by Platinum Finance are fully and unconditionally guaranteed by Platinum Holdings. The outstanding Series B Remarketed Notes, due November 16, 2007, issued by Platinum Finance are also fully and unconditionally guaranteed by Platinum Holdings.
The payment of dividends from our regulated reinsurance subsidiaries is limited by applicable laws and statutory requirements of the jurisdictions in which the subsidiaries operate, including Bermuda, the United States and the United Kingdom. Based on the regulatory restrictions of the applicable jurisdictions, the maximum amount available for payment of dividends or other distributions by the reinsurance subsidiary of Platinum Finance in 2007 without prior regulatory approval is approximately $13,000,000. The maximum amount available for payment of dividends or other distributions by the reinsurance subsidiaries of Platinum Holdings in 2007, including the reinsurance subsidiary of Platinum Finance, without prior regulatory approval is estimated to be approximately $307,000,000.
The tables below present condensed consolidating financial information for the years ended December 31, 2006, 2005 and 2004 of Platinum Holdings, Platinum Finance and the non-guarantor subsidiaries of Platinum Holdings ($ in thousands):
F-39
Table of Contents
Platinum Underwriters Holdings, Ltd. and Subsidiaries
Notes to Consolidated Financial Statements, continued
| Non- | ||||||||||||||||||||
| Condensed Consolidating Balance Sheet | Platinum | Platinum | guarantor | Consolidating | ||||||||||||||||
| December 31, 2006 | Holdings | Finance | Subsidiaries | Adjustments | Consolidated | |||||||||||||||
ASSETS | ||||||||||||||||||||
| Total investments | $ | — | 11,342 | 3,365,943 | — | $ | 3,377,285 | |||||||||||||
| Investment in subsidiaries | 1,749,762 | 475,194 | 402,098 | (2,627,054 | ) | — | ||||||||||||||
| Cash and cash equivalents | 106,039 | 39,294 | 706,319 | — | 851,652 | |||||||||||||||
| Reinsurance assets | — | — | 765,928 | — | 765,928 | |||||||||||||||
| Income tax recoverable | — | (1,418 | ) | 8,933 | — | 7,515 | ||||||||||||||
| Other assets | 9,296 | 3,792 | 78,099 | — | 91,187 | |||||||||||||||
| Total assets | $ | 1,865,097 | 528,204 | 5,327,320 | (2,627,054 | ) | $ | 5,093,567 | ||||||||||||
LIABILITIES AND SHAREHOLDERS’ EQUITY | ||||||||||||||||||||
| Liabilities | ||||||||||||||||||||
| Reinsurance liabilities | $ | — | — | 2,880,715 | — | $ | 2,880,715 | |||||||||||||
| Debt obligations | — | 292,840 | — | — | 292,840 | |||||||||||||||
| Other liabilities | 7,036 | 2,024 | 52,891 | — | 61,951 | |||||||||||||||
| Total liabilities | 7,036 | 294,864 | 2,933,606 | — | 3,235,506 | |||||||||||||||
| Shareholders’ Equity | ||||||||||||||||||||
| Preferred shares | 57 | — | — | — | 57 | |||||||||||||||
| Common shares | 597 | — | 6,250 | (6,250 | ) | 597 | ||||||||||||||
| Additional paid-in capital | 1,545,979 | 192,203 | 2,051,468 | (2,243,671 | ) | 1,545,979 | ||||||||||||||
| Accumulated other comprehensive loss | (44,289 | ) | (9,071 | ) | (55,012 | ) | 64,083 | (44,289 | ) | |||||||||||
| Retained earnings | 355,717 | 50,208 | 391,008 | (441,216 | ) | 355,717 | ||||||||||||||
| Total shareholders’ equity | 1,858,061 | 233,340 | 2,393,714 | (2,627,054 | ) | 1,858,061 | ||||||||||||||
| Total liabilities and shareholders’ equity | $ | 1,865,097 | 528,204 | 5,327,320 | (2,627,054 | ) | $ | 5,093,567 | ||||||||||||
F-40
Table of Contents
Platinum Underwriters Holdings, Ltd. and Subsidiaries
Notes to Consolidated Financial Statements, continued
| Non- | ||||||||||||||||||||
| Condensed Consolidating Balance Sheet | Platinum | Platinum | guarantor | Consolidating | ||||||||||||||||
| December 31, 2005 | Holdings | Finance | Subsidiaries | Adjustments | Consolidated | |||||||||||||||
ASSETS | ||||||||||||||||||||
| Total investments | $ | — | 12,448 | 2,997,234 | — | $ | 3,009,682 | |||||||||||||
| Investment in subsidiaries | 1,410,794 | 448,839 | 436,368 | (2,296,001 | ) | — | ||||||||||||||
| Cash and cash equivalents | 129,962 | 5,010 | 685,774 | — | 820,746 | |||||||||||||||
| Reinsurance assets | — | — | 1,065,987 | — | 1,065,987 | |||||||||||||||
| Income tax recoverable | — | 5,874 | 18,648 | — | 24,522 | |||||||||||||||
| Other assets | 2,963 | 4,086 | 226,389 | — | 233,438 | |||||||||||||||
| Total assets | $ | 1,543,719 | 476,257 | 5,430,400 | (2,296,001 | ) | $ | 5,154,375 | ||||||||||||
LIABILITIES AND SHAREHOLDERS’ EQUITY | ||||||||||||||||||||
| Liabilities | ||||||||||||||||||||
| Reinsurance liabilities | $ | — | — | 3,041,254 | — | $ | 3,041,254 | |||||||||||||
| Debt obligations | — | 292,840 | — | — | 292,840 | |||||||||||||||
| Other liabilities | 3,470 | 2,243 | 274,319 | — | 280,032 | |||||||||||||||
| Total liabilities | 3,470 | 295,083 | 3,315,573 | — | 3,614,126 | |||||||||||||||
| Shareholders’ Equity | ||||||||||||||||||||
| Preferred shares | 57 | — | — | — | 57 | |||||||||||||||
| Common shares | 590 | — | 6,250 | (6,250 | ) | 590 | ||||||||||||||
| Unearned share grant compensation | (2,467 | ) | — | — | — | (2,467 | ) | |||||||||||||
| Additional paid-in capital | 1,527,316 | 192,036 | 2,050,834 | (2,242,870 | ) | 1,527,316 | ||||||||||||||
| Accumulated other comprehensive loss | (40,718 | ) | (10,199 | ) | (52,840 | ) | 63,039 | (40,718 | ) | |||||||||||
| Retained earnings | 55,471 | (663 | ) | 110,583 | (109,920 | ) | 55,471 | |||||||||||||
| Total shareholders’ equity | 1,540,249 | 181,174 | 2,114,827 | (2,296,001 | ) | 1,540,249 | ||||||||||||||
| Total liabilities and shareholders’ equity | $ | 1,543,719 | 476,257 | 5,430,400 | (2,296,001 | ) | $ | 5,154,375 | ||||||||||||
F-41
Table of Contents
Platinum Underwriters Holdings, Ltd. and Subsidiaries
Notes to Consolidated Financial Statements, continued
| Non- | ||||||||||||||||||||
| Consolidating Statement of Operations | Platinum | Platinum | guarantor | Consolidating | ||||||||||||||||
| For the year ended December 31, 2006 | Holdings | Finance | Subsidiaries | Adjustments | Consolidated | |||||||||||||||
| Revenue: | ||||||||||||||||||||
| Net premiums earned | $ | — | — | 1,336,701 | — | $ | 1,336,701 | |||||||||||||
| Net investment income | 5,912 | 1,033 | 181,042 | — | 187,987 | |||||||||||||||
| Net realized gains on investments | — | — | 1,090 | — | 1,090 | |||||||||||||||
| Other income (expense) | 3,577 | — | (6,449 | ) | — | (2,872 | ) | |||||||||||||
| Total revenue | 9,489 | 1,033 | 1,512,384 | — | 1,522,906 | |||||||||||||||
| Expenses: | ||||||||||||||||||||
| Net losses and loss adjustment expenses | — | — | 760,602 | — | 760,602 | |||||||||||||||
| Net acquisition expenses | — | — | 285,923 | — | 285,923 | |||||||||||||||
| Operating expenses | 23,803 | 544 | 71,143 | — | 95,490 | |||||||||||||||
| Net foreign currency exchange gains | — | — | (738 | ) | — | (738 | ) | |||||||||||||
| Interest expense | — | 21,803 | 2 | — | 21,805 | |||||||||||||||
| Total expenses | 23,803 | 22,347 | 1,116,932 | — | 1,163,082 | |||||||||||||||
| Income (loss) before income tax expense (benefit) | (14,314 | ) | (21,314 | ) | 395,452 | — | 359,824 | |||||||||||||
| Income tax expense (benefit) | — | (7,444 | ) | 37,611 | — | 30,167 | ||||||||||||||
| Net income (loss) before equity in earnings of subsidiaries | (14,314 | ) | (13,870 | ) | 357,841 | — | 329,657 | |||||||||||||
| Equity in earnings of subsidiaries | 343,971 | 64,741 | 61,473 | (470,185 | ) | — | ||||||||||||||
| Net income (loss) | 329,657 | 50,871 | 419,314 | (470,185 | ) | 329,657 | ||||||||||||||
| Preferred dividends | 10,382 | — | — | — | 10,382 | |||||||||||||||
| Net income attributable to common shareholders | $ | 319,275 | 50,871 | 419,314 | (470,185 | ) | $ | 319,275 | ||||||||||||
F-42
Table of Contents
Platinum Underwriters Holdings, Ltd. and Subsidiaries
Notes to Consolidated Financial Statements, continued
| Non- | ||||||||||||||||||||
| Consolidating Statement of Operations | Platinum | Platinum | guarantor | Consolidating | ||||||||||||||||
| For the year ended December 31, 2005 | Holdings | Finance | Subsidiaries | Adjustments | Consolidated | |||||||||||||||
| Revenue: | ||||||||||||||||||||
| Net premiums earned | $ | — | — | 1,714,723 | — | $ | 1,714,723 | |||||||||||||
| Net investment income | 1,724 | 937 | 126,867 | (83 | ) | 129,445 | ||||||||||||||
| Net realized losses on investments | — | (15 | ) | (3,031 | ) | — | (3,046 | ) | ||||||||||||
| Other income (expense) | 7,036 | — | (7,622 | ) | — | (586 | ) | |||||||||||||
| Total revenue | 8,760 | 922 | 1,830,937 | (83 | ) | 1,840,536 | ||||||||||||||
| �� | ||||||||||||||||||||
| Expenses: | ||||||||||||||||||||
| Net losses and loss adjustment expenses | — | — | 1,505,425 | — | 1,505,425 | |||||||||||||||
| Net acquisition expenses | — | — | 407,680 | (4,545 | ) | 403,135 | ||||||||||||||
| Operating expenses | 13,393 | 635 | 51,337 | 4,462 | 69,827 | |||||||||||||||
| Net foreign currency exchange losses | 2 | — | 2,109 | — | 2,111 | |||||||||||||||
| Interest expense | 71 | 19,935 | — | — | 20,006 | |||||||||||||||
| Loss on repurchase of debt | — | 2,486 | — | — | 2,486 | |||||||||||||||
| Total expenses | 13,466 | 23,056 | 1,966,551 | (83 | ) | 2,002,990 | ||||||||||||||
| Loss before income tax benefit | (4,706 | ) | (22,134 | ) | (135,614 | ) | — | (162,454 | ) | |||||||||||
| Income tax benefit | — | (7,746 | ) | (17,221 | ) | — | (24,967 | ) | ||||||||||||
| Net income (loss) before equity in earnings of subsidiaries | (4,706 | ) | (14,388 | ) | (118,393 | ) | — | (137,487 | ) | |||||||||||
| Equity in loss of subsidiaries | (132,781 | ) | (27,557 | ) | (62,160 | ) | 222,498 | — | ||||||||||||
| Net loss | (137,487 | ) | (41,945 | ) | (180,553 | ) | 222,498 | (137,487 | ) | |||||||||||
| Preferred dividends | 737 | — | — | — | 737 | |||||||||||||||
| Net loss attributable to common shareholders | $ | (138,224 | ) | (41,945 | ) | (180,553 | ) | 222,498 | $ | (138,224 | ) | |||||||||
F-43
Table of Contents
Platinum Underwriters Holdings, Ltd. and Subsidiaries
Notes to Consolidated Financial Statements, continued
| Non- | ||||||||||||||||||||
| Consolidating Statement of Operations | Platinum | Platinum | guarantor | Consolidating | ||||||||||||||||
| For the year ended December 31, 2004 | Holdings | Finance | Subsidiaries | Adjustments | Consolidated | |||||||||||||||
| Revenue: | ||||||||||||||||||||
| Net premiums earned | $ | — | — | 1,447,935 | — | $ | 1,447,935 | |||||||||||||
| Net investment income | 53 | 164 | 84,315 | — | 84,532 | |||||||||||||||
| Net realized gains on investments | — | 6 | 1,949 | — | 1,955 | |||||||||||||||
| Other income | 2,944 | — | 48 | 219 | 3,211 | |||||||||||||||
| Total revenue | 2,997 | 170 | 1,534,247 | 219 | 1,537,633 | |||||||||||||||
| Expenses: | ||||||||||||||||||||
| Net losses and loss adjustment expenses | — | — | 1,019,804 | — | 1,019,804 | |||||||||||||||
| Net acquisition expenses | — | — | 331,754 | (3,933 | ) | 327,821 | ||||||||||||||
| Operating expenses | 12,725 | 288 | 49,387 | 3,933 | 66,333 | |||||||||||||||
| Net foreign currency exchange gains | (3 | ) | — | (722 | ) | — | (725 | ) | ||||||||||||
| Interest expense | 207 | 9,061 | — | — | 9,268 | |||||||||||||||
| Total expenses | 12,929 | 9,349 | 1,400,223 | — | 1,422,501 | |||||||||||||||
| Income (loss) before income tax expense (benefit) | (9,932 | ) | (9,179 | ) | 134,024 | 219 | 115,132 | |||||||||||||
| Income tax expense (benefit) | — | (3,213 | ) | 33,562 | — | 30,349 | ||||||||||||||
| Net income (loss) before equity in earnings of subsidiaries | (9,932 | ) | (5,966 | ) | 100,462 | 219 | 84,783 | |||||||||||||
| Equity in earnings of subsidiaries | 94,715 | 55,006 | 60,799 | (210,520 | ) | — | ||||||||||||||
| Net income | $ | 84,783 | 49,040 | 161,261 | (210,301 | ) | $ | 84,783 | ||||||||||||
F-44
Table of Contents
Platinum Underwriters Holdings, Ltd. and Subsidiaries
Notes to Consolidated Financial Statements, continued
| Non- | ||||||||||||||||||||
| Condensed Consolidating Statement of Cash Flows | Platinum | Platinum | guarantor | Consolidating | ||||||||||||||||
| For the year ended December 31, 2006 | Holdings | Finance | Subsidiaries | Adjustments | Consolidated | |||||||||||||||
| Net cash provided by (used in) operating activities | $ | (9,650 | ) | (6,483 | ) | 542,934 | — | $ | 526,801 | |||||||||||
| Investing Activities: | ||||||||||||||||||||
| Proceeds from sale of available-for-sale fixed maturity securities | — | 1,564 | 346,578 | — | 348,142 | |||||||||||||||
| Proceeds from maturity or paydown of available-for-sale fixed maturity securities | — | — | 270,939 | — | 270,939 | |||||||||||||||
| Acquisition of available-for-sale fixed maturity securities | — | (498 | ) | (1,082,784 | ) | — | (1,083,282 | ) | ||||||||||||
| Dividends from subsidiaries | 1,600 | 40,000 | — | (41,600 | ) | — | ||||||||||||||
| Increase in short-term investments | — | — | (15,822 | ) | — | (15,822 | ) | |||||||||||||
| Contributions to subsidiaries | — | (300 | ) | 300 | — | |||||||||||||||
| Net cash provided by (used in) investing activities | 1,600 | 40,766 | (481,089 | ) | (41,300 | ) | (480,023 | ) | ||||||||||||
| Financing Activities: | ||||||||||||||||||||
| Dividends paid to common shareholders | (19,029 | ) | — | (41,600 | ) | 41,600 | (19,029 | ) | ||||||||||||
| Dividends paid to preferred shareholders | (9,818 | ) | — | — | — | (9,818 | ) | |||||||||||||
| Proceeds from exercise of share options | 12,975 | — | — | — | 12,975 | |||||||||||||||
| Capital contribution from parent | — | — | 300 | (300 | ) | — | ||||||||||||||
| Net cash used in financing activities | (15,872 | ) | — | (41,300 | ) | 41,300 | (15,872 | ) | ||||||||||||
| Net increase (decrease) in cash and cash equivalents | (23,922 | ) | 34,283 | 20,545 | — | 30,906 | ||||||||||||||
| Cash and cash equivalents at beginning of year | 129,962 | 5,010 | 685,774 | — | 820,746 | |||||||||||||||
| Cash and cash equivalents at end of year | $ | 106,040 | 39,293 | 706,319 | — | $ | 851,652 | |||||||||||||
F-45
Table of Contents
Platinum Underwriters Holdings, Ltd. and Subsidiaries
Notes to Consolidated Financial Statements, continued
| Non- | ||||||||||||||||||||
| Condensed Consolidating Statement of Cash Flows | Platinum | Platinum | guarantor | Consolidating | ||||||||||||||||
| For the year ended December 31, 2005 | Holdings | Finance | Subsidiaries | Adjustments | Consolidated | |||||||||||||||
| Net cash provided by (used in) operating activities | $ | (4,999 | ) | (16,340 | ) | 619,013 | — | $ | 597,674 | |||||||||||
| Investing Activities: | ||||||||||||||||||||
| Proceeds from sale of available-for-sale fixed maturity securities | — | 3,026 | 888,773 | — | 891,799 | |||||||||||||||
| Proceeds from maturity or paydown of available-for-sale fixed maturity securities | — | 439 | 97,492 | — | 97,931 | |||||||||||||||
| Proceeds from sale of subsidiary shares | — | — | 193,000 | (193,000 | ) | — | ||||||||||||||
| Purchase of subsidiary shares | — | — | (139,902 | ) | 139,902 | — | ||||||||||||||
| Acquisition of available-for-sale fixed maturity securities | — | (12,347 | ) | (1,699,158 | ) | — | (1,711,505 | ) | ||||||||||||
| Dividends from subsidiaries | 17,000 | — | — | (17,000 | ) | — | ||||||||||||||
| Decrease in short-term investments | — | — | (8,793 | ) | — | (8,793 | ) | |||||||||||||
| Contributions to subsidiaries | (477,500 | ) | (75,100 | ) | — | 552,600 | — | |||||||||||||
| Net cash used in investing activities | (460,500 | ) | (83,982 | ) | (668,588 | ) | 482,502 | (730,568 | ) | |||||||||||
| Financing Activities: | ||||||||||||||||||||
| Dividends paid to shareholders | (14,775 | ) | — | (17,000 | ) | 17,000 | (14,775 | ) | ||||||||||||
| Proceeds from exercise of share options | 15,026 | — | — | — | 15,026 | |||||||||||||||
| Proceeds from issuance of common shares | 425,757 | 139,902 | — | (139,902 | ) | 425,757 | ||||||||||||||
| Proceeds from issuance of debt | — | 246,900 | — | — | 246,900 | |||||||||||||||
| Proceeds from issuance of preferred shares | 167,509 | — | — | — | 167,509 | |||||||||||||||
| Capital contribution from parent | — | — | 552,600 | (552,600 | ) | — | ||||||||||||||
| Purchase of common shares | — | (193,000 | ) | — | 193,000 | — | ||||||||||||||
| Repurchase of debt obligations | — | (96,674 | ) | — | — | (96,674 | ) | |||||||||||||
| Net cash provided by financing activities | 593,517 | 97,128 | 535,600 | (482,502 | ) | 743,743 | ||||||||||||||
| Net increase (decrease) in cash and cash equivalents | 128,018 | (3,194 | ) | 486,025 | — | 610,849 | ||||||||||||||
| Cash and cash equivalents at beginning of year | 1,944 | 8,204 | 199,749 | — | 209,897 | |||||||||||||||
| Cash and cash equivalents at end of year | $ | 129,962 | 5,010 | 685,774 | — | $ | 820,746 | |||||||||||||
F-46
Table of Contents
Platinum Underwriters Holdings, Ltd. and Subsidiaries
Notes to Consolidated Financial Statements, continued
| Non- | ||||||||||||||||||||
| Condensed Consolidating Statement of Cash Flows | Platinum | Platinum | guarantor | Consolidating | ||||||||||||||||
| For the year ended December 31, 2004 | Holdings | Finance | Subsidiaries | Adjustments | Consolidated | |||||||||||||||
| Net cash provided by (used in) operating activities | $ | (8,400 | ) | (436 | ) | 723,569 | — | $ | 714,733 | |||||||||||
| Investing Activities: | ||||||||||||||||||||
| Proceeds from sale of available-for-sale fixed maturity securities | — | 998 | 497,947 | — | 498,945 | |||||||||||||||
| Proceeds from maturity or paydown of available-for-sale fixed maturity securities | — | 697 | 135,775 | — | 136,472 | |||||||||||||||
| Acquisition of available-for-sale fixed maturity securities | — | (2,972 | ) | (1,227,923 | ) | — | (1,230,895 | ) | ||||||||||||
| Dividends from subsidiaries | 22,000 | — | — | (22,000 | ) | — | ||||||||||||||
| Contributions to subsidiaries | (250 | ) | — | — | 250 | — | ||||||||||||||
| Net cash provided by (used in) investing activities | 21,750 | (1,277 | ) | (594,201 | ) | (21,750 | ) | (595,478 | ) | |||||||||||
| Financing Activities: | ||||||||||||||||||||
| Dividends paid to shareholders | (13,807 | ) | — | (22,000 | ) | 22,000 | (13,807 | ) | ||||||||||||
| Proceeds from exercise of share options | 7,406 | — | — | — | 7,406 | |||||||||||||||
| Proceeds from issuance of common shares | 1,567 | — | — | — | 1,567 | |||||||||||||||
| Purchase of common shares | (9,985 | ) | — | — | — | (9,985 | ) | |||||||||||||
| Capital contribution from parent | — | — | 250 | (250 | ) | — | ||||||||||||||
| Net cash used in financing activities | (14,819 | ) | — | (21,750 | ) | 21,750 | (14,819 | ) | ||||||||||||
| Net increase (decrease) in cash and cash equivalents | (1,469 | ) | (1,713 | ) | 107,618 | — | 104,436 | |||||||||||||
| Cash and cash equivalents at beginning of year | 3,413 | 9,917 | 92,131 | — | 105,461 | |||||||||||||||
| Cash and cash equivalents at end of year | $ | 1,944 | 8,204 | 199,749 | — | $ | 209,897 | |||||||||||||
F-47
Table of Contents
Platinum Underwriters Holdings, Ltd. and Subsidiaries
Index to Schedules to Consolidated Financial Statements
| Page | ||||||||
| Report of Independent Registered Public Accounting Firm | S-2 | |||||||
| Schedule I | S-3 | |||||||
| Schedule II | S-4 | |||||||
| Schedule III | S-7 | |||||||
| Schedule IV | S-8 | |||||||
Schedules other than those listed above are omitted for the reason that they are not applicable or the information is provided elsewhere in the consolidated financial statements.
S-1
Table of Contents
REPORT OF INDEPENDENT REGISTERED PUBLIC ACCOUNTING FIRM
The Board of Directors and Shareholders
Platinum Underwriters Holdings, Ltd.:
Platinum Underwriters Holdings, Ltd.:
Under date of February 27, 2007, we reported on the consolidated balance sheets of Platinum Underwriters Holdings, Ltd. and subsidiaries as of December 31, 2006 and 2005, and the related consolidated statements of operations and comprehensive income (loss), shareholders’ equity and cash flows for each of the years in the three-year period ended December 31, 2006, which are included in the December 31, 2006 annual report on Form 10-K. Our report refers to a change in the method of accounting for share-based payments in 2006. In connection with our audits of the aforementioned consolidated financial statements, we also audited the related consolidated financial statement schedules appearing on pages S-3 through S-8 of the Form 10-K. These financial statement schedules are the responsibility of the Company’s management. Our responsibility is to express an opinion on these financial statement schedules based on our audits.
In our opinion, such financial statement schedules, when considered in relation to the basic consolidated financial statements taken as a whole, present fairly, in all material respects, the information set forth therein.
/s/ KPMG LLP
New York, New York
February 27, 2007
February 27, 2007
S-2
Table of Contents
SCHEDULE I
Platinum Underwriters Holdings, Ltd. and Subsidiaries
Summary of Investments — Other Than Investments in Related Parties
As of December 31, 2006
($ in thousands)
Summary of Investments — Other Than Investments in Related Parties
As of December 31, 2006
($ in thousands)
| Amount at | ||||||||||||
| which | ||||||||||||
| shown in | ||||||||||||
| Balance | ||||||||||||
| Cost* | Fair Value | Sheet | ||||||||||
| Fixed maturity securities: | ||||||||||||
| Bonds: | ||||||||||||
| United States Government and government agencies and authorities | $ | 231,900 | 227,599 | $ | 227,599 | |||||||
| State, municipalities and political subdivisions | 162,600 | 160,165 | 160,165 | |||||||||
| Foreign governments | 130,245 | 127,075 | 127,075 | |||||||||
| Foreign corporate | 201,764 | 197,799 | 197,799 | |||||||||
| Public utilities | 128,696 | 126,175 | 126,175 | |||||||||
| All other corporate | 2,493,052 | 2,456,566 | 2,456,566 | |||||||||
| Total bonds | 3,348,257 | 3,295,379 | 3,295,379 | |||||||||
| Redeemable preferred stock | 39,558 | 39,266 | 39,266 | |||||||||
| Total fixed maturity securities | 3,387,815 | 3,334,645 | 3,334,645 | |||||||||
| Preferred stock | 11,246 | 10,772 | 10,772 | |||||||||
| Other long term investments | 5,000 | 4,745 | 4,745 | |||||||||
| Short-term investments | 27,123 | 27,123 | 27,123 | |||||||||
| Total investments | $ | 3,431,184 | 3,377,285 | $ | 3,377,285 | |||||||
| * | Original cost of fixed maturity securities reduced by repayments and adjusted for amortization of premiums and discounts. |
S-3
Table of Contents
SCHEDULE II
Platinum Underwriters Holdings, Ltd.
(Parent Company)
Condensed Balance Sheets
December 31, 2006 and 2005
($ in thousands, except share data)
(Parent Company)
Condensed Balance Sheets
December 31, 2006 and 2005
($ in thousands, except share data)
| 2006 | 2005 | |||||||
ASSETS | ||||||||
| Investment in affiliates | $ | 1,749,762 | $ | 1,410,794 | ||||
| Cash | 106,039 | 129,962 | ||||||
| Other assets | 9,296 | 2,963 | ||||||
| Total assets | $ | 1,865,097 | $ | 1,543,719 | ||||
LIABILITIES AND SHAREHOLDERS’ EQUITY | ||||||||
| Liabilities | ||||||||
| Accrued expenses and other liabilities | $ | 7,036 | $ | 3,470 | ||||
| Total liabilities | 7,036 | 3,470 | ||||||
| Shareholders’ equity | ||||||||
| Preferred shares, $.01 par value, 25,000,000 shares authorized, 5,750,000 shares issued and outstanding | 57 | 57 | ||||||
| Common shares, $.01 par value, 200,000,000 shares authorized, 59,671,959 and 59,126,675 shares issued and outstanding, respectively | 597 | 590 | ||||||
| Additional paid-in capital | 1,545,979 | 1,527,316 | ||||||
| Unearned share grant compensation | — | (2,467 | ) | |||||
| Accumulated other comprehensive income (loss) | (44,289 | ) | (40,718 | ) | ||||
| Retained earnings | 355,717 | 55,471 | ||||||
| Total shareholders’ equity | 1,858,061 | 1,540,249 | ||||||
| Total liabilities and shareholders’ equity | $ | 1,865,097 | $ | 1,543,719 | ||||
S-4
Table of Contents
SCHEDULE II, continued
Platinum Underwriters Holdings, Ltd.
(Parent Company)
Condensed Statements of Operations
For the years ended December 31, 2006, 2005 and 2004
($ in thousands)
(Parent Company)
Condensed Statements of Operations
For the years ended December 31, 2006, 2005 and 2004
($ in thousands)
| 2006 | 2005 | 2004 | ||||||||||
| Revenues: | ||||||||||||
| Net investment income | $ | 5,912 | 1,724 | $ | 53 | |||||||
| Other income | 3,577 | 7,036 | 2,944 | |||||||||
| 9,489 | 8,760 | 2,997 | ||||||||||
| Expenses: | ||||||||||||
| Interest expenses | — | 71 | 207 | |||||||||
| Operating expenses | 23,803 | 13,395 | 12,722 | |||||||||
| Total expenses | 23,803 | 13,466 | 12,929 | |||||||||
| Net loss before equity in earnings of affiliate | (14,314 | ) | (4,706 | ) | (9,932 | ) | ||||||
| Equity in earnings (loss) of affiliates | 343,971 | (132,781 | ) | 94,715 | ||||||||
| Net income (loss) before preferred dividends | 329,657 | (137,487 | ) | 84,783 | ||||||||
| Preferred dividends | 10,382 | 737 | — | |||||||||
| Net income (loss) attributable to common shareholders | $ | 319,275 | (138,224 | ) | $ | 84,783 | ||||||
S-5
Table of Contents
SCHEDULE II, continued
Platinum Underwriters Holdings, Ltd.
(Parent Company)
Condensed Statements of Cash Flows
For the years ended December 31, 2006, 2005 and 2004
($ in thousands)
(Parent Company)
Condensed Statements of Cash Flows
For the years ended December 31, 2006, 2005 and 2004
($ in thousands)
| 2006 | 2005 | 2004 | ||||||||||
| Operating Activities: | ||||||||||||
| Net loss before equity in earnings of affiliates | $ | (14,314 | ) | (4,706 | ) | $ | (9,932 | ) | ||||
| Adjustments to reconcile net income to net cash provided in operations: | ||||||||||||
| Share based compensation | 3,552 | 2,313 | 1,777 | |||||||||
| Depreciation and amortization | 129 | 129 | 125 | |||||||||
| Other, net | 983 | (2,735 | ) | (369 | ) | |||||||
| Net cash used in operating activities | (9,650 | ) | (4,999 | ) | (8,399 | ) | ||||||
| Investing Activities: | ||||||||||||
| Dividends and distributions from subsidiaries | 1,600 | 17,000 | 22,000 | |||||||||
| Contributions to subsidiaries | — | (477,500 | ) | (250 | ) | |||||||
| Net cash provided by (used in) investing activities | 1,600 | (460,500 | ) | 21,750 | ||||||||
| Financing Activities: | ||||||||||||
| Dividends paid to preferred shareholders | (9,818 | ) | — | — | ||||||||
| Dividends paid to common shareholders | (19,029 | ) | (14,775 | ) | (13,807 | ) | ||||||
| Proceeds from exercise of share options | 12,974 | 15,026 | 7,406 | |||||||||
| Net proceeds from issuance of common shares | — | 425,757 | 1,566 | |||||||||
| Net proceeds from issuance of preferred shares | — | 167,509 | — | |||||||||
| Purchase of common shares | — | — | (9,985 | ) | ||||||||
| Net cash (used in) provided by financing activities | (15,873 | ) | 593,517 | (14,820 | ) | |||||||
| Net increase (decrease) in cash and cash equivalents | (23,923 | ) | 128,018 | (1,469 | ) | |||||||
| Cash and cash equivalents at beginning of year | 129,962 | 1,944 | 3,413 | |||||||||
| Cash and cash equivalents at end of year | $ | 106,039 | 129,962 | $ | 1,944 | |||||||
S-6
Table of Contents
SCHEDULE III
Platinum Underwriters Holdings, Ltd.
Supplementary Insurance Information
($ in thousands)
Supplementary Insurance Information
($ in thousands)
| Net unpaid | Other | Net losses | Amortization | |||||||||||||||||||||||||||||||||||||
| Deferred | losses | policy | and loss | of deferred | ||||||||||||||||||||||||||||||||||||
| policy | and loss | Net | claims and | Net | Net | adjustment | policy | Other | Net | |||||||||||||||||||||||||||||||
| acquisition | adjustment | unearned | benefits | earned | investment | expenses | acquisition | operating | written | |||||||||||||||||||||||||||||||
| Period | costs | expenses | premiums | payable | premium | income | incurred | costs | expenses | premiums | ||||||||||||||||||||||||||||||
| Year ended December 31, 2006: | ||||||||||||||||||||||||||||||||||||||||
| Property and Marine | $ | 9,969 | 537,794 | 46,022 | 448,959 | 145,900 | 47,183 | $ | 424,929 | |||||||||||||||||||||||||||||||
| Casualty | 72,641 | 1,467,879 | 289,966 | 764,341 | 522,815 | 114,880 | 757,675 | |||||||||||||||||||||||||||||||||
| Finite Risk | — | 320,554 | 4,124 | 123,401 | 91,887 | 58,695 | (5,991 | ) | ||||||||||||||||||||||||||||||||
| Total | 82,610 | 2,326,227 | 340,112 | — | 1,336,701 | 187,987 | 760,602 | 220,758 | 24,194 | 1,176,613 | ||||||||||||||||||||||||||||||
| Year ended December 31, 2005: | ||||||||||||||||||||||||||||||||||||||||
| Property and Marine | 14,357 | 816,328 | 66,741 | 569,173 | 756,742 | 70,005 | 575,055 | |||||||||||||||||||||||||||||||||
| Casualty | 73,622 | 1,107,316 | 292,513 | 789,629 | 511,609 | 140,758 | 809,031 | |||||||||||||||||||||||||||||||||
| Finite Risk | 42,821 | 345,011 | 134,865 | 355,921 | 237,074 | 88,797 | 333,636 | |||||||||||||||||||||||||||||||||
| Total | 130,800 | 2,268,655 | 494,119 | — | 1,714,723 | 129,455 | 1,505,425 | 299,560 | 14,158 | 1,717,722 | ||||||||||||||||||||||||||||||
| Year ended December 31, 2004: | ||||||||||||||||||||||||||||||||||||||||
| Property and Marine | 15,747 | 410,347 | 64,985 | 485,135 | 349,557 | 58,792 | 504,439 | |||||||||||||||||||||||||||||||||
| Casualty | 72,454 | 715,314 | 278,634 | 611,893 | 418,355 | 118,734 | 677,399 | |||||||||||||||||||||||||||||||||
| Finite Risk | 47,837 | 253,566 | 155,917 | 350,907 | 251,892 | 46,781 | 464,175 | |||||||||||||||||||||||||||||||||
| Total | $ | 136,038 | 1,379,227 | 499,536 | — | 1,447,935 | 84,532 | 1,019,804 | 224,307 | 13,196 | $ | 1,646,013 | ||||||||||||||||||||||||||||
S-7
Table of Contents
SCHEDULE IV
Platinum Underwriters Holdings, Ltd.
Reinsurance
($ in thousands)
Reinsurance
($ in thousands)
| Assumed from | Percentage of | |||||||||||||||||||
| Direct | Ceded to other | other | amount | |||||||||||||||||
| Description | Amount | companies | companies | Net Amount | assumed to net | |||||||||||||||
| Property and liability premiums written: | ||||||||||||||||||||
| Year ended December 31, 2006: | ||||||||||||||||||||
| Property and Marine | — | $ | 89,387 | 514,316 | $ | 424,929 | 121.0 | % | ||||||||||||
| Casualty | — | 74 | 757,749 | 757,675 | 100.0 | % | ||||||||||||||
| Finite Risk | — | 9,126 | 3,135 | (5,991 | ) | (52.3 | %) | |||||||||||||
| Total | — | 98,587 | 1,275,200 | 1,176,613 | 108.4 | % | ||||||||||||||
| Year ended December 31, 2005: | ||||||||||||||||||||
| Property and Marine | — | 21,521 | 596,576 | 575,055 | 103.7 | % | ||||||||||||||
| Casualty | — | 133 | 809,164 | 809,031 | 100.0 | % | ||||||||||||||
| Finite Risk | — | 25,779 | 359,415 | 333,636 | 107.7 | % | ||||||||||||||
| Total | — | 47,433 | 1,765,155 | 1,717,722 | 102.8 | % | ||||||||||||||
| Year ended December 31, 2004: | ||||||||||||||||||||
| Property and Marine | — | 13,029 | 517,468 | 504,439 | 102.6 | % | ||||||||||||||
| Casualty | — | 748 | 678,147 | 677,399 | 100.1 | % | ||||||||||||||
| Finite Risk | — | — | 464,175 | 464,175 | 100.0 | % | ||||||||||||||
| Total | — | $ | 13,777 | 1,659,790 | $ | 1,646,013 | 100.8 | % | ||||||||||||
S-8