
Opening Remarks
Albert R. Gamper, Jr.
Chairman and Chief Executive Officer
Exhibit 99.1
1
1

Solid Management Team
Seven Key Take Aways
Diversification
Slice of North American Economy
Outstanding Corporate Governance
Commitment to Financial Strength
Enduring Business Model
Achievable Earnings and ROE Targets
2
2
2
2
2

Credit Overview
Lawrence A. Marsiello
Vice Chairman and Chief Credit Officer
3
3
Balance of Financial and Collateral Analysis
4
4
Customized Risk Management Processes by Asset Class
Flow Businesses
Highly Credit Intensive
Automated Processes with Rapid Response
Behavioral Science Applications
Transaction Businesses
Traditional Cash-Flow Analysis
Collateral/Equipment Expertise
Relationship Based Lending

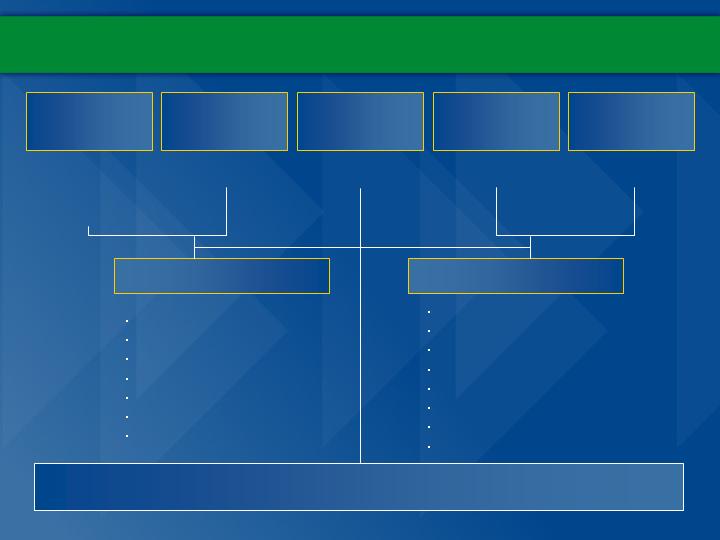
Credit Risk Management Organization
Corporate Credit Risk Management
Lawrence A. Marsiello
Vice Chairman
Chief Credit Officer
31 Years Experience
Anthony
Lombardi
Commercial
Services Clients
34 Years Experience
David
Bram
Commercial
Services Customers
36 Years Experience
John
O’Kane
Business
Credit
26 Years Experience
Bruce
Ells
Capital
Finance
18 Years Experience
Bill
Schumm
Specialty
Finance Consumer
29 Years Experience
Bill
Stoddard
Equipment
Finance
35 Years Experience
Thomas
Abbate
Administration &
Credit Audit
34 Years Experience
Timothy
Bennett
Capital & Commercial
Finance
23 Years Experience
Kenneth
Brown
Equipment &
Specialty Finance
23 Years Experience
Operating Group – Risk Management
Ken
Wendler
Specialty
Finance Commercial
16 Years Experience
Credit quality is a core competency woven into CIT’s heritage and culture
5
5

Collaborative effort between corporate and operating group credit teams
Credit Risk Management
Establish credit authorities by business
and industry
Align risk limits with risk-return tolerances
across various asset classes
Monitor CIT-wide industry, geographic,
collateral and single obligor concentrations
Assess the credit quality of targeted
acquisitions
Ensure adherence to credit risk management
policies, practices and processes
Corporate Functions
Operating Group Functions
Underwrite quality transactions within
established policies and procedures
Manage portfolio returns via risk-based
pricing strategies
Conduct routine monitoring and maintenance
of the portfolios
Maintain a high quality collection effort and
collateral monitoring program
Engage in problem loan workouts - Formulate
exit strategies and recommend reserves
6
6

Credit Risk Management Framework
Pre-approved underwriting criteria frame credit risk tolerances
Target Market Definitions (TMD) – Delineate markets and industries in
which an operating company is permitted to do business
Risk Acceptance Criteria (RAC) – Details acceptable transaction
structures, credit profiles and required returns by industry and product
RAC and TMD are approved by the Executive Credit Committee
and are updated annually
80% of transactions submitted for credit approval should conform
to pre-defined TMD and RAC
Operating Group compliance to standards is monitored by
the Corporate Credit Audit unit
7
7

Credit Risk Management Systems
Credit Scoring Systems
Automated commercial and proprietary
models rating a prospective client’s credit
worthiness
Typically used in flow businesses
with individual obligor exposures of
< $350K
Frequently updated to reflect shifts
in performance based on empirical
data
Risk Grading Systems
Numeric rating systems assessing the
probability of default and potential loss
based on:
Obligor risk
Facility risk
Global Exposure System
Centralized customer identification repository linking exposures across multiple business lines
Robust data supports real-time pricing and credit decisions
8
8

Continuous Portfolio Monitoring
Quarterly Asset Quality Review
Rigorous review of portfolio by Credit Risk
Management, Controllers and Operating
Groups
Discuss trends in predictive credit metrics
such as delinquencies and non-performers
Analyze and track default rates and review
loss projections
Monthly Surveillance Meetings
Report problem loans and review risk grades
Review collateral coverage and repayment
ability to estimate potential loss
Enhance predictability with respect to risk-return characteristics
Ad Hoc Portfolio Meetings
Driven by AQR findings or market
developments
Focus on select asset classes and obligor
groups
9
9

Finance Receivables vs Operating Leases
Cease accruing rent at 90 days
past due or sooner
Asset write-down through
depreciation (reduction in lease
margin)
Lost rental income for lease term
(reduction in lease margin)
Depreciate asset irrespective of
payment status
Rental payment
Operating Leases
Collateral realization (to the
extent the credit fails)
Equipment/Collateral
Exposure
Receivable balance net of
collateral value (charge-off)
Maximum
Credit Exposure
Amortize loan balance upon
receipt of payment
Asset Balance
Cease accruing interest at 90
days delinquent or sooner
Revenue Recognition
Full receivable balance
Delinquency
Finance Receivables
10
10

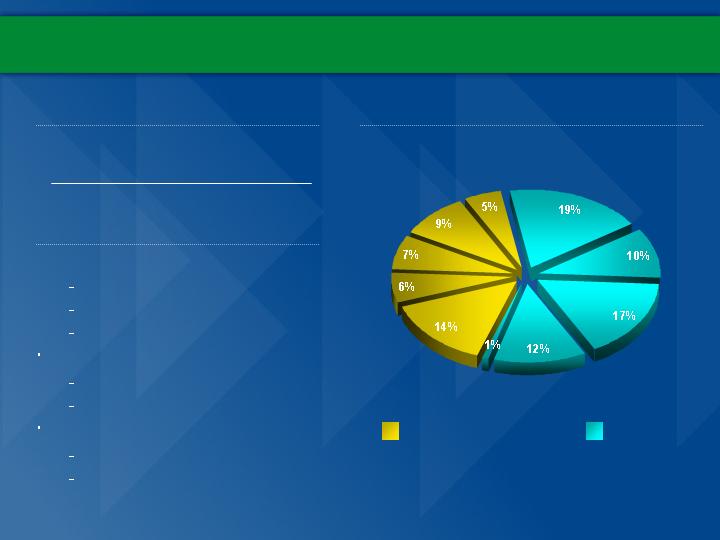
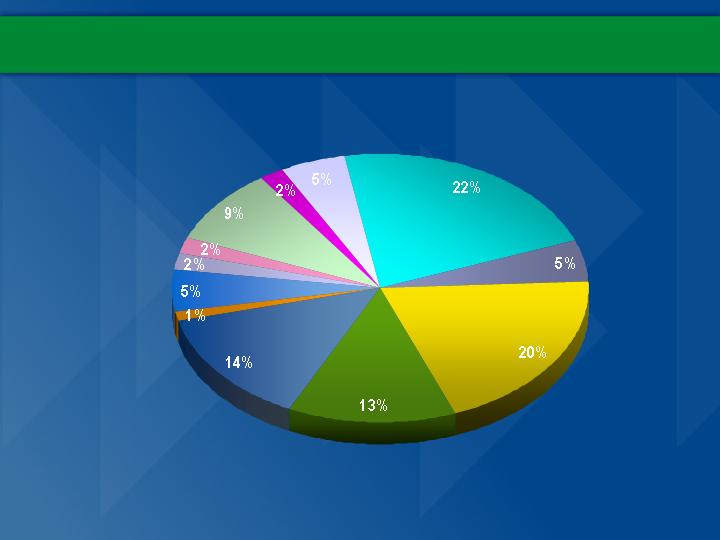
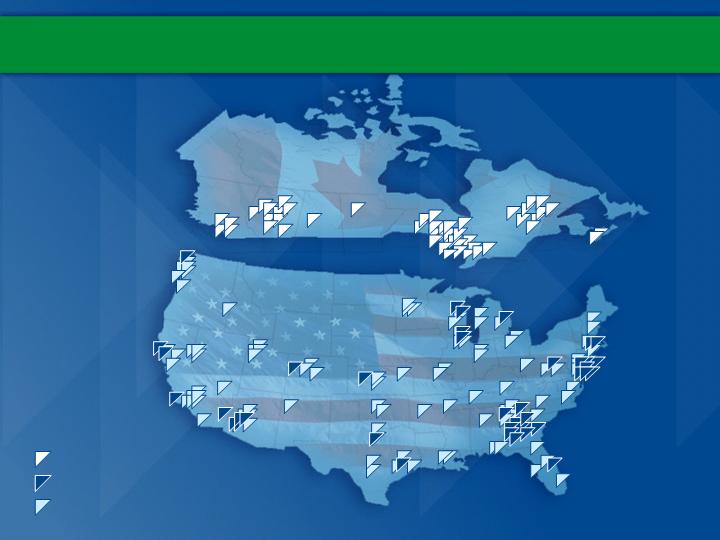
Portfolio Diversification
Geography
Asset / Collateral Type
Industries Served
Northeast
International
Canada
Southwest
Southeast
Midwest
West
A/R and
Inventory
Revolvers
Technology
Manufacturing
Construction
Transportation
- Land
Other*
Real Estate-Res
Manufacturing
Commercial Air
Consumer
Mortgage
Transportation
Services
Consumer Other
Construction
Wholesale
Communication
Auto
Other*
Retail
Transportation
- ComAir
Transporation
-CorpAir
Real Estate-Ind
*no collateral/industry greater than 3%
11
11

Top 10 Single Obligor Exposures
12
12
Total balance of $2.3 billion or 5.5% of finance and leasing assets at 3/31/04
Customer Industry
Amount (millions)
Loan/Lease
CIT Division
Retail
$359
Loan
Commercial Services
Aerospace
$267
Lease
Capital Finance
Rail
$240
Lease
Capital Finance
Aerospace
$238
Lease
Capital Finance
Power
$204
Loan
Structured Finance
Aerospace
$197
Lease
Capital Finance
Aerospace
$191
Lease
Capital Finance
Retail
$186
Loan
Commercial Services
Retail
$185
Loan
Commercial Services
Construction
$185
Loan
Equipment Finance

Top 10 Non-Accruals
13
13
Total balance $147 million or 0.4% of finance and leasing assets at 3/31/04
Customer Industry
Amount (millions)
CIT Division
Manufacturing
$23.8
Structured Finance
Telecom
$17.9
Structured Finance
Construction
$17.7
Equipment Finance
Construction
$15.0
Business Credit
Telecom
$13.6
Structured Finance
Manufacturing
$13.4
Business Credit
Telecom
$13.3
Structured Finance/Business Credit
Telecom
$13.0
Structured Finance
Telecom
$ 9.8
Structured Finance
Construction
$ 9.7
Equipment Finance

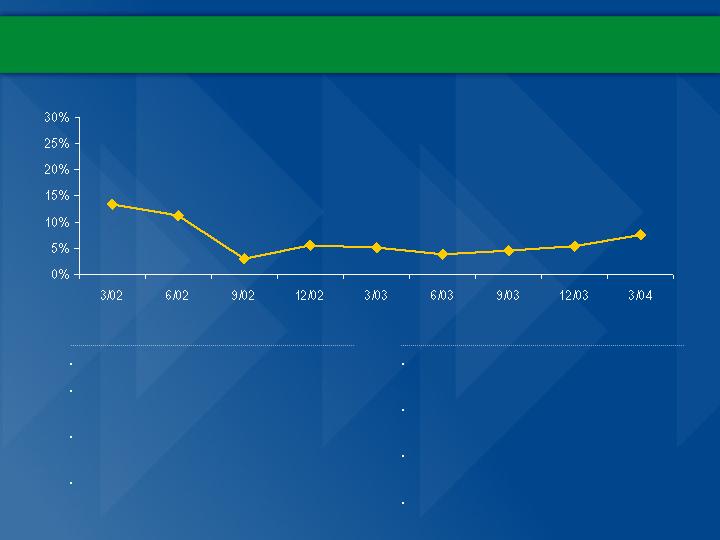
Historic Credit Losses
14
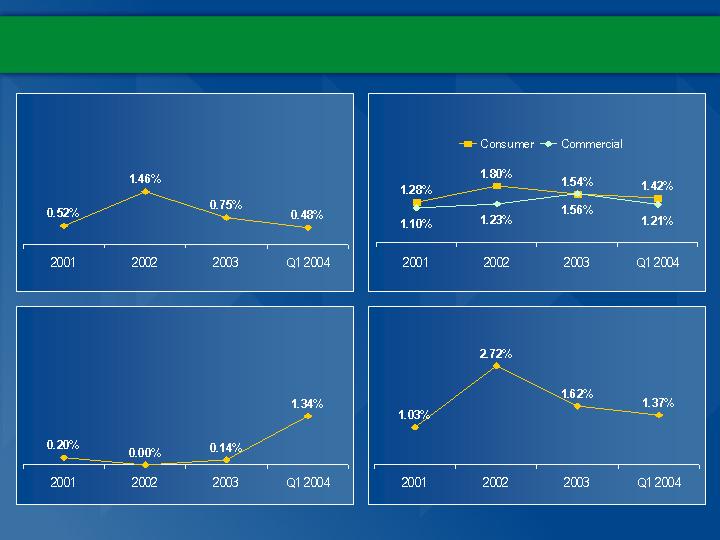
Credit Losses by Segment*
Structured Finance
Commercial Finance
Specialty Finance
Equipment Finance
*Excludes Telecom, Liquidating, Argentine and other non-recurring losses.
15

Equipment Finance – A Case Study
Allocated additional resources
to impacted portfolios
Office closures
Tightened underwriting standards
Lowered LTVs
Created a specialized work-out
group to address problem loans
Deflation in equipment values
Exited challenged markets
Economic slow down
Action Taken
Situation
16
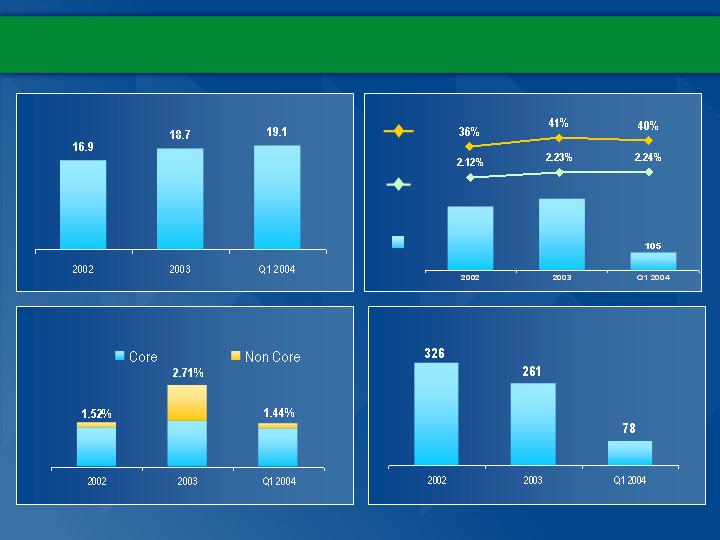
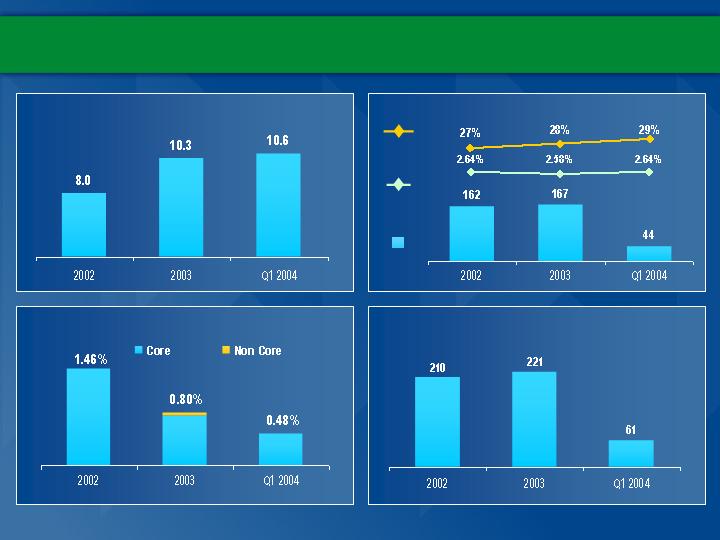
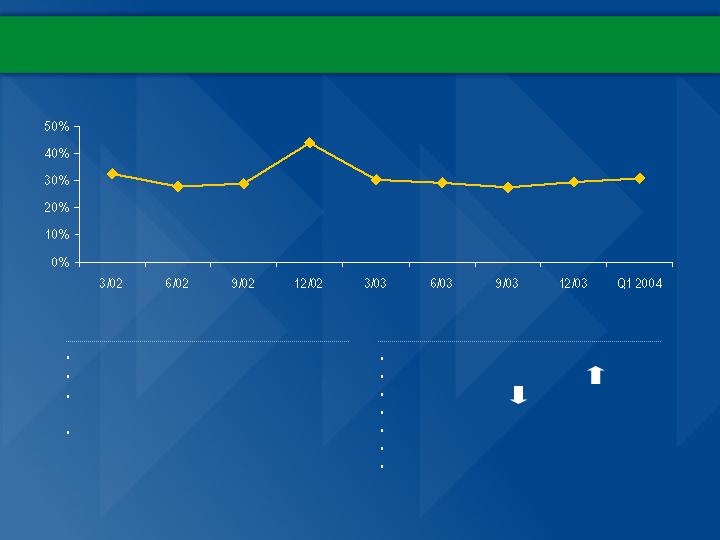
Credit Metrics
Owned Delinquency 60+ days
Liquidating
Repo
Non-Accrual
3.24%
2.47%
2.05%
3.93%
2.16%
Non-Performing Assets
2.07%
Sharp improvement in forward markers
2.71%
2.98%
3.90%
3.63%
2.16%
1.89%
17
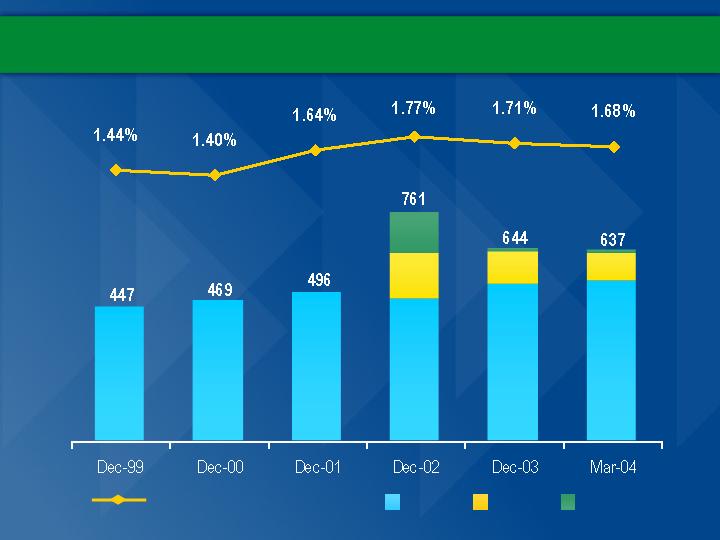
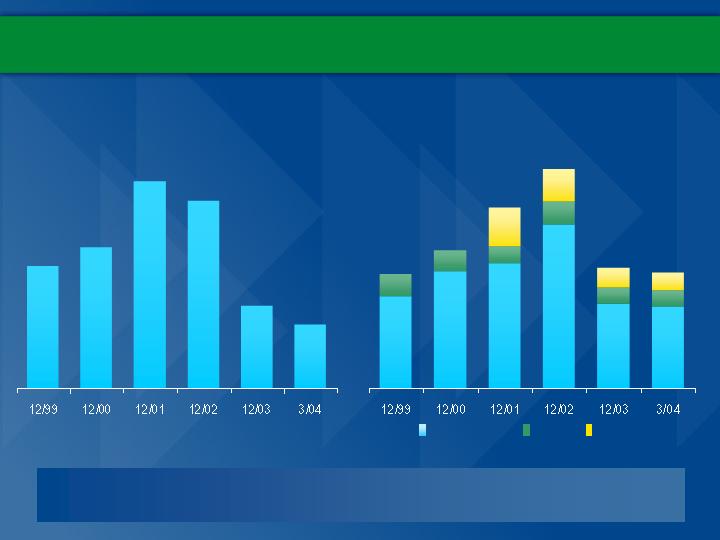
Reserves
General Reserves to Finance Receivables
Telecom
General
Argentine
18

Topical Areas
Liquidating Portfolios
Aerospace
Argentina
Telecommunications
Currency issue; not credit
Sold remainder Q2-2004 at slight gain
Ongoing claim against Argentine Government
$874 million Down from $2.0 billion March 2001
2/3rds Manufactured Housing
1/3rd RV, Marine, Franchise, Trucking
$519 million total exposure to sector
$191 million with CLECs
$93 million remaining reserve 1.4 times NPAs
19
$4.7 billion portfolio
Receiving management focus
Asset management business
(collateral vs credit)
New fundings limited to order book

Risk Management: A Dynamic Disciplined Process
Upgrade risk taking skills
Drive risk-based pricing
Thin portfolio concentrations
Enhance systems and processes
Improve predictability of credit performance
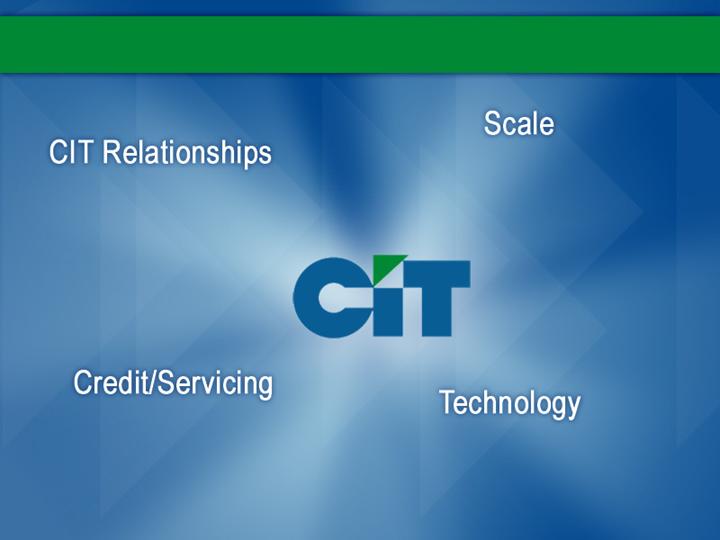
The “C” in CIT still stands for Credit
20

Specialty Finance
Thomas B. Hallman
Vice Chairman
21

Market Focus
Flow Business
Consumer Finance
Government Guaranteed/Small
Business Lending
International
Major Vendor
Small & Mid-Ticket Leasing
Overview
Leadership Team
Tom Hallman, Vice Chairman
30 years experience
Senior Leadership Team (8 members)
Average experience: 22 years
Key Profitability Drivers
Operating efficiency through scale
Use of differentiated technology
Residual gains through end-of-lease management
Predictable credit results
22
Key Statistics
Headquarters:
Livingston, NJ
Employees:
3,000 in 23 countries
Market Presence:
Market leader in
chosen franchises
Specialty Finance: Financial Summary
Note: 2002 data excludes impact of SBL/TRS portfolios transferred to Specialty in 2003.
Operating Efficiency ($ millions)
Managed Assets ($ billions)
Net Income ($ millions)
Charge-offs (% AFR)
% of
AMA
Operating
Expenses
Efficiency
Ratio
370
415
23
ROE Trend
Q1 and Q2 2002 results include $2.1
billion in Home Equity securitizations
Q1 and Q2 2002 exclude $135 million
reserves related to Argentina de-
dollarization
Cost of Funds fully allocated to
Business Units starting Q1 2003
Returns strong and improving
Volume and assets growing
Relationship base expanding
Factors Impacting Performance
Current Environment
Return on Equity
24

Systems - PC/Servers/Printers
$235-245 billion in PC spending expected in 2004
PC shipments up 16% year-over-year to 41.2
million units
Strong growth expected to continue
Networking Equipment
$52.1 billion market
Networking growth up 5.4% year-over-year
A leader in providing financing to the US direct and
reseller markets
Strong growth expected to continue
Storage
$24.4 billion market
Storage growth 1.6% year-over-year
Increased market penetration by CIT expected
Targeted Technology Markets
Sources: IDC, InfoTech and CIT
PBX/IP-PBX/Key Systems
$20-30 billion market
Telephony growth flat at 2.3% but IP-PBX growth
forecasted at 34%
Avaya #1 or #2 in Worldwide Enterprise and IP
Telephony, Applications and Services
After declines since 1999, increased
capital spending is driving growth 2004+
25

Specialty Finance Overview
Global provider of lending and leasing solutions to consumers and
commercial customers of manufacturers, distributors, dealers and
brokers
Diverse customer base
Broad product offering
Differentiated technology
Diverse equipment classes
Customer behavior-based models
Global reach
26
Extensive market knowledge
Thousands of relationships with
manufacturers, distributors, brokers
and dealers
BrokerEdge PLUS CIT DigitalEdge
Robust e-Commerce platforms
State-of-the-art call center systems
Comprehensive risk management
systems and analytics
Conducts business in 23 countries
Over 3 million customers worldwide
Over $19 billion in managed assets
Specialty Finance – Core Strengths
27
27

Specialty Finance – Business Segments
Consumer/
Home Equity
Small
Business
Lending
International
Major Vendor
Small &
Mid-Ticket
Leasing
Large,
National
Home Equity
Lender
CIT Bank
#1 SBA
Lender in US
Leader in
Technology
Leasing
#1 in Point-of-
Sale Equipment
Leasing
Agilent
Avaya
Dell
Snap-On
Spanning 23
Countries
$5.1B in
Managed Assets
$1.6B in Serviced
Assets (Sales
Financing)
$1.1B in
Managed Assets
$1.5B in
Serviced Assets
$1.8B in
Managed Assets
$7.4B in
Managed Assets
$2.2B in
Managed Assets
28

Specialty Finance – Financial Target
Exceeds
Exceeds
Small & Mid-Ticket Leasing
Exceeds
Exceeds
Specialty Finance
Exceeds
Exceeds
Major Vendor
Below
Exceeds
International
Exceeds
Exceeds
Small Business Lending
Below
Exceeds
Consumer
Return on
Equity of 15%
Managed Asset
Growth of 8-10%
Corporate Target
29

Market Strategies / Growth Opportunities
Grow assets 10% or more year-over-year
Supplement organic growth with ‘Bolt-on’ acquisitions, such as GTS
Expand relationship base through targeted business
development efforts
Exploit international growth opportunities, particularly in Europe
Leverage consumer capability to support vendors with
consumer/commercial financing requirements
Increase utilization of CIT Bank as a strategic resource
Target high growth areas in key industries such as Technology
30

Consumer Finance
National home equity and consumer finance lender
$3.4 billion in 2003 originations
31 home equity area offices in major markets of US
4000+ mortgage brokers driving originations
CIT Bank originates consumer loans and lines of credit for consumers of
manufacturers and distributors
Virtually all originations are web-based through BrokerEdge.com for
home equity loans
31
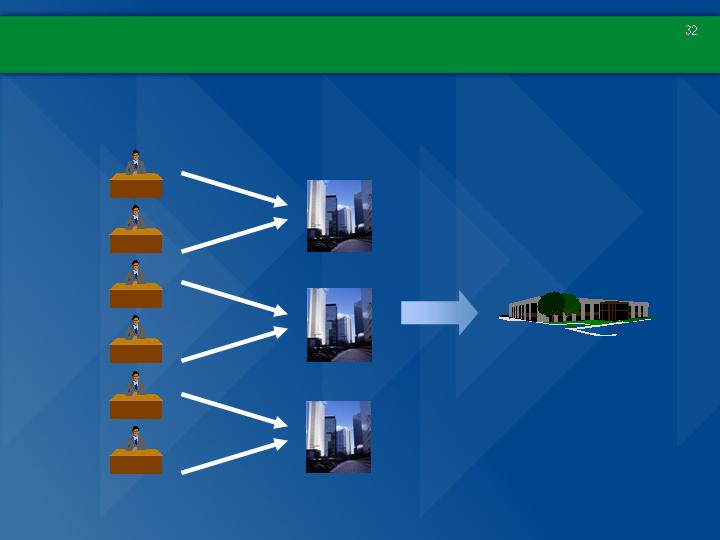
Mortgage Brokers
CIT Market Presence
CIT Servicing
Brokers originate loan
applications/packages
Application through closing via the
internet
Low cost servicing provider
31 CIT locations in major markets
National servicing center in Oklahoma City
4,000+ Brokers
Home Equity – How It Works
32

Home Equity – Competitive Differentiators
31 Office national platform located in major MSA’s enables CIT to
provide “best-in-class” levels of customer service
CIT’s “BrokerEdge” web-based technology provides mortgage brokers
access to CIT products, pricing and programs in real-time to more
effectively manage response times to their borrowers
Broad product set offers our clients multiple financial solutions
Credit expertise and servicing capabilities drive favorable industry
comparisons
These differentiators have proven to be effective throughout
various interest rate cycles and market conditions
33

Home Equity – Portfolio Demographics
34
34
Average Amount Financed
$94,500
FICO
630
Debt Ratio
38%
First Liens
91%
Annual Income
$86,074
Length of Employment
9 Years
Length of Residence
8 Years
LTV
74%

Small Business Lending
The nation's #1 SBA lender for the last four years
$812 million in annual originations
Floating rate loans to small/medium businesses for equipment,
real estate, acquisitions and working capital
Designated a “preferred lender” by the SBA
Differentiators
National origination capability
Scale and efficiency
On-line technology – originations / processing
SBL’s website and online SBA loan application are
located at www.smallbizlending.com
Focused on targeted segments

SBA Lending – Market Position*
*Compiled by Coleman Publishing from Data Provided by the SBA
CIT’s market share has increased 50% since 2000
36
2003 SBA 7(a)
Rank
Competition
Guaranteed Loans
Market Share
1
CIT
$ 753
million
6.7%
2
Wells Fargo
476
4.2
3
Business Loan Express
434
3.8
4
US Bancorp
432
3.8
5
Comerica Bank
370
3.2
6
Others
$8,835
78.3
TOTAL
$11,300
million
100.0%

International
Global presence
$1.2 billion in 2003 originations
Leasing and lending capabilities span 23 countries
Vendor relationships around the world
Target new global and regional vendors
Partner with vendors in wide range of industries
Customize partnerships based on local market requirements
Differentiators
Intellectual capital
Online originations technology
Servicing capabilities
Credit scoring and risk management systems and analytics
Risk-based pricing
Geographical presence
37

($ in millions)
79 Employees
$294 Assets
$201 Volume
142 Employees
$329 Assets
$175 Volume
377 Employees
$859 Assets
$621 Volume
82 Employees
$282 Assets
$252 Volume
100 Employees
$312 Assets
$144 Volume
Singapore
Malaysia
China
Hong Kong
Korea
Taiwan
Australia
New Zealand
Mexico
Colombia
Brazil
Chile
Canada
Scandinavia
UK
Ireland
Benelux
France
Spain
Italy
Germany
Switzerland
International Presence
38
38

39
39
President, Major Vendor Finance
Jeffrey D. Simon

Major Vendor
40
F
F
i
i
n
n
a
a
n
n
c
c
i
i
a
a
l
l
S
S
e
e
r
r
v
v
i
i
c
c
e
e
s
s
Providing a compelling alternative to traditional 3rd
party vendor finance programs or wholly owned
captives
$5.8 billion in 2003 originations
Customized partnerships with vendors
characterized by common interests
Sales
Earnings
Customer control
Channel management
Integration with front end sales, order
management and fulfillment processes and
systems
Centralized global service delivery network
provides
Local originations and credit decisions
Centralized shared services
Efficient processes and systems
“Cutting edge” information technology systems

Major Vendor – Agilent Financial Services
41
Type of Agreement:
Highly structured vendor program
Name of Entity:
Agilent Financial Services
Purpose of Entity:
Provide leases/loans to Agilent customers worldwide
Ownership:
100% CIT
Inception:
2000
Maturity:
2005
Last Extension:
n/a
Governance:
1) Equal representation on Advisory Board
2) CIT manages all day-to-day activity
Markets:
Electronics, Semiconductor and Telecommunication Industries
Growth Opportunity:
Grow with Agilent, increase penetration of current
business and grow as Agilent’s markets recover from
recent downturn

Major Vendor – Avaya Financial Services
42
Type of Agreement:
Virtual Joint Venture
Name of Entity:
Avaya Financial Services
Purpose of Entity:
Provide financial services to Avaya customers
Ownership:
100% CIT
Inception:
1984
Maturity:
2006
Last Extension:
2003
Governance:
1) Equal representation on “Board of Directors”
2) CIT manages all day-to-day activities
3) Serviced through CIT Communications Finance
Markets:
Small Business through Fortune 100
Growth Opportunity:
Increase penetration and grow as telecommunications
market recovers

Major Vendor – Dell Financial Services
43
Type of Agreement:
True joint venture
Name of Entity:
Dell Financial Services (DFS)
Purpose of Entity:
Provide financial services (other than
credit cards) to Dell customers in the US
Ownership:
70% / 30% - Dell/CIT
Inception:
April 1997
Maturity:
2005
Last Extension:
2000
Governance:
Equal representation by Dell and CIT plus one
independent third party
Markets:
Consumers through Fortune 500
Growth Opportunity:
Continue to grow with Dell and increase penetration

Major Vendor – Snap-On Credit
44
Type of Agreement:
True joint venture
Name of Entity:
Snap-On Credit, LLC
Purpose of Entity:
Provide financial services to Snap-On Tools customers
Ownership:
50% Snap-On Tools / 50% CIT
Inception:
1999
Maturity:
2006
Last Extension:
2000
Governance:
1) Equal representation on Board of Directors
2) Snap-On Credit manages all day-to-day activities
3) Services through Snap-On Credit
Markets:
Automotive technical professionals
Growth Opportunity:
Continue to penetrate US market and expand geographically

Major Vendor – Growth Strategies
Increase penetration within current vendor relationships
Expand product and markets within current relationships
Identify and sign-up new partners
Utilize international capability as a catalyst for new, large domestic
business relationships
45

46
46
President, Small & Mid-Ticket Leasing
Ron G. Arrington

Small & Mid-Ticket Leasing
Market Leader in Leasing point-of-sale (POS),
office products, IT and telecom equipment in the
US and Canada
$1.2 billion in annual originations
Originating business through thousands of sales
persons of Independent Sales Organizations
(ISOs), manufacturers and dealers
Customers include Fortune 1000 and
middle-market businesses
Differentiators
Superior online service delivery
Customer behavioral databases
Scale

Small & Mid-Ticket Leasing – Market Approach
Indirect Market
Value added financing solutions to
customers of
Manufacturers
Distributors
Resellers
Leverage clients’ sales infrastructure
Direct Market
Provide financing to Fortune 1000
and middle market customers
Work closely with business partners
Manufacturers
Integrators/Outsourcing
Distributors
48

Small & Mid-Ticket Leasing: Markets
Office and Technology – Provides value added financing and services to
manufacturers, distributors and resellers for the sale of office and technology
equipment in the US and Canada. Equipment types include copiers, PC’s, printers,
servers and other technology equipment
Point-of-Sale – Equipment leasing operation for point-of-sale equipment to small and
mid-size retail merchants throughout the US and Canada
Mid-Ticket Technology – Technology equipment leasing provided directly to Fortune
1000 and middle market customers utilizing relationships with manufacturers, resellers
and distributors. Equipment types include servers, network equipment and mid-range
systems
Telecommunications – Leases telecom equipment to Fortune 1000 and middle
market companies working directly with end users
49

Small & Mid-Ticket Leasing – Distribution Channels
Telecommunications
Mid-Ticket Technology
Point-of-Sale
Office and Technology
Direct
Brokers
ISO / Dealers
Manufacturers
50

Small & Mid-Ticket Leasing – Growth Strategies
Indirect Market
Expand vendor relationship base
Increase penetration with existing
vendors
Continue to enhance our origination
and servicing technology
Identify portfolio acquisition targets
Direct Market
Expand sales force
Increase manufacturer and integrator
relationships
Capitalize on synergies within the
small and mid-ticket businesses
Identify portfolio acquisition targets
(e.g. GTS)
51

52
52
Vice Chairman
Thomas B. Hallman

Achieve 10%+ Owned Asset Growth in 2004
Establish new relationships
Expand into new markets
Add new products and geographies within current customer case
Increase penetration within current customer base
Specialty Finance – Business Growth
53
53

Commercial Finance
John F. Daly
President, Commercial Services
Victor D. Russo
President, Business Credit
54

Key Statistics
Headquarters: New York, NY
Employees: 1120
Market Presence:
Leading provider of asset-based, cash flow
and retail financing to middle market
companies
Largest US factoring company
Market Focus
Business Credit
Asset-based and cash flow lending
Acquisition, recapitalizations, restructuring and DIP financing
Commercial Services
Factoring, credit protection and working capital
Serves retail and consumer product industry
Overview
Leadership Team
John F. Daly, President, CIT Commercial Services
31 years experience
Victor D. Russo, President, CIT Business Credit
21 years experience
Senior Leadership Team (14 members)
Average experience: 27 years
Key Profitability Drivers
Business Credit
Disciplined underwriting and portfolio management
Fee generation opportunities
Customized client service
Commercial Services
Factored volume
Advance rates
Risk-based pricing
Operating efficiency
55
Financial Summary
Operating Efficiency ($ millions)
Managed Assets ($ billions)
Charge-offs (% AFR)
Net Income ($ millions)
% of
AMA
Operating
Expenses
Efficiency
Ratio
56
ROE Trend
Competitive landscape
Credit cycle
Risk premiums extremely high in late 2002
through mid 2003
Strong operating leverage
Improving credit quality
Refinancings and acquisitions
Restructurings
Non-traditional competitors are entering market
Risk premium pricing not as readily available
Credit losses near historical lows
Continued strong operating expense leverage
Factors Impacting Performance
Current Environment
Return on Equity
57

2004 Performance Expectations
Exceeds
Below
Commercial Finance
Exceeds
Meets
Business Credit
Exceeds
Below
Commercial Services
Return on Equity
of 15%
Managed Asset
Growth of 8-10%
58

59
59
John F. Daly
President, CIT Commercial Services
Commercial Services
Market Focus
Accounts Receivable Protection
Credit insurance companies
ACI
AIG
Coface
Hedge funds
Amrock
Fortress
Fifth Avenue Fund
Credit Information Services
D & B
Bookkeeping &
Collection Services
Bookkeeping firms
Collection agencies
D & B
Creditek
Asset-Based Financing
Money center banks
Regional banks
Finance companies
60
60

Competitive Advantages
Core competencies of credit, administration and collections
Technological advantages
Comprehensive on-line system enables clients to view detailed credit and
collection account information in real-time
Most credit decisions are systems-generated resulting in approved
orders within seconds
Clients can customize reports on-line
Streamlined internal processes result in quick credit decisions and
efficient collections
Why do business with CIT?
One-stop solution for factoring and borrowing needs
Broad range of services, competitively priced
61
Portfolio Composition
Products/Services Offered
Industries Served
Women's &
Children's
Apparel
Men's Apparel
Footwear
Textiles
Furniture &
Home
Furnishings
Consumer
Goods
Other
Data as of December 31, 2003
62
Financial Products:
(millions)
Trade Receivables
$5,037
ABL / Overadvances
1,413
Total Managed Assets
$6,450
Financial Services:
(millions)
Factored Volume
$9,137
Distribution/Marketing Channels
Business
Development
Sales Force
Industry
Professionals
Cross-sell from
Other CIT
Units
63

Client Demographics
2,100 clients
Many clients have been with CIT for over 25 years, some dating back to the 1930’s
Clients range in size from $2 million in annual sales to Fortune 500 companies
Primarily in apparel, textiles, footwear, furniture, home furnishings, housewares,
consumer electronics and other consumer goods industries
Sell into retail channels of distribution
Factoring volume
Ranges from $2 million to $500 million per year
85% of clients factor $25 million or less with CIT
Asset-based loans
Agent and underwrite loans up to $100 million
Typical hold position is $30 million
64

GE & HSBC Acquisitions
Successful Integrations
Acquired GE factoring portfolio September 2003
Acquired HSBC factoring portfolio December 2003
Fully integrated both purchases within 60 days of closing
Additional staffing complete
Post conversion – all systems are operating satisfactorily
First quarter ’04 revenue exceeded plan
Challenges
Client retention
Maintaining service levels
Opportunities
Sell additional CIT services to acquired clients
65

Market Strategies / Growth Opportunities
Demand for factoring and credit protection services remain high as companies seek to
reduce customer credit exposures
Continued demand for asset-based lending services as borrowers are confronted with
contraction in the banking industry
Benefit from trend in outsourcing non-strategic functions to reduce costs in credit,
accounts receivable bookkeeping and collections
Leverage presence in Shanghai and Hong Kong with Asian manufacturers looking for
credit protection on US sales
Expand beyond core industries with new products offerings such as Concentration Risk
Management and E-TAD
66

Business Initiatives
Concentration Risk Management
A solution for companies with high customer concentrations
Credit line approvals and customer guarantees
Reduces potential for bad-debt losses
“E-TAD” - Electronic Trade Acceptance Draft
Electronic payment obligations from a buyer to a supplier payable
on a future date, just like a check
Fee-based service for CIT’s credit protection service and ability
to advance payment to the seller
Value-added solutions for companies seeking
credit protection and payment expertise
67

68
68
Victor D. Russo
President, Business Credit
Business Credit
Asset-Based Lenders
Congress Financial
Foothill
PNC Business Credit
LaSalle Business Credit
Cash Flow Lenders
Antares
Madison Capital
Dymas Financial
Merrill Lynch Capital
Lenders providing both asset-based and cash flow solutions
CIT, GE Capital, Bank of America
Regional banks
Money center banks: JP Morgan, Citibank, Goldman Sachs, Deutsche Bank
Hedge Funds
Business Development Companies
Market and Competitive Analysis
69
69

Business Overview
Asset-Based
Lending
Retail
Media and
Communications
Corporate
Finance
Secured by accounts receivable, inventory, fixed assets and intangibles
Tranche B loans as part of senior financing facilities
Cash-flow based senior debt financing
Target market: Equity sponsor groups
Specialized group targeting public and private retailers nationwide
Specialized group providing senior debt and advisory services
Target market: Equity sponsor groups, end users in telecommunications,
TV, radio, etc.
Providing total financing solutions to middle market companies
70
Portfolio Composition
Portfolio Breakdown (millions)
Industries Served
Other
Wholesale
Retail
Media
Manufacturing
Communications
71
Asset-Based Lending
$
3,554
Cash Flow Lending
552
Media
749
Communications
543
Total Managed Assets
$
5,398
Products Offered
Asset-Based Lending
Used for acquisitions, growth, refinancing,
leveraged buyouts, turnaround financing,
DIP and exit financing
Tranche B Loans
Corporate Finance (Cash Flow)
Acquisition financing
Recapitalizations
Specialty Groups
Retail Finance Group
Media and Communications

Core Competencies
Disciplined credit process with experienced credit managers
Strong origination, credit and portfolio management skills
Known and respected by borrowers, referral sources and
other lenders
Industry specializations in retail, media and communications
Dedicated origination, underwriting and portfolio staff
Industry focus supports in-depth knowledge of customers,
valuations, industry trends and important intermediaries
Long-term franchise with expertise in managing through
industry cycles
72

Borrower Demographics
Asset-Based Lending Borrowers
550 public and private companies with annual sales of $30 million+
Senior revolving and term debt secured by accounts receivable, inventory and fixed
assets
Hold positions generally up to $50 million
Agents and underwrites positions up to $600 million
Cash Flow Lending Borrowers
75 portfolio companies largely owned by private equity sponsor groups
Senior debt based on a multiple of EBITDA and enterprise valuations
Hold positions is generally up to $15 million
Media and Communications Borrowers
125 companies with typical deal sizes ranging from $10-$100 million
Hold positions generally up to $25 million
Senior debt based on multiple of EBITDA and/or asset valuations
73
Distribution/Marketing Channels
Investment Banks
Cross-sell from other
CIT units
Direct Prospect
Calling
Attorneys
Accountants
Turnaround
Consultants
Equity Sponsors
Other Lenders
74
74

2004 Business Combination
Media and Communications transferred to Business Credit
in April 2004
Synergies
Both target middle market companies
Similar origination channels
Similar credit culture, underwriting, portfolio skills and process
Overlapping financing solutions (combination of asset-based
and cash flow)
Benefits
Leverage capital markets network to syndicate loans
Draw upon expertise and experience in turnaround situations
and DIP financing
75
Media and Communications – Portfolio
Media 58%
Communications 42%
Portfolio Breakdown (millions)
Industries Served
Media-Other
CLEC
LEC-ILEC/RLEC
Tower
Wireless
Publishing
Cable
Television
Radio
Comm-Other
76
Media
$
749
Communications
543
Total Managed Assets
$
1,292
Products Offered
Senior debt
Acquisition, growth financing
Term loans, revolving lines of credit
Bridge financing
Mezzanine debt
Subordinated debt
Convertible instruments
Investment banking services
Capital formation
Balance sheet restructuring

Business Credit Growth Opportunities
Leverage origination expertise to win more deals
Arrange total financing by bringing in junior lenders to provide second
tier financing
Exploit increased liquidity in mezzanine lending market created by hedge
funds and other new entrants
Leverage syndication capabilities to work with other lenders
Continue to build upon middle market platform
Addition of media and communications broadens reach into middle market companies
Asset-based, corporate finance, media and communication and retail are all
sourced via a common referral base
Build platform for additional specializations to leverage calling efforts,
syndications, systems and operations
Expand lending capabilities outside of United States
Build upon media and communication’s UK presence by offering asset-based
lending and corporate finance in the United Kingdom
77

Equipment Finance
Roy W. Keller, Jr.
President
78

Key Statistics
Headquarters: Tempe, AZ
Employees: 770
Market Presence:
Industry leader in dealer/manufacturer
programs in the U.S.
Leader in both transportation and
direct healthcare markets in Canada
Market Focus
Flow Business
Secured equipment lender in construction, industrial,
healthcare, business aircraft, sports/gaming
Dealers, manufacturers and end-users
Overview
Leadership Team
Roy W. Keller, Jr., President
31 years experience
Senior Leadership Team (13 members)
Average experience: 25 years
Key Profitability Drivers
Asset Growth
Credit Costs
Operating Efficiency
79

Operating Efficiency ($ millions)
Managed Assets ($ billions)
Charge-offs (% AFR)
Net Income ($ millions)
Financial Summary
% of
AMA
Operating
Expenses
Efficiency
Ratio
80
ROE Trend
Low levels of capital spending
Glut of equipment pressuring collateral
values
Aggressive pricing by captives to
stimulate manufacturing parent
Tighter underwriting criteria negatively
impacted volumes
Positive results from annual construction
industry survey
Initial signs of pick-up in business
investment and capital spending
Reduced repossessed inventory levels
within portfolio
Increased liquidity among clients
Return on Equity
Factors Impacting Performance
Current Environment
81

2004 Performance Outlook
Below
Below
Equipment Finance
Meets
Meets
Canada
Below
Exceeds
Specialized
Below
Below
C & I
Return on
Equity of 15%
Managed Asset
Growth of 8-10%
82
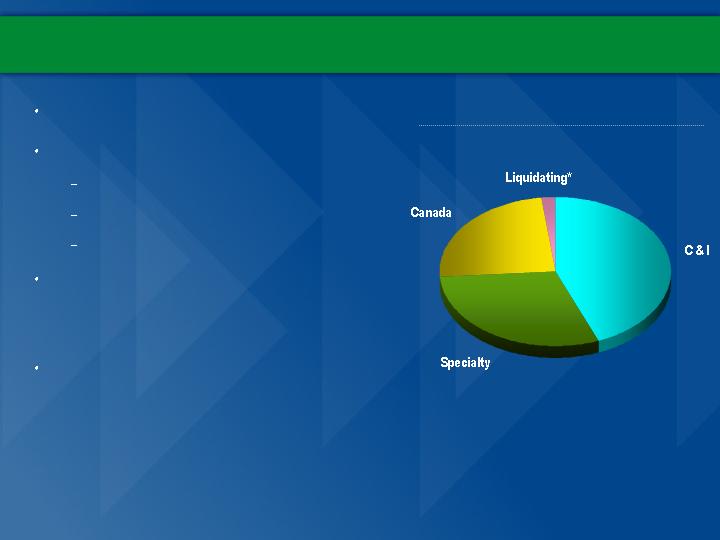
Business Overview
Premium brand name
Industry leader in key markets:
Construction equipment
Manufacturing
Corporate aircraft
Wide range of product offerings including
direct financing programs with equipment
manufacturers and dealers
Collateral and equipment management
expertise
Assets by Operating Division
* Liquidating Portfolios include Franchise
Finance & Owner Operated Trucking
44%
30%
24%
2%
83
Construction & Industrial Profile
National Account
Division
East Region
Southwest
Region
West Region
8 DSMs
Serves vendors
& manufacturers
nationwide
17 DSMs
18 DSMs
17 DSMs
16 DSMs
Construction Equipment
Industrial Equipment
Printing
Imaging
Extruding
Packaging
Machine tools
Plastic injection molding
Fitness
Other light equipment
Great Lakes
Region
Centralized credit, funding, collections and portfolio management (Tempe, AZ)
84
Lifting
Ground engagement
Hauling
Vocation transport
Material handling
Crushing
Paving

Growth Strategies – C & I
Construction
Leveraging existing customer relationships
Improving quality of field force
Expanding dealer/manufacturer relationships through shared customer marketing
Placing stronger emphasis on tele-sales to follow on small balance customers
Industrial
Increasing direct call activity in printing and machine tool markets
Expanding manufacturer vendor relationships in printing and machine tool
industries
Establishing strategic alliances in the other industrial markets
Using ‘One CIT’ to expand industrial business segment
85

Centralized credit, funding, collections and portfolio management (Tempe, AZ)
Specialized Industry Profile
8 DSMs
7 DSMs
10 DSMs
14 DSMs
6 DSMs
Profile
Finances turbine
powered aircraft
Floating rate loans
Fixed rate capital
leases
Operating leases
Business
Aircraft
Sports/
Gaming
Healthcare
IMME
Syndications
Profile
Profile
Profile
Profile
Finances sports
teams & casinos
Floating rate loans
Fixed rate loans
Finances
healthcare
equipment with an
emphasis on
diagnostic
equipment
Customers:
hospitals,
outpatient centers,
physician practices
Floating and Fixed
rate loans
Finances inland
marine operators,
mining companies
and some energy
Sells loans and
leases to manage
risk exposure levels
Buys loans and
leases that fit with
equipment financing
units
86

Growth Strategies – Specialized Industry
Aircraft
Expanding helicopter financing
Tightening relationships with manufacturers
Healthcare
Adding manufacturer relationships
Increasing sales coverage
Sports / Gaming
Taking lead positions in Sports Franchise and Casino Financings
Inland Marine, Mining, Energy and Real Estate
Expanding into auxiliary power in the energy industry by hiring a specialist
Leveraging “One CIT” working with Business Credit and other CIT units
Syndications
Purchasing “plug-in” portfolios
Strategically purchasing or participating in syndicated transactions
87

Centralized credit, funding, collections and portfolio management (Burlington, Ontario)
Canada Profile
25 DSMs
11 DSMs
11 DSMs
14 DSMs
Profile
Recognized market
leader in the
transportation
sector
Finances
construction
equipment
Transportation
& Construction
Commercial
& Industrial
Healthcare
CIBC
Profile
Profile
Profile
Specializes in
vendor programs
Finances printing,
food processing &
other industrial
equipment
Recognized
market leader in
direct dental and
pharmacy
financing
Dedicated DSMs
located in the
commercial bank
branches of the
Bank of Commerce
88

Growth Strategies - Canada
Transportation & Construction
New business opportunities from the 2010 Winter Olympics
Actively promoting “Wholesale” financing programs
Increasing non-transportation mix to the 35%-40% range
Healthcare
Maintaining leadership position in the direct dental and pharmacy markets
Taking advantage of the recent mortgage interest tax ruling
Remaining the lender of choice for two major pharmacy chains in Canada
CEFL (Canadian Imperial Bank of Commerce)
Re-alignment of sales staff in the branches
Partnering with the bank’s “Oil & Gas group”
Commercial & Industrial
Increasing sales coverage in the key markets of Toronto and Calgary
Expanding role in the printing & food processing industries
89

Portfolio Composition
Products/Services Offered
Industries Served
*No industry greater than 3%
Construction
Mining
Food
Transportation
Aircraft
Services
Other
Healthcare
Retail
Financial
Entertainment
Manufacturing*
Wholesale
90
Financial Products:
($ millions)
Owned
$6,872
Securitized
3,052
Total Managed Assets
$9,924
Financial Services:
Collateral/Cash Flow Loans
Leases
Revolving Lines of Credit
Sale and Leaseback Arrangements
Wholesale/Retail Financing for
Distributors/Manufacturers
Discounting Programs
Portfolio Acquisitions
Acquisition Financing
Debt Refinancing
Leveraged Leases/Loans
Equipment Diversification
Healthcare
Transportation
Other
Aircraft
Real Estate
Machine Tools
Construction
Furniture
Material Handling
Printing
Manufacturing
Technology
91

Distribution/Marketing Channels
Leads obtained through advertisement referrals, direct calls, direct mail
programs, trade shows, industry related events and repeat customers.
Products are distributed through manufacturers, dealers and sales force
Sales force is broken down into regions both the U.S. and Canada (123 U.S.
and 69 Canadian sales professionals)
Industry in several key markets
Canada: transportation and direct healthcare
U.S.: dealer and manufacturer programs
92
Canada
C & I
Specialized
EF – Sales Team Representation
93
93

Competition
Competitors
Manufacturer captives
Caterpillar Finance
Cessna Finance
Phillips Medical Capital
Siemens Financial Services
John Deere Credit
Independents
General Electric
Financial Federal
Banks
Wells Fargo
Citicapital
US Bancorp
Competitive Advantages
Key customer relationships
Expertise in evaluating and managing risk
Customer service focus
Leadership positions in primary markets
Long-term industry presence
Strong brand recognition in U.S.; growing
brand recognition in Canada
Diverse and customized financial products
and service offerings
Customers choose CIT because of our flexibility in creating custom financial
packages and our innovative, relationship driven approach
94

Capital Finance
Nikita Zdanow & David D. McKerroll
Co-Group Chief Executive Officers
95

Overview
Key Statistics
Headquarters: New York, NY
Employees: 200+
Market Presence:
Top player serving serving the Rail and
Aerospace industries for 30+ years
Recognized leader in structuring
complex finance transactions
Market Focus
Full service provider of financing and leasing
alternatives to:
Aerospace
Rail
Power, Energy and Infrastructure
Principal and/or advisory capabilities
Leadership Team
Nikita Zdanow
40+ years experience
David McKerroll
20+ years experience
Senior Leadership Team (10 members)
Average experience: 19 years
Key Profitability Drivers
Equipment utilization
Lease margins (rental rates)
Operating efficiency
Gains on equipment sales
Fee generation
96
Financial Summary (pre-combination)
Operating Efficiency ($ millions)
Managed Assets ($ billions)
Charge-offs (% AFR)
Net Income ($ millions)
% of
AMA
Operating
Expenses
Efficiency
Ratio
97
Capital Finance (pre-combination)
Return on Equity
Sluggish economy dampened rail
rental rates
Aerospace cyclical downturn
exacerbated by 9/11, SARS and the
Iraqi war
Near full utilization on rail and air
Rail rates continuing to firm
2004 air order book is fully placed
Aerospace rents starting to firm
Performance Factors
Current Environment
98

99
99
David D. McKerroll
Co-Group Chief Executive Officer
Capital Finance

Business Re-Alignment
Power, Energy
& Infrastructure, Regional
Air and SD&L
$1.8
Communication & Media
$1.3
1 Includes $0.3 billion of product with the rail industry
$ billions
100
Capital Finance
Air
$5.1
Rail
2.7
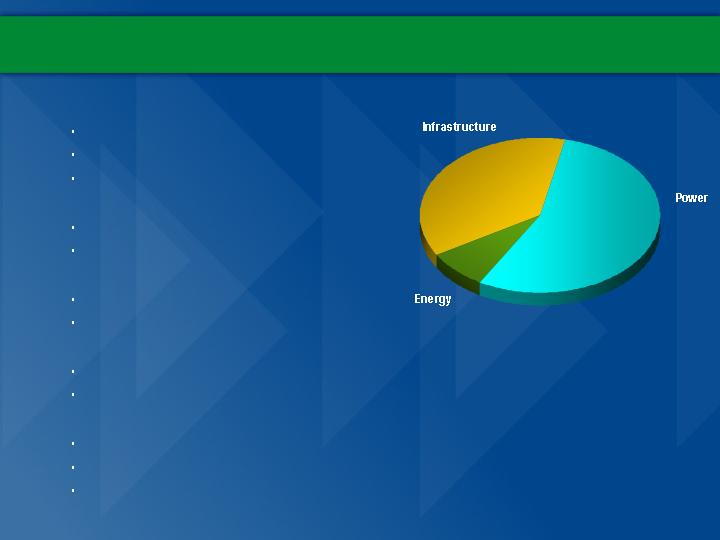
Power, Energy & Infrastructure
1.1
Structured Debt & Leasing
0.1
Other
0.1
New Capital Finance
$9.1
Business Credit
Business Credit - Old
$ 4.1
Communication & Media
1.3
New Business Credit
$ 5.4
Structured Finance
Communication & Media
$1.3
Power, Energy & Infrastructure
1.1
Air - Regional
0.3
Structured Debt & Leasing1
0.4
Total
$3.1

2004 Business Combination
Industry knowledge
Expertise in long-lived assets
Remarketing capability
Strong manufacturer and industry
relationships
Capital Finance
Asset Management Skills
Full Service
Provider of
Financing
Solutions
Competitive player in purchase of newly
manufactured equipment
Structuring expertise as principal or advisor
Syndication capabilities
Collateral expertise
Key Value Drivers
Structured Finance
Structuring Expertise
Distinguishes us from financial players
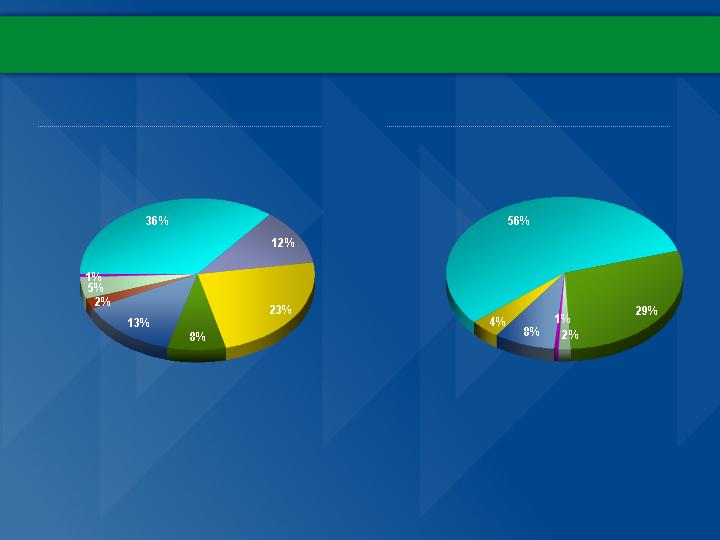
Aerospace
Other
Inter-
modal
Rail *
Total = $9.1B *
Aircraft
209 Commercial
119 Regional
50,000+ Railcars
500+ Locos
Asset Classes
* Excludes $0.4B / 8,000 railcars related to 9/01 Rail Sale Leaseback
Power,
Energy &
Infrastructure
Product Types
Structured
Debt &
Leasing
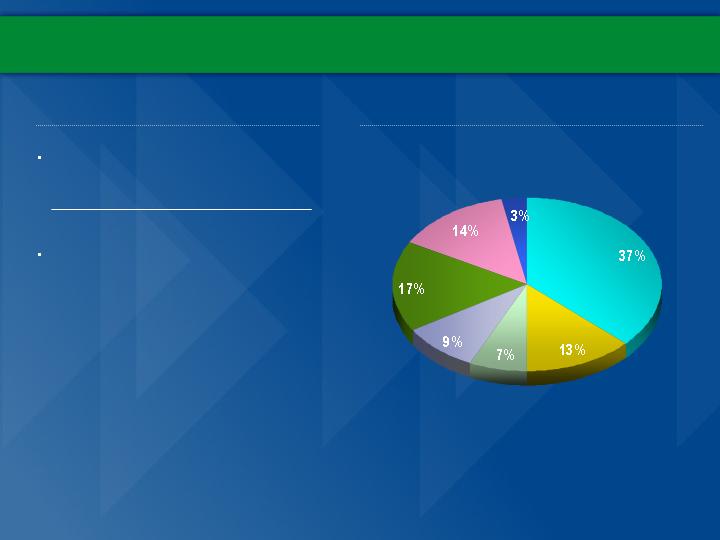
Portfolio Composition
Aero Tax
Optimized Lev
Lease
Single Investor
& Finance
Lease
Other
Loans
Other
Leveraged
Lease
Operating
Lease
$5.1
$1.1
$2.7
$0.1
$0.1
$0.1
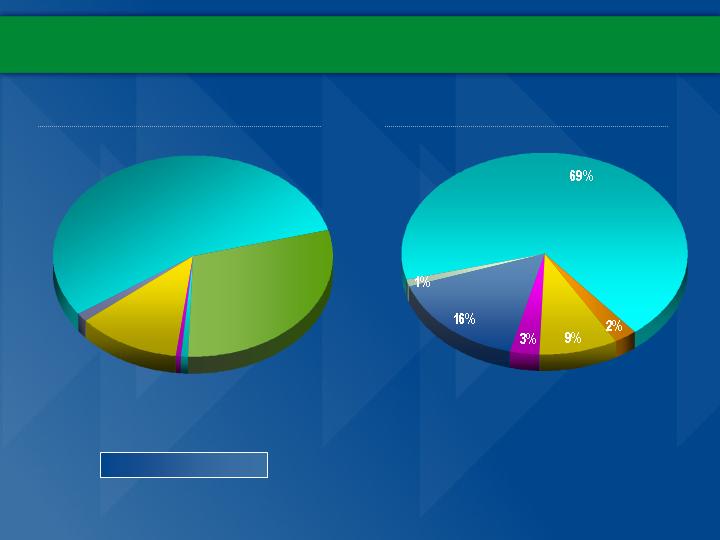
102
Power, Energy & Infrastructure
Primarily Senior Secured Investments
Investment grade projects
Middle market projects
Some mezzanine investments (high quality projects)
Balanced Revenue Profile
Net interest margin ~ 70% of net revenues
Non-spread income ~ 30% of net revenues
Steady Growth and Profitability
Double-digit earnings growth
Historic ROE above 15% threshold
Competitive Advantage
Professional staff experienced in lending through industry/business cycles
Proven track record of successfully managing large scale domestic and international projects
Growth Opportunities
Power – Sector recovery will provide refinancing opportunities in the under-banked middle market
Energy – Growing use of natural gas will increase investment in terminals, pipelines and storage
Infrastructure – Exploit expertise in working with Public Private Partnerships
37%
55%
8%
103

Structured Debt & Leasing
Leasing companies
Hedge funds
Banks
Pension funds
Life insurance companies
Syndication network
Extensive knowledge of accounting, tax, finance and structural issues in multiple
jurisdictions and capital markets
Experience
Single investor leases
Leveraged leases
Cross-border/International leasing
Senior debt
Mezzanine debt
Credit tenant leases
Specialized product-oriented division
104

Benefits Structured brings to Capital Finance
Enhanced structuring and syndication capabilities
Increased originations
Ability to offer a broader range of financing products
Opportunity to participate in larger transactions through syndication
Ability to manage exposures
Increased returns
Advisory fees
Structuring fees
Syndication fees
105

106
106
C. Jeffrey Knittel
President, CIT Aerospace
Aerospace

$5.1B Portfolio
$4.8B Commercial
$0.3B Regional
Leading lessor of commercial aircraft
Leading advisor in regional aircraft
Broad distribution including most major foreign and domestic airlines
Expanding client base
Balanced commercial fleet mix
Over 72% narrow body aircraft
Over 84% aircraft built since 1990
CIT Aerospace – Attributes
107
107

Softer economic conditions
Industry Overview - What Happened?
Increased passenger price sensitivity
Difficulty supporting high cost structures
9/11 + War in Iraq + SARS
Reduction in demand
Supply - Demand imbalance
Lower lease rates
108

Industry Outlook
Industry in transition where price is
the #1 driver
Low fare opportunities stimulating
passenger demand
Market share shifting from legacy to
low cost carriers
International demand growing
Where are we now?
Where are we going?
Long-term air travel expected to
grow 5% per annum
Passenger demand will result in a
doubling of the world fleet by 2025
Regional jets will represent a
growing proportion of the world fleet
Capital starved airlines will look to
leasing companies for aircraft
109

Activity since 9/11
Commercial Market
Took delivery of and placed in excess of 50 new aircraft
Effectively remarketed/renewed over 80 leases
Expanded our market base
Signed deals with 43 new customers
Placed aircraft in 16 new countries
Sold approximately 20 aircraft – All at values greater than book
Managed fleet through multiple airline bankruptcies
Enhanced relationship with Airbus and Boeing by developing over 20 new clients
Regional Market
As advisor, placed over 120 regional aircraft representing over $2 billion
of financings
110

Portfolio Composition
Aircraft
Net Investment
100.0%
328
100.0%
5,060
0.0%
---
1.3%
67
Other
2.1%
7
2.9%
149
Capital Leases
2.7%
9
4.3%
219
Tax-Optimized leveraged leases
29.6%
97
4.6%
235
Loans
6.7%
22
5.4%
272
Leveraged Leases
58.8%
193
81.4%
4,118
Operating Leases
%
Number
%
$ Millions
Risk Management Focus
Risk
Management
111
Equipment
Balanced
Credit
Operating leases
Loans
Leveraged leases
Capital leases
Residual reviews
Technical expertise
Proactive management
Business and financial
Performance monitoring
Quarterly credit review

Performance Objectives
Structuring / Syndication Skills
Increase Fee Income
Diverse Customer Base
Minimize Risk Concentrations
Operating Lease Capability
Capitalize on Industry Transition
Lease Term Management
Maximize Rental Income
Desirable Fleet
Maintain High Utilization
Success Driver
Objective
Focused on improving profitability
112
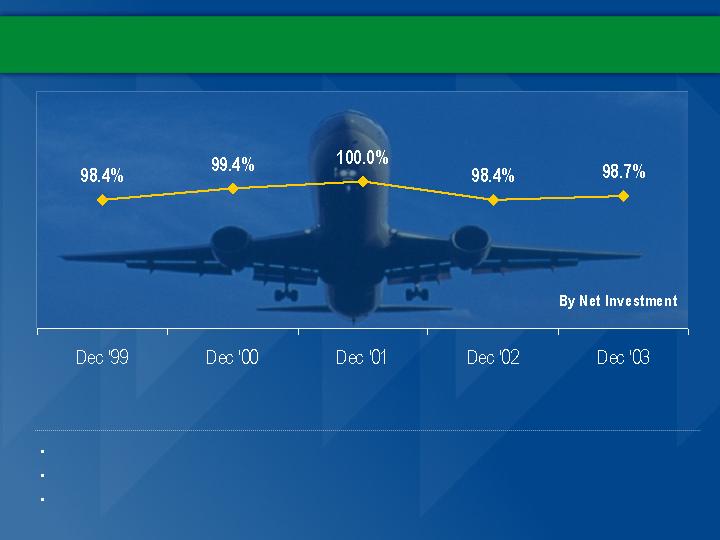
Commercial Aerospace – Utilization
Broad & diverse customer base
Strong remarketing team with technical expertise
Aircraft fleet with broad appeal (type, age)
Drivers of High Utilization
113

Commercial Aerospace – Portfolio Migration
Years
Years
Europe
Asia and Australia
North America
Latin America and Caribbean
Middle East and Africa
Boeing
Airbus
Other
Narrow
Intermediate
Wide
Other
Grouping
54.8%
44.8%
0.4%
86.0%
9.0%
5.0%
Manufacturer
6.8
9.2
Average Lease Term
7.1
9.8
Weighted Average Age
42.4%
22.1%
21.3%
12.9%
1.2%
38.6%
11.1%
37.5%
10.8%
2.0%
Geographic Diversity
72.7%
18.4%
8.5%
0.4%
71.0%
8.3%
16.2%
4.5%
Body Type
2004
1999
Category
Attractive fleet with broader distribution
114

Commercial Aerospace – Lease Rates
Impact varied by type and age of aircraft falling 10-60% from
pre-9/11 highs
Less impacted models - A320s, A330s, 737 NGs
More impacted models - 737 classics and 757s
Rates up across the board versus December 2003
Less impacted models are approaching pre-9/11 rates
More impacted models are still well below pre-9/11 rates
Lower lease rates today due in part to lower interest rates
Expect lease rates to continue to rise as supply-demand balance
improves
115
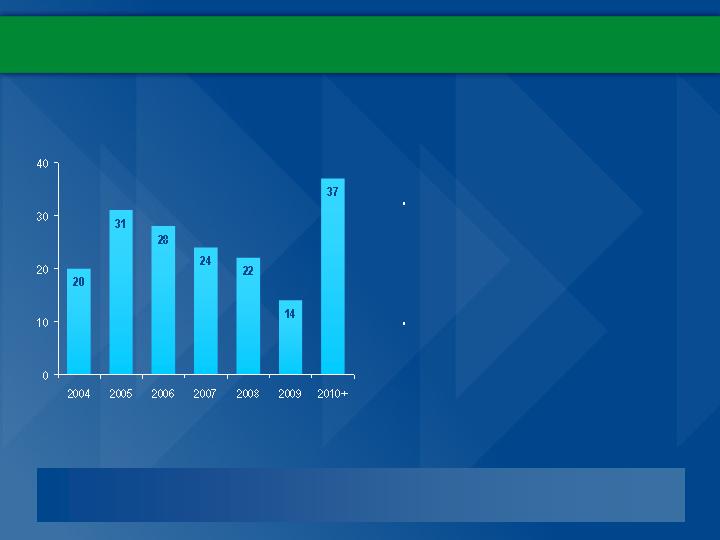
Commercial Aerospace – Lease Book*
176 Aircraft - $4.3 billion
Lease Expiration Schedule
Expirations planned to take
advantage of lease rate
improvement
Beginning process of gradually
lengthening lease terms
* Excludes finance leases and FSC leveraged leases
Proactive portfolio management will speed recovery
116

Commercial Aerospace – Deliveries
20
60
2.9
Total $
0
5
0.3
2007
0
20
1.0
2006
3
18
0.9
2005
17
17
0.7
2004
Poised
for
recovery
Placed
Number
Amt ($B)
Year
Remaining
order book
52
52
2.5
Total $
1
1
0.1
2004 (Q1)
22
22
0.9
2003
16
16
0.8
2002
9
9
0.5
2001
4
4
0.2
2000
Placed with
22 clients
in 16
countries
Placed
Number
Amt ($B)
Year
Deliveries
taken to
date
117

Regional Aerospace
Portfolio composition
$292 million net investment
119 planes
30 customers
Focused on providing customized financing solutions
Fee based business whose primary product is intellectual capital
Experienced in structuring, arranging and placing complex financings
Broad client base: manufacturers, export credit agencies, airlines
and investors
Strong client retention based on a strong history of success and value added
Arranged $2 billion in financing for SkyWest aircraft since 1995
118

Outlook
Manage through current down cycle while positioning for turn-around
and future profit growth
Global airlines will need capital to meet future passenger demand forecasts
Ideal condition for leasing opportunities
Improve profitability through cycles
Maintain high utilization
Better supply/demand characteristics should improve pricing power / lease rates
Continue to seek further efficiencies from a low cost infrastructure
Increase advisory/fee generation business
Return aerospace to its historical profitability
119

120
120
Stephen McClure
President, CIT Rail Resources
Rail Resources

$ 2.7 billion owned portfolio
$ 0.4 billion serviced portfolio
Diverse customer base
Clients include all US and Canadian class I railroads
Excellent growth rate
New and diversified railcar fleet
80% of leased portfolio < 8 years old
Broad based penetration of market
Rail Resources – Attributes
121
121

Rail - Industry Overview
Increased Utilization
& Mileage
More Demand for
New/High
Capacity Cars
Aging N.A.
Railcar Fleet
Higher Rental Rates
& Fleet Value
Increased Cost
for New Cars
Higher Steel
Prices
Greater Demand for
Existing Assets
Severe Component
Shortages
50% Rise in
Railcar Orders
(QTQ)
Strong Demand &
Higher Rental Rates
Increased Rail
Traffic
Improving
Economy
Impact on CIT
External Environment
Enhanced demand, increased rates and improved asset values
122

Performance Objectives
Growing the Business
Purchase approximately 4,000 new
railcars and 34 locomotives with a
value approaching $300mm in 2004
Actively review portfolios for sale in
the secondary market
Continue aggressive marketing to the
higher margin shipper business
Expand programs to monetize rail
assets of customer base
Increasing Profitability
Increase rental margins
Continue to aggressively push rental
rates while containing costs
Approximately 50% of our lease fleet
will re-price in 2004/2005, allowing us
to lock-in favorable future returns
Increase equipment gains
5-year residual realization 118%
Improving values Higher gains
Generate additional fee income by
offering structuring/advisory services to
customer base
123
Portfolio Demographics
Industries Served
Railcar Age
Class 1 RR
Shortline &
Regional RR
Manufacturing
Grain Products
Utilities
Leasing
Mining
Other
1999-2004
1994-1998
1989-1993
1984-1988
1979-1983
1978 and
older
124
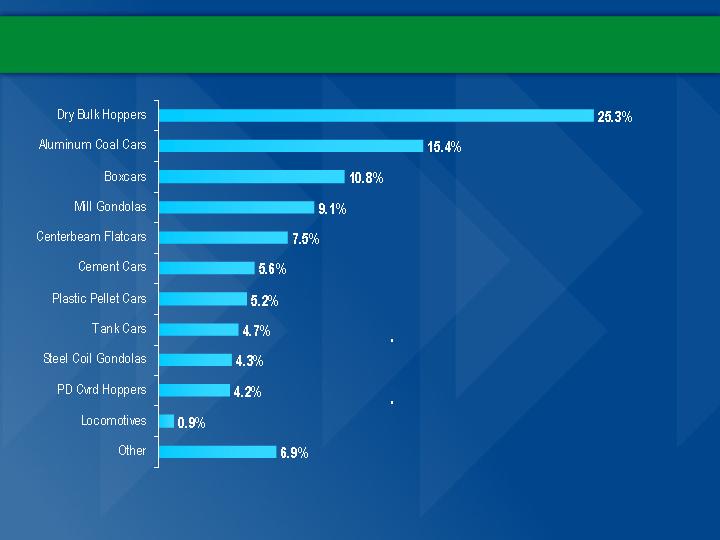
Well diversified fleet – compares
favorably to national railcar fleet
Fleet mix managed through asset
sales and purchases – excellent
history of gains
Railcar Types
125
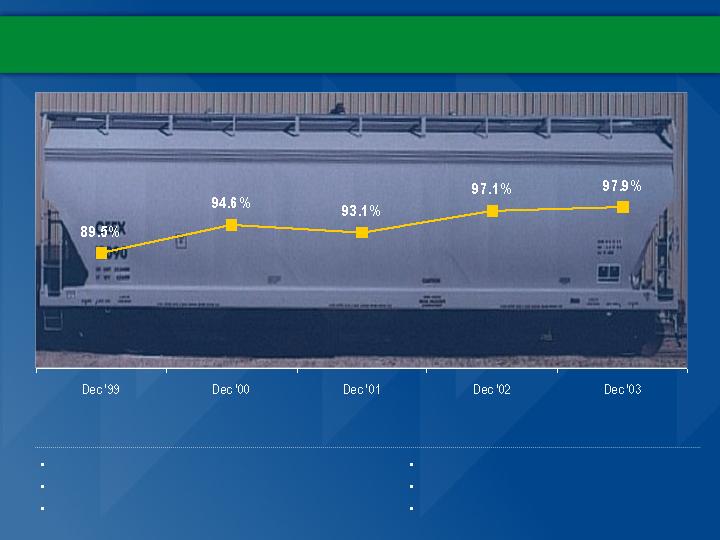
Rail Resources – Utilization
Relationship/Service oriented
Superior financial structuring
Advanced fleet management
Youngest fleet among the majors
Primarily 286K capable fleet
Well diversified by category
Drivers of High Utilization
By Unit
126

Portfolio Management
Strategic Actions
Shortened lease terms during period of compressed rates (2000-2003)
Purchased assets at depressed equipment prices (Flex)
Lengthen lease terms in response to current market improvements
Plan Lease Expirations
Avoid concentrations
Minimize seasonality
Focus on high quality clients
Leads to higher renewal rates
Increases operating efficiency
Maintain Desirable Fleet
Proactively buy and sell equipment
Target average fleet age of 8-10 years
Focus on balanced car base with proven
track record
Ensure well-serviced and properly
maintained fleet
127

Opportunities and Initiatives
Continue to increase rental rates as the market further improves
Pull cars from lessees who are unable to absorb higher rates
Sell select assets to capitalize on value improvements and manage
fleet age dynamics
Continue system and process enhancement to insure scalability,
premium service and high efficiency
Seek strategic acquisitions to expand portfolio base and take
advantage of operating efficiencies
Superior industry and equipment knowledge distinguish us from the rest
128

2004 Performance Expectations
Below
Meets
Total Capital Finance
Exceeds
Meets
Structured Portfolios
Meets
Meets
Rail
Below
Meets
Aerospace
Return on Equity
of 15%
Managed Asset
Growth of 8-10%
Division
129
Finance Overview
Joe Leone
Vice Chairman and Chief Financial Officer
130

Agenda
Financial Scorecard
Technology
Risk Management
Liquidity
Interest Rate
Capital
Ratings Objective
131

Financial Scorecard
* Excludes $25.5MM after-tax gain on PINES debt call
8% - 10%
5% (owned 6%)
50.1
47.5
Managed Assets ($ billions)
9% Plus
10.7%
10.4%
Tangible Equity/Managed Assets
Balance Sheet
1.26%
1.61%
Credit Losses - Total
Credit
35% Area
41.1%
41.7%
Efficiency Ratio
Expenses
Max. 15%
8%
14%
Securitization Gain (% PT Income)
3.40% - 3.60%
3.09%
2.34%
Risk Adjusted Margin
15%
13.1%
11.0%
ROTE
1.42%
1.13%
ROMA
27%
0.76
0.60
EPS ($)
29%
164
127
Net Income ($ millions)
Profitability
Long Term
Targets
Increase
2004
Q1*
2003
Q1
132

Risk Adjusted Margin
Need 40 bps improvement to meet target
Mix – Allocate capital to higher return businesses
Lower total credit losses – Move below 1.00%
Refinance higher cost debt - Improve margin 10 bps or more
133
Year-to-Date Issuance
Remaining 2004 Maturities
Amount
Spread
Term
Amount
Spread
Term
Fixed
$1.9B
100 bps
8.6 yrs
$1.2B
133 bps
5.0 yrs
Floating
3.8B
21 bps
2.9 yrs
2.1B
56 bps
1.2 yrs
Total
$5.7B
$3.3B

Efficiency Ratio
134
Efficiency Ratio (1Q04)
41%
Improve cost of funds
(1%)
Operating leverage
(1 - 2%)
Additional efficiencies
(1 - 2%)
Other
(1%)
Target Ratio (depending on mix)
35%

IT Standardization
135
Category
1999
Today
Infrastructure
Data Center
7
1
Mainframe Processors
3
1
Global Network
2
1
E-Commerce Gateway
5
1
Business Applications
General Ledgers
30
2
Credit Exposure
2
1
Leasing
Credit Origination
5
3
Lease Accounting
20
4
Customer Service/Collection
6
2
Web Front-end
5
1
Contact Center Technology
5
2
Document Management/Imaging
5
1
IT Investment Profile
Future investment emphasizes innovation…
Today’s investment includes…
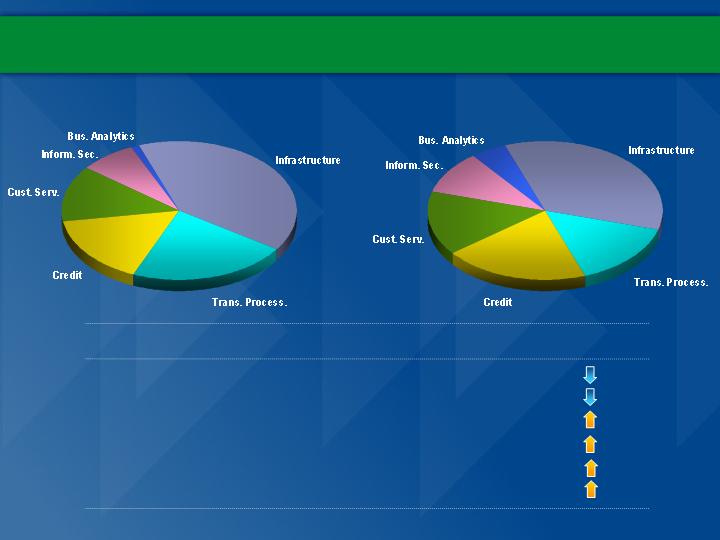
136
2004
Spending Category
Beyond
40%
Infrastructure
35%
22%
Customer Transaction Processing
15%
13%
Customer Service
15%
16%
Credit
20%
8%
Information Security
10%
1%
Business Analytics
5%

Enterprise – Wide Best Practices
eFinance It (full service front-end web customer service portal)
eBoss (credit origination for commercial loans and leases)
CIT Connect (collection workflow)
Asset Management (residual management)
Business Intelligence (performance scorecards and decision support)
Improved generation of credit scoring
High technology centers
137

Treasury Risk Management Framework
Interest Rate/
FX Risk
Definition
Strategy
Exposure to accounting or
economic loss due to changes
in interest rates or foreign
exchange rates
Match-funding practice
Hedging
Liquidity
Risk that funds needed to meet
potential cash outflows are not
available
Diverse funding sources
Committed back-up credit facilities
Securitization facilities
Contingency funding plan
Derivative
Risk
Risks associated with the use of
derivative instruments including
counterparty credit, liquidity,
legal and systemic risks
Counterparty selection based
on ratings
Monitoring of current and
potential exposure
Uniform documentation
Market Risk
138

Capital Committee
Charter
Define, monitor & direct management of market
risks arising from financing the business
Ensure uninterrupted funding access
Objectives
Review economic, interest rate and FX outlook
Monitor external factors impacting the company
Authorize Treasury financing plans and risk management policies
Formulate and monitor capital ratio and risk targets
139
139
Liquidity Risk Metrics
*Alternate Liquidity includes available bank facilities, asset backed conduit facilities and cash
Bank Line Coverage / Total Commercial Paper
Target minimum of 100%
Commercial Paper / Total Debt
Short Term Debt / Total Debt
Target cap of 15%
Target cap of 45%
Alternate Liquidity* / Short Term Debt
Target minimum of 75%
140
Diversified Liquidity Sources
US MTN
US CP
US Cons. ABS
Int'l MTN's
US ABS CP
US MTN
Globals
US CP
US Retail
Int'l ABS CP
US Comm. ABS
US Cons. ABS
Int'l MTN's
US ABS CP
Private
Placements
December 31, 1998
December 31, 2003
141
2004 Funding To Date
Long-Term
International CP
Globals
$1,250 Million
A$CP
A$ 285 Million
MTNs
$3,224 Million
Euro Note
€1,000 Million
ABS
$1,244 Million

Traits of a Rising Rate Environment
Cyclical lenders return
Capital available for new entrants
Pricing pressure increases
Competition
More liquidity for customers
Asset and collateral values appreciate
Lower losses and improved credit metrics
Credit
Higher asset growth drives more margin
Stronger deal flow leads to fee generation
Equipment gains higher
Revenue
Matched funding philosophy minimizes risk
Margin
Higher capital spending
Activity picks up and growth accelerates
Volume
142

Interest Rate Sensitivity - Portfolio Mix
$38B
$ 5B
$17B
$16B
$38B
—
$17B
$21B
Debt (after swaps)
Receivables
Total
—
—
Tangible Equity
52%
44%
Floating Rate
48%
56%
Fixed Rate
143
Interest Rate Risk Metrics
Target cap of 4%
Target cap of 3%
* 100 bps rate shock
Margin at Risk (MAR)*
Equity at Risk (VAR)*
Negligible impact on margin
Represents increased equity value
reflective of longer liability duration
144
Accounting Based
Short-term Horizon (12 Months)
Risk to Earnings
MAR = 2.45% [~ $15 million after-tax]
Economic Based
Long-term Horizon
Risk to the Value of Equity
VAR = -1.70% [+$83 million]
Capital Generation
Return on Equity
13%
Dividend Payout
17%
Capital
Generation
11%
Asset growth target 8-10%
Increased dividend 8%
Stock buyback program to support employee stock option program
Acquisitions that are accretive to earnings

Capital Allocation
Transitioning to risk-adjusted capital allocation methodology
Ensure capital is invested in businesses with superior returns
Identify level of required capital reflective of the following risks:
Credit
Operational
Market
Implementation
Process rolled out January 2004
Transition effective 2005
146

Below Target
11 - 13%
10%
Equipment Finance
Below Target
15 - 20%
10%
Capital Finance
Exceeds Target
6 -10%
10%
Specialty Finance
Exceeds Target
8 - 10%
10%
Commercial Finance
Risk-Adjusted
ROE
Risk-Adjusted
Target
Current
Risk-Adjusted Capital Impact
147

10.7%
86%
10.3%
43%
Tang Equity/MA
Alt. Liquidity/STD
Capitalization:
0.98%*
2.07%
0.42%
1.40%
Charge-offs
NPA’s
Asset Quality:
1.42%
13.1%
1.48%
14.0%
ROMA
ROTE
Profitability:
A2/A
Aa3/A
Rating
Q1-04
1998
Ratings Objective
Well-defined succession plan
Experienced management
Management
Transition
Expanded funding diversity
Reduced refinancing risk
Proven alternate liquidity
Wholesale
Funding Model
Improving economy
Diverse business franchises
Economic
Environment
Current Status
Issue
Comparative Analysis
Other Qualitative Factors
* Core Charge-offs
Focus on returning to high single A long-term debt rating
148

CIT Characteristics 2004 and Beyond
149
Fortress Balance Sheet
Well Capitalized
Prudent Reserves
Proven and Effective
Broad Access
Funding Model
Strong Liquidity
High Debt Ratings
Improving Profitability
Growth
Margins
Efficiency
ROE

Strategic Review
Jeffrey M. Peek
President and Chief Operating Officer
150

Diverse Business Mix
Powerful Brand
Clean, Efficient Operating Platform
Experienced and Highly Skilled Team
CIT Strengths
151
151

Key Financial Metrics
Asset Growth
Operating Efficiency
Return on Equity
152

Economic Environment Favors Growth
Expanding GDP
Moderate inflation
Consolidation of competitors
Middle market opportunity
153

Middle Market Opportunity
154
154

Classic
Organic
Achieving Asset Growth Target
155
155

Focus on
High-Growth
Areas
Classic
Organic
Achieving Asset Growth Target
156
156

High Growth Areas
Technology
Healthcare
International
Apparel & Retailing
Media & Communications
157

Achieving Asset Growth Target
Bolt-on
Acquisitions
Focus on
High-Growth
Areas
Classic
Organic
158
158

Energizing CIT’s Future
RPM
ROE
One CIT
159
160
160

Non-GAAP Disclosure
Non-GAAP financial measures disclosed by management are meant to provide additional information and insight relative to trends in the business to investors and, in certain cases, to
present financial information as measured by rating agencies and other users of financial information. These measures are not in accordance with, or a substitute for, GAAP and may be
different from, or inconsistent with, non-GAAP financial measures used by other companies.
161
($ in Millions)
03/31/04
12/31/03
09/30/03
06/30/03
03/31/03
Managed assets:
Finance receivables
$
32,187.4
$
31,300.2
$
30,342.6
$
28,413.6
$
28,654.6
Operating lease equipment, net
7,576.2
7,615.5
7,485.3
7,560.0
6,831.4
Finance receivables held for sale
1,006.2
918.3
1,017.9
1,210.0
1,273.0
Equity and VC investments (included in other assets)
251.8
249.9
313.9
325.4
334.3
Total financing and leasing portfolio assets
41,021.6
40,083.9
39,159.7
37,509.0
37,093.3
Securitized assets
9,067.0
9,651.7
10,141.0
10,356.5
10,387.7
Managed assets
$
50,088.6
$
49,735.6
$
49,300.7
$
47,865.5
$
47,481.0
Earning assets:
Total financing and leasing portfolio assets
$
41,021.6
$
40,083.9
$
39,159.7
$
37,509.0
$
37,093.3
Credit balances of factoring clients
(3,619.4)
(3,894.6)
(3,103.0)
(2,471.6)
(2,437.9)
Earning assets
$
37,402.2
$
36,189.3
$
36,056.7
$
35,037.4
$
34,655.4
Tangible stockholders' equity:
Total equity
$
5,492.7
$
5,394.2
$
5,180.9
$
5,057.5
$
4,996.6
Other comprehensive loss relating to derivatives
102.9
41.3
106.9
122.1
92.6
Unrealized (gain) loss on securitization
investments
(11.3)
(7.7)
(8.0)
(7.9)
(12.5)
Goodwill and intangible assets
(485.5)
(487.7)
(437.9)
(404.1)
(399.8)
Tangible common equity
5,098.8
4,940.1
4,841.9
4,767.6
4,676.9
Preferred capital securities
255.1
255.5
255.9
256.4
256.8
Tangible equity
$
5,353.9
$
5,195.6
$
5,097.8
$
5,024.0
$
4,933.7

Non-GAAP Disclosure
Non-GAAP financial measures disclosed by management are meant to provide additional information and insight relative to trends in the business to investors and, in certain cases, to
present financial information as measured by rating agencies and other users of financial information. These measures are not in accordance with, or a substitute for, GAAP and may be
different from, or inconsistent with, non-GAAP financial measures used by other companies.
162
($ in Millions)
12/31/02
09/30/02
06/30/02
03/31/02
12/31/01
Managed assets:
Finance receivables
$
27,621.3
$
28,459.0
$
27,925.4
$
26,297.7
$
30,333.0
Operating lease equipment, net
6,704.6
6,567.4
6,689.7
6,604.0
6,465.6
Finance receivables held for sale
1,213.4
1,019.5
730.8
645.2
1,510.3
Equity and VC investments (included in other assets)
335.4
341.7
362.5
352.2
338.2
Total financing and leasing portfolio assets
35,874.7
36,387.6
35,708.4
33,899.1
38,647.1
Securitized assets
10,482.4
11,234.7
11,967.9
14,188.7
10,442.2
Managed assets
$
46,357.1
$
47,622.3
$
47,676.3
$
48,087.8
$
49,089.3
Earning assets:
Total financing and leasing portfolio assets
$
35,874.7
$
36,387.6
$
35,708.4
$
33,899.1
$
38,647.1
Credit balances of factoring clients
(2,270.0)
(2,513.8)
(1,980.0)
(1,543.5)
(2,184.2)
Earning assets
$
33,604.7
$
33,873.8
$
33,728.4
$
32,355.6
$
36,462.9
Tangible stockholders' equity:
Total equity
$
4,870.7
$
4,757.8
$
4,514.3
$
6,500.0
$
10,842.2
Other comprehensive loss relating to derivatives
118.3
120.5
43.2
32.9
52.7
Unrealized (gain) loss on securitization
investments
(20.5)
(23.6)
(18.6)
(21.7)
13.9
Goodwill and intangible assets
(400.9)
(402.0)
(403.1)
(2,403.2)
(6,857.1)
Tangible common equity
4,567.6
4,452.7
4,135.8
4,108.0
4,051.7
Preferred capital securities
257.2
257.7
258.1
258.6
259.0
Tangible equity
$
4,824.8
$
4,710.4
$
4,393.9
$
4,366.6
$
4,310.7

Forward Looking Statements
Certain statements made in these presentations that are not historical facts may constitute “forward-
looking” statements under the Private Securities Litigation Reform Act of 1995, including those that are
signified by words such as “anticipate”, “believe”, “expect”, “estimate”, and similar expressions. These
forward-looking statements reflect the current views of CIT and its management and are subject to risks,
uncertainties, and changes in circumstances. CIT’s actual results or performance may differ materially
from those expressed in, or implied by, such forward-looking statements. Factors that could affect actual
results and performance include, but are not limited to, potential changes in interest rates, competitive
factors and general economic conditions, changes in funding markets, industry cycles and trends,
uncertainties associated with risk management, risks associated with residual value of leased equipment,
and other factors described in our Form 10-K for the year period ended December 31, 2003 and our Form
10-Q for the quarter ended March 31, 2004. CIT does not undertake to update any forward-looking
statements.
Non-GAAP Financial Measures
These presentations include certain non-GAAP financial measures, as defined in Regulation G
promulgated by the Securities and Exchange Commission. Any references to non-GAAP financial
measures are intended to provide additional information and insight into CIT's financial condition and
operating results. These measures are not in accordance with, or a substitute for, GAAP and may be
different from or inconsistent with non-GAAP financial measures used by other companies. For a
reconciliation of these non-GAAP measures to GAAP, please refer to the appendix within this presentation
or access the reconciliations through CIT's Investor Relations website at investor.relation@cit.com.
Data as of March 31, 2004 unless otherwise noted.
Notices
163
163