- CIT Dashboard
- Financials
- Filings
-
Holdings
- Transcripts
- ETFs
- Insider
- Institutional
- Shorts
-
8-K Filing
Cit (CIT) 8-KRegulation FD Disclosure
Filed: 8 Nov 05, 12:00am

Exhibit 99.1
Forward-Looking Statements
Certain statements made in these presentations that are not historical facts may constitute “forward-looking” statements
under the Private Securities Litigation Reform Act of 1995, including those that are signified by words such as “anticipate”,
“believe”, “expect”, “estimate”, “target”, and similar expressions. These forward-looking statements reflect the current views
of CIT and its management and are subject to risks, uncertainties, and changes in circumstances. CIT’s actual results or
performance may differ materially from those expressed in, or implied by, such forward-looking statements. Factors that
could affect actual results and performance include, but are not limited to, potential changes in interest rates, competitive
factors and general economic conditions, changes in funding markets, industry cycles and trends, uncertainties associated
with risk management, risks associated with residual value of leased equipment, and other factors described in our Form
10-K for the year ended December 31, 2004 and our Form 10-Q for the quarter ended September 30, 2005. CIT does not
undertake to update any forward-looking statements.
Non-GAAP Financial Measures
The data provided in these presentations have been modified from our previously reported periodic data, including, but
not limited to, the exclusion of certain non-core transactions and nonrecurring events, because management believes
that the data presented herein better reflects core operating results. As such, the data will vary from comparable data
reported in CIT’s Forms 10-K and 10-Q. The data provided in these presentations have not been examined by
independent accountants and is not presented in accordance with generally accepted accounting principles (“GAAP”).
These presentations include certain non-GAAP financial measures, as defined in Regulation G promulgated by the
Securities and Exchange Commission. Any references to non-GAAP financial measures are intended to provide
additional information and insight into CIT’s financial condition and operating results. These measures are not in
accordance with, or a substitute for, GAAP and may be different from or inconsistent with non-GAAP financial measures
used by other companies.
For a reconciliation of these non-GAAP financial measures and a list of the transactions and events excluded from the
data herein, please refer to the tables on the following page.
Please refer to the Company’s SEC filings on Forms 10-K and 10-Q for consolidated financial results prepared in
accordance with GAAP.
Data as of or for the period ended September 30, 2005 unless otherwise noted.

$ 5,195.6
$ 5,731.0
$ 5,787.0
Total Tangible stockholders' equity
255.5
253.8
252.5
Preferred capital securities
-
-
500.0
Preferred Stock
4,940.1
5,477.2
5,034.5
Tangible common stockholders' equity
(487.7)
(596.5)
(1,003.8)
Goodwill and intangible assets
(7.7)
(8.5)
(20.5)
Unrealized (gain) loss on securitization investments
41.3
27.1
(15.5)
Other comprehensive loss relating to derivative financial instruments
$ 5,394.2
$ 6,055.1
$ 6,074.3
Total common stockholders' equity
Total Tangible stockholders' equity:
$ 36,189.3
$ 41,313.6
$ 49,483.4
Earning assets
(3,894.6)
(3,847.3)
(4,267.1)
Credit balances of factoring clients
$ 40,083.9
$ 45,160.9
$ 53,750.5
Total financing and leasing portfolio assets
Earning assets:
$ 49,735.6
$ 53,470.6
$ 61,289.9
Managed assets
9,651.7
8,309.7
7,539.4
Securitized assets
40,083.9
45,160.9
53,750.5
Total financing and leasing portfolio assets
249.9
181.0
31.1
Equity and venture capital investments (included in other assets)
918.3
1,640.8
1,848.4
Finance receivables held for sale
7,615.5
8,290.9
9,184.4
Operating lease equipment, net
$ 31,300.2
$ 35,048.2
$ 42,686.6
Finance receivables
Managed assets:
12/31/2003
12/31/2004
9/30/2005
Non-GAAP financial measures disclosed by management are meant to provide additional information and insight relative to trends in the business to investors and, in certain cases, to
present financial information as measured by rating agencies and other users of financial information. These measures are not in accordance with, or a subsitute for, GAAP and may
be different from, or inconsistent with, non-GAAP financial measures used by other companies.
Non-GAAP Reconciliation

Non-Core Items
0.08
17.6
0.0
Commercial Finance
Provision for income taxes
Release of international tax reserves
Q3
2005
(0.06)
(11.9)
(20.0)
Specialty Finance
Other revenue
(Loss) on sale of manufactured housing
Q3
2005
(0.25)
(52.9)
(86.6)
Commercial Finance
Other revenue
(Loss) on sale of commercial and business aircraft
Q3
2005
0.34
69.7
115.0
Corporate
Other revenue
Gain on sale of real estate investment
Q3
2005
(0.02)
(4.4)
(6.8)
Corporate
Other revenue
Retained interest impairment from hurricanes Katrina and Rita
Q3
2005
(0.11)
(23.3)
(35.9)
Corporate
Provision for credit losses
Reserves for hurricanes Katrina and Rita
Q3
2005
(0.08)
(16.5)
(25.2)
Corporate
Provision for restructuring
Provision for restructuring
Q2
2005
0.07
14.4
22.0
Commercial Finance
Other revenue
Gain on sale of business aircraft
Q2
2005
(0.04)
(9.3)
(15.7)
Specialty Finance
Other revenue
(Loss) on sale of manufactured housing
Q4
2004
(0.04)
(8.7)
(14.0)
Corporate
Other revenue
(Loss) on venture capital investments
Q4
2004
0.12
26.8
43.3
Corporate
Provision for credit losses
Release of telecom reserves
Q4
2004
0.12
25.9
41.8
Corporate
Gain on redemption of debt
Gain on call of PINEs debt
Q1
2004
(0.17)
(37.5)
(60.5)
Corporate
Other revenue
Loss on venture capital investments
Q4
2003
0.15
31.2
50.4
Corporate
Gain on redemption of debt
Gain on call of PINEs debt
Q4
2003
EPS Impact
After-Tax
Pre-Tax
Group
P&L Line Item
Item Description
Impact on Income

EXECUTIVE OVERVIEW
Jeffrey M. Peek
Chairman and Chief Executive Officer

Today’s Agenda
Executive Overview
Sales & Marketing
Specialty Finance
Commercial Finance
Credit
Finance
2006 Outlook
Jeff Peek
Walter Owens
Tom Hallman
Rick Wolfert
Larry Marsiello
Joe Leone
Jeff Peek
2

Vision
Relationship-driven
Uniquely positioned in middle market
Unparalleled experience and expertise
The leading global finance company
for the middle market
3

Taking Action Quickly
Align organizational energies
Recruit new talent to complement existing team
Implement risk-based capital allocation
Focus on strategy
4

A Differentiated Corporate Strategy
Focus on most attractive opportunities in commercial
middle market in U.S. and globally
Active portfolio management – enter, grow, fix
Industry specialized customer teams with necessary
expertise and relationship focus
Broad product offering to deepen customer relationship
Reinvest in sales and IT
Leverage scale across businesses to contain costs
Maintain historic discipline (no compromise for growth)
Active management of portfolio exposures
Risk-based capital allocation
Diversification of funding sources including deposits
Sector
Alignment
Client
Focus
Productivity
Management
Credit and Risk
Management
Capital
Discipline
Build to script
5

Organizing Around our Customers
Provides factoring
and other trade
products to
companies in retail
supply chain, with
increasing
international focus
Trade
Finance
Provides longer-
term, large ticket
equipment, leases
and other secured
financing to
companies in rail
and aerospace
industries
Transportation
Finance
Provides
lending, leasing
and other
investment
banking
services to
middle market
companies, with
a focus on
specific
industries
Corporate
Finance
Provides financing
to manufacturers
and distributors
around the globe
Vendor
Finance
Provides
asset backed and
government
secured loans to
consumers and
small businesses,
leveraging broker
and intermediary
relationships
Consumer/
SBL
build to
script
6
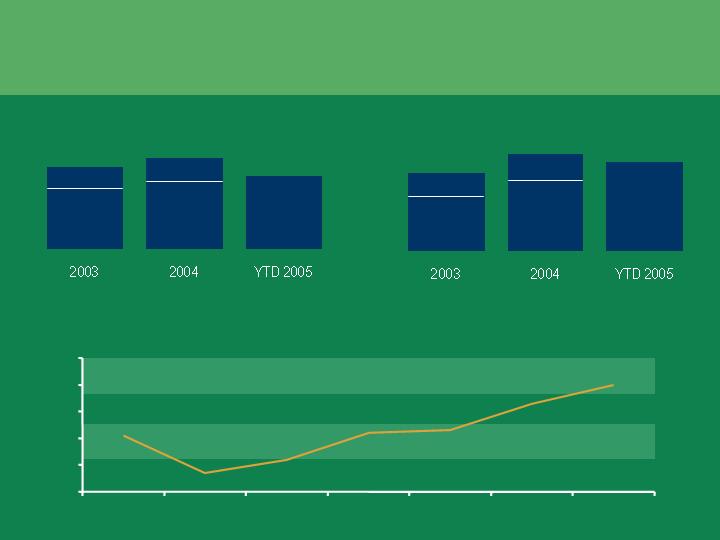
Deliver Strong Financial Results While
Investing in Growth
Return on Tangible Equity
Revenue ($ millions)
Net Income ($ millions)
9 months
9 months
9 months
9 months
2,215
2,452
573
720
1,965
658
7
13%
14%
15%
16%
17%
18%
Q1 04
Q2 04
Q3 04
Q4 04
Q1 05
Q2 05
Q3 05

SALES & MARKETING
Executive Vice President, Chief Sales & Marketing Officer
Walter J. Owens

Articulate growth opportunity
Assess current capabilities
Provide roadmap for growth and 2005 progress
Lay out 2006 sales execution plan
Key Takeaways
2

Huge Opportunity to Grow: Execution is Key
Well Positioned to Grow
Small share of huge
fragmented markets
Strong customer value
propositions
Best-in-class risk capabilities
2%
10%
2000-2004
2008
Increasing
Organic Growth
Rate
* Excludes Venture Capital gains
Revenue Growth*
3

Focusing on Revenue Growth
Available Drivers
Size / Share of addressable market
Channel penetration
Share of wallet
Deals seen
Conversion efficiency
Assimilation effectiveness
Selling face time
Market
Share
Sales Force
Size
Sales
Productivity
Growth
Number of new hires
Turnover optimization
Compensation alignment
Talent strength
4

Well Positioned with Ample Room for
Growth
Note: All figures above are based on 2004 data except railcar share position which is from 2005 figures
#3 position in
aerospace with
2% global
market share
#3 lessor of rail
cars in US with
9% share
Emerging player
in corporate
finance, with
2% share
Top three
independent
equipment lessor
worldwide, 3%
share of global
market
#1 in SBA
lending, with 6%
market share
Top ten originator
of consolidation
loans, but
1% share in
FFELP
Top 20 player in
home lending with
1% market
share
#1 player in US
market, but only
4% of
worldwide
market
Trade
Finance
Transportation
Finance
Corporate
Finance
Vendor
Finance
Consumer/
SBL
5

Commercial Finance
Scaling our Competitive Strengths
Value Proposition
Strong risk structuring capabilities
allow CIT to stand behind our
customers in good and bad times
Specialty Finance
Value Proposition
Superior product and processing
skills delivered in a flexible and
customer focused business model
“CIT acts like a true partner and works
with me to service my customers”
“CIT has unique processing and back
office capabilities”
“GE is transactional, CIT invests in
building relationships”
“CIT has strong risk screening
capabilities”
Quote Source: CIT “Voice of the Customer” Survey
6

Sales Productivity Next Steps
Create and retain long-term profitable relationships
Drive penetration of key intermediaries
Develop a targeted direct calling capability
Lever strong customer relationships to sell “One CIT”
Sales Force Size / Quality
Complete a targeted sales build-out
Build a high performing sales culture
Focusing our Sales Efforts
7

Key Takeaways
Articulate growth opportunity
Assess current capabilities
Provide roadmap for growth and 2005 progress
Lay out 2006 sales execution plan
8

Recent History Tells a Slow Growth Story
Sales Force Headcount
Revenue
Salesperson Productivity
2002
2003
($ billions)
2004
996
2002
2003
2004
1,077
1,081
$2.4
2002
2003
2004
$2.0
$2.3
($ millions)
Flat growth in a very
competitive environment
Played defense coming out of
Tyco ownership
Lack of focus on sales
leadership and sales execution
Performance Drivers
$2.4
$2.2
$2.5
9

Evaluated the “Current” State of Sales
Voice of Sales Survey
800+ responses
Capability Assessment
100% completion rate
Sales Talent Assessment
90%+ sales coverage
10

Sales
Execution
Using lead
generation and
sales automation
tools to find new
customers
Sales
Leadership
Building and
developing sales
forces
Aligning growth
targets with
incentive
compensation
Focusing and
deploying sales force
by industry and
channels
Organization
Alignment
Targeting sales force
on specific market
segments where CIT
is most competitive
Strategic
Planning
And We Identified Key Capabilities to Build
11

Key Takeaways
Articulate growth opportunity
Assess current capabilities
Provide roadmap for growth and 2005 progress
Lay out 2006 sales execution plan
12

Phased Approach to Growth
2005
Phase I
Build Strong
Foundation
Create sales
organization
Energize sales
force
Focus front ends
Implement sales
automation
2006
Phase II
Drive Core Competitive
Advantages
Execute sales
plans
Build out
sales force
Drive productivity
Sell “One CIT”
Expand Core to
Accelerate Growth
2007-2008
Phase III
Drive
customer loyalty
Expand the core
New geographies
New markets
New products
13
13

Energized Sales Team
Communicated
Message
Touched 80% of
sales through 7
global and
regional sales
summits
Aligned CIT to Grow
Risk
Operations
Improved
Alignment
Listened
to Sales
Gained
buy-in and
developed
bottoms up
priorities
14
14

Organized Sales For Growth
Created team
of 8 senior
sales
professionals
Designated
senior sales
leader in all
business units
Implemented
councils to speed
decision making and
prioritization
Sales Councils
Corporate Sales
Chief Sales
Officer
Growth Culture
15

Refocused and Redeployed our Sales Forces
Organized to sell how
customers want
to buy
Controls full range of
products and services
Different coverage
models required for
middle versus
large market
Relationship selling is
incremental
Borrower
size
5
500
Borrower credit quality
Sub-D
AAA
Relationship Accounts
Historical CIT Sweet Spot
Example: Commercial Finance Verticals
($ millions)
16
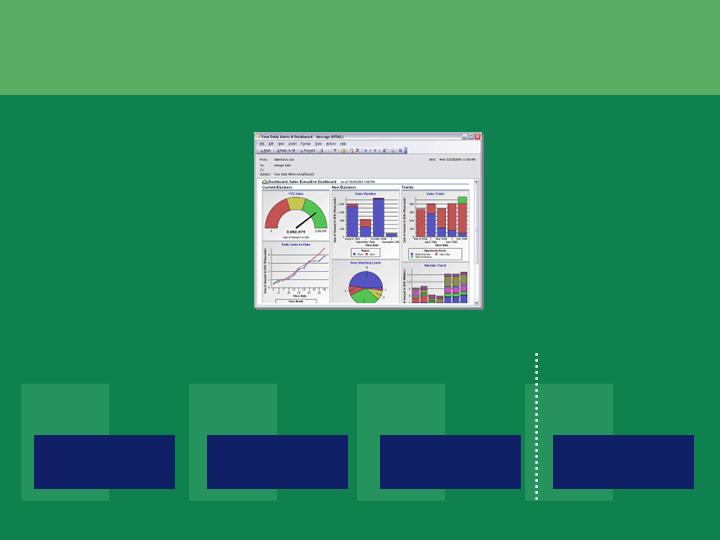
Automated the Front End
Automate / simplify tasks
Increase face time with
customers
Get to the right prospect at
the right time
Market coverage
view
Drivers of wins and
losses
Measure sales force
performance
Benefits for
Salespeople
Benefits for
Sales Managers
May
Jun
Jul
Aug
Sep
Oct
Nov
Dec
2005
Vendor
Evaluation
System Design
System
Implementation
Ongoing Use
We are here
17

Results Starting to Pay Dividends
Sales Force Headcount
Revenue ($ billions)
Sales Person Productivity ($ millions)
Revenues flat in tough pricing
environment
Fees offset softness in volumes
Top graded and turned over 300
sales heads
Hired 500 new sales professionals
Increased industry focus and higher
account penetration offset by new hire
productivity
Performance Drivers
$1.8
9 months
2004
YTD 2005
$2.0
1,077
1,276
$1.7
$1.6
Sep-04
Sep-05
9 months
2004
YTD 2005
18

Key Takeaways
Articulate growth opportunity
Assess current capabilities
Provide roadmap for growth and 2005 progress
Lay out 2006 sales execution plan
19

2006 Priorities Focus on Driving Execution
Execution
Drive
rigorous
execution
Leadership
Leaders own
growth agenda
Align to accelerate
growth
Alignment
Find more
opportunities
Strategy
SALE
20
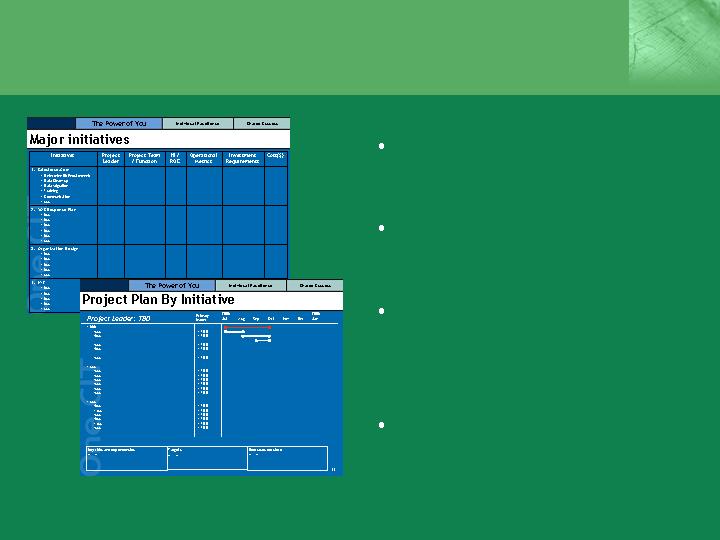
Sales Execution Linked to Strategy
Strategy
New disciplined approach to
sales planning
Key initiatives prioritized and
resourced
Sales leaders own execution
with compensation tied to
performance
Metrics monitor progress
21

Enhancing the Hiring Process
Total Front-Line Sales Talent
1,575
1,275
Finding the Right
People
Hiring Them Quickly
and Efficiently
Assimilating to
Accelerate
Productivity
Competencies
In-house recruiter(s)
Screening process
Interview process
Approval process
On-boarding process
Deal strike zones
Technology support
Sales support
Net Increase
300 People
Alignment
22

Objective
Shorten cycle time for
1st closed deal by 50%
Key Areas of Focus
Business information
Systems and tools training
Deal process
Contact lists
Risk parameters
And Accelerating Productivity
Leadership
23
23
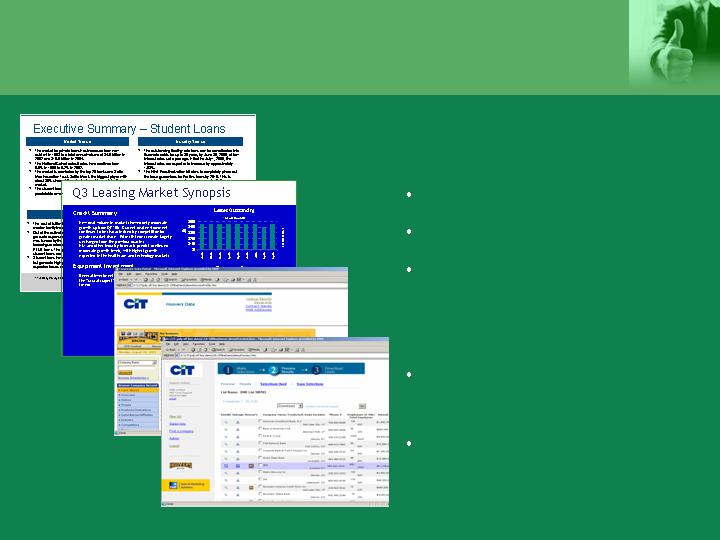
Enhancing Customer Targeting
White space analysis
Market segmentation
Monthly dashboards
Identifying Opportunities
Tools identify high-priority
prospects
Company analyses to
support calling
Targeting Customers
Execution
24

Pilot Project Driving “One CIT”
Industry verticals
Strategic
accounts
High
Low
Complexity
Equity
Sponsors
M&A Group
Cross-BU
programs
Target
marketing
c it pay
BU referral
programs
Multiple Approaches to Driving Share of Wallet
Share Leads
Share
Customer
Databases
Combine
Sales Force
Enterprise
Sell
Alignment
25

Driving Progress with Better Visibility
Are we Seeing the Market?
Deals seen
Deals closed
Is our Sales Force Growing?
Sales force size
Time to first deal
Are we More Productive?
Profit per salesperson
Conversion rates
Penetration rates
26

Growing in 2006 and Beyond
Growing
Market Share
Completing
Sales Force
Build-out
Focusing on
Sales
Execution
+
=
Drive Core
Competitive
Advantages
Expand Core to
Accelerate Growth
2005
Phase I
Build Strong
Foundation
2006
Phase II
2007-2008
Phase III
27

SPECIALTY FINANCE
Thomas B. Hallman
Vice Chairman, Specialty Finance

Key Takeaways
Distinctive value proposition
Efficient operating model
Strong and consistent growth across business groups
Large and growing commercial and consumer customer base
Strategic imperatives to accelerate organic growth
2

Specialty Finance: At-a-Glance
$14 B volume year-to-date
700 sales
professionals
We deliver quantifiable value to vendor and consumer
markets through our core strengths in relationship
management, risk and behavior scoring capabilities and
global servicing reach
29 countries
$27 B managed assets
3,000+ relationships
1.4 M commercial customers
3.6 M consumers
3

Home
Lending
Technology
Construction
Healthcare
Industrial
Student
Lending
Small
Business
Lending
Two Major Business Groups
Consumer / Small Business
(United States)
Vendor Finance
(Global)
Global Insurance Services
CIT Bank (US)
4

Global Capability Supported by Efficient
Shared Services Model
Europe
Dublin, Ireland
Asia Pacific
Hong Kong
South Pacific
Sydney, Australia
Canada
Burlington, ON
United States
Jacksonville, FL
Vendor Finance
Austin, TX
Dell Financial Svcs.
Libertyville, IL
Snap-On Credit
Livingston, NJ
Small Business
Oklahoma City, OK
Consumer Lending
Cleveland, OH
Student Lending
Latin America
Miami Lakes, FL
5
5
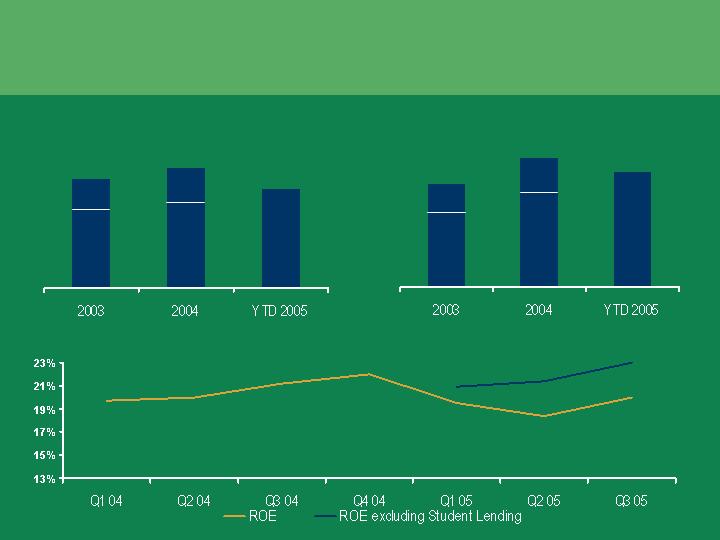
Financial Highlights
Revenue ($ billions)
Net Income ($ millions)
Return on Equity
9 months
9 months
9 months
9 months
1.0
1.1
0.9
261
324
290
6

Vendor Finance: At-a-Glance
CIT Vendor Finance through its market leading leasing and
lending product capability, relationship structuring skills, global
presence, scalable shared services platforms and best-in-class
sales teams provides vendors and intermediaries with financial
solutions to maximize customer sales
$7.2 B volume year-to-date
375 sales
professionals
29 countries
$13.4 B managed assets
7

Strong and Profitable Growth
2003
2004
YTD 2005
Net Income ($ millions)
Volume ($ billions)
2003
2004
YTD 2005
7.2
8.2
9.1
199
251
216
9 months
9 months
9 months
9 months
Vendor Finance ROE: 24% year-to-date
8

Large and Growing Global Market
Other
3%
Asia
16%
North
America
44%
Europe
37%
Total Vendor Leasing Volume = $318 B
Large and fragmented market
Subsectors with significant annual
growth
International markets growing
faster than U.S.
Europe leasing growth 13%
Asia leasing growth 17%
Focused on growth in rapidly
growing sectors and geographies
Source: 2005 World Leasing Yearbook; 2005 Monitor 100
9
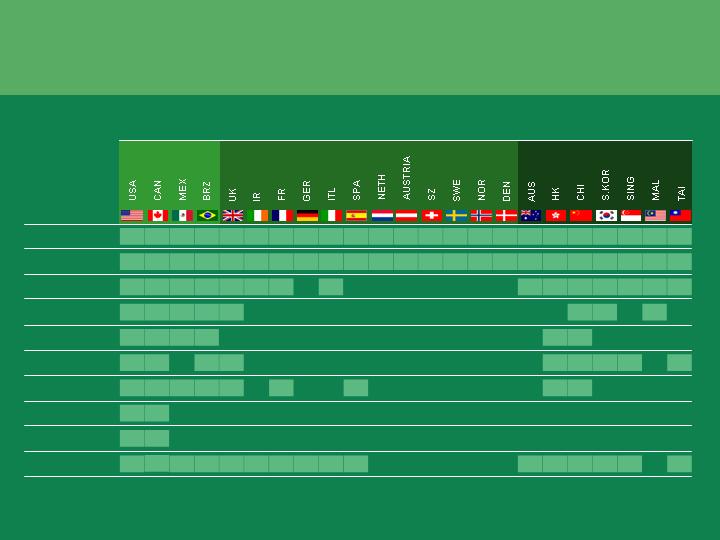
Broad Global Reach
IT
Telecom
Office Equipment
Printing
Construction
Test Equipment
Medical
Tools
Software
Other
Americas
Europe
Asia Pacific
10

New Vendor Relationships
11
11

Vendor Finance: Strategic Imperatives
Expand sales force
Increase penetration of
current relationships
Enter strategic geographies
Upgrade customer facing
technologies
Broaden product offering
12
12

Intermediary relationship management
Technology / credit scoring
Servicing expertise
Liquid
Attractive returns
Countercyclical with commercial
Consumer Dell, Honda etc.
Small Business Snap-on, Avaya etc.
Large / scalable
Fragmented
Government guaranteed
Consumer and Small Business Characteristics
Match our Core Strengths
Markets
Capabilities
Value to CIT
Vendor Enablers
13

Strong Consumer and Small Business Trends
2003
2004
YTD 2005
6.7
4.2
5.7
2003
2004
YTD 2005
74
62
73
Net Income ($ millions)
Volume ($ billions)
9 months
9 months
9 months
9 months
Consumer / Small Business ROE: 12% year-to-date (17% excluding SLX)
14

We deliver value-added lending solutions to mortgage brokers
through a national network of sales offices providing a
comprehensive set of competitive products through
superior customer facing technology and servicing capabilities
Home Lending: At-a-Glance
$4.4 B volume year-to-date
200 sales
professionals
Over 2,000 relationships
$7.8 B managed assets
15

Average FICO 630
90% owner-occupied
100% appraisal review
92% of loans are first liens
No negative amortization loans
Disciplined lending standards define
a sustainable target market
Source: SMR
2004 Sub-prime Broker Originations
Focused Target Market
CIT Target
Market
(~$80 B)
Total Market = $286 B
16
16

Strong Portfolio Demographics
81%
80%
77%
Loan to Value
Loan characteristics:
Borrower characteristics:
72%
Reevaluated Loan
to Value at 7/31/05
46%
72%
86%
% Fixed
$112K
$87K
$61K
Loan size
9
9
11
Length of residence
9
9
10
Length of employment
39%
38%
37%
Debt to income
631
625
624
FICO
12/31/99
12/31/03
9/30/05
17
17

Geographic Diversification
16%
20%
11%
21%
14%
18%
Versus 39%
share of national
sub-prime
volume
Percent of total managed portfolio
18

Low Delinquency vs. Competitors
Source: Loan Performance Service
90+ Delinquency Comparison by Geography
N.E.
Central
New
England
Mid
Atlantic
South
Atlantic
S.E.
Central
S.W.
Central
N.W.
Central
0.0
2.0
4.0
6.0
8.0
10.0%
Mountain
Pacific
CIT
Sub-prime industry
19

Home Lending: Financial Performance
YTD 2005
Volume
Managed assets
Efficiency ratio
Charge-offs
ROE
$4.4 B
$7.8 B
37.8%
0.78%
Mid-teens
20

Well Positioned Against Market Risks
Increased delinquency
and defaults
Primary impact on higher
value areas and coastal
regions
Decrease in
Housing Values
Increase in
Unemployment
Rise in Interest
Rates
Defaults due to increasing
payments (for floating
loans)
46% of portfolio fixed rate
No option ARM or negative
amortization
Average customer
9 years in residence
9 years in current job
Average loan size = $112K
CLTV = 72%
Geographic diversification
Low participation in resort / condo
markets
Impact
CIT Position
21

Expand sales force
Enhance front-end technology
Increase scale
Maintain risk and
target market discipline
Focus on broker channel growth
Home Lending: Strategic Imperatives
22
22

We deliver a broad range of student lending products and
services with distinctive borrower benefits to educational
institutions through a network of dedicated relationship
managers supported through an efficient centralized
processing and servicing capability
Student Lending: At-a-Glance
$1.8 B volume year-to-date
45 sales
professionals
820 partner schools;
direct channels
$4.6 B managed assets
23
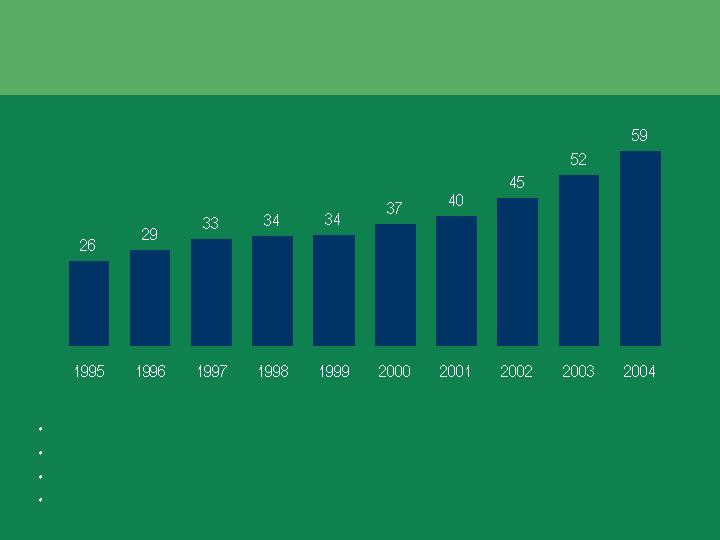
Large and Growing Market
Major Trends
Strong and consistent growth in lending market
Educational costs outpacing inflation
Exponential growth in on-line education
Excluding Sallie Mae, competitors have a small share of market
Total Stafford and PLUS Volume ($ billion)
Source: U.S. Department of Education
24

Rapidly Expanding Partnerships
Partner Schools
Sep-05
2006
820
1000+
551
2004
25
25

Strong Growth
Direct Channel
Volume ($ millions)
26
1,209
9 months 2005
1,761
School Channel
552
359
826
9 months 2004
1,185
26

Leading Web Presence
485,000 registered users
Reaches 4.3% of the market
Top 25 ranked website
Over 350,000 unique visitors
per month
27

Expand school channel
sales force
Enhance web leadership
Broaden product offering
Build best-in-class
servicing capability
Capitalize on cross-sell
opportunities
Student Loan Xpress: Strategic Imperatives
28
28

We leverage our position as market leader in SBA loans
and our experienced sales force to deliver competitively
priced products and value-added advice to small business
entrepreneurs
Small Business Lending: At-a-Glance
$640 M volume year-to-date
80 sales
professionals
500+ relationships
$1.3 B managed assets
29

#1 Player in Growing Market
Major Trends
Strong growth rate – CAGR >10%
Market still relatively fragmented – top 25 have <50% share
SBA’s role changing resulting in greater barriers to entry for new and under-scaled competitors
Local banks not experts in SBA loans – emerging correspondent model
0
5
10
15
$20
2000
2001
2002
2003
2004
2005
Market Volume ($ billions)
2004 Competitor Originations ($ millions)
0
200
400
600
800
$1,000
CIT
Wells
Wachovia
US BanCorp
Source: U.S. Small Business Administration; CIT Estimates
30
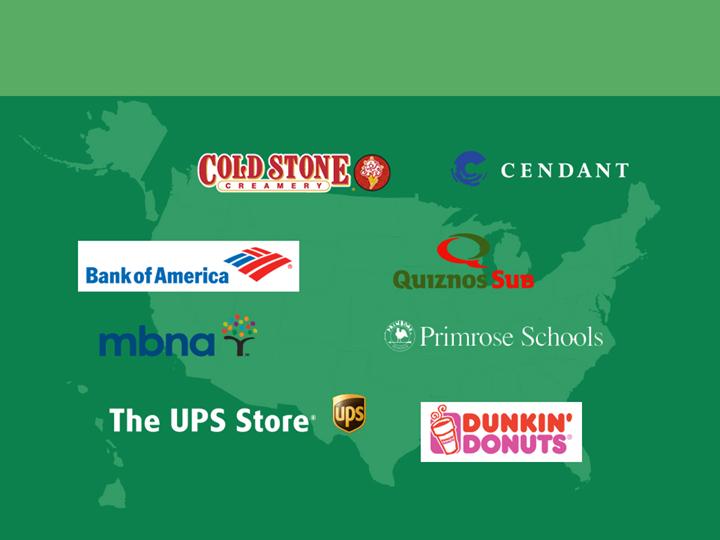
Major Alliances and Intermediaries
31
31

Expand leadership position
in SBA lending
Maintain leading position in
current segments
Enter adjacent small
business markets
Broaden product offering
Capitalize on cross-sell
opportunities
Small Business Lending: Strategic Imperatives
32
32

Specialty Finance: Strategic Summary
Leading global player
Vendor
Finance
Consumer/
Small Business
Lending
Home Lending
Major share player in target markets
Sales force
New relationships
Increased penetration
Geographic expansion
Student Loan Xpress
Major share player in school channel
Small Business Lending
#1 SBA player with leading position
in target SB markets
Sales force
Increased penetration
Technology leadership
Sales force
New partnerships
Consolidated in-house
servicing
Sales force
Product expansion
New industry segments
33

COMMERCIAL FINANCE
Vice Chairman, Commercial Finance
Frederick E. Wolfert

Creating a new model for the 21st Century
Focused on large and attractive markets
Enabling growth while maintaining risk discipline
Positioned to deliver strong results through all cycles
Key Takeaways
2

Commercial Finance: At-A-Glance
Profile
Strong middle market focus
Global reach – 60 countries
29 offices – U.S., Canada,
Europe and China
2,250 employees
57,000 client relationships
Financial Highlights
$34 billion in managed assets
$8 billion in YTD loan and lease
originations
$31 billion in YTD factoring
volume
A Recognized Leader in Commercial Finance
3
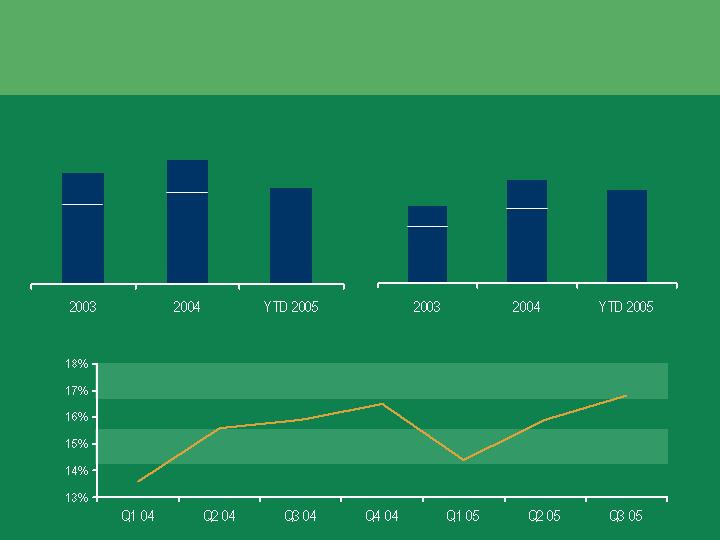
Financial Highlights
Revenue ($ billions)
Net Income ($ millions)
9 months
9 months
9 months
9 months
Return on Equity
1.1
1.3
1.0
356
472
430
4

Aerospace
Commercial Services
Businesses
Trade Finance
Transportation
Finance
Corporate
Finance
54,000 client relationships
340 sales professionals
900 client relationships
70 sales professionals
2,150 client
relationships
40 sales professionals
Profile
$486 M revenue
$195 M net income
15% ROE
$188 M revenue
$107 M net income
11% ROE
$311 M revenue
$128 M net income
26% ROE
Financial Highlights
(YTD 2005)
Business Groups
Rail Resources
5
Energy & Infrastructure
Healthcare
Business Capital
Global Sponsor
Finance
Construction
Diversified Industries
Communications,
Media & Entertainment
5
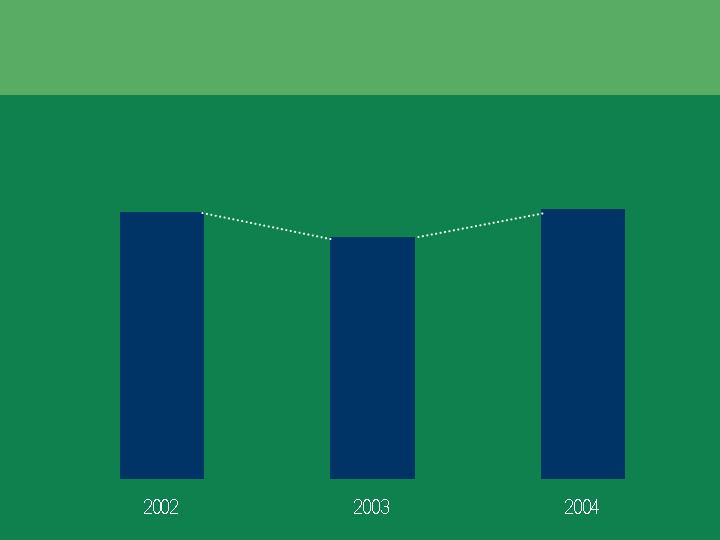
The Growth Challenge
Loan and Lease Volume ($ billions)
8.6
7.8
8.7
6

Observations
Unclear growth strategy
Uncoordinated market coverage
Limited advisory services
Built-in silos – difficult to work together
Focus on ROA vs. Risk Adjusted ROE
Initial Business Assessment
Fortress balance sheet
Experienced management team
Broad industry – specific knowledge
Product and risk structuring acumen
Relationship orientation – delivers on
commitments
Loyal customer base
Strong brand
Scale and global reach
Strengths
7

The Business Model
Do we have the right
model and the right
talent to execute the
strategy?
Key Question: How To Drive Growth?
The Market
What is the size of
the opportunity?
How will we
compete?
The Customer
How do we
differentiate our
offering in the market
and provide
customers the value
they demand?
8
Banking
Dramatic Change in Competitive Landscape
Commercial Finance & Leasing
Banks consolidating and moving up-market
Disrupted client relationships
Shifting strategies
1995-2005
9

Huge Opportunity For Growth
Small shares in large fragmented markets
< 2% U.S. Market share
Market
Opportunity
Source: Bain & Company
10
Aerospace
$328 B
Business Capital
$203 B
Healthcare
$159 B
Construction
$104 B
Global Sponsor Finance
$94 B
Energy
$62 B
Media, Communications & Entertainment
$34 B
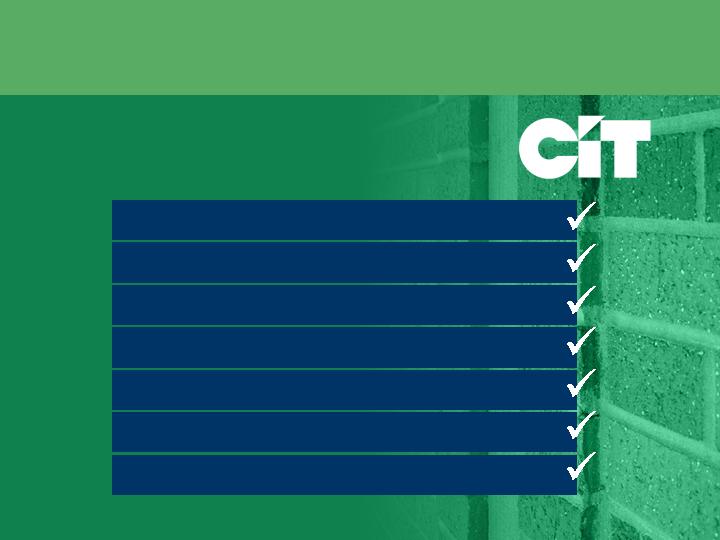
Customer Requirements
Staying Power through all Cycles
Financial Strength and Capacity
Deliver on Commitments
Access to Decision Makers
Broad Product Offering
Specific Industry Expertise
Experience in Middle Market Lending
11
11
Blueprint for the Future:
“Client-Centric, Market-Focused Model”
Relationship Managers
Industry “Thought Leaders”
Consultative approach
Develop/manage CIT relationship
Coordinate execution
12
Equipment Finance
& Leasing
Factoring
Asset Based Lending
Corporate Finance
Structured / Project Finance
Advisory Services
Commercial Real Estate
Finance
Products and Services
Target Industries
Direct Coverage
Communications, Media &
Entertainment
Construction
Retail
Healthcare
Energy
& Infrastructure
Aerospace
Diversified Industries
Rail Resources
Private Equity
Sponsors
Intermediaries
and Hedge Funds
Equipment
Manufacturers and
Distributors
Financial
Institutions
Channel Partners
12
Focused on Growth and Productivity
Specific Design
Drives efficiency – leverages technology
and platforms for growth + productivity
Delivers the full value of CIT to customers
– integrates company offerings
Assigns our best sales resources to the right
customers + maximizes effectiveness
Leverages deep product and
industry knowledge across units
Promotes better transparency and
performance management
Provides “One CIT” face to the customer
Expected Benefits
13

“CIT Strike Zone”
Junk
B-
$10M
$50M
$1B
$100B+
B+
BB-
BBB
AAA
Credit rating
Revenue
CIT Target Market
Commercial
Finance
Companies
Regional Banks
Hedge Funds
Finance Companies
Local Banks
Large Banks
Investment Banks
14
Hedge Funds
14

Bulge Bracket
Investment Banks
M&A Advisory
Merchant Banking
Capital Markets
Fairness Opinions
Commercial Real Estate Services
High Yield Underwriting
Equity Underwriting
Investment Banking Services Strategy:
“Bringing Wall Street to Main Street”
CIT Investment
Banking Services
Boutique
Investment Banks
Driving increased fee revenue and incremental loan volume
15
Attracting Top Talent
Significant investment in people to support our growth strategy
Recruited 60 new senior executives – averaging 15+ years experience
New leadership complements existing CIT veterans
16

Completing
Transformation
Moved Aerospace
International to
Ireland
Announced
$2.2 billion Airbus
order
Acquired HBCC and
PLM rail cars
Announced
Canadian
restructuring
Announced
disposition of out of
production aircraft
Launched
Commercial Real
Estate Advisory
Completed Strategic
Planning process
Sold $900 million
corporate aircraft
portfolio
Restructured
Equipment Finance
and Business Credit
Launched Strategic
Planning process
Announced
Commercial Finance
reorganization
Acquired RCM
(SunTrust factoring)
Established Shared
Services
Q4
2005
Q3
2005
Q2
2005
Q1
2005
Major Actions
2006 +
Execute
17
17

Select Business Updates
Trade
Finance
Aerospace
Healthcare
Rail
Resources
Equipment
Finance
18
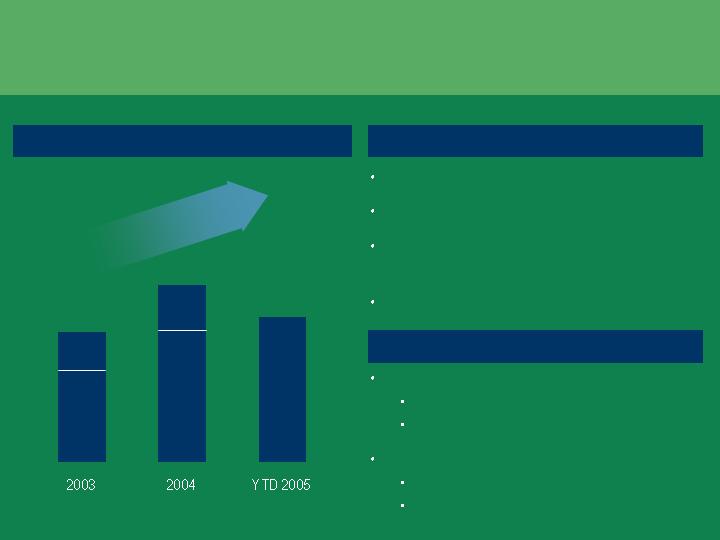
#1 Market position
Expanded international platform
Deep industry expertise in retail and
consumer goods
Experienced sales and marketing team
$4 billion per month in factoring volume
Trade Finance
Highlights
Growth Agenda
Expanding in adjacent sectors
Textiles, home furnishings and furniture
Housewares, electronics and hardware
Focusing on international expansion
U.S. – Asia and Europe – Asia trade flows
Pursuing major global alliances
28
38
31
Factoring volume ($ billions)
9 months
9 months
19
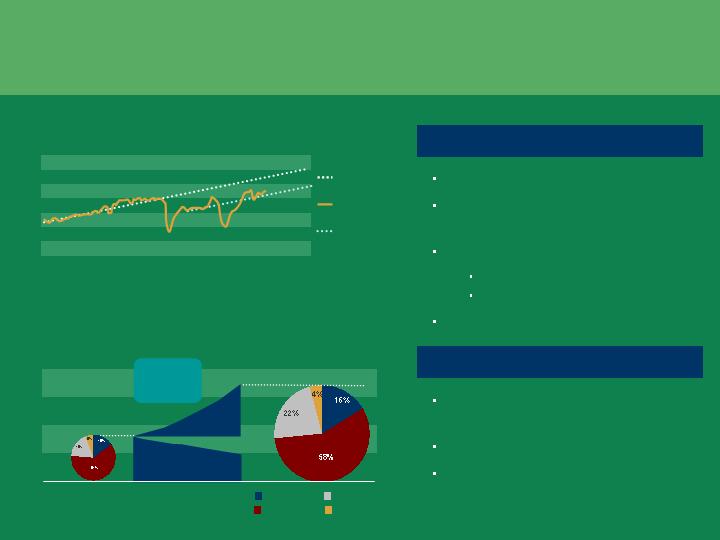
Aerospace
World Air Travel Now Above 2000 Levels
26
0
240
220
200
180
160
140
120
100
1998
1999
2000
2001
2002
2003
2004
2005
Long-term
trend
Actual
trend
Future
trend
Source: Boeing
The World Fleet Will More Than Double
Regional
Twin Aisle
Single Aisle
747 and larger
2004
2024
40,000
30,000
20,000
10,000
7,200
Replacements
2024
35,300 airplanes
2004
16,800
airplanes
25,700
New Aircraft
Deliveries
# 3 market position
Investing in commercial fleet to meet
increased customer demand
Transferred international to Dublin
Moved closer to customers
Optimized tax structure
Repositioned corporate aircraft business
Highlights
Growth Agenda
Launch Corporate Finance strategy
targeting aerospace and defense sector
Opportunistic “spot market” purchases
Expand international corporate aircraft
20
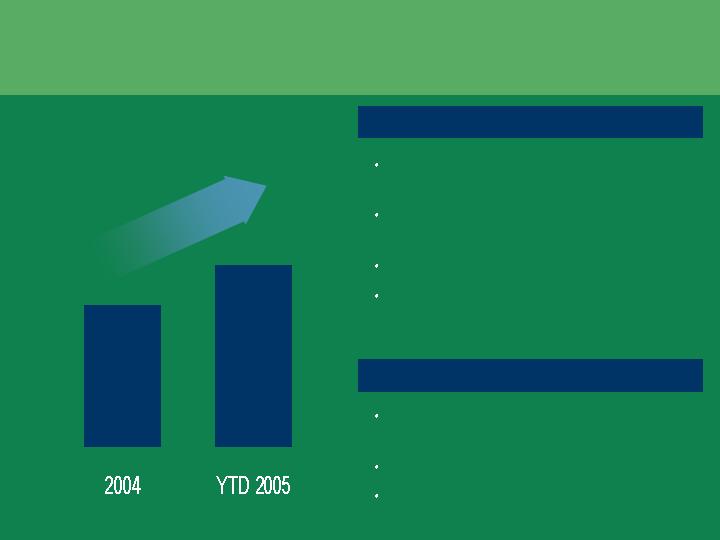
Investing in technology to deliver best-in-
class service and improved efficiency
Expand direct sales force
Drive sales productivity
Equipment Finance
Highlights
Installed new leadership team with deep
industry expertise
Refocused on core industries –
Construction and Diversified Industries
Increased focus on ROE
Improving cost structure and operating
efficiencies
ROE
8.0%
10.2%
Growth Agenda
21

Organized for success
Hospitals
Long-Term
Care
Outpatient
Managed
Care
Healthcare
Highlights
Launched healthcare
vertical
Hired top industry talent
Grew FTE’s from 20
to 140
Accelerated build-out via
HBCC acquisition
$1 billion in asset growth
>15% of U.S. GDP and growing
Estimated 2004 Industry Financings: $159 billion
Growth Agenda
Leverage 2005
investments and execute
Cross-sell HBCC
customer base
$49
Hospitals
$25
Long-Term Care
$7
Outpatient
$10
Vendor
$8
Physician / Dental Practice
$20
Life Sciences
$15
Managed Care
$25
Specialty Pharma / Medtech
22

Growing the fleet…
…And lengthening terms to lock in
growth and profits
Highlights
#3 market position
Youngest fleet in industry,
80% of fleet < 9 years
Diversified mix of car types
Excellent service reputation
Full economic utilization: 99%
Strong ROEs, with positive trends
* Owned or serviced
Rail Resources
Rail cars under lease*
(thousands)
Average renewal term
(months)
Dec-00
32
Dec-04
52
Sep-05
83
22
38
48
Dec-00
Dec-04
Sep-05
Growth Agenda
Maximize rental rates as existing
leases renew
Seek opportunistic bulk purchases
Launch Corporate Finance
strategies
23

A Diverse Portfolio of Growth Businesses
15%+
10-15%
Aerospace
Business Capital
Communications, Media &
Entertainment
Diversified Industries
Energy & Infrastructure
Global Sponsor
Healthcare
Construction
Rail Resources
Trade Finance
Projected earnings growth rate
24
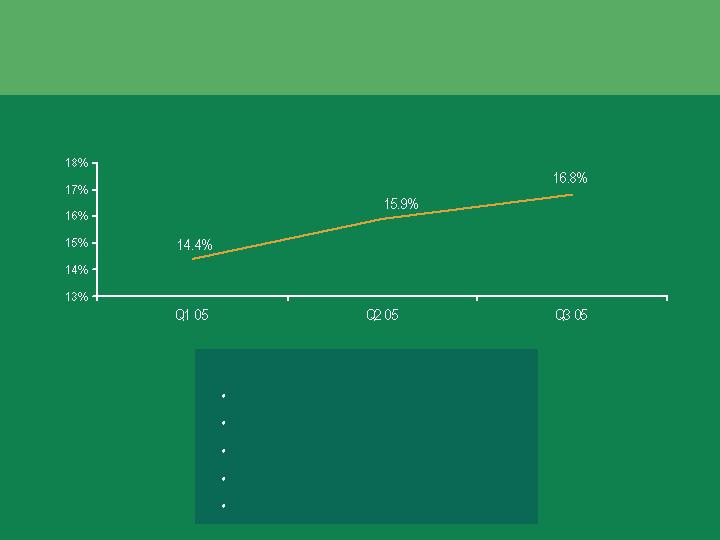
Delivering on Commitments while
Transforming the Business
Return on Equity
Strong momentum going into 2006
New business volume up 30% YTD
Strong pipeline
Earnings up 23% YTD
Credit quality considerably improved
Increasing rate environment favorable
25

New Model for the 21st Century
Improved go-to-market synergies
Sharper focus on growth opportunities
Increased fee income – Investment Banking
Enhanced risk management – domain expertise
Improved transaction execution
Scale and productivity gains
Benefits to CIT
Market focused
Customer centric
End-to-end solutions
Relationship driven
Leverages CIT’s strengths
The Right Model at the
Right Time
Industry expertise valued
Capital expenditures increasing
Large and growing financing needs
Fragmented financing market
Global scope
Focus on Large and
Attractive Markets
26
26

CREDIT OVERVIEW
Lawrence A. Marsiello
Vice Chairman & Chief Lending Officer

Disciplined underwriting practices
Diverse portfolio with broad spread of risk
Strong credit metrics
Supporting growth initiatives
Preparing for the next credit downturn
Key Takeaways
2

Broad and Diverse Portfolio
Northeast
Geography
Europe and Asia
Canada
Southwest
Southeast
Midwest
West
* No other collateral type greater than 3%
Asset / Collateral Type
A/R and
Inventory
Revolvers
Technology
Manufacturing
Construction
Transportation
Land
Other*
RE- Residential
Transportation
Air
RE-Industrial
Government
Subsidized
Healthcare
3

Wide Array of Industries
* No other industry served greater than 3%
Manufacturing
Commercial Air
Home Lending
Transportation
Services
Consumer Other
Construction
Wholesale
Communication
Healthcare
Other*
Retail
Education Lending
4

Client Ratings Reflect Middle Market Focus
1-10 internal risk grading system
Focus on transactions just below
investment grade
Good portion of high quality assets
Little change in our client risk profile
Consistent market focus
Continuously refine underwriting criteria
A-AAA
BBB
BB
B
Below B
Risk grading based on credit quality of obligor and transactional details
(collateral coverage, tenor, etc.)
15%
13%
40%
28%
4%
5

Minimal Concentration Risk
Data based on individual transaction sizes
6
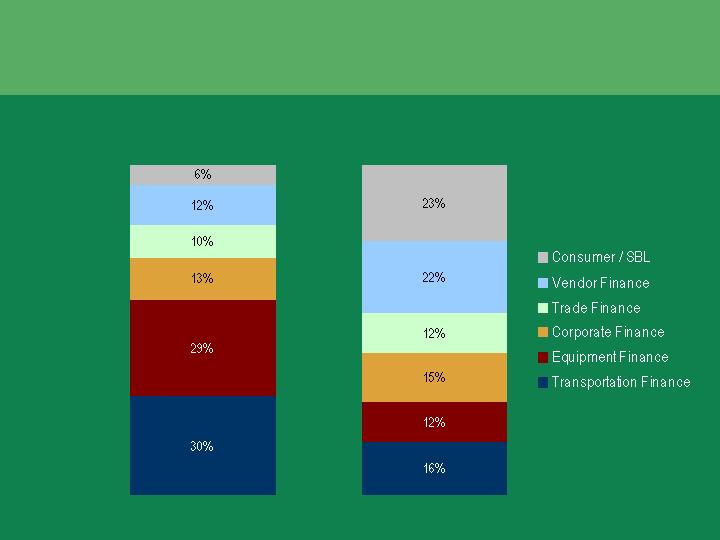
Mix Shift Toward Small Ticket Businesses
Sep-95
Sep-05
$17B
$61B
Composition of Managed Assets
7

Rank Industry Amount ($ millions) Business Facility Grade
Top 10 Exposures: Less than 5% of
Portfolio Assets
Data based on aggregate client exposures
8
1.
Retail
360
Trade Finance
AA
2.
Retail
302
Trade Finance
BBB
3.
Technology
288
Vendor Finance
A
4.
Retail
230
Trade Finance
BB+
5.
Energy
223
Corporate Finance
CCC
6.
Retail
192
Trade Finance
A
7.
Retail
153
Trade Finance
A+
8.
Retail
144
Trade Finance
A-
9.
Retail
139
Trade Finance
BB
10.
Construction
130
Equipment Finance
BB

Top 10 Non-Accruals: Represents 0.3% of
Finance Receivables
Data based on aggregate client exposures
9
Rank
Industry
Amount ($ millions)
Business
1.
Aerospace
50
Transportation Finance
2.
Aerospace
33
Transportation Finance
3.
Telecom
15
Corporate Finance
4.
Telecom
12
Corporate Finance
5.
Construction
12
Equipment Finance
6.
Manufacturing
11
Corporate Finance
7.
Telecom
9
Equipment Finance
8.
Healthcare
8
Corporate Finance
9.
Energy
7
Corporate Finance
10.
Aerospace
7
Transportation Finance
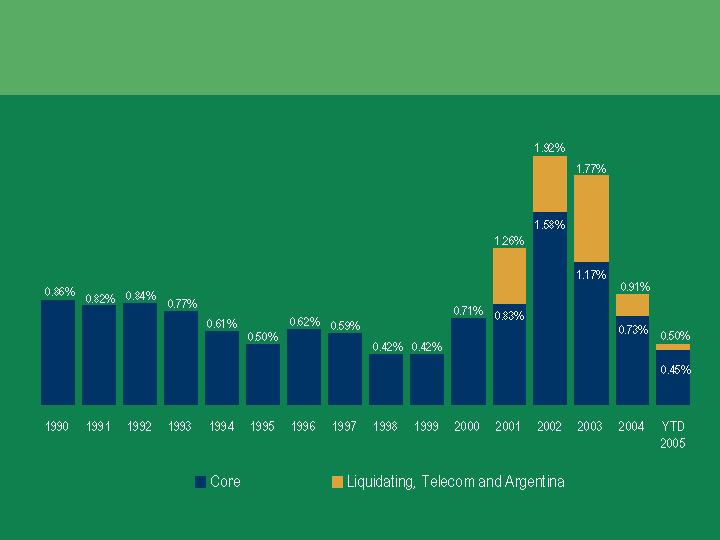
Charge-offs Are Below Historic Run-Rate
10
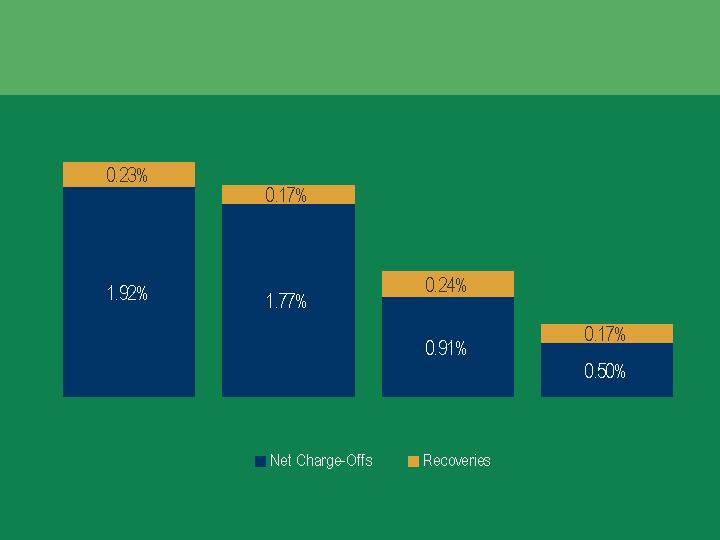
Charge-offs and Recoveries Strong
2002
2003
2004
YTD 2005
11
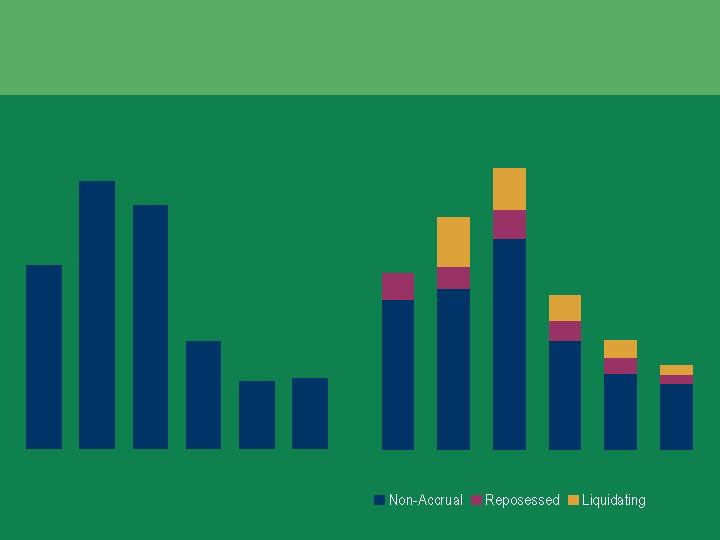
Forward Markers Remain Strong
3.24%
2.47%
3.93%
2.16%
1.54%
1.28%
Owned Delinquency 60+ days
Non-Performing Assets
Dec-00
Dec-01
Dec-02
Dec-03
Dec-04
Sep-05
Dec-00
Dec-01
Dec-02
Dec-03
Dec-04
Sep-05
1.76%
1.73%
2.16%
3.63%
3.90%
2.98%
12
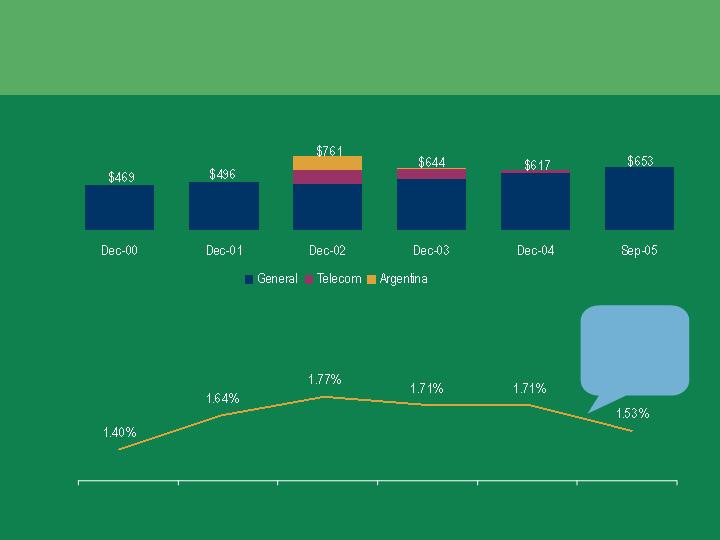
Solid Loan Loss Reserves
Decrease
reflects addition
of student
lending assets
Reserves ($ millions)
General Reserves as % of Finance Receivables
Dec-00
Dec-01
Dec-02
Dec-03
Dec-04
Sep-05
13
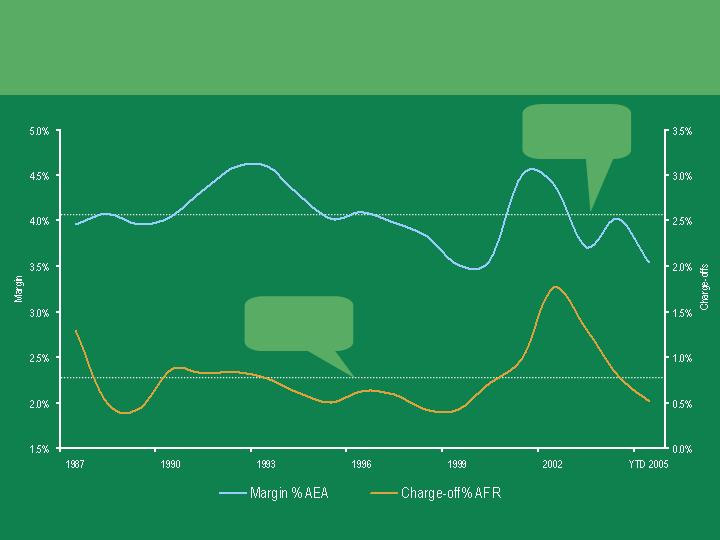
Margin and Charge-offs Are Correlated
18 Year
Avg = 0.79%
18 Year
Avg = 4.08%
14

Factors Influencing Pricing and Structure
Pricing
Influx of
New
Lenders
Robust
Market
Liquidity
Historically
Low Defaults
Rising
Interest
Rates
Rising
Energy
Prices
Structure
15

Forward View of Credit
Default rates start creeping up
Consolidated losses average 0.70% to
0.80% through the cycle
2006 losses below that range
16

Key Objectives Going Forward
Prepare for the next downturn
Support growth initiatives
Launching
new products
Entering
new industries
Expanding
internationally
17

Credit Risk Management Enhancements
New analytics
Installing a powerful Risk
Management System
Creating a two-tiered Risk
Grading System reflecting
probability of default and
loss given default
React quicker
Expanding syndication and
hedging activities to shed
excessive risk and gain
insight on market returns
Do what we do better
Developing common
definitions and methodologies
Linking credit grades to
default rates in pricing models
Driving capital allocation
down to the portfolio and
obligor level
18

Close Working Relationship Between
Credit and Sales
Standardize and streamline credit review process
Pre-approve underwriting criteria and credit risk tolerances
Enhance the knowledge base and skill sets of both credit and sales staff
Accelerate decisioning without cutting corners
19
Preparing for next
downturn
Supporting growth
initiatives
Summary
Key Attributes
Key Initiatives
Disciplined underwriting practices
Diverse portfolio with broad
spread of risks
Solid loan loss reserves
Proactive portfolio
risk management program
20

CFO PRESENTATION
Joseph M. Leone
Vice Chairman & Chief Financial Officer

Strong capital position and disciplined treasury management
Broad based and high quality revenue sources
Further opportunities to enhance productivity and funding
2006 funding and capital update
Key Takeaways
2

Organic
Asset Growth
Opportunistic
Acquisitions
More Than
Supports
Strong Capital Generation
ROTE
16%+
Dividends
15% to 20%
Capital Generation
>12%+
less
equals
3

Increased dividend 23% in Q1 2005
Repurchased shares to cover options
Freed $200 million in capital
Bought back $500 million common
stock – 15% cost
Accelerated Healthcare build-out
Acquired HBCC
Action-Oriented Capital Management
Strong internal capital generation
Reduced discontinued
portfolios $600 million
Issued $500 million of preferred
stock – 6% cost
Sold $900 million of
low-returning business aircraft
Improved ROTE to over 17%
4

Disciplined Capital Allocation
$6.5
$6.8
($ billions)
$0.3 billion
excess capital
Rail
Corporate
Finance
Aerospace
Equipment
Finance
Trade
Finance
Vendor
Finance
Consumer
SLX
$1.0
Required
Actual
0
1
2
3
4
5
6
7
Business
Goodwill
Equity
Equity
5

Building Funding Flexibility
Commercial Paper / Total Debt
Alternate Liquidity* / Short Term Debt
*Alternate Liquidity includes available bank facilities, asset backed conduit facilities and cash
~
6
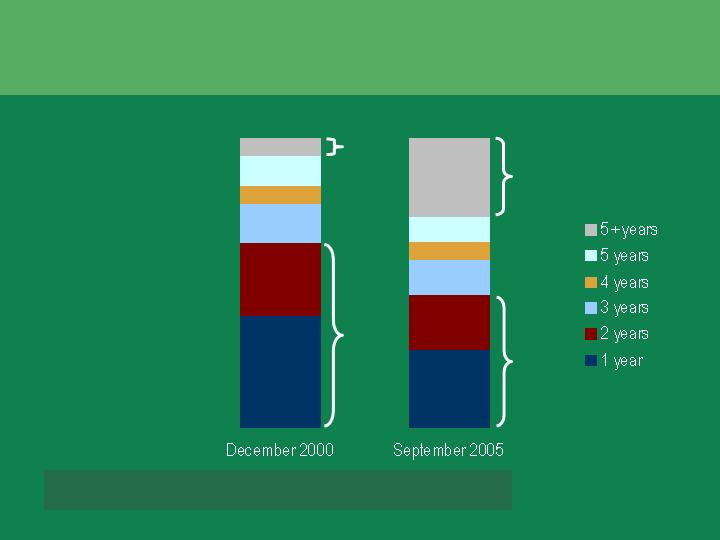
Extending Debt Maturities
28
35
1.9 years
3.5 years
Average Term
6%
64%
46%
27%
($ billions)
7

Next Funding Source: CIT Bank
Current
2006 and Beyond
Industrial Bank
Facilitates originations
Standard documentation
Used for Dell Financial
Services program
$400 million of vendor assets
Chartered in 2000
Broaden focus
A funding source
Target 10% of funding
Access Federal Home
Loan Bank
Student loans and mortgages
Timing: Early 2006
8

3.2 years
43%
2.4 years
48%
$24B
Fixed
$25B Debt
Amount
Funding (after swaps)
57%
Portfolio
Term
Term
Portfolio
Amount
4.1 years
2.6 years
52%
$26B
Floating
Assets
Effective Matched Funding
$19B Debt
$6B Equity
9
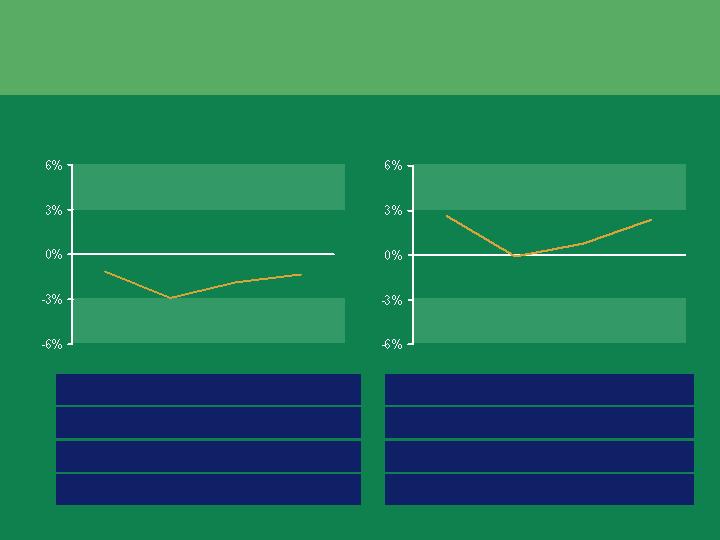
Measured Risk Analysis
Accounting measure
Short-term measurement
Earnings sensitivity = $14 million after-tax
Minimal rate sensitivity
Economic measure
Long-term measurement
Equity sensitivity = $111 million
Consistent risk taking
Margin at Risk*
Equity at Risk*
* Based on an immediate 100 basis point rate increase
2002
2003
2004
Q3 05
2002
2003
2004
Q3 05
10
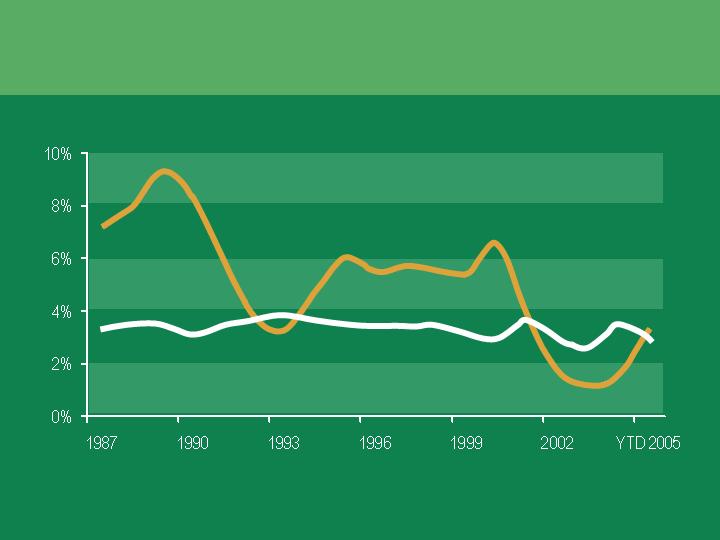
Stable Margin In All Rate Environments
3 month LIBOR
Risk Adjusted Margin
11
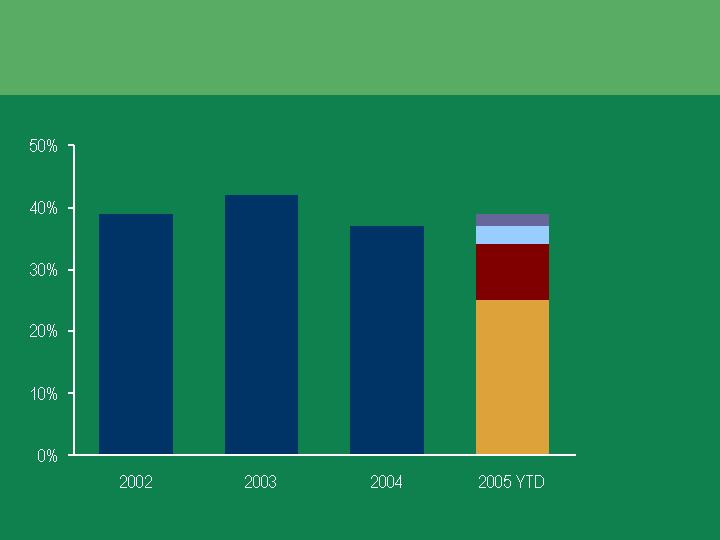
High Percentage of Non-Spread Revenue
Fees and other
Equipment gains
Factoring commissions
Securitization gains
12
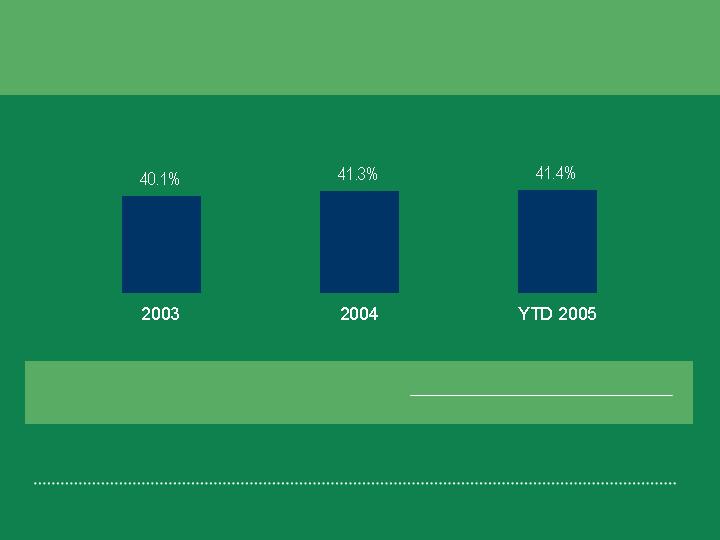
2005
2004
Operating Group
38%
46%
43% ex. SLX
39%
45%
Efficiency Ratios (incl. corp. allocation)
3-Year Asset
CAGR
6%
Commercial Finance
15%
Specialty Finance
Growing Efficiently
Consolidated Efficiency Ratio
40.2%
ex. SLX
13

In Process
Evaluating 20 processing platforms and systems
Leveraging shared services organizations
Examining offshore opportunities
Developing more automated credit adjudication
Remodeling the Back Office
Completed
Eliminated 17 transaction processing platforms
Consolidated 9 servicing centers
Reduced procurement spending
Servicing international aerospace in Dublin (tax savings)
14
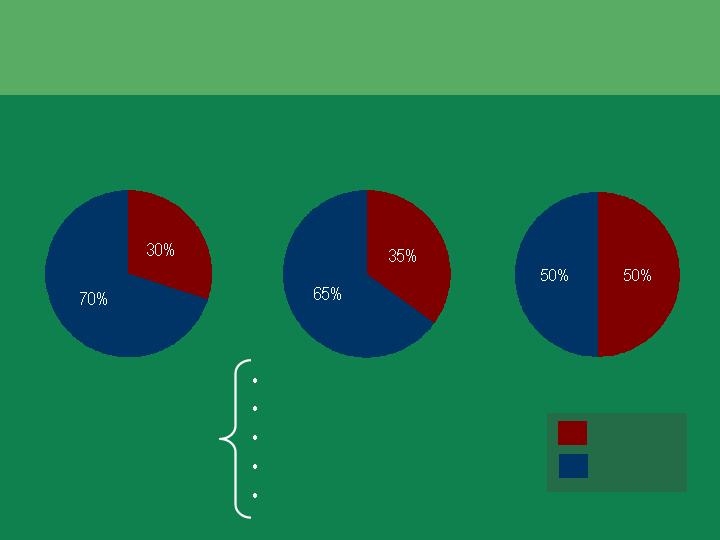
Investing in Revenue Generation
2004
Longer Term
YTD 2005
Front-end
Back-end
Investing Back
Office Savings in
Sales Force
M&A and Real Estate Advisory
Sponsor Finance
Syndication
Insurance
Expense Composition
15

Minimal Impact From Expensing Stock Options
2 - 3%
2%
3%
Pro-Forma
Dilution
$3.09
$3.35
EPS
16

Leasing Businesses
Utilization of Net Operating Loss
Dublin Aerospace Initiative
Improved International Vendor Profitability
Efficient Tax Management
$329
$483
Accounting Provision for Taxes
$64
$115
Cash Taxes Paid
< 35%
35%
39%
Effective Tax Rate
2006 (E)
YTD 2005
2004
Income Taxes: Another Expense
Why it is decreasing
Why cash is lower
17
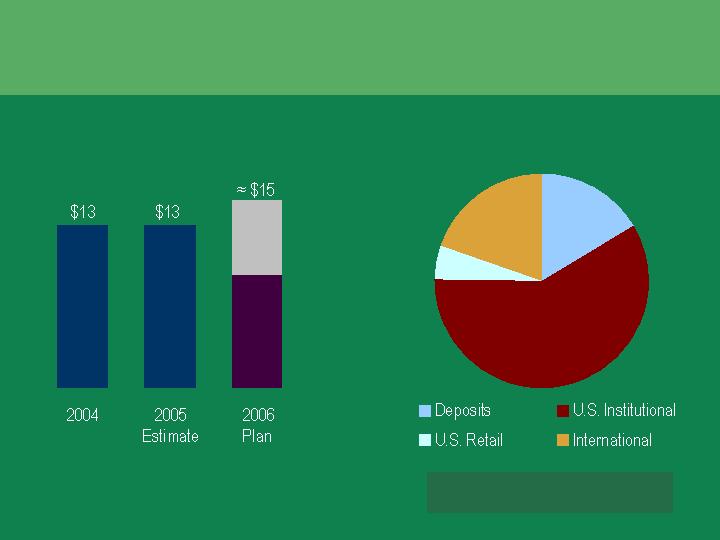
Our 2006 Funding Plan
$2
$8-10
$3
$1
Unsecured Term Issuance
($ billions)
Growth
Maturities
$6
$9
2006 Sources
($ billions)
No significant change in planned commercial
paper or securitization levels
18

Our Case for a Ratings Upgrade
Governance
Experienced management with strong ISS ratings
Profitability
Quality, stable earnings, high returns
Credit Quality
Strong culture, performance and reserves
Funding
Robust liquidity, diverse sources and experienced
Capital
Strong base with disciplined management
Premium name with leadership positions
Franchise
19

Support
Quality
Growth
Even Stronger Fundamentals
20
Broader Based Revenues
More Diverse Funding
Improving Productivity
Enhanced Capital Position
Long-
standing
Credit and
Control
Culture
20

2006 OUTLOOK
Jeffrey M. Peek
Chairman and Chief Executive Officer

What You Have Heard Today
Vision &
Strategy
Sales & Marketing
Business Execution
Risk Management & Capital Discipline
Trade
Finance
Transportation
Finance
Corporate
Finance
Vendor
Finance
Consumer /
SBL
2

Targets
16.4%
27%
YTD 2005
Updated
Initial
15%
Mid-teens
16%+
ROTE
20%+
EPS growth
Exceeding Our 2005 Targets
3

Execution of our Strategy Will
Drive 2006 Results
Trade Finance, Vendor Finance, Corporate Finance
initiatives critical to success
Invest in Energy, Advisory and Technology
Grow sales force from 1,275 to 1,575
Increase pipeline visibility through Salesforce.com
Leverage strategic account program
Pursue next round of expense opportunities, including
offshoring and further platform consolidation
Invest in technology
Expand analytics, syndication and hedging
Maintain historic discipline (no compromise for growth)
Further diversify funding including brokered deposits
through CIT Bank
Implement risk-based capital allocation at customer level
Sector
Alignment
Client
Focus
Productivity
Management
Credit and
Risk Management
Capital
Discipline
build to script
4

Looking Ahead
Trade
Finance
Maintain #1 position
in U.S. market
Leadership in
attractive non-
traditional segments
Build international
platform
The leading global finance company for the middle market
Transportation
Finance
Leadership position
(top 3 player)
The most modern
fleet
Participation in
emerging air markets
(Asia and India)
Increasing
penetration of non-
spread products
Corporate
Finance
Partner of choice for
middle market
companies
A leader in each
target customer-
focused market
Increasing
penetration of non-
spread revenue
Vendor
Finance
The #1 global provider
of vendor finance
Increasing penetration
of current partners
within and across
geographies
Scale global back-
office platforms
Consumer/
SBL
#1 provider of sub-
prime home lending
with targeted brokers
The #1 SBA lender in
U.S.
Leader in student
lending (top 5 player)
Continued provider of
growth and earnings
diversification
5