Investor Meetings: Europe
February 8-10, 2006
Exhibit 99.1

Notices
Forward Looking Statements
Certain statements made in this presentation that are not historical facts may constitute "forward-looking" statements under the Private
Securities Litigation Reform Act of 1995, including those that are signified by words such as "anticipate", "believe", "expect", "estimate", “target”,
and similar expressions. These forward-looking statements reflect the current views of CIT and its management and are subject to risks,
uncertainties, and changes in circumstances. CIT's actual results or performance may differ materially from those expressed in, or implied by,
such forward-looking statements. Factors that could affect actual results and performance include, but are not limited to, potential changes in
interest rates, competitive factors and general economic conditions, changes in funding markets, industry cycles and trends, uncertainties
associated with risk management, risks associated with residual value of leased equipment, and other factors described in our Form 10-K for
the year ended December 31, 2004 and our Form 10-Q for the quarter ended September 30, 2005. CIT does not undertake to update any
forward-looking statements.
Non-GAAP Financial Measures
The data provided in this presentation have been modified from our previously reported periodic data, including but not limited to, exclusion of
certain non-core transactions and non-recurring events, because management believes that the data presented herein better reflects core
operating results. As such, the data may vary from comparable data reported in CIT’s forms 10-K and 10-Q.
This presentation includes certain non-GAAP financial measures, as defined in Regulation G promulgated by the Securities and Exchange
Commission. Any references to non-GAAP financial measures are intended to provide additional information and insight into CIT's financial
condition and operating results. These measures are not in accordance with, or a substitute for, GAAP and may be different from or
inconsistent with non-GAAP financial measures used by other companies.
For a reconciliation of these non-GAAP measures to GAAP and a list of the transactions and events excluded from the data herein, please refer
to the appendix within this presentation or access the reconciliations through CIT's Investor Relations website at investor.relations@cit.com.
Data as of or for the period ended December 31, 2005 unless otherwise noted.
2
Overview
Specialty Finance
($29 billion)
Vendor Finance
Consumer / Small Business Lending
Commercial Finance
($34 billion)
Trade Finance
Corporate Finance
Transportation Finance
Equipment Finance
Client Focus
Life Cycle Financing
Disciplined Underwriting
Seasoned Leadership
Long standing customer relationships
Full product and service offering
Cash flow and collateral expertise
Broad and deep management team
Leading global finance company
with $63 billion of managed assets
3

International Operations
$13.2 (21% of CIT)
$1.4
$0.6
$1.8
$4.7
$4.7
Managed Assets (billions)
Total
Aerospace
Vendor Finance
Other
Aerospace
Vendor Finance
Australia
Aerospace
Trade Finance
Vendor Finance
Asia
Aerospace
Corporate Finance
Vendor Finance
Europe
Aerospace
Corporate Finance
Equipment Finance
Trade Finance
Vendor Finance
Canada
Primary Businesses
Country
1,500 employees servicing international operations
4

2005 – A Strategic Year
Performed rigorous strategic assessment of our business
Realigned portfolios around market sectors
Invested in high return / high growth opportunities
Acquired three businesses
Ordered 39 aircraft valued at $2.8 billion
Created Strategic Advisory Services group to accelerate fee income growth
Divested $1.7 billion of low return / low growth businesses
Reinvigorated sales culture
Enhanced shareholder value
Completed $500 million share repurchase program
Increased quarterly dividend by 25%
5

2005 – A Record Year
Very strong credit performance
0.60%
0.91%
Net Charge-offs
Increased 160 basis points
14.2%
12.6%
ROE
Exceeded 16% target
16.5%
13.9%
ROTE
Record earnings, up 23%
$882 M
$720 M
Net Income
Record asset levels
$63 B
$53 B
Managed Assets
Record new business originations
$32 B
$24 B
Volume
Comment
2005
2004
Metric
6

2005 – A Year of Improving Returns
Improving
Reflects student lending
Exceeds hurdle
Improving
Improving
Exceeds hurdle
Exceeds hurdle
Comment
14.2%
12.6%
Overall CIT ROE
9.4%
14.9%
Specialty Finance – Consumer
23.8%
21.8%
Specialty Finance – Commercial
10.5%
8.0%
Equipment Finance
11.3%
10.5%
Transportation Finance
19.3%
22.2%
Corporate Finance
27.1%
25.7%
Trade Finance
2005
2004
Segment
7

2006 Priorities
Execute upon our growth strategies
Focus on productivity through technology
Maintain traditional disciplines
8

2006 Growth Drivers
Healthcare
Asset
Generation
Strategic Advisory Services
Fee
Generation
Syndications
Communications, Media &
Entertainment
Global Sponsor Finance
Aerospace
Student Loan Xpress
International
Global Insurance
Restructuring
9

Sales Force Execution is Key to Growth
Established a
corporate sales
office providing
direction and
oversight
Designated
Chief Sales
Officers in
all business
units
Implemented a
company wide
customer
management
system,
Salesforce.com
Aligned our sales
incentive plans
with growth
strategies
10

International Growth Agenda
Continue to build upon aerospace platform
Scale pan-European vendor operations
Expand Trade Finance (factoring) in Asia
Leverage recently acquired UK banking license
Build upon our leading equipment leasing position in China
11

Supporting Our Growth
Investing in technology to maximize the customer relationship
Salesforce.com (customer relationship database)
Credit adjudication and risk analysis software
Web-based applications
Re-directing investment from back-end to front-end
Front-end
Back-end
2004
2005
Longer Term
12

Furthering Commitment to Traditional Disciplines
Credit
Maintain prudent reserve position
Expand syndication and portfolio management activities to manage excess risk
Expect 2006 credit losses to be less than 80 basis points
Funding
Continue to match fund the portfolio
Increase funding from international capital markets
Leverage CIT Bank’s deposit-taking capability
Capital
Drive portfolio optimization
Explore further capital structure efficiencies
Continue to return capital to shareholders
13

2006 – The Year of Execution
Clearly defined our strategic
imperatives by business
Augmented leadership
Re-aligned around the customer
Rounded out our products and service
offerings
Energized the sales force
Organic volume benefits from the hiring
of sales professionals
Non-spread income reflects addition of
Strategic Advisory Services
Efficiency improves as revenue growth
accelerates
Funding diversity enhanced by deposit
base growth
Portfolio initiatives result from capital
discipline
2005 Actions
2006 Drivers
14

2006 Earnings Guidance
Target**
15%
$4.65 - $4.75
ROE
EPS*
*Includes estimated stock options expense of $0.08-$0.10 per share
**Guidance as provided on January 18, 2006. Reproduction of this slide should not be construed as an affirmation or update of that guidance.
15

Capital and Liquidity Management

Commitment to Strong Debt Ratings
Corporate Ratings
Stable
A
R-1 Low
DBRS
Outlook
Long Term
Short Term
Fitch
S&P
Moody’s
Stable
A
F1
Stable
A
A-1
Stable
A2
P-1
17

Cash and Equivalents
Commitment to Strong Balance Sheet
Cash balance is ample
Maintain a minimum balance of $500 million
0.8
2.0
2.0
2.2
3.7
Loan Loss Reserve to Net Charge-offs
1.2
0.9
1.4
2.3
2.5
Reserves reflect risk
Strong coverage ratios
Capital supports asset base
9.5% Tangible Capital to Managed
Assets verses 9.0% requirement
Tangible Capital Base
18
Dec-01
Dec-02
Dec-03
Dec-04
Dec-05

Organic
Asset Growth
Opportunistic
Acquisitions
More Than
Supports
Strong Tangible Capital Generation
ROTE
17%+
Dividends
15% to 20%
Capital Generation
>13%+
less
equals
19
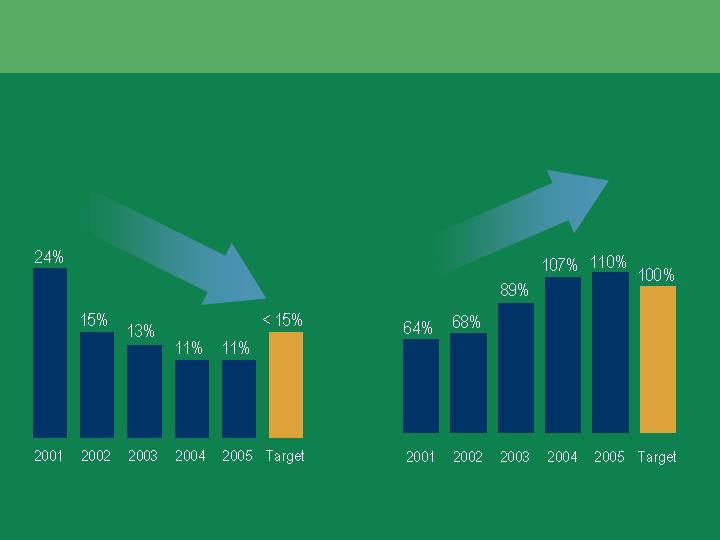
Building Funding Flexibility
Commercial Paper / Total Debt
Alternate Liquidity* / Short Term Debt
*Alternate Liquidity includes available bank facilities, asset backed conduit facilities and cash
20

Unsecured Facilities
Committed Liquidity Facilities
Renewed Q1 2005
All term facilities with 3 years or longer to
expiration
No Mac Clause
1 Financial Covenant: Net worth >$4.0B
Well Over 100% CP Coverage
Apr 2009
$ 2.1B
Facility Expiration
Total
$ 6.5B
Mar 2006
A$ 0.2B
Oct 2008
2.1B
Apr 2010
2.1B
$9.3 billion of committed asset-backed facilities
Facilities cover a variety of asset classes (Equipment Finance, Vendor Finance,
Trade Receivables, Home Equity, Student Loans)
$4.8 billion of available capacity provides supplemental liquidity
Ability to structure facilities in other asset classes (Asset Based Loans, SBA
Loans, Rail)
Secured Facilities
21
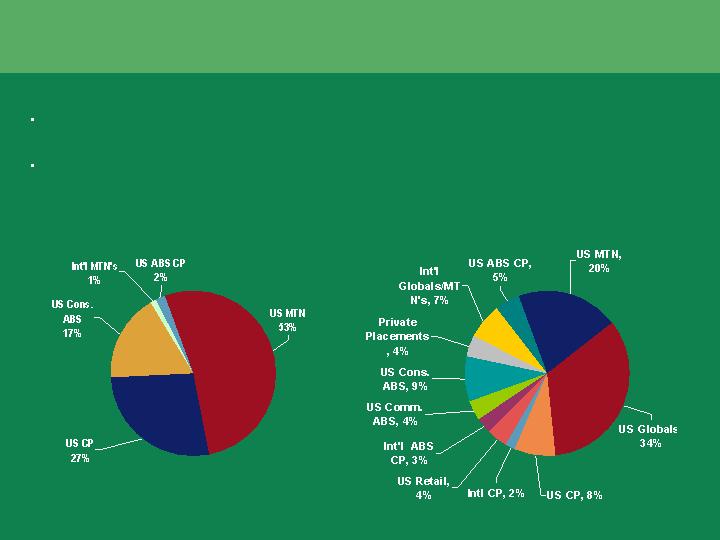
Funding Diversity
December 31, 1998
December 31, 2005
CIT takes great care in ensuring depth and diversity of its funding sources
We have dramatically expanded and diversified our funding composition
22

Effective Matched Funding
3.4 years
44%
$20B Debt
2.8 years
49%
$26B
Fixed
$26B Debt
Amount
Funding (after swaps)
56%
Portfolio
Term
Term
Portfolio
Amount
4.3 years
3.2 years
51%
$26B
Floating
Assets
$6B Equity
Margin at Risk
Value at Risk
After-tax impact of $15 million (liability sensitive)
After-tax impact of $51 million (asset sensitive)
Risk Metrics*
*Sensitivity to immediate 100 basis point rate increase
23
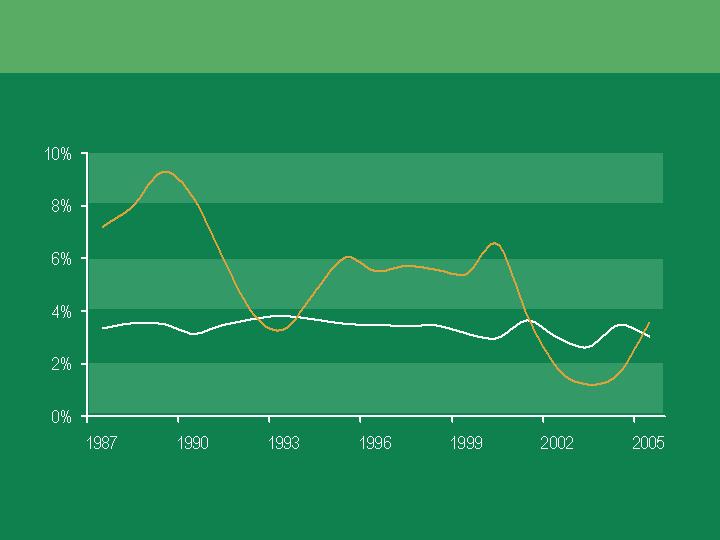
Stable Margin In All Rate Environments
3 month LIBOR
Risk Adjusted Margin
24
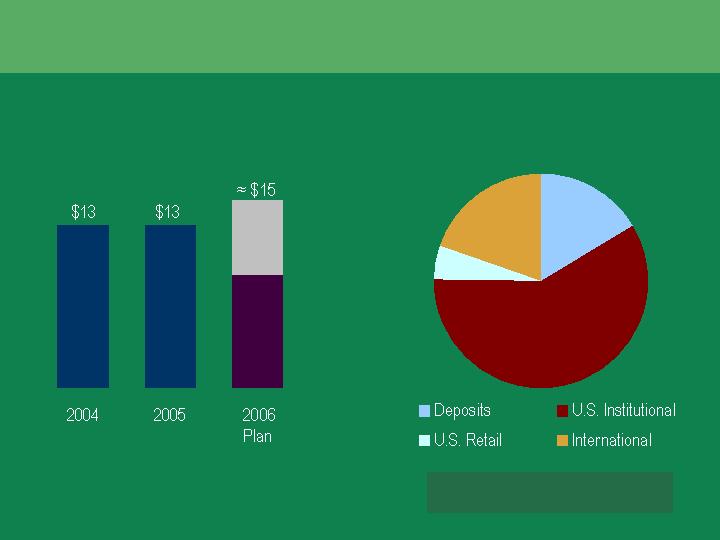
2006 Funding Plan
$2
$8-10
$3
$1
Unsecured Term Issuance
($ billions)
Growth
Maturities
$6
$9
2006 Sources
($ billions)
No significant change in planned commercial
paper issuance
Secured Issuance: $ 4-6 billion
25

A Compelling Investment Opportunity
Differentiated strategy focused on global middle-market opportunities
Well positioned to grow in a fragmented market place
Reinvigorated sales and marketing platform focused on high quality
revenue growth
World class credit and risk management capabilities
Strong business momentum heading into 2006
26
26