
Forward Looking Statement
Certain statements made in these presentations that are not historical facts may constitute “forward-looking” statements
under the Private Securities Litigation Reform Act of 1995, including those that are signified by words such as “anticipate”,
“believe”, “expect”, “estimate”, “target”, and similar expressions. These forward-looking statements reflect the current
views of CIT and its management and are subject to risks, uncertainties, and changes in circumstances. CIT’s actual
results or performance may differ materially from those expressed in, or implied by, such forward-looking statements.
Factors that could affect actual results and performance include, but are not limited to, potential changes in interest rates,
competitive factors and general economic conditions, changes in funding markets, industry cycles and trends,
uncertainties associated with risk management, risks associated with residual value of leased equipment, and other
factors described in our Form 10-K for the year ended December 31, 2005 and our Form 10-Q for the quarter ended
September 30, 2006. CIT does not undertake to update any forward-looking statements.
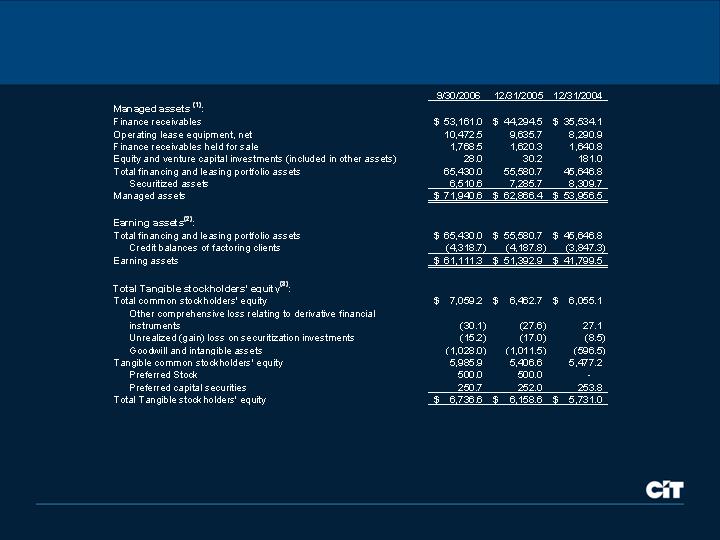
The data provided in these presentations have been modified from our previously reported periodic data, including, but not
limited to, the exclusion of certain non-core transactions and nonrecurring events, because management believes that the
data presented herein better reflects core operating results. As such, the data will vary from comparable data reported in
CIT’s Forms 10-K & 10-Q. The data provided in these presentations have not been examined by independent accountants
and is not presented in accordance with generally accepted accounting principles (“GAAP”).
These presentations include certain non-GAAP financial measures, as defined in Regulation G promulgated by the
Securities and Exchange Commission. Any references to non-GAAP financial measures are intended to provide additional
information and insight into CIT’s financial condition and operating results. These measures are not in accordance with, or
a substitute for, GAAP and may be different from or inconsistent with non-GAAP financial measures used by other
companies.
For a reconciliation of these non-GAAP measures to GAAP and a list of the transactions and events excluded from the
data herein, please refer to the tables on the following page.
Please refer to the Company’s SEC filings on Forms 10-K and 10-Q for consolidated financial results prepared in
accordance with GAAP.
Data as of or for the period ended September 30, 2006 unless otherwise noted.

Noteworthy Items
(0.03)
(5.5)
(8.5)
Corporate
Provision for restructuring
Provision for restructuring
Q3
2006
(0.04)
(9.2)
(15.0)
Transportation Finance
Other revenue
(Loss) on sale of non-strategic assets
Q3
2006
(0.02)
(3.6)
(5.8)
Transportation Finance
Interest expense
(Loss) on debt termination
Q3
2006
0.28
55.6
0.0
Transportation Finance
Provision for income taxes
Release of deferred tax liabilities
Q3
2006
0.03
6.5
0.0
Corporate
Provision for income taxes
Tax adjustment on planned NOL utilization
Q1
2006
(0.04)
(7.4)
(11.1)
Corporate
Provision for restructuring
Provision for restructuring
Q1
2006
0.08
17.0
0.0
Commercial
Provision for income taxes
Reversal of deferred tax liability
Q4
2005
(0.06)
(12.9)
(22.7)
Corporate
Other revenue
Loss on select derivative transactions
Q4
2005
(0.03)
(6.7)
(11.0)
Corporate
Operating expenses
Early termination fee on NYC lease / Legal Settlement
Q4
2005
0.13
26.8
44.3
Vendor Finance
Other revenue
Gain on sale of micro-ticket leasing point of sale unit
Q4
2005
(0.04)
(8.1)
(14.3)
Corporate
Other revenue
Loss on Restatement of select derivative transactions
Q3
2005
0.08
17.6
0.0
Transportation Finance
Provision for income taxes
Release of international tax reserves
Q3
2005
(0.06)
(11.9)
(20.0)
Vendor Finance
Other revenue
(Loss) on sale of manufactured housing
Q3
2005
(0.25)
(52.9)
(86.6)
Transportation Finance
Other revenue
(Loss) on sale of commercial and business aircraft
Q3
2005
0.34
69.7
115.0
Corporate
Other revenue
Gain on sale of real estate investment
Q3
2005
(0.02)
(4.4)
(6.8)
Corporate
Other revenue
Retained interest impairment from hurricanes Katrina and Rita
Q3
2005
(0.11)
(23.3)
(35.9)
Corporate
Provision for credit losses
Reserves for hurricanes Katrina and Rita
Q3
2005
(0.01)
(2.5)
(4.2)
Corporate
Operating margin
Other minor restatements (timing difference)
Q2
2005
0.14
30.9
52.4
Corporate
Other revenue
Gain on Restatement of select derivative transactions
Q2
2005
(0.08)
(16.5)
(25.2)
Corporate
Provision for restructuring
Provision for restructuring
Q2
2005
0.07
14.4
22.0
Transportation Finance
Other revenue
Gain on sale of business aircraft
Q2
2005
0.01
2.5
4.2
Corporate
Operating margin
Other minor restatements (timing difference)
Q1
2005
0.07
14.7
27.7
Corporate
Other revenue
Gain on restatement of select derivative transactions
Q1
2005
(0.04)
(9.3)
(15.7)
Vendor Finance
Other revenue
(Loss) on sale of manufactured housing
Q4
2004
(0.04)
(8.7)
(14.0)
Corporate
Other revenue
(Loss) on venture capital investments
Q4
2004
0.12
26.8
43.3
Corporate
Provision for credit losses
Release of telecom reserves
Q4
2004
0.12
25.9
41.8
Corporate
Gain on redemption of debt
Gain on call of PINEs debt
Q1
2004
(0.17)
(37.5)
(60.5)
Corporate
Other revenue
Loss on venture capital investments
Q4
2003
0.15
31.2
50.4
Corporate
Gain on redemption of debt
Gain on call of PINEs debt
Q4
2003
EPS
Impact
After-Tax
Pre-Tax
Segment
P&L Line Item
Item Description
Impact on Income
Non-GAAP Reconciliation
Non-GAAP financial measures disclosed by management are meant to provide additional information and insight relative to trends in the business to investors and, in certain cases, to
present financial information as measured by rating agencies and other users of financial information. These measures are not in accordance with, or a substitute for, GAAP and may
be different from, or inconsistent with, non-GAAP financial measures used
by other companies.

Overview
Jeffrey M. Peek
Chairman & Chief Executive Officer
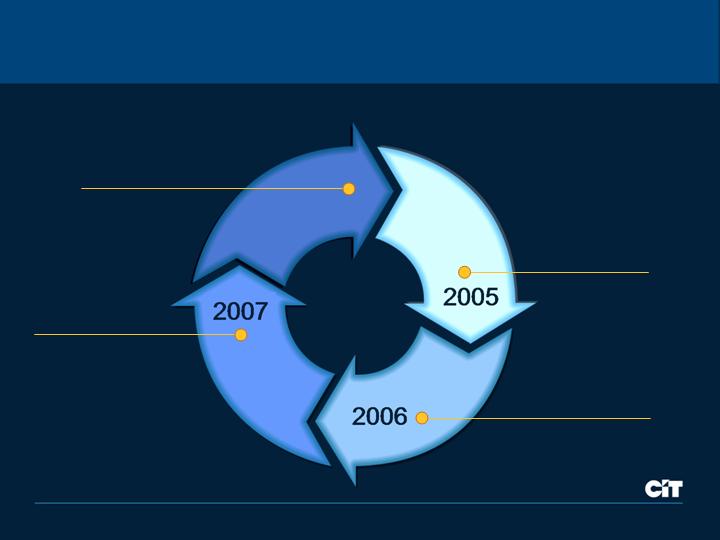
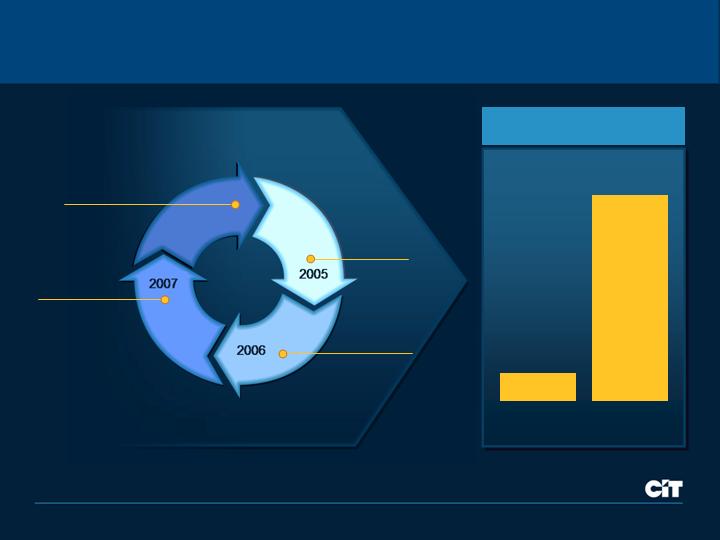
Transforming Vision into Reality
Vision
The leading global finance company in the middle market
2004
Introduced
Operating
Principles
ROE
One CIT
RPM
2005
Set
Strategic
Framework
Productivity
Management
Credit and
Risk
Management
Capital
Discipline
Client
Focus
Sector
Alignment

Reorganized for Growth
Entered new markets and
expanded our offerings
Aligned around customer needs
Developed industry focused
teams
Established sales culture
Focused on back-office
efficiencies
Furthered credit and capital
disciplines
Trade
Finance
Transportation
Finance
Corporate
Finance
Vendor
Finance
Consumer /
SBL
Factoring and other trade products to
companies in retail supply chain, with
increasing international focus
Longer-term, large ticket equipment
leases and other secured financing to
companies in rail, aerospace and
defense industries
Lending, leasing and other services to
middle market companies, with a
focus on specific industries
Financing solutions to manufacturers
and distributors around the globe
Loans to consumers and small
businesses, leveraging broker and
intermediary relationships
Expanded Origination
Platforms
Broadened Product and
Service Offerings
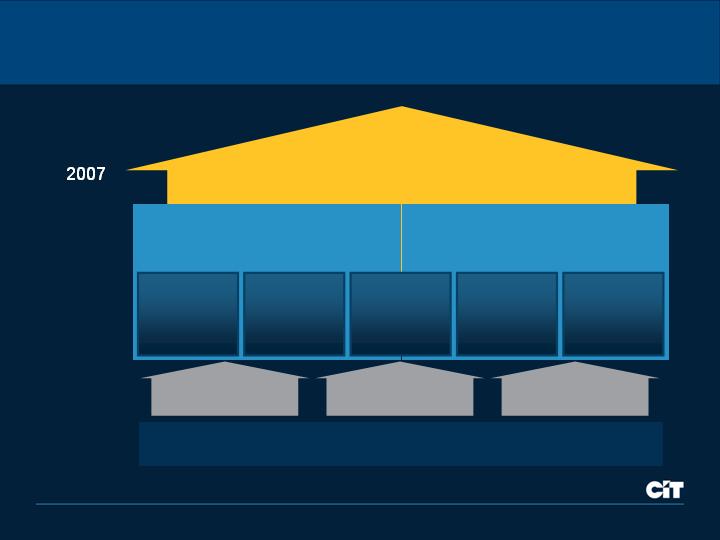
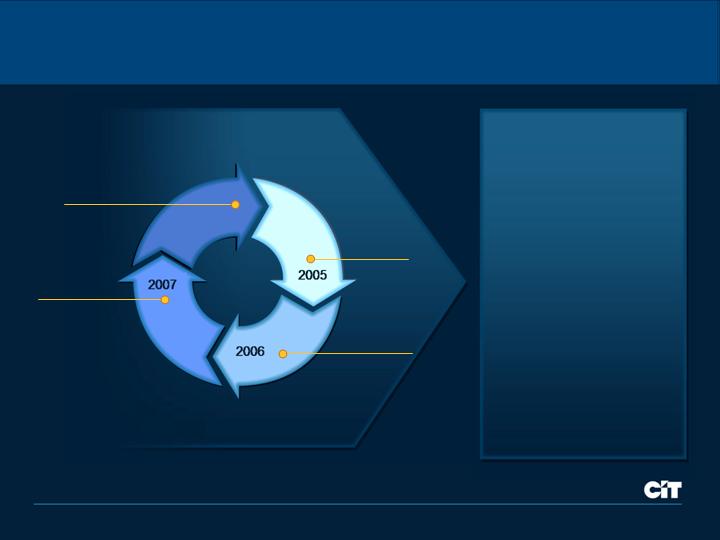
Transforming Vision into Reality
Vision
The leading global finance company in the middle market
2004
Introduced
Operating
Principles
ROE
One CIT
RPM
2005
Set
Strategic
Framework
2006
Built Growth
Engine
Productivity
Management
Credit and
Risk
Management
Capital
Discipline
Client
Focus
Sector
Alignment
2006 Building the Growth Engine
Expanded Asset Origination Capabilities
Enhanced market coverage through sales
force build-out — substantially complete
Developed strategic relationships to leverage
third party origination platforms
Developed Platform for Growth
Expanded into 21st century growth sectors
Increased products and services offerings
Grew capital markets distribution capabilities
Continued growth outside of North America
Volume
($ Billions)
38%
2005
9 mos.
2006
9 mos.
22
30
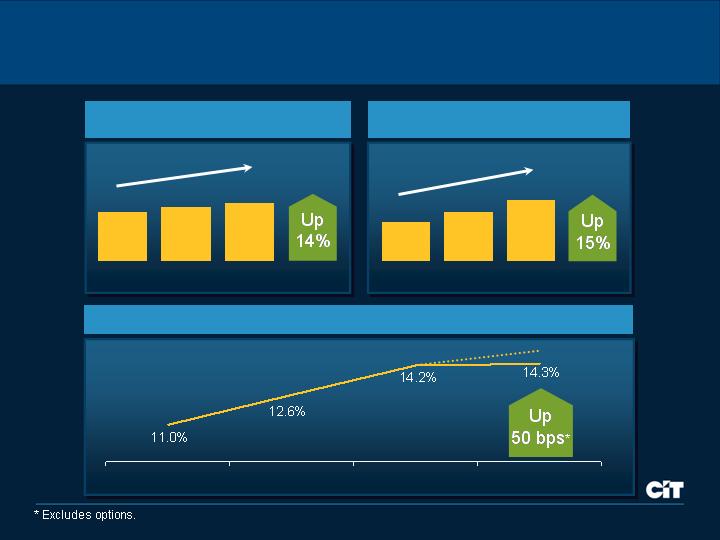
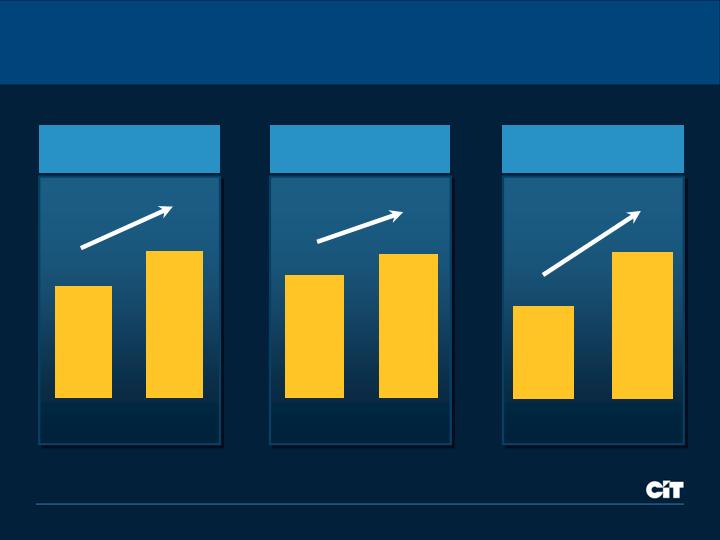
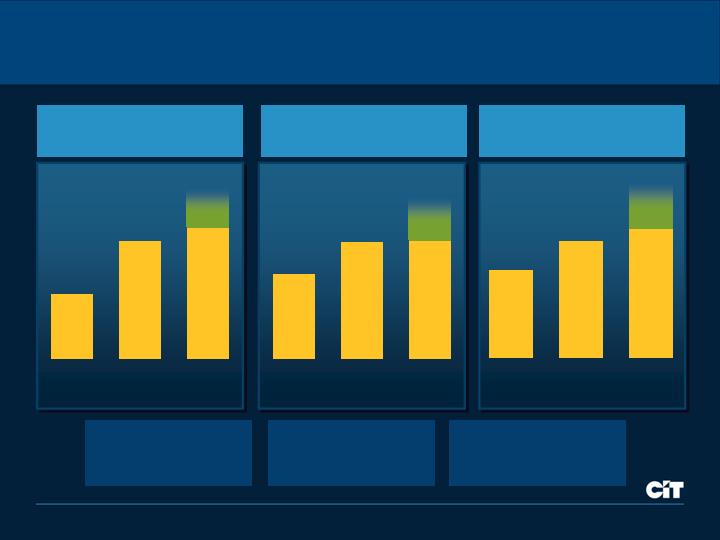
Delivering Results
Revenue
($ millions)
$2,218
$2,452
$2,661
10% CAGR
2003
2004
2005
2006
9 mos.
EPS
$2.69
$3.35
$4.18
25% CAGR
2003
2004
2005
2006
9 mos.
14.7%*
Return on Equity
2003
2004
2005
2006
9 mos.
Executing for Performance
Expanded Origination
Platforms
Broadened Product and
Service Offerings
Transforming Vision into Reality
Vision
The leading global finance company in the middle market
2004
Introduced
Operating
Principles
ROE
One CIT
RPM
2005
Set
Strategic
Framework
2006
Built Growth
Engine
Productivity
Management
Credit and
Risk
Management
Capital
Discipline
Client
Focus
Sector
Alignment

2007 Executing for Performance
Leverage revenue generation platforms
Increase the velocity of assets
Maintain positive operating leverage
Continue international expansion
Further risk management expertise
Strengthen performance-driven culture
Agenda
Sales & Marketing
Walter Owens
Commercial Finance
Frederick Wolfert
Specialty Finance
Thomas Hallman
Credit & Risk Management
Lawrence Marsiello
Finance
Joseph Leone
Outlook
Jeffrey Peek

Financial Capital
+ Intellectual Capital
+ Relationship Capital
= infinite possibilities

Sales & Marketing
Walter Owens
Executive Vice President
Chief Sales & Marketing Officer
We Are Building a Sustainable Growth Engine for CIT...
Build Strong
Foundation
Invest and Drive
Execution
Accelerate
Productive Growth
Deliver Sustainable
Long-Term Growth
Organic
Growth
14%
2000-2005
2006
9 mos.
3%
Revenue Growth
We Are Building a Sustainable Growth Engine for CIT...
Build Strong
Foundation
Invest and Drive
Execution
Accelerate
Productive Growth
Deliver Sustainable
Long-Term Growth
Organic
Growth
Financial Capital
+ Intellectual Capital
+ Relationship Capital
= infinite possibilities
To
Commoditized,
transaction-based capital
…with a Clear Value Proposition
From
+
‘Beyond Capital’
The net potential
of a business
The net worth
of a business

“I like to do business with people I can trust to get the right
advice. CIT takes a solutions approach to my needs rather
than going for the quick sale.”
“At the end of the day, CIT delivered a relationship
and not just a transaction.”
Guy Sansone
CEO, St Vincent’s Medical Centers
Why Our Customers Do Business with Us
Developed tactical sales plans
Implemented operating framework
Built-out sales force
Deployed sales force
Delivered selling tools
Invest and
Drive Execution
Where We Are Today
Created sales organization
Introduced SALE framework
Developed performance management system
Implemented sales automation
Developed market intelligence
Build Strong
Foundation
=
Delivering Strong Momentum in Top Line Growth
* Excludes Trade Finance, joint ventures and portfolio purchases.
+
Sales Force Size*
972
1,241
Sep
2005
28%
Sales Productivity
15.2
18.9
($ Millions)
24%
14.8
Volume*
23.4
($ Billions)
58%
Sep
2006
2005
9 mos.
2006
9 mos.
2005
9 mos.
2006
9 mos.

Developed In-Depth Growth Plans for Each Business…
Addressable
market share
Channel penetration
Share of wallet
Deployment strategy
Market
Coverage
Number of new hires
Turnover optimization
Leadership capabilities
Talent strength
Compensation
alignment
Sales Force
Size
Conversion efficiency
Penetration
effectiveness
Assimilation
effectiveness
Customer retention
strategies
Sales
Productivity
Revenue Growth
Spread
Non-Spread
…and a Robust Operating Process to Ensure Accountability
Sales playbooks in 32 businesses
Development and execution
owned by Chief Sales Officers
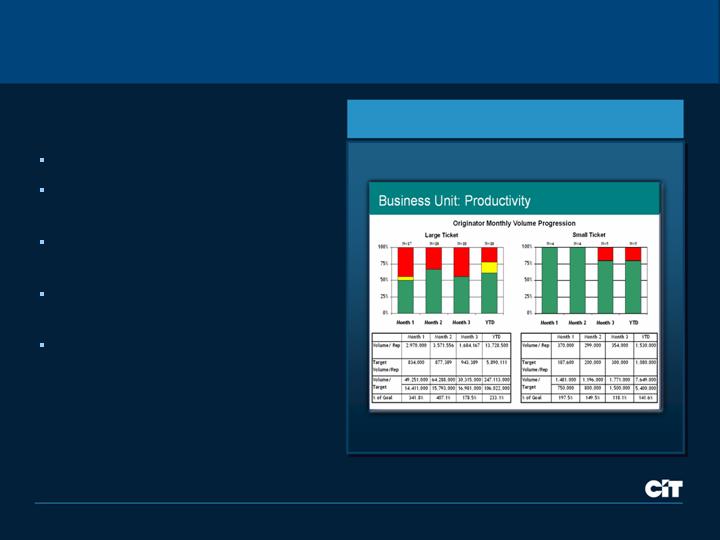
Rigorous monthly reviews using
dashboards
Identify areas of focus by
Sales SWAT teams
Leverage best practices
Operating Rhythm
Dashboards
Focused on Finding, Hiring and Assimilating Talent
Market intelligence
Sales competencies
Hiring screens
Interview guides
Finding and Hiring
the Right People
Buddy system
Deal strike zones
Technology support
Product knowledge
Assimilating to
Accelerate Productivity
Compensation alignment
Sales training
Leader development
Reward and recognition
Developing and Retaining
to Sustain Growth
1,241
972
Sep 2006
Sep 2005
Total Front-Line Sales Talent
28%

Deployed Sales Forces to Maximize Opportunity
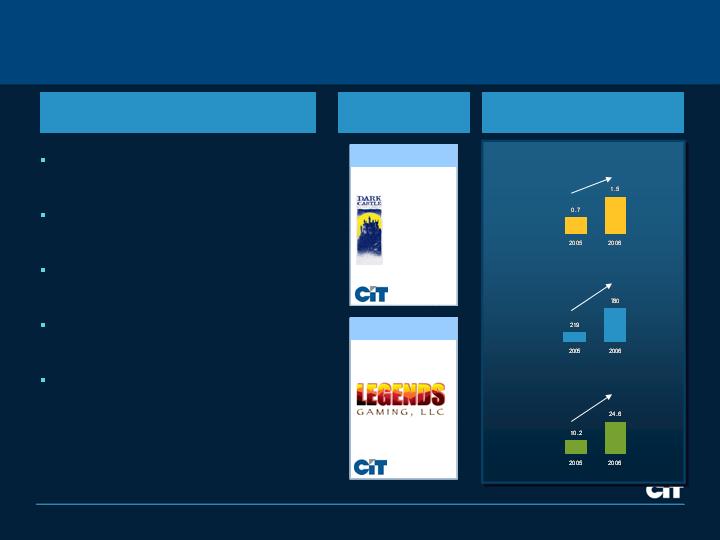
Example: Communications, Media & Entertainment
New Business Volume
$0.7 Billion
$1.5 Billion
2006
9 mos.
Organized by
sub-industry vertical
Acquired talent with
deep industry expertise
Focused on
key relationships
Provided solutions
not products
Success Drivers
2005
9 mos.
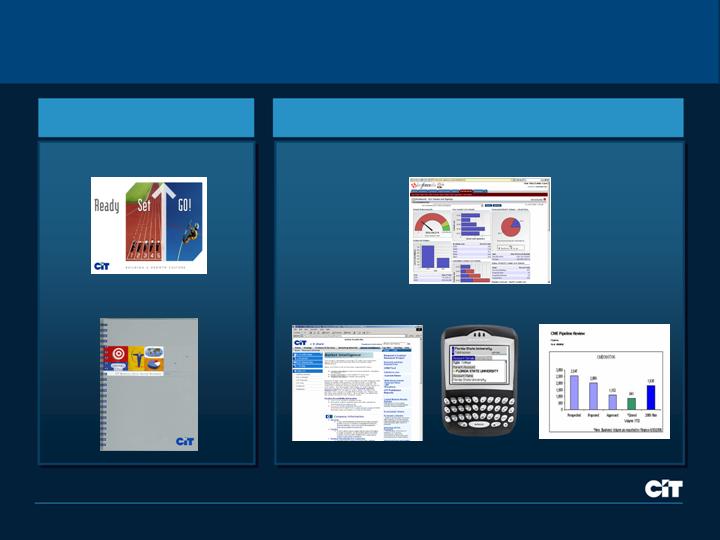
Rolled Out Robust Toolkit to Make Selling Easier
Gets You Started
Makes You More Effective
Product Guide
Assimilation Guide
Salesforce.com
Visibility
Flexibility
Intelligence

Where We Are Heading
Retain and develop maturing sales force
Invest in strategic marketing
Deepen relationships with customers
Drive ‘One CIT’ cross-selling
Accelerate
Productive Growth
Slowing Build-Out in 2007 and Focusing on Productivity
2007 Agenda
Slow hiring pace
Increase productivity over 20%
Raise the sales performance bar
Targeted training and development
Percentage Increase in
Sales Force Size*
1,360
1,241
2007 (E)
2006
9 mos.
10%
28%
Headcount
* Excludes acquisitions.
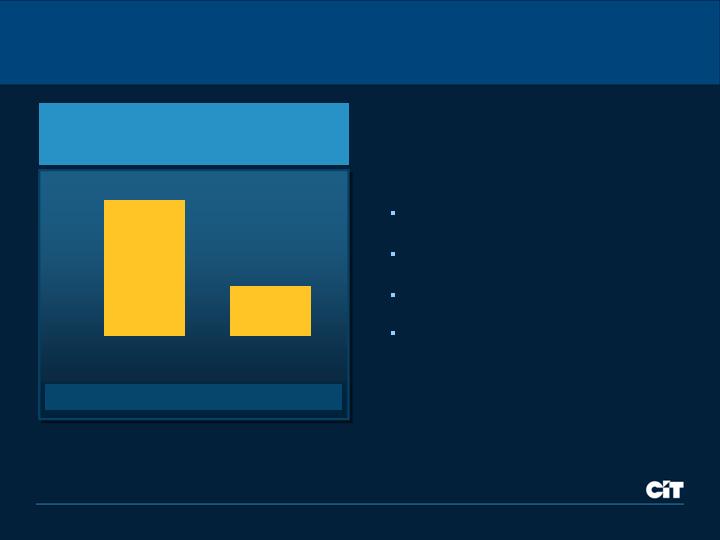
Benefiting from a Maturing and Higher Quality Sales Force
400% increase
1
Leading
4
Rarely
Demonstrated
Current
Future
2.2
Average Monthly Volume
per Originator by Tenure
(Example: Student Loan Xpress)
Focus on Talent Development
to Lift Average Performance
<6 Months
6-12 Months
>12 Months
Increasing Market Coverage to See and Close More Deals
Market
Opportunities
Leads
Proposals
Commitments
Closed Deals
See More
#1
Touch More
#2
Close More
#3
Establishing Deeper Relationships Through Account Planning
Developed plans for top 100
opportunities for 2007 across
Specialty Finance businesses…
Resources from across CIT leveraged to
‘open doors’, create solutions, win deals
Improved visibility into customer potential
Stronger, more profitable client relationships
Key Outcomes
Identification of top accounts through
several measures … not just exposure
Representatives for top accounts will be
specially trained in planning and selling
skills
Key Activities

Solution sell
Combined teams
Team awards
c it pay
Deal referrals
All employees
eligible
Driving ‘One CIT’ to Gain Customer Share-of-Wallet
Share Leads
Deal Collaboration
‘One CIT’ Volume
($ Millions)
2005
9 mos.
‘One CIT’ Fees
($ Millions)
2005
9 mos.
Specialist sales force
Advisory fees:
Insurance
M&A
Real Estate
Advisory Services
2006
9 mos.
56
981
2006
9 mos.
Advisory
Fees
Cap
Markets
40
132
Delivering Sustainable Long-Term Growth
Accelerating Revenue
Growth
Larger and Better
Sales Force
+
=
Productivity Focus
Build Strong
Foundation
Invest and Drive
Execution
Accelerate
Productive Growth
Deliver Sustainable
Long-Term Growth
Organic
Growth

Commercial Finance
Rick Wolfert
Vice Chairman, Commercial Finance

A Recognized Leader in Commercial Finance
Managed Assets: $39 Billion
Large and loyal customer base
Over 57,000
2,450 employees
Large direct sales force: ~400
Preeminent brand
98 years of middle market lending
experience
Superior risk underwriting experience
and skill
Global scope
Operating in over 30 countries
Data as of September 30, 2006.
Broad Portfolio of Scaled Businesses in Attractive Markets
Commercial Finance Group
Commercial Services
Business Capital
Comm, Media & Entertainment
Commercial Real Estate
Construction
Equipment Finance
Energy
Healthcare
Mergers and Acquisitions
Sponsor Finance
Aerospace
Rail
Commercial Aircraft
Business Aircraft
Aerospace and Defense Finance
Commercial Credit
Commercial Services Int’l
Commercial Services Asia
Commercial Services Europe
Trade Finance
Transportation Finance
Corporate Finance
Net Revenue: $331 Million
Net Income: $129 Million
ROE: 26%
Net Revenue: $266 Million
Net Income: $182 Million
ROE: 17%
Net Revenue: $603 Million
Net Income: $240 Million
ROE: 16%
Net Revenue: $1.2 Billion
Net Income: $551Million
ROE: 17.9%
Syndicated Loan Group
Data as of or for the nine months ended September 30, 2006.
Clear Traction in Executing the New Strategy
33%
Efficiency Ratio
$12.5 Billion
Volume
$1.2 Billion
Net Revenue
17.9%
ROE
0.16%
Net Charge-offs
3.23%
Net Margin
$39 Billion
Managed Assets
$551 Million
Net Income
vs. 2005
2006
9 bps
Challenges
Aggressive market pricing
Liberal credit structures
Accomplishments
Successfully launched customer-centric,
market-focused growth strategy
Attracted over 150 top commercial
finance professionals
Enhanced state-of-the-art
risk management system
Executed well on new growth initiatives
Data as of or for the nine months ended September 30.
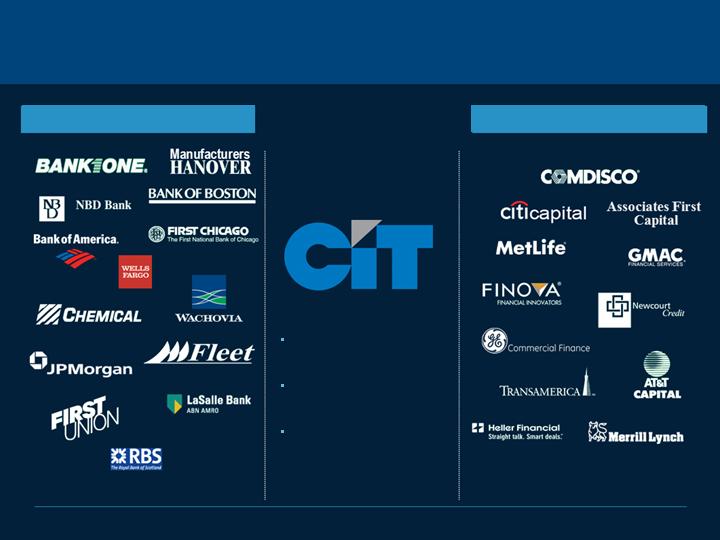
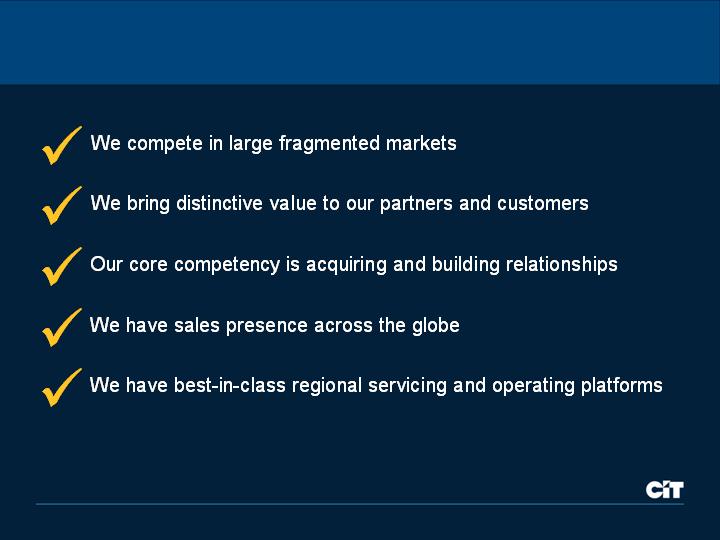
1995-2006: A Dramatically Changed Competitive Landscape
Banks consolidating
and moving up-market
Disrupted client
relationships
Shifting middle market
and industry strategies
Banking
Commercial Finance
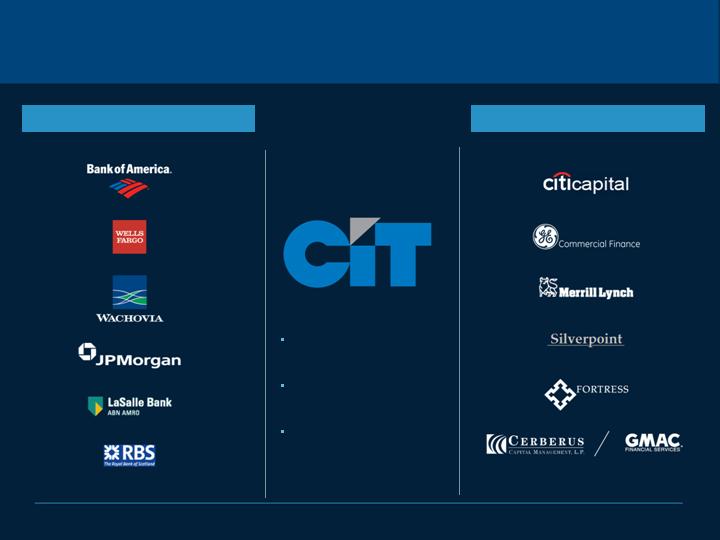
1995-2006: A Dramatically Changed Competitive Landscape
Banks consolidating
and moving up-market
Disrupted client
relationships
Shifting middle market
and industry strategies
Banking
Commercial Finance
Revenue
Where We Compete
Junk
B-
$10M
$50M
$1B
$100B+
B+
BB-
BBB
AAA
Credit Rating
Middle Market
~$1.8 Trillion
Finance Companies
Local Banks
Large Banks
Investment Banks
Hedge Funds
Finance Companies
Regional Banks
Hedge Funds
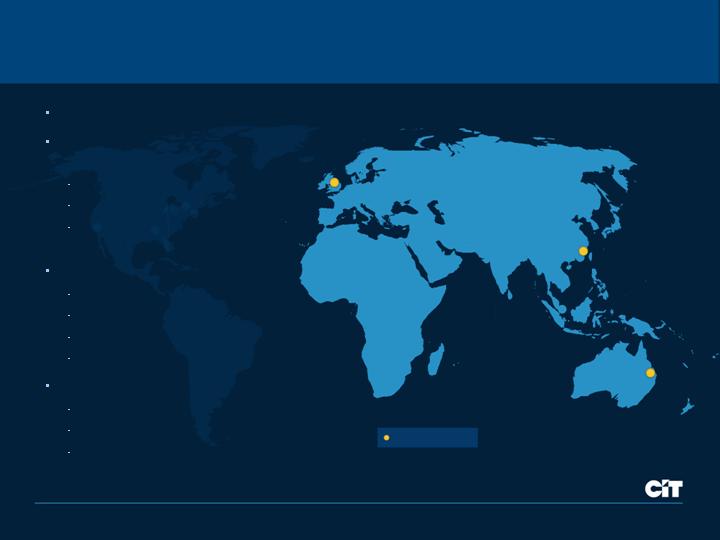
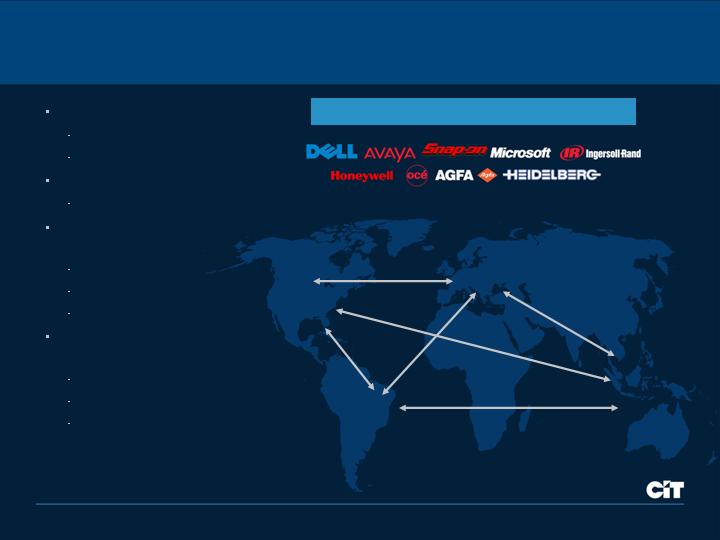
Positioned for Global Growth
Aerospace global headquarters opened in Dublin, 2005
Expanding European factoring platform – German Factoring acquisition Q2 2006
Fortifying Asian expansion – New Singapore Aerospace office Q4 2006
Atlanta
Boston
Charlotte
Chicago
Dallas
North America
Shanghai
Singapore
Hong Kong
$930 Billion
London
Dublin
Frankfurt
Europe
$330 Billion
$420 Billion
Asia-Pacific
$147 Billion
Houston
Los Angeles
New York
Tempe
Toronto
$410 Billion
Loans
Equipment
Finance
$750 Billion
$1.34 Trillion
Market
$330 Billion
$183 Billion
Market-Focused Model Driving Organic Growth
Relationship Managers
Industry thought leaders
Consultative approach
Develop / manage CIT relationship
Coordinate execution
Equipment Finance
& Leasing
Factoring
Asset Based Lending
Corporate Finance
Structured / Project Finance
M&A Advisory
Commercial Real Estate
Advisory & Finance
Products and Services
Target Industries
Communications,
Media & Entertainment
Construction
Retail
Healthcare
Energy
Aerospace
Rail
Private Equity
Sponsors
Intermediaries
Financial
Institutions
Channel Partners
Hedge
Funds
Syndicated
Loan Group
Sponsor
Finance
Capital Markets
Healthcare
Energy
Europe
Sales
Equipment
Finance
Commercial
Real Estate
M&A
Advisory
Commercial
Services
Canada
Risk
Communications,
Media & Entertainment
Business
Capital
Construction
Aerospace
Rail
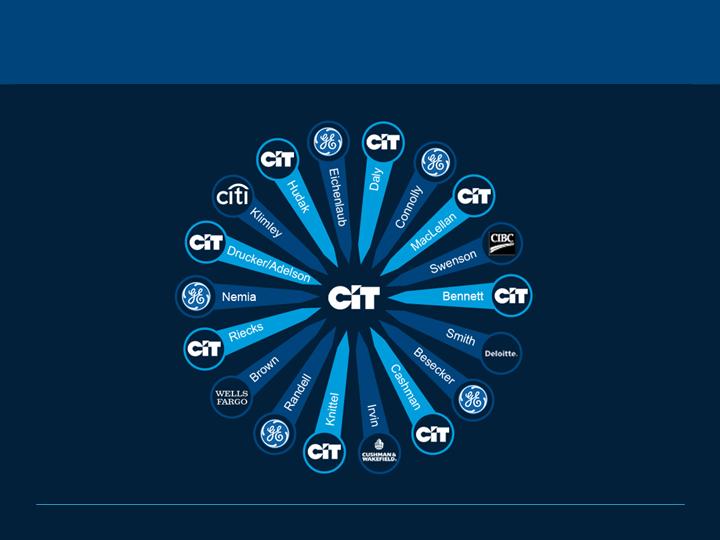
Performance Driven by Strong Talent
New Strategy is Driving Strong Originations Growth
CAGR: ~40%
CAGR: 6%
Q4
9 months
New Business Volume
($ Billions)
8.1
9.1
8.2
11.4
12.5
7.8

Cross-Selling Strategy is Working
Tremendous growth in referral
activity in 2006
Incentive compensation
drives behaviors
Lowest cost origination lever
2005
2006
9 mos.
$228
$967
22
72
Transactions
Cross-Sell Volume
($ Millions)
YTD
324%
An Originations Powerhouse
$12.5 Billion Booked YTD
Investment
Vehicles
$9.3 Billion
2007 Initiative
$3.2 Billion
Capital
Markets
Syndications
Balance Sheet
$61 Billion Proposed YTD
Driving Non-Spread Revenue and Improving Earnings Mix
Revenue Composition
($ in Millions)
2002
9 mos.
2003
9 mos.
2004
9 mos.
2005
9 mos.
2006
9 mos.
Spread
Non-Spread (NSR)
NSR Growth
22%

Owned Credit Losses
(% of Average Finance Receivables)
Best-in-Class Risk Management
660 person risk team lead by
seasoned veterans
Sophisticated systems provide
‘early warning detection’
State-of-the-art risk-adjusted
pricing discipline
Risk philosophy driven by
diversification and supported
by strong collateral positions
Risk Management Expertise
0.25%
0.16%
Risk-Adjusted Margin
(% of Average Earning Assets)
2006
9 mos.
2005
9 mos.
2.75%
3.11%
2006
9 mos.
2005
9 mos.
Model Designed to Deliver Earnings Through All Cycles
Strong Economy
Acquisition Finance
Growth Capital
Mergers and Acquisitions
Real Estate
Construction
Competitors enter,
margins decline
Down Cycle
Factoring
Restructuring
DIP Financing
Distressed Debt
Advisory Services
Competitors exit,
margins improve

What do Middle Market Customers Really Want?
Understand their business
Stand with them through cycles
Deliver solutions for complex financing needs
Respond quickly and always deliver on commitments

Limited
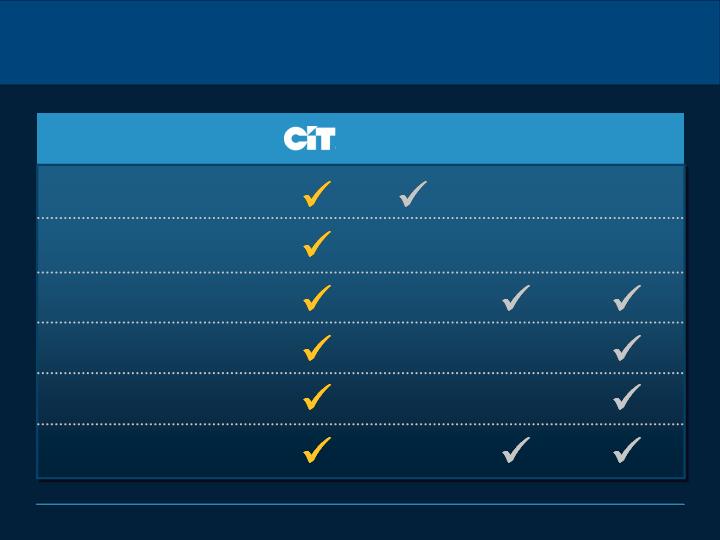
How We Win in the Middle Market
Relationship
Orientation
Structuring
Expertise
Middle Market
Advisory Capabilities
Agility
Direct Access to
Decision Makers
Broad Product
Offering
Long-Term Commitment
to Middle Market
Deep & Dedicated Industry
Focus / Expertise
Banks
Finance
Companies
Hedge
Funds
Limited
Limited
Limited
Limited

Business Overview
Trade Finance
Corporate Finance
Transportation Finance
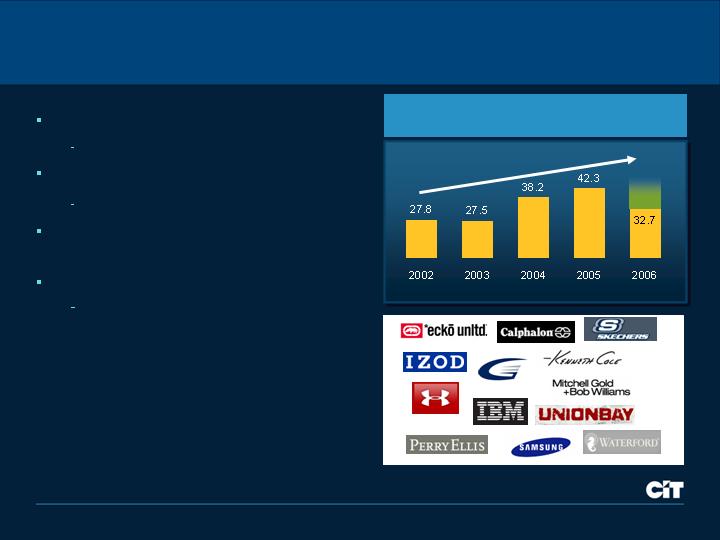
Trade Finance: Commercial Services
#1 factoring position in the U.S.
~$45 Billion volume
Average client relationship
Over 10 years
Actively cross-selling insurance,
commercial credit and M&A
International expansion
Following our clients to Europe
and Asia
Factoring Volume
($ Billions)
9 mos.
CAGR: 12%
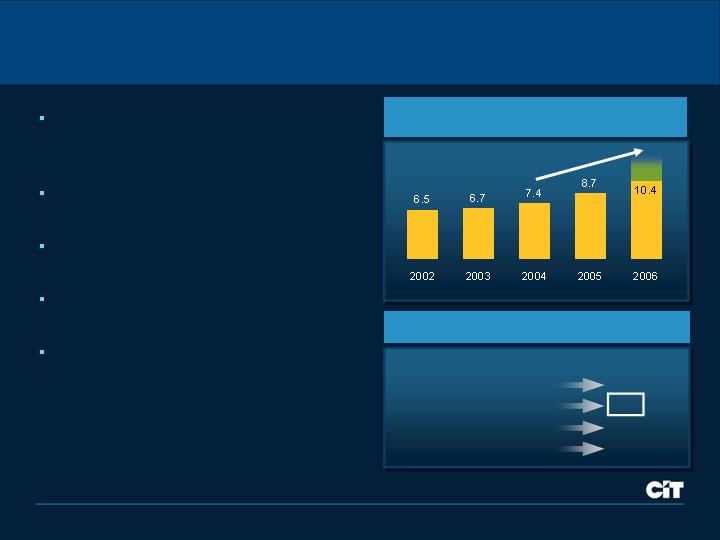
Transportation Finance: Rail
Youngest major fleet in the industry
Average age of 10 years versus
industry average of 19 years
#3 franchise position with over
100,000 car fleet
Over 99% utilization rate
Smart bolt-on acquisitions
Attractive pricing on renewals
Favorable railcar delivery positions
with manufacturers in 2007 / 2008
Managed Assets
($ Billions)
9 mos.
CAGR: 22%
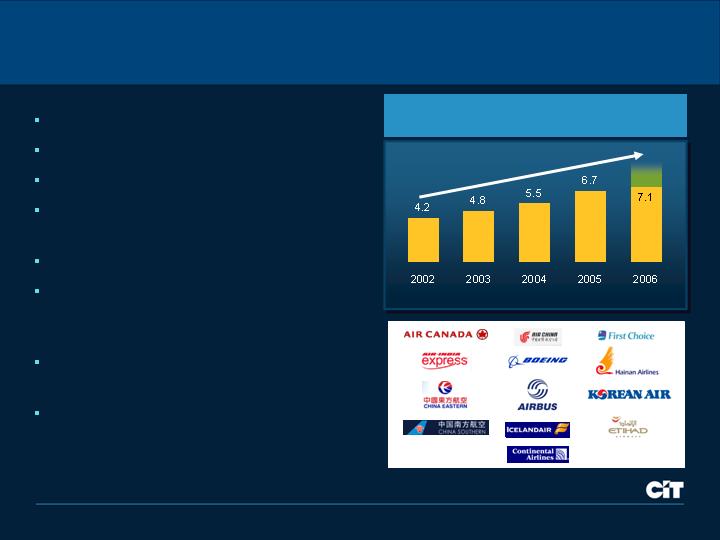
Transportation Finance: Aerospace
#3 franchise position
40 years of industry experience
Over 120 customers
International platform: over 80%
of aircraft are outside North America
Modern, fuel efficient fleet
Commercial Aircraft: Over $2 trillion
requirement for aircraft financing in
the next 20 years
Business Aircraft: $156 billion of
aircraft deliveries in the next 10 years
Aerospace and Defense Finance:
Supply chain finance
Managed Assets
($ Billions)
9 mos.
CAGR: ~15%
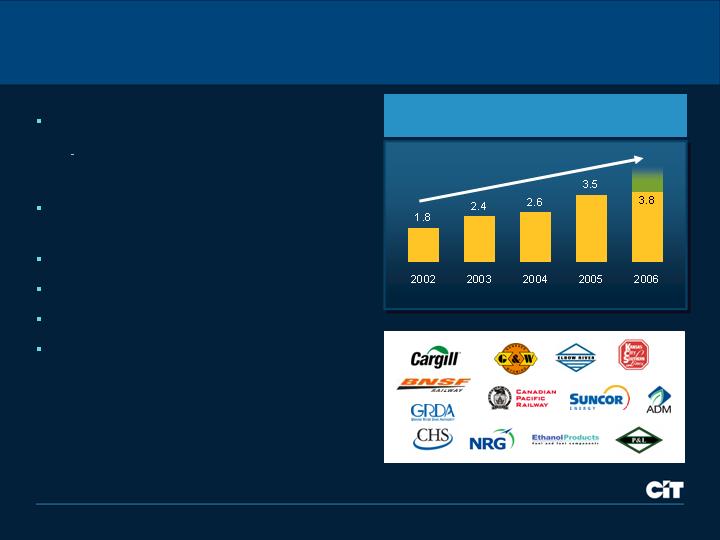
Corporate Finance
9 mos.
Leveraging industry expertise,
specialty lending acumen, balance
sheet and capital market capabilities
Focused ‘One CIT’ approach
to channel partners
Collaborative deal teams driving
organic growth
Advisory services enhance
capabilities and fee revenue
Expanding lead generation through
Piper Jaffray alliance
New Business Volume
($ Billions)
Sponsor-Backed Transactions
CAGR: ~30%
2005
2006 9 mos.
Number of Deals
196
262
Lead Deals
15
40
Commitments
$4.0 B
$7.3 B
Fundings
$2.2 B
$4.0 B

Advancing Lead Arranger Status
Q3 2005
314,500,000
National City Corporation
25
325,000,000
Zions First National Bank
24
345,000,000
CIT Group
23
352,000,000
KeyBank
22
360,000,000
Deutsche Bank
21
387,000,000
RBC Capital Markets
20
407,300,000
Antares Capital Corporation
19
510,000,000
PNC Bank
18
Volume
($)
Company
Rank
530,000,000
Bear Stearns Companies
17
602,500,000
CIBC World Markets
16
638,241,305
ABN AMRO Bank N.V.
15
702,500,000
Lehman Brothers
14
734,000,000
Royal Bank of Scotland Plc
13
750,000,000
SunTrust Bank
12
792,500,000
Merrill Lynch & Company
11
819,000,000
Bank of New York Company
10
962,000,000
BNP Paribas
9
1,178,750,000
General Electric Capital Corporation
8
1,205,000,000
Citigroup
7
1,221,674,000
Wachovia Securities
6
1,602,300,000
Credit Suisse First Boston
4
1,487,500,000
Wells Fargo & Company
5
2,067,250,000
UBS AG
3
4,113,300,000
Bank of America
2
5,212,900,000
JP Morgan
1
Source: Reuters Loan Pricing Corporation / DealScan.
Q3 2006
212,500,000
U.S. Bancorp
25
215,000,000
KeyBank
24
227,500,000
National City Corporation
23
237,500,000
TD Securities
22
250,000,000
Regions Bank
21
275,000,000
ABN AMRO Bank N.V.
20
295,000,000
Merrill Lynch & Company
19
315,000,000
BMO Capital Markets
18
Volume
($)
Company
Rank
329,500,000
Bank of New York Company
17
378,500,000
CIBC World Markets
16
557,500,000
Bear Stearns Companies
15
558,797,950
General Electric Capital Corporation
14
650,000,000
SunTrust Bank
13
727,500,000
Wells Fargo & Company
12
799,000,000
Lehman Brothers
11
841,200,000
CIT Group
10
882,500,000
UBS AG
9
937,297,950
BNP Paribas
8
1,000,000,000
Goldman Sachs & Company
7
1,061,100,000
PNC Bank
6
1,809,750,000
Wachovia Securities
4
1,473,500,000
Credit Suisse
5
1,852,500,000
Citigroup
3
4,204,800,000
JP Morgan
2
4,382,850,000
Bank of America
1
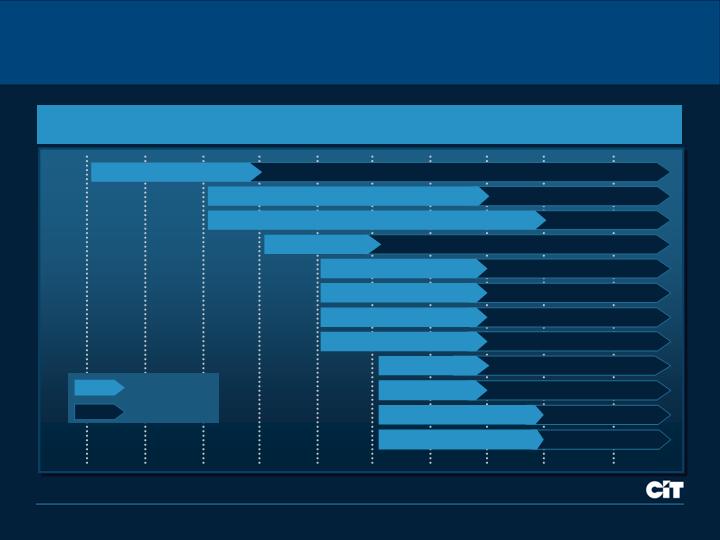
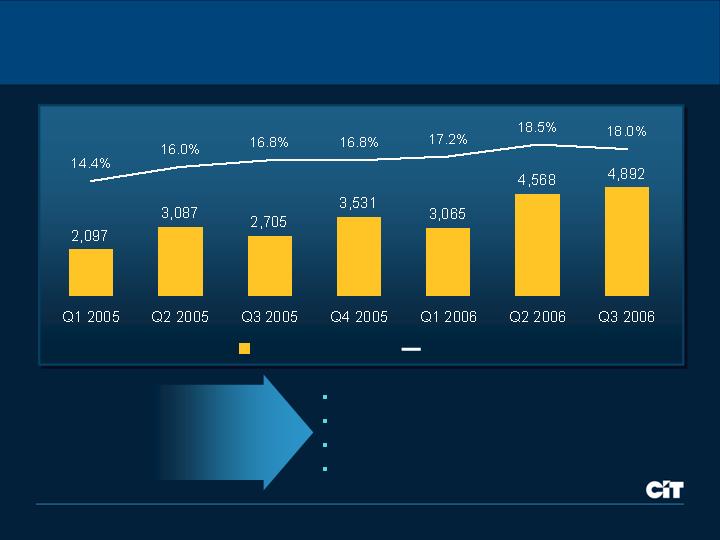
New Strategic Initiatives are Growth Engines for the Future
Q1 2005
Q2 2005
Q3 2005
Q4 2005
Q1 2006
Q2 2006
Q3 2006
Q4 2006
2007
Overall Investment vs. Return
($ Millions)
Investment phase
Revenue positive
Healthcare
Mergers & Acquisition
Commercial Real Estate
Capital Markets
Global Sponsor
Syndicated Loan
Energy
Aerospace & Defense Finance
International Trade Finance
Commercial Credit
Business Capital Restructuring
Structured
Equipment Finance
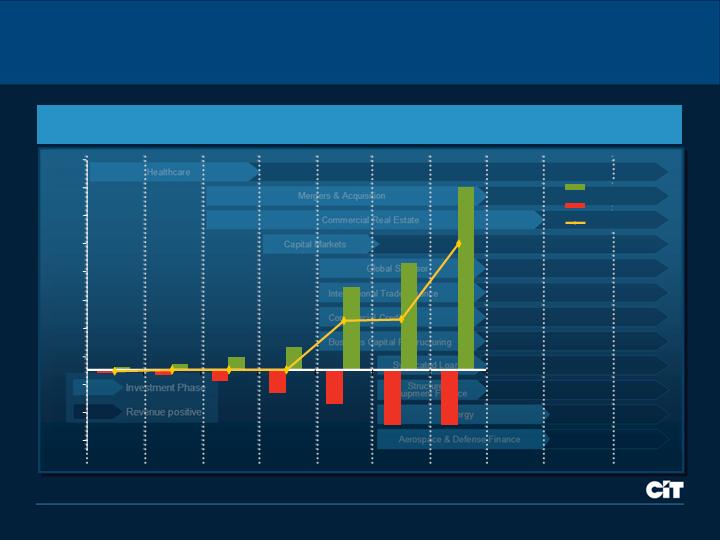
New Strategic Initiatives are Growth Engines for the Future
Overall Investment vs. Return
($ Millions)
Q1 2005
Q2 2005
Q3 2005
Q4 2005
Q1 2006
Q2 2006
Q3 2006
Q4 2006
2007
-50
-30
-10
10
30
50
70
90
110
130
150
Q1 2005
Q2 2005
Q3 2005
Q4 2005
Q1 2006
Q2 2006
Q3 2006
Expense
Revenue
Net Revenue
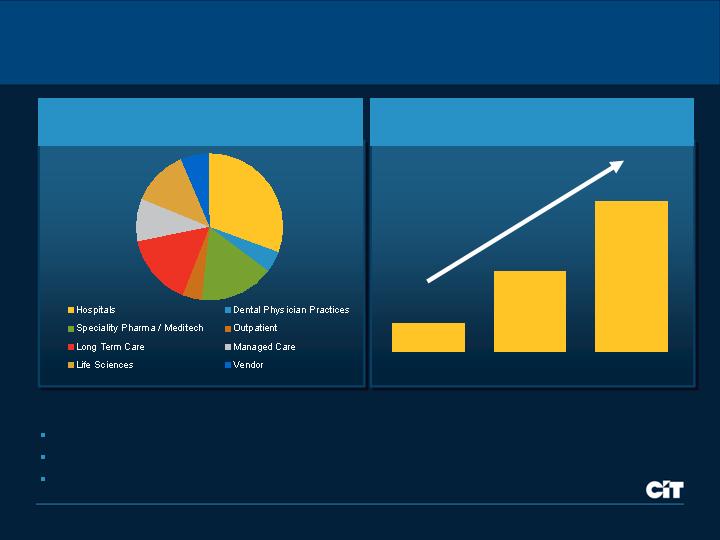
Healthcare Vertical Driving Growth
Healthcare as a growth engine
Launched industry vertical in 2005
Hired best-in-class team
Organized sales force around large healthcare sub-segments
2005 Healthcare Financings:
~ $170 Billion
Managed Assets
($ Billions)
Dec 2004
Dec 2005
Sep 2006
0.5
1.5
2.5
31%
5%
16%
5%
16%
9%
12%
6%
CAGR: 144%
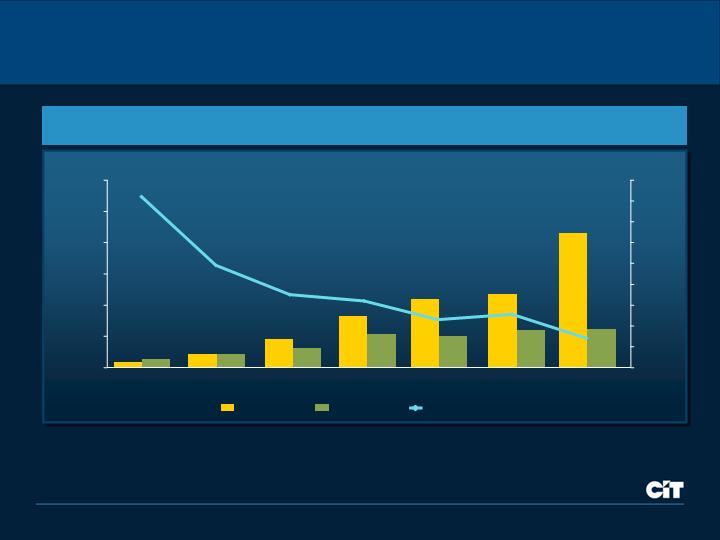
Healthcare - Rapid Payback on Investment
0
10
20
30
40
50
60
Q1 2005
Q2 2005
Q3 2005
Q4 2005
Q1 2006
Q2 2006
Q3 2006
0
20
40
60
80
100
120
140
160
180
Revenues
Expenses
Efficiency Ratio
Accelerating Productivity
($ Millions)
Efficiency Ratio (%)
Building Scale Through Bolt-On Acquisitions
Trade Finance
Transportation Finance
Rail Fleet
(Railcars)
German Factoring 166
SunTrust 864
Factoring Assets
($ Millions)
Corporate Finance
Healthcare Finance Assets
($ Millions)
HBCC 515
PLM 5,845
DJ Joseph 2,100
Bombardier 15,000
Acquisitions are a core competency
Accretive from inception
All are tracking at or above plan
Construction: Transformation Success Story
Refocused on core strategy
Restructured the business
$11 million cost take-out
106 headcount reduction
Re-deployed sales force
Effective use of capital markets
distribution capabilities
The result:
Improved front-end and
operational efficiency
Sales productivity more
than doubled
Achieving ROE hurdle rate
$28 M
Non-Spread Revenue
$1.2 B
Volume
15.1%
ROE
27.2%
Efficiency Ratio
$32 M
Net Income
2006
9 mos.
2005
9 mos.
VS.
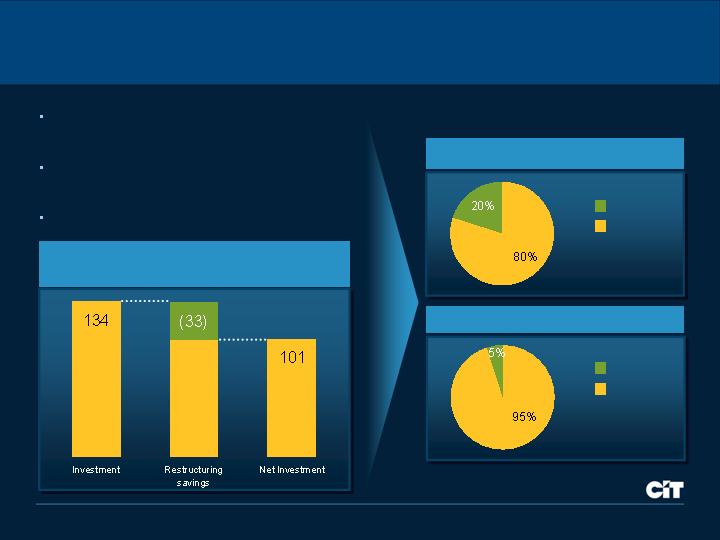
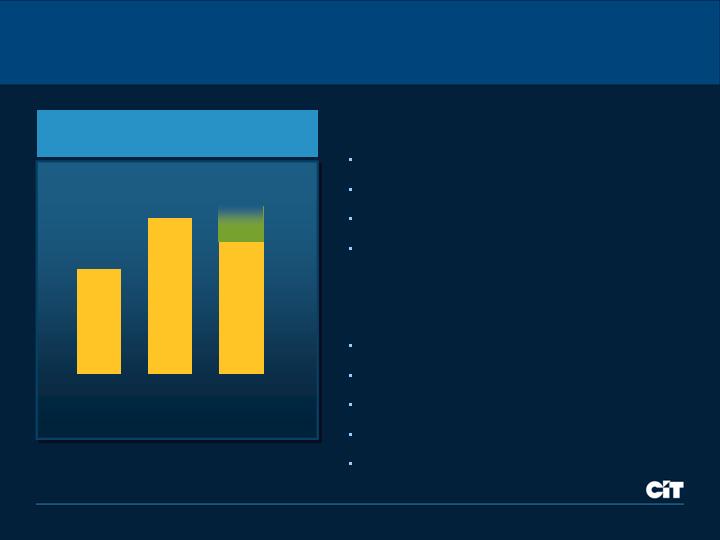
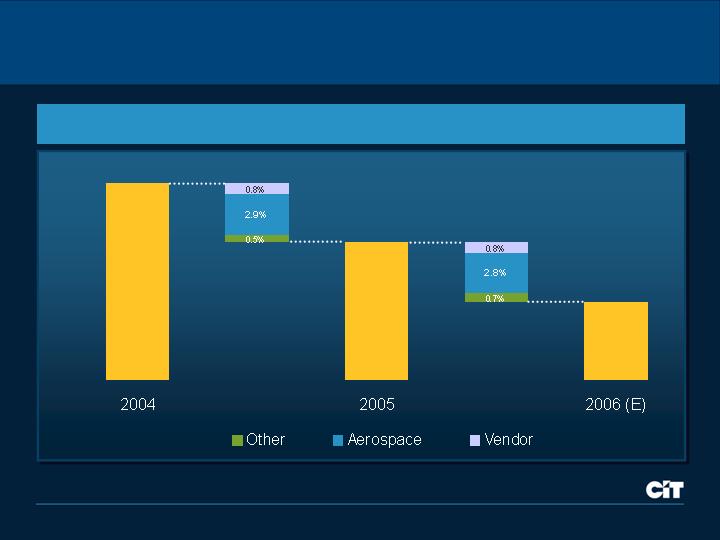
Investment Phase in Growth Initiatives is Nearly Complete
Funded 25% by exiting slow-growth /
low-return businesses
Rigorous focus on productivity and
expense management
Platforms built without incurring goodwill
Back-end
Front-end
Majority of investment has been…
Focused on the Front-End
Cost and Revenue Correlated
Fixed
Variable
Investment for Growth
($ Millions)
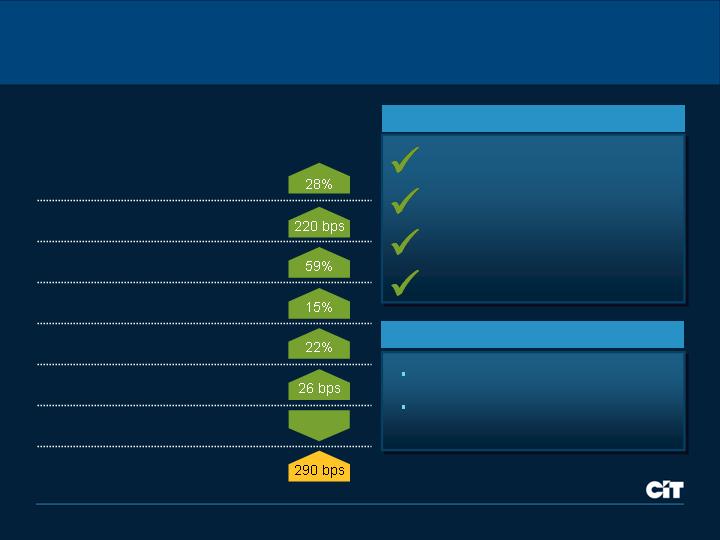
Balancing Size of Sales Force with Productivity
275
Sep
2005
20%
=
+
28
32%
37
59%
12.1
7.6
Sales Force Size*
Sales Productivity
($ Millions)
Volume*
($ Billions)
Sep
2006
2005
9 mos.
2006
9 mos.
2005
9 mos.
2006
9 mos.
330
* Excludes Trade Finance volume and headcount.
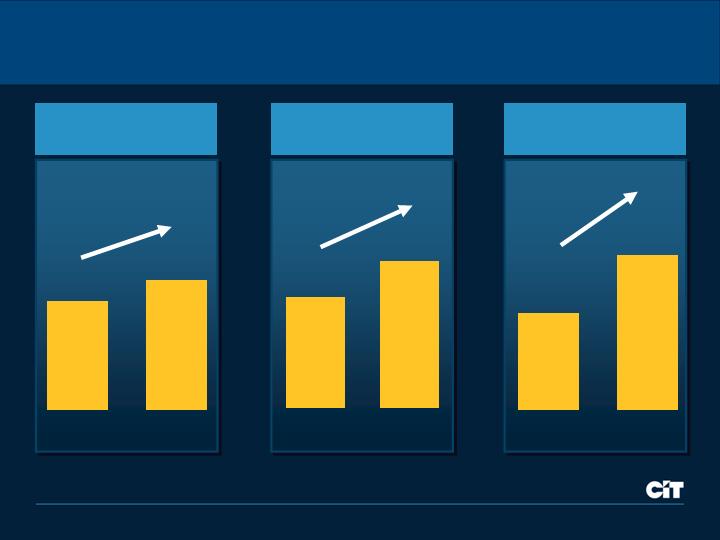
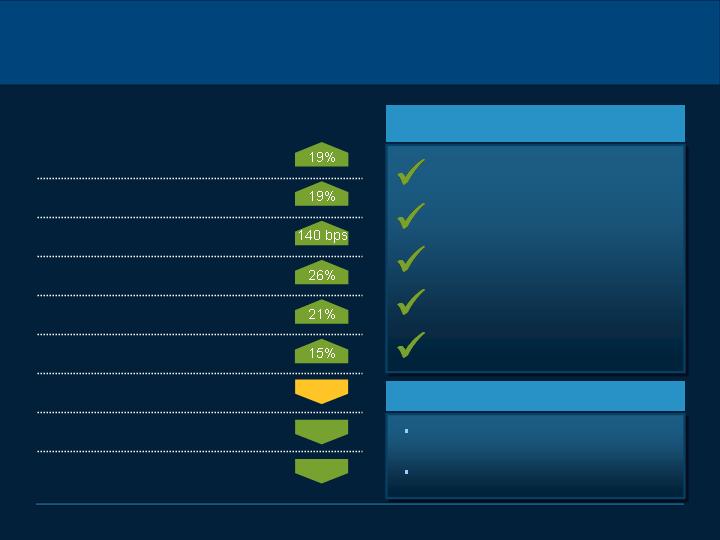
Delivering Strong Growth and Returns
Profitability
Drivers
Volume ($ Millions)
ROE
Record new business volumes
Stable risk-adjusted margins
Increasing levels of fee income
Strong credit quality

Focus for 2007: Accelerating Growth and Productivity
Harvest investment in new
initiatives
Focus on fee income growth
Build asset management
complement
Build on our
growth momentum
Operational
excellence
driving productivity
Accelerate sales productivity
Optimize back-office
platforms
Efficiencies driven
through IT enhancements
Revenue
Expense
Commercial Finance Panel
Gregg Smith
M&A
Jim Hudak
Communications, Media & Entertainment
Flint Besecker
Healthcare
Healthcare Team Leads with Trusted Advisor Approach
Top 5 healthcare leaders have over 100 years of industry experience
Applies intellectual capital to drive value for clients
Healthcare is huge market representing 16% of GDP
Added 289 new relationships in past 12 months
Sole Lead Arranger
$55,000,000
Senior Secured Credit Facility
Supporting the Acquisition of Tarrant
Dialysis Centers by US Renal
$47,100,000
Senior Secured Credit Facilities
Acquisition Finance
Relationship Case Study
Widely respected middle market private
equity firm with long standing healthcare
investment track record
4 Closed lead mandate financings in 2006
3 Pending commitments due to fund
2 Buy-side advisory engagements
CIT Healthcare is preferred source for
private equity firm’s activities
Sole Lead Arranger
M&A Advisory Team Executes Mandates Across CIT’s Platform
Over 90 opportunities have been reviewed:
have acquired
September 2006
and
Sanus Holdings, LLC
®
®
The undersigned initiated the transaction and acted as exclusive
financial advisor to Arcapita Inc. and Sanus Holdings, LLC
Common Characteristics
A leading distributor
of women’s apparel
®
®
Exclusive sell-side advisor
PROJECT
YELLOW JACKET
In Process
Aerospace & Defense (1)
Communication, Media & Entertainment (14)
Consumer Products (5)
Diversified Industrials (20)
Energy (5)
Healthcare (30)
Rail (1)
Retail & Apparel (15)
Long-term relationships
Leverage CIT’s balance sheet
Deep industry expertise
CIT initiated
Case Studies
Communications, Media & Entertainment
Validation of Industry Vertical Strategy
Strategic Group with Great Growth
and New Potential
Industry experts with long term
relationships in each sub-vertical
Deliver multiple products for a total
financing solution
Expanded into contiguous areas -
Sports and Entertainment
Repositioned team for stronger
underwritings and lead positions
27 co-lead or sole lead arranger
transactions to date in 2006
Proof of Concept
Sole Arranger,
Administrative Agent
and Acquisition Advisor
First Lien Revolving Line of
Credit, First Lien Term Loan B
and Second Lien Term Loan
used for acquisition
Casino and hotel operator
$222,000,000
Sole Arranger,
Administrative Agent
and Acquisition Advisor
First Lien Revolving Line of
Credit, First Lien Term Loan B
and Second Lien Term Loan
used for acquisition
First Lien Revolving Line of
Credit, First Lien Term Loan B
and Second Lien Term Loan
used for acquisition
Casino and hotel operator
$222,000,000
Administrative Agent
(Senior)
Documentation Agent
(Mezzanine)
Revolving line of credit and
mezzanine facility for the purpose
of film production
Successful genre film label
$212,500,000
Administrative Agent
(Senior)
Documentation Agent
(Mezzanine)
Revolving line of credit and
mezzanine facility for the purpose
of film production
Successful genre film label
$212,500,000
Syndication Volume
($ Millions)
250%
Fee Income
($ Millions)
140%
Volume
($ Billions)
114%
Commercial Finance
Improved go-to-market synergies
Focus on major growth opportunities
Greatly enhanced fee income generation
Enhanced risk management – domain expertise
Scalable model
Deliver consistently through all cycles
Benefits
Market and industry focused
Customer-centric
End-to-end solutions
Relationship driven
Enables cross-selling
Originate and distribute model
The Right Model
at the Right Time
Industry expertise valued
Capital expenditures increasing
Complex and growing financing needs
Fragmented competitive landscape
Global scope
Focus on Large and
Attractive Markets

Specialty Finance
Tom Hallman
Vice Chairman, Specialty Finance

Specialty Finance: Leaders in Relationship Financing
Assets: $33 Billion
$17.6 Billion in new business volume
ROE: 19.5%
Employees: ~3,800
Large experienced sales force: ~900
Large and diversified partner base: Over 5,000
4.3 million consumer and over 500,000
commercial customers
Global reach: 34 countries
Efficient and scalable platforms serving
customers in 5 continents
Best–in-class risk and collateral
management capabilities
Data as of the nine months ended September 30, 2006.

Specialty Finance At-a-Glance
Global Focus
Vendor Finance
U.S. Focus
Consumer /
Small Business Lending
CIT-Wide
Insurance Services
Industrial
Healthcare
Home Lending
Student Loan Xpress
Small Business Lending
Specialty Finance Group
Technology / Office Products
CIT Bank
Strong Performance
19.5%
ROE
$537 Million
Pre-Tax
39.9%
Efficiency Ratio
$17.6 Billion
Volume
$1.1 Billion
Revenue
0.64%
Net Charge-offs
3.14%
Net Margin
$33 Billion
Managed Assets
$332 Million
Net Income
vs. 2005
2006
Challenges
Lower year-over-year volume from
largest vendor relationships
Pressure in the housing market
Accomplishments
Expanded sales force globally and
increased productivity
Realigned vendor organization to
better serve customers
Won several global marquee
relationships including Microsoft
Student Loan Xpress performance
significantly ahead of plan
Continued strong credit and residual
management performance
15 bps
10 bps
60 bps
Data as of or for the nine months ended September 30.
Significant Market Opportunities
Global Vendor
Financing
Home
Lending*
Student
Lending
Small Business
Lending**
Markets are large,
growing and
fragmented
Scalable platforms
in all segments
Relationship
expansion drives
growth
Market Trends
($ Billions)
Market
Growth
* Non-prime market data based on YTD market trend.
**SBA lending only. Based on SBA 2006 fiscal year.
~340
~700
~70
~20
2006 Estimated Market Size

Distinctive Value Proposition
Over 5,000 strong
relationships
Over 900 sales
representatives in 34
countries
Differentiated
relationship
management tools
Customer-centric
business model
Proven talent with
extensive industry
experience
International expertise
Capability to structure
sophisticated
partnerships
Risk-scoring expertise
Collateral
management skills
Relationship Capital
Intellectual Capital
Sustainable
Competitive
Advantage
=
+

Capturing More of the Market
Software financing
Managed services
Conventional small
business products
Private education loans
People
Products
Places
Over 30% increase
in sales forces
35% Vendor
26% Consumer / SBL
Increase sales presence
in U.K. and Germany
Over 60 sales
executives
Industrial leasing
products
Technology leasing
solutions
Expanded to 34
countries including
Portugal
Czech Republic
Puerto Rico (U.S.)
Increased presence in
U.K. technology
finance
German dealer /
reseller finance
Organic
Barclays
Vendor
Finance
Acquisition
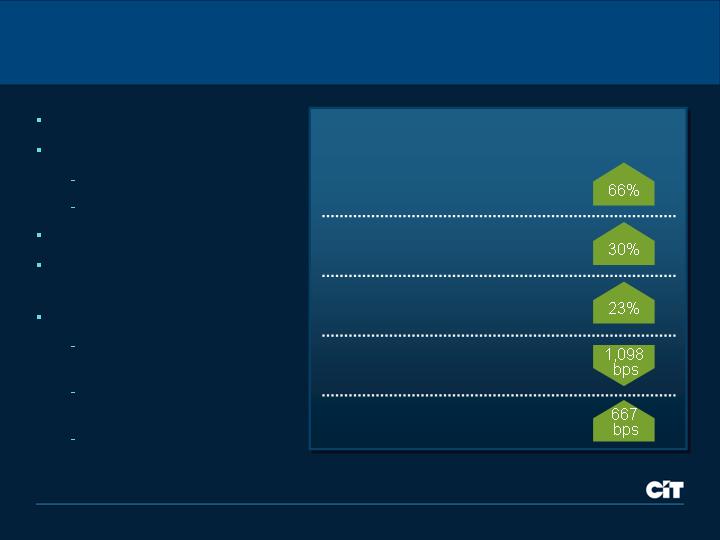
Sales Build-Out Across the Globe
Europe
117
160
37%
Asia / Pacific
68
84
24%
667
512
Sep
2005
Sep
2006
30%
Americas
Sep
2005
Sep
2006
Sep
2005
Sep
2006
* Excludes joint ventures and portfolio purchases.
Productive Sales Growth in 2006
697
911
31%
=
+
10.2
21%
12.4
59%
11.3
7.1
Sales Force Size
Sales Productivity
($ Millions)
Volume*
($ Billions)
2005
9 mos.
2006
9 mos.
2005
9 mos.
2006
9 mos.
Sep.
2005
Sep.
2006
End-to-End Efficiency Enhancements to Fund Future Growth
Maturing sales force
Enhanced lead-generation and
prospecting tools
Broader product set
New global markets
Sales Drivers
Efficiency Ratio
(%)
Scaling of operation
Best-practice sharing across platforms
LEAN processes to reduce ‘waste’
Improved technologies
Operations Drivers
2005
9 mos.
2006
9 mos.
2004
9 mos.
45
40
35
Strong Focus on Driving Non-Spread Revenue
Expanded sales force generating new
relationships and incremental volume
Increase in syndication and
secondary market gains
Secondary market activity for
Consumer / SBL
Syndication in Vendor Finance
Robust growth in Insurance cross-sell
across all businesses
Increase in fees due to expanded
customer base and greater volume
generation
2006
9 mos.
350
434
Non-Spread Revenue
($ Millions)
2005
2004
CAGR: ~30%
420
New And Expanded Relationships
New And Expanded Relationships
New And Expanded Relationships
Efficient / Scalable Global Platforms: Vendor Example
Jacksonville (U.S.)
Miami (Latin America)
Dublin (Europe)
Shanghai (Asia)
Sydney (South Pacific)
Regional servicing hubs
In-country sales and credit
Scalable systems and processes
34 countries and growing
Operations / Technology
Burlington (Canada)
Servicing Centers

Owned Credit Losses
(% of Finance Receivables)
Best-in-Class Risk Management
Underwriting capabilities
Tenured senior risk management team
Tailored risk systems across all
business units
Predictive scoring
Proprietary behavioral scoring models
for consumer and commercial credits
In-house management science
expertise
Collateral management
Deep expertise in each collateral
category
Efficient end-of-lease processes create
low inventory levels and positive
residual experience
Risk Management Expertise
0.79%
0.64%
Residual Realization
153%
150%
2006
9 mos.
2005
9 mos.
2006
9 mos.
2005
9 mos.
100%

Growth Agenda
Increase Relationship
Penetration
Add New
Relationships
Increase End-to-End
Productivity
Pursue Bolt-on
Acquisitions
Scale Global
Operations
Expand Market
Coverage

Specialty Finance Group
Global Focus
Vendor Finance
Vendor Finance Overview
Vendor Finance
Industrial
Healthcare
Technology / Office Products
Global Focus
Specialty Finance Group
CIT-Wide
Insurance Services
Home Lending
Student Loan Xpress
Small Business Lending
CIT Bank
U.S. Focus
Consumer /
Small Business Lending

Vendor Finance: At-a-Glance
2006 Business Highlights
Leading Global Vendor Finance Company
Extensive Geographic Coverage
Over 500 sales representatives in 34 countries
6 Service Centers in 4 continents
Doubled market presence in Europe
New marquee relationships: Microsoft, AGFA,
Manitowoc
2007 Growth Initiatives
Leverage new organization to drive volume for
global and strategic accounts
Increase market penetration in technology,
healthcare and industrial sectors
Enter new segments in Canada, Europe, Latin
America and South Pacific
Integrate and grow Barclays Vendor Business
Build-out Asian operating platform in Shanghai

Volume
($ Billions)
Vendor Finance Performance
662
Managed Assets
$13 B
ROE
25.8%
838
Revenue
($ Millions)
Net Income
($ Millions)
222
249
278
2004
2005
2006
9 mos.
2004
2005
2006
9 mos.
810
6.1
9.1
9.8
2005
2006
9 mos.
2004
Data as of or for the nine months ended September 30, 2006.
Growth Beyond Dell U.S. Joint Venture
New Business Volume Growth*
Accelerating growth rates across
all geographies
35% increase in Vendor Finance
sales force
Sales force focused on building
new relationships and greater
penetration with existing partners
Record new vendor signings
Strong pipeline and funnel
Robust growth in new vendor
programs
New programs in Europe
growing at over 100% annually
11%
18%
2005
9 mos.
2006
9 mos.
* Excludes Dell U.S. joint venture.
Technology
Telco
Software
OP / Printing
Healthcare
Industrial
Growth Across Industry Segments and Geographies
U.S.
Canada
Latin
America
Asia
South
Pacific
Europe
Significant Presence
Significant Opportunity
Vendor Finance Competitive Positioning is Very Strong
Captives
Banks
Independents
Organization alignment
to support vendors
Residual management
Global reach
Specialized products and
structures
Balance sheet /
syndication capabilities
Key Attributes
Risk management expertise
Limited
Limited
Limited
Limited
Limited
Limited
Limited
Limited
Organizational Alignment is a Key Differentiator
Customer Centric Model
Global Accounts
Global Vendors with
centralized decision making
Strategic Accounts
Global Vendors with
decentralized (geographic)
decision making
Local Accounts
Single geography
Managed by Global Major
Relationships team
Coordinated by Global Major
Relationships team
Managed locally
Managed locally
Enhanced focus on Global and Strategic Accounts will
enable over 30% * annual volume growth
Over 30
Relationships
Over 60
Relationships
Over 1,000
Relationships
* Excluding Dell U.S. joint venture.

Specialty Finance Group
Global Focus
Vendor Finance
Industrial
Healthcare
Technology / Office Products
CIT Bank
Global Focus
Vendor Finance
Industrial
Healthcare
Specialty Finance Group
Technology / Office Products
CIT Bank
Consumer / Small Business Lending Overview
U.S. Focus
Consumer /
Small Business Lending
Home Lending
Student Loan Xpress
Small Business Lending
Insurance Services
CIT-Wide
Consumer / Small Business Lending Performance
11.6
392
5.7
10.5
283
387
Volume
($ Billions)
Revenue
($ Millions)
Managed Assets
$20 B
ROE
13.4%
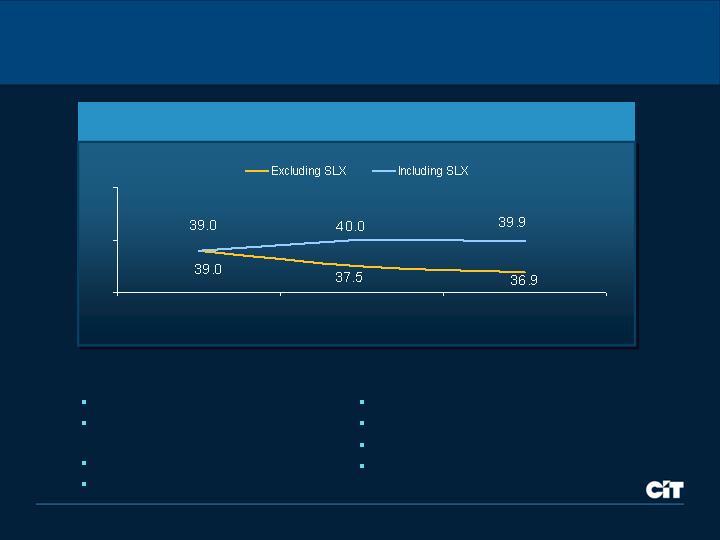
ROE
16.6%
(excludes SLX Goodwill)
2004
2005
2006
9 mos.
2004
2005
2006
9 mos.
Net Income
($ Millions)
110
75
100
2004
2005
2006
9 mos.
Data as of or for the nine months ended September 30, 2006.
Home Lending: At-a-Glance
2006 Business Highlights
Proven, disciplined originator
Over 250 sales representatives
Over 2,500 broker relationships
Strong portfolio management through
all cycles
2007 Strategy
Increase sales and operations productivity
Leverage originate and sell capability
Maintain competitive position
Continue risk and target market discipline
Enhance loan origination technology
Volume
($ Billions)
2004
2005
2006
9 mos.
5.8
4.6
6.9
Disciplined Portfolio Approach
Geographic Diversification
17%
12%
10%
20%
22%
19%
24% U.S.
non-prime market
Portfolio Demographics
2005
2006
2005
2006
Data as of September 30 (Current LTV as of June 30).
Borrower
Characteristics
FICO
631
636
Debt to Income
39%
40%
Length of employment
9
8
Length of residence
9
8
Loan
Characteristics
Loan Size
$112K
$120K
% Fixed
46%
44%
Loan to Value
81%
81%
at Origination
Current LTV
70%
69%
Student Loan Xpress: At-a-Glance
2006 Business Highlights
12th largest loan originator
~1,200 school channel partners
(doubled in 18 months)
State-of-the-art servicing facility
2007 Growth Initiatives
Continue investment in sales coverage
Increase school channel penetration
Increase productivity through scale and
systems enhancement
School Channel Partners
2004
2005
2006
9 mos.
Volume
($ Billions)
2004
2005
2006
9 mos.
4.7
1.6
2.7
1,198
601
876
Small Business Lending: At-a-Glance
2006 Business Highlights
#1 SBA 7(a) lender to small businesses
– seven consecutive years
Leading lender to women and minorities
Market leader in medical, dental and
day care segments
2007 Growth Initiatives
Increase sales and servicing productivity
Enhance market coverage through expanded 504
and conventional loans
Expand intermediary strategy
(franchise and hospitality)
Continue to focus on cross-sell opportunities
Volume
($ Billions)
2004
2005
2006
9 mos.
0.7
0.8
0.9
Global Insurance Cross-Sell Momentum
Core Business Model
Integrated cross-sell model
Distribution focus
Centralized expertise; ‘thin infrastructure’
Recurring non-spread revenues
High margins
2007 Growth Initiatives
Expand product set
Consumer based programs
Commercial insurance capabilities
to small business & middle market
companies
Accelerate rollout in Europe,
Canada and Australia
Revenue
($ Millions)
2006
9 mos.
21
26
2005
2004
CAGR: ~30%
28
Deposits
($ Billions)
CIT Bank: At-a-Glance
Origination Strategy
Funding Strategy
Unsecured consumer installment lending
through targeted intermediaries
Fee income generated through bank
affiliation programs
Focused on consumer, personal and
household markets
Leverage deposit market for lower
cost funding
Broker deposit market
Participation in deposit sweep
programs
0.3
2.2
Assets
($ Billions)
0.4
2.6
Sep.
2006
Sep.
2005
Sep.
2006
Sep.
2005
Well-Positioned for Continued Success
Specialty Finance Panel
Jeffrey Simon
Vendor Finance, Global Major Relationships
Michael Shaut
Student Loan Xpress, a CIT Company
Terry Kelleher
Vendor Finance, Europe, Asia and South Pacific
Randall Chesler
Consumer Finance, Home Lending
Christine Reilly
Small Business Lending
Dublin (Europe)
Shanghai (Asia)
Sydney (South Pacific)
Servicing Centers
International growth
Barclays vendor finance
acquisition
$2 Billion portfolio
$1 Billion volume
IT / Industrial leasing in U.K.,
Germany
Microsoft rollout in Europe
U.K.
Germany
France
Switzerland
Scalable platforms
Pan-European: Dublin
Pan-Asian: Shanghai
South Pacific: Sydney
Vendor Finance Europe, Asia, South Pacific
Vendor Finance, Global Major Relationships
Global Relationship Management
Coordination and Expansion
Latin
America
North
America
Europe
Asia/
South
Pacific
Global relationship management
Consistent execution
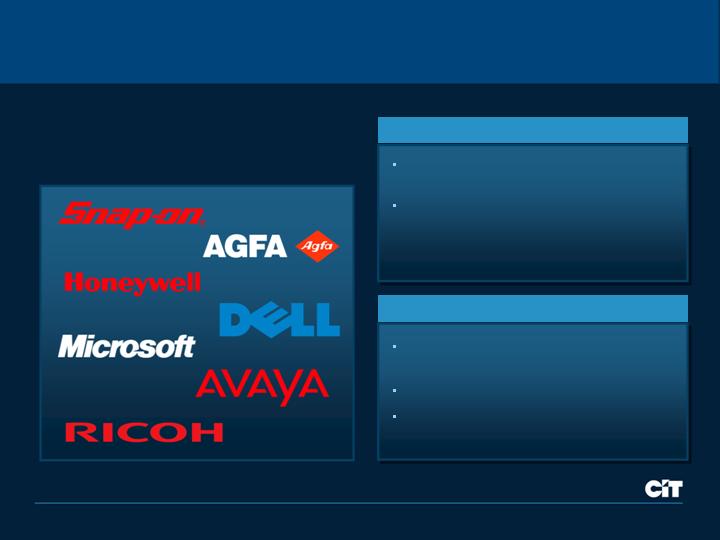
Cross-CIT coordination
Dell relationship
Growing internationally
Building new global
relationships, including
Microsoft
AGFA
Honeywell
Expanding relationships
to new geographies, including
Avaya
Heidelberg
Toshiba

Small Business Lending
Key Messages
#1 SBA 7(a) lender – seven consecutive years
Market coverage
Increased sales presence
Focus geographies
Flow partnerships
Growth segments
Hospitality
Franchise
Expanded product set
SBA 504 lending
Conventional small business product
(real estate)
Strategic marketing focus to improve lead
generation / targeting
Servicing excellence

Consumer Finance, Home Lending
Demographics
Consistent market player through cycles
Disciplined origination strategy
Strong partner relationships
Sales presence across U.S.
Local underwriting capabilities
Portfolio management expertise
Geographically diversified
Limited exposure to high-volatility
markets (e.g., coastal properties)
Proven / experience-based products
Technology investments
BrokerEdge enhancements
New loan origination system
Data as of December 31, 2003 and September 30, 2006.
2003
2006
FICO
625
636
Debt to Income
38%
40%
Length of employment
9
8
Loan Size
$87K
$120K
House price
$109K
$148K
LTV at origination
80%
81%
Successful CIT integration
Growth story
12th largest originator
Extensive industry expertise
Best-in-market sales force
1,200 school relationships
The CIT advantage
Balance sheet strength
Marketing and brand recognition
Sales culture
Investment in technology
Focus on school penetration
Top schools
Corporate relationships
Top 10 servicing facility: over $5 billion
in managed assets
Student Loan Xpress, a CIT Company
UT Austin
Texas A&M
Pepperdine
USC
Remington
Florida State
DeVry
Capella
Portland
State
Wisconsin
Widener
Temple
Columbia
Auburn
Univ. of
Arizona
Thomas
M. Cooley
Saint
Louis
Univ. of
Oklahoma
Inter American
Meharry
Wichita
State
Akron

Credit & Risk Management
Lawrence Marsiello
Vice Chairman and
Chief Lending Officer

2006 Progress and 2007 Expectations
Well-positioned to perform through the cycle
Robust and consistent credit grading methodology and process
Risk-based pricing and capital allocation
Active portfolio management approach
Creating more stable and predictable credit performance

Credit Execution Agenda
Key portfolio attributes
Diversification
Cross-business correlations
Counter-cyclicality
Credit management science
Delivering superior credit performance
Consistency
Lower volatility in credit metrics
Stable risk-adjusted returns
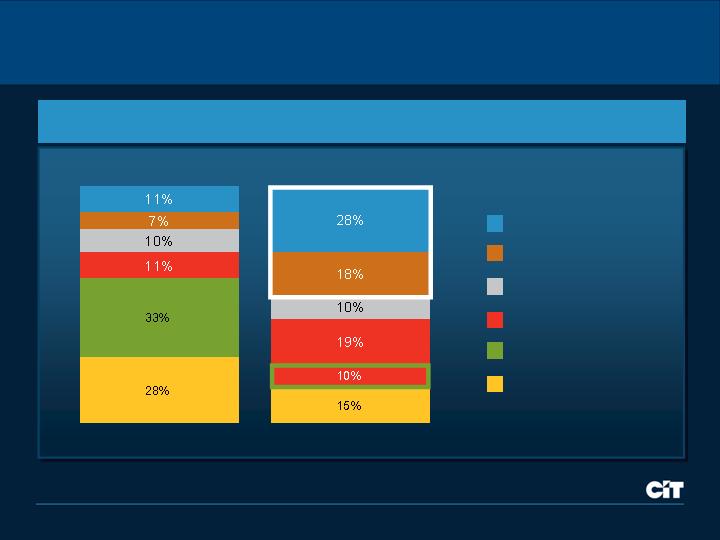
Balanced Portfolio
Consumer / SBL
Vendor Finance
Trade Finance
Corporate Finance
Equipment Finance*
Transportation Finance
1996
Sept 2006
$17 Billion
$72 Billon
Composition of Managed Assets
* Equipment Finance was combined with Corporate Finance in 2006.

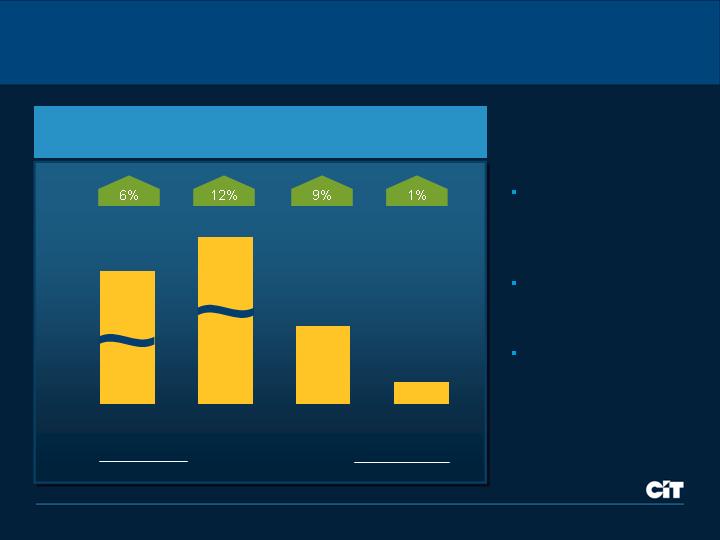
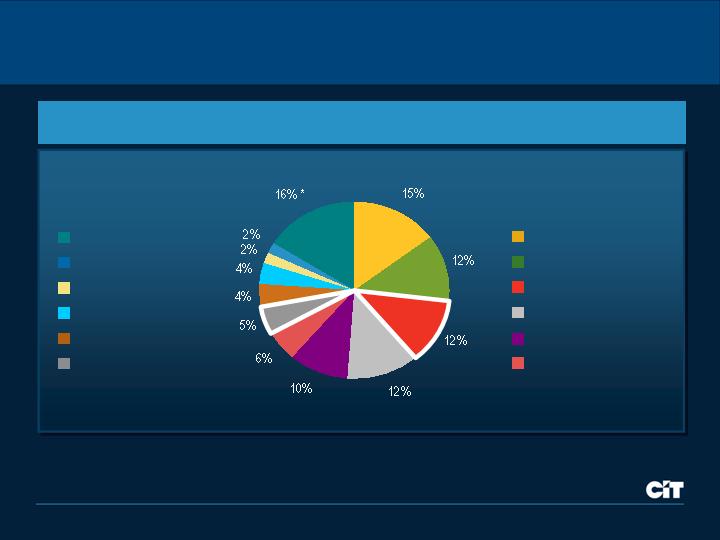
Client Ratings Reflect Middle Market Focus
A-AAA
BBB
BB
B
Below B
6%
12%
39%
37%
6%
* Risk grading based on credit quality of obligor and probability of default.
Portfolio by Risk Grade*
Focus on transactions just below
investment grade
Minimal change in our client
risk profile
-
Consistent market focus
-
Continuously refine
underwriting criteria

Top 10 Exposures
High ratings for large hold positions = less portfolio value at risk
B
Transportation Finance
207
Aerospace
10
BB
Transportation Finance
219
Aerospace
9
BBB
Trade Finance
228
Retail
8
B
Transportation Finance
233
Aerospace
7
A
Trade Finance
235
Retail
6
BB
Transportation Finance
292
Aerospace
5
D
Corporate Finance
62
Energy
4b
B
Corporate Finance
231
Energy
4a
BBB
Trade Finance
309
Retail
3
AA
Trade Finance
379
Retail
2
BBB
Transportation Finance
395
Rail
1
Rank
Industry
Amount
Business
Facility Grade
($ millions)
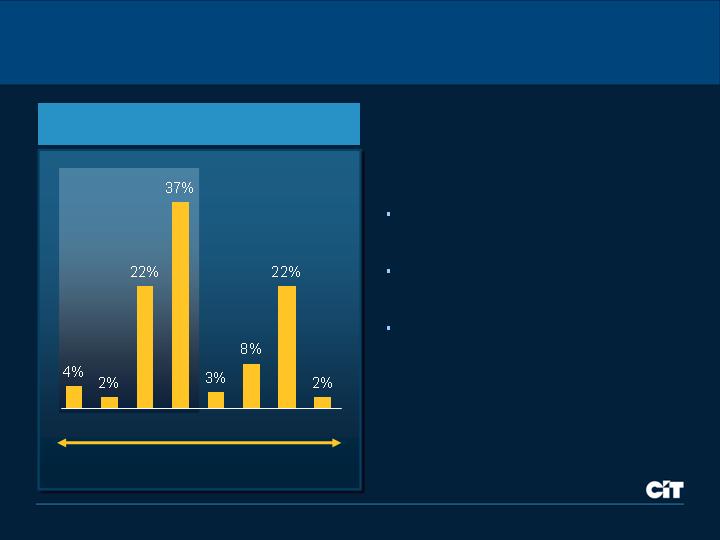
Broad Geographic Dispersion
Northeast
West
Midwest
Southeast
Southwest
Canada
Europe, Latin
America and Asia
Asset Diversification
(% Financing and Leasing Assets)
Data as of September 30, 2006.
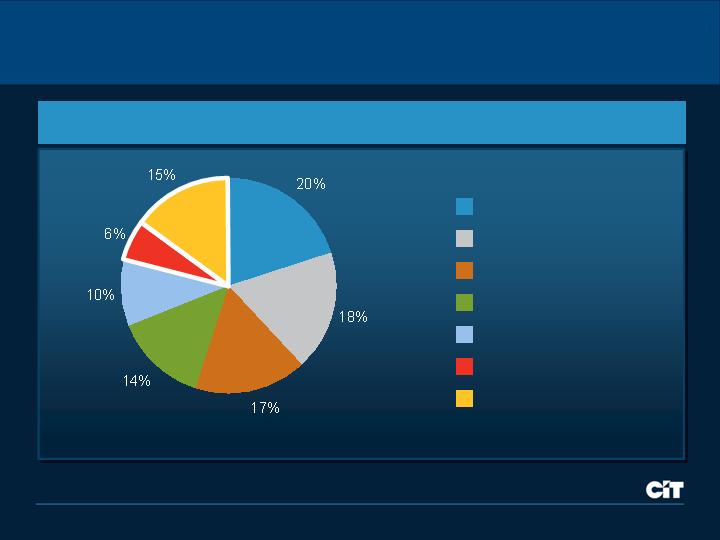
Diverse Industry Profile
Home Lending
Manufacturing
Educational Lending
Retail
Commercial Air
Services
*No other industry served greater than 2%.
Data as of September 30, 2006.
Other*
Communications
Consumer Other
Wholesale
Transportation
Healthcare
Asset Diversification
(% Financing and Leasing Assets)
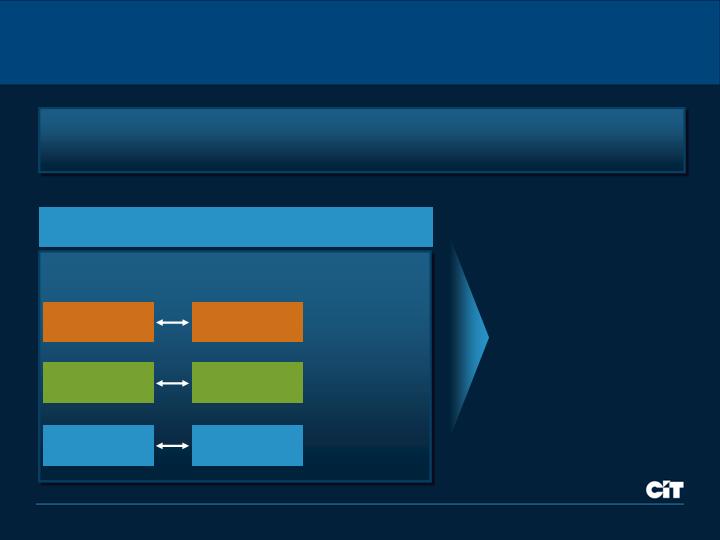
Portfolio Correlation Analysis
Less credit loss
volatility than
monoline companies
Modeled business segments
to anticipate performance through credit cycles
Corporate
Finance
Transportation
Finance
Trade
Finance
Transportation
Finance
Vendor
Finance
Consumer
Finance
Credit Performance Linkage
(% of Average Finance Receivables)
Sample correlations:
STRONG
(38%)
MODERATE
(34%)
NEGATIVE / LOW
(28%)
Limited Economic Sensitivity
Negative /
Low
Portfolio Correlation to U.S. Economy
(% of Financing and Leasing Assets)
65% portfolio minimally
correlated to US economy
Adjusting mix to non-cyclical
industries
Well-equipped to manage risk
in cyclical industries
Strong

More decisions made closer to the customer
Improving Risk Skill Set
Consistent views of portfolio volatility
Consistent skill sets
Consistent processes
Developing Intellectual Capital
Identifying gaps and making
investments across the business
Providing additional training to
existing teams
Adding new talent to the
organization in critical roles
Driving Empowerment
Using two-tier risk rating system
and standard processes
Larger decision authorities
pushed down into units
Aligned compensation to reward
growth, risk balance and margins

Active Credit
Portfolio
Management
Risk-adjusted ROE /
Economic profit
ROE
Income
Performance
Measure
Portfolio driven
Risk based
Traditional
Pricing
Credit portfolio manager
Originators / Credit
Originators
Ownership
Originate, portfolio
optimization, hedging
and redistribution
Mostly originate and hold, some
use of risk mitigation tools
Originate and hold
Investment
Philosophy
Transaction specific, with some
regard to overall portfolio
Transaction-by-transaction
Marginal impact relative
to existing portfolio
Transaction
Evaluation
Evolving Credit Portfolio Management
Aggregate Portfolio Management
Sophistication
Current State
Pre-2004
2004 - 2005

Enhanced Credit Portfolio Management
Transition matrix
Market data
Credit conversions
Loss-given defaults
Etc.
Modeling
Parameters
Simulation Setting Options
Confidence interval
MTM / book value
No. of simulations
Portfolio
Parameters
Correlations
Simulation Summaries
Loss Distribution
Sampling
Stress tests
Horizon
Greater Depth
of Model Inputs
Improved Ability to
Manage Risk
More Simulation
Options
+
=
Reporting
tables
Obligors,
transaction
data
Reference
data
(industry,
ratings,
etc.)
Data Inputs
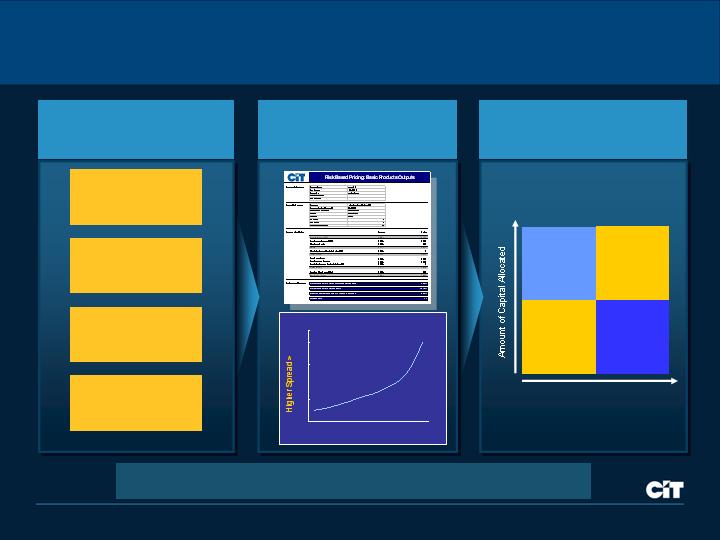
Transition to three common pricing models
Improved Risk Based Pricing
Probability of
Default
Cost of Funds
Operating
Expenses
Capital
Allocation
Standard RBP Modeling
Methodology
Risk-
Adjusted
Returns
Under-
performing
Asset Portfolio
Risk-
Adjusted
Returns
Missed
Opportunities
Asset Risk
High
High
Low
Consistent Outputs
Guide Credit,
Sales Organizations
Common Input
Parameters
Increasing Risk >
PRICING CURVE
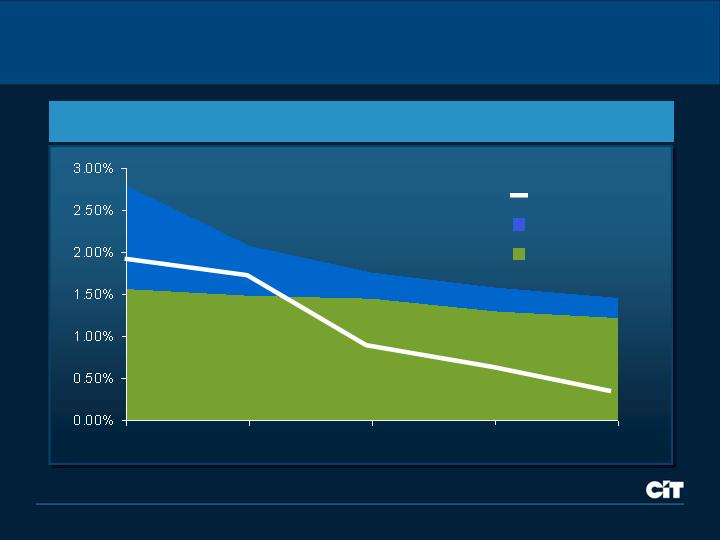
Charge-Off History
(% Average Finance Receivables)
Historic Credit Losses
Expect 2007 to remain below full cycle credit losses
2003
2004
2005
2006
9 mos.
2007 (E)
Full Cycle
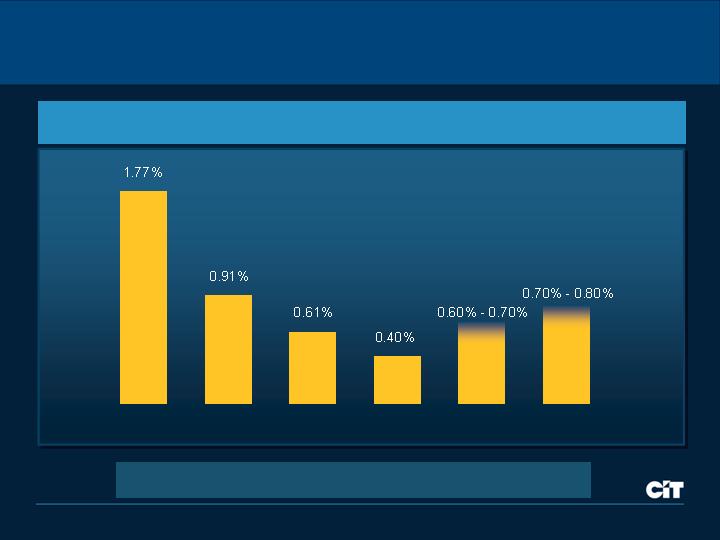
Consistent Reserve Coverage
Loan Loss Reserves vs. Charge-Offs*
(% Finance Receivables)
1.92%
1.77%
0.91%
0.61%
0.40%
1.57%
1.49%
1.46%
1.31%
1.22%
Charge-Offs
Specific
General
* Excludes Student Loan Xpress finance receivables.
2002
2003
2004
2005
2006
9 mos.
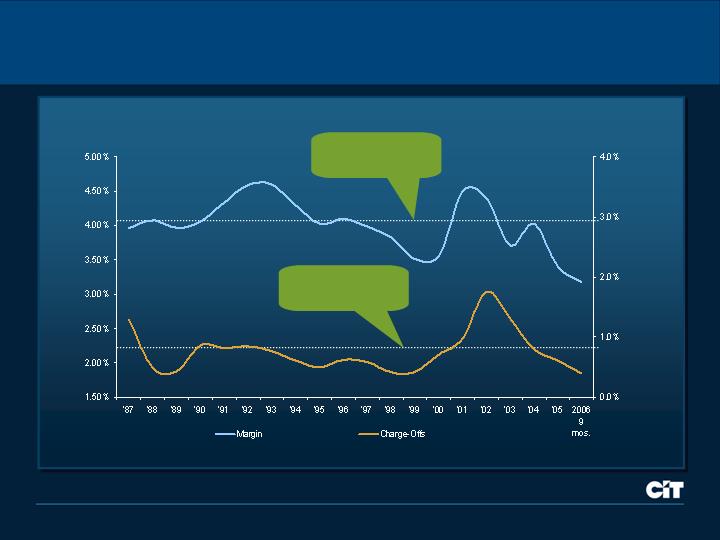
Stable Margin In All Environments
Margin
(% AEA*)
* Average Earning Assets
** Average Finance Receivables
Charge-Offs
(% AFR **)
20 Year
Average: 4.00%
20 Year
Average: 0.76%

2006 Progress and 2007 Expectations
Well-positioned to perform through the cycle
Robust and consistent credit grading methodology and process
Risk-based pricing and capital allocation
Active portfolio management approach
Continual investment in transactional level talent, skills and processes
Robust syndication capabilities for risk distribution and portfolio optimization
Creating more stable and predictable credit performance

Finance
Joseph M. Leone
Vice Chairman &
Chief Financial Officer

Financial Execution Agenda
Optimizing the balance sheet…
Robust liquidity
Resilient liability structure
Disciplined capital management
Strong capital generation
Strong credit ratings
…to drive financial performance
Leveraging originations
Managing net finance revenue
Improving productivity
Prudent tax planning
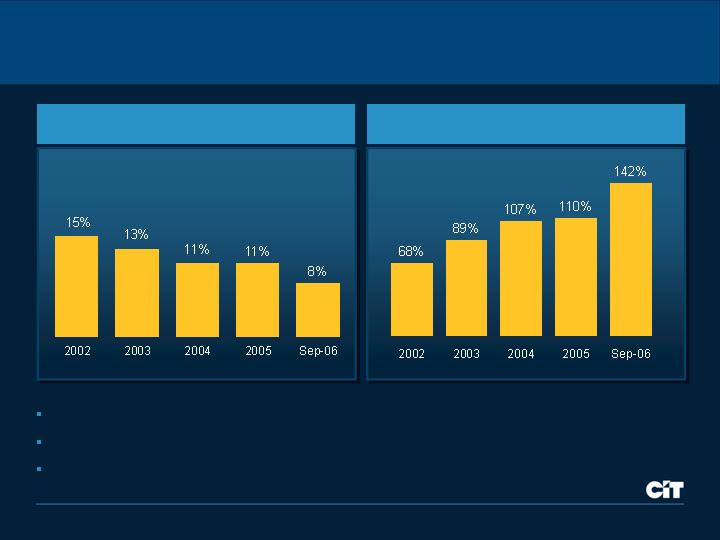
Robust Liquidity
* Includes available bank facilities, asset backed conduit facilities and cash.
Commercial Paper / Total Debt
Alternate Liquidity* / Short Term Debt
$6.3 Billion committed multi-year, unsecured credit facilities
$9.4 Billion committed asset backed commercial paper facilities
CIT Bank – deposits and Federal Home Loan Bank
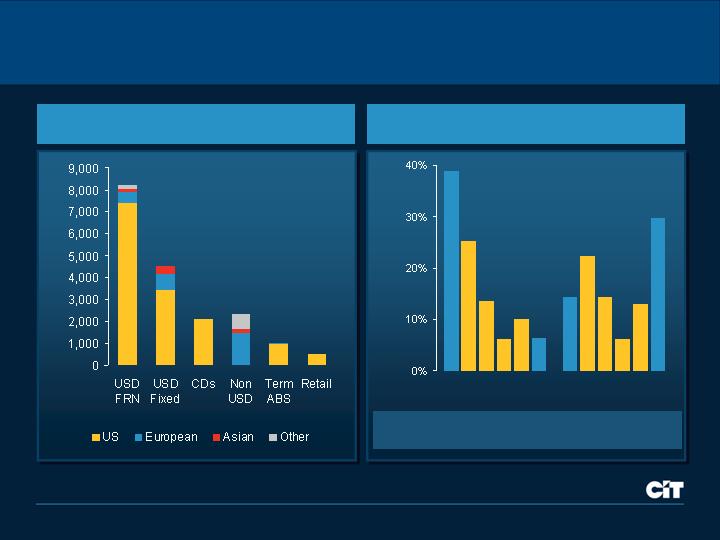
Resilient Liability Structure
Average
Term:
1.9 yrs
4.6 yrs
1
2
3
4
5
5+
1
2
3
4
5
5+
2000
2006
2006 (9 mos.) Term Funding
Debt Maturity Distribution
Disciplined Capital Management
Barclays vendor finance
German factoring
RBS / Citizen’s portfolio
Immediately accretive
Short-term achievement of ROE hurdle
Bolt-on to existing platforms
Mergers &
Acquisitions
Expand syndication capabilities
Asset management complement
Generate optimal ROE
Asset-based capital allocation
Capital
Deployment
Programmatic share repurchase
$500 million ASR executed in 2005
Support compensation program
Opportunistic strategies
Share
Repurchase
Payout Ratio of 15% - 20%
Stable dividend within peer group
Capital retention to support growth
Dividends
Common and preferred / hybrid
15% available; 10% used
Efficient and flexible
Capital Structure
Target ~9.00%
Address portfolio risk
Capitalization
Philosophy
Actions
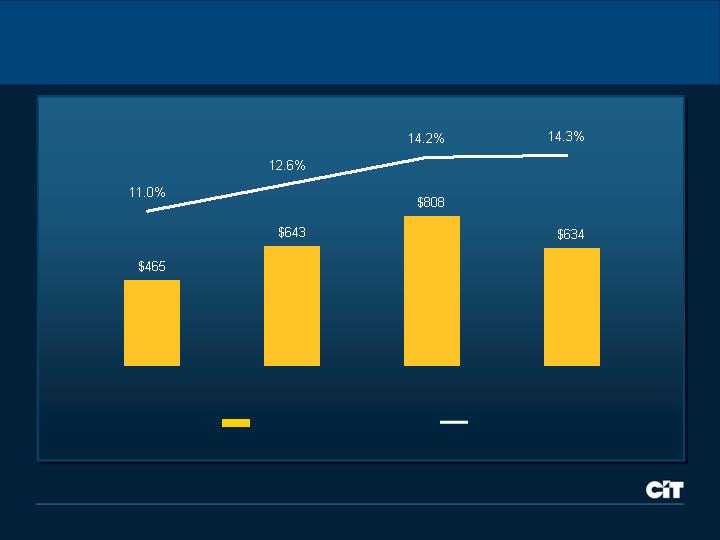
Strong Capital Generation
Net Capital Generation
($ Millions)
ROE
2003
2004
2005
2006
9 mos.
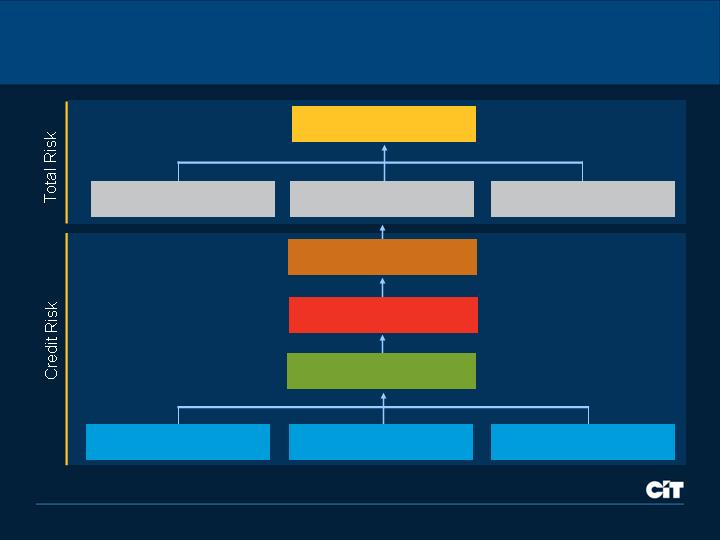
Rigorous Capital Allocation
Required Capital
Transactional Credit Risk
Portfolio Correlations
Transactional Data
Modeling Parameters
Simulation Settings
Market Risk
Goodwill
Operational Risk
Portfolio Credit Risk (VAR)
2007 Segment Capital Allocations
No. of Sub-
Segments
Capital
Range
5%
6%
11%
11%
12%
1% - 20%
2% - 15%
5% - 15%
5% - 20%
8% - 15%
5%
5
Consumer and SBL
9%
15
Vendor Finance
Specialty Finance
14%
4
Transportation Finance
10%
15
Corporate Finance
10%
4
Trade Finance
Commercial Finance
Segment Allocations
2006
2007 Refinements
Segment
Average
Leveraging Originations
Balance Sheet
76%
Sold / Syndicated
24%
Investment Vehicles
2007 Initiatives
‘Hold’
‘Partner / Invest’
‘Distribute’
Loan / Lease
Volume
Managing Net Finance Revenue Dynamics
(0.11%)
Funding Strategy
3.03%
Q3 2006
(0.08%)
Fees and Other
(0.10%)
Market Pricing
(0.10%)
Leverage
(0.17%)
Yield Curve
(0.35%)
Portfolio Mix
3.94%
2004
2007 Impact
Net Finance Margin
Efficiency ratio improvement expected
2007
Impact
Net
Revenue
($ Millions)
Operating
Expense
($ Millions)
Efficiency
Ratio
(%)
$3,175
---
---
---
$400
$300
$2,475
44%
1.3%
1.0%
(1.6%)
1.1%
2.4%
40%
---
$30
Options
---
$40
Other
$190
New businesses
$1,410
Q3 2006 (annualized)
---
($50)
Expense take-outs
$200
Business expansion
$1,000
Q3 2004 (annualized)
Targeting Productivity
Prudent Tax Planning
Effective Tax Rate
39.0%
34.8%
30.5%
Sustainable Earnings
Net Income
($ in Millions)
Real GDP
(%)
CAGR: 19%
Net Income
($ in Millions)
Real GDP
(%)
Net Income
US GDP
CAGR: 24%
-1
0
1
2
3
4
5
-1
0
1
2
3
4
5
Pre-IPO
Post-IPO

2007 Focus
Efficiency
Allocate corporate expenses
Improve efficiency ratio by ≥2%
Tax rate ≤30%
Funding
$16 - $18 billion issuance
Over 20% issuance non-dollar
Grow deposits to $4.0 billion
Refinance $1.3 Billion
high-cost debt
Capital
Manage to optimal capitalization
Composition
Share repurchase
Target capital ratios
Rating Agencies
Two Agencies with positive
outlook
Aspire to high single A ratings

Outlook
Jeffrey M. Peek
Chairman & Chief Executive Officer
2007 Segment Performance Expectations
Corporate
Finance
Strong originations
Higher fees
Improved productivity
Trade
Finance
Modest growth
Expanding breadth
Stable credit
Transportation
Finance
Consistent expansion
Solid utilization
Efficient tax structure
Vendor
Finance
Strong global volume
Increased productivity
Stable credit
Consumer /
SBL
Focused growth
Strong fees
Seasoning portfolio
Key Take-Aways
Drive volume through sales force productivity
Consistent credit performance
Stable margins and increased tax efficiency
Strong business momentum and focused execution plans

2007 Earnings Guidance
Target
………………
DO NOT PRINT
GUIDANCE IN BOOKS
EPS
ROE
………………

CIT Investor Conference 2006
Executing for Performance