
Lehman Conference
London
May 16, 2007
Exhibit 99.1

Notices
Forward Looking Statements
Certain statements made in these presentations that are not historical facts may constitute “forward-looking” statements under the Private Securities
Litigation Reform Act of 1995, including those that are signified by words such as “anticipate”, “believe”, “expect”, “estimate”, “target”, and similar
expressions. These forward-looking statements reflect the current views of CIT and its management and are subject to risks, uncertainties, and changes
in circumstances. CIT’s actual results or performance may differ materially from those expressed in, or implied by, such forward-looking statements.
Factors that could affect actual results and performance include, but are not limited to, potential changes in interest rates, competitive factors and
general economic conditions, changes in funding markets, industry cycles and trends, uncertainties associated with risk management, risks associated
with residual value of leased equipment, and other factors described in our Form 10-K for the year ended December 31, 2006 and 10-Q for the quarter
ended March 31, 2007. CIT does not undertake to update any forward-looking statements.
Non-GAAP Financial Measures
The data provided in these presentations have been modified from our previously reported periodic data, including, but not limited to, the exclusion of
certain noteworthy transactions and nonrecurring events, because management believes that the data presented herein better reflects core operating
results. As such, the data will vary from comparable data reported in CIT’s Forms 10-K & 10-Q. The data provided in these presentations have not been
examined by independent accountants and is not presented in accordance with generally accepted accounting principles (“GAAP”).
These presentations include certain non-GAAP financial measures, as defined in Regulation G promulgated by the Securities and Exchange
Commission. Any references to non-GAAP financial measures are intended to provide additional information and insight into CIT’s financial condition
and operating results. These measures are not in accordance with, or a substitute for, GAAP and may be different from or inconsistent with non-GAAP
financial measures used by other companies.
For a reconciliation of these non-GAAP measures to GAAP and a list of the transactions and events excluded from the data herein, please refer to the
appendix within this presentation or access the reconciliations through CIT's Investor Relations website at www.cit.com ..
This presentation is derived from CIT’s publicly available information and is to be used solely as part of CIT management’s continuing
investor communications program. This presentation has not been prepared in connection with, and should not be used in connection with,
any offering of securities by CIT. For the sale of any securities by CIT you are directed to rely only upon the offering document for those
particular securities.
Data as of or for the period ended March 31, 2007 unless otherwise noted.
2
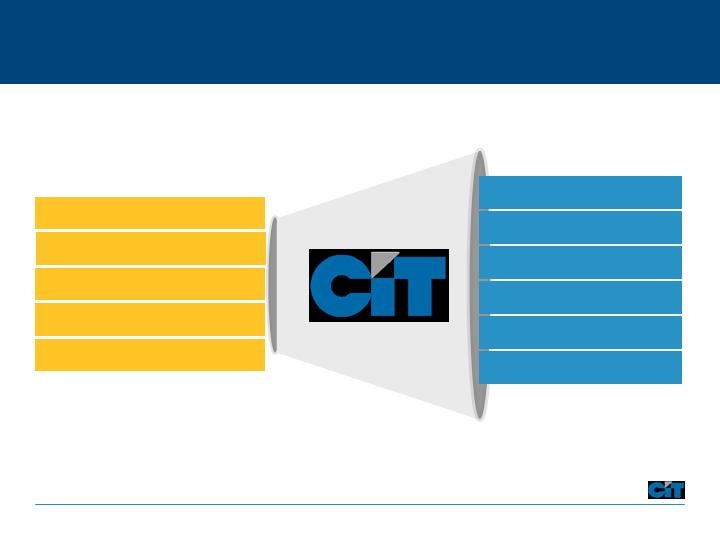
Building on 99 Years of Success
$11 Billion Market Capitalization
Global Servicing Capabilities
Customized Financial Solutions
Strong Credit Culture
Managed Assets $80 Billion
Premium Brand
Diverse Portfolio
3

Solid Start to 2007
Increased 22%
$65,503
$79,712
Managed Assets
Increased 15%
$1.13
$1.30
EPS
Increased 60 basis points
14.2%
14.8%
ROE
Improved 140 basis points
45.7%
44.3%
Efficiency Ratio
Continued excellence
0.37%
0.39%
Net Charge-offs
Increased 14%
$707
$809
Revenue
Increased 24%
$8,716
$10,779
Volume
Comment
Q1 2006
Q1 2007
Metric
($ millions, except EPS)
4

2007 Initiatives
Leverage asset manager model
Drive operational excellence
Proactively manage risk and capital
Expand global footprint
5

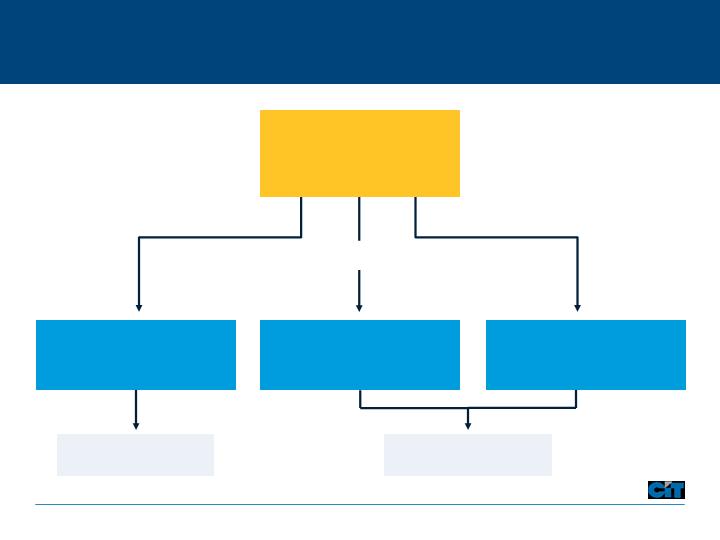
Expanding the Asset Manager Model
Transportation Finance
Develop
aerospace
investment vehicle
Corporate Finance
Enter CLO market
and launch
Healthcare REIT
Consumer/SBL
Increase
originate-to-sell
activity
Release capital
Manage risk
Common Objectives
Provide ongoing capital source
Build non-spread revenue
Leverage platform
Maintain growth
6
Leveraging Originations
Balance Sheet
74%
Sold / Syndicated
26%
Investment Vehicles
2007 Initiatives
‘Hold’
‘Partner / Invest’
‘Distribute’
2006
Loan / Lease Volume
($41 billion)
Net Finance Income
Non-Spread Revenue
7
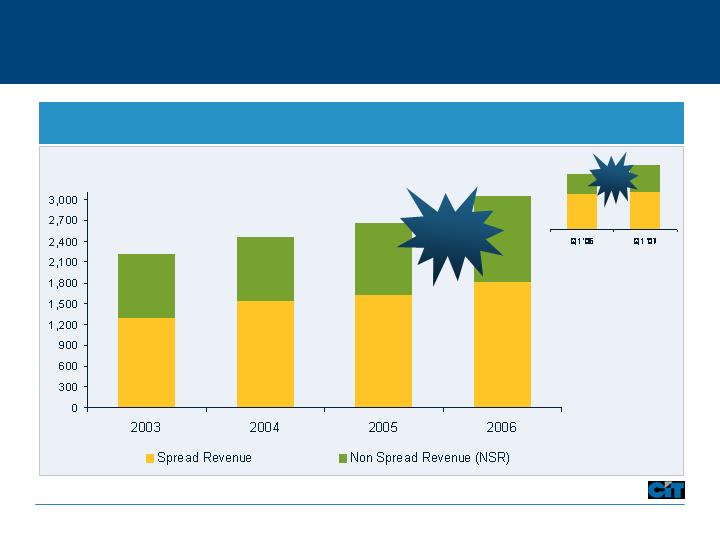
Balancing Revenue Growth
Revenue Composition
($ in Millions)
$2,218
$2,661
$2,452
$3,057
22%
NSR
Growth
$707
$809
26%
NSR
Growth
8
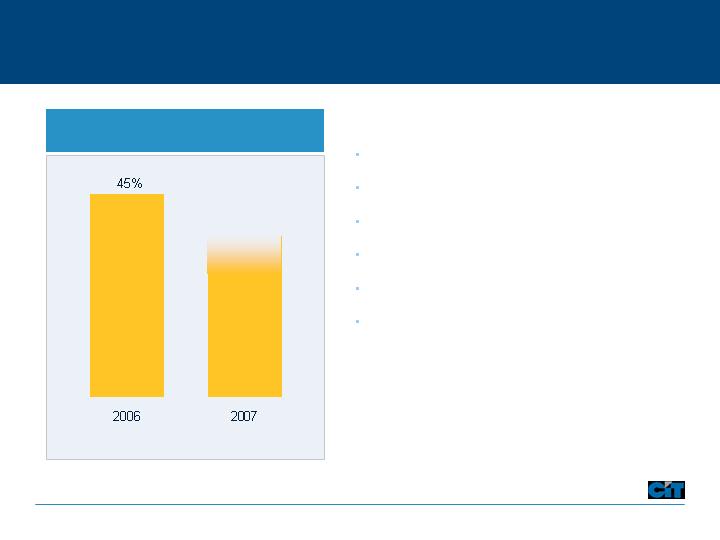
Driving Operational Excellence
*Guidance as presented on November 7, 2006. This should not be construed as an affirmation or update of that guidance.
* Excludes acquisitions.
Increase sales force productivity
Scale international operations
Consolidate leasing platforms
Expand shared services model
Offshore select functions
Control headcount
Efficiency Ratio
~ 42%
Target
9
Gaining Global Traction
Europe
Acquired factoring platform in Germany
Expanding global relationship with Microsoft
Acquired vendor business in U.K. and Germany
Canada
Full suite of commercial products and services
Expanding middle-market corporate finance team
Asia Pacific
Largest foreign owned leasing company in China
Centralizing vendor servicing in Shanghai
Servicing aerospace region through Singapore
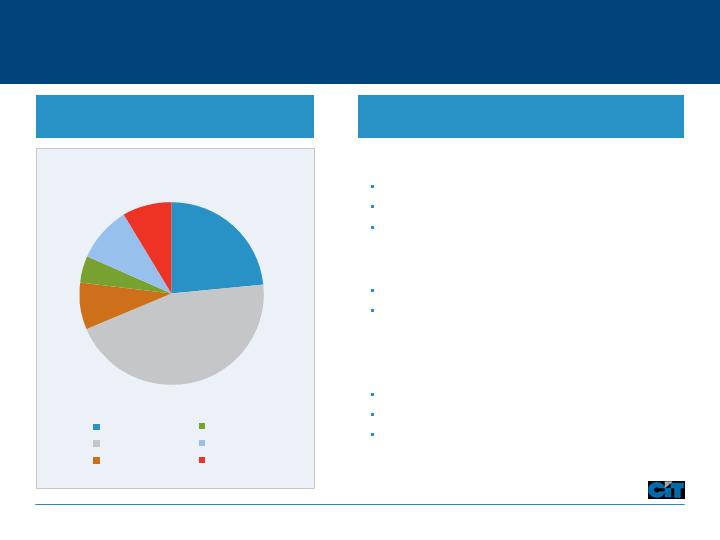
International Portfolio Assets
Canada
Europe
South Pacific
Asia Pacific
Latin America
Other
Recent Initiatives
Approx. $17 billion
24%
45%
8%
5%
10%
8%
10
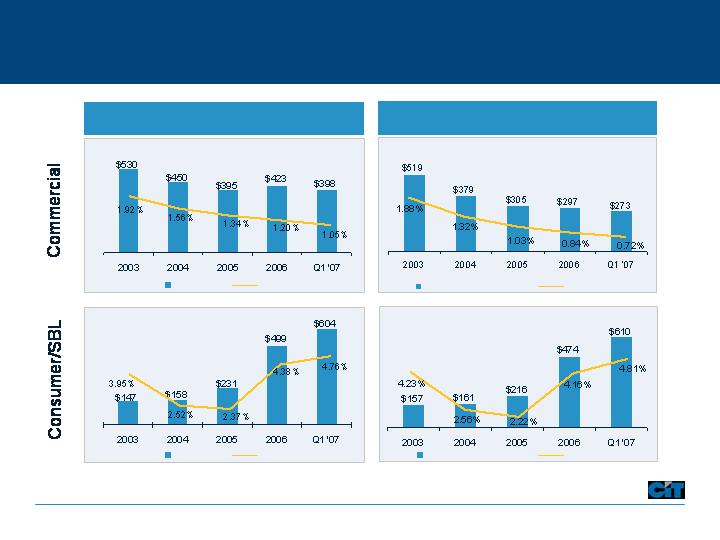
Non-Performing Assets
Monitoring Credit Quality
Delinquency 60+ Days
Owned portfolio statistics; Consumer/SBL excludes Student Loan Xpress
% of FR
Non-Accrual
Delinquent
% of FR
% of FR
Non-Accrual
Delinquent
% of FR
11
Responding to a Challenging Home Lending Market
Softening housing market
Reduced prepayment speeds
Tighter secondary market pricing
Industry consolidation
Market Trends
Initiatives
Tightened underwriting criteria
Added loss mitigation resources
Closed offices
Targeted collection efforts
Raised pricing
Increased reserves
Rising delinquencies
12
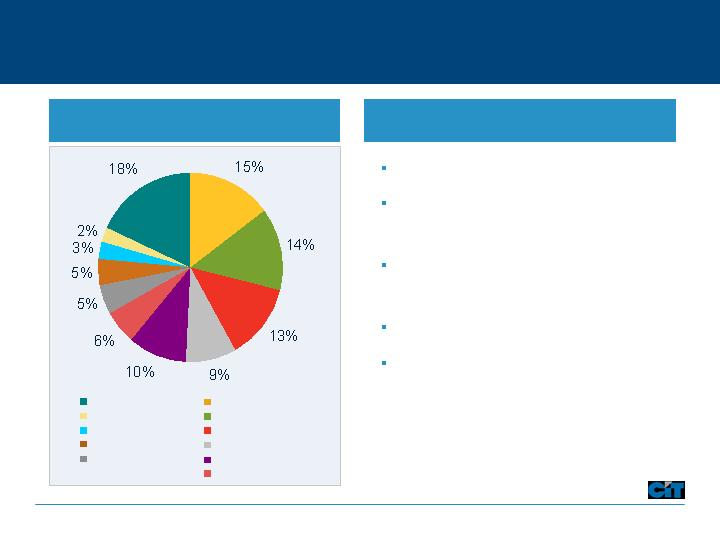
Performing Through The Business Cycles
Entered non-cyclical industries
Expanded risk management
capabilities
Managing capital in more cyclical
industries
Building international franchises
Expanding non-spread revenue
sources
Initiatives
Balanced Portfolio
(% Financing and Leasing Assets)
Home Lending
Manufacturing
Educational Lending
Retail
Commercial Air
Services
Other*
Consumer-Other
Wholesale
Transportation
Healthcare
*No other industry served greater than 2%.
13
Defining Success
Strategy
2007 Performance Measures
Advance sales culture
Double digit revenue growth
Achieve balanced asset manager model
Broad based asset growth and higher fee income
Expand global footprint
Generate 25% of income/assets internationally
Drive operational excellence
Single digit expense growth, ~ 42% efficiency ratio
Maintain credit discipline
Losses < 70 basis points
Optimize capital structure
Reduce cost of capital
Improve profitability
EPS $5.40-5.50 (13-15% growth)
Enhance returns
ROE 15% (achieve target set in 2004)
14
Q1 Headwinds and Tailwinds
Margin Compression
Home Lending
Asset Growth
Commercial Credit Quality
Capital Initiatives
15

Long-term Growth Agenda
EPS Growth
Low – Mid
Teens
The leading global finance company for the middle market
ROE
Mid - Upper
Teens
16

Keys to Enhancing Long-term Profitability
Leverage originations platform
Drive capital allocation and efficiency
Further credit and cost disciplines
Balance revenue streams
17

Appendix
Managed Assets - $80B
Business Overview
Aerospace & Railcar Leasing
Asset Based Lending
Equipment Lending & Leasing
Factoring & Trade Finance
Financial Advisory Services
Project Financing
SBA Lending
Student Lending
Vendor Finance
Trade
Finance
Transportation
Finance
Vendor
Finance
Consumer/
Small
Business
Lending
Corporate
Finance
Leadership Positions
Data as of December 31, 2005
19

Trade Finance
Leading factoring business in the U.S.
Vital credit bridge between vendors and retailers
Provide credit insurance, loans and back-office processing
Superb track record of navigating retail credit cycles
Long-term client relationships – average 10+ years
Expanding international presence
Highly efficient processor
Annuity-like earnings
Value
Drivers
Low-cost
provider
International
capabilities
Innovative
technology
Relationship
oriented
20
20

Transportation Finance
Top 3 global aerospace and North American railcar lessor
Attractive and modern fleets
Aerospace – own over 300 commercial and regional aircraft
Rail – manage over 100,000 railcar fleet
Full product offering with flexible deal terms
Four decades of experience
Strong relationships with deep market penetration
Experts in managing and maximizing collateral values
Seasoned equipment managers with proven residual
realization
21
Data as of December 31, 2005
Value
Drivers
Industry
knowledge
Collateral
expertise
Structuring
flexibility
Remarketing
capability
21

Corporate Finance
Leading provider of working capital to the middle market
Unique go-to-market strategy
Asset based lender to multiple industries
Healthcare, communications, media, entertainment, energy,
infrastructure, construction and industrial
Strong debtor-in-possession (DIP), turn around and
expansion financing capabilities
Deal-oriented and collateral protected
Long-standing referral relationships
Significant fee generator
22
Value
Drivers
Client
focus
Life-cycle
financing
Committed
presence
Industry
expertise
Trusted
advisors
22

Vendor Finance
Leading provider of global vendor finance solutions
Thousands of vendor relationships in the US and abroad
Preferred provider relationships with Dell, Microsoft,
Avaya, Snap-on-Tools, and other Fortune 500 companies
Efficient and scalable platforms
State-of-the-art transaction processing technology
Disciplined underwriting supplemented by behavioral
analysis
Collateral and residual management expertise
Global sales coverage (34 countries) with regional
servicing centers
23
Value
Drivers
Structuring
expertise
Global
capabilities
Integrated
systems
Low-cost
provider
23

Consumer / Small Business Lending
Home Lending:
Broker-driven origination network
Disciplined lending standards
Conservative product set
Centralized servicing
Student Lending:
Top player in student loan market
Preferred Lender at over 1,400 schools
Government guaranteed FFELP collateral
SBA Lending:
#1 provider of government backed 7(a) small
business loans for seven consecutive years
24
Value
Drivers
Intermediary
relationships
Efficient
servicing
Brand
recognition
Consistent
underwriting
24
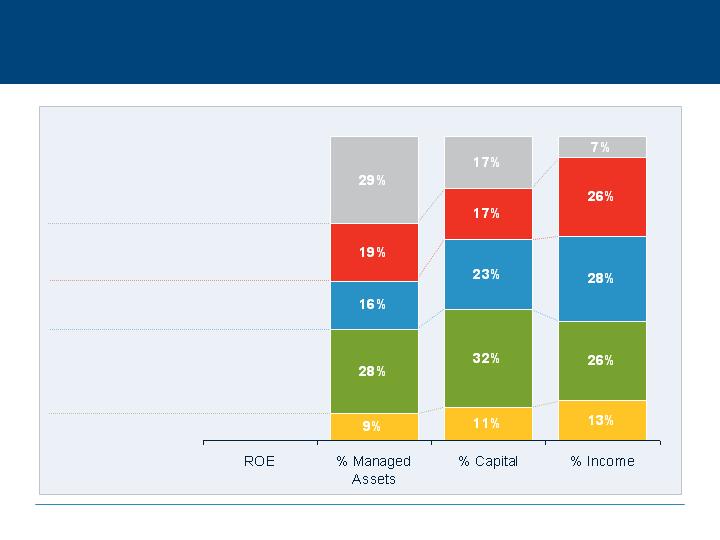
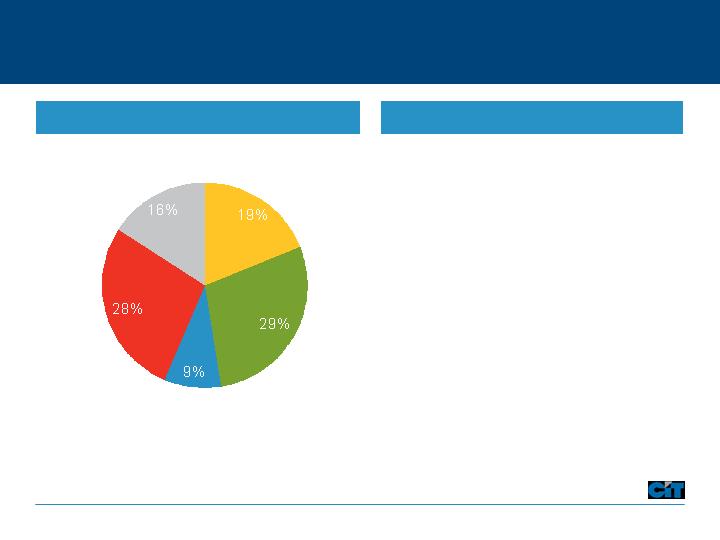
Segment Performance
Transportation Finance
Trade Finance
Corporate Finance
Vendor Finance
Consumer/SBL
$80 B
$8 B
$258 M
19%
17%
13%
20%
6%
25

Proven Acquisition Strategy
Doubled assets
Q1
4,300
Education Loans
EDLG
Solid returns
Q1
860
Factoring
SunTrust
Accelerated build out
Q3
500
Healthcare
HBCC
Closed April 30
Q2
2,000
Vendor Finance (US)
Citigroup
Realized synergies
Q3
700
Vendor Finance
CitiCapital
Strong volume
Q2
520
Technology Leasing
GATX
Completed integration Q107
Q4
700
Diversified equipment
RBS/Citizens
Included serviced fleet
Q4
90
Rail
Bombardier
Established foothold
Hit the ground running
Comments
165
2,000
Assets ($mm)
Q2
Factoring (Germany)
Enterprise Finance
Q1
Vendor Finance (Europe)
Barclays
Closed
Asset Type
Seller
26
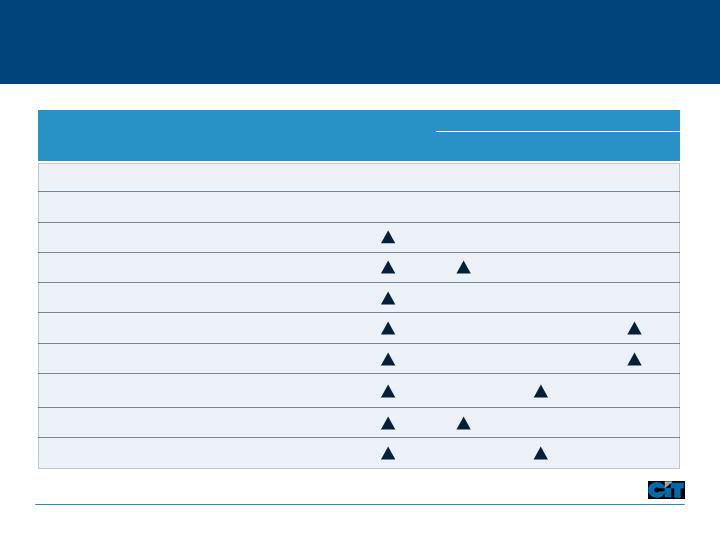
Board of Directors
President & CEO
Martha Stewart Living
Chairman & CEO New
York Life Insurance Co.
Chairman & CEO
C.R. Bard Inc.
President & CEO
ADP
Managing Partner
McCarter & English LLP
Chancellor SUNY
Maritime College
EVP& CFO International
Paper Company
Chairman
TerreStar Networks Inc
Retired
CEO & Chairman
CIT Group Inc.
Current
Position
2006
Susan Lyne
2005
Seymour Sternberg
2005
Timothy M. Ring
2004
Gary Butler
2003
Lois M. Van Deusen
Chair
2003
John R. Ryan
2003
Marianne Miller Parrs
Chair
2003
William M. Freeman
Chair
Lead
2002
Peter J. Tobin
2003
Jeffery M. Peek
Nominating &
Governance
Compensation
Audit
Board Member
Board Committees
Independent
Directors
Member
Since
27
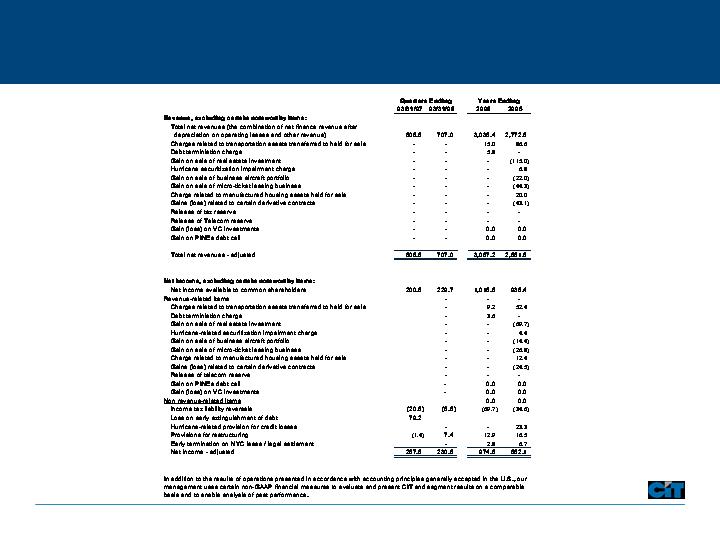
Noteworthy Items
28
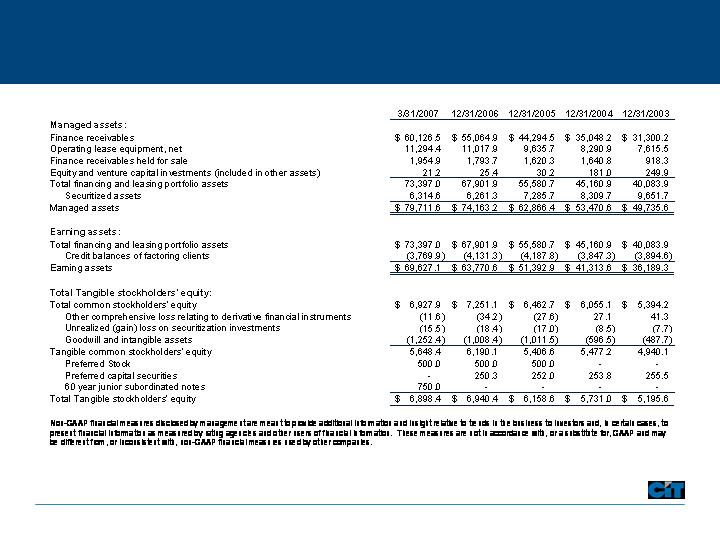
Non-GAAP Reconciliation
*The preferred capital securities were called on April 10, 2007. On March 16, 2007, $250 million of additional junior subordinated notes were issued in anticipation
of the preferred capital securities call. Accordingly only $500 million of the junior subordinated notes were included in our March 31, 2007 capitalization ratios.
*
29
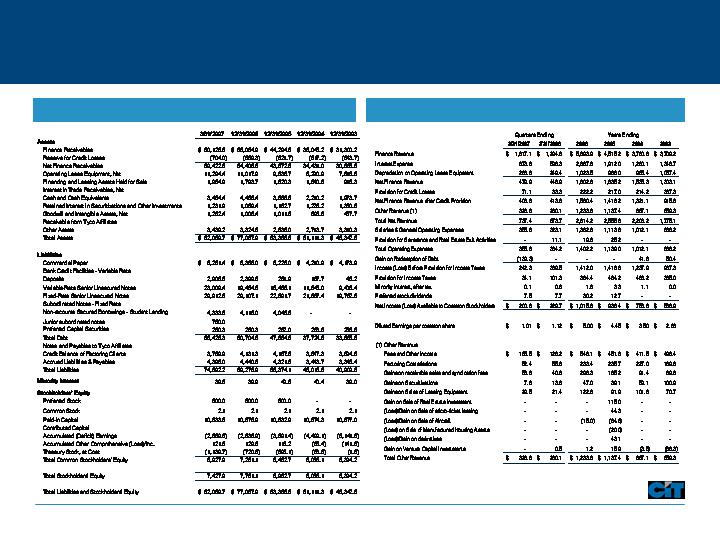
Financial Statements
Balance Sheet
Income Statement
$11 Billion Market Capitalization
30