Exhibit 99.2
PART ONEITEM 1. Business
OVERVIEWBUSINESS DESCRIPTION
Founded a hundred years ago on February 11, 1908, CIT Group Inc., a Delaware corporation (“we,” “CIT” or the “Company”), is a leading commercial finance company providing financing and leasing products and services to clients in a wide variety of industries around the globe.
Diversification is a hallmark of CIT, with a broad range of financial services businesses serving customers in over 30 industries and 50 countries. The majority of our business focuses on commercial clients with a particular focus on middle-market companies. We serve a wide variety of industries. Our largest industries include transportation, particularly aerospace and rail, and a broad range of manufacturing and retailing. We also serve the wholesaling, healthcare, communications, media and entertainment and various service-related industries. Our SBA preferred lender operations has been recognized as the nation’s #1 SBA Lender (based on 7(a) program volume) in each of the last eight years. We also provide financing to the student loan market.
Each business has industry alignment and focuses on specific sectors, products and markets, with portfolios diversified by client and geography. Our principal product and service offerings include:
Products
| – | Asset-based loans |
| – | Secured lines of credit |
| – | Leases – operating, capital and leveraged |
| – | Vendor finance programs |
| – | Import and export financing |
| – | Debtor-in-possession / turnaround financing |
| – | Acquisition and expansion financing |
| – | Project financing |
| – | Small business loans |
| – | Student loans |
| – | Letters of credit / trade acceptances |
Services
| – | Financial risk management |
| – | Asset management and servicing |
| – | Merger and acquisition advisory services |
| – | Debt restructuring |
| – | Credit protection |
| – | Accounts receivable collection |
| – | Commercial real estate advisory services |
| – | Debt underwriting and syndication |
| – | Insurance |
| – | Capital markets structuring |
We previously offered mortgage loans to consumers. However, we closed the home lending origination platform in August 2007 and sold the remaining assets and operations in July 2008. See “Discontinued Operation” section ofItem 7. Management’s Discussion and Analysis of Financial Condition and Results of OperationsandNote 1 “Discontinued Operation,” of Item 8. Financial Statements and Supplementary Datafor further discussion on home lending.
Asset generation is a core strength of CIT. We source transactions through direct marketing efforts to borrowers, lessees, manufacturers, vendors, distributors and to end-users through referral sources and other intermediaries. In addition, our business units work together both in referring transactions between units (i.e. cross-selling) and by combining various products and services to meet our customers’ overall financing needs. We also buy and sell participations in syndications of finance receivables and lines of credit and periodically purchase and sell finance receivables on a whole-loan basis.
Credit adjudication and servicing are also core strengths. We maintain disciplined underwriting standards and employ sophisticated portfolio risk management models to achieve desired portfolio demographics. Our collection and servicing operations are centralized across businesses and geographies providing efficient client interfaces and uniform customer experiences.
We generate revenue by earning interest income on the loans we hold on our balance sheet, collecting rentals on the equipment we lease, and earning fee and other income for the financial services we provide. In addition, we syndicate and sell certain finance receivables and equipment to leverage our origination capabilities, reduce concentrations, manage our balance sheet and improve profitability.
We fund our business in the global capital markets, principally through asset-backed and other secured financing arrangements, commercial paper, unsecured term debt, and broker-originated deposits. We rely on these diverse funding sources to maintain liquidity and strive to mitigate interest rate, foreign currency, and other market risks through disciplined matched-funding strategies. Our debt ratings are summarized on page 46 in the “Risk Management” section ofItem 7. Management’s Discussion and Analysis of Financial Condition and Results of Operations.
At December 31, 2007, we had managed assets of $73.4 billion comprised of an owned loan and lease portfolio of $67.8 billion and a securitized portfolio of $5.6 billion. We also serviced third party assets under fee-based contracts at year-end. Common stockholders’ equity at December 31, 2007 was $6.5 billion.
BUSINESS SEGMENTS
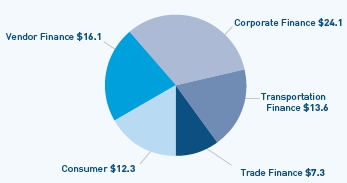
CIT meets customers’ financing needs through five business segments, which represent our continuing operations.
SEGMENT Corporate Finance Group | MARKET AND SERVICES Lending, leasing and other financial services to middle-market companies, through industry focused sales teams, including Healthcare, Communications, Media and Entertainment, and Energy, as well as to small businesses, through broker and intermediary relationships. |
| | |
Transportation Finance | Large ticket equipment leases and other secured financing to companies in aerospace, rail and defense industries. |
| | |
Trade Finance | Factoring, lending, credit protection, receivables management and other trade products to retail supply chain companies. |
| | |
Vendor Finance | Innovative financing and leasing solutions to manufacturers, distributors and customer end-users around the globe. |
| | |
Consumer | Student loans through Student Loan Xpress; other consumer loans through CIT Bank. |
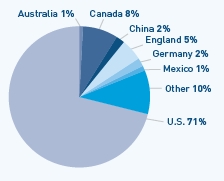
Our managed assets are presented in the following graphs.
Managed Assets by Segment
At December 31, 2007 (dollars in billions)
Managed Assets by Country
At December 31, 2007 (dollars in billions)
CORPORATE FINANCE
Our Corporate Finance segment provides a full spectrum of financing alternatives to borrowers ranging from small companies to large multinationals with emphasis on middle market companies. We service clients in a broad array of industries with specialized groups serving commercial and industrial; capital markets; communications, media and entertainment; energy; and healthcare sectors in the U.S. and abroad. We also provide collateralized and government-secured loans to small businesses (such as SBA loans), leveraging broker and intermediary relationships.
We offer loan structures ranging from working capital loans secured by accounts receivable and inventories, term loans secured by fixed assets to leveraged loans based on operating cash flow and enterprise valuation. Loans may be fixed or variable rate, senior or subordinated, and revolving or term. Our clients typically use the proceeds for working capital, asset growth, acquisitions, debtor-in-possession financing, and debt restructurings. Additionally, we provide equipment lending and leasing products, including loans, leases, wholesale and retail financing packages, operating leases, and sale-leaseback arrangements to meet our customer’s needs.
We also offer clients an array of financial and advisory services. The unit offers capital markets structuring and syndication capabilities, as well as advisory services, a capability that we enhanced in 2007 with a strategic acquisition. We also offer financial risk management services to selected customers, whereby we will enter into offsetting derivative transactions with a customer and a third party financial institution. As the offsetting derivatives have like notional amounts and terms, we retain only the counterparty risk.
Industry focused teams originate business through various intermediaries, referral sources, strategic partnerships and direct calling. We maintain relationships with selected banks, finance companies, hedge funds and other lenders both to obtain business leads and distribute our products. We also purchase and sell participation interests in syndicated loans from and to other financial institutions.
Our small business lending unit originates and services Small Business Administration and conventional loans for commercial real estate financing, construction, business acquisition and business succession financing. We are a SBA preferred lender and have been recognized as the nation’s #1 SBA Lender (based on 7(a) program volume) in each of the last eight years.
We earn interest revenue on receivables we keep on-balance sheet and recognize gains on receivables sold. We also earn fees for servicing third party assets, which approximated $2.1 billion at year end. Small business lending activities are principally focused on the U.S. market.
TRANSPORTATION FINANCE
Our Transportation Finance segment specializes in providing customized leasing and secured financing primarily to end-users of aircraft, locomotives and railcars. Our transportation equipment financing products include operating leases, single investor leases, equity portions of leveraged leases and sale and leaseback arrangements, as well as loans secured by equipment. Our equipment financing clients represent major and regional airlines worldwide, North American railroad companies, and middle-market to larger-sized aerospace and defense companies.
This segment has been servicing the aerospace and rail industries for many years and has built a global presence with operations in the United States, Canada, Europe and Asia. We have extensive experience in managing equipment over its full life cycle, including purchasing new equipment, equipment maintenance, estimating residual values and re-marketing by re-leasing or selling equipment.
The aerospace group offers commercial aircraft financing, business aircraft and aerospace and defense financing. It provides aircraft leasing and sales, asset management, finance, banking, technical and engineering, aircraft valuation and advisory services. The team has built strong relationships across the entire aerospace industry, including the major manufacturers, parts suppliers and carriers. These relationships provide us with access to technical information, which enhances our customer service and provides opportunities to finance new business. Our clients include major and regional airlines around the world.
Our commercial aerospace business has offices in North America, Europe and Asia and a global reach of customers in 45 countries. Our international aerospace servicing center in Dublin, Ireland, puts us closer to our growing international client base and provides us with favorable tax treatment for certain aircraft leasing operations. Our commercial fleet consists of 287 aircraft with a weighted average age of approximately 5 years placed with 105 clients around the world. As of December 31, 2007, our commercial aerospace financing and leasing portfolio was $8.2 billion.
The business aircraft team offers financing and leasing programs for owners of business jet aircraft and turbine helicopters primarily in the United States. The aerospace and defense business provides comprehensive financing solutions to the aerospace and defense corporate finance market, as well as the aerospace financial intermediary market.
Our dedicated rail equipment group maintains relationships with numerous leading railcar manufacturers and calls directly on railroads and rail shippers throughout North America. Our rail portfolio, which totaled $4.4 billion at December 31, 2007, includes leases to all of the U.S. and Canadian Class I railroads (railroads with annual revenues of at least $250 million) and other non-rail companies, such as shippers and power and energy companies. The operating lease fleet primarily includes: covered hopper cars used to ship grain and agricultural products, plastic pellets and cement; gondola cars for coal, steel coil and mill service; open hopper cars for coal and aggregates; center beam flat cars for lumber; boxcars for paper and auto parts; and tank cars. Our railcar operating lease fleet has an average age of approximately 6 years and approximately 86% (based on net investment) were manufactured in 1998 or later. Our total rail fleet includes approximately 114,000 railcars and over 500 locomotives that we own, lease or service.
See “Concentrations” section ofItem 7. Management’s Discussion and Analysis of Financial Condition and Results of Operationsand Note 17 – Commitments and Contingencies ofItem 8. Financial Statements and Supplementary Datafor further discussion of our aerospace portfolio.
TRADE FINANCE
Our Trade Finance segment provides factoring, receivable and collection management products, and secured financing to businesses that operate in several industries including apparel, textile, furniture, home furnishings and electronics. Although primarily U.S.-based, we have increased our international business in Asia and Europe. CIT has many relationships with factors located throughout Asia, and from our full-service factoring company based in Frankfurt, Germany, we provide factoring and financing services to companies in Europe.
We offer a full range of domestic and international customized credit protection, lending and outsourcing services that include working capital and term loans, factoring, receivable management outsourcing, bulk purchases of accounts receivable, import and export financing and letter of credit programs.
We provide financing to our clients, primarily manufacturing, through the purchase of accounts receivable owed to our clients by their customers, typically retailers. We also guarantee amounts due to our client’s suppliers under letters of credit collateralized by accounts receivable and other assets. The purchase of accounts receivable is traditionally known as “factoring” and results in the payment by the client of a factoring fee that is commensurate with the underlying degree of credit risk and recourse, and which is generally a percentage of the factored receivables or sales volume. We also may advance funds to our clients, typically in an amount up to 80% of eligible accounts receivable, charging interest on the advance (in addition to any factoring fees), and satisfying the advance by the collection of the factored accounts receivable. We integrate our clients’ operating systems with ours to facilitate the factoring relationship.
Clients use our products and services for various purposes, including improving cash flow, mitigating or reducing credit risk, increasing sales, and improving management information. Further, with our TotalSourceSMproduct, our clients can out-source their bookkeeping, collection, and other receivable processing to us. These services are attractive to industries outside the traditional factoring markets.
VENDOR FINANCE
We are a leading global vendor finance company with numerous vendor relationships and operations serving customers in over 30 countries. We have significant vendor programs in information technology, telecommunications equipment, healthcare and other diversified asset types across multiple industries. Through our global relationships with industry-leading equipment vendors, including manufacturers, dealers, and distributors, we deliver customized financing solutions to both commercial and consumer customers of our vendor partners in a wide array of programs.
Our vendor alliances feature traditional vendor finance programs, joint ventures, profit sharing and other transaction structures with large, sales-oriented partners. In the case of joint ventures, we engage in financing activities jointly with the vendor through a distinct legal entity that is jointly owned. We also use “virtual joint ventures,” by which we originate the assets on our balance sheet and share with the vendor the economic outcomes from the customer financing activity. A key part of these partnership programs is coordinating with the vendor’s product offering systems to improve execution and reduce cycle times.
These alliances allow our vendor partners to focus on their core competencies, reduce capital needs and drive incremental sales volume. As a part of these programs, we offer our partners (1) financing to commercial and consumer end users for the purchase or lease of products, (2) enhanced sales tools such as asset management services, efficient loan processing and real-time credit adjudication, and (3) a single point of contact in our regional servicing hubs to facilitate global sales. In turn, these alliances provide us with a highly efficient origination platform as we leverage our partners’ sales forces.
Vendor Finance includes a small and mid-ticket commercial business, which focuses on leasing office equipment, computers and other technology products primarily in the United States and Canada. We originate products through relationships with manufacturers, dealers, distributors and other intermediaries as well as through direct calling.
Vendor Finance also houses CIT Insurance Services, through which we offer insurance and financial protection products in key markets around the world. We leverage our existing distribution capabilities and alliances with insurance and financial services providers, enabling us to offer protection products for small business and middle market clients and consumers. Our offerings to middle market and small business customers range from commercial property & casualty insurance, employee benefits, key person life insurance, and high net worth personal line coverage. For our consumer clients, we offer property coverage, debt protection, credit insurance, as well as supplemental insurance programs.
CONSUMER
Our Consumer segment includes student lending and CIT Bank, a Utah-based industrial bank with deposit-taking capabilities. Our consumer activities are principally focused on the U.S. market.
Our student lending unit, which markets under the name Student Loan Xpress, offers student loan products, services, and solutions to students, parents, schools, and alumni associations. We offer government-guaranteed student loans made under the Federal Family Education Loan Program (FFELP), including consolidation loans, Stafford loans, Parent Loans for Undergraduate Students (PLUS) and Grad PLUS. We discontinued offering private loans during 2007. We originate and acquire loans through direct consumer marketing, school channel referrals and periodically purchase portfolios of loans. The majority of our student loan portfolio is consolidation loans, but our portfolio of
Stafford and PLUS loans has continued to grow. Most of our student loan portfolio is serviced in-house from our Cleveland facility.
During 2007, the federal government passed legislation with respect to the student lending business. Among other things, the legislation reduces special allowance payments paid to lenders by the federal government, increases loan origination fees paid to the government by lenders, and reduces the lender guarantee percentage. The legislation went into effect for all new FFELP student loans with first disbursements on or after October 1, 2007. The guarantee percentage, reduced from 97% to 95%, is in effect for loans originated after October 1, 2012. While the demographics of this market remain strong, the returns related to future originations will be impacted by the recent legislation.
As a result of decreased market valuations for student lending businesses and lower profit expectations resulting from higher funding costs, we recorded goodwill and intangible asset impairment charges during the last quarter of 2007.
CIT Bank, with assets of $3.3 billion and deposits of $2.7 billion, is located in Salt Lake City, Utah. Since its inception, the bank had been primarily funding consumer type loans. During late 2007, we refined the Bank’s focus to fund commercial assets and have commenced originating corporate loans. The Bank is chartered by the state of Utah as an industrial bank and is subject to regulation and examination by the Federal Deposit Insurance Corporation and the Utah Department of Financial Institutions.
See “Concentrations” section ofItem 7. Management’s Discussion and Analysis of Financial Condition and Results of Operationsand “Note 23 – Goodwill and Intangible Assets” ofItem 8. Financial Statements and Supplementary Datafor further discussion of our student lending portfolios.
2007 SEGMENT PERFORMANCEEarnings and Return Summary(dollars in millions)
| | Net
Income/
(Loss)
| | Return on
Equity
|
| Corporate Finance | $ 453.0 | | 18.3 | % |
| Transportation Finance | 271.1 | | 16.3 | % |
| Trade Finance | 164.0 | | 17.8 | % |
| Vendor Finance | 410.1 | | 23.6 | % |
| |
| | | |
| Commercial Segments | 1,298.2 | | 19.1 | % |
| Consumer | (274.9 | ) | (52.3 | %) |
| Corporate and Other | (231.3 | ) | (3.4 | %) |
| |
| | | |
| Net income from continuing operations, before preferred dividends | $ 792.0 | | 11.6 | % |
| |
| | | |
See the “Results by Business Segments” and “Concentrations” sections ofItem 7. Management’s Discussion and Analysis of Financial Condition and Results of OperationsandItem 7A. Quantitative and Qualitative Disclosuresabout Market Risk, and Notes 5 and 21 ofItem 8. Financial Statements and Supplementary Data, for additional information.
ITEM 6.Selected Financial Data
The following tables set forth selected consolidated financial information regarding our results of operations and balance sheets and has been updated to present activity on a continuing operations basis and present the operations of the home lending business as a discontinued operation. The data presented below is explained further in, and should be read in conjunction with,Item 7. Management’sDiscussion and Analysis of Financial Condition and Results of OperationsandItem 7A. Quantitative and Qualitative Disclosures about Market RiskandItem 8. Financial Statements and Supplementary Data.Also see Item 8., Note 1 (Discontinued Operation)for data pertaining to discontinued operation.
(At or for the Years Ended December 31,dollars in millions, except per share data)
| | | 2007 | | | 2006 | | | 2005 | | | 2004 | | | 2003 | |
| | |
| | |
| | |
| | |
| | |
| |
| Results of Operations | | | | | | | | | | | | | | | |
| Total net revenue | $ | 3,239.1 | | $ | 2,678.6 | | $ | 2,614.8 | | $ | 2,271.8 | | $ | 1,974.4 | |
| Provision for credit losses | | 241.8 | | | 159.8 | | | 165.3 | | | 159.5 | | | 332.4 | |
| Valuation allowance for receivables held for sale | | 22.5 | | | 15.0 | | | 86.6 | | | 15.7 | | | – | |
| Salaries and general operating expenses | | 1,389.6 | | | 1,276.1 | | | 971.4 | | | 923.9 | | | 816.1 | |
| Net income continuing operations, before preferred | | | | | | | | | | | | | | | |
| stock dividends | | 792.0 | | | 925.7 | | | 918.5 | | | 742.4 | | | 522.0 | |
| Net (loss) income from discontinued operation | | (873.0 | ) | | 120.3 | | | 30.6 | | | 11.2 | | | 44.9 | |
| Net (loss) income (attributable) available | | | | | | | | | | | | | | | |
| to common stockholders | | (111.0 | ) | | 1,015.8 | | | 936.4 | | | 753.6 | | | 566.9 | |
Income per share from
continuing operations — diluted | | 3.93 | | | 4.41 | | | 4.30 | | | 3.45 | | | 2.45 | |
Income (loss) per share from discontinued
operation — diluted | | (4.50 | ) | | 0.59 | | | 0.14 | | | 0.05 | | | 0.21 | |
| Net income (loss) per share — diluted | | (0.57 | ) | | 5.00 | | | 4.44 | | | 3.50 | | | 2.66 | |
| Dividends per share | | 1.00 | | | 0.80 | | | 0.61 | | | 0.52 | | | 0.48 | |
| Balance Sheet Data | | | | | | | | | | | | | | | |
| Total finance receivables | $ | 53,760.9 | | $ | 45,203.6 | | $ | 35,878.5 | | $ | 29,892.1 | | $ | 27,940.6 | |
| Reserve for credit losses | | 574.3 | | | 577.1 | | | 540.2 | | | 553.8 | | | 609.8 | |
| Operating lease equipment, net | | 12,610.5 | | | 11,017.9 | | | 9,635.7 | | | 8,290.9 | | | 7,615.5 | |
| Goodwill and intangible assets, net | | 1,152.5 | | | 1,008.4 | | | 1,011.5 | | | 596.5 | | | 487.7 | |
| Assets of discontinued operation | | 9,308.6 | | | 10,387.1 | | | 8,789.8 | | | 5,811.5 | | | 3,674.4 | |
| Total assets | | 90,248.0 | | | 77,485.7 | | | 63,386.6 | | | 45,299.8 | | | 42,662.2 | |
| Total debt and deposits | | 69,018.3 | | | 60,704.8 | | | 47,864.5 | | | 37,724.8 | | | 33,668.6 | |
| Total stockholders’ equity | | 6,960.6 | | | 7,751.1 | | | 6,962.7 | | | 6,055.1 | | | 5,394.2 | |
| Selected Data and Ratios | | | | | | | | | | | | | | | |
| Profitability (continuing operations) | | | | | | | | | | | | | | | |
| Net income (loss) before preferred dividend as a percentage | | | | | | | | | | | | | | | |
| of average common stockholders’ equity | | 11.6 | % | | 13.6 | % | | 14.8 | % | | 13.0 | % | | 10.1 | % |
| Net finance revenue as a percentage of average earning assets | | 2.71 | % | | 3.08 | % | | 3.38 | % | | 3.97 | % | | 3.63 | % |
| Efficiency ratio | | 42.9 | % | | 47.6 | % | | 37.2 | % | | 40.7 | % | | 41.3 | % |
| Credit Quality | | | | | | | | | | | | | | | |
| 60+ days contractual delinquency as a percentage of finance receivable | | 2.26 | % | | 1.88 | % | | 1.50 | % | | 1.45 | % | | 1.88 | % |
| Net credit losses as a percentage of average finance receivables | | 0.35 | % | | 0.33 | % | | 0.52 | % | | 0.82 | % | | 1.75 | % |
| Reserve for credit losses as a percentage of finance receivables | | 1.07 | % | | 1.28 | % | | 1.51 | % | | 1.85 | % | | 2.18 | % |
| Reserve for credit losses, excluding specific reserves as a | | | | | | | | | | | | | | | |
| percentage of finance receivables, excluding guaranteed | | | | | | | | | | | | | | | |
| student loans | | 1.21 | % | | 1.44 | % | | 1.53 | % | | 1.71 | % | | 1.59 | % |
| Reserve for credit losses as a percentage of | | | | | | | | | | | | | | | |
| non-performing assets | | 118.1 | % | | 180.7 | % | | 175.3 | % | | 152.6 | % | | 117.2 | % |
| Other | | | | | | | | | | | | | | | |
| Total managed assets | $ | 73,428.1 | | $ | 63,220.2 | | $ | 53,200.7 | | $ | 46,154.3 | | $ | 43,715.9 | |
| Tangible stockholders’ equity to managed assets | | 8.8 | % | | 9.4 | % | | 9.8 | % | | 10.7 | % | | 10.4 | % |
| | | Item 6: Selected Financial Data PAGE 7 |