Exhibit 99.1

Positioned for Growth
June 14, 2012

Important Notices
This presentation contains forward-looking statements within the meaning of applicable federal securities laws that are based upon our current expectations and assumptions concerning future events, which are subject to a number of risks and uncertainties that could cause actual results to differ materially from those anticipated. The words “expect,” “anticipate,” “estimate,” “forecast,” “initiative,” “objective,” “plan,” “goal,” “project,” “outlook,” “priorities,” “target,” “intend,” “evaluate,” “pursue,” “commence,” “seek,” “may,” “would,” “could,” “should,” “believe,” “potential,” “continue,” or the negative of any of those words or similar expressions is intended to identify forward-looking statements. All statements contained in this presentation, other than statements of historical fact, including without limitation, statements about our plans, strategies, prospects and expectations regarding future events and our financial performance, are forward-looking statements that involve certain risks and uncertainties. While these statements represent our current judgment on what the future may hold, and we believe these judgments are reasonable, these statements are not guarantees of any events or financial results, and our actual results may differ materially. Important factors that could cause our actual results to be materially different from our expectations include, among others, the risk that CIT is unsuccessful in refining and implementing its strategy and business plan, the risk that CIT is unable to react to and address key business and regulatory issues, the risk that CIT is delayed in transitioning certain business platforms to CIT Bank and may not succeed in developing a stable, long-term source of funding, and the risk that CIT continues to be subject to liquidity constraints and higher funding costs. Further, there is a risk that the valuations resulting from our fresh start accounting analysis, which are inherently uncertain, will differ significantly from the actual values realized, due to the complexity of the valuation process, the degree of judgment required, and changes in market conditions and economic environment. We describe these and other risks that could affect our results in Item 1A, “Risk Factors,” of our latest Annual Report on Form 10-K filed with the Securities and Exchange Commission. Accordingly, you should not place undue reliance on the forward-looking statements contained in this presentation. These forward-looking statements speak only as of the date on which the statements were made. CIT undertakes no obligation to update publicly or otherwise revise any forward-looking statements, except where expressly required by law.
This presentation is to be used solely as part of CIT management's continuing investor communications program. This presentation shall not constitute an offer or solicitation in connection with any securities.
Data as of or for the quarter ended March 31, 2012 unless otherwise noted.
 | CIT Investor Day 2012: Important Notices | 2 |

Overview & Strategic Update
John Thain

Today’s Agenda
| |
| Topic | Presenter |
| Overview & Strategic Update | John Thain |
| Corporate Finance | Pete Connolly, Jim Hudak, Matt Galligan |
| Trade Finance | John Daly, Jon Lucas |
| Vendor Finance | Ron Arrington |
| Transportation Finance | Jeff Knittel |
| Credit Risk Management | Rob Rowe |
| Funding & Liquidity | Glenn Votek, Ray Quinlan |
| Financial Update | Scott Parker |
| Concluding Remarks | Nelson Chai |
 | Overview & Strategic Update | 4 |
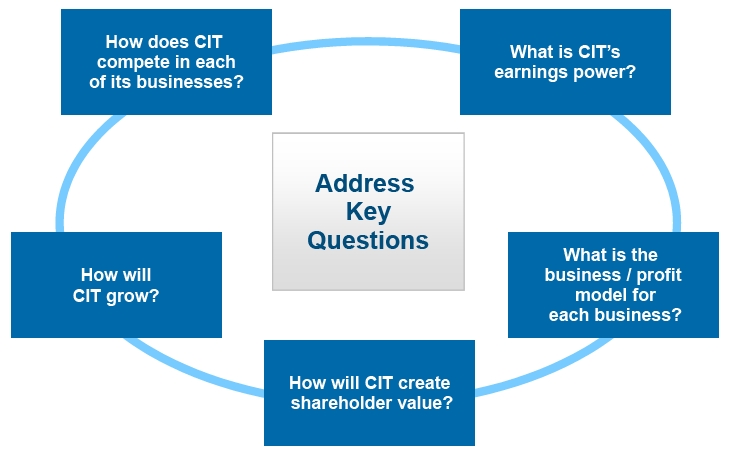
Objectives for Today
 | Overview & Strategic Update | 5 |
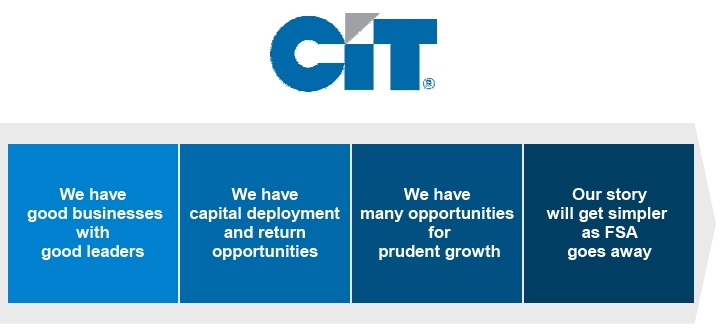
We Are Well Positioned
 | Overview & Strategic Update | 6 |
CIT – A Unique Franchise and Investment Opportunity

 | Overview & Strategic Update | 7 |
Significant Progress Over the Past Two Years
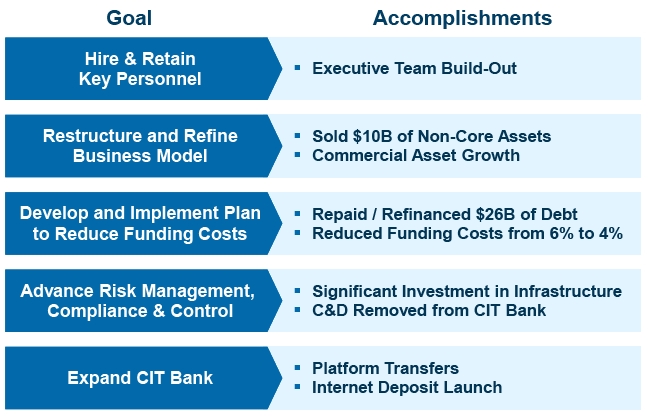
Up to and including Q2 2012
 | Overview & Strategic Update | 8 |
Well Defined Near-term Priorities
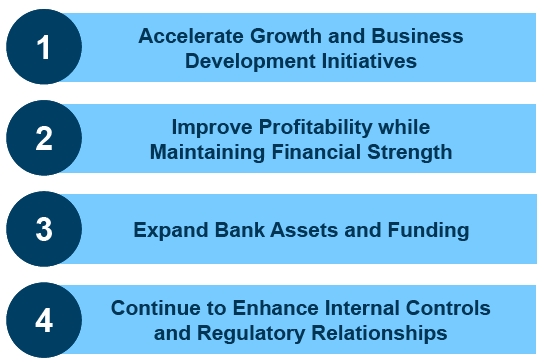
 | Overview & Strategic Update | 9 |

 | Overview & Strategic Update | 10 |

Corporate Finance
The Right Focus for Growth
Pete Connolly
Jim Hudak
Matt Galligan

The Right Focus for Growth
Well Positioned for Growth
Industry Specialization & Relationships
Are Key Differentiators
Sustainable Bank Funding Model
 | Corporate Finance | 2 |
Customized Financial Solutions
Corporate Finance provides lending,
leasing and other financial and
advisory services to the small business
and middle market sectors,
with a focus on specific industries
 | Corporate Finance | 3 |
Focused on Industries in Which We Have Significant Expertise

 | Corporate Finance | 4 |
Our Target Industries Represent a Significant Part of the US Economy
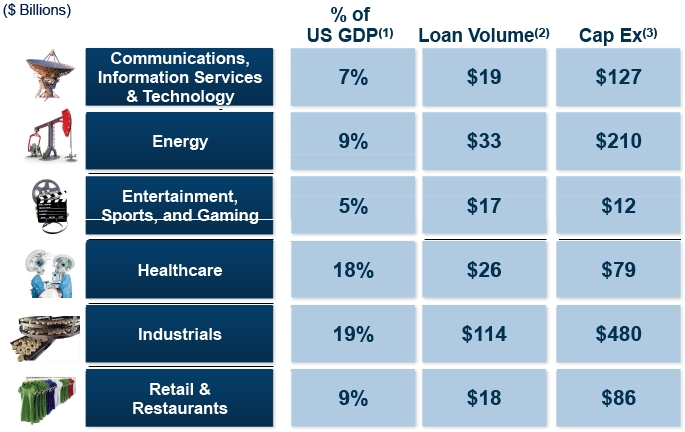
| (1) | | Bureau of Economic Analysis – 2011; Health Leaders Media July 2011; American Gaming Assoc. Feb 2012; Plunkett Research 2011; Motion Picture Assn. of America 2011; Institute for Energy Research 2010; Telecommunications Industry Research 2011 |
| (2) | | Thomson Reuters LPC Loan Connector, ABF Journal – 2011 |
 | Corporate Finance | 5 |
Focused on Products that Serve Our Middle Market Clients

 | Corporate Finance | 6 |
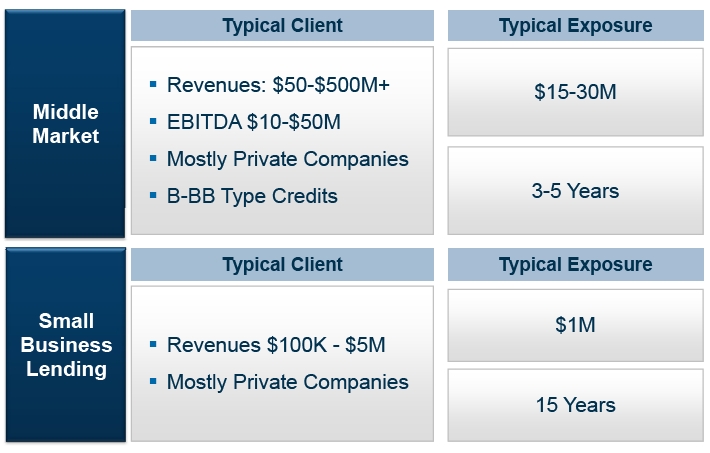
We Have a Clearly Defined Target Market that Fills a Niche
 | Corporate Finance | 7 |
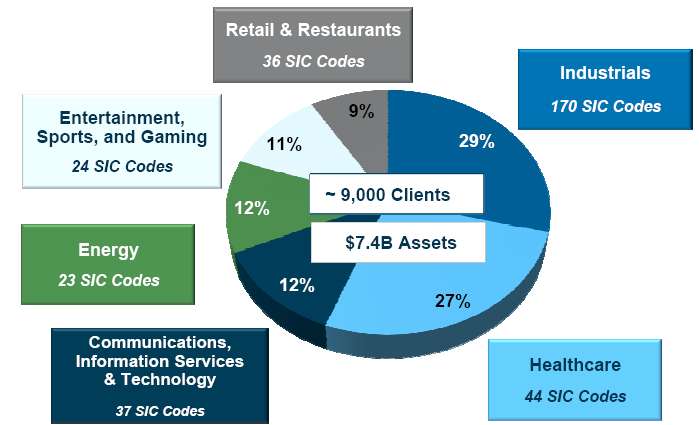
Portfolio Is Well Diversified Across Industries
Data as of or for period ended 3/31/12
 | Corporate Finance | 8 |
Growing Assets in CIT Bank Leads to Higher Net Interest Margins
($ Billions)

* Non-Bank international assets not detailed but are included in total
 | Corporate Finance | 9 |
Evolving Competitive Landscape Presents Opportunities
Competitive Landscape
| ■ | | Several legacy middle market competitors have been challenged or have shut down |
| ■ | | Continuing opportunities arising from the withdrawal of European banks from US markets |

 | Corporate Finance | 10 |
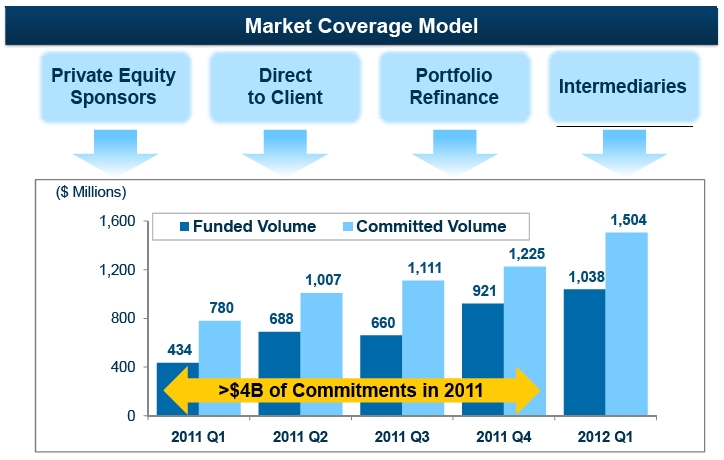
Multiple Channel Marketing Model Drives Sustainable Growth
 | Corporate Finance | 11 |
Value Proposition: Why We Win
| ■ | | Focused on Key Industries Where We Make a Difference and Maintain a Long-Term View |
| ■ | | Industry Specialization and Product Expertise |
| ■ | | Deep Relationships with Sponsors and Clients |
| ■ | | High Quality Servicing / Portfolio Management Team |
| ■ | | Creativity of a Finance Company with a Bank Funding Model |
 | Corporate Finance | 12 |
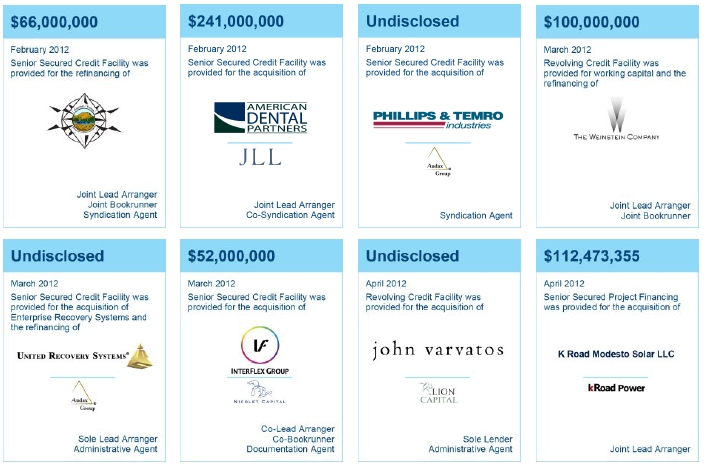
Gaining Traction on Lead Agency Roles
 | Corporate Finance | 13 |
Case Study: Expertise and Relationship Drive Success
Transaction Overview
Odyssey Investment Partners Engaged CIT Based on:
| ■ | | Strong relationship developed over the course of several transactions |
| ■ | | Ability to leverage deep industry knowledge of an experienced industry team |
| ■ | | Strong capital markets capabilities |
| ■ | | Flexible borrowing structure to enable the Sponsor and Company to execute their growth strategy |
 | Corporate Finance | 14 |
Capital Equipment Finance: Building on Past Success
Diverse financing solutions to a wide range of strong companies

Product Offering
■Equipment Acquisition Financing
■Cap Ex Financing
■Term Debt Secured by Equipment
■Structured Financing
■Leases (Capital & Operating)
■Sale / Leasebacks
Transaction Size
| ■ | | $3 Million - $25 Million |
Terms
| ■ | | Fixed rate lending with opportunities for variable rate where appropriate |
 | Corporate Finance | 15 |
Large Addressable Equipment Market
($ Billions)
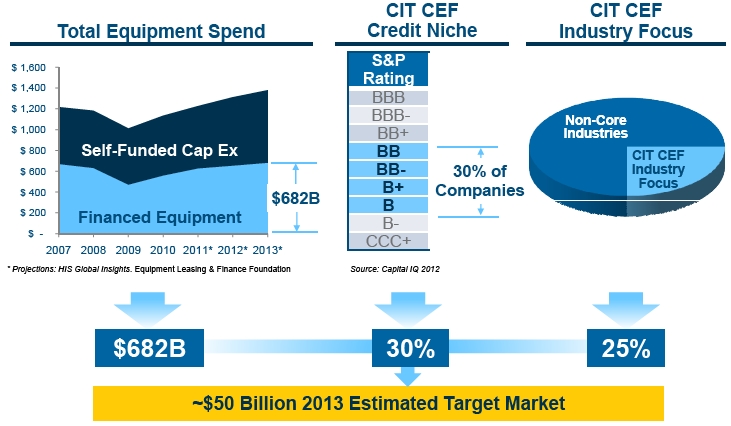
CEF = Capital Equipment Finance
 | Corporate Finance | 16 |
Real Estate Finance’s Value Proposition Provides Opportunities
| |
| Rebranding CIT | ■Moderate-risk bank debt provider taking senior secured |
| within | positions |
| Commercial | |
| Real Estate | ■No legacy CRE exposure |
| |
| Experienced | ■Eight professionals with substantial experience in real estate |
| Team | funding transactions through the economic cycle |
| |
| Relationship | ■Clear and direct communication with clients and internal |
| Excellence | constituencies resulting in timely response and execution |
| |
| Portfolio | ■“Cradle-to-grave” client relationship management by a team |
| Oversight | with a successful track record in a bank environment |
 | Corporate Finance | 17 |
Real Estate Finance Has A Clearly Defined Target Market
| |
| | ■Target bi-lateral opportunities but also participate in syndicated loans |
| Role | and club transactions |
| | |
| |
| |
| | |
| Structure | ■Conservatively structured loans secured by high-quality assets |
| | |
| |
| |
| | |
| Geography | ■Assets located in major 24-hour cities and healthy nationwide markets |
| | |
| |
| |
| | |
| Type | ■Fund investment loans and construction projects (max ~ 30% of portfolio) |
| | |
| | |
| | |
| | ■Building a portfolio evenly spread across: |
| Sectors | •Multi-family residential (both for rent and for sale) |
| | •Multi-tenant office and |
| | •Retail including ground floor retail condos in urban or infill locations |
| | |
| | |
| | ■Senior secured, first lien positions |
| Collateral | |
| | ■No specialized or esoteric assets including raw un-zoned land |
 | Corporate Finance | 18 |
Relationships Differentiate CIT REF from Competitors

 | Corporate Finance | 19 |
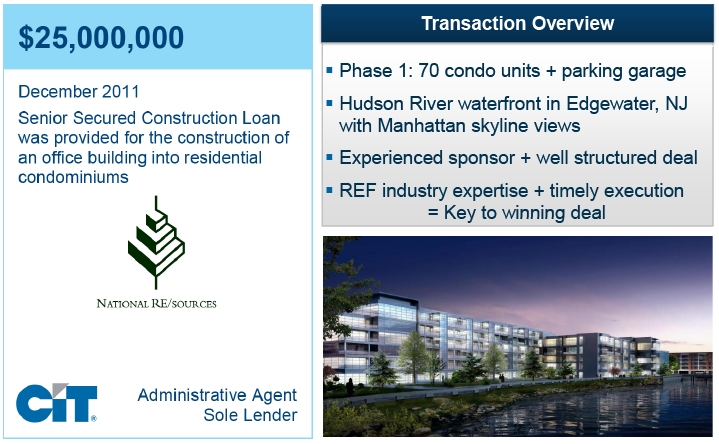
Case Study: Specific Target Market Drives Opportunity
 | Corporate Finance | 20 |
Significant Growth Opportunity Across Corporate Finance
Right-Size Platform, Retained Key Talent
Significant Niche Experience
Targeted Middle Market Products
to Address Client Needs
Sustainable Bank Funding Model
 | Corporate Finance | 21 |
Growing Relationships by Understanding Client Needs

 | Corporate Finance | 22 |

 | Corporate Finance | 23 |

Trade Finance
The Nation’s Leader in Factoring
John Daly
Jon Lucas

Longstanding Excellence in the US Factoring Industry
| • | | Entered the factoring business in 1928 |
| • | | $26 billion in annual factored volume in 2011 |
| • | | Factoring receivables (including off-balance sheet) peak seasonally at ~ $4.7B |
| ■ | | Approximately 475 employees |
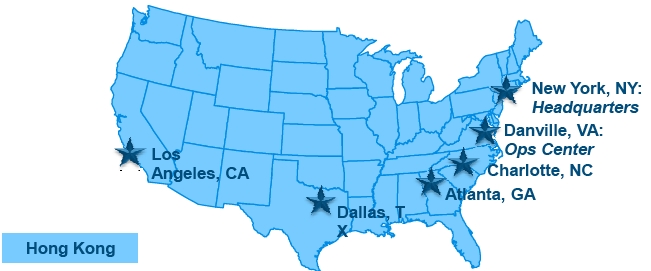
| ■ | | We are located where our clients are located |
 | Trade Finance | 2 |
CIT Provides Clients with Insight About Their Retail Customers
“The Secret Sauce”
| ■ | | Experienced management team with deep industry relationships |
| ■ | | Direct access to senior management in retail industry |
| ■ | | Comprehensive customer credit database |
| ■ | | Real-time online access to detailed accounts receivable information |
 | Trade Finance | 3 |
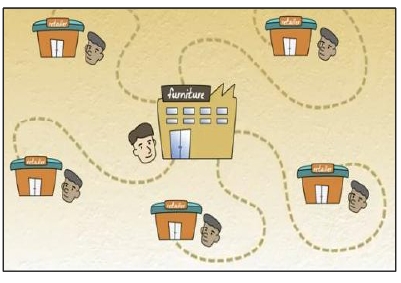
Critical Link Between Suppliers and Retailers
What Is Factoring?
 | Trade Finance | 4 |
Trade Finance Provides Multiple Benefits to Our Clients
Factoring
•Credit protection
•Accounts receivable bookkeeping
•Collections
Advances against accounts receivable
Asset-based lending
Letters of credit
Factoring Provides Solutions to Business Problems
| ■ | | Reduce or eliminate bad debt losses |
| ■ | | Professional accounts receivable management |
| ■ | | Liquidity and working capital for companies that may be thinly capitalized or leveraged |
 | Trade Finance | 5 |
Our Clients and Our Competitors Vary in Size and Scope
Competitive Landscape
Factors
| ■ | | Privately held boutique factors |
Other
| ■ | | Credit advisory services |
What Types of Companies Use Factoring?
| ■ | | Manufacturers, importers, wholesalers |
| ■ | | Design companies, sourcing companies |
| • | | Owner-operators, entrepreneurial mindset |
| ■ | | Many run by the original founder |
| ■ | | Annual sales range from $2 million to $1 billion |
 | Trade Finance | 6 |
Factoring Is a Commission-Driven Annuity Business
| |
| | ■Risk management |
| Profitability | ■Commission income earned on factoring volume |
| Drivers | ■Interest income earned on loans |
| | and advances on receivables |
| | ■Letter of credit fees and other fees |
| |
| | ■Clients stay for years |
| | ■Historically steady and predictable returns |
| Business | ■Volume tied to consumer spending on |
| Dynamics | moderate-to-better priced consumer |
| | non-durables |
| | ■Opportunistic credit underwriting |
 | Trade Finance | 7 |
Trade Finance Is Largely a Fee-Based Business

 | Trade Finance | 8 |
Consumer Product Industries Rely on Factoring

 | Trade Finance | 9 |
Opportunity to Grow Factoring Business Beyond Apparel
2011: $26 billion in Factored Volume
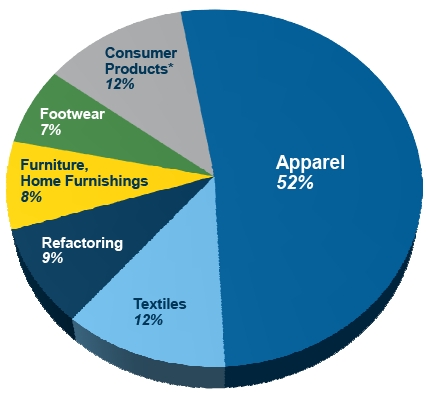
* Includes carpets, housewares, electronics, health & beauty, toys, luggage, sporting goods
 | Trade Finance | 10 |
CIT’s Factoring Clients Sell to ~ 300,000 Retailers Nationwide
Representative Customers
(Retailers)
Walmart
Macy's
Target
Nordstrom
Bed Bath & Beyond
Aeropostale
Amazon.com
Raymours Furniture Company
Nee Dell’s Shoes
Squires Family Clothing & Footwear
CIT Gives Clients
Peace of Mind and Liquidity
| ■ | | CIT underwrites the creditworthiness of their retailer customers |
| ■ | | Suppliers know they will get paid on all approved, undisputed invoices |
| ■ | | Suppliers can turn their accounts receivable into cash, enhancing liquidity |
 | Trade Finance | 11 |
Why Do Companies Turn to CIT?

 | Trade Finance | 12 |
Focused on Opportunities
Business Priorities
 | | Grow traditional factoring business in core markets and new markets |
 | | Client retention, win new deals |
 | | Grow international factoring |
 | Trade Finance | 13 |
The Leader in the US Factoring Industry
Competitive Advantages
| ■ | | Strong brand recognition |
| ■ | | Efficient and scalable operations |
| ■ | | Long term client relationships – average 10+ years |
| ■ | | Seasoned management team; deep industry knowledge |
| ■ | | Extensive retail credit database, knowledge and underwriting expertise |
| ■ | | Vital link in retail supply chain |
 | Trade Finance | 14 |

 | Trade Finance | 15 |

Vendor Finance
A Global Leader Positioned for Growth
Ron Arrington

A Global Leader Positioned for Growth
| ■ | | Targeting select regions for significant, scalable growth |
| ■ | | Enhancing a proven business model that originates profitable business across diverse industries and provides long-term value to partners and customers |
| ■ | | Utilizing a strong bank-centric funding strategy in the US that can support prudent growth at a competitive cost |
| ■ | | Establishing a forward-looking roadmap that positions Vendor Finance for prudent incremental growth |
 | Vendor Finance | 2 |
Leasing/Financing Essential-Use Equipment Across Diverse Industries

| ■ | | Assets:$5.1B in financing and leasing assets |
| • | | Global Sales Employees: 246 |
| ■ | | Global Reach:Located in 4 regions around the world |
| ■ | | Volume: 2011$2.6B
1Q12$0.7B |
| ■ | | Long-standing Vendor Relationships:Major vendors average 11 years |
| ■ | | Large Vendor Base:Over 2,000 active vendors |
| ■ | | Diverse Customer Base:Almost 400,000 customers |
Data as of or for period ended 3/31/12
 | Vendor Finance | 3 |
Building on a Proven Business Model
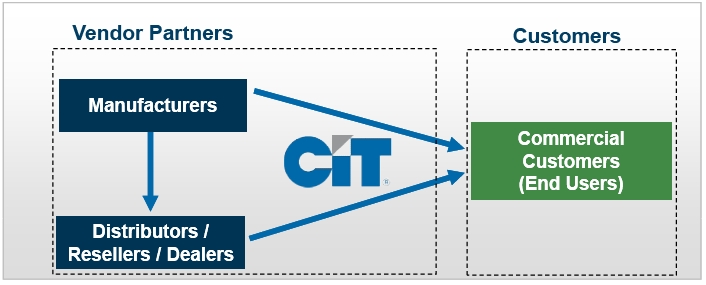
| ■ | | Focused on providing small businesses and middle market companies equipment leasing and value-added services |
| ■ | | Tailored equipment financing and leasing programs for manufacturers, distributors and equipment resellers |
| ■ | | Equipment financing and value-added services throughout the equipment life cycle from invoicing to asset disposition |
 | Vendor Finance | 4 |
Customer Diversity Provides Spread of Risk
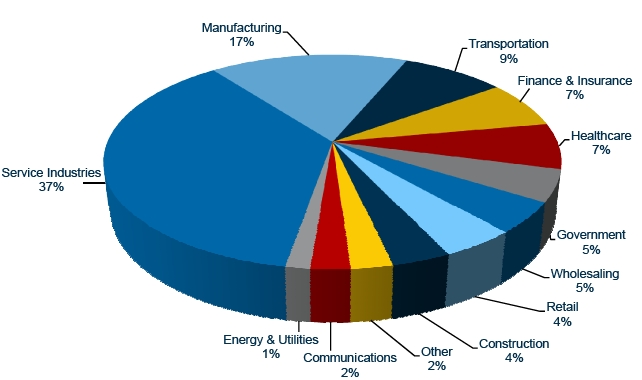
Global Vendor Finance Financing and Leasing assets. Data as of or for period ended 3/31/12
 | Vendor Finance | 5 |
We Provide Multiple Benefits to Our Vendor Partners and Customers
Manufacturer, Reseller, Dealer, Distributor (~ 2,000)
| ■ | | Sell more equipment & close sales quickly |
| ■ | | Capture incremental revenue |
| ■ | | Improve cash flow & preserve capital |
| ■ | | Enhance customer loyalty & footprint |
| ■ | | Minimize customer credit exposure |
| ■ | | Customer billing consolidated for equipment and services |
| ■ | | Eliminate the cost and burden of an in-house captive |
| ■ | | Broad range of tailored financing choices to their customers |
Commercial Customers (~400,000)
| ■ | | Predictable, affordable monthly payments |
| ■ | | Provides flexibility for equipment upgrades |
| ■ | | Streamlined invoicing for equipment and services |
 | Vendor Finance | 6 |
We Source Business through Multiple Channels
| |
| | ■Support for both manufacturer sales and retail sales |
| | channels |
| Manufacturers | ■Leveraging manufacturer’s platform and sales force |
| ■Cultural Alignment | brings scale |
| ■Strategic Relationship | ■Customized structures, such as “private label programs” |
| ■Branding in the Market | that support manufacturer and retail sales |
| | ■Work with Distributors and Resellers to qualify and |
| | secure programs with their channel partners |
| | ■Measure of success gauged by share of wallet |
| |
| Distributors / Resellers | ■Standard program agreements and structures |
| ■Speed and Consistency | ■More broad-based, with multiple products |
| of Service | ■Typically multi-funder model |
| ■Broad Product Knowledge | ■Measure of success gauged by share of wallet |
| |
| Direct | ■Support the broader financing needs of our customers |
 | Vendor Finance | 7 |
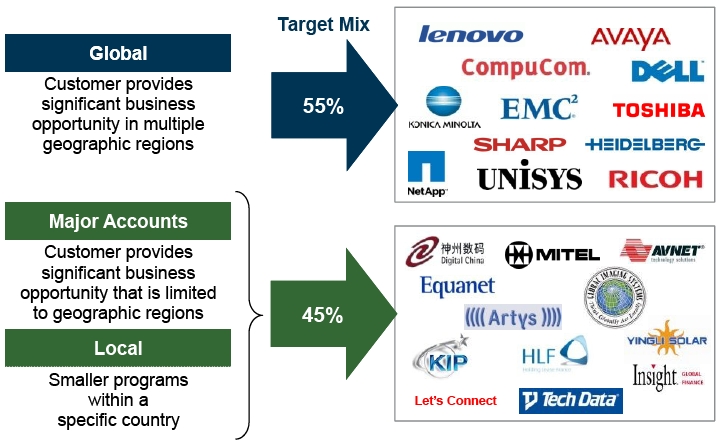
Key to Sustainable Growth: Maintaining a Mix of Vendor Partners
 | Vendor Finance | 8 |
Revenue Opportunity for Vendor Finance Throughout Lease Cycle

 | Vendor Finance | 9 |
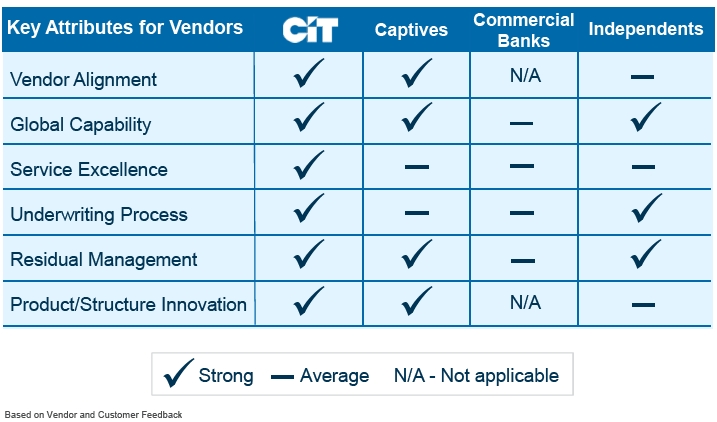
Strong Competitive Position with a Priority on Service
 | Vendor Finance | 10 |
Relationships and Service Win Business
| ■ | | Fastest growing PC manufacturer |
| ■ | | RFP process launched Q3 2009 |
| ■ | | Program awarded to CIT Q2 2010 |
| ■ | | Launched initially in North America |
| ■ | | Rolled out to Europe in Q3 2010 |
| ■ | | Expanded into Latin America |
 | Vendor Finance | 11 |
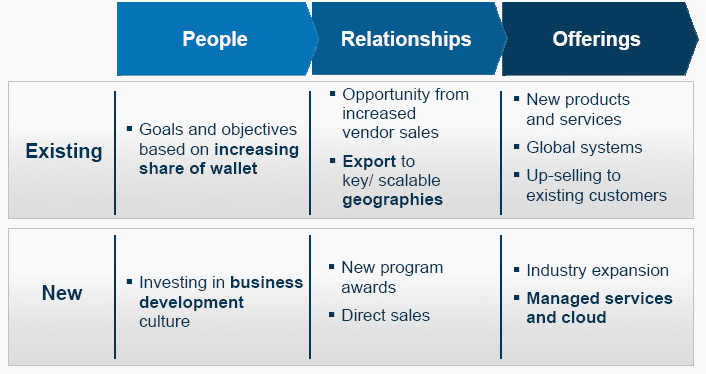
Growth Driven by Increased Penetration and Expansion
 | Vendor Finance | 12 |
Growth Markets Represent Significant Opportunities

Market
| ■ | | 2ndlargest GDP in the world(1) |
| ü | | Forecast GDP growth between 6% and 8% through 2013 |
| ü | | Remain a net exporter of goods |
| ■ | | Maturing leasing market with significant potential |
| ■ | | China leasing portfolios grew 33% in 2011 to RMB 930 billion(2) |
CIT Competitive Advantages
| ■ | | Strong vendor & reseller relationships |
| ■ | | Extensive industry coverage |
| ■ | | Scalable in country operating platform |
| ■ | | Excellent portfolio performance |
| (1) | | International Monetary Fund listing 2011 |
| (2) | | 2011 China Financial Leasing Industry Development Report |
 | Vendor Finance | 13 |
Growth Markets Represent Significant Opportunities

Market
| ■ | | 6thlargest GDP in the world(1) |
| ü | | Forecast GDP growth between 2% and 5% through 2013 |
| ü | | Strong manufacturing and remains a net exporter of goods |
| ■ | | Leasing market portfolio ~$55B(2), with annual volume of ~$13B(2) |
| ü | | Maturing and growing market |
| ü | | Brazil represents 63% of Latin America leasing portfolio |
CIT Competitive Advantages
| ■ | | Long-term presence and strong reputation |
| ■ | | Extensive industry coverage and comprehensive product offering |
| ■ | | Robust sales coverage model |
| ■ | | Local bank deposits provide Reais funding |
| ■ | | Excellent portfolio performance |
| (1) | | International Monetary Fund listing 2011 |
| (2) | | The Alta Group – data represents year-end 2010 |
 | Vendor Finance | 14 |
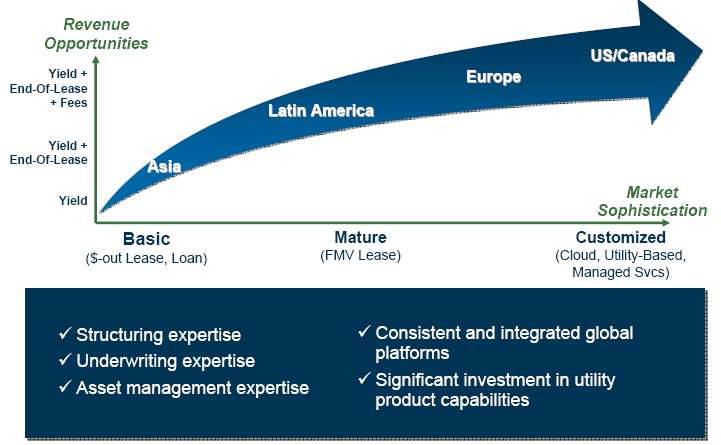
Well Positioned to Capitalize on Market Shift to Customize Products
 | Vendor Finance | 15 |
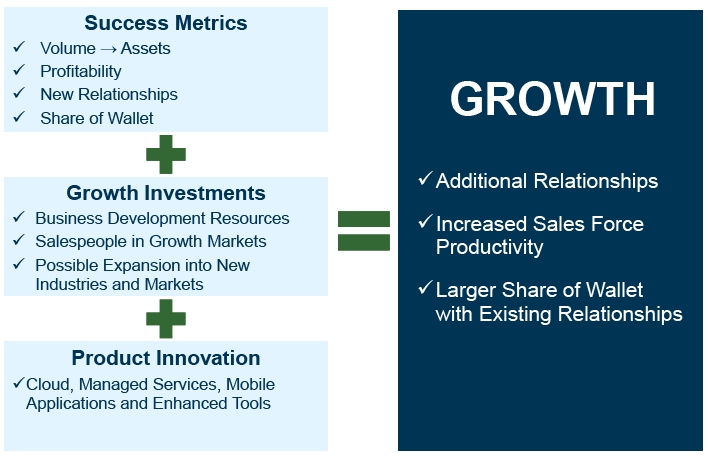
Formula for Growth Includes Investment
 | Vendor Finance | 16 |
A Global Leader Positioned for Growth
| ■ | | Targeting select regions forsignificant, scalable growth |
| ■ | | Enhancing a proven business modelthat provides long-term value to partners and customers |
| ■ | | Utilizing astrong bank-centric funding strategyin the US that can support prudent growth at a competitive cost |
| ■ | | Establishing aforward-looking roadmapthat positions Vendor Finance for prudent incremental growth |
Creating Growmentum
 | Vendor Finance | 17 |

 | Vendor Finance | 18 |

Transportation Finance
Capital for Companies on the Move
Jeff Knittel

Transportation Finance Is Well-Positioned for Continued Success
Favorable industry fundamentals and competitive landscape
Quality fleets and a diverse client base
Strong utilization and attractive yields
Multiple channels for growth
Cost-efficient financing creating new opportunities
Proven ability to execute through multiple market cycles
 | Transportation Finance | 2 |
Significant and Expanding Franchise

(1) Leasing includes operating leases only
Data as of or for period ended 3/31/12
 | Transportation Finance | 3 |
Broad and Balanced Portfolio
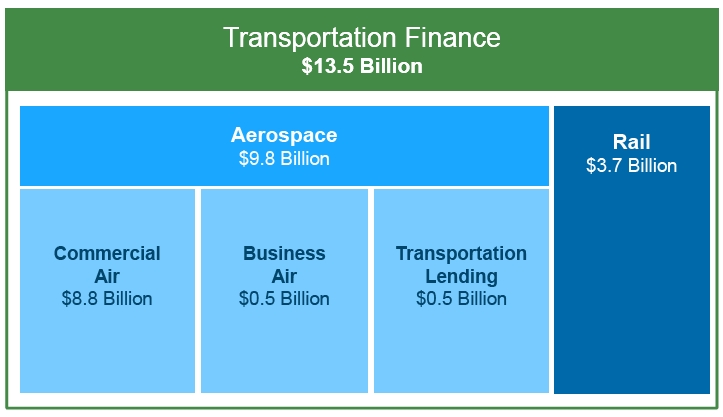
Data as of or for period ended 3/31/12
 | Transportation Finance | 4 |
A Global Provider of Financial Solutions to the Aerospace Industry
| ■ | | Modern, fuel efficient fleet |
| ■ | | Seasoned management team |
| ■ | | Global operating platforms |
| ■ | | Full financial product offering |
| ■ | | Strong customer, manufacturer and industry relationships |
| ■ | | Business aircraft team dedicated to the growing global market |
| ■ | | Provider of supply chain financing to aerospace and defense industries |
| ■ | | Differentiate from the competition via “intellectual capital” |
Data as of or for period ended 3/31/12
 | Transportation Finance – Aerospace | 5 |
Demand for Commercial Aircraft Expected to Grow
| ■ | | Global air traffic resuming 3-5% long-term growth trend |
| ■ | | International traffic growing nearly twice as fast as domestic services |
| ■ | | World fleet expected to more than double over next 20 years |
| ■ | | Narrow body aircraft in highest demand as low-cost carriers and route fragmentation proliferate |
| ■ | | Longer-range, intermediate-body aircraft demand driven by intercontinental travel |
| ■ | | Regional jets and large wide-body aircraft continue specialized roles |
 | Transportation Finance – Aerospace | 6 |
Demand Shifting from Developed to Developing Countries
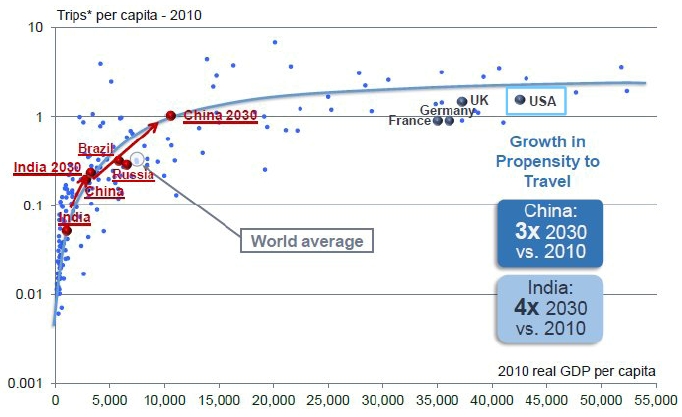
Source: Airbus
*Passengers originating from respective country
 | Transportation Finance – Aerospace | 7 |
Leased Proportion of World Fleet Expected to Increase
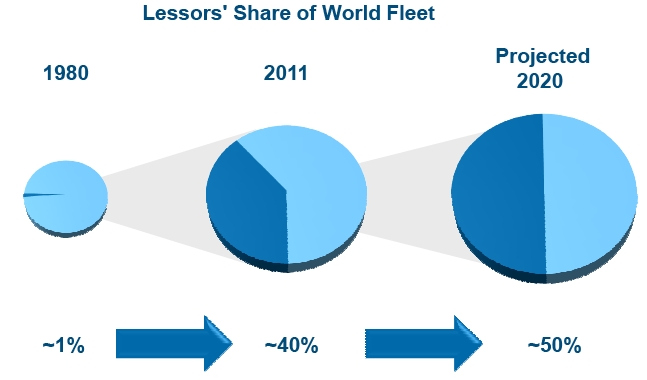
Source: Ascend and Company estimate
 | Transportation Finance – Aerospace | 8 |
We Are Well-Positioned Among Competitors
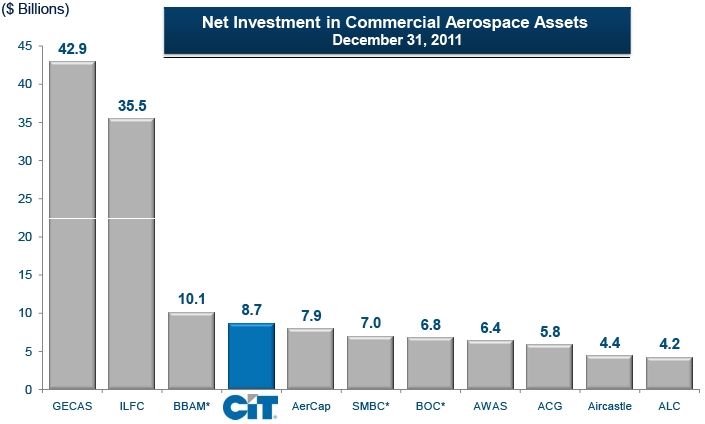
Source: Company reports/ filings. AWAS net investment as of November 30, 2011.
*Based on Ascend current market values because net investment was not readily available in company reports/filings. SMBC = Sum of RBS and Sumitomo CMVs
 | Transportation Finance – Aerospace | 9 |
Strong Value Proposition
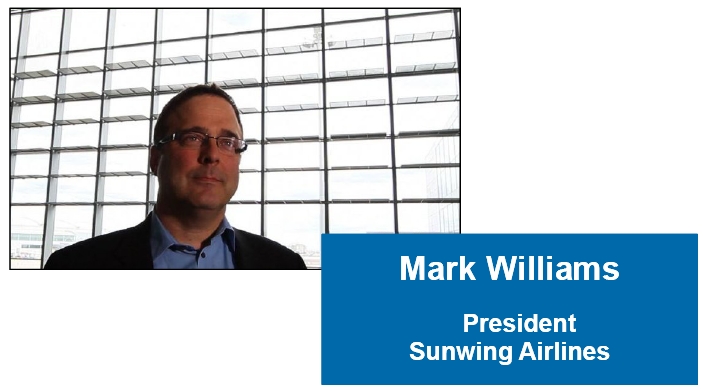
 | Transportation Finance – Aerospace | 10 |
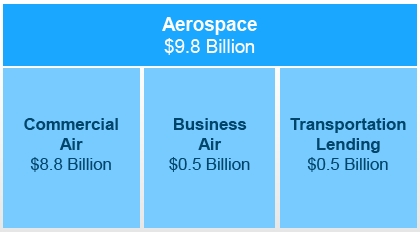
Commercial Air Is a Significant and Growing Business

| ■ | | Primarily an operating lessor |
| • | | $8.2 billion operating leases on 266 aircraft |
| • | | $0.6 billion of loans secured by 73 aircraft(2) |
| • | | Over 100 lending and leasing clients |
| • | | Clients spread across ~50 countries |
| • | | Serve a wide array of carriers |
(1) Based on net investment. Region chart based on operating lease fleet
(2) Includes finance leases. Count excludes syndicated loan aircraft
Data as of or for period ended 3/31/12
 | Transportation Finance – Aerospace | 11 |
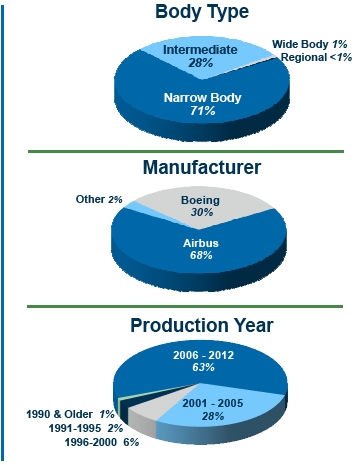
High Quality and Diverse Fleet
| ■ | | 98% of fleet is in-production |
| ■ | | Weighted average age is 6 years |
| ■ | | Primarily Airbus A320 family and Boeing 737NG |
| • | | Efficient narrow-body aircraft |
| ■ | | Select investments in intermediate body aircraft |
| • | | Principally A330s, A350s and 767s |
| ■ | | Few regional and wide-body aircraft |
| ■ | | Disciplined asset manager |
Based on net investment in operating lease fleet
Data as of or for period ended 3/31/12
 | Transportation Finance – Aerospace | 12 |
Strong Order Book
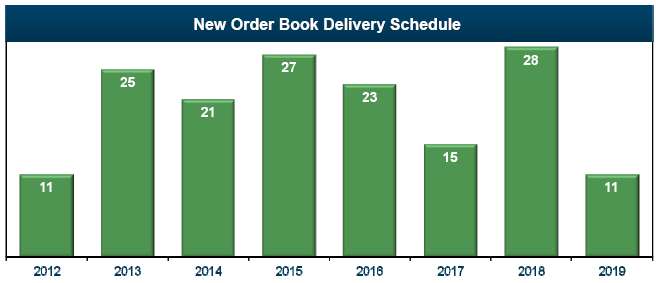
| ■ | | 161 aircraft with deliveries thru 2019 |
| • | | Approximately $1.0-$1.5 billion of deliveries per year |
| • | | ~2/3rds narrow body (largely A320 NEO and 737NG) |
| • | | Diversified by manufacturer |
| • | | Strategic investment in twin aisle aircraft |
| ■ | | All scheduled 2012 deliveries are placed |
Data as of or for period ended 3/31/12
 | Transportation Finance – Aerospace | 13 |
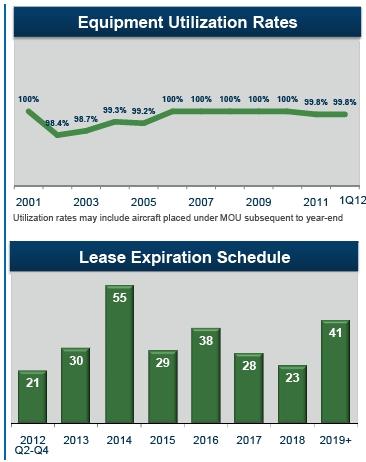
Effective Asset Manager
| ■ | | Equipment utilization near 100% |
| ■ | | Strong residual realization |
| • | | Historically around 105-110% |
| • | | Higher recently due to FSA adjustments |
| ■ | | Balanced expiration schedule |
| • | | ~10-20% of fleet rolls in any year |
| • | | ~Half renew with existing lessee |
| ■ | | New business terms are attractive |
Based on operating lease fleet. Expiration schedule excludes one aircraft off lease
Data as of or for period ended 3/31/12
 | Transportation Finance – Aerospace | 14 |
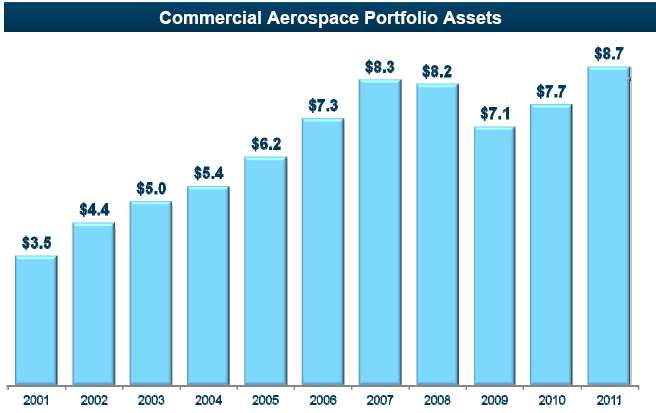
Ability to Manage and Deliver Growth
($ Billions)
 | Transportation Finance – Aerospace | 15 |
Business Air: A Niche Player
Overview
| • | | Structured loans & leases |
| • | | Approximately 100 customers |
| • | | High net worth (HNW) individuals and corporate end-users |
| • | | Over 70% of 2011 volume was international |
| • | | Business spans Asia, Latin America and Europe |
Target Market
| ■ | | Focus on “new” mid/large cabin aircraft |
| • | | International embedded base of $17 billion that are less than 10 years old |
| • | | Est. $5-6 billion of new deliveries per year (international only) |
| ■ | | International demand strong |
| • | | ~50% of new business jet orders international |
| • | | Annual growth rate of approximately 10% |
| • | | Rapidly expanding pool of HNW individuals |
Source: General Aviation Manufacturers Association, JP Morgan Research and CIT estimates
Strategic Focus
| ■ | | Expand international presence |
| ■ | | Advance manufacturer partnerships |
| ■ | | Leverage CIT Bank capabilities |
 | Transportation Finance – Aerospace | 16 |
Transportation Lending: A Natural Extension
Overview
| • | | Cash flow loans (acquisition finance) |
| - | | Equipment (vessels, parts, etc.) |
| - | | Receivable & inventory financing |
| • | | Aerospace, Defense & Government Services, Marine and Rail Markets |
| • | | Secondary market opportunities |
Deals Reviewed by Segment

Strategic Focus
| ■ | | Continue to “sell” industry expertise |
| ■ | | Advance financial sponsor relationships |
| ■ | | Explore adjacent markets |
| ■ | | Aggressively manage the portfolio |
 | Transportation Finance – Aerospace | 17 |
Proven Aerospace Strategy
Acquire in-demand assets at the right price
Further strengthen relationships with manufacturers and clients
Maintain geographic, customer and equipment diversification
Diversify and lower funding costs
Selectively grow loan portfolio
 | Transportation Finance – Aerospace | 18 |
CIT Is a Leading Railcar Lessor
| ■ | | Top 3 North American lessor |
| ■ | | Strong customer, manufacturer and industry relationships |
| ■ | | Full life-cycle equipment manager |
| ■ | | Over 100,000 railcars & 450 locomotives |
| ■ | | Diverse, young and well-maintained equipment |
| ■ | | Approximately 500 clients including all of the Class I railroads |
Data as of or for period ended 3/31/12
 | Transportation Finance – Rail | 19 |
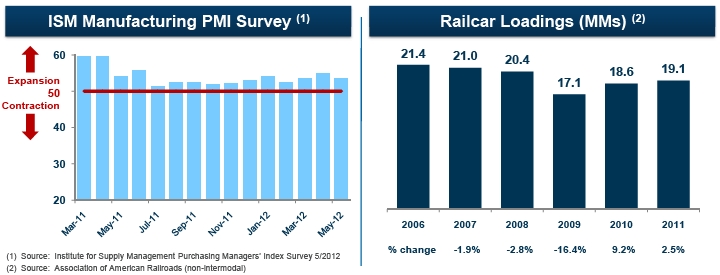
Overall Rail Market Environment Is Improving
| ■ | | North American industrial sector continues to grow slowly |
| ■ | | Energy driven markets have dominated new car activity |
| ■ | | US and Canada non-coal rail loadings are up 3.8% from a year ago |
| ■ | | Coal market weakened in Q1 2012; showing signs of stabilization |
| ■ | | Overall utilization and yields remain at solid levels |
| ■ | | Limited new car manufacturing availability until Q4 2013 |
 | Transportation Finance – Rail | 20 |
Competitive Environment Is Stable
% Share Among North American Lessors

Source: CIT estimates based on 2010-2012 data from Progressive Railroading / UMLER, SEC filings and industry presentations. Excludes TTX.
 | Transportation Finance – Rail | 21 |
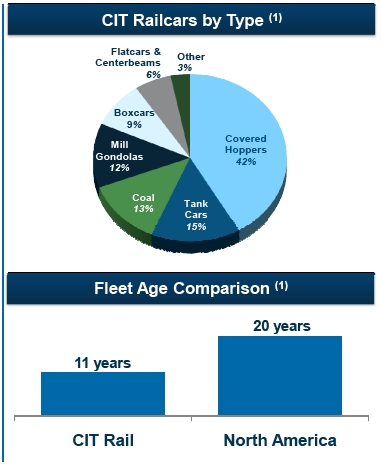
High Quality Fleet Results in Strong and Consistent Demand
| ■ | | Significant and diverse portfolio |
| ■ | | Balanced distribution of car types |
| ■ | | 95% of freight fleet comprised of
high capacity, efficient railcars |
| ■ | | Young, well-maintained equipment |
| • | | Average age of 11 years is well below
the overall N.A. fleet |
| • | | Lower operating/maintenance costs |
(1) By unit count. Operating lease portfolio only.
Data as of or for period ended 3/31/12
 | Transportation Finance – Rail | 22 |
Strong Order Book Facilitates Growth
| • | | Maintain alignment with long-term industrial product demand trends |
| • | | Provide clients with young, well-maintained and cost-efficient assets |
| ■ | | ~9,000 railcars to be delivered in 2012/2013 |
| ■ | | Deliveries include approximately 75% tank cars and 25% covered hoppers |
| ■ | | 2012 deliveries are ~85% committed; 2013 deliveries are ~80% committed |
| ■ | | Most new deliveries in CIT Bank |

Data as of or for period ended 3/31/12; Includes orders placed in May 2012
 | Transportation Finance – Rail | 23 |
Diverse Client Base Provides Stability
| • | | Serve a wide array of industries core to North American economy |
| • | | Approximately 500 customers |
| • | | Fleet management (i.e. flexibility) |
| • | | Maintain broad market coverage |
| • | | Build strong relationships |
(1) By unit count. Operating lease portfolio only.
Data as of or for period ended 3/31/12
 | Transportation Finance – Rail | 24 |
Proven Asset Manager
| ■ | | Utilization nearing historic highs |
| • | | 1Q 2012 increased to 97.6% |
| ■ | | Strong residual realization |
| • | | Historical average ~110-120% |
| • | | Impacted by scrap / steel prices |
| ■ | | Lease expirations well distributed |
| • | | Less than 25% roll off in any year |
| • | | Average remaining term of ~3 years |
| • | | Most cars renew with existing lessee |
| ■ | | New business terms are attractive |
| • | | Cars coming off-lease are renewing at improved net yields |
Data as of or for period ended 3/31/12
 | Transportation Finance – Rail | 25 |
Disciplined Rail Strategy
Maintain modern, cost-effective and in-demand fleet
Grow by investing in select car types
Maintain leading client service
Proactively manage risks
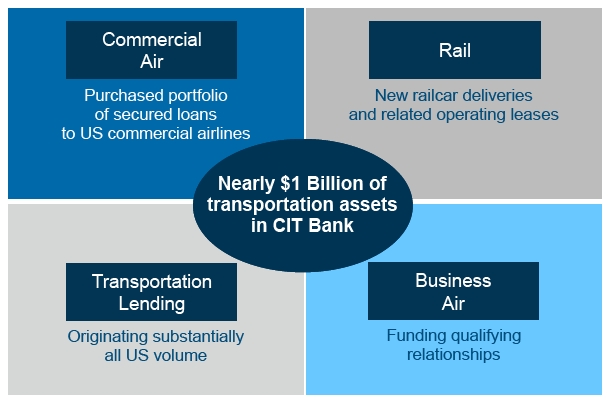
Leverage CIT Bank capabilities
 | Transportation Finance – Rail | 26 |
All Units Doing Business in CIT Bank
Data as of or for period ended 3/31/12
 | Transportation Finance | 27 |
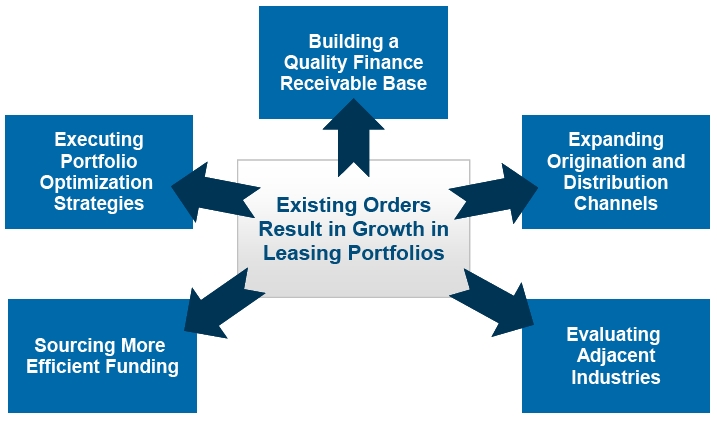
Growing Assets & Profitability Beyond the Order Books
 | Transportation Finance | 28 |
Transportation Finance Is Well-Positioned to Create Value
Favorable industry fundamentals and competitive landscape
Quality fleets and a diverse client base
Strong utilization and attractive yields
Multiple channels for growth
Cost-efficient financing creating new opportunities
Proven ability to execute through multiple market cycles
 | Transportation Finance | 29 |

 | Transportation Finance | 30 |

Credit Risk Management
Culture of Credit
Rob Rowe

Positioned for the Future
| ■ | | Strong credit organization and culture |
| ■ | | Focused on risk adjusted / return profile of portfolio assets |
 | Credit Risk Management | 2 |
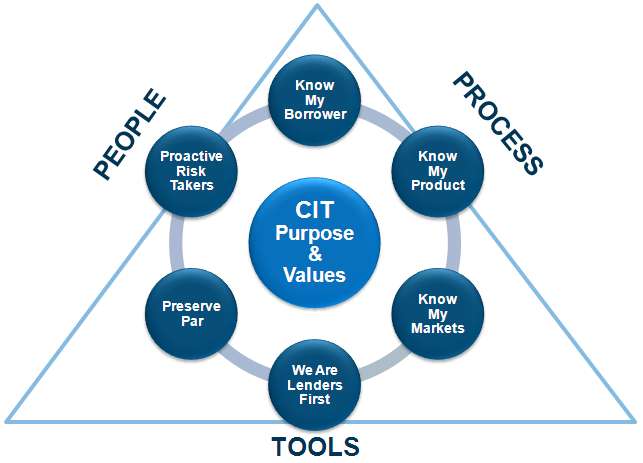
Credit Culture Based on Clear Set of Guiding Principles
 | Credit Risk Management | 3 |
Robust Oversight and Controls in Place
| |
Corporate
Governance | ■ Set three lines of defense: Business, Risk and Loan Review & Internal Audit ■ Revised risk tolerance to reflect size and risk appetite of organization ■ Instituted new committee structure that allows for quick escalation, transparency and decision making ■ Revised policies and procedures in underwriting and portfolio management |
| | |
Portfolio
Strategy | ■ Built out Credit Risk Reporting to drive portfolio strategy decisions ■ Reduced large obligor exposures ■ Significantly reduced problem loan portfolio ■ Rebalanced cash flow and reduced consumer lending ■ Re-graded entire portfolio |
| | |
Staffing &
Training | ■ Right people in the right places ■ All credit professionals across organization report into risk ■ Training and development deployed globally across credit organization |
| | |
Credit
Controls | ■ Revised authorities that are appropriate for business segments and size of firm ■ New portfolio concentration limits in place ■ Require industry reviews and approvals |
 | Credit Risk Management | 4 |
Consistent Underwriting Approach AcrossCredit RiskSpectrum

| Industry White Papers: | | Define what markets we target and why |
Risk Acceptance Criteria &
Target Market Definitions: | | Define transaction structure parameters |
| Risk Rating System: | | First introduced in 2006 and was recently re-developed and validated |
Standard Underwriting
Documentation: | | Promotes single credit culture and consistent approach to underwriting |
| Pre-screen Process: | | Involves decision makers early to ensure we dedicate resources to transactions that fit our credit criteria |
| Credit Authorities: | | Based on total institutional exposure and scaled to product and transaction risk |
| Approval Process: | | Majority of business reviewed by committees to ensure broad input |
| Risk-based Pricing: | | Ensures pricing reflects risk |
 | Credit Risk Management | 5 |
We Get Paid for Taking Credit Risk in Areas ofExpertise
CommercialYield PeerComparison
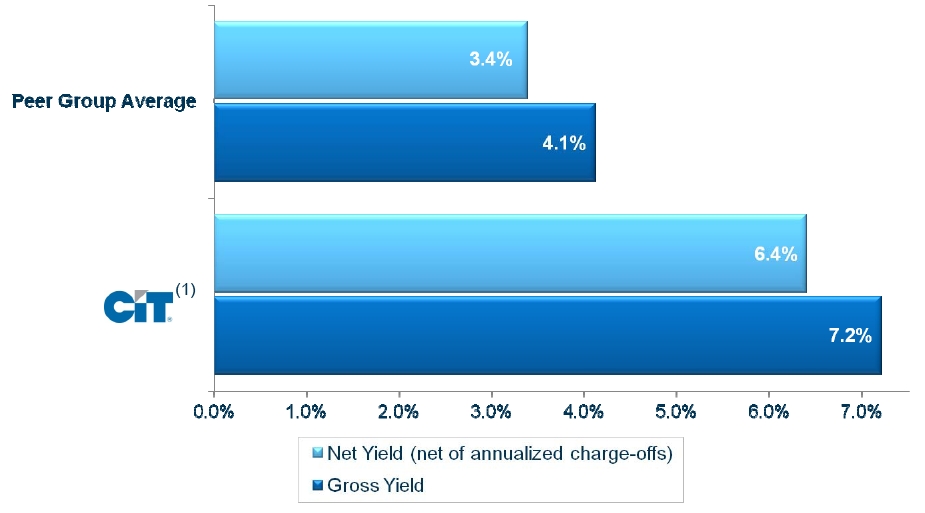
(1) Excluded income related to FSA
Data as of or for period ended 3/31/12
 | Credit Risk Management | 6 |
ExpertiseandSecurity MitigateCredit Risk
CommercialLoan and LeasePortfolio:$28.4Billion
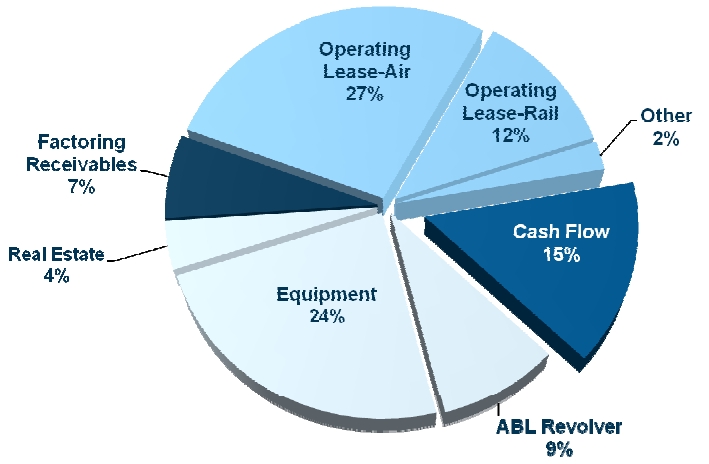
99.8% of Cash FlowPortfolioIs 1st LienSenior Secured
Percentages based on internal loan level data as of 3/31/12
 | Credit Risk Management | 7 |
CommercialLoan & LeasePortfolio Diversified Across Industries
Portfolio:$28.4Billion
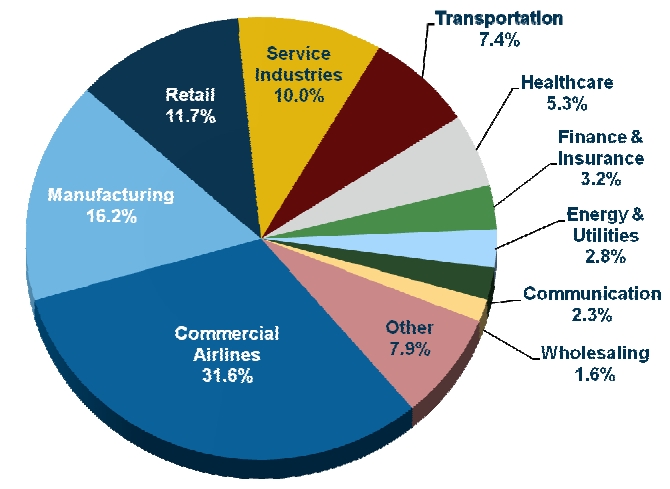
Data as of or for period ended 3/31/12
 | Credit Risk Management | 8 |
Limited ExposuretoCurrent RegionsofConcern

| ■ | | Excludes Student Lending and Commercial Air |
| ■ | | $1.2 billion or 6.3% exposure across Europe, primarily in Great Britain (2.7%) with no other European country exposure exceeding 1% |
| ■ | | Exposure to Portugal, Italy, Ireland, Greece and Spain totals $180 million with no direct sovereign exposure |
Data as of or for period ended 3/31/12 Excludes Commercial Air and Student Lending and includes Rail
 | Credit Risk Management | 9 |
Non-PerformingAssets HaveDeclined Significantly
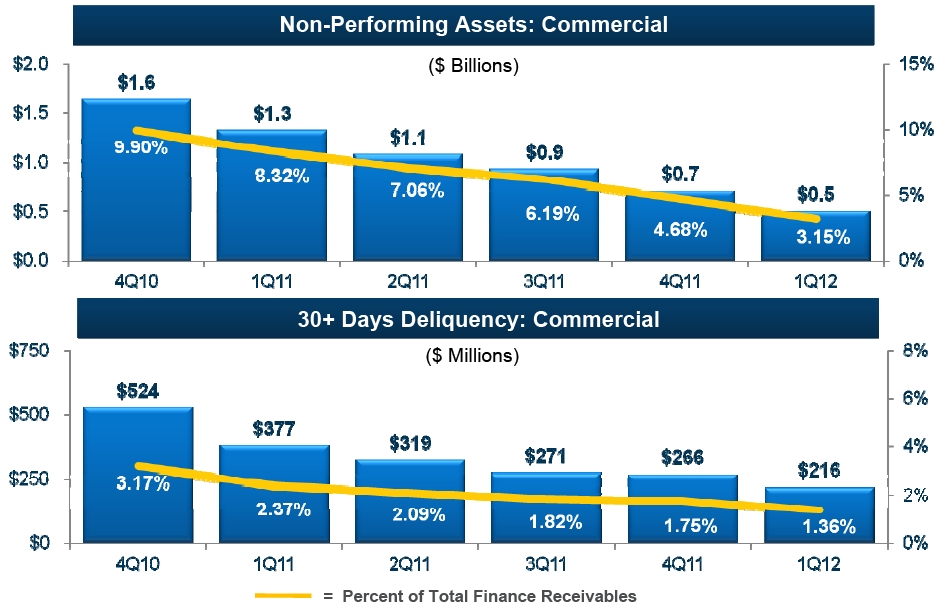
 | Credit Risk Management | 10 |
NetCharge-Offs HaveDecreasedto Cycle Lows
($ Millions)

 | Credit Risk Management | 11 |
ReservesAre Stable Due toImproving
andGrowing Commercial Portfolio
($ Millions)
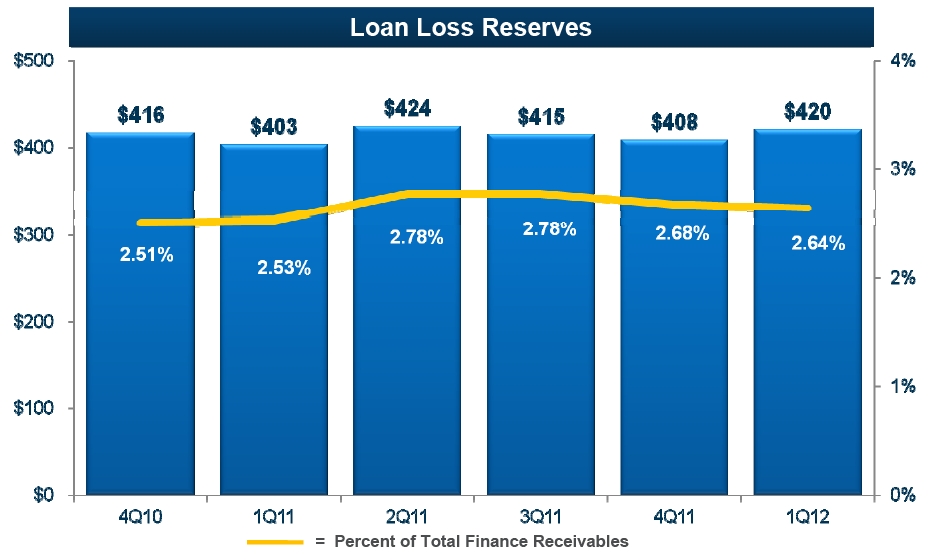
 | Credit Risk Management | 12 |
AligningCreditCultureandGrowth Objective
| ■ | | Strong credit organization and culture |
| – | | Foundation built on disciplined underwriting processes and culture |
| ■ | | Focused on risk adjusted / return profile of portfolio assets |
| – | | Platform currently in place to support strong and prudent risk adjusted growth |
| – | | Granularity continues to be a focus |
| – | | Lower NPAs as a percentage of the portfolio |
| – | | Diverse portfolio across four business segments |
 | Credit Risk Management | 13 |

 | Credit Risk Management | 14 |

Funding&Liquidity
Transitioning LiquidityandFunding Profile
Glenn Votek
RayQuinlan

Substantial Progress Improving LiquidityandFunding
| |
| | ■Significant liquidity resources supported by: |
| Liquidity | –Cash & short-term-investments |
| | –Committed funding facilities |
| |
| | ■Substantial progress toward efficient funding profile |
| Funding | –Liability profile realignment near complete |
| | –Solid access to diverse funding sources |
| | –Building out deposit platform |
| |
| | ■Focused on investment grade ratings |
| Credit | –Favorable ratings migration trend |
| Ratings | –Investment grade ratings can drive further funding |
| | benefits |
 | Funding & Liquidity | 2 |
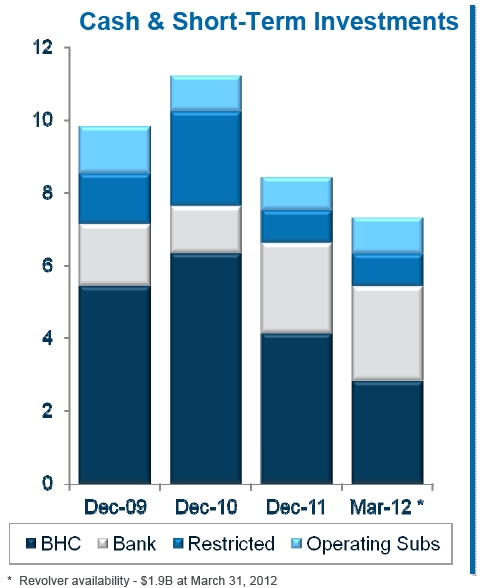
Improving Liquidity Efficiency
($Billions)
| ■ | | Cash and short-term investments portfolio is primary liquidity source |
| ■ | | Target 12-month forward funding obligations on a post-stress basis including: |
| • | | No access to capital markets |
| • | | Greater collateral requirements |
| • | | Increased customer line draw activity |
| ■ | | Restricted balances declined following elimination of debt indenture cash sweep requirement |
 | Funding & Liquidity | 3 |
Meaningful Committed Liquidity
($ Billions)
| | | | | | Unused | | Commitment |
| | | Commitment | | Amount | | Expiration Date |
| Bank Revolver | | $2.0 | | | $1.9 | (1) | | Aug 2015 |
| US Secured Facilities | | 1.6 | | | 0.4 | | | Mar / Sep 2013 |
| TRS Facility | | 2.1 | | | 0.2 | | | Jun 2028 |
| Int’l Secured Facilities | | 0.4 | | | 0.2 | | | Jun 2013 |
| Total | | $6.1 | | | $2.6 | (2) | | |
| ■ | | Committed funding facilities provide solid source of alternate liquidity |
| ■ | | The facilities provide term liquidity at an attractive price |
| • | | Weighted average cost of L+250 bps |
| • | | Weighted average committed term of ~7 years |
(1) $100 million outstanding for letter of credit commitment (2) Does not foot due to rounding
Data as of or for the period ended 3/31/12
 | Funding & Liquidity | 4 |
Significantly Improved FundingProfile
($ Billions)
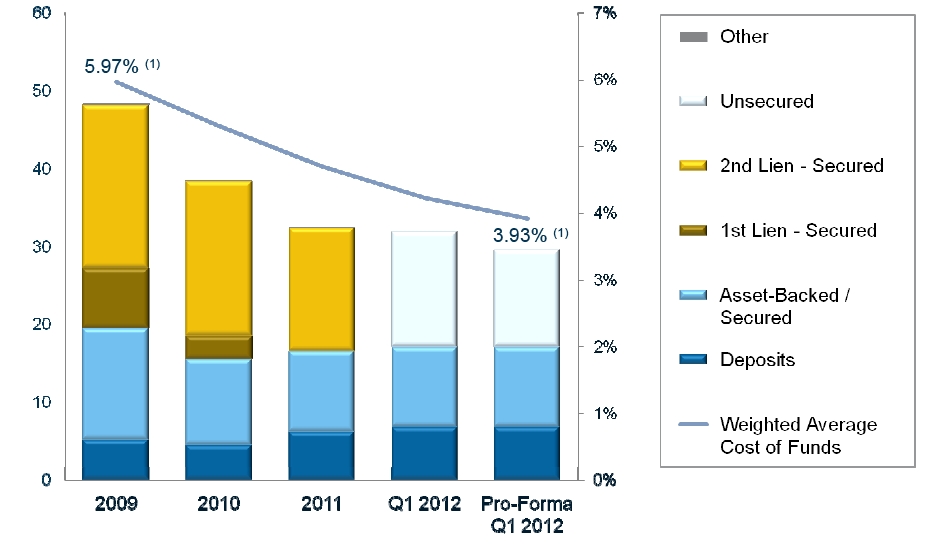
| (1) | | Excludes FSA adjustments and amortization of fees and expenses. Figures are pro forma for $2 billion senior unsecured issuance in Q2 2012, all completed or announced redemptions of 7% Series C notes in Q2 2012 and does not include any drawdowns or payments on the Revolver after March 31, 2012. |
 | Funding & Liquidity | 5 |
Laddered Liability Structurewith No Near-TermMaturities
($ Billions)

| (1) | | Excludes FSA adjustments and amortization of fees and expenses. |
| (2) | | Figures are pro forma for $2 billion senior unsecured issuance in Q2 2012, all completed or announced redemptions of 7% Series C notes in Q2 2012 and do not include any drawdowns or payments on the Revolver after March 31, 2012. |
 | Funding & Liquidity | 6 |
Further OpportunitytoReduce InterestCosts
($Billions)

| ■ | | Opportunity to improve funding cost through redemption of remaining 7% Series C debt |
| ■ | | Significant amount of non-bank, unencumbered portfolio assets |
| ■ | | Increasing proportion of assets funded through CIT Bank will also create funding benefits |
(1) Includes all completed or announced redemptions of 7% Series C notes in Q2 2012
Data as of or for period ended 3/31/12
 | Funding & Liquidity | 7 |
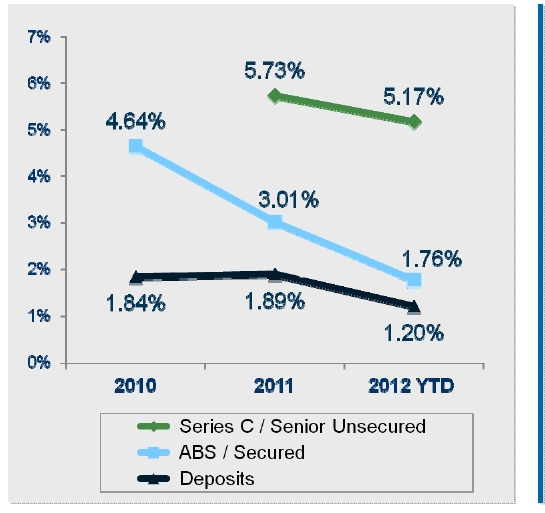
Continued ImprovementinMarginal FundingCost
Weighted Average InterestRate on NewFinancings
| ■ | | Series C/Senior unsecured cost down over 50 bps year-over-year while weighted average maturity increased by 1- 2 years |
| ■ | | ABS/Secured cost improvement driven by 1stlien refinancing and term ABS execution |
| ■ | | Decline in 2012 deposit cost reflects growth in Internet deposits |
Figures are pro forma for $753 million equipment lease securitization that closed in April 2012, $2 billion senior unsecured issuance in May 2012 and do not reflect any drawdowns or repayments on the Revolver after August 2011.
 | Funding & Liquidity | 8 |
FavorableCreditRatingsTrend WillImprove FinancingCosts

| ■ | | Achieving investment grade ratings remains our objective |
| ■ | | Key drivers to higher ratings: |
| – | | Improved earnings profile |
| ■ | | While CIT bonds trade better than their ratings, investment grade ratings could create up to 250 bps of marginal funding improvement |
 | Funding & Liquidity | 9 |
Evolutionto aBalanced FundingModel
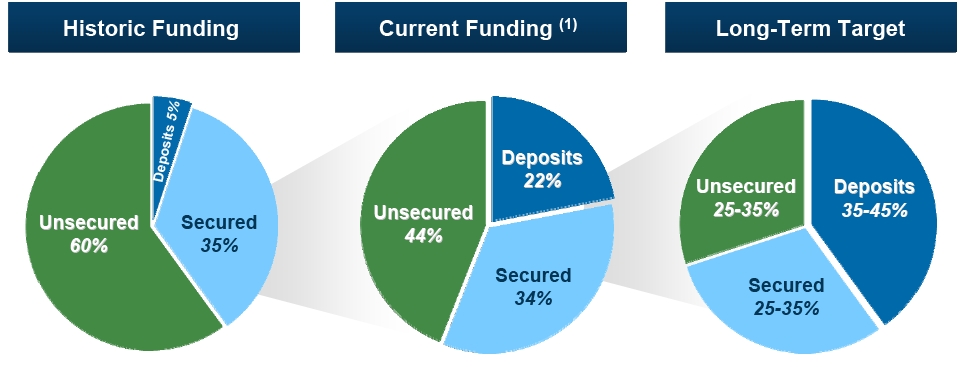
| ■ | | Foundation of long -term liability strategy includes balanced funding model |
| ■ | | Hybrid funding model to facilitate the path back to investment grade ratings |
| ■ | | Bias towards a higher mix of deposits vs. capital markets funding |
| (1) | | Data as of March 31, 2012 and pro forma for $2 billion senior unsecured issuance in Q2 2012, all completed or announced redemptions of 7% Series C notes in Q2 2012 and does not include any drawdowns or payments on the Revolver after March 31, 2012. |
 | Funding & Liquidity | 10 |
CIT Bank - A Solid Path toFunding Growth
Steady Progress
Reliable, Low-Cost Funding
Continue to Build on Strong Foundation
 | Funding & Liquidity | 11 |
CIT Bank Has MadeSignificant Progress

 | Funding & Liquidity | 12 |
Keys toSustainable Deposit Growth
Brand Characteristics
| ■ | | Convenience and quality service |
Top Tier Ratings
| ■ | | 4 Star Bankrate. com rating |

 | Funding & Liquidity | 13 |
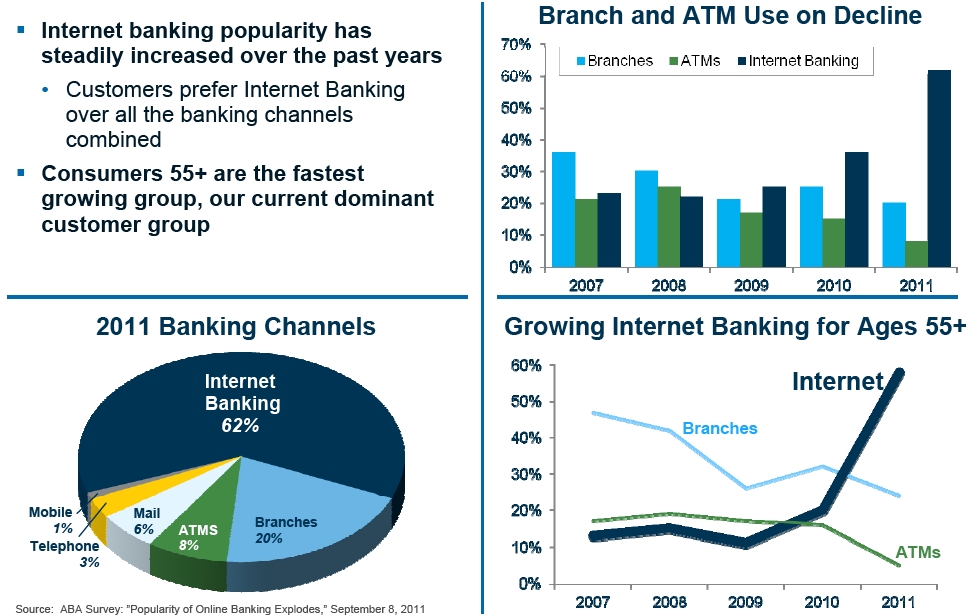
Banking Trends SupportCIT Bank's BankDeposit Strategy
 | Funding & Liquidity | 14 |
Evolutionof CIT Bank’sDeposit Franchise

 | Funding & Liquidity | 15 |
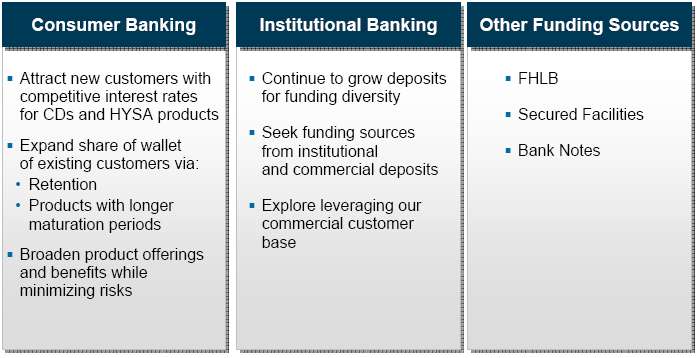
A Solid Path toAchieve Diversified Funding
| ■ | | Continue to obtain liquid, reliable, low-cost funding to support lending and leasing businesses |
 | Funding & Liquidity | 16 |

 | Funding & Liquidity | 17 |

Financial Update
Progress Towards Profitability Targets
ScottParker

Significant ProgressOver the Past Two Years
| |
| Portfolio | ■ Essentially completed |
| Optimization | ■ Reduced low yielding, non-strategic and non-accrual assets |
| |
| | ■ Refinanced/redeemed $26 billion of debt since January 2010(1) |
| Debt / Liability | ■ Diversified and better balanced bank-centric liability structure |
| | • Unsecured / secured / deposits |
| |
| | ■ Improved credit quality |
| Credit | • Sequential declines in new additions to non-accrual |
| | • Improved ratios |
| |
| | ■ Maintained tangible book value since emergence |
| Balance | • Accelerated debt FSA discount of $790 million |
| Sheet | • Net FSA benefit of $2 billion remaining |
| | • ~$4 billion Net Operating Loss carry-forwards |
(1) Includes completed and announced 7% Series C redemptions in Q2 2012
Data as of or for period ended 3/31/12; Net Operating Loss (NOL) as of 12/31/11
 | Financial Update | 2 |
Progress Towards Profitability Targets
| | |
| | Updated | Driver / Assumptions |
| Net Margin | 3.00% - 4.00% | Reflects portfolio composition
and funding costs |
| Credit Provision | (0.50%) - (0.75%) | Dependent on portfolio mix
(leases vs. loans) |
| Other Income | 1.00% - 1.50% | Lower due to fewer asset sales |
| Operating Expense | (2.00%) - (2.25%) | Reflects bank funding-related costs |
| Pre-Tax Income | 2.00% - 2.50% | Deliver consistency |
| Tax & Other | (0.25%) - (0.75%) | Utilize NOL carry-forwards |
| Net Income (ROAEA) | 1.50% - 2.00% | EPS growth exceeds asset growth |
| ROE (Common Equity) | 10% - 15% | Maintain prudent levels of capital |
Assumes 13% Capital Ratio including ~ 10% Tier 1 Common
 | Financial Update | 3 |
ContinuedShiftTowards CommercialAssets
($ Billions)
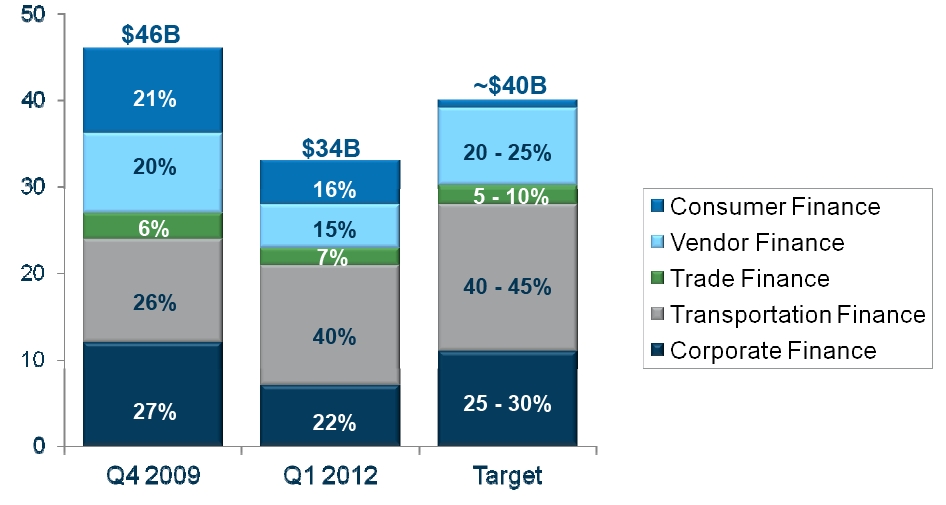
Sold $1.1BillionofStudentLoans Held for Sale at CIT Bank in April 2012
 | Financial Update | 4 |
WellDefinedPath to TargetFundingModel

Approximately60% of Q1 2012 newbusinesswas CIT Bankoriginated
 | Financial Update | 5 |
NewBusiness Committed Lending Volume Increasing
($ Billions)

Strong Volume Performance
| • | | Lending and leasing volume up vs. prior year |
| • | | CIT Bank volume comprises ~65% of total and ~85% of US volume |
Data as of or for period ended 3/31/12
 | Financial Update | 6 |
Organic CommercialAssetGrowth Improving
($ Billions)
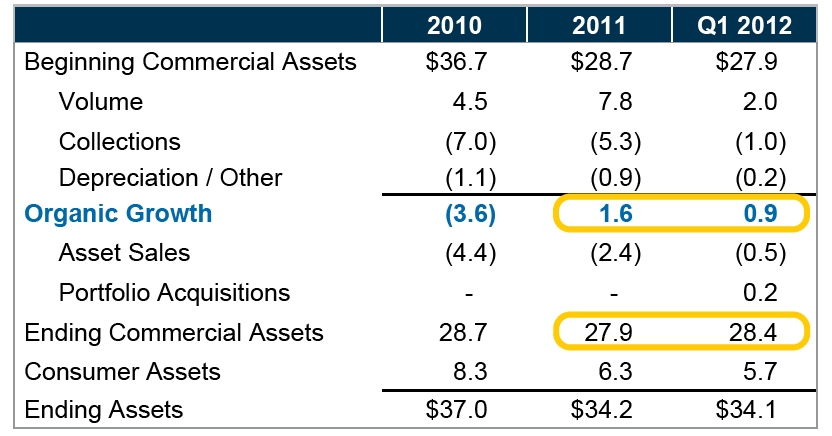
| ■ | | Commercial assets grew 2% sequentially from Q4 2011 |
| ■ | | Consolidated asset growth offset by sale of low yielding/non -strategic assets and consumer liquidation |
Note: May not foot due to rounding
 | Financial Update | 7 |
EconomicNetFinance Margin Trending Favorably
“Economic” Net Finance Margin(1)
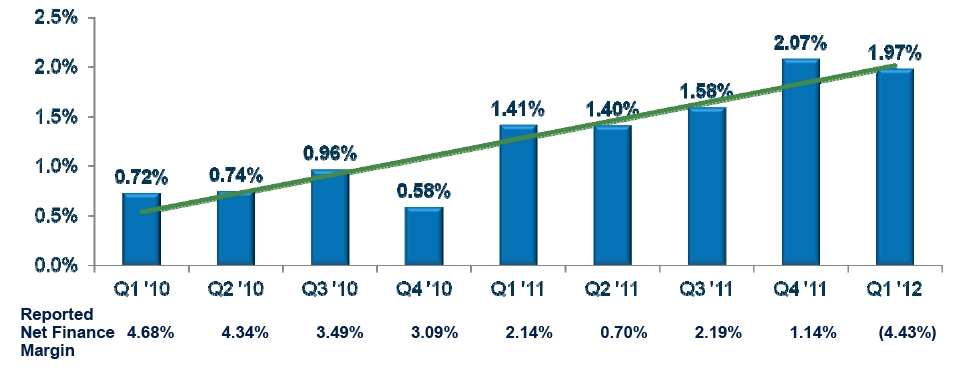
| ■ | | Reported net finance margin volatile due to impacts from Fresh Start Accounting |
| • | | Substantially decreased loan accretion |
| • | | Debt accretion accelerates as we redeem/refinance Series C debt |
| (1) | | Economic Net Finance Margin equals net interest income plus rent on operating leases minus depreciation as a percentage of average earning assets and excludes FSA accretion/ acceleration (See Non GAAP reconciliation table included in Form 10Q for period ended March 31, 2012) |
 | Financial Update | 8 |
LowerFundingCosts Have Been the Driver of NetFinance Margin

| ■ | | Portfolio yield has trended higher since Q4 2010 |
| • | | Significant progress on reducing low yielding assets |
| • | | Shift towards higher yielding commercial assets |
| • | | Continues to be impacted by interest recoveries and suspended depreciation |
| ■ | | Funding costs continue to decline |
| • | | Refinancing of high-cost debt |
| • | | Continued migration to bank funding |
| • | | Increasing international funding sources |
 | Financial Update | 9 |
Recent Funding ActivitiestoFurther BenefitNetFinance Margin
($ Millions)
| | YTD 2012 | Avg. Cost |
| Sources | | |
| Secured Debt | 380 | ~3% |
| Senior Unsecured Debt | 6,750 | ~5% |
| Cash + Revolving Credit Facility | 3,490 | ~1% |
| Debt Redemptions | | |
| Series A (Q1 ’12) | 6,450 | 7% |
| Series C (Q2 ’12) | 4,170 | 7% |
Impactfrom theseactions=benefitof ~40 bps in Q2 2012
 | Financial Update | 10 |
Core Non-Spread Revenue RemainsStable
($ Millions)

Note: May not foot due to rounding.
 | Financial Update | 11 |
Credit Metrics Near Historic Lows
($ Billions)

| ■ | | Strong portfolio quality across all segments |
| ■ | | Non-accrual loans down 75% since March 2010 |
| • | | Improved customer credit |
| • | | Proactive portfolio management |
| ■ | | Currently below target expectations; benefiting from continued recoveries |
 | Financial Update | 12 |
Considerable Operating LeverageinCurrent Infrastructure
($ Millions)
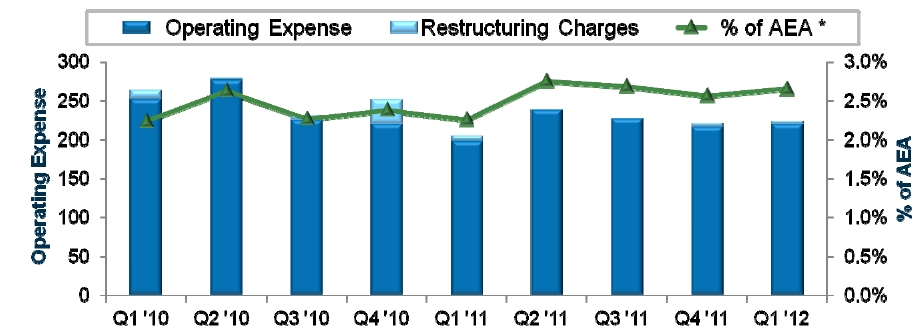
| ■ | | Expense ratios impacted by portfolio optimization efforts |
| • | | $1 billion of incremental assets reduces % of AEA by ~5 bps |
| ■ | | $40 billion asset level would put us within our target range |
| ■ | | Bank funding costs such as marketing, FDIC and servicing will continue to increase as bank-centric model evolves |
* Excludes restructuring charges
 | Financial Update | 13 |
Key TaxConsiderations
GlobalTaxProfile
| - | | Debt at US Bank Holding Company |
| • | | General and Administrative Expenses |
| - | | Substantial headquarter costs in US |
| - | | Accelerated tax depreciation on leases reduces taxable income |
| ■ | | International Tax Profile |
| • | | Profitable foreign subsidiaries |
Potential Actions
| ■ | | Offset US Net Operating Losses against future taxable income |
| • | | Further improve margin / Grow CIT Bank |
| • | | Refine intercompany pricing policies between BHC and subsidiaries |
| • | | Leverage foreign subsidiaries |
| - | | Recapitalize foreign subsidiaries with local funding |
| ■ | | Release remaining valuation allowances |
| • | | Requires history of profitability |
TheCombinationofForeign IncomeandDomestic Losses
Provides OpportunityforImprovement
 | Financial Update | 14 |
ActionstoAchieve Profitability Targets
| |
| Business | ■Growth from new opportunities and initiatives |
| Segments | ■Increased operating efficiency |
| |
| | ■Continue shift in business mix |
| Corporate | ■Improve capital efficiency |
| | ■Optimize corporate infrastructure |
| |
| | ■Continue to refinance and pay down high-cost BHC debt |
| Funding | ■Expand bank funding profile |
| | ■Return to investment grade |
 | Financial Update | 15 |
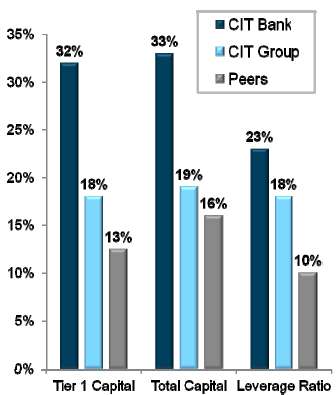
Capital PositionIs Strong
| ■ | | Capital ratios well above regulatory commitments of: |
| • | | 13% Consolidated CIT Total Capital Ratio |
| • | | 15% CIT Bank Tier 1 Leverage Ratio |
| ■ | | Capital metrics also strong relative to industry peers |
| ■ | | Capital is largely comprised of common equity |
Economic Capital
Allocations by Segment(1) |
| Corporate Finance | ~11% |
| Trade Finance | ~ 9% |
| Transportation Finance | ~15% |
| Vendor Finance | ~10% |
| Consumer | ~ 2% |
| Total CIT | ~12% |
(1) Capital expressed as a percentage of lending and leasing assets plus off balance sheet risk-weighted assets and is subject to change
Source: Peer Data Bloomberg
 | Financial Update | 16 |
FrameworkforCapital Actions
Total Risk Based Capital$8.5 Billion

Prospective Capital Actions
Capital Deployment
| • | | Inorganic/organic growth |
Capital Generation
| • | | Increasing economic earnings |
Capital Return
Data as of or for period ended 3/31/12
 | Financial Update | 17 |
Progress Towards Profitability Targets
Significant progress positioning the Company
to achieve profitability targets
Strong balance sheet with solid liquidity,
reserves and capital
Deposit platform well underway
 | Financial Update | 18 |

 | Financial Update | 19 |
CIT Group Inc. and Subsidiaries Non-GAAP Disclosures(1)
($ Millions)
Net Finance Revenue as a % of Average Earning Assets(2)
| | Mar 31, 2012 | | Dec 31, 2011 | | Sep 30, 2011 | | Jun 30, 2011 | | Mar 31, 2011 |
| |
| Net finance revenue | $(366.3) | | (4.43)% | | $96.4 | | 1.14% | | $184.4 | | 2.19% | | $60.2 | | 0.70% | | $188.9 | | 2.14% |
| FSA impact on net finance | | | | | | | | | | | | | | | | | | | |
| revenue | 546.3 | | 6.40% | | 88.2 | | 0.83% | | (56.2) | | (0.82)% | | 25.8 | | 0.18% | | (83.1) | | (1.08)% |
| Secured debt prepayment | | | | | | | | | | | | | | | | | | | |
| penalties | - | | - | | 9.2 | | 0.10% | | 20.0 | | 0.21% | | 50.0 | | 0.52% | | 35.0 | | 0.35% |
| |
| Adjusted net finance revenue | $180.0 | | 1.97% | | $193.8 | | 2.07% | | 148.2 | | 1.58% | | $136.0 | | 1.40% | | $140.8 | | 1.41% |
| |
| |
| | Dec 31, 2010 | | Sep 30, 2010 | | Jun 30, 2010 | | Mar 31, 2010 | | | | |
| |
| Net finance revenue | $285.8 | | 3.08% | | $345.2 | | 3.49% | | $457.8 | | 4.34% | | $527.2 | | 4.68% | | | | |
| FSA impact on net finance | | | | | | | | | | | | | | | | | | | |
| revenue | (273.1) | | (2.96)% | | (264.4) | | (2.78)% | | (411.4) | | (3.96)% | | (447.6) | | (4.07)% | | | | |
| Secured debt prepayment | | | | | | | | | | | | | | | | | | | |
| penalties | 48.9 | | 0.46% | | 29.0 | | 0.25% | | 45.0 | | 0.36% | | 15.0 | | 0.11% | | | | |
| |
| Adjusted net finance revenue | $61.6 | | 0.58% | | $109.8 | | 0.96% | | $91.4 | | 0.74% | | $94.6 | | 0.72% | | | | |
| (1) | | Non-GAAP financial measures disclosed by management are meant to provide additional information and insight relative to trends in the business to investors and, in certain cases, to present financial information as measured by rating agencies and other users of financial information. These measures are not in accordance with, or a substitute for, GAAP and may be different from, or inconsistent with, non-GAAP financial measures used by other companies. |
| (2) | | NFR excluding FSA and debt prepay costs is used in the analysis of operating margin. |
 | Financial Update | 20 |

Wrap-up
Nelson Chai

Objectivesfor Today
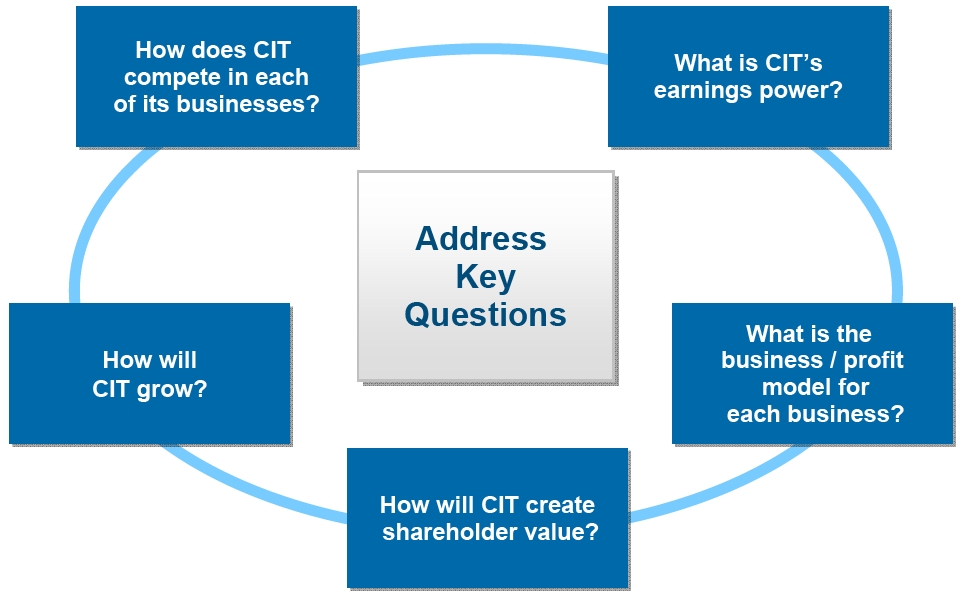
 | Wrap-Up | 2 |
Where We Are…
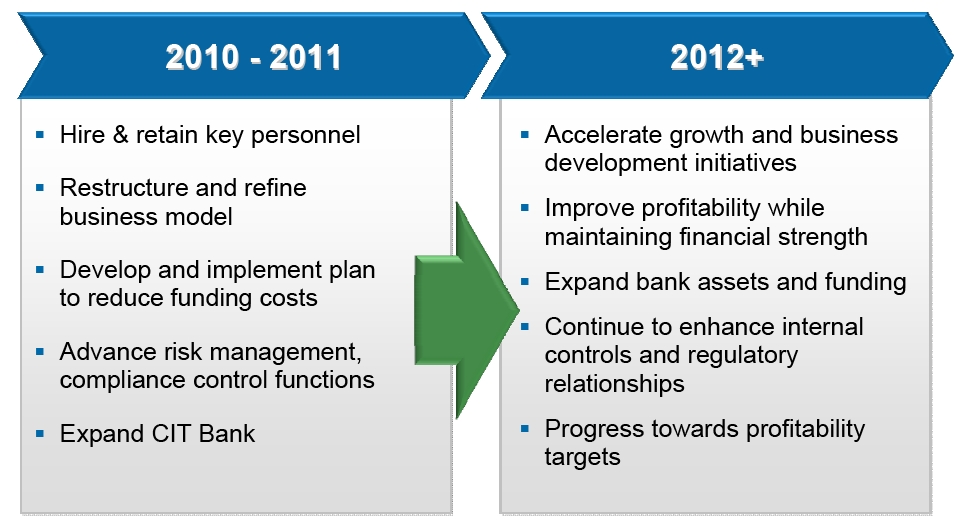
GoodProgress... Lots more to do
 | Wrap-Up | 3 |
Transportation Finance:CapitalforCompanieson the Move

| ■ | | Seasoned management team |
| ■ | | Strong customer, manufacturer and industry relationships |
| ■ | | Quality fleets and diverse client base |
| ■ | | Proven track record through multiple market cycles |
 | Wrap-Up | 4 |
Vendor Finance:A GlobalLeader PositionedforGrowth
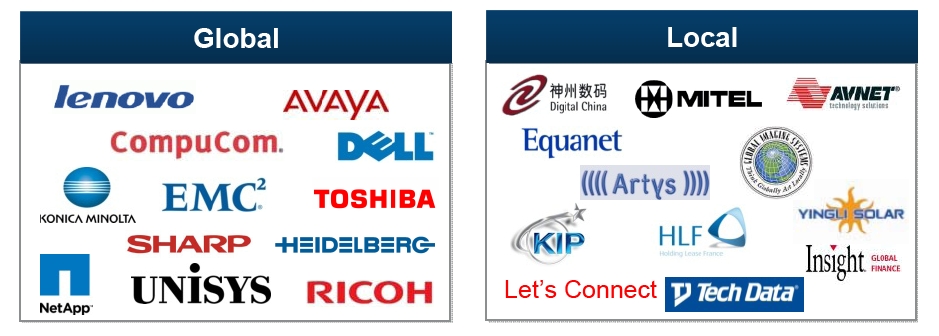
| ■ | | Long standing relationships |
| ■ | | Extensive expertise with ability to provide standard or customized products |
 | Wrap-Up | 5 |
TradeFinance:TheNation’s LeaderinFactoring

| ■ | | Deep relationships and strong brand recognition |
| ■ | | Extensive industry and underwriting expertise |
| ■ | | Experienced management team |
 | Wrap-Up | 6 |
Corporate Finance:The Right Focus forGrowth

 | Wrap-Up | 7 |
OurDifferentiatedStory
| ■ | | Originate high yielding assets |
| ■ | | Strong balance sheet with solid liquidity, reserves and capital |
WellPositionedin theCurrent Environment
 | Wrap-Up | 8 |
We Are WellPositioned
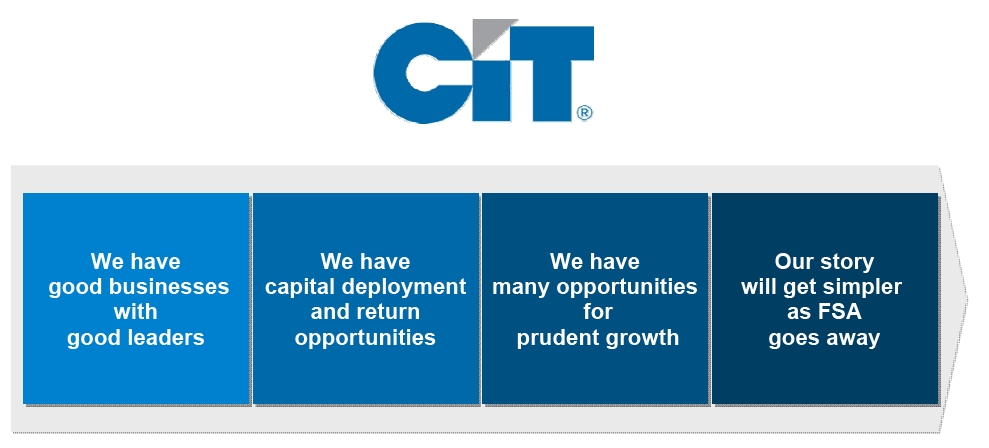
 | Wrap-Up | 9 |

 | Wrap-Up | 10 |


