Exhibit 99.2
![]()
® CIT Fourth Quarter 2013 Financial Results January 28, 2014
Important Notices
This presentation contains forward-looking statements within the meaning of applicable federal securities laws that are based upon our current expectations and assumptions concerning future events, which are subject to a number of risks and uncertainties that could cause actual results to differ materially from those anticipated. The words “expect,” “anticipate,” “estimate,” “forecast,” “initiative,” “objective,” “plan,” “goal,” “project,” “outlook,” “priorities,” “target,” “intend,” “evaluate,” “pursue,” “commence,” “seek,” “may,” “would,” “could,” “should,” “believe,” “potential,” “continue,” or the negative of any of those words or similar expressions is intended to identify forward-looking statements. All statements contained in this presentation, other than statements of historical fact, including without limitation, statements about our plans, strategies, prospects and expectations regarding future events and our financial performance, are forward-looking statements that involve certain risks and uncertainties. While these statements represent our current judgment on what the future may hold, and we believe these judgments are reasonable, these statements are not guarantees of any events or financial results, and our actual results may differ materially. Important factors that could cause our actual results to be materially different from our expectations include, among others, the risk that CIT is unsuccessful in implementing its strategy and business plan, the risk that CIT is unable to react to and address key business and regulatory issues, the risk that CIT is unable to achieve the projected revenue growth from its new business initiatives or the projected expense reductions from efficiency improvements, the risk that CIT is delayed in implementing its branch strategy, and the risk that CIT becomes subject to liquidity constraints and higher funding costs. Further, there is a risk that the valuations resulting from our fresh start accounting analysis, which are inherently uncertain, will differ significantly from the actual values realized, due to the complexity of the valuation process, the degree of judgment required, and changes in market conditions and economic environment. We describe these and other risks that could affect our results in Item 1A, “Risk Factors,” of our latest Annual Report on Form 10-K for the year ended December 31, 2012, which was filed with the Securities and Exchange Commission. Accordingly, you should not place undue reliance on the forward-looking statements contained in this presentation. These forward-looking statements speak only as of the date on which the statements were made. CIT undertakes no obligation to update publicly or otherwise revise any forward-looking statements, except where expressly required by law.
This presentation is to be used solely as part of CIT management's continuing investor communications program. This presentation shall not constitute an offer or solicitation in connection with any securities.
1
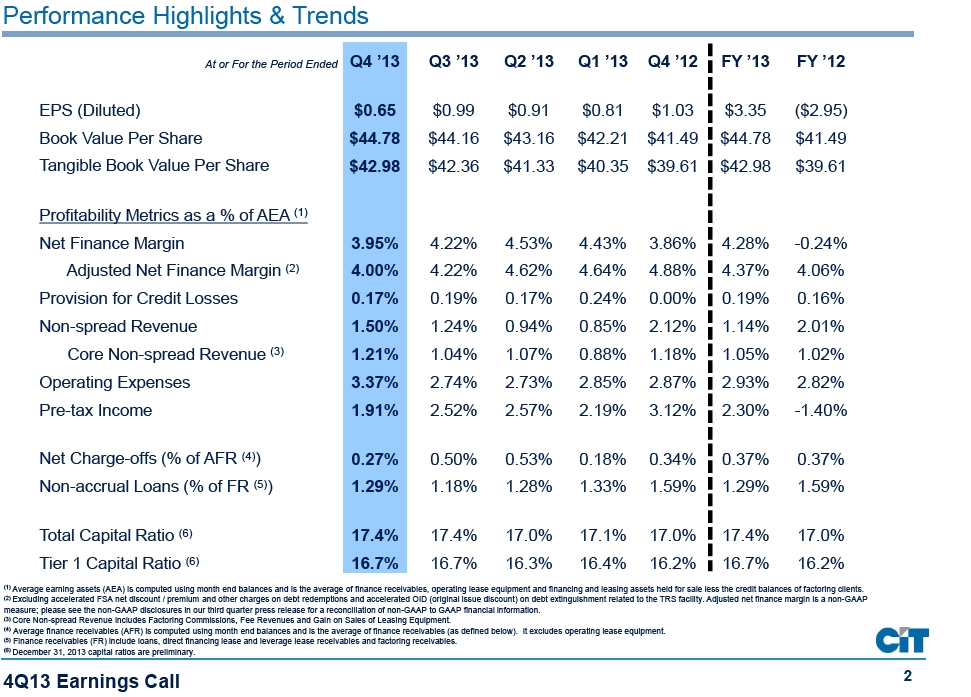
Performance Highlights & Trends
At or For the Period EndedQ4 ’13 Q3 ’13 Q2 ’13 Q1 ’13 Q4 ’12 FY ’13 FY ’12
EPS (Diluted) $0.65 $0.99 $0.91 $0.81 $1.03 $3.35 ($2.95) Book Value Per Share $44.78 $44.16 $43.16 $42.21 $41.49 $44.78 $41.49 Tangible Book Value Per Share $42.98 $42.36 $41.33 $40.35 $39.61 $42.98 $39.61
Profitability Metrics as a % of AEA(1)
Net Finance Margin 3.95% 4.22% 4.53% 4.43% 3.86% 4.28% -0.24% Adjusted Net Finance Margin(2)4.00% 4.22% 4.62% 4.64% 4.88% 4.37% 4.06% Provision for Credit Losses 0.17% 0.19% 0.17% 0.24% 0.00% 0.19% 0.16% Non-spread Revenue 1.50% 1.24% 0.94% 0.85% 2.12% 1.14% 2.01% Core Non-spread Revenue(3)1.21% 1.04% 1.07% 0.88% 1.18% 1.05% 1.02% Operating Expenses 3.37% 2.74% 2.73% 2.85% 2.87% 2.93% 2.82% Pre-tax Income 1.91% 2.52% 2.57% 2.19% 3.12% 2.30% -1.40%
Net Charge-offs (% of AFR(4)) 0.27% 0.50% 0.53% 0.18% 0.34% 0.37% 0.37% Non-accrual Loans (% of FR(5)) 1.29% 1.18% 1.28% 1.33% 1.59% 1.29% 1.59%
Total Capital Ratio(6)17.4% 17.4% 17.0% 17.1% 17.0% 17.4% 17.0% Tier 1 Capital Ratio(6)16.7% 16.7% 16.3% 16.4% 16.2% 16.7% 16.2%
(1)Average earning assets (AEA) is computed using month end balances and is the average of finance receivables, operating lease equipment and financing and leasing assets held for sale less the credit balances of factoring clients.(2)Excluding accelerated FSA net discount / premium and other charges on debt redemptions and accelerated OID (original issue discount) on debt extinguishment related to the TRS facility. Adjusted net finance margin is a non-GAAP measure; please see the non-GAAP disclosures in our third quarter press release for a reconciliation of non-GAAP to GAAP financial information.
(3)Core Non-spread Revenue includes Factoring Commissions, Fee Revenues and Gain on Sales of Leasing Equipment.
(4)Average finance receivables (AFR) is computed using month end balances and is the average of finance receivables (as defined below). It excludes operating lease equipment.(5)Finance receivables (FR) include loans, direct financing lease and leverage lease receivables and factoring receivables.
(6)December 31, 2013 capital ratios are preliminary.
4Q13 Earnings Call 2
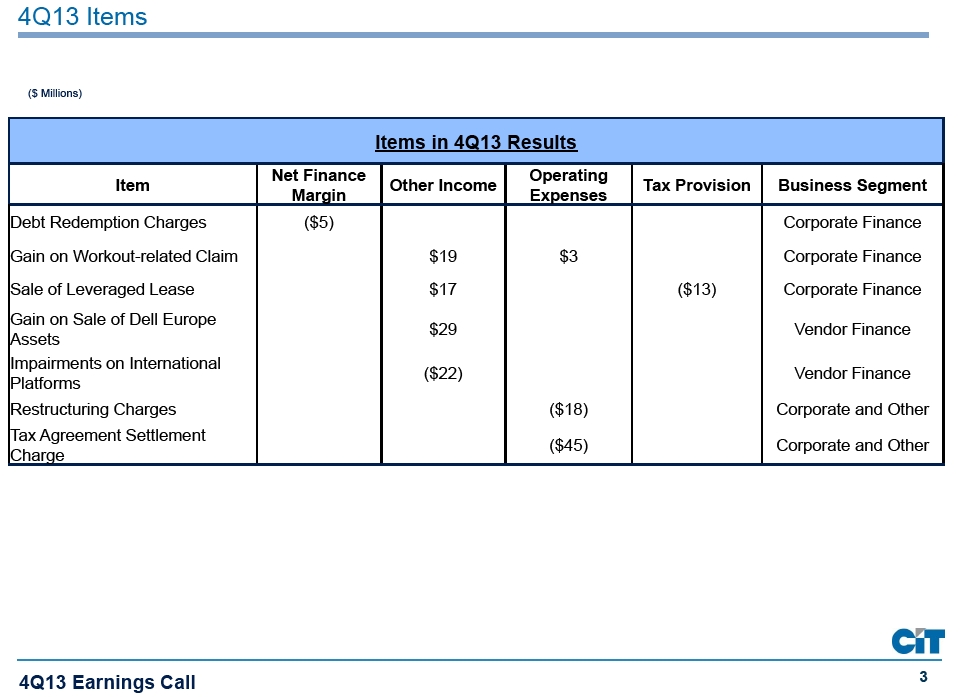
4Q13 Items
($ Millions)
Items in 4Q13 Results
Net Finance Operating
Item Other Income Tax Provision Business Segment Margin Expenses
Debt Redemption Charges ($5) Corporate Finance Gain on Workout-related Claim $19 $3 Corporate Finance Sale of Leveraged Lease $17 ($13) Corporate Finance Gain on Sale of Dell Europe $29 Vendor Finance Assets Impairments on International ($22) Vendor Finance Platforms Restructuring Charges ($18) Corporate and Other Tax Agreement Settlement ($45) Corporate and Other Charge
4Q13 Earnings Call 3
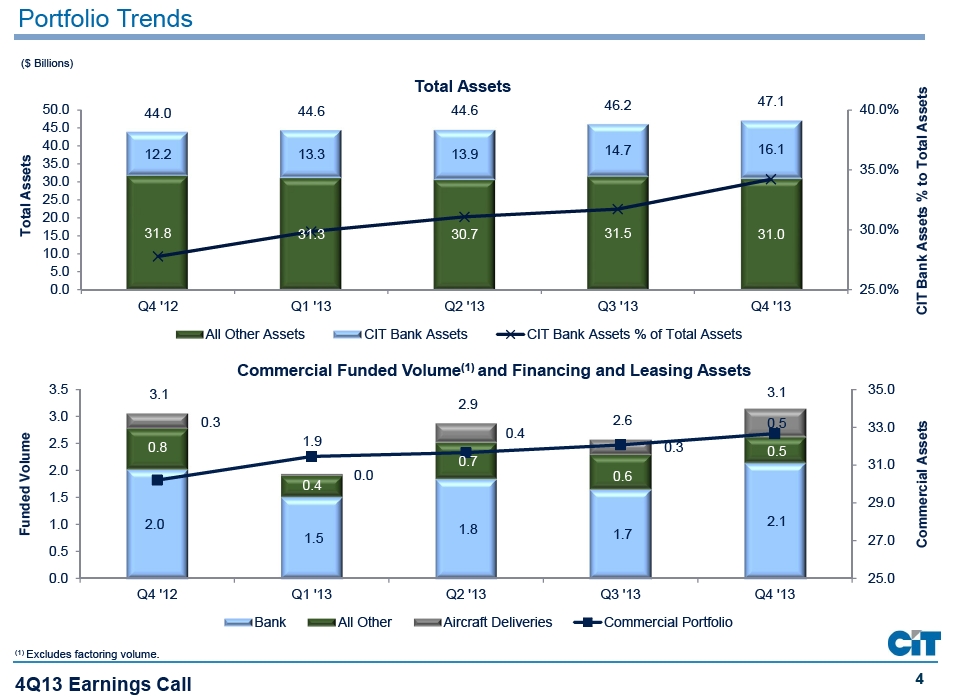
Portfolio Trends
($ Billions)
Total Assets
47.1 Assets
50.0 44.6 44.6 46.2 40.0% 44.0 45.0 40.0 14.7 16.1 12.2 13.3 13.9
Assets 35.0 35.0% Total
30.0 to 25.0 %
20.0 Assets Total 15.0 31.8 31.3 30.7 31.5 31.0 30.0% 10.0 5.0 Bank
0.0 25.0% Q4 '12 Q1 '13 Q2 '13 Q3 '13 Q4 '13 CIT
All Other Assets CIT Bank Assets CIT Bank Assets % of Total Assets
Commercial Funded Volume(1)and Financing and Leasing Assets
3.5 3.1 3.1 35.0 2.9 3.0 2.6 0.3 0.5 33.0 Assets 0.4
Volume 2.5 1.9
0.8 0.3 0.5
0.7 31.0 2.0 0.0 0.6 Commercial
0.4
Funded 1.5
29.0 1.0 2.0 2.1 1.8 1.7 1.5 27.0 0.5 0.0 25.0 Q4 '12 Q1 '13 Q2 '13 Q3 '13 Q4 '13 Bank All Other Aircraft Deliveries Commercial Portfolio
(1)Excludes factoring volume.
4Q13 Earnings Call 4

Asset Quality
($ Millions)
Non-accrual Loans & Net Charge-offs
350 332 1.5% 294
Loans 300 279 AFR
258 1.2% 241 to 250
% accrual 200 0.9% 150 -offs 0.6% Charge
– 100
0.3%
Non 50
0 0.0% Net Q4 '12 Q1 '13 Q2 '13 Q3 '13 Q4 '13 (1)
Non-accrual Loans Net Charge-offs % to AFR
Losses 500 Allowance for Loan Losses
Losses
2.9% 450 379 386 400 367 356 356 2.7% FR
350 Commercial
2.5%
Loan 300 Loan
2.3% for 250 200 2.1% for Allowance Allowance
150
1.9% to 100 1.7% % 50
0 1.5% Q4 '12 Q1 '13 Q2 '13 Q3 '13 Q4 '13
Allowance for Loan Losses Allowance for Loan Losses % to Commercial FR
(1)Q4’13, Q3’13 and Q2’13 include approximately $5 million, $12 million and $20 million, respectively, of charge-offs related to the transfer of loans to held for sale; exclusive of these charge-offs, net charge-offs as a % to AFR would have been 19 bps, 27 bps and 16 bps, respectively.
4Q13 Earnings Call 5
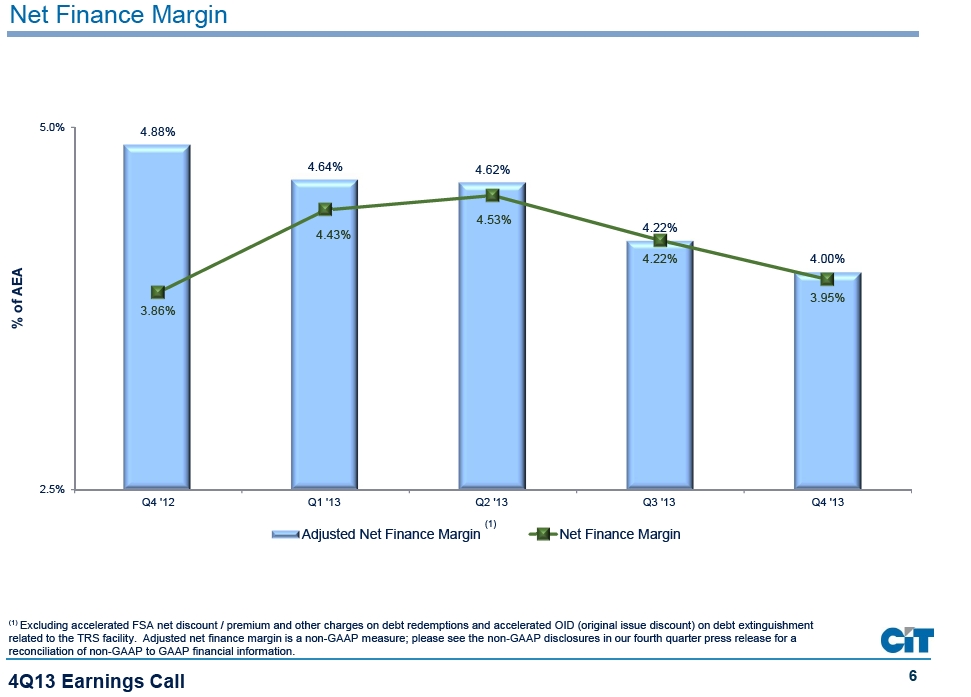
Net Finance Margin
5.0% 4.88%
4.64% 4.62%
4.53%
4.22% 4.43%
4.22% 4.00%
AEA
3.95% of 3.86%
%
2.5%
Q4 '12 Q1 '13 Q2 '13 Q3 '13 Q4 '13 (1)
Adjusted Net Finance Margin Net Finance Margin
(1)Excluding accelerated FSA net discount / premium and other charges on debt redemptions and accelerated OID (original issue discount) on debt extinguishment related to the TRS facility. Adjusted net finance margin is a non-GAAP measure; please see the non-GAAP disclosures in our fourth quarter press release for a reconciliation of non-GAAP to GAAP financial information.
4Q13 Earnings Call 6
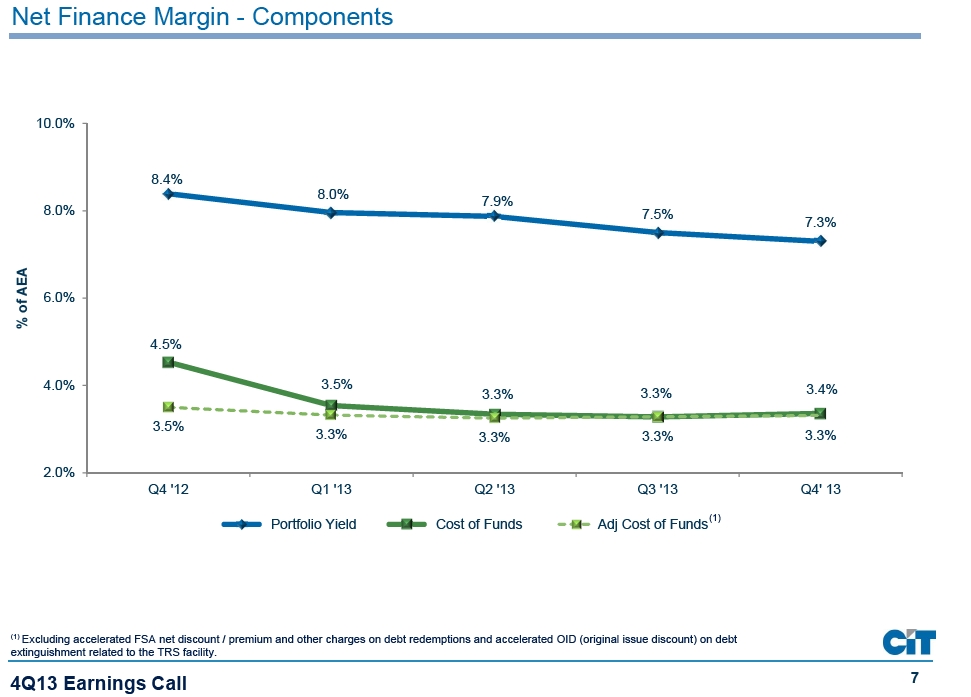
Net Finance Margin - Components
10.0%
8.4%
8.0%
7.9%
8.0% 7.5%
7.3%
AEA
6.0% of %
4.5%
4.0% 3.5% 3.4% 3.3% 3.3%
3.5%
3.3% 3.3% 3.3% 3.3%
2.0%
Q4 '12 Q1 '13 Q2 '13 Q3 '13 Q4' 13
Portfolio Yield Cost of Funds Adj Cost of Funds(1)
(1)Excluding accelerated FSA net discount / premium and other charges on debt redemptions and accelerated OID (original issue discount) on debt extinguishment related to the TRS facility.
4Q13 Earnings Call 7
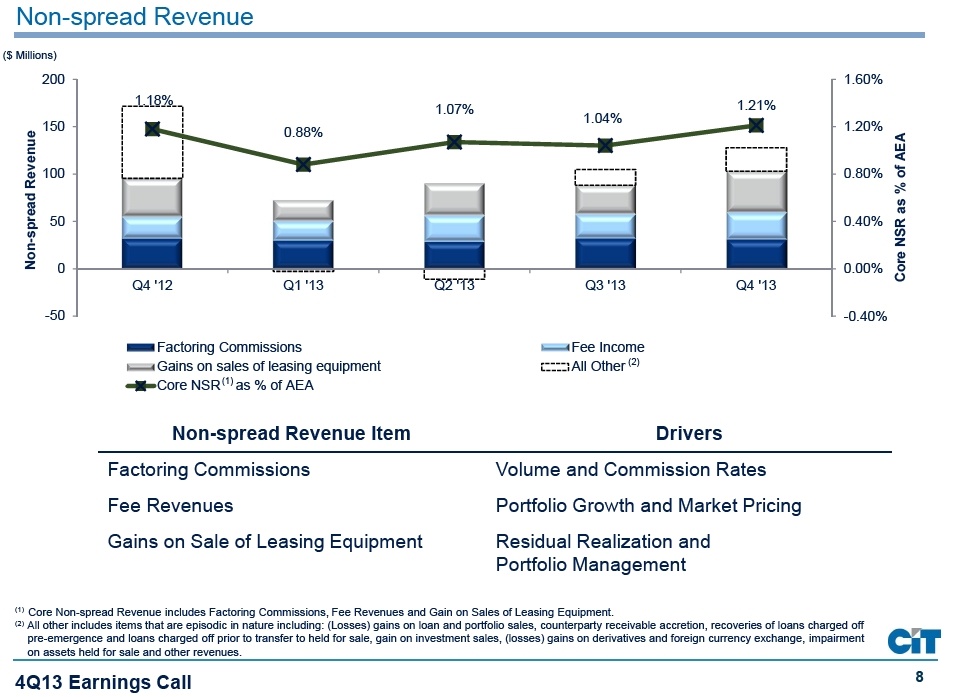
Non-spread Revenue
($ Millions)
200 1.60% 1.18% 1.21% 1.07% 1.04% 150 0.88% 1.20%
Revenue AEA
100 0.80% of % spread as
50 0.40% NSR
Non- 0 0.00% Core
Q4 '12 Q1 '13 Q2 '13 Q3 '13 Q4 '13
-50 -0.40%
Factoring Commissions Fee Income Gains on sales of leasing equipment All Other (2) Core NSR(1) as % of AEA
Non-spread Revenue Item Drivers
Factoring Commissions Volume and Commission Rates Fee Revenues Portfolio Growth and Market Pricing Gains on Sale of Leasing Equipment Residual Realization and Portfolio Management
(1)Core Non-spread Revenue includes Factoring Commissions, Fee Revenues and Gain on Sales of Leasing Equipment.
(2)All other includes items that are episodic in nature including: (Losses) gains on loan and portfolio sales, counterparty receivable accretion, recoveries of loans charged off pre-emergence and loans charged off prior to transfer to held for sale, gain on investment sales, (losses) gains on derivatives and foreign currency exchange, impairment on assets held for sale and other revenues.
4Q13 Earnings Call 8
8
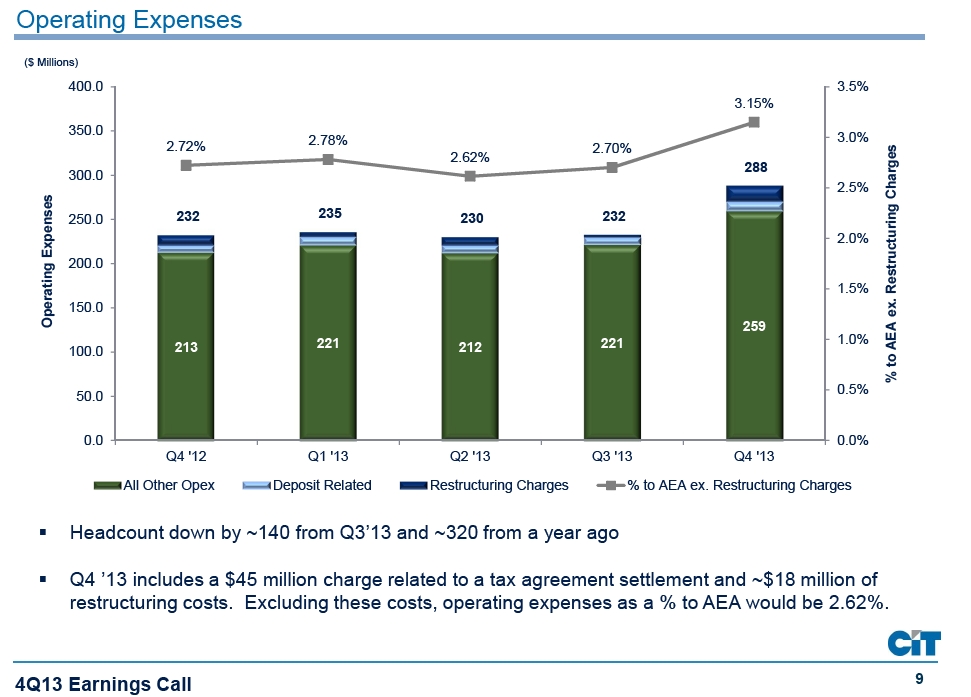
Operating Expenses
($ Millions)
400.0 3.5% 3.15% 350.0 2.78% 3.0% 2.72% 2.70% Charges 2.62%
288
300.0
2.5%
Expenses
232 235 230 232 Restructuring
250.0
2.0% 200.0
Operating
1.5% 150.0 ex.
259
221 221 1.0% AEA 100.0 213 212 to %
0.5% 50.0
0.0 0.0% Q4 '12 Q1 '13 Q2 '13 Q3 '13 Q4 '13
All Other Opex Deposit Related Restructuring Charges % to AEA ex. Restructuring Charges
§ Headcount down by ~140 from Q3’13 and ~320 from a year ago
§ Q4 ’13 includes a $45 million charge related to a tax agreement settlement and ~$18 million of restructuring costs. Excluding these costs, operating expenses as a % to AEA would be 2.62%.
4Q13 Earnings Call 9
9