Exhibit 99.1
![]()
Building Long-Term Value June 25, 2014
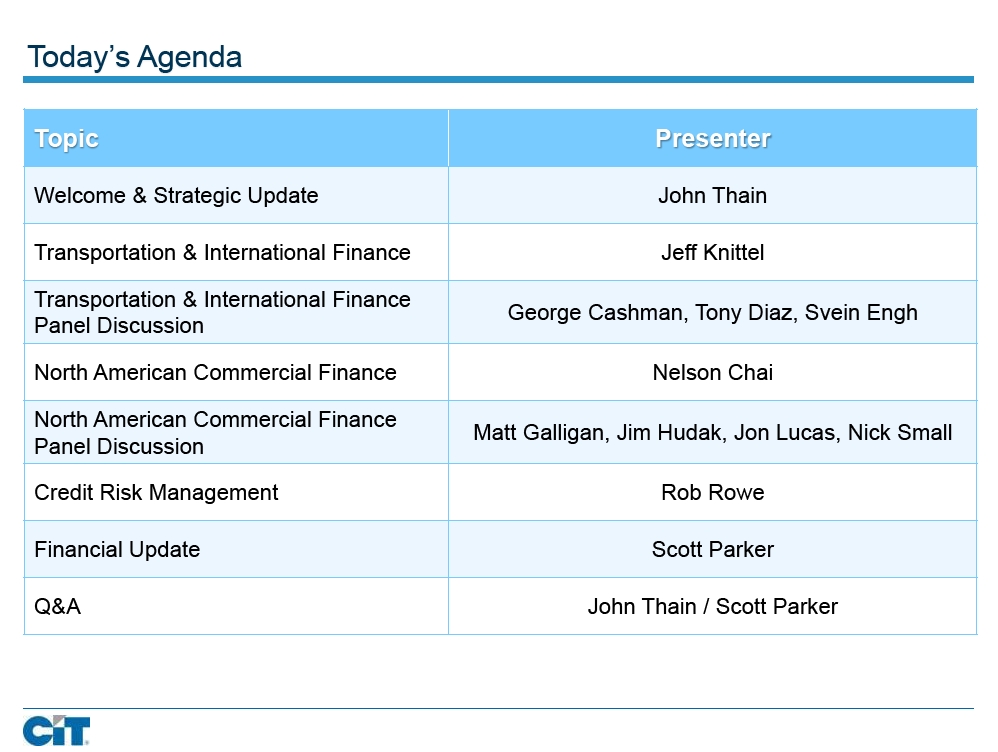
Today’s Agenda Topic Presenter Welcome & Strategic Update John Thain Transportation & International Finance Jeff Knittel Transportation & International Finance George Cashman, Tony Diaz, Svein Engh Panel Discussion North American Commercial Finance Nelson Chai North American Commercial Finance Matt Galligan, Jim Hudak, Jon Lucas, Nick Small Panel Discussion Credit Risk Management Rob Rowe Financial Update Scott Parker Q&A John Thain / Scott Parker
Disclaimer This presentation contains forward-looking statements within the meaning of applicable federal securities laws that are based upon our current expectations and assumptions concerning future events, which are subject to a number of risks and uncertainties that could cause actual results to differ materially from those anticipated. The words “expect,” “anticipate,” “estimate,” “forecast,” “initiative,” “objective,” “plan,” “goal,” “project,” “outlook,” “priorities,” “target,” “intend,” “evaluate,” “pursue,” “commence,” “seek,” “may,” “would,” “could,” “should,” “believe,” “potential,” and “continue,” or the negative of any of those words or similar expressions are intended to identify forward-looking statements. All statements contained in this presentation, other than statements of historical fact, including without limitation, statements about our plans, strategies, prospects and expectations regarding future events and our financial performance, are forward-looking statements that involve certain risks and uncertainties. While these statements represent our current judgment on what the future may hold, and we believe these judgments are reasonable, these statements are not guarantees of any events or financial results, and our actual results may differ materially. Important factors that could cause our actual results to be materially different from our expectations include, among others, the risk that CIT is unsuccessful in implementing its strategy and business plan, the risk that CIT is unable to react to and address key business and regulatory issues, the risk that CIT is unable to achieve the projected revenue growth from its new business initiatives or the projected expense reductions from efficiency improvements, the risk that CIT is delayed in implementing its branch strategy, and the risk that CIT becomes subject to liquidity constraints and higher funding costs. We describe these and other risks that could affect our results in Item 1A, “Risk Factors,” of our latest Annual Report on Form 10-K for the year ended December 31, 2013, which was filed with the Securities and Exchange Commission. Accordingly, you should not place undue reliance on the forward-looking statements contained in this presentation. These forward-looking statements speak only as of the date on which the statements were made. CIT undertakes no obligation to update publicly or otherwise revise any forward-looking statements, except where expressly required by law. This presentation is to be used solely as part of CIT management’s continuing investor communications program. This presentation shall not constitute an offer or solicitation in connection with any securities. Data as of or for the quarter ended March 31, 2014, unless otherwise noted.

Transportation & International Finance C. Jeffrey Knittel President
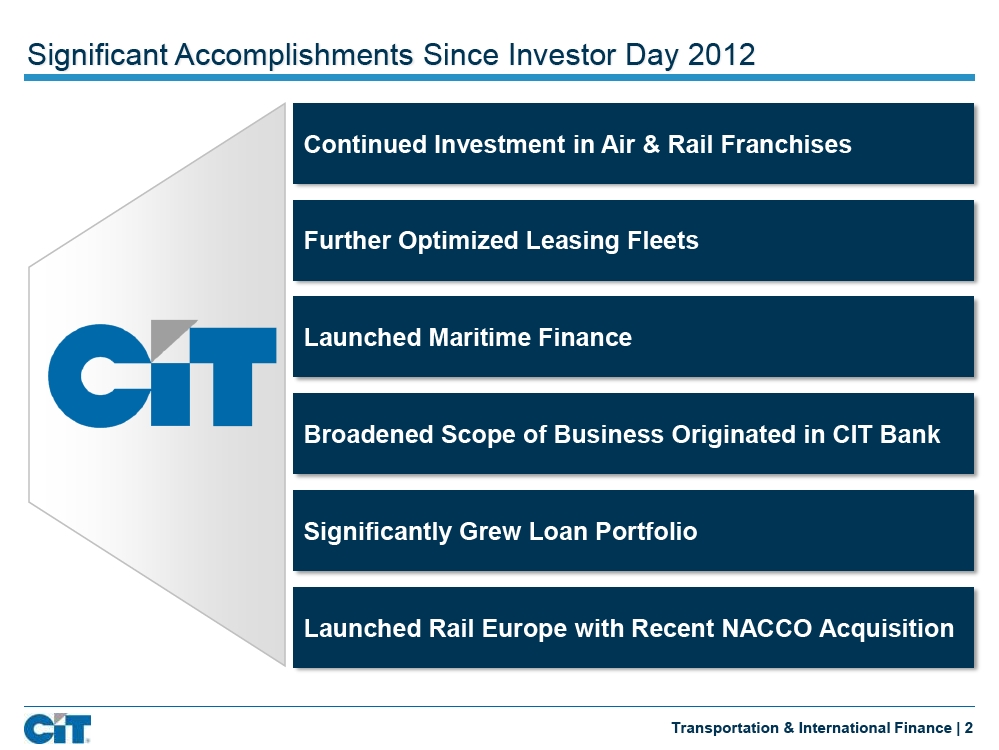
Significant Accomplishments Since Investor Day 2012 Continued Investment in Air & Rail Franchises Further Optimized Leasing Fleets Launched Maritime Finance Broadened Scope of Business Originated in CIT Bank Significantly Grew Loan Portfolio Launched Rail Europe with Recent NACCO Acquisition Transportation & International Finance | 2
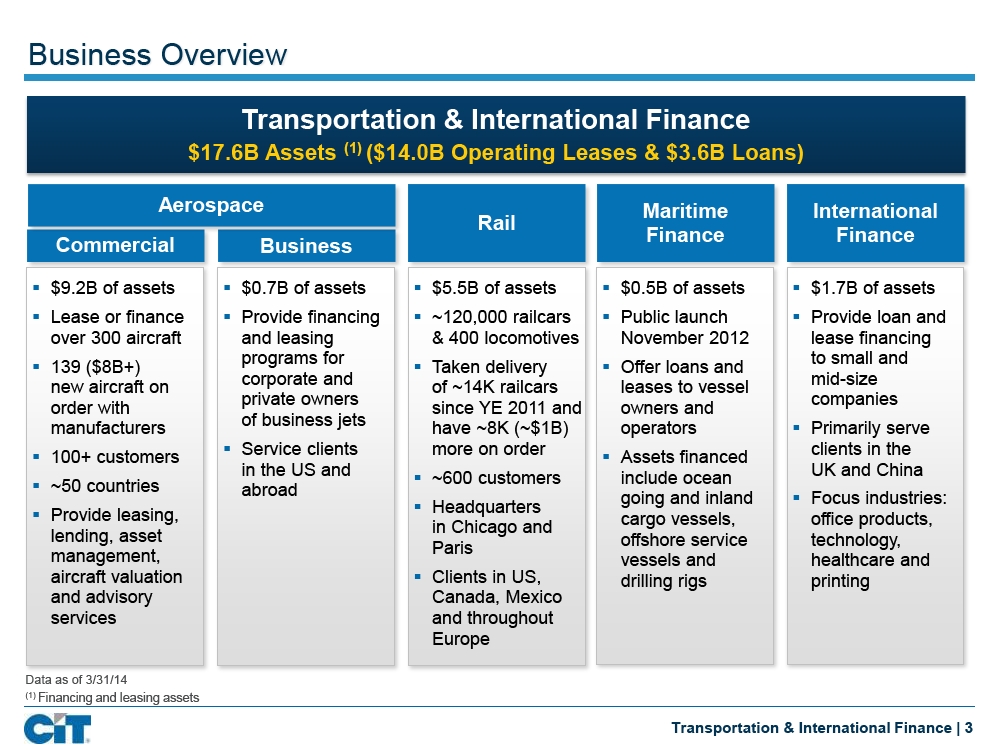
Business Overview Transportation & International Finance $17.6B Assets(1)($14.0B Operating Leases & $3.6B Loans) Aerospace Maritime International Rail Finance Finance Commercial Business § $9.2B of assets§ $0.7B of assets§ $5.5B of assets§ $0.5B of assets§ $1.7B of assets§ Lease or finance§ Provide financing§ ~120,000 railcars§ Public launch§ Provide loan and over 300 aircraft and leasing & 400 locomotives November 2012 lease financing§ programs for§ to small and 139 ($8B+)§ Taken delivery Offer loans and corporate and mid-size new aircraft on of ~14K railcars leases to vessel private owners companies order with since YE 2011 and owners and of business jets manufacturers have ~8K (~$1B) operators§ Primarily serve§ Service clients more on order clients in the§ 100+ customers§ Assets financed in the US and UK and China§ ~600 customers include ocean§ ~50 countries abroad going and inland§ Focus industries:§ Headquarters§ Provide leasing, cargo vessels, office products, in Chicago and lending, asset offshore service technology, Paris management, vessels and healthcare and aircraft valuation§ Clients in US, drilling rigs printing and advisory Canada, Mexico services and throughout Europe Data as of 3/31/14(1)Financing and leasing assets Transportation & International Finance | 3
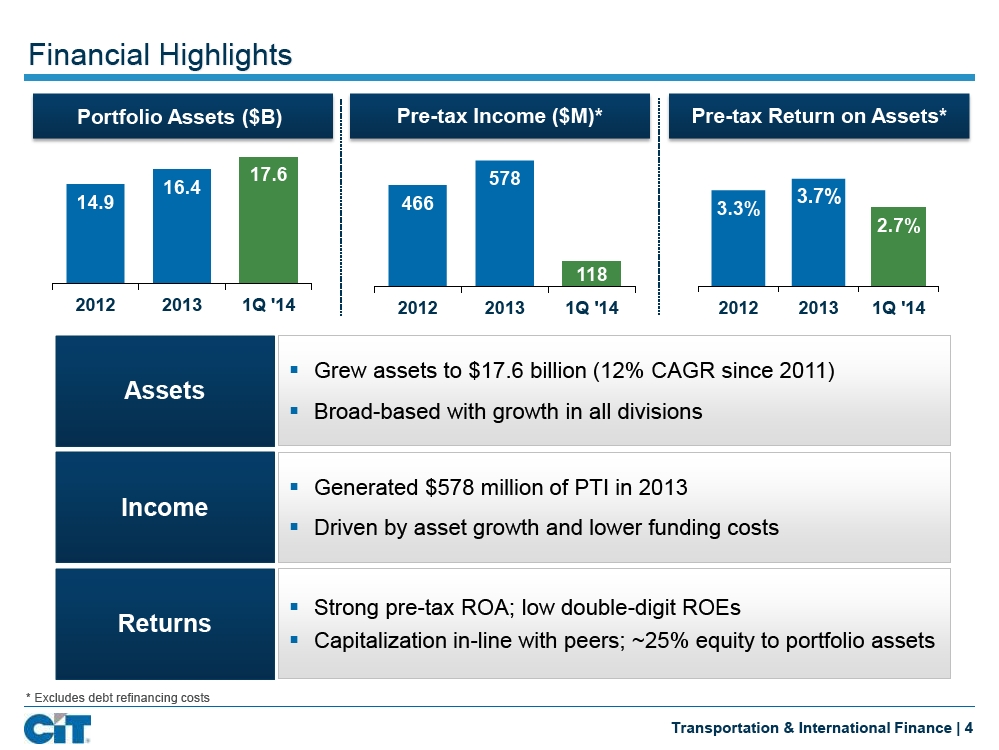
Financial Highlights Portfolio Assets ($B) Pre-tax Income ($M)* Pre-tax Return on Assets* 17.6 578 16.4 14.9 466 3.7% 3.3% 2.7% 118 2012 2013 1Q '14 2012 2013 1Q '14 2012 2013 1Q '14 § Grew assets to $17.6 billion (12% CAGR since 2011) Assets § Broad-based with growth in all divisions § Generated $578 million of PTI in 2013 Income § Driven by asset growth and lower funding costs § Strong pre-tax ROA; low double-digit ROEs Returns § Capitalization in-line with peers; ~25% equity to portfolio assets * Excludes debt refinancing costs Transportation & International Finance | 4
Leasing Value Proposition
![]()
High Quality Fleets Commercial Air Rail § Operating lease fleet of 272 aircraft§ Total leased fleet of ~120,000 railcars§ Young, fuel-efficient and technologically • North America ~110,000 railcars & advanced aircraft ~400 locomotives • Weighted average age is ~6 years • Europe ~9,800 railcars • 98% of fleet is in-production§ Balanced distribution of car types§ In-demand aircraft with broad operator • ~75% freight cars appeal • ~25% tank cars • Primarily narrow body (A320s & 737s) § Largely high-capacity, efficient cars • Select intermediate body (A330s) § Young, well-maintained equipment§ Continue to add latest technology aircraft • Average age North American fleet ~11 years • NEO, MAX, A350, 787 • Lower operating/maintenance costs Data as of 3/31/14; Air data based on operating lease fleet and net investment. Rail data based on total leased and unit count. Transportation & International Finance | 6
![]()
Strong Order Book Approaching $10B of Transportation Equipment on Order § Ensures access to current and in-demand equipment/technologies Order Book § Provides predictable growth Is a § Strengthens relationship with manufacturers and clients Key Value Driver § Supply chain is a valuable information source in risk management Commercial Air (139 Aircraft) Rail (~8,000 Cars) Aircraft Orders by Year ($B) Aircraft Orders by Model Railcar Orders by Year ($B) 2.0 1.9 A320/A321 (NEO) 0.5 0.5 A321 3 50 A330 1.6 8 A320 1 787 10 A350 1.0 15 0.9 737 (MAX) 0.5 0.5 30 737 (NG) E190 17 5 2014 2015 2014 2015 2016 2017 2018 2019 2020 $1-2B of Aircraft per Year Predominantly New Technology Valuable Delivery Slots Data as of 3/31/14, order amounts exclude deposits and sale-leasebacks Transportation & International Finance | 7
![]()
Broad & Diverse Customer Base Commercial Air § Over 100 lending and leasing clients § Broad distribution, clients in ~50 countries 27% 17% § Cover full spectrum of air carriers 7% 38%§ Far East / Asia driving growth 11% Rail § Over 600 clients (~500 in North America Energy Transportation and ~140 in Europe) Chemicals (non-petrochemical) Agriculture, Food and Ethanol § ~2/3 shippers & 1/3 railroads in N.A. Construction & Building Products Petrochemicals § Strong credit profile Lumber & Paper Products Steel and Metals § Serve a wide array of industries Services Other Data as of 3/31/14 Graphics based on operating lease fleet net investment, (Rail North America excluding containers) Transportation & International Finance | 8
![]()
Proven Asset Managers Commercial Air Rail 100% 100%100% 98%99%99%98% High 99%100%99% 97% 98%95%94% Utilization Seasoned Rate Team Disciplined Underwriting 149% Strong Proactive 128% Residual 116% Management Realization 106% 108% 103% Technical 2011 2012 2013 2011 2012 2013 Expertise # of Aircraft # of Rail Cars (in '000) Economically Balanced 44 19 19 Driven 33 31 16 16 Expiration 30 27 14 Schedule 2014 2015 2016 2017 2018 2014 2015 2016 2017 2018 Started 2014 with 48 expirations Data as of 3/31/14; Residual Calculation: (Gain–LOCOM+Suspended Depreciation)/Net Investment; Rail data excludes Europe. Expiration schedules exclude MOUs. Transportation & International Finance | 9
![]()
Growing Beyond Core Leasing
![]()
Increasing Growth and Profitability in CIT Bank § Over $3 billion of Transportation Transportation Assets in CIT Bank ($B) assets in CIT Bank Rail 3.0§ Maritime 2.6 All Transportation divisions doing Commercial Air business in CIT Bank Business Air 1.4 § Significantly improves finance margin § Continuing to diversify product 0.3 capabilities within CIT Bank; booked first aircraft operating leases 2011 2012 2013 1Q '14 in 1Q 2014 Transportation Product Mix in Bank § Current bank product mix: Air Rail Maritime Loans Operating Loans* 55% Leases üüü 45% Operating Leasesüü Data as of 3/31/14 * Loans include finance leases Transportation & International Finance | 11
![]()
Diversifying Products: Building a Quality Loan Portfolio Loan Portfolio by Business § Lending capability is a key differentiator International 47% § Loan portfolio has grown to ~$3.5B; Rail ~40% CAGR 2010-2013 3% Business Maritime Air Comm'l 15% 19% Air § CIT Bank originating substantially all 16% Transportation loans § “Loans” include senior debt & finance leases Loan Portfolio Statistics § Attractive risk/return profile: Transportation International • Solid yields • Well-secured; amortizing investments $ $1.8B $1.7B • Less capital intensive Term ~5.5 years ~3.5 years Fix / Var ~60% / 40% ~70% / 30% § Expect double-digit growth rate Yield ~7.5% / L+4.5% ~10% / L+5% Data as of 3/31/14 Transportation & International Finance | 12
![]()
Pursuing Adjacencies: Business Air Overview Growth Trend § Product Offering • Secured loans & structured leases 1Q ’13 1Q ’14 • Pre-delivery financing § Client Profile Assets(1)$0.6B $0.7B • High net worth individuals & corporate end-users Employees 10 14 § Global Emphasis • Business spans US, Asia, Latin America and Europe • Majority of current opportunities are international Volume Statistics Focus 2012 2013 § Expand international presence $ $0.2B $0.4B§ Advance manufacturer partnerships Term ~4 years ~5 years§ Expand CIT Bank capabilities Fix / Var ~70% / 30% ~60% / 40%§ Proactively manage risk LTV ~70% ~70% Data as of 3/31/14(1)Financing and leasing assets Transportation & International Finance | 13
![]()
Pursuing Adjacencies: Maritime Finance Overview Growth Trend § Attractive Opportunity • Depressed asset values 1Q ’13 1Q ’14 • Traditional lenders remain sidelined§ Industry Expertise Assets(1)$0.3B $0.5B § Product Offering • Senior secured term loans & finance leases Employees 3 10 • Evaluating operating leasing § Marketing Channels • Direct relationships & private equity sponsors Volume Statistics Focus § Quality owners, operators and vessels 2012 2013 § Diversify portfolio across sectors and geographies $ N/A $0.4B § Establish international presence Term N/A ~7 years Fix / Var N/A ~5% / 95%§ Proactively manage client, asset and sector exposures LTV N/A ~60% Data as of 3/31/14(1)Financing and leasing assets Transportation & International Finance | 14
![]()
Expanding Geographies: European Rail Background Portfolio by Car Type § European rail market continues to develop and has become more attractive Tank Cars § CIT has evaluated several international platforms over the 51% past few years building local relationships and expertise Pressure § NACCO was an opportunity to acquire an existing platform Discharge Hopper with a diverse and attractive fleet and a highly experienced 3% Gondola 17% 12% Flat Cars management team 17% NACCO Overview § Established in 1972 § Grew to become the 5th largest lessor of freight wagons in Europe with approximately 9,800 wagons§ Headquartered in Paris with sales offices in Germany and United Kingdom§ ~140 customers across western, central and eastern Europe; Germany & France top sales list§ Quality management team and origination platform; employment contracts for key employees Data as of 3/31/14 Portfolio unit count op lease only, owned and managed. Transportation & International Finance | 15
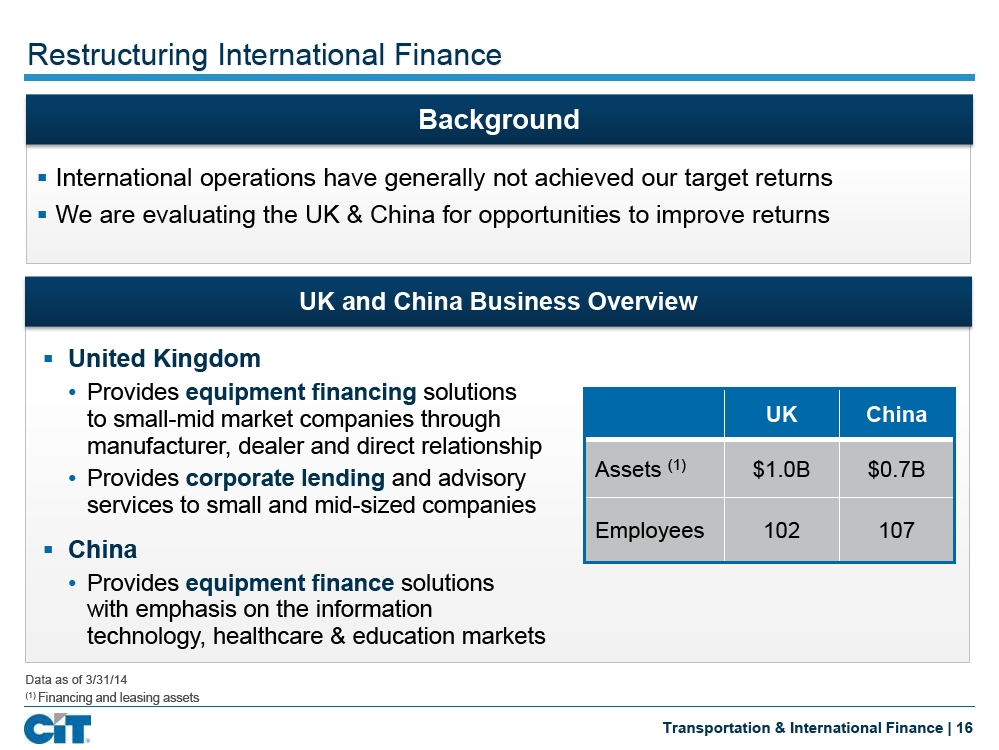
Restructuring International Finance Background § International operations have generally not achieved our target returns§ We are evaluating the UK & China for opportunities to improve returns UK and China Business Overview § United Kingdom • Provides equipment financing solutions to small-mid market companies through UK China manufacturer, dealer and direct relationship • Provides corporate lending and advisory Assets(1)$1.0B $0.7B services to small and mid-sized companies Employees 102 107 § China • Provides equipment finance solutions with emphasis on the information technology, healthcare & education markets Data as of 3/31/14(1)Financing and leasing assets Transportation & International Finance | 16
![]()
A Premium Franchise § Fleets: Market values in excess of carrying values Earning § Leases: Gross rental yields (~13% Air & ~15% Rail) Assets § Loans: Quality borrowers & attractive yields (average ~8%) § Air: Holding valuable delivery slots for new technology Strategic § Rail: Secured limited manufacturing capacity in 2014-2015 Positioning § Maritime: Building a pipeline of committed volume Income§ Track record of delivering earnings growth through cycles &§ Strong ROA businesses with positive operating leverage Returns§ Transportation units all delivering double-digit PT ROEs § Seasoned management with skilled workforce People § Our most valuable asset Data as of 3/31/14 Transportation & International Finance | 17
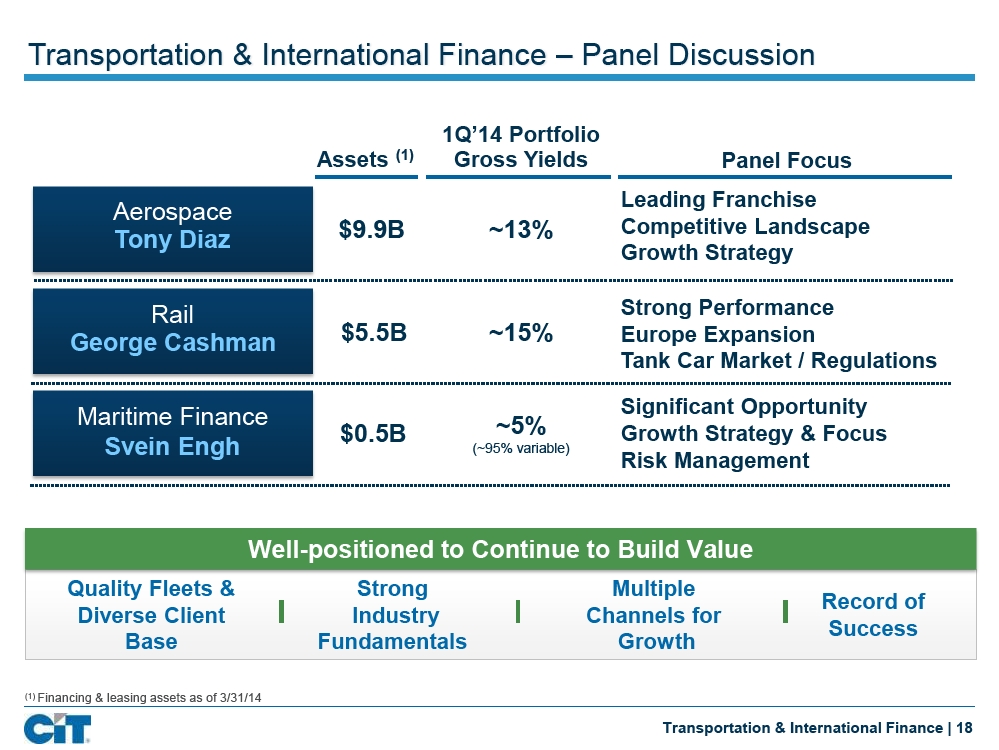
Transportation & International Finance – Panel Discussion 1Q’14 Portfolio Assets(1)Gross Yields Panel Focus Leading Franchise Aerospace $9.9B ~13% Competitive Landscape Tony Diaz Growth Strategy Rail Strong Performance George Cashman $5.5B ~15% Europe Expansion Tank Car Market / Regulations Maritime Finance Significant Opportunity $0.5B ~5% Growth Strategy & Focus Svein Engh (~95% variable) Risk Management Well-positioned to Continue to Build Value Quality Fleets & Strong Multiple Record of Diverse Client Industry Channels for Success Base Fundamentals Growth(1)Financing & leasing assets as of 3/31/14 Transportation & International Finance | 18

North American Commercial Finance Nelson J. Chai President
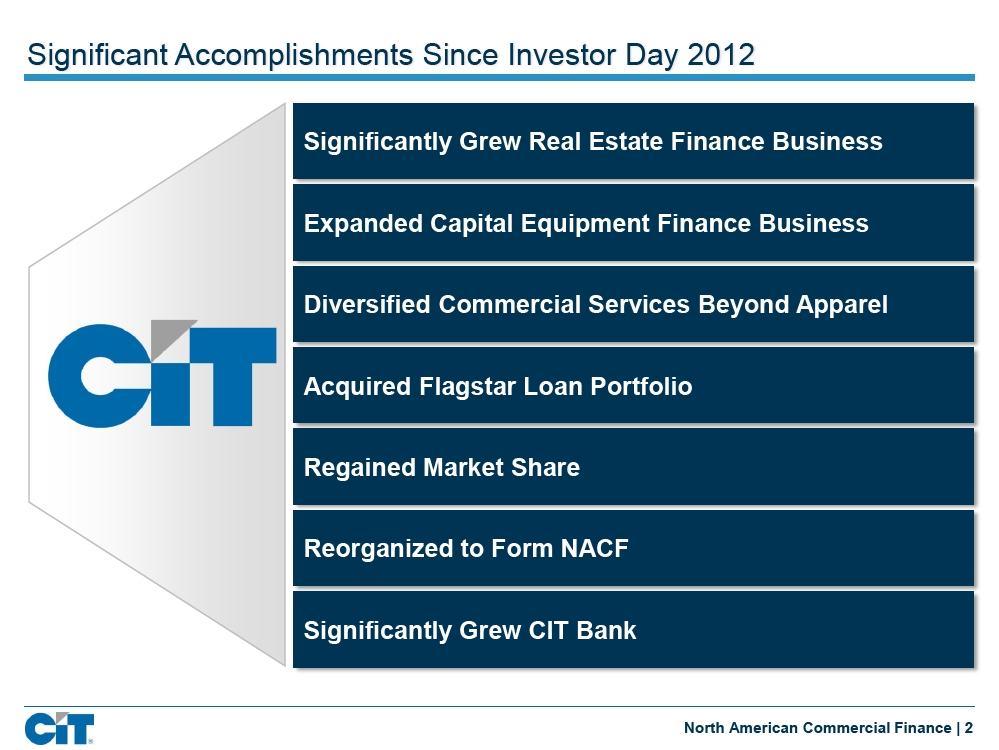
Significant Accomplishments Since Investor Day 2012 Significantly Grew Real Estate Finance Business Expanded Capital Equipment Finance Business Diversified Commercial Services Beyond Apparel Acquired Flagstar Loan Portfolio Regained Market Share Reorganized to Form NACF Significantly Grew CIT Bank North American Commercial Finance | 2
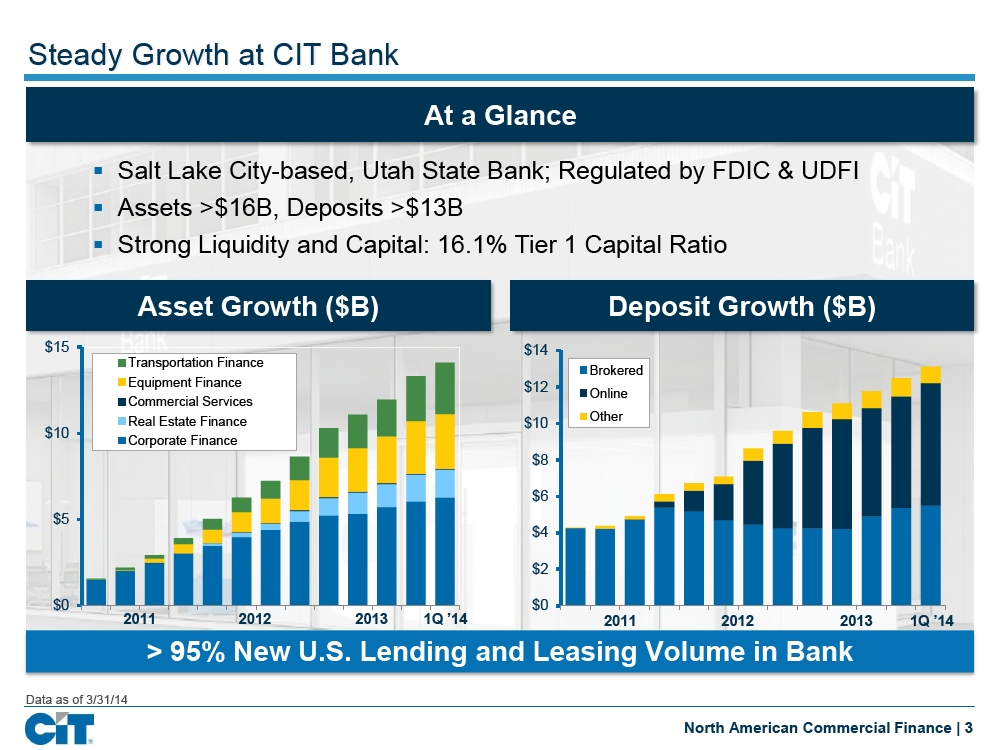
Steady Growth at CIT Bank At a Glance § Salt Lake City-based, Utah State Bank; Regulated by FDIC & UDFI§ Assets >$16B, Deposits >$13B § Strong Liquidity and Capital: 16.1% Tier 1 Capital Ratio Asset Growth ($B) Deposit Growth ($B) $15 $14 Transportation Finance Brokered Equipment Finance $12 Online Commercial Services Real Estate Finance Other $10 $10 Corporate Finance $8 $6 $5 $4 $2 $0 $0 2011 2012 2013 1Q ’14 2011 2012 2013 1Q ’14 > 95% New U.S. Lending and Leasing Volume in Bank Data as of 3/31/14 North American Commercial Finance | 3
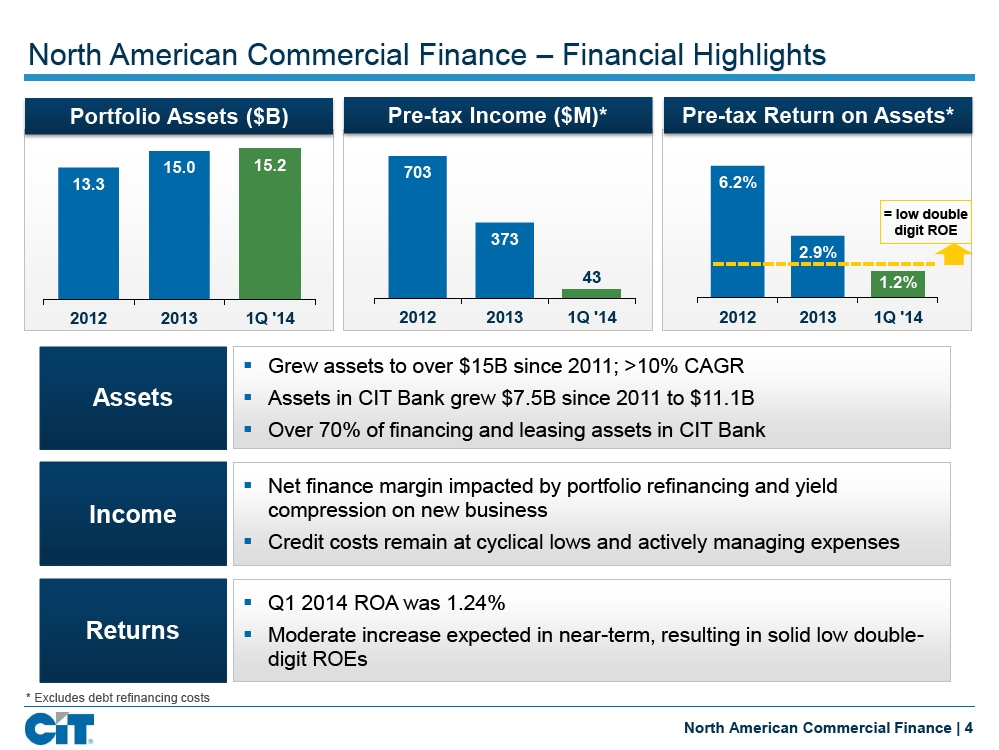
North American Commercial Finance – Financial Highlights Portfolio Assets ($B) Pre-tax Income ($M)* Pre-tax Return on Assets* 15.0 15.2 703 13.3 6.2% = low double digit ROE 373 2.9% 43 1.2% 2012 2013 1Q '14 2012 2013 1Q '14 2012 2013 1Q '14 § Grew assets to over $15B since 2011; >10% CAGR Assets§ Assets in CIT Bank grew $7.5B since 2011 to $11.1B§ Over 70% of financing and leasing assets in CIT Bank § Net finance margin impacted by portfolio refinancing and yield Income compression on new business§ Credit costs remain at cyclical lows and actively managing expenses § Q1 2014 ROA was 1.24% Returns§ Moderate increase expected in near-term, resulting in solid low double-digit ROEs * Excludes debt refinancing costs North American Commercial Finance | 4
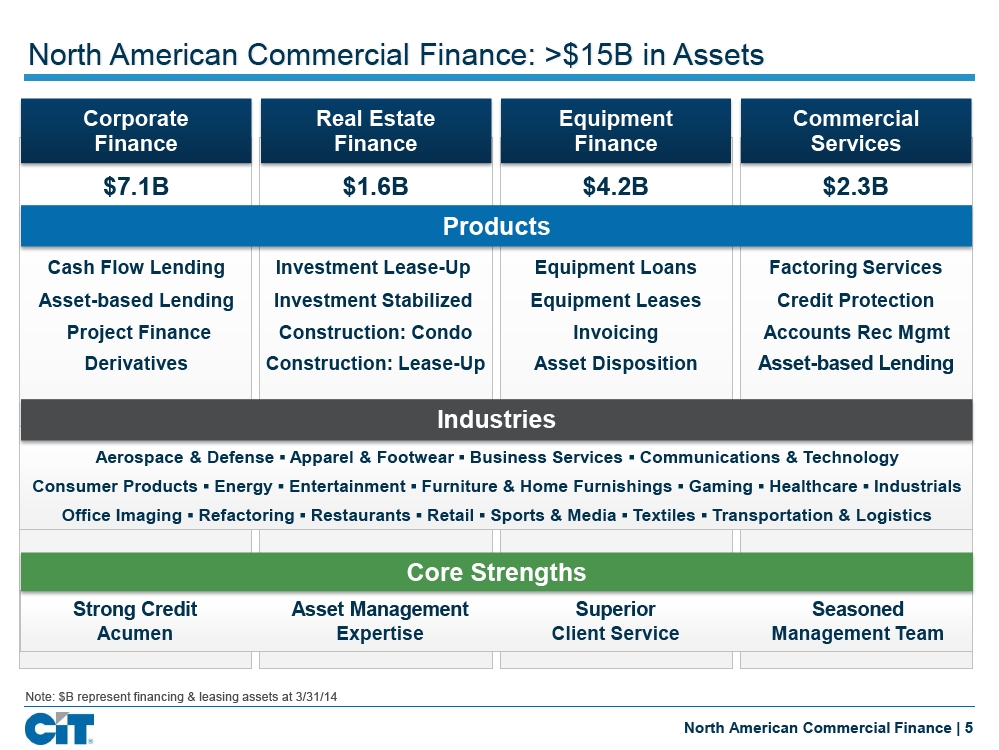
North American Commercial Finance: >$15B in Assets Corporate Real Estate Equipment Commercial Finance Finance Finance Services $7.1B $1.6B $4.2B $2.3B Products Cash Flow Lending Investment Lease-Up Equipment Loans Factoring Services Asset-based Lending Investment Stabilized Equipment Leases Credit Protection Project Finance Construction: Condo Invoicing Accounts Rec Mgmt Derivatives Construction: Lease-Up Asset Disposition Asset-based Lending Industries Aerospace & Defense ª Apparel & Footwear ª Business Services ª Communications & Technology Consumer Products ª Energy ª Entertainment ª Furniture & Home Furnishings ª Gaming ª Healthcare ª Industrials Office Imaging ª Refactoring ª Restaurants ª Retail ª Sports & Media ª Textiles ª Transportation & Logistics Core Strengths Strong Credit Asset Management Superior Seasoned Acumen Expertise Client Service Management Team Note: $B represent financing & leasing assets at 3/31/14 North American Commercial Finance | 5
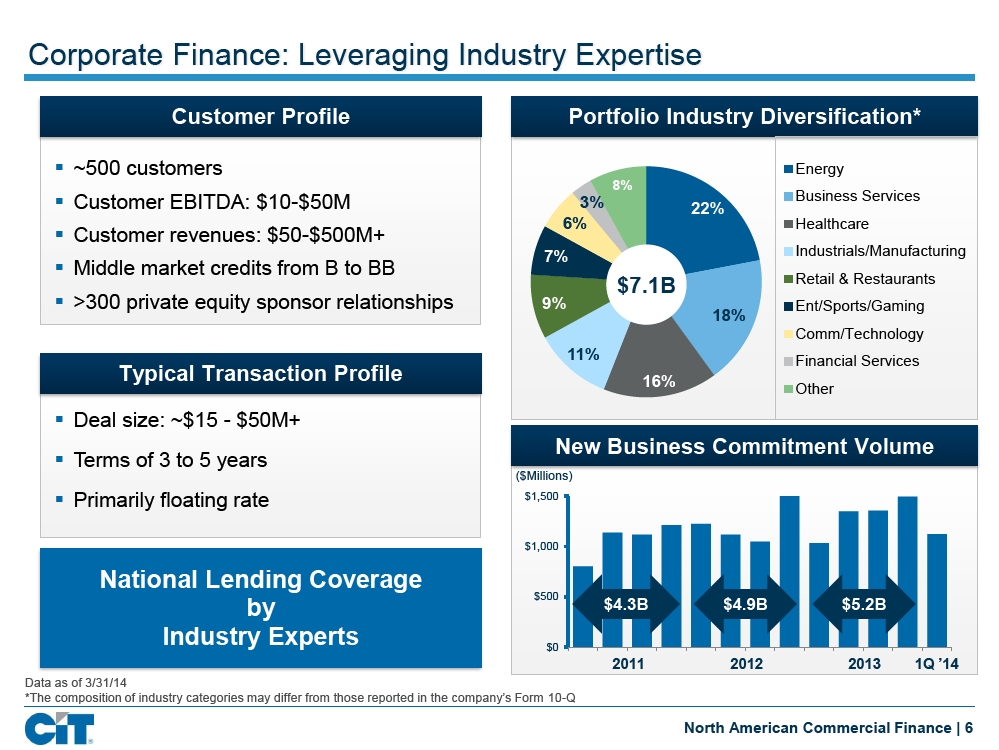
Corporate Finance: Leveraging Industry Expertise Customer Profile Portfolio Industry Diversification* § ~500 customers Energy 8% § Customer EBITDA: $10-$50M 3% Business Services 22% 6% Healthcare § Customer revenues: $50-$500M+ 7% Industrials/Manufacturing § Middle market credits from B to BB $7.1B Retail & Restaurants § >300 private equity sponsor relationships 9% Ent/Sports/Gaming 18% Comm/Technology 11% Financial Services Typical Transaction Profile 16% Other § Deal size: ~$15 - $50M+ New Business Commitment Volume § Terms of 3 to 5 years ($Millions) § Primarily floating rate $1,500 $1,000 National Lending Coverage $500 by $4.3B $4.9B $5.2B Industry Experts $0 2011 2012 2013 1Q ’14 Data as of 3/31/14 *The composition of industry categories may differ from those reported in the company’s Form 10-Q North American Commercial Finance | 6
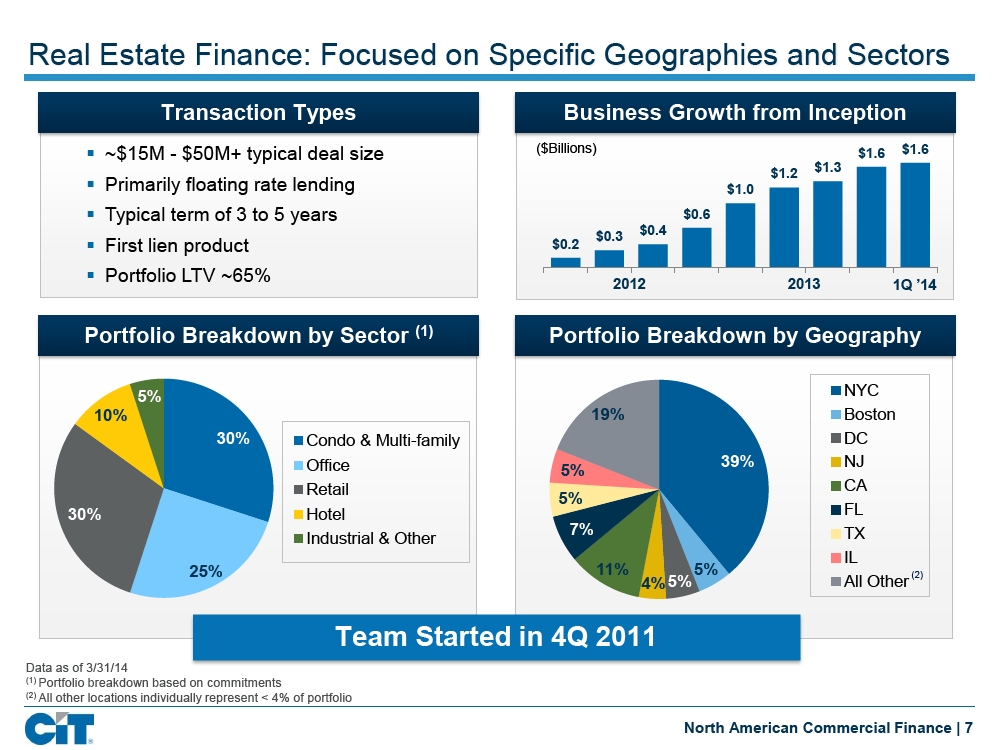
Real Estate Finance: Focused on Specific Geographies and Sectors Transaction Types Business Growth from Inception § ~$15M - $50M+ typical deal size ($Billions) $1.6 $1.6 $1.3 $1.2 § Primarily floating rate lending $1.0§ Typical term of 3 to 5 years $0.6 $0.3 $0.4 § First lien product $0.2 § Portfolio LTV ~65% 2012 2013 1Q ’14 Portfolio Breakdown by Sector(1)Portfolio Breakdown by Geography 5% NYC 10% 19% Boston 30% Condo & Multi-family DC Office 39% NJ 5% Retail CA 5% 30% Hotel FL 7% TX Industrial & Other IL 25% 11% 5% (2) 4% 5% All Other Team Started in 4Q 2011 Data as of 3/31/14(1)Portfolio breakdown based on commitments(2)All other locations individually represent < 4% of portfolio North American Commercial Finance | 7
![]()
Equipment Finance: Customized Financing Solutions Capital Equipment Finance Small Ticket Equipment Finance(1) Small- and Mid-Ticket equipment leasing Large Ticket equipment financing of with tailored programs for manufacturers, assets that are critical to operations distributors and equipment resellers Deal Size: ~$5 - $50M+ Deal Size: ~$5K - $5M+ 3 to 8 year terms 3 to 5 year terms Primarily fixed rate lending & leasing Middle market, small business companies, large corporate credits from B - BB Energy Office Products5%4% 8% Trucking & Logistics 6% 23% Retail - FF&E 11% Technology 8% Manufacturing Automotive Dealers 47% Communications $0.8B 14% $3.4B Healthcare 12% 17% Transportation Construction Communications & Technology 12% Other Other 20% 13% Capital Equipment Finance Business Re-launched in November 2011 Leveraging Strong Brand in Direct & Indirect Market Segments for Continued Growth Note: Data as of 3/31/14(1)Distribution based on equipment type as opposed to data in 10-Q which is provided by obligor/lessee industry North American Commercial Finance | 8
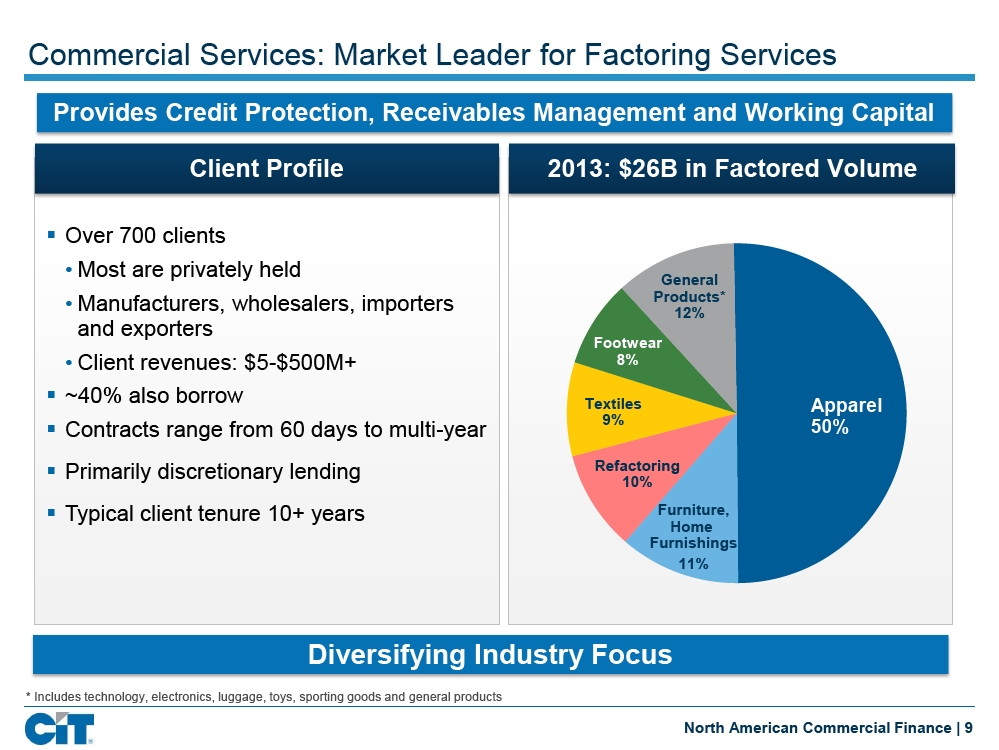
Commercial Services: Market Leader for Factoring Services Provides Credit Protection, Receivables Management and Working Capital Client Profile 2013: $26B in Factored Volume § Over 700 clients • Most are privately held General • Manufacturers, wholesalers, importers Products* 12% and exporters Footwear • Client revenues: $5-$500M+ 8%§ ~40% also borrow Textiles Apparel § Contracts range from 60 days to multi-year 9% 50%§ Primarily discretionary lending Refactoring 10% § Typical client tenure 10+ years Furniture, Home Furnishings 11% Diversifying Industry Focus * Includes technology, electronics, luggage, toys, sporting goods and general products North American Commercial Finance | 9
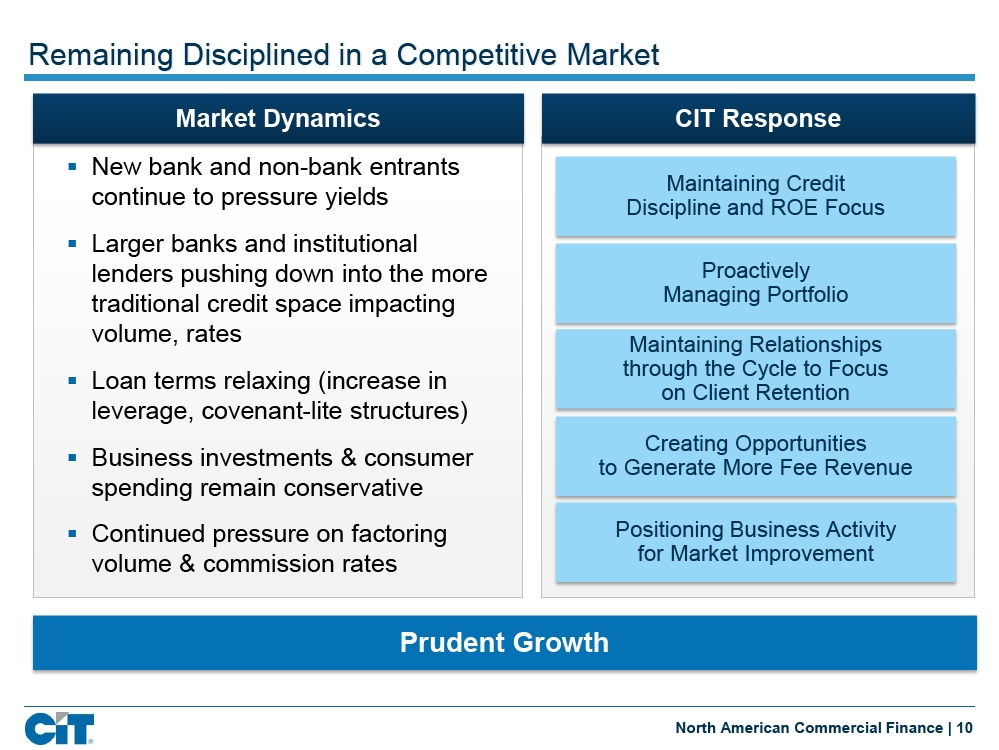
Remaining Disciplined in a Competitive Market Market Dynamics CIT Response § New bank and non-bank entrants Maintaining Credit continue to pressure yields Discipline and ROE Focus § Larger banks and institutional lenders pushing down into the more Proactively traditional credit space impacting Managing Portfolio volume, rates Maintaining Relationships through the Cycle to Focus § Loan terms relaxing (increase in on Client Retention leverage, covenant-lite structures) Creating Opportunities § Business investments & consumer to Generate More Fee Revenue spending remain conservative§ Continued pressure on factoring Positioning Business Activity volume & commission rates for Market Improvement Prudent Growth North American Commercial Finance | 10
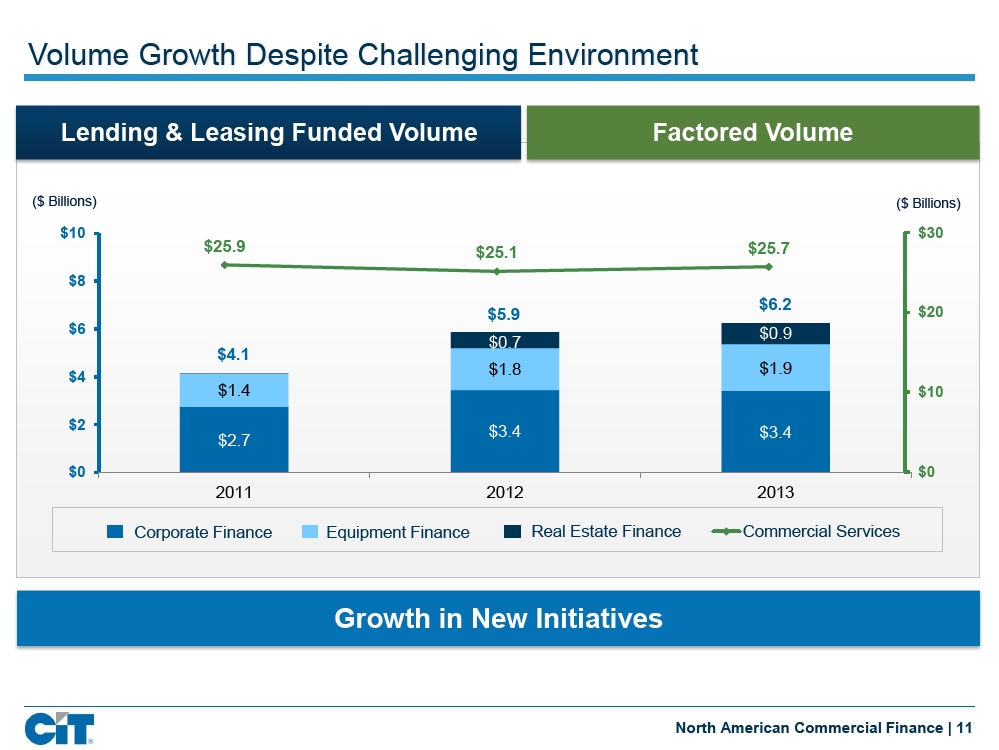
Volume Growth Despite Challenging Environment Lending & Leasing Funded Volume Factored Volume ($ Billions) ($ Billions) $10 $30 $25.9 $25.1 $25.7 $8 $6.2 $5.9 $20 $6 $0.9 $0.7 $4.1 $1.8 $1.9 $4 $1.4 $10 $2 $3.4 $3.4 $2.7 $0 $0 2011 2012 2013 Corporate Finance Equipment Finance Real Estate Finance Commercial Services Growth in New Initiatives North American Commercial Finance | 11
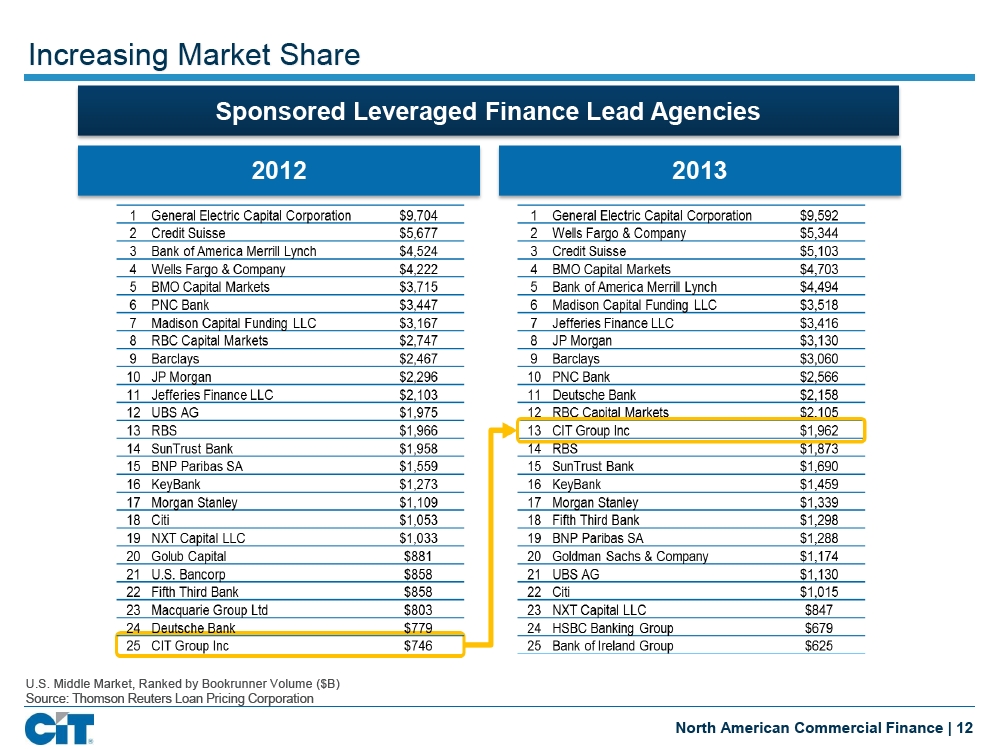
Increasing Market Share Sponsored Leveraged Finance Lead Agencies 2012 2013 U.S. Middle Market, Ranked by Bookrunner Volume ($B) Source: Thomson Reuters Loan Pricing Corporation North American Commercial Finance | 12
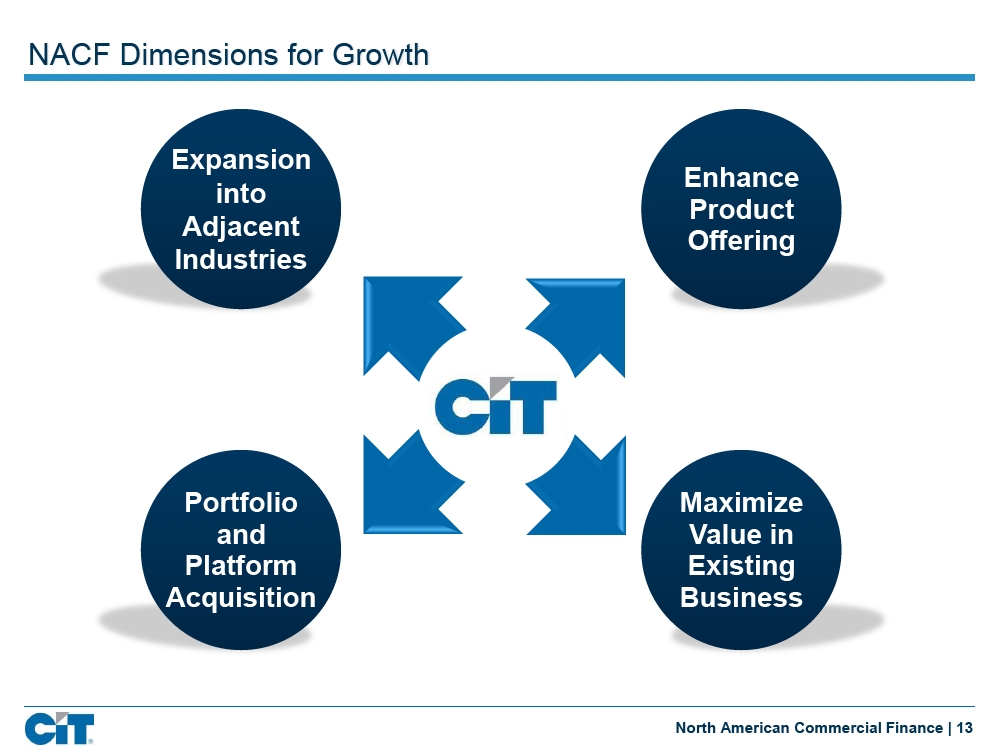
NACF Dimensions for Growth Expansion Enhance into Product Adjacent Offering Industries Portfolio Maximize and Value in Platform Existing Acquisition Business North American Commercial Finance | 13
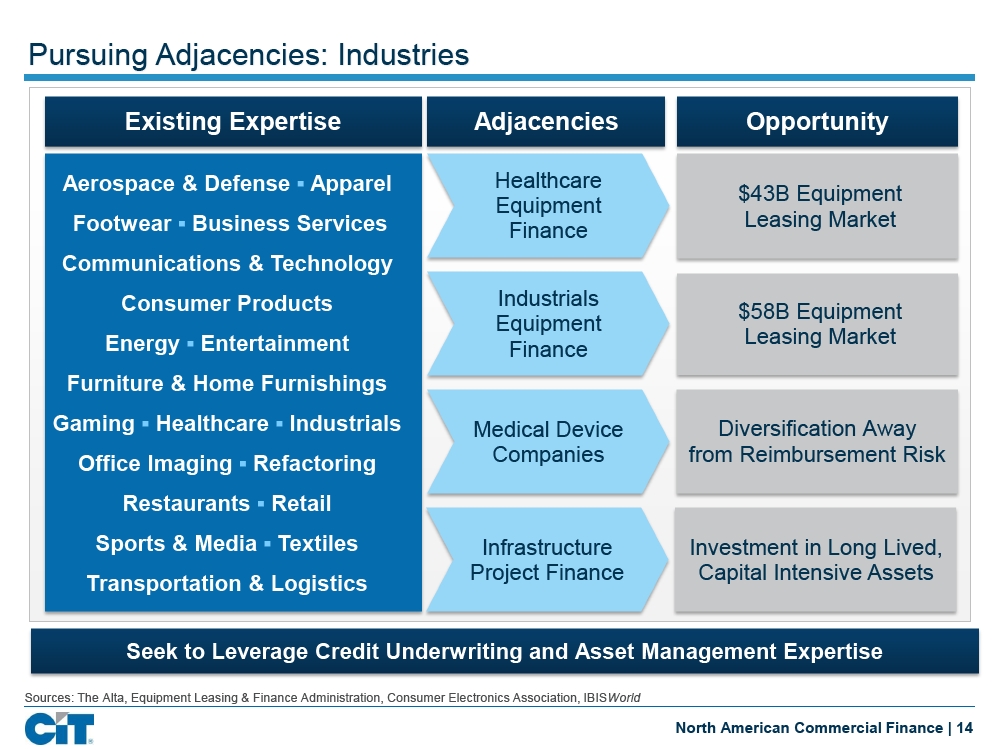
Pursuing Adjacencies: Industries Existing Expertise Adjacencies Opportunity Aerospace & Defense ª Apparel Healthcare $43B Equipment Equipment Footwear ª Business Services Leasing Market Finance Communications & Technology Consumer Products Industrials $58B Equipment Equipment Energy ª Entertainment Leasing Market Finance Furniture & Home Furnishings Gaming ª Healthcare ª Industrials Medical Device Diversification Away Office Imaging ª Refactoring Companies from Reimbursement Risk Restaurants ª Retail Sports & Media ª Textiles Infrastructure Investment in Long Lived, Project Finance Capital Intensive Assets Transportation & Logistics Seek to Leverage Credit Underwriting and Asset Management Expertise Sources: The Alta, Equipment Leasing & Finance Administration, Consumer Electronics Association, IBISWorld North American Commercial Finance | 14
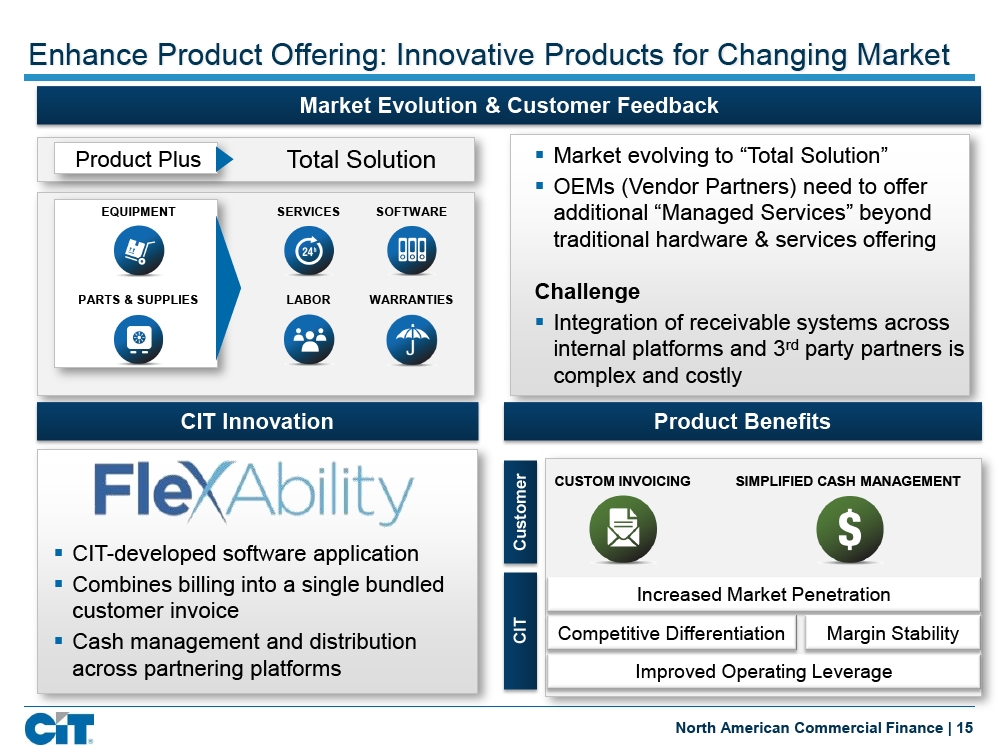
Enhance Product Offering: Innovative Products for Changing Market Market Evolution & Customer Feedback Product Plus Total Solution§ Market evolving to “Total Solution” § OEMs (Vendor Partners) need to offer EQUIPMENT SERVICES SOFTWARE additional “Managed Services” beyond traditional hardware & services offering PARTS & SUPPLIES LABOR WARRANTIES Challenge § Integration of receivable systems across internal platforms and 3rdparty partners is complex and costly CIT Innovation Product Benefits Customer CUSTOM INVOICING SIMPLIFIED CASH MANAGEMENT § CIT-developed software application§ Combines billing into a single bundled Increased Market Penetration customer invoice § Cash management and distribution CIT Competitive Differentiation Margin Stability across partnering platforms Improved Operating Leverage North American Commercial Finance | 15
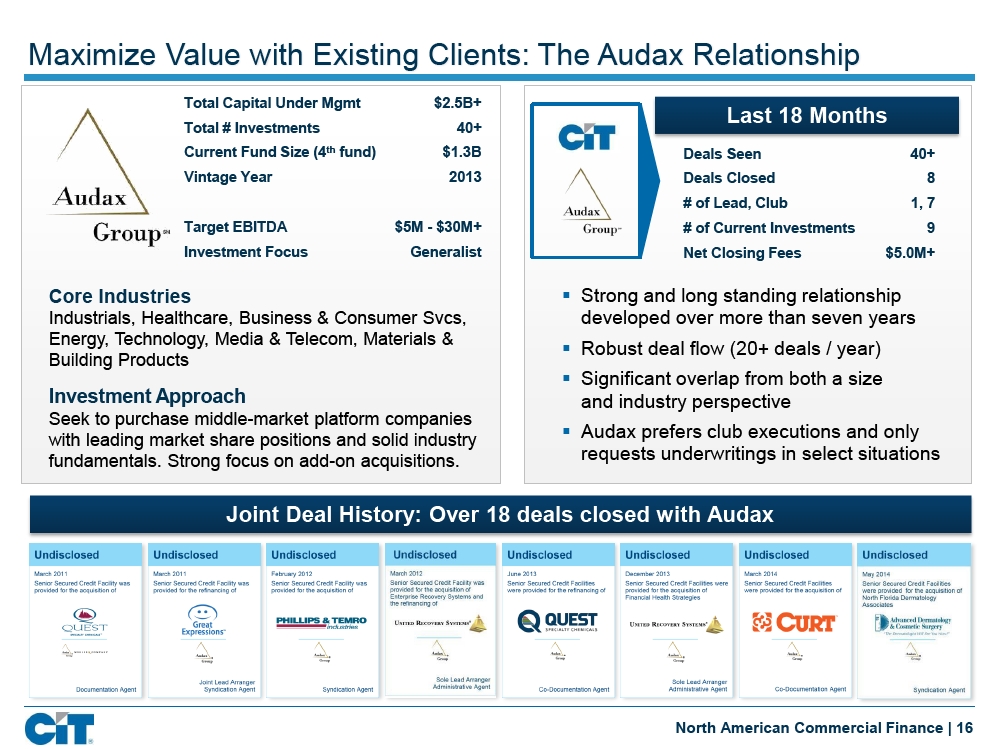
Maximize Value with Existing Clients: The Audax Relationship Total Capital Under Mgmt $2.5B+ Last 18 Months Total # Investments 40+ Current Fund Size (4thfund) $1.3B Deals Seen 40+ Vintage Year 2013 Deals Closed 8 # of Lead, Club 1, 7 Target EBITDA $5M - $30M+ # of Current Investments 9 Investment Focus Generalist Net Closing Fees $5.0M+ Core Industries§ Strong and long standing relationship Industrials, Healthcare, Business & Consumer Svcs, developed over more than seven years Energy, Technology, Media & Telecom, Materials &§ Robust deal flow (20+ deals / year) Building Products§ Significant overlap from both a size Investment Approach and industry perspective Seek to purchase middle-market platform companies with leading market share positions and solid industry§ Audax prefers club executions and only fundamentals. Strong focus on add-on acquisitions. requests underwritings in select situations Joint Deal History: Over 18 deals closed with Audax North American Commercial Finance | 16
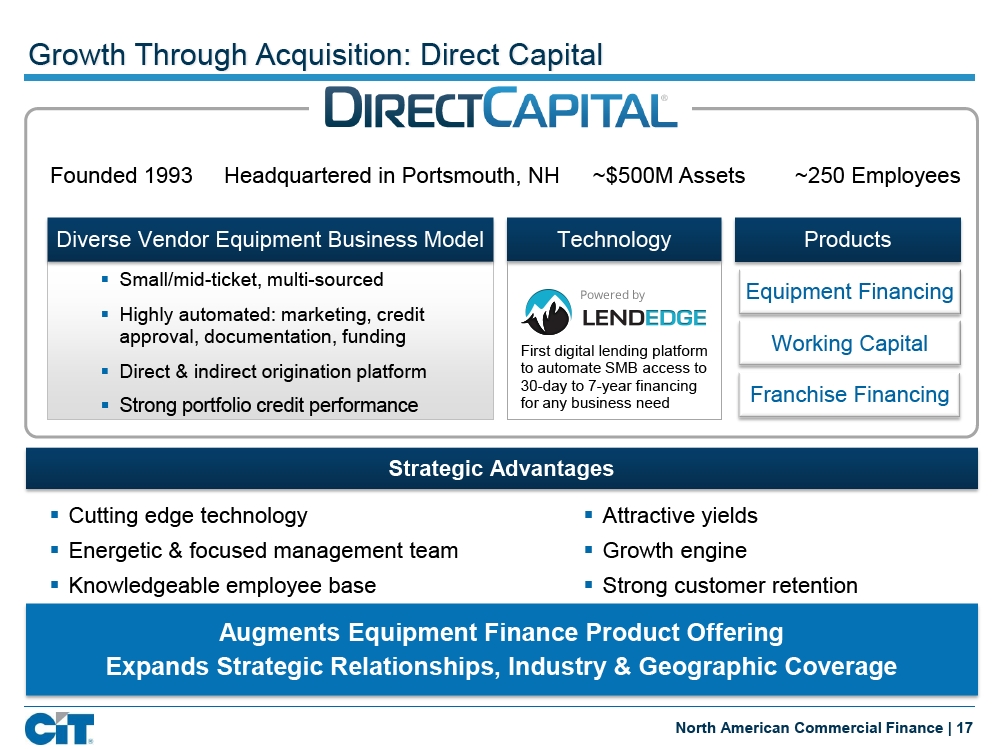
Growth Through Acquisition: Direct Capital Founded 1993 Headquartered in Portsmouth, NH ~$500M Assets ~250 Employees Diverse Vendor Equipment Business Model Technology Products§ Small/mid-ticket, multi-sourced Equipment Financing§ Highly automated: marketing, credit approval, documentation, funding Working Capital First digital lending platform § Direct & indirect origination platform to automate SMB access to 30-day to 7-year financing Franchise Financing § Strong portfolio credit performance for any business need Strategic Advantages § Cutting edge technology§ Attractive yields§ Energetic & focused management team§ Growth engine § Knowledgeable employee base§ Strong customer retention Augments Equipment Finance Product Offering Expands Strategic Relationships, Industry & Geographic Coverage North American Commercial Finance | 17
![]()
Value Proposition: Why We Win Superior Industry Knowledge + History of Product and Structuring Expertise Idea Generation and Value to the Client Deep Relationships with Clients, Customers, Sponsors, Developers and Manufacturers Focused on Client Service Throughout the Transaction Cycle North American Commercial Finance | 18
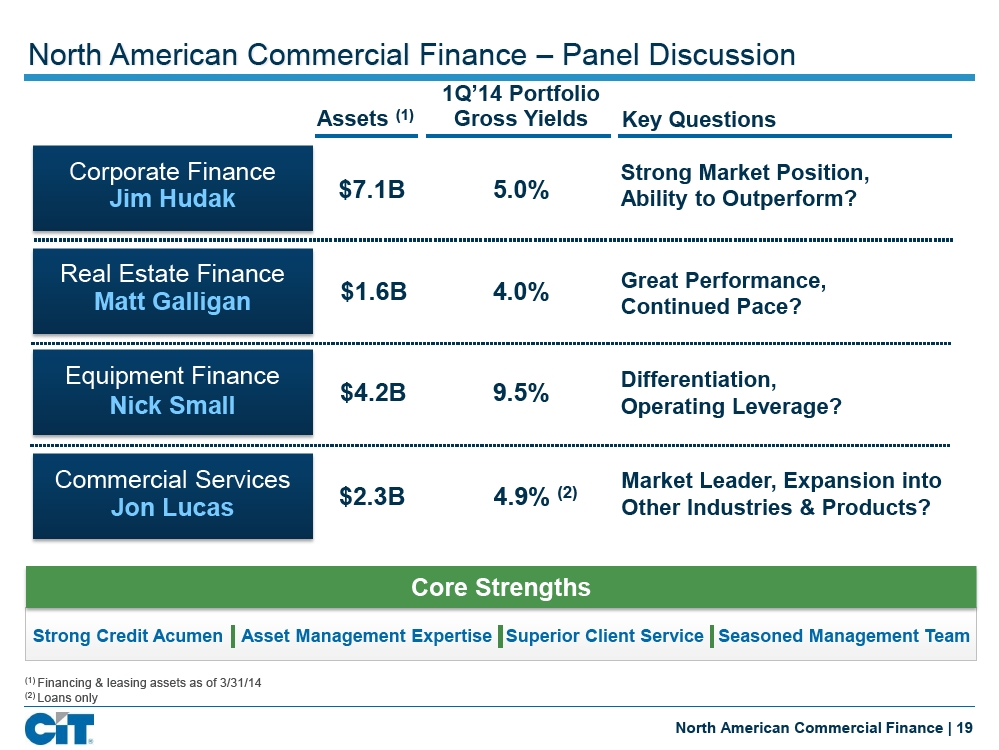
North American Commercial Finance – Panel Discussion 1Q’14 Portfolio Assets(1)Gross Yields Key Questions Corporate Finance Strong Market Position, Jim Hudak $7.1B 5.0% Ability to Outperform? Real Estate Finance Great Performance, Matt Galligan $1.6B 4.0% Continued Pace? Equipment Finance Differentiation, $4.2B 9.5% Nick Small Operating Leverage? Commercial Services Market Leader, Expansion into Jon Lucas $2.3B 4.9%(2)Other Industries & Products? Core Strengths Strong Credit Acumen Asset Management Expertise Superior Client Service Seasoned Management Team(1)Financing & leasing assets as of 3/31/14(2)Loans only North American Commercial Finance | 19

Credit Risk Management Robert C. Rowe EVP & Chief Credit Officer
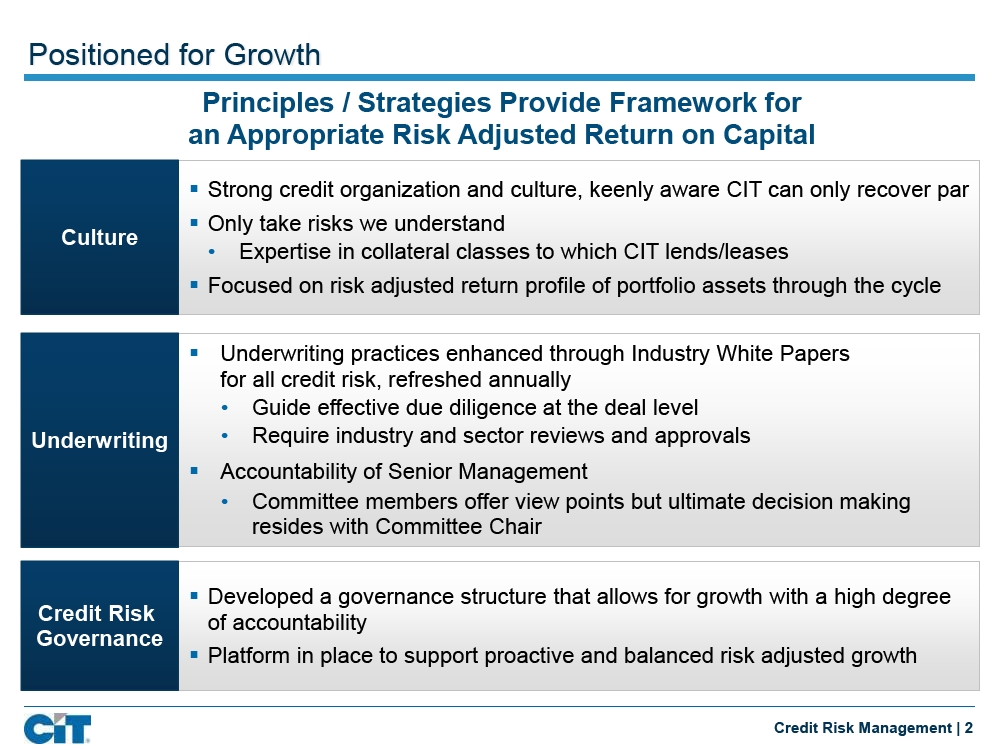
Positioned for Growth Principles / Strategies Provide Framework for an Appropriate Risk Adjusted Return on Capital § Strong credit organization and culture, keenly aware CIT can only recover par§ Only take risks we understand Culture • Expertise in collateral classes to which CIT lends/leases § Focused on risk adjusted return profile of portfolio assets through the cycle § Underwriting practices enhanced through Industry White Papers for all credit risk, refreshed annually • Guide effective due diligence at the deal level Underwriting • Require industry and sector reviews and approvals§ Accountability of Senior Management • Committee members offer view points but ultimate decision making resides with Committee Chair § Developed a governance structure that allows for growth with a high degree Credit Risk of accountability Governance § Platform in place to support proactive and balanced risk adjusted growth Credit Risk Management | 2
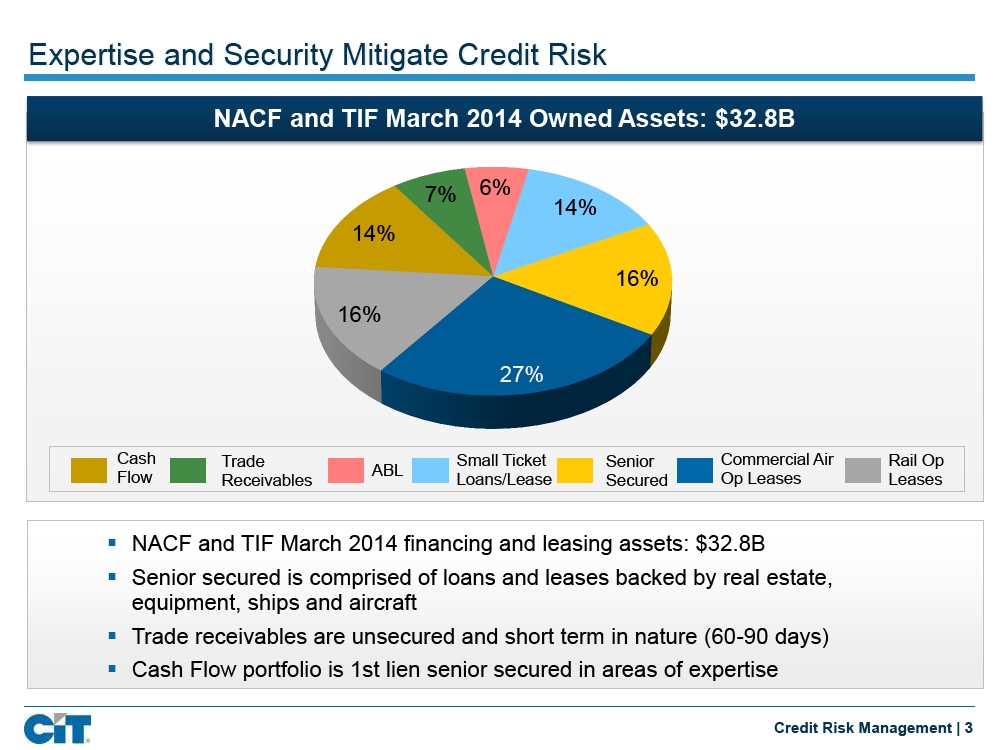
Expertise and Security Mitigate Credit Risk NACF and TIF March 2014 Owned Assets: $32.8B 7% 6% 14% 14% 16% 16% 27% Cash Trade Small Ticket Senior Commercial Air Rail Op Flow ABL Receivables Loans/Lease Secured Op Leases Leases § NACF and TIF March 2014 financing and leasing assets: $32.8B § Senior secured is comprised of loans and leases backed by real estate, equipment, ships and aircraft§ Trade receivables are unsecured and short term in nature (60-90 days)§ Cash Flow portfolio is 1st lien senior secured in areas of expertise Credit Risk Management | 3
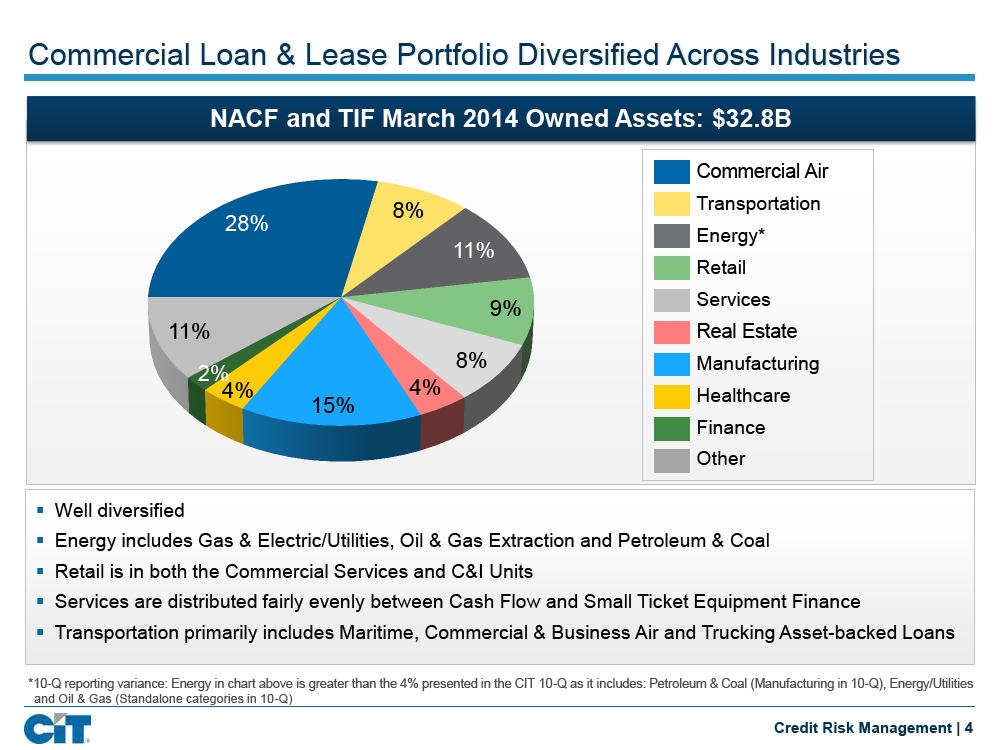
Commercial Loan & Lease Portfolio Diversified Across Industries NACF and TIF March 2014 Owned Assets: $32.8B Commercial Air 8% Transportation 28% Energy* 11% Retail 9% Services 11% Real Estate 8% Manufacturing 2% 4% 4% Healthcare 15% Finance Other § Well diversified § Energy includes Gas & Electric/Utilities, Oil & Gas Extraction and Petroleum & Coal§ Retail is in both the Commercial Services and C&I Units § Services are distributed fairly evenly between Cash Flow and Small Ticket Equipment Finance § Transportation primarily includes Maritime, Commercial & Business Air and Trucking Asset-backed Loans *10-Q reporting variance: Energy in chart above is greater than the 4% presented in the CIT 10-Q as it includes: Petroleum & Coal (Manufacturing in 10-Q), Energy/Utilities and Oil & Gas (Standalone categories in 10-Q) Credit Risk Management | 4
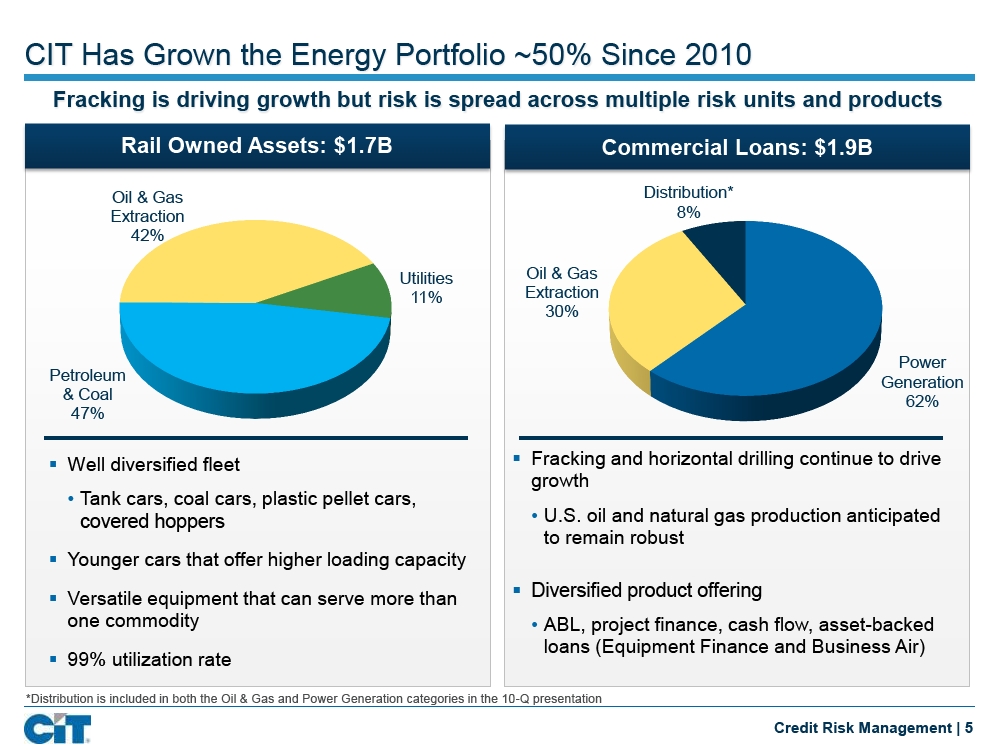
CIT Has Grown the Energy Portfolio ~50% Since 2010 Fracking is driving growth but risk is spread across multiple risk units and products Rail Owned Assets: $1.7B Commercial Loans: $1.9B Oil & Gas Distribution* Extraction 8% 42% Utilities Oil & Gas 11% Extraction 30% Power Petroleum Generation & Coal 62% 47% § Well diversified fleet§ Fracking and horizontal drilling continue to drive growth • Tank cars, coal cars, plastic pellet cars, covered hoppers • U.S. oil and natural gas production anticipated to remain robust§ Younger cars that offer higher loading capacity§ Diversified product offering§ Versatile equipment that can serve more than one commodity • ABL, project finance, cash flow, asset-backed loans (Equipment Finance and Business Air)§ 99% utilization rate *Distribution is included in both the Oil & Gas and Power Generation categories in the 10-Q presentation Credit Risk Management | 5
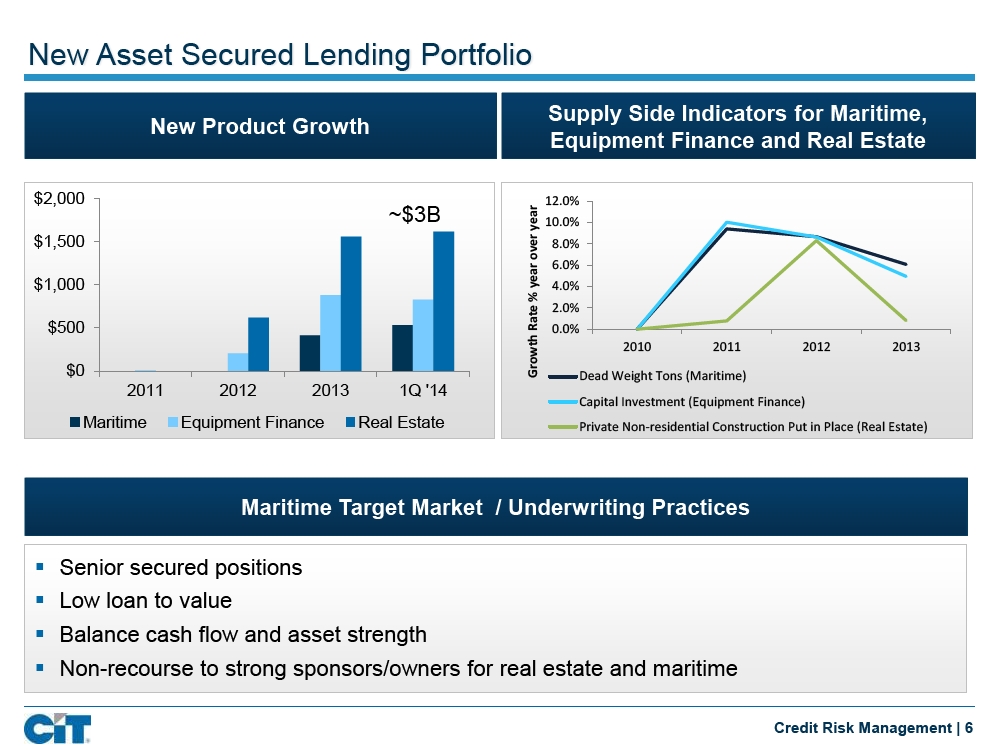
New Asset Secured Lending Portfolio Supply Side Indicators for Maritime, New Product Growth Equipment Finance and Real Estate $2,000 12.0% ~$3B year 10.0% $1,500 over 8.0% year 6.0% $1,000 4.0% % Rate 2.0% $500 0.0% 2010 2011 2012 2013 $0 Growth Dead Weight Tons (Maritime) 2011 2012 2013 1Q '14 Capital Investment (Equipment Finance) Maritime Equipment Finance Real Estate Private Non-residential Construction Put in Place (Real Estate) Maritime Target Market / Underwriting Practices § Senior secured positions§ Low loan to value § Balance cash flow and asset strength § Non-recourse to strong sponsors/owners for real estate and maritime Credit Risk Management | 6
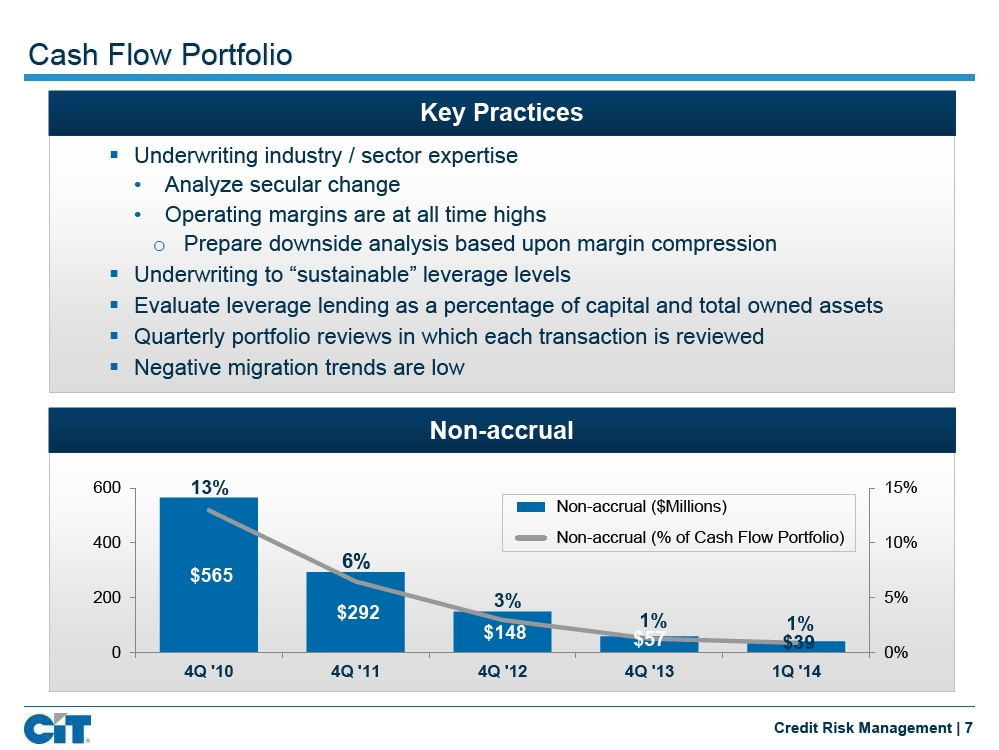
Cash Flow Portfolio Key Practices § Underwriting industry / sector expertise • Analyze secular change • Operating margins are at all time highs o Prepare downside analysis based upon margin compression § Underwriting to “sustainable” leverage levels § Evaluate leverage lending as a percentage of capital and total owned assets§ Quarterly portfolio reviews in which each transaction is reviewed§ Negative migration trends are low Non-accrual 600 13% 15% Non-accrual ($Millions) 400 Non-accrual (% of Cash Flow Portfolio) 10% 6% $565 200 3% 5% $292 1% 1% $148 $57 $39 0 0% 4Q '10 4Q '11 4Q '12 4Q '13 1Q '14 Credit Risk Management | 7
![]()
Commercial Portfolio Priced for Risk Commercial Yield Peer Comparison Net Yield Gross Yield (net of annualized charge-offs) 5.4% 4.6% 4.0% 3.6% CIT Peer Group Average Note: Data as of 3/31/14. Source; 10-Q filing of certain peers Credit Risk Management | 8
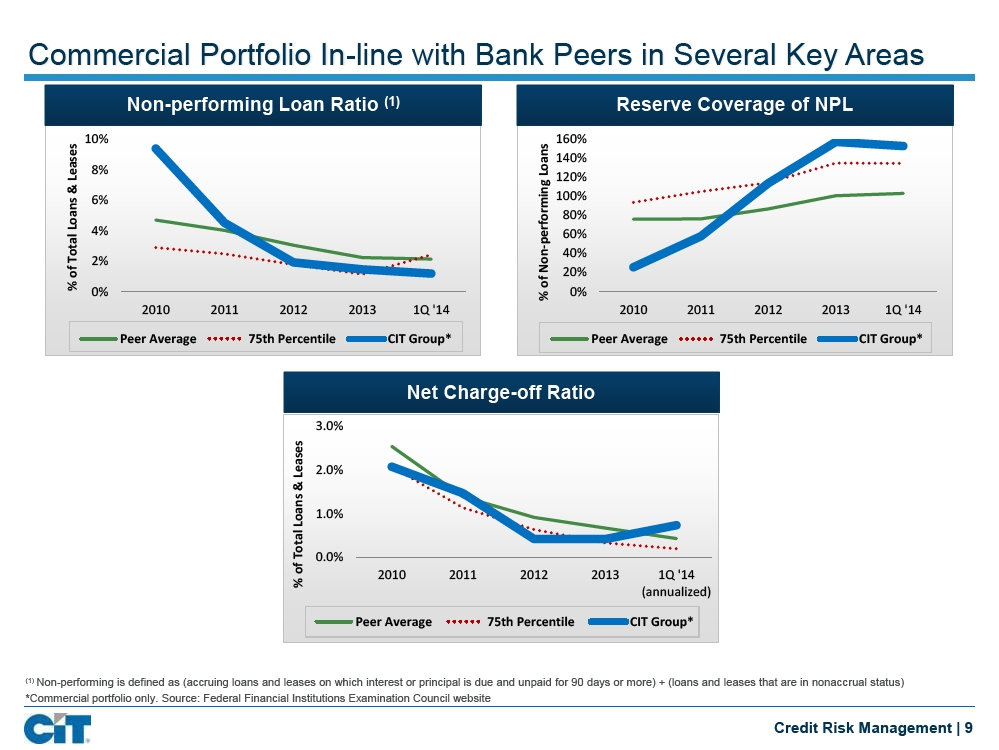
Commercial Portfolio In-line with Bank Peers in Several Key Areas Non-performing Loan Ratio(1)Reserve Coverage of NPL 10% 160% 140% 8% Loans Leases 120% & performing 6% 100% Loans 80% 4% 60% Total 40% 2% Non-of 20% % of 0% 0% % 2010 2011 2012 2013 1Q '14 2010 2011 2012 2013 1Q '14 Peer Average 75th Percentile CIT Group* Peer Average 75th Percentile CIT Group* Net Charge-off Ratio 3.0% Leases 2.0% & Loans 1.0% Total 0.0% of 2010 2011 2012 2013 1Q '14 % (annualized) Peer Average 75th Percentile CIT Group*(1)Non-performing is defined as (accruing loans and leases on which interest or principal is due and unpaid for 90 days or more) + (loans and leases that are in nonaccrual status) *Commercial portfolio only. Source: Federal Financial Institutions Examination Council website Credit Risk Management | 9
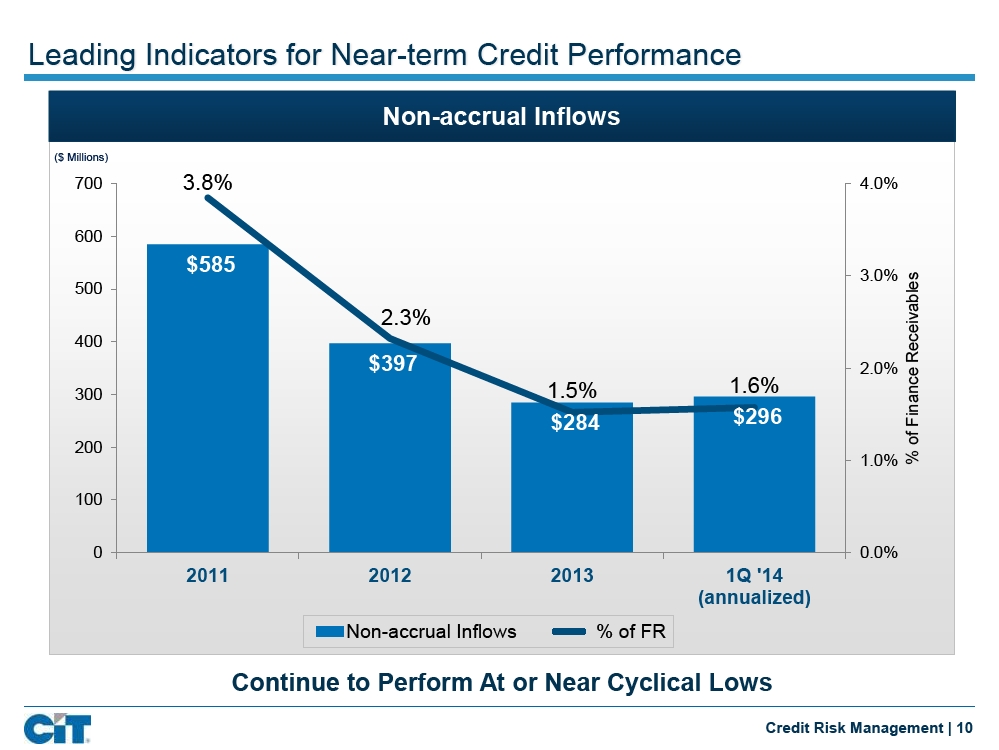
Leading Indicators for Near-term Credit Performance Non-accrual Inflows ($ Millions) 700 3.8% 4.0% 600 $585 3.0% Receivables 500 2.3% 400 $397 2.0% 1.6% Finance 300 1.5% $284 $296 200 of 1.0% % 100 0 0.0% 2011 2012 2013 1Q '14 (annualized) Non-accrual Inflows % of FR Continue to Perform At or Near Cyclical Lows Credit Risk Management | 10
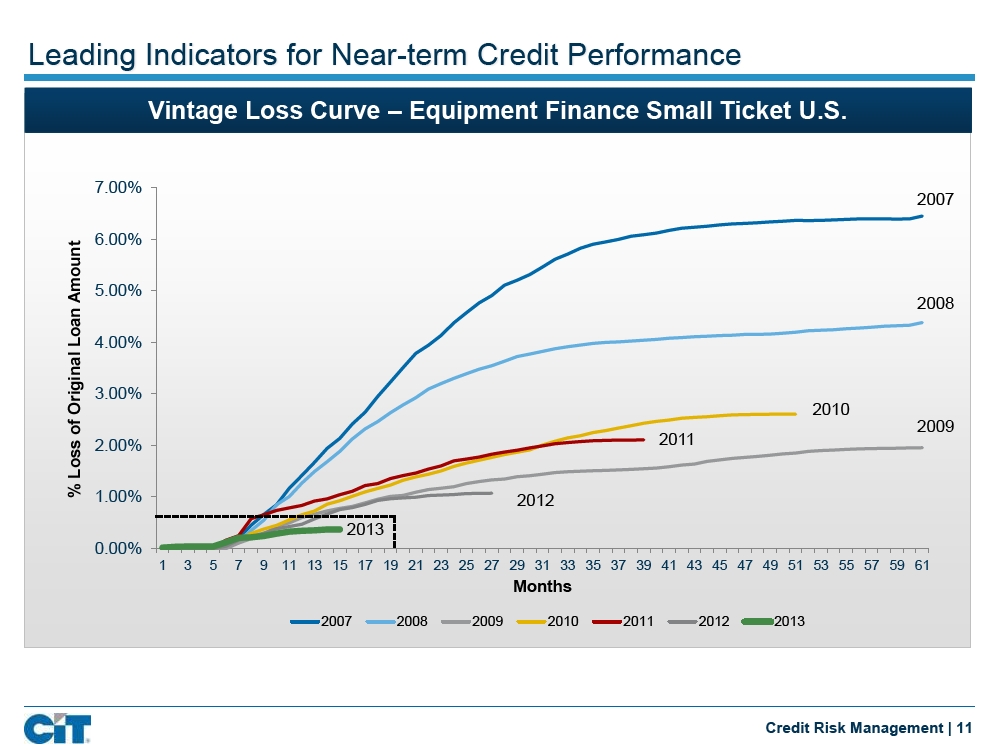
Leading Indicators for Near-term Credit Performance Vintage Loss Curve – Equipment Finance Small Ticket U.S. 7.00% 2007 6.00% Amount 5.00% 2008 Loan 4.00% Original 3.00% 2010 of 2009 2.00% 2011 Loss % 1.00% 2012 2013 0.00% 1 3 5 7 9 11 13 15 17 19 21 23 25 27 29 31 33 35 37 39 41 43 45 47 49 51 53 55 57 59 61 Months 2007 2008 2009 2010 2011 2012 2013 Credit Risk Management | 11
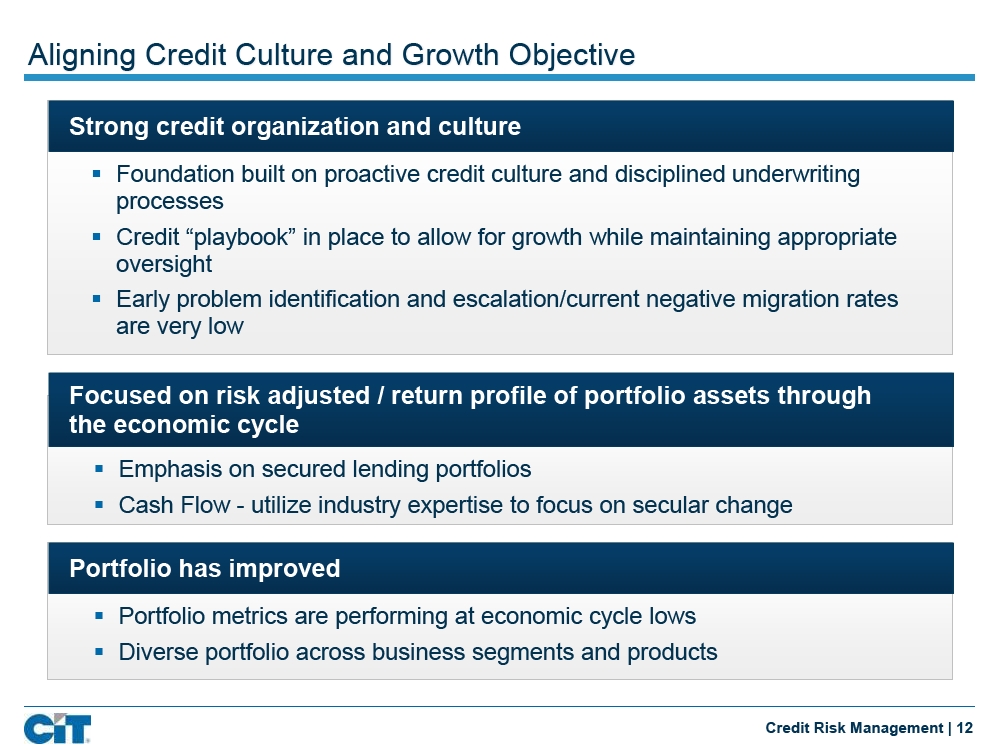
Aligning Credit Culture and Growth Objective Strong credit organization and culture § Foundation built on proactive credit culture and disciplined underwriting processes § Credit “playbook” in place to allow for growth while maintaining appropriate oversight§ Early problem identification and escalation/current negative migration rates are very low Focused on risk adjusted / return profile of portfolio assets through the economic cycle § Emphasis on secured lending portfolios § Cash Flow - utilize industry expertise to focus on secular change Portfolio has improved § Portfolio metrics are performing at economic cycle lows§ Diverse portfolio across business segments and products Credit Risk Management | 12
Financial Update Scott T. Parker EVP & Chief Financial Officer
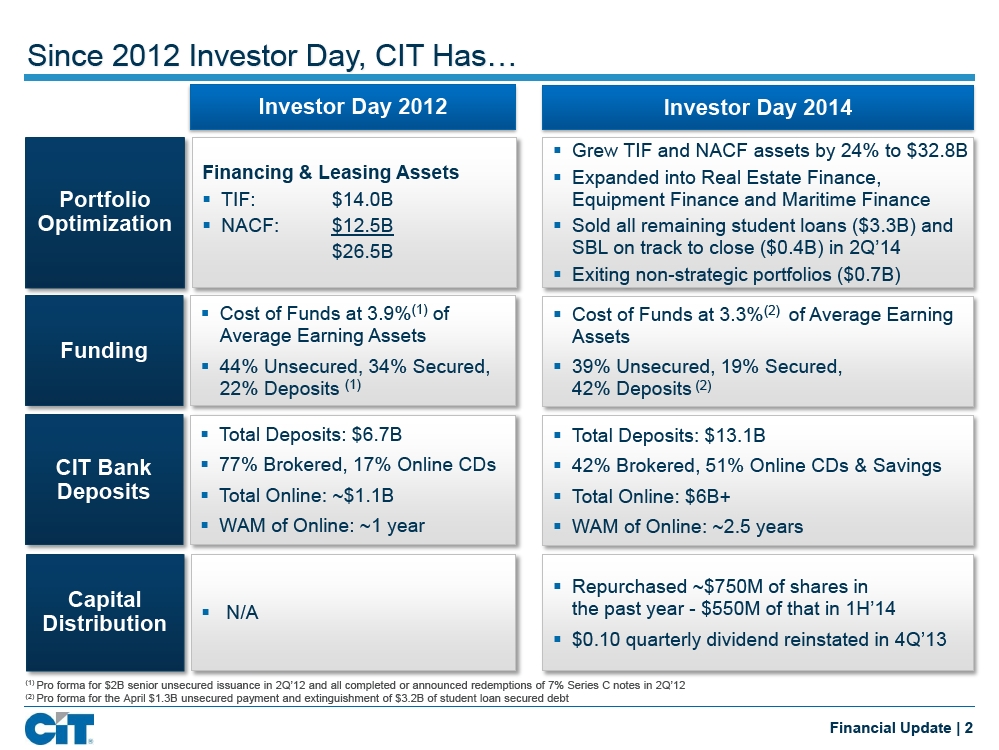
Since 2012 Investor Day, CIT Has… Investor Day 2012 Investor Day 2014 § Grew TIF and NACF assets by 24% to $32.8B Financing & Leasing Assets§ Expanded into Real Estate Finance, Portfolio§ TIF: $14.0B Equipment Finance and Maritime Finance Optimization§ NACF:$12.5B§ Sold all remaining student loans ($3.3B) and $26.5B SBL on track to close ($0.4B) in 2Q’14§ Exiting non-strategic portfolios ($0.7B) § Cost of Funds at 3.9%(1)of§ Cost of Funds at 3.3%(2)of Average Earning Average Earning Assets Assets Funding § 44% Unsecured, 34% Secured,§ 39% Unsecured, 19% Secured, 22% Deposits(1)42% Deposits(2) § Total Deposits: $6.7B§ Total Deposits: $13.1B CIT Bank§ 77% Brokered, 17% Online CDs§ 42% Brokered, 51% Online CDs & Savings Deposits§ Total Online: ~$1.1B§ Total Online: $6B+§ WAM of Online: ~1 year§ WAM of Online: ~2.5 years § Repurchased ~$750M of shares in Capital the past year - $550M of that in 1H’14 § N/A Distribution § $0.10 quarterly dividend reinstated in 4Q’13(1)Pro forma for $2B senior unsecured issuance in 2Q’12 and all completed or announced redemptions of 7% Series C notes in 2Q’12(2)Pro forma for the April $1.3B unsecured payment and extinguishment of $3.2B of student loan secured debt Financial Update | 2
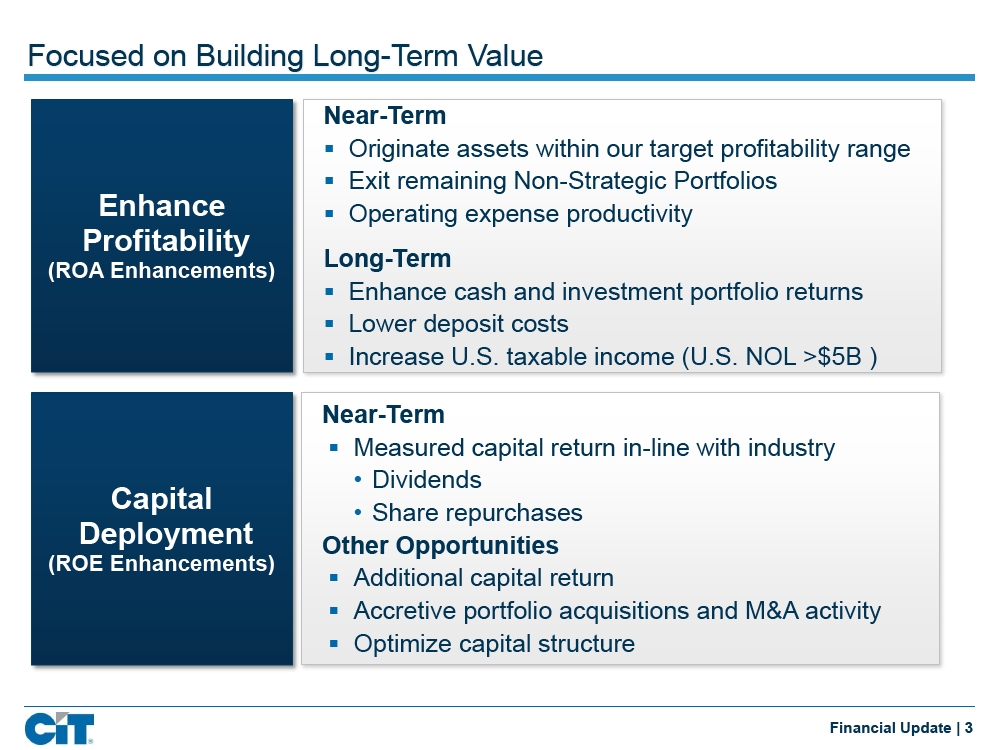
Focused on Building Long-Term Value Near-Term § Originate assets within our target profitability range§ Exit remaining Non-Strategic Portfolios Enhance§ Operating expense productivity Profitability Long-Term (ROA Enhancements) § Enhance cash and investment portfolio returns§ Lower deposit costs§ Increase U.S. taxable income (U.S. NOL >$5B ) Near-Term § Measured capital return in-line with industry • Dividends Capital • Share repurchases Deployment Other Opportunities (ROE Enhancements) § Additional capital return § Accretive portfolio acquisitions and M&A activity§ Optimize capital structure Financial Update | 3
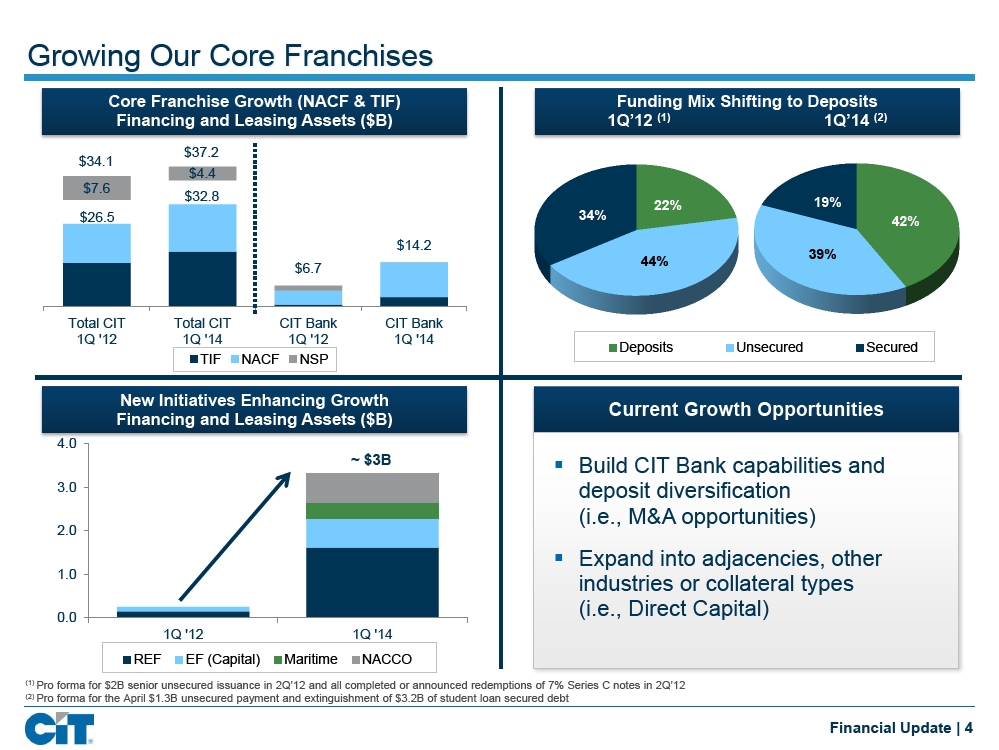
Growing Our Core Franchises Core Franchise Growth (NACF & TIF) Funding Mix Shifting to Deposits Financing and Leasing Assets ($B) 1Q’12(1)1Q’14(2) $37.2 $34.1 $4.4 $7.6 $32.8 19% 22% $26.5 34% 42% $14.2 39% 44% $6.7 Total CIT Total CIT CIT Bank CIT Bank 1Q '12 1Q '14 1Q '12 1Q '14 Deposits Unsecured Secured TIF NACF NSP New Initiatives Enhancing Growth Current Growth Opportunities Financing and Leasing Assets ($B) 4.0 ~ $3B§ Build CIT Bank capabilities and 3.0 deposit diversification (i.e., M&A opportunities) 2.0 § Expand into adjacencies, other 1.0 industries or collateral types 0.0 (i.e., Direct Capital) 1Q '12 1Q '14 REF EF (Capital) Maritime NACCO(1)Pro forma for $2B senior unsecured issuance in 2Q’12 and all completed or announced redemptions of 7% Series C notes in 2Q’12(2)Pro forma for the April $1.3B unsecured payment and extinguishment of $3.2B of student loan secured debt Financial Update | 4
![]()
Making Progress Exiting Non-Strategic Portfolios Finance and Leasing Assets(1) Total $4.4B Exited Sub-scale, Small Ticket ($ Billions) Europe International Platforms ~$100 million in 10 countries 0.2 0.4 Latin America SBL 0.5 2Q’14 Sold Student Loans & SBL Portfolio SLX on Track to Close 3.3 Exit Latin America and Europe by the end of 2014 Platforms requiring regulatory approval may drift into 1H’15(1)Financing and leasing assets include loans, operating lease equipment and assets held for sale; data in billions and as of 3/31/14. Financial Update | 5
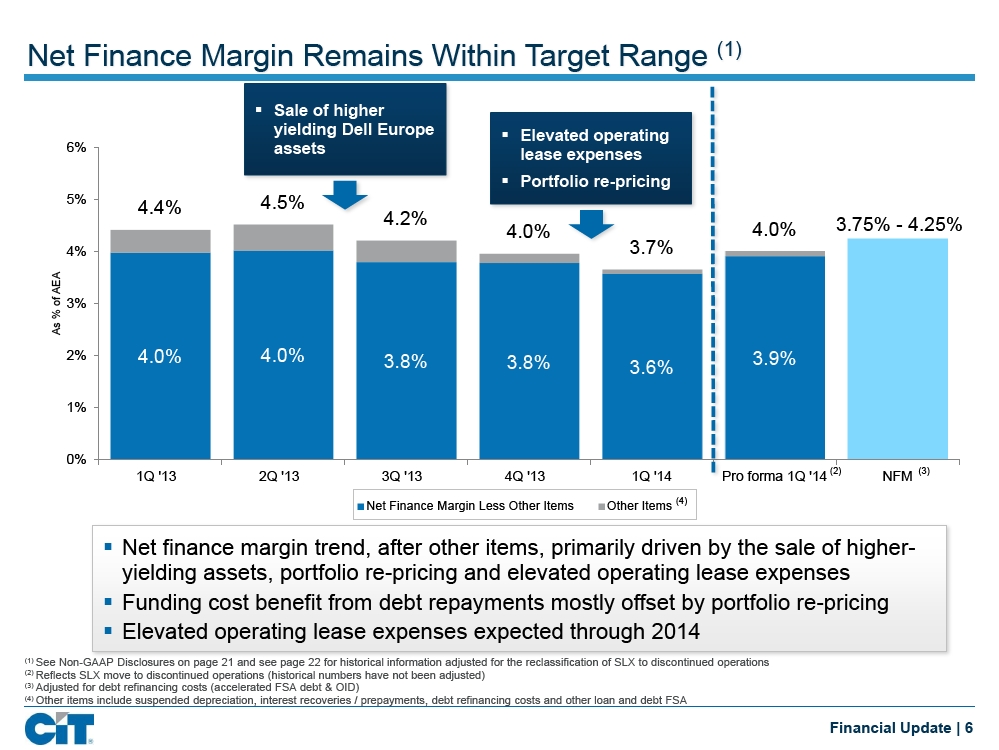
Net Finance Margin Remains Within Target Range(1) § Sale of higher yielding Dell Europe§ Elevated operating 6% assets lease expenses§ Portfolio re-pricing 5% 4.4% 4.5% 4.2% 3.75% - 4.25% 4.0% 4.0% 4% 3.7% AEA of 3% % As 2% 4.0% 4.0% 3.8% 3.8% 3.9% 3.6% 1% 0% 1Q '13 2Q '13 3Q '13 4Q '13 1Q '14 Pro forma 1Q '14 (2) NFM (3) Net Finance Margin Less Other Items Other Items(4) § Net finance margin trend, after other items, primarily driven by the sale of higher-yielding assets, portfolio re-pricing and elevated operating lease expenses§ Funding cost benefit from debt repayments mostly offset by portfolio re-pricing§ Elevated operating lease expenses expected through 2014(1)See Non-GAAP Disclosures on page 21 and see page 22 for historical information adjusted for the reclassification of SLX to discontinued operations(2)Reflects SLX move to discontinued operations (historical numbers have not been adjusted)(3)Adjusted for debt refinancing costs (accelerated FSA debt & OID)(4)Other items include suspended depreciation, interest recoveries / prepayments, debt refinancing costs and other loan and debt FSA Financial Update | 6
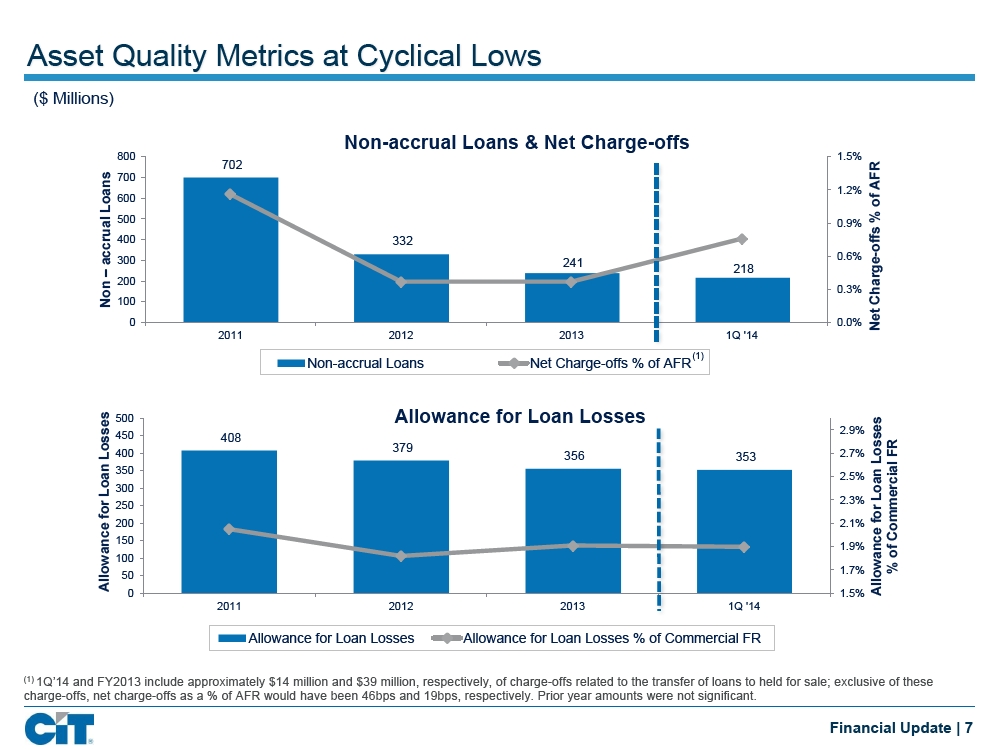
Asset Quality Metrics at Cyclical Lows ($ Millions) Non-accrual Loans & Net Charge-offs 800 1.5% 702 Loans 700 AFR 1.2% 600 of accrual 500 0.9% % 400 332 -offs 300 0.6% 241 Charge 218 – 200 0.3% Non 100 0 0.0% Net 2011 2012 2013 1Q '14 (1) Non-accrual Loans Net Charge-offs % of AFR Losses 500 Allowance for Loan Losses Losses 2.9% 450 408 379 400 356 353 2.7% FR 350 Commercial 2.5% Loan 300 Loan 2.3% for 250 200 2.1% for Allowance Allowance 150 1.9% of 100 1.7% % 50 0 1.5% 2011 2012 2013 1Q '14 Allowance for Loan Losses Allowance for Loan Losses % of Commercial FR(1)1Q’14 and FY2013 include approximately $14 million and $39 million, respectively, of charge-offs related to the transfer of loans to held for sale; exclusive of these charge-offs, net charge-offs as a % of AFR would have been 46bps and 19bps, respectively. Prior year amounts were not significant. Financial Update | 7
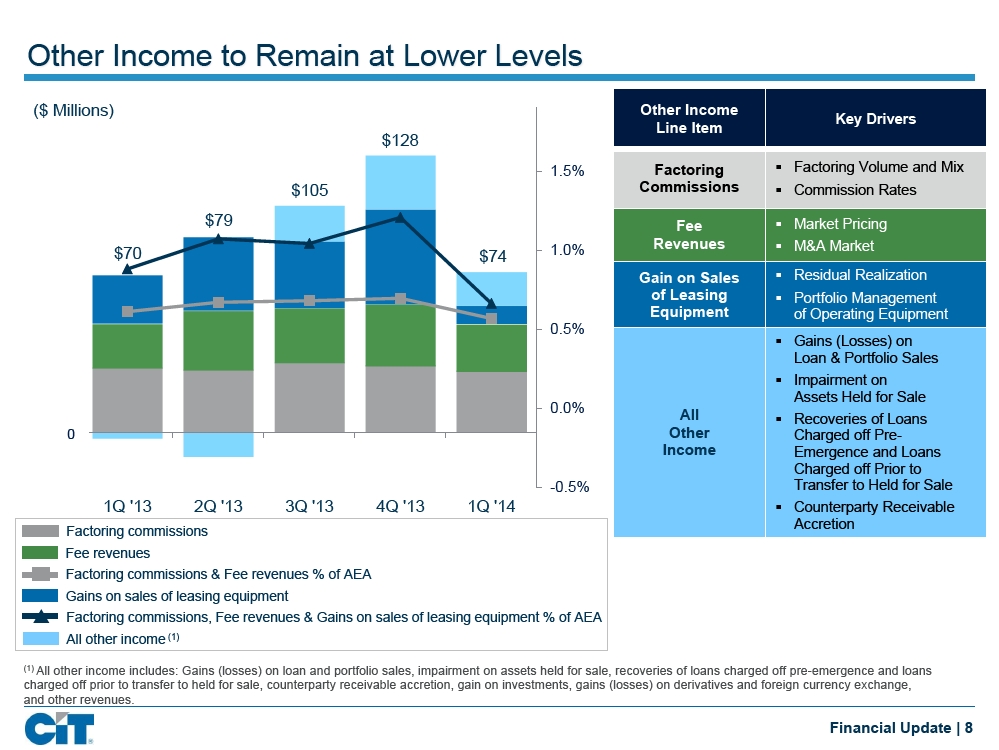
Other Income to Remain at Lower Levels ($ Millions) Other Income Key Drivers Line Item $128 1.5% Factoring§ Factoring Volume and Mix $105 Commissions§ Commission Rates $79 Fee§ Market Pricing 1.0% Revenues§ M&A Market $70 $74 Gain on Sales§ Residual Realization of Leasing§ Portfolio Management Equipment of Operating Equipment 0.5%§ Gains (Losses) on Loan & Portfolio Sales§ Impairment on Assets Held for Sale 0.0% All§ Recoveries of Loans 0 Other Charged off Pre-Income Emergence and Loans Charged off Prior to -0.5% Transfer to Held for Sale 1Q '13 2Q '13 3Q '13 4Q '13 1Q '14§ Counterparty Receivable Accretion Factoring commissions Fee revenues Factoring commissions & Fee revenues % of AEA Gains on sales of leasing equipment Factoring commissions, Fee revenues & Gains on sales of leasing equipment % of AEA All other income(1)(1)All other income includes: Gains (losses) on loan and portfolio sales, impairment on assets held for sale, recoveries of loans charged off pre-emergence and loans charged off prior to transfer to held for sale, counterparty receivable accretion, gain on investments, gains (losses) on derivatives and foreign currency exchange, and other revenues. Financial Update | 8
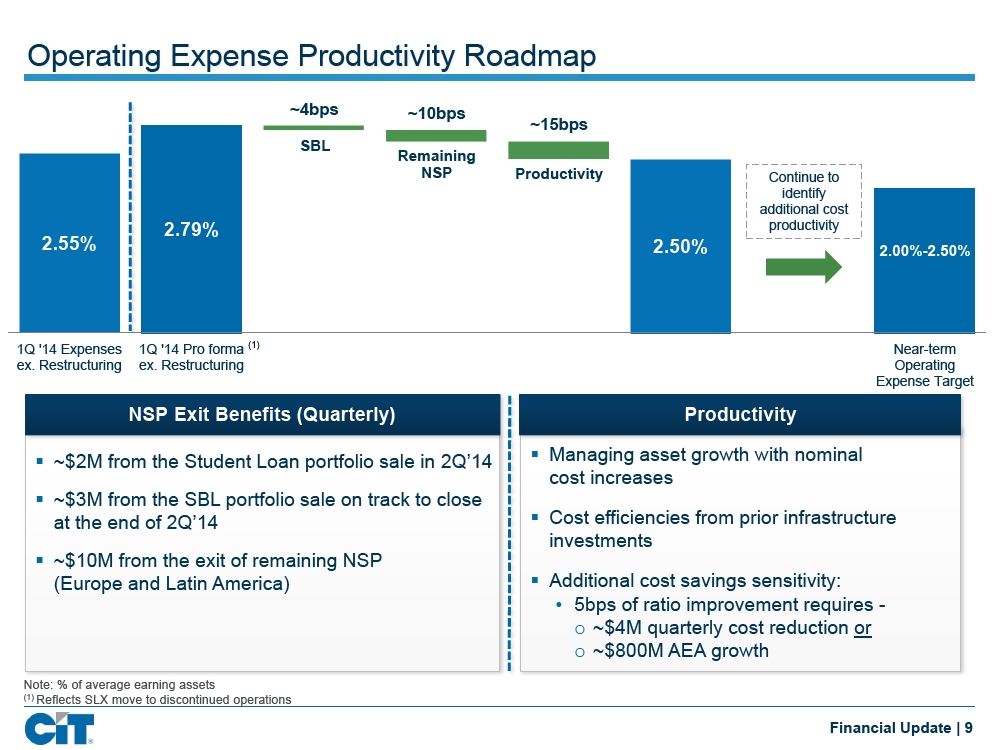
Operating Expense Productivity Roadmap ~4bps ~10bps ~15bps SBL Remaining NSP Productivity Continue to identify additional cost 2.79% productivity 2.55% 2.50% 2.00%-2.50% 1Q '14 Expenses 1Q '14 Pro forma (1) Near-term ex. Restructuring ex. Restructuring Operating Expense Target NSP Exit Benefits (Quarterly) Productivity § ~$2M from the Student Loan portfolio sale in 2Q’14§ Managing asset growth with nominal cost increases§ ~$3M from the SBL portfolio sale on track to close at the end of 2Q’14§ Cost efficiencies from prior infrastructure investments§ ~$10M from the exit of remaining NSP (Europe and Latin America)§ Additional cost savings sensitivity: • 5bps of ratio improvement requires -o ~$4M quarterly cost reductionoro ~$800M AEA growth Note: % of average earning assets(1)Reflects SLX move to discontinued operations Financial Update | 9
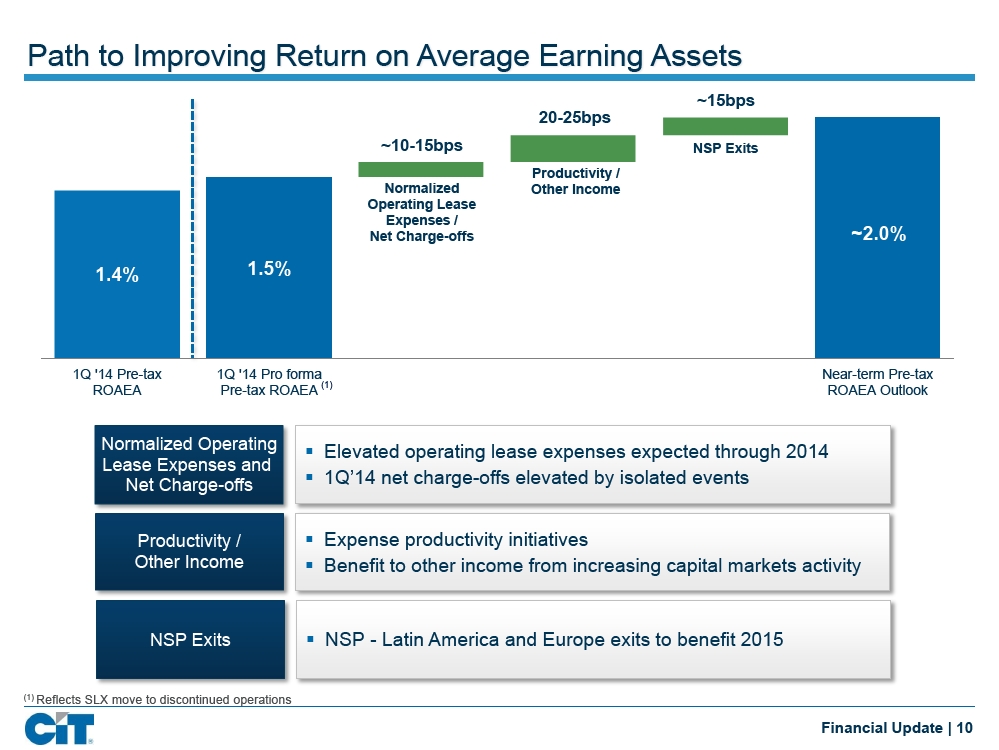
Path to Improving Return on Average Earning Assets ~15bps 20-25bps ~10-15bps NSP Exits Productivity / Normalized Other Income Operating Lease Expenses / Net Charge-offs ~2.0% 1.4% 1.5% 1Q '14 Pre-tax 1Q '14 Pro forma Near-term Pre-tax ROAEA Pre-tax ROAEA (1) ROAEA Outlook Normalized Operating§ Elevated operating lease expenses expected through 2014 Lease Expenses and Net Charge-offs§ 1Q’14 net charge-offs elevated by isolated events Productivity /§ Expense productivity initiatives Other Income§ Benefit to other income from increasing capital markets activity NSP Exits§ NSP - Latin America and Europe exits to benefit 2015(1)Reflects SLX move to discontinued operations Financial Update | 10
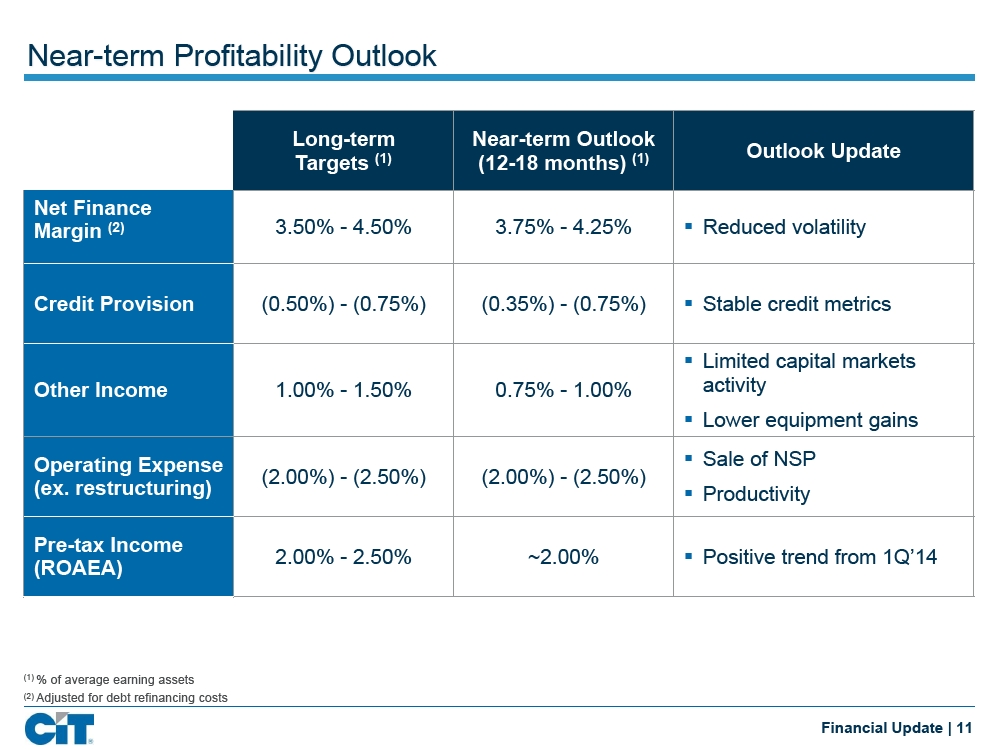
Near-term Profitability Outlook Long-term Near-term Outlook Outlook Update Targets(1)(12-18 months)(1) Net Finance Margin(2)3.50% - 4.50% 3.75% - 4.25%§ Reduced volatility Credit Provision (0.50%) - (0.75%) (0.35%) - (0.75%)§ Stable credit metrics § Limited capital markets Other Income 1.00% - 1.50% 0.75% - 1.00% activity§ Lower equipment gains Operating Expense§ Sale of NSP (2.00%) - (2.50%) (2.00%) - (2.50%) (ex. restructuring)§ Productivity Pre-tax Income 2.00% - 2.50% ~2.00%§ Positive trend from 1Q’14 (ROAEA)(1)% of average earning assets(2)Adjusted for debt refinancing costs Financial Update | 11
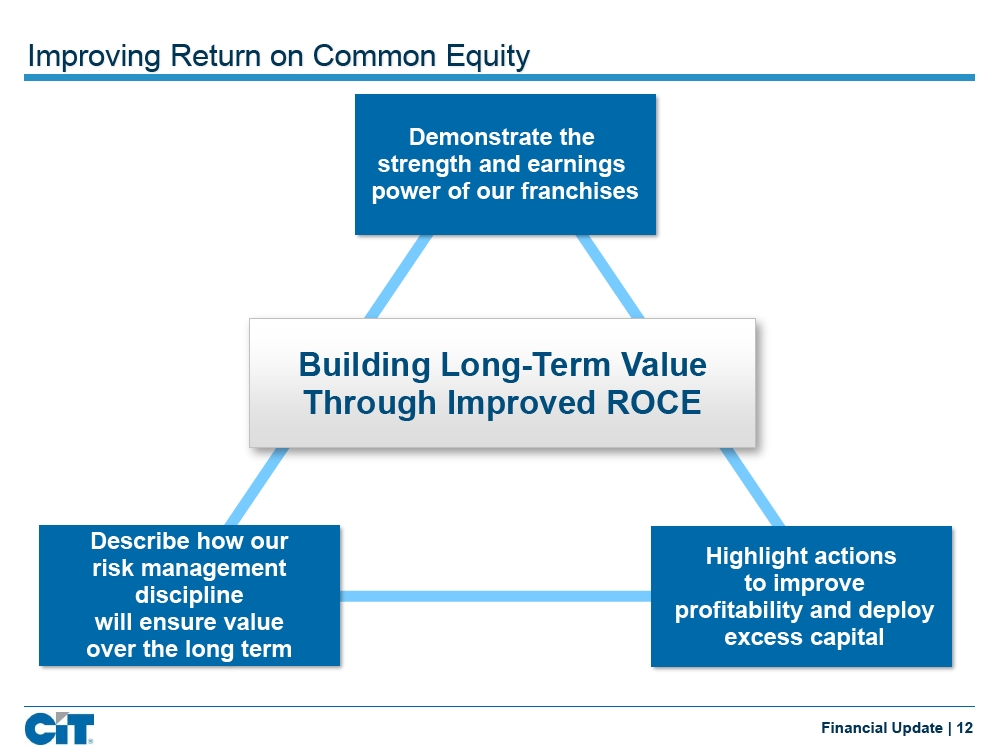
Improving Return on Common Equity Demonstrate the strength and earnings power of our franchises Building Long-Term Value Through Improved ROCE Describe how our Highlight actions risk management to improve discipline profitability and deploy will ensure value excess capital over the long term Financial Update | 12
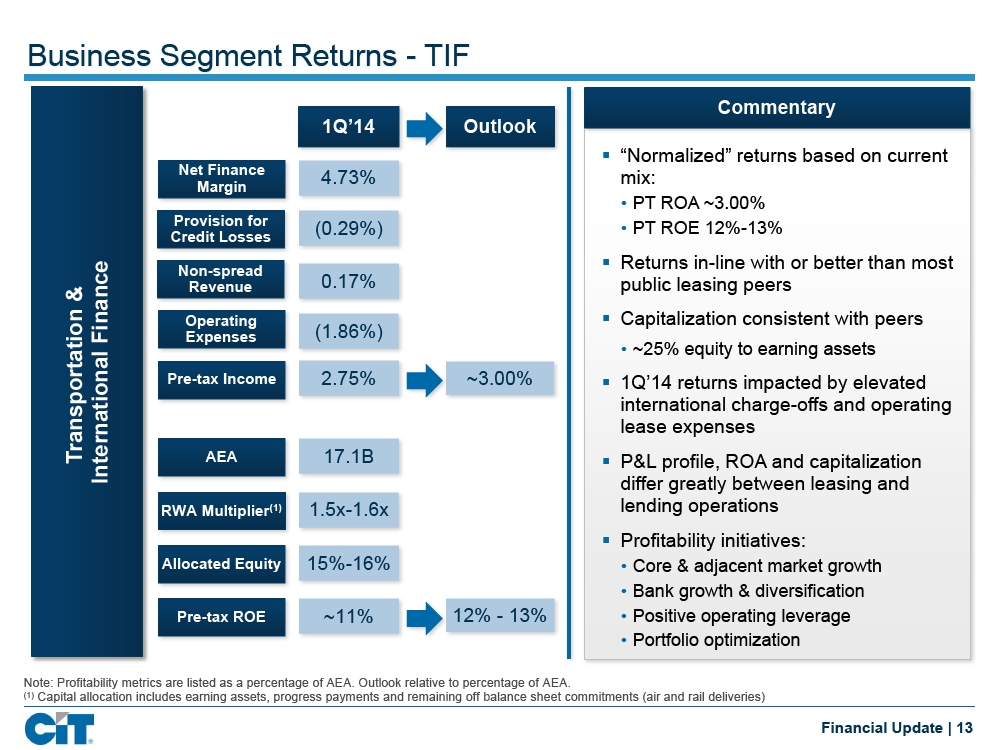
Business Segment Returns - TIF Commentary 1Q’14 Outlook § “Normalized” returns based on current Net Finance 4.73% mix: Margin • PT ROA ~3.00% Provision for (0.29%) • PT ROE 12%-13% Credit Losses § Returns in-line with or better than most Finance Non-spread Revenue 0.17% public leasing peers & Transportation Operating§ Capitalization consistent with peers Expenses (1.86%) • ~25% equity to earning assets International Pre-tax Income 2.75% ~3.00%§ 1Q’14 returns impacted by elevated international charge-offs and operating lease expenses AEA 17.1B§ P&L profile, ROA and capitalization differ greatly between leasing and RWA Multiplier(1)1.5x-1.6x lending operations§ Profitability initiatives: Allocated Equity 15%-16% • Core & adjacent market growth • Bank growth & diversification Pre-tax ROE ~11% 12% - 13% • Positive operating leverage • Portfolio optimization Note: Profitability metrics are listed as a percentage of AEA. Outlook relative to percentage of AEA.(1)Capital allocation includes earning assets, progress payments and remaining off balance sheet commitments (air and rail deliveries) Financial Update | 13
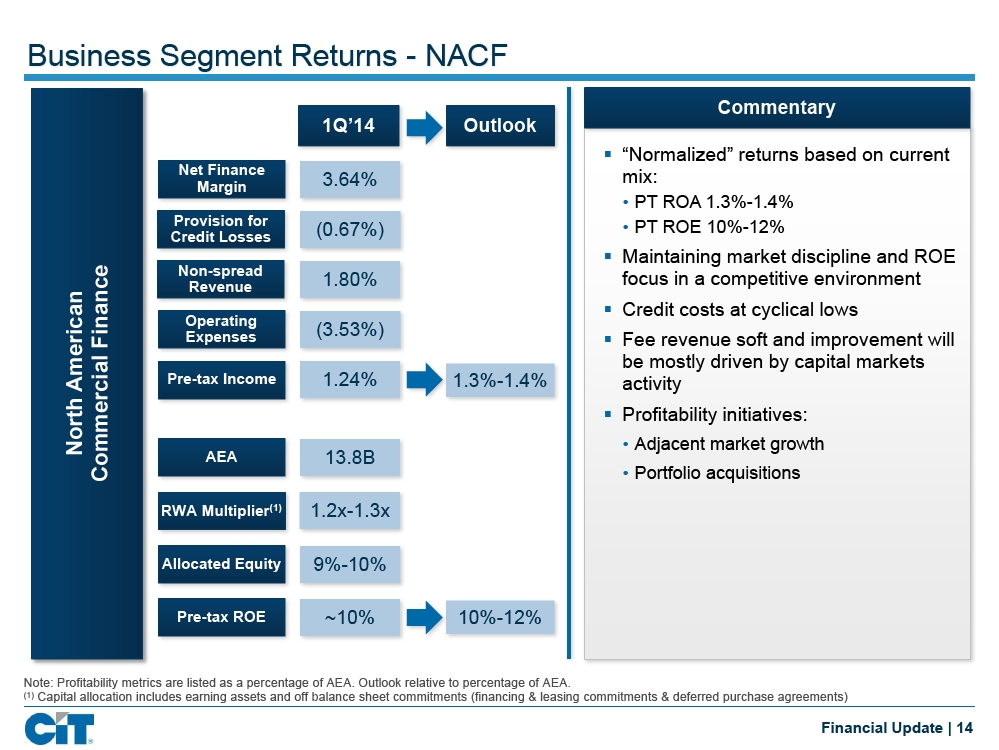
Business Segment Returns - NACF Commentary 1Q’14 Outlook § “Normalized” returns based on current Net Finance mix: Margin 3.64% • PT ROA 1.3%-1.4% Provision for • PT ROE 10%-12% Credit Losses (0.67%) § Maintaining market discipline and ROE Finance Non-spread focus in a competitive environment Revenue 1.80% § Credit costs at cyclical lows Operating Expenses (3.53%) § Fee revenue soft and improvement will be mostly driven by capital markets American Pre-tax Income 1.24% 1.3%-1.4% activity North§ Profitability initiatives: • Adjacent market growth AEA 13.8B Commercial • Portfolio acquisitions RWA Multiplier(1)1.2x-1.3x Allocated Equity 9%-10% Pre-tax ROE ~10% 10%-12% Note: Profitability metrics are listed as a percentage of AEA. Outlook relative to percentage of AEA.(1)Capital allocation includes earning assets and off balance sheet commitments (financing & leasing commitments & deferred purchase agreements) Financial Update | 14
![]()
Framework to Improve Pre-tax ROCE(1) 200-300bps 100+bps ~100bps Other Actions 100+bps Capital Growth Returns 12%+ ROA 9%-10% Improvement (ex. Growth) 6% 1Q '14 Pre-tax ROCE Near-term Outlook Pre-tax ROCE Pre-tax ROCE § Asset mix and productivity § Portfolio acquisitions and Growth§ Asset growth at ROE hurdle M&A activity§ Earnings growth§ Additional capital return Other above industry payout range Actions § Optimize capital structure§ Announced capital actions (preferred, sub-debt) Capital for 2014 § Enhance cash and Returns§ 2015 capital returns at investment portfolio returns industry average payout(1)ROCE = Return on book common equity. Assumes no reversal of the valuation allowance. Financial Update | 15
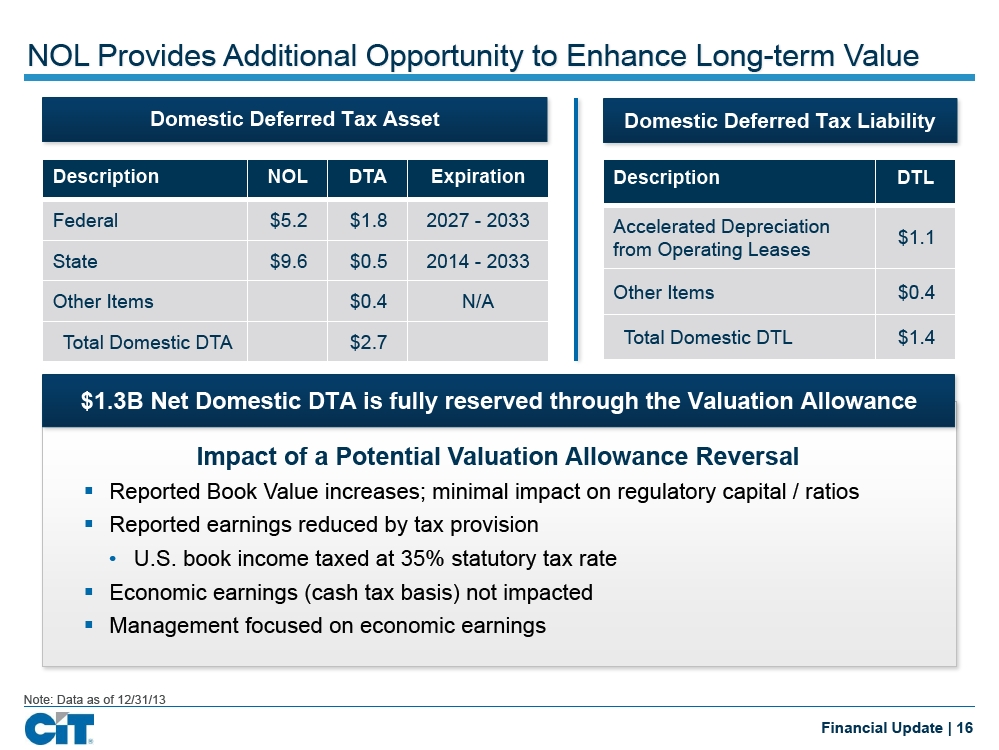
NOL Provides Additional Opportunity to Enhance Long-term Value Domestic Deferred Tax Asset Domestic Deferred Tax Liability Description NOL DTA Expiration Description DTL Federal $5.2 $1.8 2027 - 2033 Accelerated Depreciation $1.1 from Operating Leases State $9.6 $0.5 2014 - 2033 Other Items $0.4 Other Items $0.4 N/A Total Domestic DTA $2.7 Total Domestic DTL $1.4 $1.3B Net Domestic DTA is fully reserved through the Valuation Allowance Impact of a Potential Valuation Allowance Reversal § Reported Book Value increases; minimal impact on regulatory capital / ratios§ Reported earnings reduced by tax provision • U.S. book income taxed at 35% statutory tax rate§ Economic earnings (cash tax basis) not impacted§ Management focused on economic earnings Note: Data as of 12/31/13 Financial Update | 16
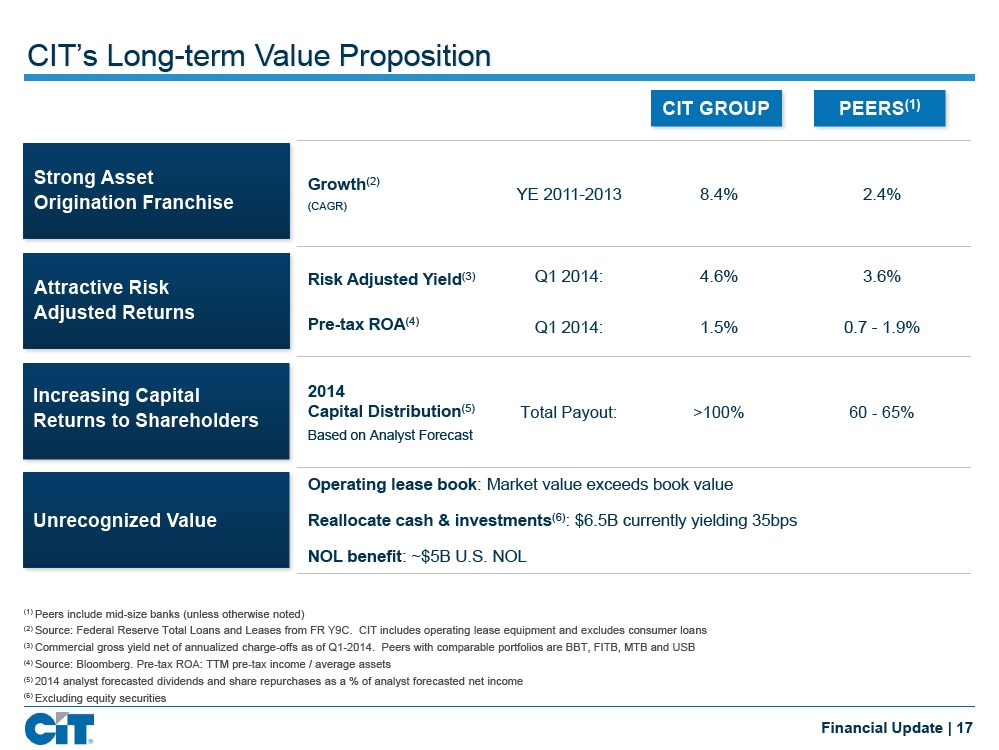
CIT’s Long-term Value Proposition CIT GROUP PEERS(1) Strong Asset Growth(2) Origination Franchise YE 2011-2013 8.4% 2.4% (CAGR) Risk Adjusted Yield(3)Q1 2014: 4.6% 3.6% Attractive Risk Adjusted Returns Pre-tax ROA(4)Q1 2014: 1.5% 0.7 - 1.9% Increasing Capital 2014 Capital Distribution(5)Total Payout: >100% 60 - 65% Returns to Shareholders Based on Analyst Forecast Operating lease book: Market value exceeds book value Unrecognized Value Reallocate cash & investments(6): $6.5B currently yielding 35bps NOL benefit: ~$5B U.S. NOL(1)Peers include mid-size banks (unless otherwise noted)(2)Source: Federal Reserve Total Loans and Leases from FR Y9C. CIT includes operating lease equipment and excludes consumer loans(3)Commercial gross yield net of annualized charge-offs as of Q1-2014. Peers with comparable portfolios are BBT, FITB, MTB and USB(4)Source: Bloomberg. Pre-tax ROA: TTM pre-tax income / average assets(5)2014 analyst forecasted dividends and share repurchases as a % of analyst forecasted net income(6)Excluding equity securities Financial Update | 17

Appendix
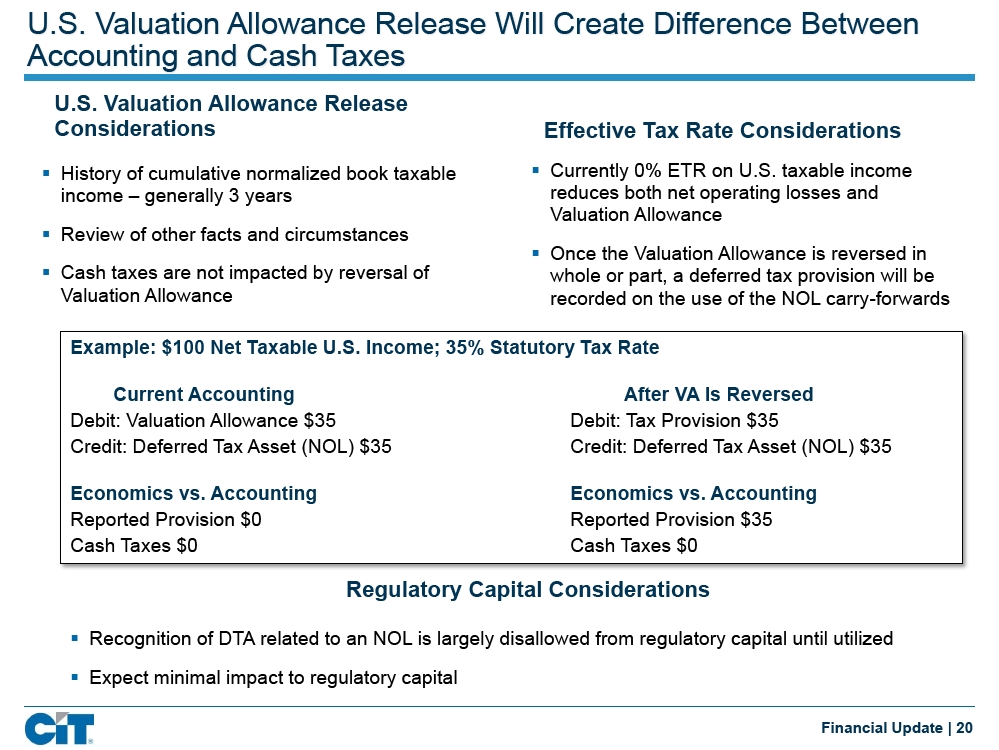
U.S. Valuation Allowance Release Will Create Difference Between Accounting and Cash Taxes U.S. Valuation Allowance Release Considerations Effective Tax Rate Considerations § History of cumulative normalized book taxable§ Currently 0% ETR on U.S. taxable income income – generally 3 years reduces both net operating losses and Valuation Allowance§ Review of other facts and circumstances§ Once the Valuation Allowance is reversed in§ Cash taxes are not impacted by reversal of whole or part, a deferred tax provision will be Valuation Allowance recorded on the use of the NOL carry-forwards Example: $100 Net Taxable U.S. Income; 35% Statutory Tax Rate Current Accounting After VA Is Reversed Debit: Valuation Allowance $35 Debit: Tax Provision $35 Credit: Deferred Tax Asset (NOL) $35 Credit: Deferred Tax Asset (NOL) $35 Economics vs. Accounting Economics vs. Accounting Reported Provision $0 Reported Provision $35 Cash Taxes $0 Cash Taxes $0 Regulatory Capital Considerations § Recognition of DTA related to an NOL is largely disallowed from regulatory capital until utilized§ Expect minimal impact to regulatory capital Financial Update | 20
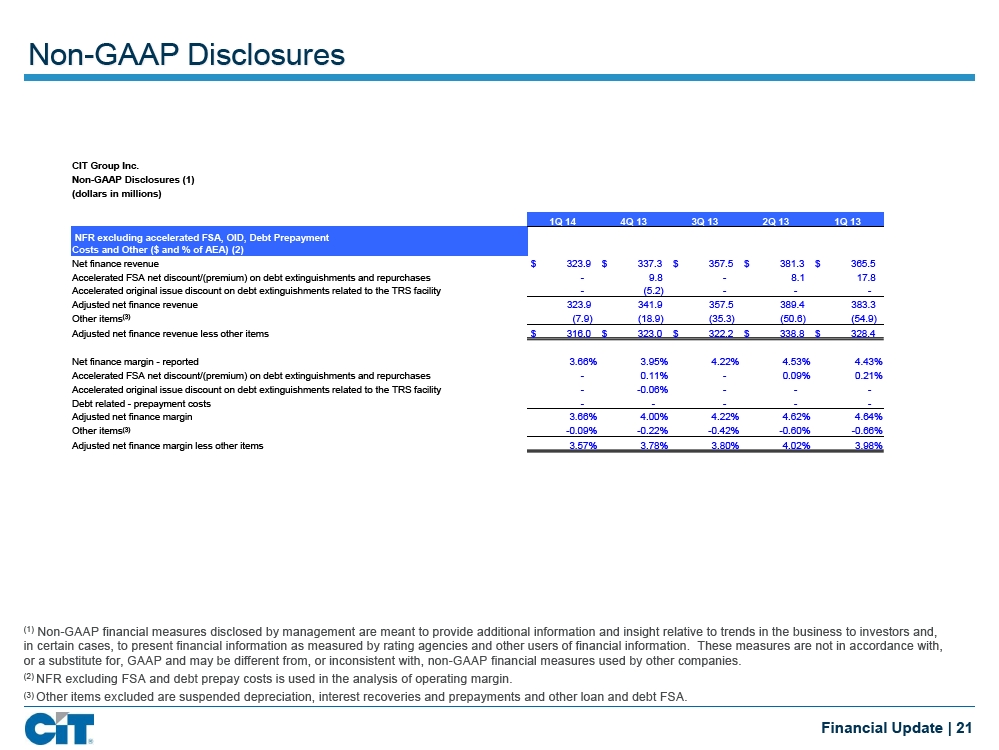
Non-GAAP Disclosures CIT Group Inc. Non-GAAP Disclosures (1) (dollars in millions) 1Q 14 4Q 13 3Q 13 2Q 13 1Q 13 NFR excluding accelerated FSA, OID, Debt Prepayment Costs and Other ($ and % of AEA) (2) Net finance revenue $ 323.9 $ 337.3 $ 357.5 $ 381.3 $ 365.5 Accelerated FSA net discount/(premium) on debt extinguishments and repurchases - 9.8 - 8.1 17.8 Accelerated original issue discount on debt extinguishments related to the TRS facility- (5.2) - - -Adjusted net finance revenue 323.9 341.9 357.5 389.4 383.3 Other items(3)(7.9) (18.9) (35.3) (50.6) (54.9)Adjusted net finance revenue less other items$ 316.0 $ 323.0 $ 322.2 $ 338.8 $ 328.4 Net finance margin - reported 3.66% 3.95% 4.22% 4.53% 4.43% Accelerated FSA net discount/(premium) on debt extinguishments and repurchases - 0.11% - 0.09% 0.21% Accelerated original issue discount on debt extinguishments related to the TRS facility - -0.06% - - -Debt related - prepayment costs- - - - -Adjusted net finance margin 3.66% 4.00% 4.22% 4.62% 4.64% Other items(3)-0.09% -0.22% -0.42% -0.60% -0.66% Adjusted net finance margin less other items 3.57% 3.78% 3.80% 4.02% 3.98%(1)Non-GAAP financial measures disclosed by management are meant to provide additional information and insight relative to trends in the business to investors and, in certain cases, to present financial information as measured by rating agencies and other users of financial information. These measures are not in accordance with, or a substitute for, GAAP and may be different from, or inconsistent with, non-GAAP financial measures used by other companies.(2)NFR excluding FSA and debt prepay costs is used in the analysis of operating margin.(3)Other items excluded are suspended depreciation, interest recoveries and prepayments and other loan and debt FSA. Financial Update | 21
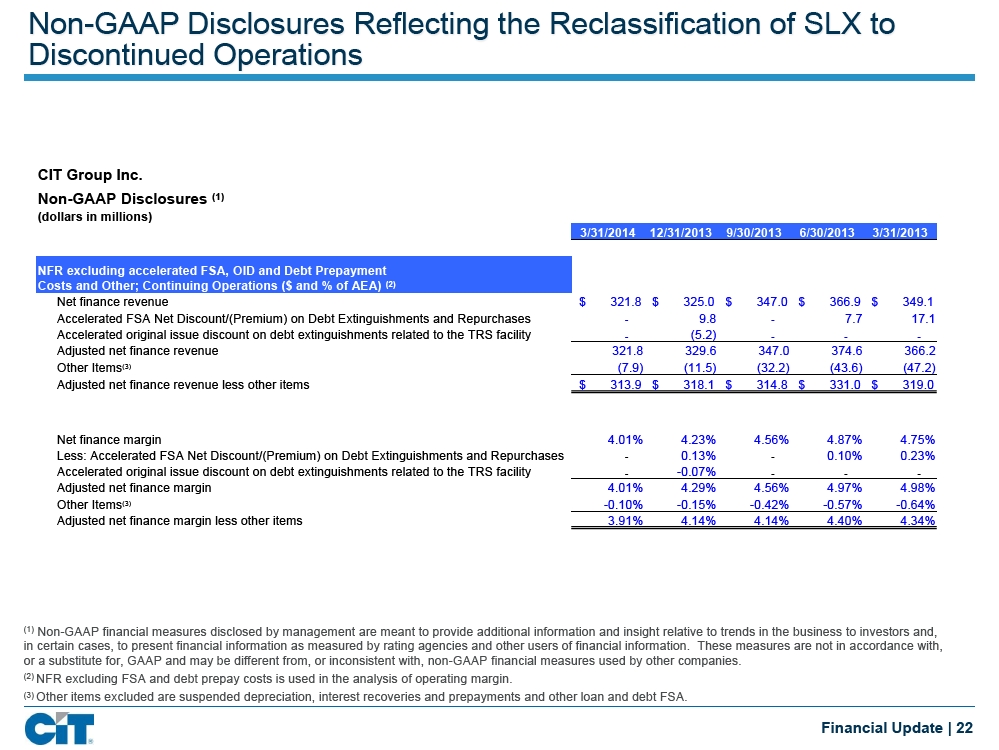
Non-GAAP Disclosures Reflecting the Reclassification of SLX to Discontinued Operations CIT Group Inc. Non-GAAP Disclosures(1)(dollars in millions) 3/31/2014 12/31/2013 9/30/2013 6/30/2013 3/31/2013 NFR excluding accelerated FSA, OID and Debt Prepayment Costs and Other; Continuing Operations ($ and % of AEA)(2) Net finance revenue $ 321.8 $ 325.0 $ 347.0 $ 366.9 $ 349.1 Accelerated FSA Net Discount/(Premium) on Debt Extinguishments and Repurchases - 9.8 - 7.7 17.1 Accelerated original issue discount on debt extinguishments related to the TRS facility - (5.2) - - -Adjusted net finance revenue 321.8 329.6 347.0 374.6 366.2 Other Items(3)(7.9) (11.5) (32.2) (43.6) (47.2) Adjusted net finance revenue less other items$ 313.9 $ 318.1 $ 314.8 $ 331.0 $ 319.0 Net finance margin 4.01% 4.23% 4.56% 4.87% 4.75% Less: Accelerated FSA Net Discount/(Premium) on Debt Extinguishments and Repurchases - 0.13% - 0.10% 0.23% Accelerated original issue discount on debt extinguishments related to the TRS facility - -0.07% - - -Adjusted net finance margin 4.01% 4.29% 4.56% 4.97% 4.98% Other Items(3)-0.10% -0.15% -0.42% -0.57% -0.64% Adjusted net finance margin less other items 3.91% 4.14% 4.14% 4.40% 4.34%(1)Non-GAAP financial measures disclosed by management are meant to provide additional information and insight relative to trends in the business to investors and, in certain cases, to present financial information as measured by rating agencies and other users of financial information. These measures are not in accordance with, or a substitute for, GAAP and may be different from, or inconsistent with, non-GAAP financial measures used by other companies.(2)NFR excluding FSA and debt prepay costs is used in the analysis of operating margin.(3)Other items excluded are suspended depreciation, interest recoveries and prepayments and other loan and debt FSA. Financial Update | 22
Glossary of Terms Average Earning Assets (AEA) is computed using month end balances and is the average of finance receivables (defined below), operating lease equipment, and financing and leasing assets held for sale, less the credit balances of factoring clients. We use this average for certain key profitability ratios, including Gross Yield, Net Yield, Net Finance Margin and return on AEA. Average Finance Receivables (AFR) is computed using month end balances and is the average of finance receivables (defined below). It excludes operating lease equipment. We use this average to measure the rate of net charge-offs for the period. Finance receivables (FR) include loans, capital lease receivables and factoring receivables. In certain instances, we use the term “Loans” synonymously, as presented on the balance sheet. Financing and Leasing Assets (F&LA) include finance receivables, operating lease equipment and assets held for sale. Fresh Start Accounting (FSA) was adopted upon emergence from bankruptcy. FSA recognizes that CIT has a new enterprise value following its emergence from bankruptcy and required asset values to be remeasured using fair value in accordance with accounting requirements for business combinations. The excess of reorganization value over the fair value of tangible and intangible assets was recorded as goodwill. In addition, FSA also required all liabilities, other than deferred taxes, be stated at fair value. Deferred taxes were determined in conformity with accounting requirements for Income Taxes. Gross Yield includes rental income and interest income as a % of AEA. Held for Sale (HFS) describes assets that we intend to sell in the near-term. These are carried at the lower of cost or market. Net Finance Margin (NFM) reflects Net Finance Revenue (defined below) divided by AEA. Net Finance Margin ‘Core’ – NFM adjusted for suspended depreciation, interest recoveries/prepayment, accelerated FSA debt & OID and other loan and debt FSA. Net Finance Revenue (NFR) reflects Net Interest Revenue (defined below) plus rental income on operating leases less depreciation on operating lease equipment and maintenance & operating lease expenses, which are direct costs of equipment ownership. Net Interest Revenue reflects interest and fees on finance receivables and interest/dividends on investments less interest expense on deposits and long-term borrowings. Return on Common Equity (ROCE) is net income available to common stockholders, expressed as a percentage of average common equity, and is a key measurement of profitability. Risk Weighted Assets (RWA) is the denominator to which Total Capital and Tier 1 Capital is compared to derive the respective regulatory ratios. RWA is comprised of both on-balance sheet assets and certain off-balance sheet items (for example loan commitments, purchase commitments or derivative contracts), all of which are adjusted by certain risk-weightings as defined by the regulators, which are based upon, among other things, the relative credit risk of the counterparty. Tier 1 Capital and Tier 2 Capital are regulatory capital as defined in the capital adequacy guidelines issued by the Federal Reserve. Tier 1 Capital is Total Stockholders Equity reduced by goodwill and intangibles and adjusted by elements of other comprehensive income and other items. Tier 2 Capital consists of, among other things, other preferred stock that does not qualify as Tier 1, mandatory convertible debt, limited amounts of subordinated debt, other qualifying term debt, and allowance for credit losses up to 1.25% of risk weighted assets. Total Capital is the sum of Tier 1 and Tier 2 capital, subject to certain adjustments, as applicable.Other Commonly Used Acronyms NACF – North American Commercial Finance SLX – Student Loan Portfolio NSP – Non-Strategic Portfolios TIF – Transportation & International Finance SBL – Small Business Lending Financial Update | 23