Exhibit 99.1

® Barclays 2014 Global Financial Services Conference John Thain, Chairman & Chief Executive Officer Scott Parker, Executive Vice President, Chief Financial Officer September 9 , 2014
1 Important Notices This presentation contains forward - looking statements within the meaning of applicable federal securities laws that are based upon our current expectations and assumptions concerning future events, which are subject to a number of risks and uncertainties that could cause actual results to differ materially from those anticipated . The words “expect,” “anticipate,” “estimate,” “forecast,” “initiative,” “objective,” “plan,” “goal,” “project,” “outlook,” “priorities,” “target,” “intend,” “evaluate,” “pursue,” “commence,” “seek,” “may,” “would,” “could,” “should,” “believe,” “potential,” and “continue,” or the negative of any of those words or similar expressions are intended to identify forward - looking statements . All statements contained in this presentation, other than statements of historical fact, including without limitation, statements about our plans, strategies, prospects and expectations regarding future events and our financial performance, are forward - looking statements that involve certain risks and uncertainties . While these statements represent our current judgment on what the future may hold, and we believe these judgments are reasonable, these statements are not guarantees of any events or financial results, and our actual results may differ materially . Important factors that could cause our actual results to be materially different from our expectations include, among others, the risk that CIT is unsuccessful in implementing its strategy and business plan, the risk that CIT is unable to react to and address key business and regulatory issues, the risk that CIT is unable to achieve the projected revenue growth from its new business initiatives or the projected expense reductions from efficiency improvements, the risk that CIT is delayed in implementing its branch strategy, and the risk that CIT becomes subject to liquidity constraints and higher funding costs . We describe these and other risks that could affect our results in Item 1 A, “Risk Factors,” of our latest Annual Report on Form 10 - K for the year ended December 31 , 2013 , which was filed with the Securities and Exchange Commission . Accordingly, you should not place undue reliance on the forward - looking statements contained in this presentation . These forward - looking statements speak only as of the date on which the statements were made . CIT undertakes no obligation to update publicly or otherwise revise any forward - looking statements, except where expressly required by law . This presentation is to be used solely as part of CIT management’s continuing investor communications program . This presentation shall not constitute an offer or solicitation in connection with any securities .
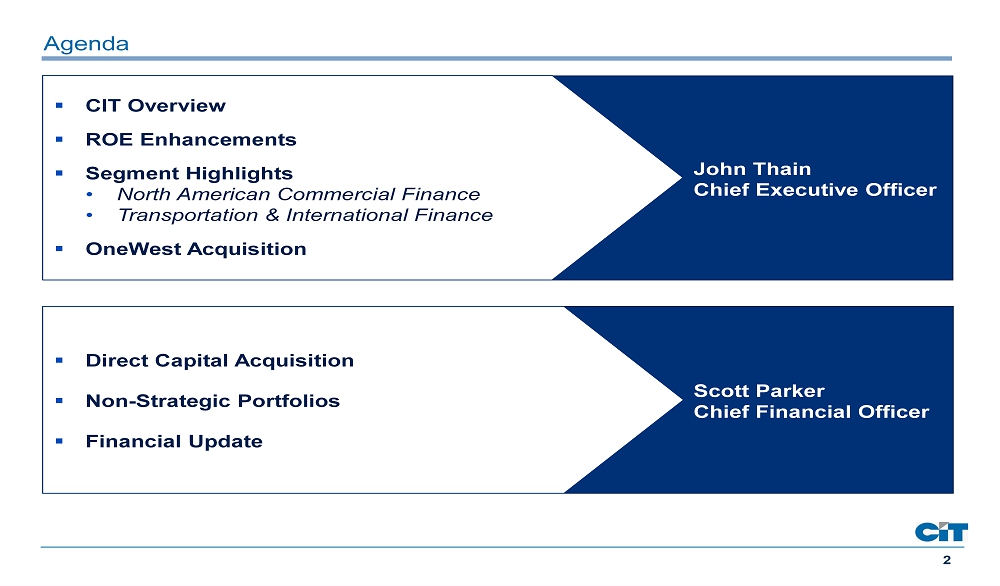
2 Agenda ▪ CIT Overview ▪ ROE Enhancements ▪ Segment Highlights • North American Commercial Finance • Transportation & International Finance ▪ OneWest Acquisition Scott Parker Chief Financial Officer ▪ Direct Capital Acquisition ▪ Non - Strategic Portfolios ▪ Financial Update John Thain Chief Executive Officer
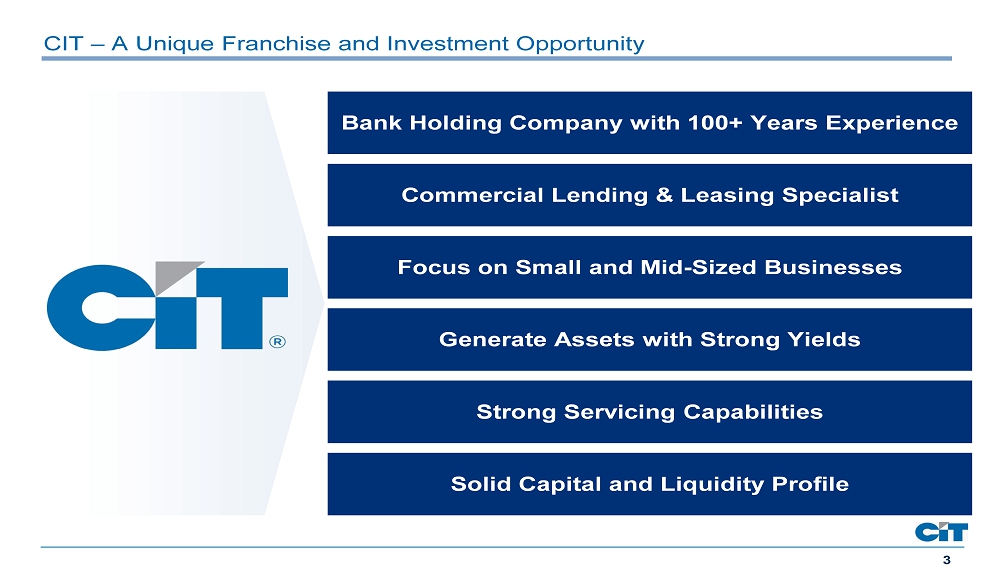
3 CIT – A Unique Franchise and Investment Opportunity Bank Holding Company with 100+ Years Experience Commercial Lending & Leasing Specialist Focus on Small and Mid - Sized Businesses Generate Assets with Strong Yields Strong Servicing Capabilities Solid Capital and Liquidity Profile
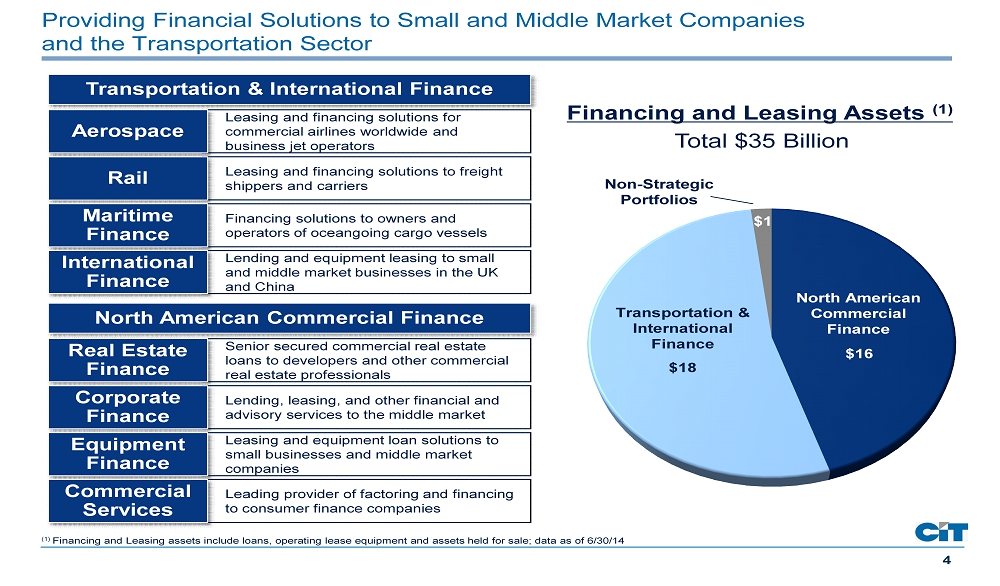
4 Providing Financial Solutions to Small and Middle Market Companies and the Transportation Sector (1) Financing and Leasing assets include loans, operating lease equipment and assets held for sale; data as of 6/30/14 Financing and Leasing Assets (1 ) Total $ 35 Billion Leasing and financing solutions for commercial airlines worldwide and business jet operators Aerospace $16 $18 $1 North American Commercial Finance Non - Strategic Portfolios Transportation & International Finance Transportation & International Finance Leasing and financing solutions to freight shippers and carriers Rail Financing solutions to owners and operators of oceangoing cargo vessels Maritime Finance Lending and equipment leasing to small and middle market businesses in the UK and China International Finance Senior secured commercial real estate loans to developers and other commercial real estate professionals Real Estate Finance North American Commercial Finance Lending, leasing, and other financial and advisory services to the middle market Corporate Finance Leasing and equipment loan solutions to small businesses and middle market companies Equipment Finance Leading provider of factoring and financing to consumer finance companies Commercial Services

5 Focus on Enhancing Return On Equity ▪ 15% y/y Financing and Leasing Asset Growth (TIF & NACF) ▪ Credit Metrics Remain Stable Grow Existing Businesses ▪ Real Estate Finance ▪ Maritime Finance ▪ Capital Equipment Finance Enhance Core Franchises with New Initiatives ▪ Flagstar - $1.3B Commercial Loan Portfolio 1Q’13 (1) ▪ Nacco - $0.65B European Rail P latform 1Q’14 ▪ Direct Capital - $0.5B Small/mid T icket E quipment 3Q’14 Buy Assets / Businesses ▪ Sold SBL and SLX in 2Q’14 ▪ ~$700M Remaining in NSP ▪ Additional Int’l Portfolio in TIF Moved into HFS in 2Q’14 Sell Non - Strategic or Underperforming Businesses ▪ Assets Surpassed $ 18B ▪ Deposits Approaching $14B ▪ Announced Acquisition of OneWest Grow CIT Bank ▪ $1.3B Total Share Repurchase Authorization since May ’13 ▪ Repurchased ~$750M of S hares as of 2Q‘14 ▪ Quarterly Dividend R einstated in 4Q’13 and Increased to $ 0.15 / Share in 3Q’14 Return Capital Note: Data as of 6/30/14 (1) $1.3B represented total loan commitment amount; $ 7 00M was currently outstanding as of the acquisition

6 Business Segment – North American Commercial Finance *Excludes debt refinancing costs Note: Data is as of 6/30/14 Asset Growth Highlights Profitability Highlights ▪ 10% year over year asset growth ▪ CIT Bank assets ~$12B, ~75% of total lending and leasing assets ▪ Solid origination volumes ▪ Low double - digit pre - tax ROE on economic capital ▪ Stable credit metrics ▪ Quarterly earnings variability Pre - tax Income ($M)* Pre - tax Return on Assets* Portfolio Assets ($B) 6.2% 2.9% 1.9% 2012 2013 1H '14 13.3 15.0 15.7 2012 2013 2Q '14 703 373 135 2012 2013 1H '14

7 3.3% 3.7% 2.9% 2012 2013 1H '14 14.9 16.4 18.4 2012 2013 2Q '14 466 578 259 2012 2013 1H '14 Business Segment – Transportation & International Finance Asset Growth Highlights Profitability Highlights ▪ 19% year over year asset growth ▪ Broad based growth in all Transportation divisions ▪ CIT Bank assets $3.5B, including four aircraft operating leases ▪ Low double - digit pre - tax ROE on economic capital ▪ High level of aircraft renewals in 2014 creating some near term pressure ▪ Solid utilization; Air over 99%, Rail over 98% ▪ Strong order book Pre - tax Income ($M)* Pre - tax Return on Assets* Portfolio Assets ($B) *Excludes debt refinancing costs Note: Data is as of 6/30/14
® Acquisition of OneWest Creating a Commercial Bank for the Middle Market
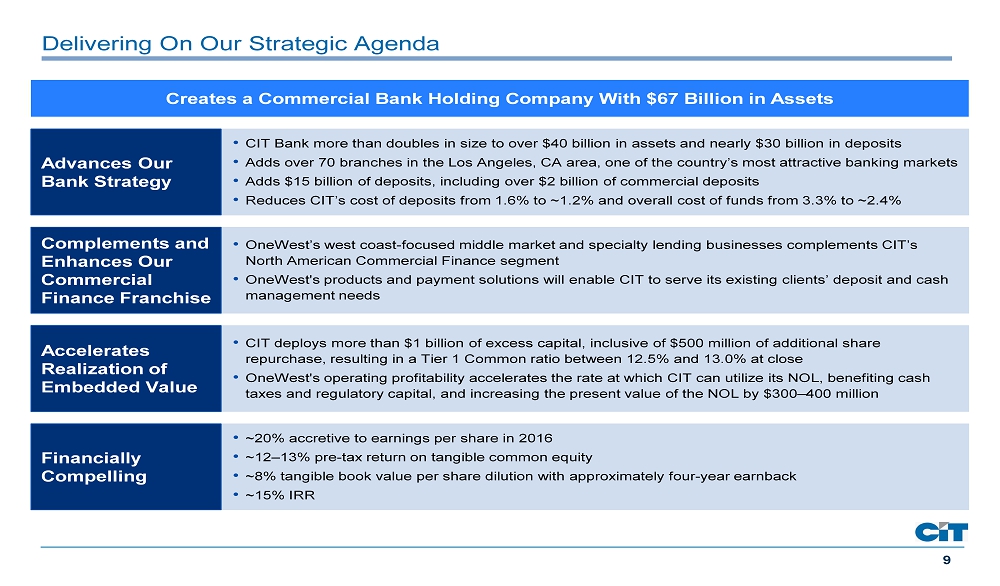
9 Delivering On Our Strategic Agenda • OneWest’s west coast - focused middle market and specialty lending businesses complements CIT’s North American Commercial Finance segment • OneWest's products and payment solutions will enable CIT to serve its existing clients’ deposit and cash management needs • CIT deploys more than $1 billion of excess capital, inclusive of $500 million of additional share repurchase, resulting in a Tier 1 Common ratio between 12.5% and 13.0% at close • OneWest's operating profitability accelerates the rate at which CIT can utilize its NOL, benefiting cash taxes and regulatory capital, and increasing the present value of the NOL by $300 – 400 million • ~20% accretive to earnings per share in 2016 • ~12 – 13% pre - tax return on tangible common equity • ~8% tangible book value per share dilution with approximately four - year earnback • ~15% IRR • CIT Bank more than doubles in size to over $40 billion in assets and nearly $30 billion in deposits • Adds over 70 branches in the Los Angeles, CA area, one of the country’s most attractive banking markets • Adds $15 billion of deposits, including over $2 billion of commercial deposits • Reduces CIT’s cost of deposits from 1.6% to ~1.2% and overall cost of funds from 3.3% to ~2.4% Advances Our Bank Strategy Complements and Enhances Our Commercial Finance Franchise Accelerates Realization of Embedded Value Financially Compelling Creates a Commercial Bank Holding Company With $67 Billion in Assets
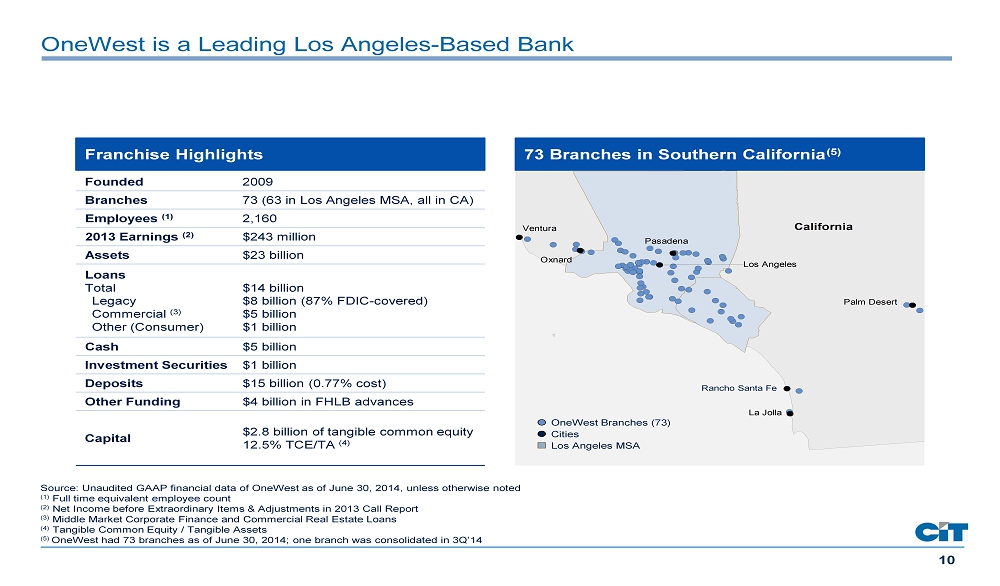
10 OneWest is a Leading Los Angeles - Based Bank Founded 2009 Branches 73 (63 in Los Angeles MSA, all in CA) Employees (1) 2,160 2013 Earnings (2) $243 million Assets $23 billion Loans Total Legacy Commercial (3) Other (Consumer) $14 billion $8 billion (87% FDIC - covered) $5 billion $1 billion Cash $5 billion Investment Securities $1 billion Deposits $15 billion (0.77% cost) Other Funding $4 billion in FHLB advances Capital $2.8 billion of tangible common equity 12.5% TCE/TA (4) Franchise Highlights Source: Unaudited GAAP financial data of OneWest as of June 30, 2014, unless otherwise noted (1) Full time equivalent employee count (2) Net Income before Extraordinary Items & Adjustments in 2013 Call Report (3) Middle Market Corporate Finance and Commercial Real Estate Loans (4) Tangible Common Equity / Tangible Assets (5) OneWest had 73 branches as of June 30, 2014; one branch was consolidated in 3Q’14 This map is saved in Dealworks folder 1601736 - 002 This map is saved in Dealworks folder 1601736 - 002 California Los Angeles Pasadena Rancho Santa Fe Oxnard Ventura San Diego Escondido Palm Desert La Jolla Nevada 73 Branches in Southern California (5) Rancho Santa Fe Cities Los Angeles MSA OneWest Branches ( 73)
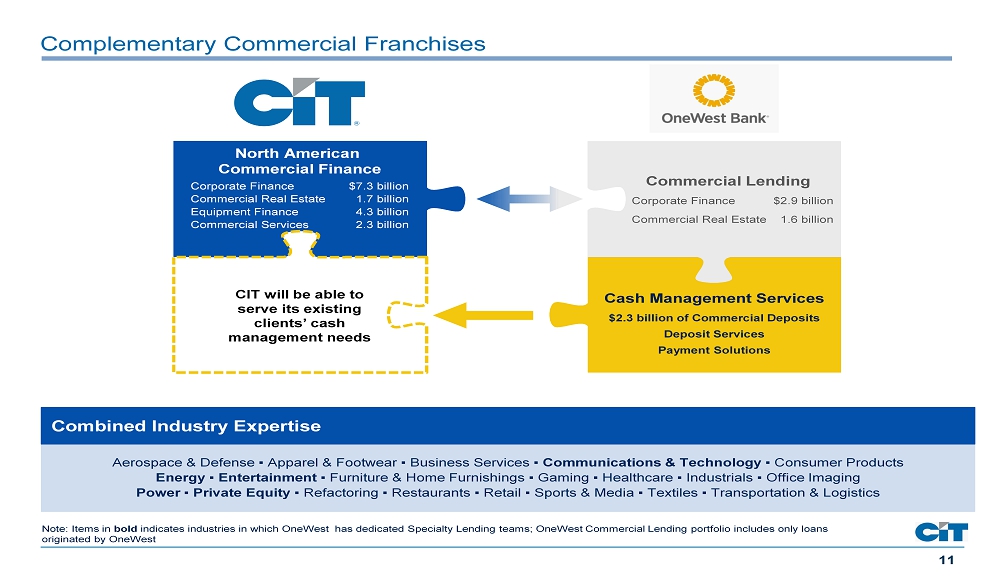
11 Complementary Commercial Franchises Aerospace & Defense ▪ Apparel & Footwear ▪ Business Services ▪ Communications & Technology ▪ Consumer Products Energy ▪ Entertainment ▪ Furniture & Home Furnishings ▪ Gaming ▪ Healthcare ▪ Industrials ▪ Office Imaging Power ▪ Private Equity ▪ Refactoring ▪ Restaurants ▪ Retail ▪ Sports & Media ▪ Textiles ▪ Transportation & Logistics Combined Industry Expertise Note: Items in bold indicates industries in which OneWest has dedicated Specialty Lending teams; OneWest Commercial Lending portfolio includes o nly loans originated by OneWest North American Commercial Finance Corporate Finance $7.3 billion Commercial Real Estate 1.7 billion Equipment Finance 4.3 billion Commercial Services 2.3 billion Commercial Lending Corporate Finance $2.9 billion Commercial Real Estate 1.6 billion Cash Management Services $2.3 billion of Commercial Deposits Deposit Services Payment Solutions CIT will be able to serve its existing clients’ cash management needs

12 ▪ Customer revenues : $20 - $750M+ ▪ Middle market credits from B to BB ▪ Typical deal size: ~$10 - $150M+ (up to $40M held) ▪ Primarily floating rate ▪ Terms of 1 to 6 years ▪ Typical single asset deal size: ~$15M to $40M; West Coast focus ▪ Loan pool financing: ~$20M to $150M ▪ Primarily floating rate lending; Typical term of 3 to 5 years ▪ First lien product with LTV of 65 - 70%; typically non - recourse Complementary Commercial Lending Franchises Commercial Real Estate (CRE) $4.3B $4.9B $5.2B Corporate Finance - Middle Market Lending $0.9 $1.4 $1.8 $2.2 $2.4 $2.8 $3.2 $3.8 $4.2 $4.5 Q1 Q2 Q3 Q4 Q1 Q2 Q3 Q4 Q1 Q2 Corporate Finance Commercial Real Estate Organic Commercial Loans (1) (1) Includes Cor porate Finance and Commercial Real Estate loans originated by OneWest ($ Billions) 2012 2014 2013 $1.6 $2.9

13 $0.2 $0.3 $0.6 $1.5 Q4 '11 Q4 '12 Q4 '13 Q2 '14 OneWest’s Banking Platform Has Experienced Strong Growth $0.5 $1.4 $1.6 $2.3 Q4 '11 Q4 '12 Q4 '13 Q2 '14 Organic Commercial Deposits (2) ($ Billions) Commercial Banking Consumer Banking ▪ Offers deposit products and cash management services to commercial customers ▪ Deposit solutions cross - sold to customers of our commercial loan groups as well as deposit - centric businesses with minimal borrowing needs ▪ Average cost of 0.27% in 1H’14 (1) ▪ Offers full suite of consumer deposit products ▪ Mortgage products offered through the retail banking channel as well as to wholesale customers and private banking clients ▪ M ortgage product expertise and servicing capabilities utilized to acquire mortgage pools (1) Represents non - CD Commercial Deposits (reflects YTD average cost of non - CD Commercial Checking and Business Money Market accounts) ( 2 ) Includes commercial checking accounts, money market accounts and CDs Consumer Banking Assets ($ Billions)

14 More Than Half of CIT's Total Assets Will Be in CIT Bank Source: Unaudited GAAP financial data of CIT and OneWest as of June 30, 2014 Note: Pro Forma column represents the sum of the CIT and OneWest data and is not reflective of any purchase accounting marks or merger adjust men ts (1) OneWest Commercial portfolio is consolidated into NA Commercial Finance CIT OneWest Pro Forma Loan and Lease Portfolio Bank 61% Non - Bank 39% Total Assets Bank 41% Non - Bank 59% Total: $67 billion Total: $44 billion NA Commercial Finance ( 1) 41% Transportation and International Finance 38% Legacy Portfolio 16% Non - Strategic Portfolios 1% Other 3% NA Commercial Finance 45% Transportation and International Finance 53% Non - Strategic Portfolios 2% Total: $49 billion Total: $35 billion Total: $23 billion Other 11% Commercial 32% Legacy Portfolio 57% Total: $14 billion Bank 99% Non - Bank <1%

15 CIT Will Be Majority Deposit Funded Source: Unaudited GAAP financial data of CIT and OneWest as of June 30, 2014 Note: Pro Forma column represents the sum of the CIT and OneWest data and is not reflective of any purchase accounting marks or merger adjustments CIT OneWest Pro Forma Deposits Total Funding Deposits 44% Unsecured debt 39% Secured debt 17% Total: $31 billion / Cost of Funds: 3.3% Online 54% Brokered 39% Other 7% Total: $14 billion / Cost of Deposits: 1.6% Branch 40% Online 27% Other 6% Commercial 8% Brokered 19% Deposits 57% Unsecured debt 24% Secured debt 11% FHLB 8% Total: $50 billion / Cost of Funds: ~2.4% Total: $28 billion / Cost of Deposits: ~1.2% Branch 77% Online 2% Other 5 % Commercial 16% Deposits 78% FHLB 22% Total: $19 billion / Cost of Funds: 0.8% Total: $15 billion / Cost of Deposits: 0.8%

® Direct Capital Acquisition Non - Strategic Portfolios Financial Update Scott Parker Executive Vice President, Chief Financial Officer
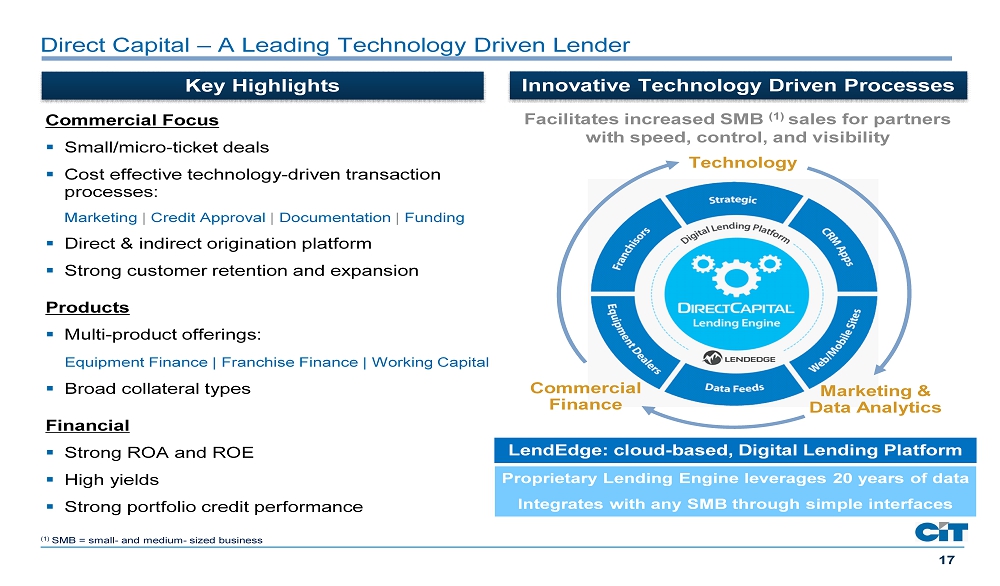
17 Direct Capital – A Leading Technology Driven Lender Key Highlights Commercial Focus ▪ Small/micro - ticket deals ▪ Cost effective technology - driven transaction processes: Marketing | Credit Approval | Documentation | Funding ▪ Direct & indirect o rigination platform ▪ Strong customer retention and expansion Products ▪ Multi - product offerings: Equipment Finance | Franchise Finance | Working Capital ▪ Broad collateral types Financial ▪ Strong ROA and ROE ▪ High yields ▪ Strong portfolio c redit p erformance LendEdge: cloud - based, Digital Lending Platform Innovative Technology Driven Processes Facilitates increased SMB (1) sales for partners with speed, control, and visibility Commercial Finance Marketing & Data Analytics Technology Proprietary Lending Engine leverages 20 years of data Integrates with any SMB through simple interfaces (1) SMB = small - and medium - sized business

18 Leveraging Direct Capital for CIT’s Growth Immediate Value Longer Term Opportunity Large - Ticket Mid/ Small - Ticket Micro / Small - Ticket Capital Equipment Finance Equipment Finance, US Equipment Finance, Canada Technology Driven Business Model Accretive to earnings Direct originations model Improves vendor / franchise financing model Creates more customized financial offering Utilizes CIT Bank Completes CIT’s Equipment Finance offerings: Leverage LendEdge: Maximize available credit to clients across Equipment Finance Leverage data & technology to cross - sell and increase customer share of wallet Utilize Direct Capital model to improve client retention/expansion across CIT Leverage Direct Capital’s innovative development team to improve efficiency 1 2 3 4

19 0.5 0.2 Exiting Non - Strategic Portfolios to Improve ROE 0.4 3.3 0.5 0.2 Finance and Leasing Assets (1) Total $4.4B (as of 3/31/14) (1) Financing and leasing assets include loans, operating lease equipment and assets held for sale Exit Latin America and Europe by the end of 2014 Platform (i.e. Brazil) requiring regulatory approval may drift into 1H’15 Additional $0.5B International portfolio moved into HFS in 2Q’14 ($ Billions) SLX Latin America SBL Europe Finance and Leasing Assets (1) Total $ 0.7 B (as of 6/30/14) ($ Billions) Latin America Europe

20 ($ Billions ) Financing and Leasing Assets Solid Asset Growth (1) 26.8 27.6 27.2 28.1 25.9 13.9 14.7 16.1 16.8 18.3 40.7 42.3 43.3 44.9 44.2 25% 30% 35% 40% 45% 0.0 10.0 20.0 30.0 40.0 50.0 Q2 '13 Q3 '13 Q4 '13 Q1 '14 Q2 '14 Total Assets Total Assets All Other Assets CIT Bank Assets CIT Bank Assets % of Total Assets CIT Bank Assets % to Total Assets 15.4 15.6 16.4 17.6 18.4 14.3 14.7 15.0 15.2 15.7 31.7 32.1 32.7 33.9 34.7 0.0 10.0 20.0 30.0 40.0 Q2 '13 Q3 '13 Q4 '13 Q1 '14 Q2 '14 TIF NACF NSP ( 1 ) Continuing operations
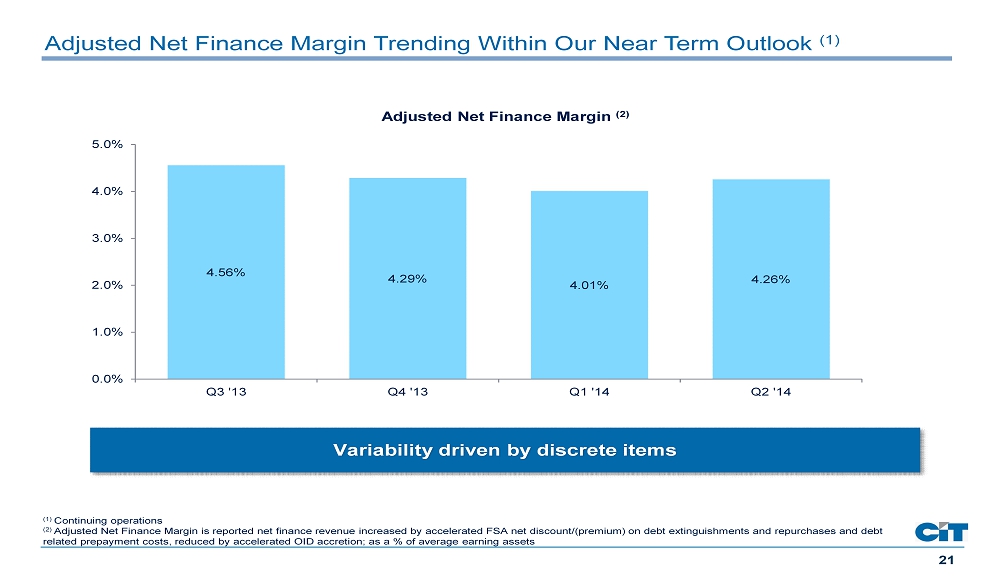
21 Adjusted Net Finance Margin Trending Within Our Near Term Outlook (1) 4.56% 4.29% 4.01% 4.26% 0.0% 1.0% 2.0% 3.0% 4.0% 5.0% Q3 '13 Q4 '13 Q1 '14 Q2 '14 Adjusted Net Finance Margin (2) ( 1 ) Continuing operations (2) Adjusted Net Finance Margin is reported net finance revenue increased by accelerated FSA net discount/(premium) on debt extinguishments and repurchases and debt related prepayment costs, reduced by accelerated OID accretion; as a % of average earning assets Variability driven by discrete items

22 Credit Metrics Remain at Cycle Lows (1) ($ Millions) 279 258 241 218 190 0.0% 0.3% 0.6% 0.9% 1.2% 1.5% 0 50 100 150 200 250 300 Q2 '13 Q3 '13 Q4 '13 Q1 '14 Q2 '14 Net Charge - offs % to AFR Non – accrual Loans Non - accrual Loans & Net Charge - offs Non-accrual Loans Net Charge-offs % to AFR 367 356 356 353 341 1.5% 1.7% 1.9% 2.1% 2.3% 2.5% 2.7% 2.9% 0 50 100 150 200 250 300 350 400 450 500 Q2 '13 Q3 '13 Q4 '13 Q1 '14 Q2 '14 Allowance for Loan Losses % to FR Allowance for Loan Losses Allowance for Loan Losses Allowance for Loan Losses Allowance for Loan Losses % to FR (2) (1) Continuing operations (2) Q2’14 , Q1’14, Q4’13, Q3’13 and Q2’13 include approximately $12 million, $14 million, $5 million, $12 million and $21 million , r espectively, of charge - offs related to the transfer of loans to held for sale; exclusive of these charge - offs, net charge - offs as a % to AFR would have been 21 bps, 46 bps , 23 bps, 32 bps and 17 bps, respectively
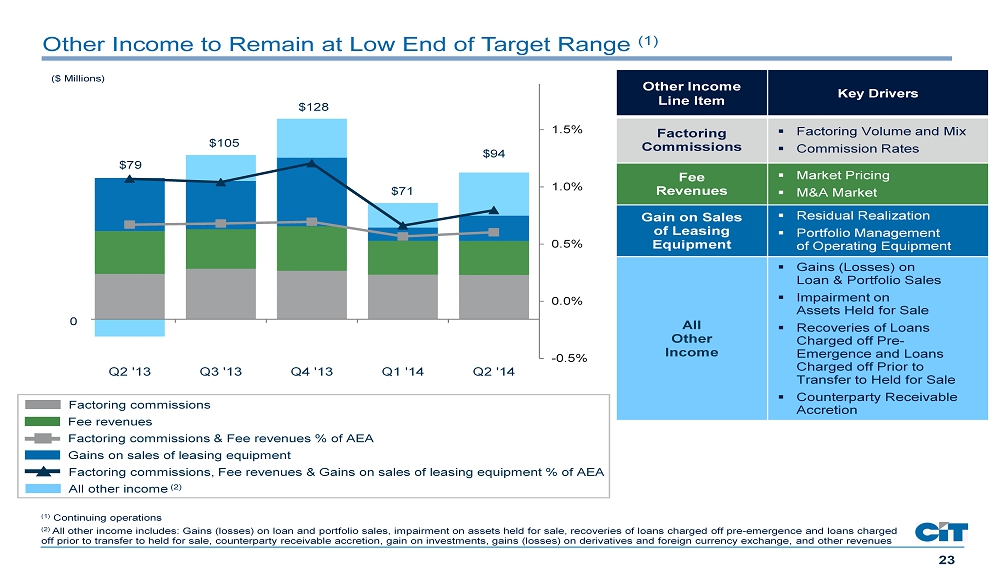
23 Other Income to Remain at Low End of Target Range (1) (1) Continuing operations (2) All other income includes: Gains (losses) on loan and portfolio sales, impairment on assets held for sale, recoveries of loans charged off pre - emergence and loans charged off prior to transfer to held for sale, counterparty receivable accretion, gain on investments, gains (losses ) on derivatives and foreign currency exchange, and other revenues -0.5% 0.0% 0.5% 1.0% 1.5% -25 0 25 50 75 100 125 150 Q2 '13 Q3 '13 Q4 '13 Q1 '14 Q2 '14 $94 0 $ 79 $105 $128 $71 Factoring commissions Fee revenues Gains on sales of leasing equipment All other income (2) Factoring commissions & Fee revenues % of AEA Factoring commissions, Fee revenues & Gains on sales of leasing equipment % of AEA Other Income Line Item Key Drivers Factoring Commissions ▪ Factoring Volume and Mix ▪ Commission Rates Fee Revenues ▪ Market Pricing ▪ M&A Market Gain on Sales of Leasing Equipment ▪ Residual Realization ▪ Portfolio Management of Operating Equipment All Other Income ▪ Gains (Losses) on Loan & Portfolio Sales ▪ Impairment on Assets Held for Sale ▪ Recoveries of Loans Charged off Pre - Emergence and Loans Charged off Prior to Transfer to Held for Sale ▪ Counterparty Receivable Accretion ($ Millions)

24 208 213 211 210 205 226 229 284 234 225 2.88% 2.90% 2.87% 2.79% 2.64% 0.0% 0.5% 1.0% 1.5% 2.0% 2.5% 3.0% 3.5% 0.0 50.0 100.0 150.0 200.0 250.0 300.0 350.0 400.0 Q2 '13 Q3 '13 Q4 '13 Q1 '14 Q2 '14 Operating Expenses 24 Operating Expenses Improving (1) ($ Millions) % to AEA ex. Restructuring Charges Restructuring Charges All Other Operating Expenses Tax Agreement Settlement Deposit Related % of AEA ex. Restructuring Charges / Tax Settlement ( 1 ) Continuing operations

25 Profitability Metrics (1) (1) % of a verage e arning a ssets (2) Adjusted for debt refinancing costs 1Q’14 2Q’14 1H’14 Near - term Outlook (12 - 18 months) Net Finance Margin (2) 4.01% 4.26% 4.13% 3.75% - 4.25% Credit Provision (0.46%) (0.12%) (0.29%) (0.35%) – (0.75%) Other Income 0.89% 1.13% 1.01% 0.75% - 1.00% Operating Expenses (ex. restructuring) (2.79%) (2.64%) (2.71%) (2.00%) – (2.50%) Pre - tax Income (ROAEA) 1.53% 2.64% 2.09% ~2.00%

26 Improving Our Return on Tangible Common Equity Pro Forma - 2016 8.25% 12 - 13% Pre - tax ROATCE 1H ‘14 Pre - tax ROATCE Profitability Initiatives and Capital Returns Acquisition of OneWest VA Reversal (1) ( 1 ) A determination to reverse the Valuation Allowance (VA) requires a complex analysis, including but not limited to, an analysi s o f the reporting entities historical and forecast future earnings. As of 12/31/13, the domestic VA against our Deferred Tax Asset was approximately $1.3 billion. This chart is representative of a potential reversal of the full VA, which may or may not occur i n f ull or in part. The impact on pre - tax ROATCE will be dependent upon the actual amount of the VA reversed.

® Appendix
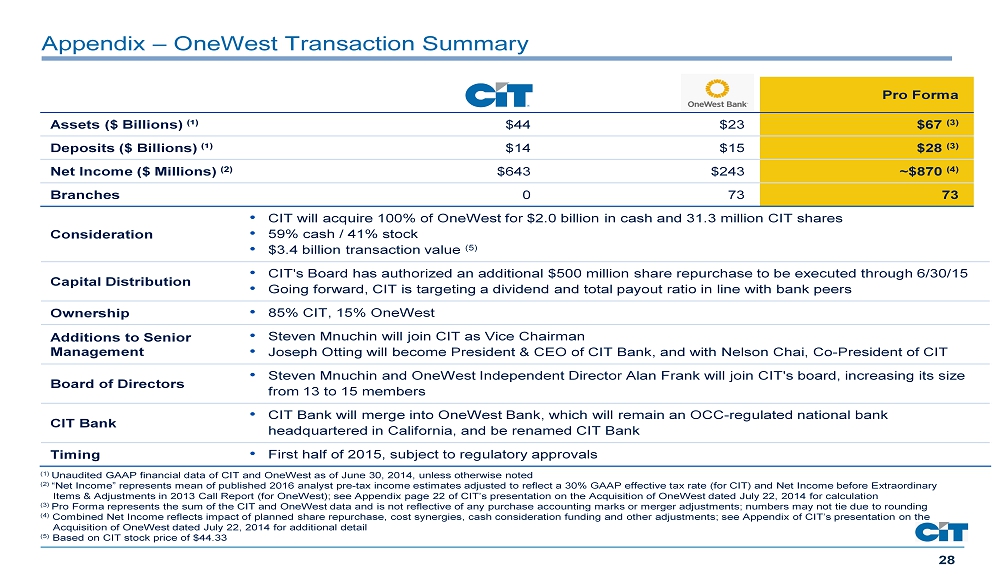
28 Consideration • CIT will acquire 100% of OneWest for $2.0 billion in cash and 31.3 million CIT shares • 59% cash / 41% stock • $3.4 billion transaction value (5) Capital Distribution • CIT's Board has authorized an additional $500 million share repurchase to be executed through 6/30/15 • Going forward, CIT is targeting a dividend and total payout ratio in line with bank peers Ownership • 85% CIT, 15% OneWest Additions to Senior Management • Steven Mnuchin will join CIT as Vice Chairman • Joseph Otting will become President & CEO of CIT Bank, and with Nelson Chai, Co - President of CIT Board of Directors • Steven Mnuchin and OneWest Independent Director Alan Frank will join CIT's board, increasing its size from 13 to 15 members CIT Bank • CIT Bank will merge into OneWest Bank, which will remain an OCC - regulated national bank headquartered in California, and be renamed CIT Bank Timing • First half of 2015, subject to regulatory approvals Pro Forma Assets ($ Billions) ( ¹ ) $44 $23 $67 (3) Deposits ($ Billions) ( ¹ ) $14 $15 $28 (3) Net Income ($ Millions) (2) $643 $243 ~$870 (4) Branches 0 73 73 (1) Unaudited GAAP financial data of CIT and OneWest as of June 30, 2014, unless otherwise noted (2) “Net Income” represents mean of published 2016 analyst pre - tax income estimates adjusted to reflect a 30% GAAP effective tax rat e (for CIT) and Net Income before Extraordinary Items & Adjustments in 2013 Call Report (for OneWest); see Appendix page 22 of CIT’s presentation on the Acquisition of OneWest dated July 22, 2014 for calculation (3) Pro Forma represents the sum of the CIT and OneWest data and is not reflective of any purchase accounting marks or merger adj ust ments; numbers may not tie due to rounding (4) Combined Net Income reflects impact of planned share repurchase, cost synergies, cash consideration funding and other adjustm ent s; see Appendix of CIT’s presentation on the Acquisition of OneWest dated July 22, 2014 for additional detail (5) Based on CIT stock price of $44.33 Appendix – OneWest Transaction Summary
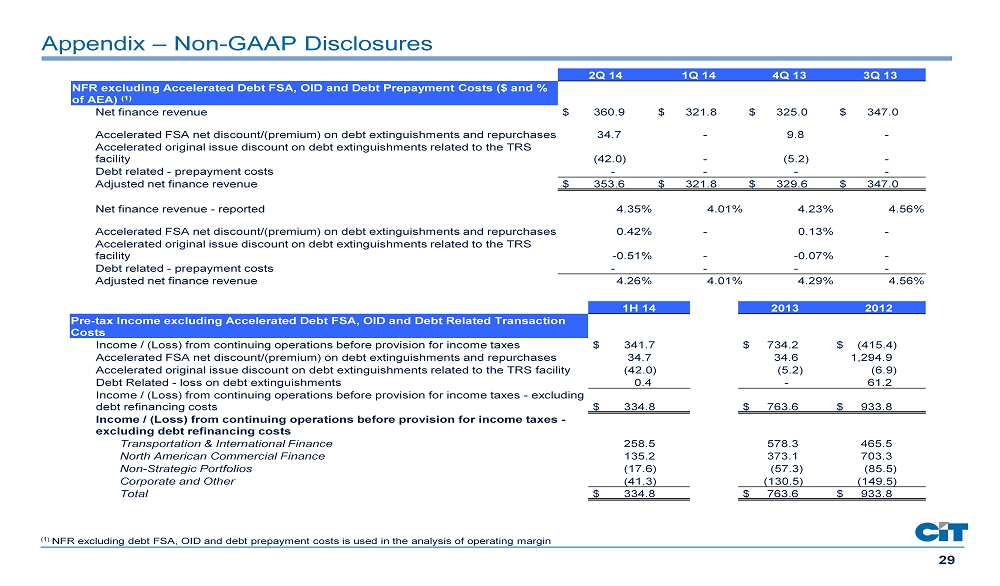
29 Appendix – Non - GAAP Disclosures (1) NFR excluding debt FSA, OID and debt prepayment costs is used in the analysis of operating margin 2Q 14 1Q 14 4Q 13 3Q 13 NFR excluding Accelerated Debt FSA, OID and Debt Prepayment Costs ($ and % of AEA) (1) Net finance revenue $ 360.9 $ 321.8 $ 325.0 $ 347.0 Accelerated FSA net discount/(premium) on debt extinguishments and repurchases 34.7 - 9.8 - Accelerated original issue discount on debt extinguishments related to the TRS facility (42.0) - (5.2) - Debt related - prepayment costs - - - - Adjusted net finance revenue $ 353.6 $ 321.8 $ 329.6 $ 347.0 Net finance revenue - reported 4.35% 4.01% 4.23% 4.56% Accelerated FSA net discount/(premium) on debt extinguishments and repurchases 0.42% - 0.13% - Accelerated original issue discount on debt extinguishments related to the TRS facility - 0.51% - - 0.07% - Debt related - prepayment costs - - - - Adjusted net finance revenue 4.26% 4.01% 4.29% 4.56% 1H 14 2013 2012 Pre - tax Income excluding Accelerated Debt FSA, OID and Debt Related Transaction Costs Income / (Loss) from continuing operations before provision for income taxes $ 341.7 $ 734.2 $ (415.4) Accelerated FSA net discount/(premium) on debt extinguishments and repurchases 34.7 34.6 1,294.9 Accelerated original issue discount on debt extinguishments related to the TRS facility (42.0) (5.2) (6.9) Debt Related - loss on debt extinguishments 0.4 - 61.2 Income / (Loss) from continuing operations before provision for income taxes - excluding debt refinancing costs $ 334.8 $ 763.6 $ 933.8 Income / (Loss) from continuing operations before provision for income taxes - excluding debt refinancing costs Transportation & International Finance 258.5 578.3 465.5 North American Commercial Finance 135.2 373.1 703.3 Non - Strategic Portfolios (17.6) (57.3) (85.5) Corporate and Other (41.3) (130.5) (149.5) Total $ 334.8 $ 763.6 $ 933.8
30 Barbara Callahan Senior Vice President 973 - 740 - 5058 barbara.callahan@cit.com Rahul Nalgirkar Director 973 - 422 - 3623 r ahul.nalgirkar@cit.com Appendix – CIT Investor Relations – Key Contacts Paulenier Sims Director 973 - 597 - 2622 paulenier.sims@cit.com