Exhibit 99.2

Fourth Quarter 2017 Earnings January 30, 2018

1 4Q17 Earnings This presentation contains forward - looking statements within the meaning of applicable federal securities laws that are based upon our current expectations and assumptions concerning future events, which are subject to a number of risks and uncertainties that could cause actual results to differ materially from those anticipated. The words “expect,” “anticipate,” “estimate,” “forecast,” “initiative,” “objective,” “plan,” “goal,” “project,” “outlook,” “priorities,” “target,” “intend,” “e val uate,” “pursue,” “commence,” “seek,” “may,” “would,” “could,” “should,” “believe,” “potential,” “continue,” or the negative of any o f those words or similar expressions is intended to identify forward - looking statements. All statements contained in this press release, other than statements of historical fact, including without limitation, statements about our plans, strategies, prospects and expectations regarding future events and our financial performance, are forward - looking statements that involve certain risks and uncertainties. While these statements represent our current judgment on what the future may hold, and we believe these judgments are reasonable, these statements are not guarantees of any events or financial results, and our actual results may differ materially. Important factors that could cause our actual results to be materially differen t from our expectations include, among others, the risk that (i) CIT is unsuccessful in implementing its strategy and business plan, (ii) CIT is unable to react to and address key business and regulatory issues, (iii) CIT is unable to achieve the projected revenue growth from its new business initiatives or the projected expense reductions from efficiency improvements, (iv) CIT becomes subject to liquidity constraints and higher funding costs, or (v) the parties to a transaction do not receive or satisfy regulatory or other approvals and conditions on a timely basis or approvals are subject to conditions that are not anticipated. We describe these and other risks that could affect our results in Item 1A, “Risk Factors,” of our latest Annual Report on Form 10 - K for the year ended December 31, 2016, which was filed with the Securities and Exchange Commission. Accordingly, you should not place undue reliance on the forward - looking statements contained in this press release. These forward - looking statements speak only as of the date on which the statements were made. CIT undertakes no obligation to update publicly or otherwise revise any forward - looking statements, except where expressly required by law. This presentation is to be used solely as part of CIT management’s continuing investor communications program. This presentation shall not constitute an offer or solicitation in connection with any securities. Important Notice

2 4Q17 Earnings Maximize Potential of Core Businesses Enhance Operational Efficiency 2 Maintain Strong Risk Management 5 Optimize Capital Structure 4 Reduce Funding Costs 2017 Progress Strategies 1 3 ▪ Grow revenues – grow core businesses, enhance fee revenue, leverage connectivity among businesses ▪ Optimize cash / investment portfolio build out x Sold Commercial Air, agreements to sell NACCO and Financial Freedom x Core portfolios (1) grew 2% Q/Q; flat Y/Y reflecting high prepayments and portfolio repositioning in Commercial Finance x Grew average investment securities by 58% ▪ Reduce / manage operating expenses ▪ Invest in, and enhance technology x Annual operating expenses (2) down ~$85 million from 2016 and remain on track to achieve remaining reduction target in 2018 x Preserved ~$470 million of NOL through strategic tax actions ▪ Increase deposits as a percent of total funding ▪ Reduce deposit costs x Reduced unsecured debt by $6.9 billion with an average rate of 5.15% x Deposits as a percent of funding grew by 9% to 77% ▪ Manage, deploy, and align capital ▪ Target CET1 ratio in the 10 - 11% range x Repurchased $3.4 billion of common stock at an average price of $47.84 x Issued $325 million of preferred stock at 5.8% x Increased quarterly dividend 7% to $0.16 ▪ Maintain credit and operating risk discipline / process ▪ Regulatory / horizontal capital review x Non - accruals 0.76% of total loans, down from 0.94% a year ago x CET1 ratio of 14.4% Executing on Our Priorities to Simplify, Strengthen and Grow CIT (1) Core portfolios excludes credit balances of factoring clients, NACCO AHFS, Legacy Consumer Mortgages, and NSP. (2) Operating expenses excluding noteworthy items and amortization of intangibles of $1.195 billion in 2016 and $1.109 bill ion in 2017.
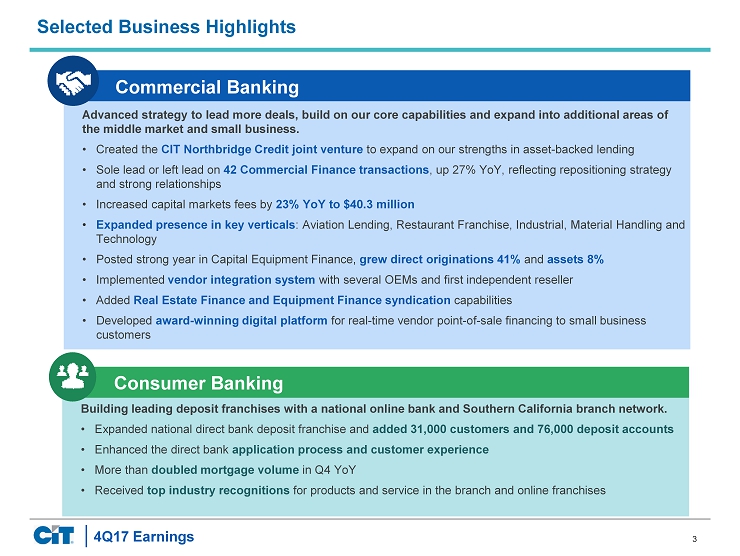
3 4Q17 Earnings Selected Business Highlights Advanced strategy to lead more deals, build on our core capabilities and expand into additional areas of the middle market and small business. • Created the CIT Northbridge Credit joint venture to expand on our strengths in asset - backed lending • Sole lead or left lead on 42 Commercial Finance transactions , up 27% YoY, reflecting repositioning strategy and strong relationships • Increased capital markets fees by 23% YoY to $40.3 million • Expanded presence in key verticals : Aviation Lending, Restaurant Franchise, Industrial, Material Handling and Technology • Posted strong year in Capital Equipment Finance , grew direct originations 41% and assets 8% • Implemented vendor integration system with several OEMs and first independent reseller • Added Real Estate Finance and Equipment Finance syndication capabilities • Developed award - winning digital platform for real - time vendor point - of - sale financing to small business customers Commercial Banking Building leading deposit franchises with a national online bank and Southern California branch network. • Expanded national direct bank deposit franchise and added 31,000 customers and 76,000 deposit accounts • Enhanced the direct bank application process and customer experience • More than doubled mortgage volume in Q4 YoY • Received top industry recognitions for products and service in the branch and online franchises Consumer Banking

4 4Q17 Earnings Highlights vs. Prior Quarter vs. Year - ago Quarter ▪ Net Finance Revenue: essentially flat; the current quarter includes a $9 million benefit from suspended depreciation on NACCO AHFS compared to an $8 million benefit in the prior quarter ▪ Other Non - Interest Income: increased $74 million; the current quarter includes a $29 million benefit in other revenues related to the cumulative effect of an accounting policy change for LIHTC investments and the prior quarter included charges related to noteworthy items totaling $27 million related to the Financial Freedom Transaction ▪ Operating Expenses: increased 10% from the prior quarter due to a $32 million restructuring charge ▪ Goodwill Impairment: $256 million mostly related to Equipment Finance in our Commercial Banking segment ▪ Provision for Credit Losses: reflected the establishment of reserves on asset growth in Commercial Banking ▪ Income Tax Provision: included an aggregate $26 million benefit from noteworthy items and an additional $22 million in discrete benefits; the prior quarter included a $140 million benefit from a noteworthy item related to the restructuring of an international legal entity ▪ Net Finance Revenue: declined 5% reflecting lower AEA, purchase accounting accretion and overall yield compression which was partially offset by lower interest expense ▪ Other Non - Interest Income: increased $255 million; the year - ago quarter included a TRS termination charge, partially offset by the Canadian portfolio gain on sale. The current quarter includes $29 million benefit related to the cumulative effect of an accounting policy change for LIHTC investments and BOLI income of $6 million ▪ Operating Expenses: declined 11%; the year - ago quarter included $27 million in charges from legacy One West matters ▪ Goodwill Impairment: in the year - ago quarter, we recognized $354 million in goodwill impairment charges, including a $319 million charge related to our Consumer Banking segment and a $35 million charge related to Commercial Services in our Commercial Banking segment. Current quarter reflects $256 million impairment related to Commercial Banking ▪ Provision for Credit Losses: declined 17% due to a decline in charge - offs ▪ Income Tax Provision: c urrent quarter includes $48 million in net discrete and noteworthy benefits; the benefit of $7 million in the year - ago quarter included a $54 million tax expense noteworthy item resulting from no longer asserting indefinite reinvestment of earnings in Canada Certain balances may not sum due to rounding. (1) Net of depreciation, maintenance, and other operating lease expenses. Change from ($ in millions, except per share data) 4Q17 3Q17 4Q16 3Q17 4Q16 $ % $ % Interest Income 448 454 474 (6) (1.4%) (26) (5.6%) Net Operating Lease Revenues (1) 120 123 125 (3) (2.4%) (5) (3.6%) Interest Expense 169 177 178 (8) (4.5%) (10) (5.4%) Net Finance Revenue 399 401 421 (1) (0.3%) (21) (5.1%) Other Non-Interest Income 137 63 (118) 74 116.7% 255 216.7% Operating Expenses 304 277 341 27 9.6% (37) (10.9%) Goodwill Impairment 256 - 354 256 NM (99) (27.8%) Loss on Debt Extinguishment and Deposit Redemption 2 54 3 (52) (96.8%) (2) (48.5%) Pre-provision Net Revenue (25) 133 (396) (158) NM 371 93.8% Provision for Credit Losses 30 30 37 - 1.0% (6) (17.4%) Pre-tax (Loss) Income from Continuing Operations (55) 103 (432) (158) (153.5%) 377 87.3% Provision (Benefit) for Income Taxes 28 (120) (7) 148 123.1% 34 519.7% (Loss) Income from Continuing Operations (83) 223 (426) (306) (137.2%) 343 80.6% Loss on Discontinued Operations, Net of Taxes (5) (2) (717) (3) (173.7%) 712 99.3% Loss on Sale of Discontinued Operations, Net of Taxes - (1) - 1 NM - 0.0% Loss from Discontinued Operations, Net of Taxes (5) (3) (717) (2) (62.5%) 712 99.3% Net (Loss) Income (88) 220 (1,143) (308) (140.1%) 1,055 92.3% Preferred Dividends 10 - - 10 - 10 - Net (Loss) Income Available to Common Shareholders (98) 220 (1,143) (317) (144.5%) 1,045 91.4% (Loss) Income from Continuing Operations Available to Common Shareholders (93) 223 (426) (315) (141.6%) 333 78.3% Diluted Income per Common Share (Loss) Income from Continuing Operations ($0.70) $1.64 ($2.11) ($2.34) (142.7%) $1.41 66.7% Loss from Discontinued Operations, Net of Taxes (0.04) (0.03) (3.54) (0.01) (33.3%) 3.50 98.9% Diluted (Loss) Income per Common Share ($0.74) $1.61 ($5.65) ($2.35) (146.0%) $4.91 86.9% Return on Average Earning Assets Average Earning Assets 44,562 45,454 46,965 (892) (2.0%) (2,403) (5.1%) After Tax Return on Average Earnings Assets - Continuing Operations (0.83%) 1.96% (3.63%) 280 bps(279) bps Quarterly Earnings Summary – Reported

5 4Q17 Earnings Highlights ▪ Goodwill Impairment: $222 million ($1.69 per diluted common share) non - cash goodwill impairment charge in the Commercial Banking segment (no impact on regulatory capital ratios or tangible book value) ▪ Restructuring Charge: $20 million ($0.15 per diluted common share) restructuring charge in operating expenses ▪ US Federal Corporate Tax Reform: $12 million ($0.09 per diluted common share) in aggregate net benefits related to U.S. tax reform; ▪ NACCO Tax - Related Items: $10 million ($0.08 per diluted common share) net deferred income tax benefit from tax items related to NACCO; ▪ LIHTC Methodology Change: $9 million ($0.07 per diluted common share) net expense related to the cumulative effect of changing the accounting policy for Low Income Housing Tax Credits (LIHTC) investments from the equity method to the proportional amortization method, including a $29 million benefit in other non - interest income and a $38 million expense in the provision for income taxes ▪ NACCO Suspended Depreciation: $6 million ($0.05 per diluted common share) benefit in net finance revenue from the suspension of the depreciation related to the European Rail business (NACCO) assets held for sale. Certain balances may not sum due to rounding. EPS based on 131.3 million average diluted shares outstanding, dollar impacts a re rounded. (1) See appendix page 23 for details on noteworthy items included in the results. ($ in millions, except per share data) Continuing Operations Discontinued Operations Total Reported GAAP Loss Available to Common Shareholders ($93) ($5) ($98) GAAP Diluted EPS ($0.70) ($0.04) ($0.74) Noteworthy Items (After-Tax): Goodwill Impairment 222 $222 Restructuring Charge 20 $20 Cumulative Effect of LIHTC Accounting Methodology Change 9 $9 US Federal Corporate Tax Reform Related Items (12) ($12) NACCO Tax-Related Items (10) ($10) NACCO Suspended Depreciation (6) ($6) Total Noteworthy Items $223 - $223 Non-GAAP Net Income Available to Common Shareholders Excluding Noteworthy Items $130 ($5) $125 Non-GAAP Diluted EPS Excluding Noteworthy Items $0.99 ($0.04) $0.95 Fourth Quarter Impact of Noteworthy Items (Non - GAAP) (1)

6 4Q17 Earnings Highlights vs. Prior Quarter vs. Year - ago Quarter ▪ Net Finance Revenue: declined 1% as lower purchase accounting accretion, lower income from cash balances and higher depreciation on operating leases were partially offset by higher interest income on loans, including higher interest recoveries, and lower interest expense from the repayment of unsecured debt at the end of the prior quarter ▪ Other Non - Interest Income: increased $18 million primarily driven by an increase in capital markets fees, net gains on asset sales, foreign exchange and derivatives, a full quarter of BOLI income, and losses related to the LIHTC investments that were reported in other non - interest income in the prior quarter ▪ Operating Expenses: declined $2 million driven primarily by a reversal of a litigation provision and a true - up of FDIC insurance costs ▪ Provision for Credit Losses: increased $15 million primarily reflecting the establishment of reserves on asset growth in Commercial Banking ▪ Income Tax Provision: current quarter included a net benefit of $22 million from discrete items, offset by a higher effective tax rate ▪ Net Finance Revenue: declined $30 million primarily reflecting lower purchase accounting accretion and lower gross yields in Rail, partially offset by higher earnings on investment securities ▪ Other Non - Interest Income: increased $4 million primarily driven by income from BOLI and an increase in capital markets fees, partially offset by a decrease in foreign exchange and derivatives ▪ Operating Expenses: declined 12%, primarily reflecting lower professional fees and technology expenses, partially offset by higher advertising and marketing costs in Consumer Banking, and higher compensation and benefits expenses ▪ Provision for Credit Losses: declined 17% due to a decline in net charge - offs ▪ Income Tax Provision: effective tax rate excluding noteworthy and discrete items for the full year was 34% Certain balances may not sum due to rounding. (1) Net of depreciation, maintenance, and other operating lease expenses. Quarterly Earnings Summary Excluding Noteworthy Items (Non - GAAP) Change from ($ in millions, except per share data) 4Q17 3Q17 4Q16 3Q17 4Q16 $ % $ % Interest Income 448 454 474 (6) (1.4%) (26) (5.6%) Net Operating Lease Revenues (1) 112 116 125 (4) (3.3%) (13) (10.7%) Interest Expense 169 177 178 (8) (4.5%) (10) (5.4%) Net Finance Revenue 391 393 421 (2) (0.5%) (30) (7.2%) Other Non-Interest Income 108 90 103 18 19.6% 4 4.3% Operating Expenses 272 274 310 (2) (0.8%) (38) (12.2%) Loss on Debt Extinguishment and Deposit Redemption 2 - 3 2 - (2) (48.5%) Pre-provision Net Revenue 225 209 211 16 7.6% 14 6.6% Provision for Credit Losses 30 15 37 16 108.2% (6) (17.2%) Pre-tax Income from Continuing Operations 194 194 174 - 0.1% 20 11.4% Provision for Income Taxes 54 55 49 (1) 2.2% 5 10.2% Income from Continuing Operations 140 139 125 1 0.9% 15 11.9% (Loss) income from Discontinued Operations, Net of Taxes (5) (1) 85 (4) NM (90) (106.0%) Gain on Sale of Discontinued Operations, Net of Taxes - - - - - - - (Loss) Income from Discontinued Operations, Net of Taxes (5) (1) 85 (4) NM (90) (106.0%) Net Income 135 138 210 (3) (2.1%) (75) (35.8%) Preferred Dividends 10 - - 10 - 10 - Net Income Available to Common Shareholders 125 138 210 (13) (9.2%) (85) (40.4%) Income from Continuing Operations Available to Common Shareholders 130 139 125 (9) (6.1%) 5 4.1% Diluted income per Common Share Income from Continuing Operations $0.99 $1.02 $0.62 ($0.03) (2.9%) $0.37 59.7% (Loss) Income from Discontinued Operations, Net of Taxes (0.04) (0.01) 0.42 (0.03) NM (0.46) (109.5%) Diluted Income per Common Share $0.95 $1.01 $1.04 ($0.06) (5.9%) ($0.09) (8.7%) Return on Average Earning Assets Average Earning Assets 44,562 45,454 46,965 (892) (2.0%) (2,403) (5.1%) After Tax Return on Average Earnings Assets - Continuing Operations 1.17% 1.22% 1.07% 10 bps(5) bps

7 4Q17 Earnings Highlights ▪ Income from continuing operations available to common shareholders excluding noteworthy items for the full year increased 31% as lower operating expenses, higher other non - interest income and a decline in the provision for credit losses was partially offset by a decline in net finance revenue ▪ The increase in income from continuing operations per diluted common share excluding noteworthy items also reflects a decline in the average number of diluted common shares outstanding due to significant share repurchases in 2017 (1) See appendix pages 23 and 24 for details on noteworthy items included in the results. (2) Net of depreciation, maintenance, and other operating lease expenses. Full Year Earnings Summary Change from Change from ($ in millions, except per share data) 2017 2016 2016 2017 2016 2016 $ % $ % Interest Income 1,836 1,912 (76) (4.0%) 1,827 1,912 (85) (4.4%) Net Operating Lease Revenues (2) 488 557 (69) (12.3%) 472 557 (85) (15.3%) Interest Expense 718 753 (36) (4.7%) 694 753 (59) (7.8%) Net Finance Revenue 1,606 1,715 (109) (6.4%) 1,604 1,715 (112) (6.5%) Other Non-Interest Income 364 151 214 141.8% 370 357 13 3.5% Operating Expenses 1,189 1,284 (95) (7.4%) 1,136 1,220 (85) (6.9%) Goodwill Impairment 256 354 (99) (27.8%) - - - 0.0% Loss on Debt Extinguishment and Deposit Redemption 220 13 208 NM 2 13 (11) (86.4%) Pre-provision Net Revenue 306 216 91 42.0% 836 840 (4) (0.4%) Provision for Credit Losses 115 195 (80) (41.1%) 99 195 (96) (49.0%) Pre-tax Income from Continuing Operations 192 21 171 NM 737 645 92 14.2% (Benefit) Provision for Income Taxes (68) 204 (271) (133.3%) 223 261 (38) (14.5%) Income (Loss) from Continuing Operations 259 (183) 442 242.1% 514 384 130 33.8% Income (Loss) from Discontinued Operations, Net of Taxes 90 (665) 755 113.5% (109) 325 (434) (133.4%) Gain on Sale of Discontinued Operations, Net of Taxes 119 - 119 - 160 - 160 0.0% Income (Loss) from Discontinued Operations, Net of Taxes 209 (665) 874 131.4% 51 325 (274) (84.3%) Net Income (Loss) 468 (848) 1,316 155.2% 565 709 (145) (20.4%) Preferred Dividends 10 - 10 - 10 - 10 - Net Income (Loss) Available to Common Shareholders 458 (848) 1,306 154.1% 555 709 (154) (21.8%) Income (Loss) from Continuing Operations Available to Common Shareholders 250 (183) 432 236.7% 504 384 120 31.2% Diluted Income per Common Share Income (Loss) from Continuing Operations $1.52 ($0.90) $2.42 268.9% $3.07 $1.90 $1.17 61.6% Income (Loss) from Discontinued Operations, Net of Taxes 1.28 (3.30) 4.58 138.8% 0.32 1.61 (1.31) (81.4%) Diluted Income (Loss) per Common Share $2.80 ($4.20) $7.00 166.7% $3.39 $3.51 ($0.12) (3.3%) Return on Average Earning Assets Average Earning Assets 46,852 47,664 (812) (1.7%) 45,922 47,664 (812) (1.7%) After Tax Return on Average Earnings Assets - Continuing Operations 2.21% (1.53%) 4.47% 3.22% NM 117 bps Excluding Noteworthy Items (1) Reported

8 4Q17 Earnings Highlights vs. Prior Quarter vs. Year - ago Quarter Net Finance Revenue & Net Finance Margin Net Finance Revenue decreased by $2 million ▪ Decrease due to lower net purchase accounting accretion, lower income from cash balances and higher depreciation on operating leases ▪ Decrease mostly offset by higher interest income on loans, including higher interest recoveries, and lower interest expense from the repayment of unsecured debt at the end of the prior quarter Net Finance Revenue decreased by $30 million ▪ Decrease primarily due to lower net purchase accounting accretion and lower gross yields in Rail ▪ Decrease partially offset by higher earnings on investment securities Certain balances may not sum due to rounding. (1) See appendix page 23 for details on noteworthy items. (2) Purchase accounting accretion and negative return on indemnification assets. (3) 4Q17 investments include $112.5 million of securities purchased under agreement to resell. (4) Net of credit balances of factoring clients of $1,571 in 4Q17 , $1,551 in 3Q17, and $1,296 in 4Q16. (5) Balances include loans and leases held for sale, respectively. 355 368 353 354 367 66 48 51 38 24 $421 $417 $404 $393 $391 3.58% 3.57% 3.44% 3.46% 3.51% 4Q16 1Q17 2Q17 3Q17 4Q17 Net Finance Revenue (less PAA, net ) PAA, net NFM (2) (2) ($ in millions) Net Finance Margin (NFM) – Continuing Operations (Excluding Noteworthy Items) (1) Change from ($ in millions, except yield data) 3Q17 4Q16 Average Balance Yield Average Balance Yield Average Balance Yield Yield Yield Interest-bearing Cash 2,270 1.6% 3,874 1.3% 5,918 0.5% 30 bps 110 bps Investments (3) 6,068 2.5% 5,796 2.6% 3,962 3.1% (10) bps (60) bps Loans (4)(5) 28,225 5.9% 27,793 6.0% 29,295 6.1% (10) bps (20) bps Operating Leases, Net (5) 7,841 5.7% 7,798 5.9% 7,438 6.6% (20) bps (90) bps Indemnification Assets 158 (40.3%) 193 (28.1%) 351 (9.4%) NM NM Earning Assets 44,562 5.0% 45,454 5.0% 46,965 5.1% - (10) bps Interest-bearing Deposits 28,134 1.3% 28,820 1.3% 31,139 1.2% - 10 bps Borrowings 8,631 3.6% 8,592 3.9% 14,677 2.2% (30) bps 140 bps Interest-bearing Liabilities 36,765 1.8% 37,412 1.9% 45,816 1.6% (10) bps 20 bps 4Q17 3Q17 4Q16
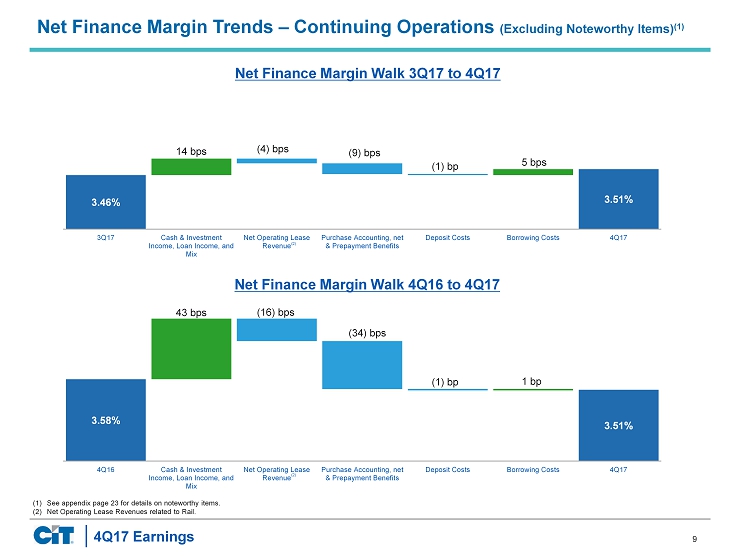
9 4Q17 Earnings (1) See appendix page 23 for details on noteworthy items. (2) Net Operating Lease Revenues related to Rail. Net Finance Margin Walk 3Q17 to 4Q17 Net Finance Margin Walk 4Q16 to 4Q17 Net Finance Margin Trends – Continuing Operations (Excluding Noteworthy Items) (1) 3.58% 3.51% 43 bps (16) bps (34) bps (1) bp 1 bp 4Q16 Cash & Investment Income, Loan Income, and Mix Net Operating Lease Revenue Purchase Accounting, net & Prepayment Benefits Deposit Costs Borrowing Costs 4Q17 3.46% 3.51% 14 bps (4) bps (9) bps (1) bp 5 bps 3Q17 Cash & Investment Income, Loan Income, and Mix Net Operating Lease Revenue Purchase Accounting, net & Prepayment Benefits Deposit Costs Borrowing Costs 4Q17 (2) (2)

10 4Q17 Earnings Highlights vs. Prior Quarter vs. Year - ago Quarter Other non - interest income increased $18 million ▪ Increase due to higher capital markets fees, net gains on asset sales, foreign exchange and derivatives, a full quarter of income related to Bank - Owned Life Insurance (BOLI) and losses related to the LIHTC investments that were reported in other non - interest income in the prior quarter Other non - interest income increased $4 million ▪ Increase due to income from BOLI and an increase in capital markets fees ▪ Increase partially offset by a decrease in foreign exchange and derivatives Certain balances may not sum due to rounding. (1) See appendix page 23 for detail on noteworthy items. 26 26 23 27 27 27 29 28 26 30 11 9 14 12 9 40 24 19 25 42 $103 $87 $85 $90 $108 4Q16 1Q17 2Q17 3Q17 4Q17 Factoring Commissions Fee Revenues Gains on Sales of Leasing Equipment All Other Income All Other Income Change from ($ in millions) 4Q17 3Q17 4Q16 3Q17 4Q16 $ % $ % Fee Revenues 30 26 27 4 15.6% 4 13.1% Factoring Commissions 27 27 26 (0) (1.1%) 1 3.9% Gains on Sales of Leasing Equipment 9 12 11 (3) (25.4%) (1) (13.3%) Gains on Loan and Portfolio Sales 7 4 1 4 97.2% 7 NM Gains on Investments 12 10 22 2 24.0% (10) (43.6%) Gains on OREO Sales 5 1 2 3 NM 3 NM Net Gains on Derivatives and Foreign Currency Exchange 7 1 15 6 NM (8) (53.8%) Impairment on Assets Held for Sale (7) - - (7) - (7) - Other Revenues 18 9 2 9 103.4% 16 NM Total Other Non-Interest Income 108 90 103 18 19.6% 4 4.3% Other Non - Interest Income – Continuing Operations (Excluding Noteworthy Items) (1)

11 4Q17 Earnings Highlights vs. Prior Quarter vs. Year - ago Quarter Operating Expenses decreased by 1% ▪ Decrease driven primarily by lower professional fees due to a reversal of a litigation provision and a true - up of FDIC insurance costs Operating Expenses decreased by 12% ▪ Decrease primarily reflecting lower professional fees and technology expenses ▪ Decrease partially offset by higher advertising and marketing costs, primarily in Consumer Banking and higher compensation and benefits expense Certain balances may not sum due to rounding. (1) In addition to the exclusion of noteworthy items, operating expenses also exclude amortization of intangibles. (2) See appendix page 23 for details on noteworthy items. (3) Total operating expenses exclusive of noteworthy items and amortization of intangibles divided by total revenue (net finance rev enue and other non - interest income). 133 143 145 139 139 40 33 34 31 31 59 40 32 32 29 72 75 75 67 68 $304 $291 $286 $268 $266 4Q16 1Q17 2Q17 3Q17 4Q17 Compensation and Benefits Technology Professional Fees All Other Expenses All Other Expenses Net Efficiency Ratio (3) 58% 58% 59% 56% 53% Change from ($ in millions) 4Q17 3Q17 4Q16 3Q17 4Q16 $ % $ % Compensation and Benefits 139 139 133 (0) (0.3%) 5 3.9% Technology 31 31 40 0 0.3% (9) (23.3%) Professional Fees 29 32 59 (3) (10.3%) (30) (50.9%) Advertising and Marketing 13 14 6 (1) (5.9%) 7 103.2% Net Occupancy Expense 17 16 20 1 3.7% (3) (14.4%) Insurance 16 19 19 (3) (15.1%) (3) (17.8%) Other 23 18 27 4 23.5% (5) (16.6%) Total Operating Expenses (1) 266 268 304 (2) (0.8%) (38) (12.4%) Headcount 3,909 3,965 4,078 (56) (1.4%) (169) (4.1%) Operating Expenses (1) – Continuing Operations (Excluding Noteworthy Items) (2)

12 4Q17 Earnings Highlights vs. Prior Quarter vs. Year - ago Quarter Average earning assets decreased 2% primarily reflecting a decline in interest - bearing cash balances ▪ 2% increase in average loans primarily driven by growth in Commercial Banking ▪ Total borrowed funds and deposits declined 2% due to the repayment of unsecured debt and a decline in average deposits, partially offset by growth in FHLB advances Average earning assets decreased 5% primarily reflecting a decline in interest - bearing cash balances partially offset by growth in investments ▪ 2% decrease in average loans and leases driven by portfolio repositioning and legacy portfolio run - off, partially offset by an increase in operating leases ▪ Unsecured borrowings decreased $6.9 billion 4% 10% 9% Average Funding Mix Structured Borrowings Total Deposits 77% FHLB Advances Deposits and FHLB Advances Wholesale Unsecured Borrowings (1) 4Q17 investments include $112.5 million of securities purchased under agreement to resell. (2) Net of credit balances of factoring clients of $1,571 in 4Q17, $1,551 in 3Q17 and $1,296 in 4Q16. (3) Loans and leases include assets held for sale. (4) Excludes Corporate and Non - Strategic Portfolio. 21% 20% 26% 15% 11% 7% Average Loans and Leases (4) Other Consumer Legacy Consumer Mortgages Rail Business Capital Real Estate Finance Commercial Finance Commercial Banking Consumer Banking Consolidated Average Balance Sheet Change from ($ in millions) 4Q17 3Q17 4Q16 $ % $ % Interest-bearing Cash 2,270 3,874 5,918 (1,604) (41.4%) (3,648) (61.6%) Investments (1) 6,068 5,796 3,962 272 4.7% 2,106 53.1% Loans (2) 28,225 27,793 29,295 432 1.6% (1,070) (3.7%) Operating Leases, Net 7,841 7,798 7,438 43 0.6% 403 5.4% Total Loans and Leases (3) 36,066 35,591 36,733 476 1.3% (667) (1.8%) Indemnification Assets 158 193 351 (36) (18.4%) (194) (55.1%) Total Earning Assets 44,562 45,454 46,965 (892) (2.0%) (2,403) (5.1%) Total Non-Earning Assets 2,772 2,431 3,992 341 14.0% (1,219) (30.5%) Discontinued Assets 533 592 13,140 (59) (10.0%) (12,608) (95.9%) Total Assets 47,867 48,477 64,097 (610) (1.3%) (16,230) (25.3%) Total Deposits 29,635 30,316 32,434 (681) (2.2%) (2,799) (8.6%) Secured Borrowings 4,885 4,245 4,080 640 15.1% 805 19.7% Senior Unsecured/Other Borrowings 3,746 4,346 10,597 (600) (13.8%) (6,851) (64.6%) Total Borrowed Funds and Deposits 38,266 38,908 47,111 (642) (1.6%) (8,845) (18.8%) Other Liabilities 1,618 1,582 1,823 36 2.3% (204) (11.2%) Discontinued Liabilities 542 580 4,180 (38) (6.5%) (3,638) (87.0%) Total Liabilities 40,426 41,070 53,113 (644) (1.6%) (12,687) (23.9%) Total Stockholders' Equity 7,441 7,407 10,983 34 0.5% (3,542) (32.3%) Total Liabilities and Equity 47,867 48,477 64,097 (610) (1.3%) (16,230) (25.3%) 3Q17 4Q16

13 4Q17 Earnings Highlights Commercial Banking and Consumer Banking Average Loans and Leases (1) Commercial Banking Consumer Banking Commercial Banking Rail includes $1.1 billion of NACCO assets held for sale ▪ Vs. Prior Quarter: Average loans and leases increased due to growth in Commercial Finance and Business Capital ▪ Vs. Year - ago Quarter: Average loans and leases increased slightly, driven by asset growth in Business Capital, Rail and Real Estate Finance, partially offset by asset sales and prepayments in Commercial Finance Consumer Banking LCM includes $0.9 billion of reverse mortgage assets held for sale ▪ Vs. Prior Quarter: Average loans essentially unchanged from prior quarter as new business volume in Other Consumer Banking was offset by run - off in LCM ▪ Vs. Year - ago Quarter: Average loans declined 5% due to run - off in LCM partially offset by growth in Other Consumer Banking Certain balances may not sum due to rounding. (1) Net of credit balances of factoring clients and including assets held for sale. (2) Real Estate Finance includes legacy non - SFR currently in run - off in the amounts of $684 million, $728 million, $765 million, $802 million, and $843 million, for 4Q17, 3Q17, 2Q17, 1Q17, and 4Q16, respectively. 10.6 10.1 9.8 9.5 9.7 7.2 7.2 7.3 7.5 7.5 5.5 5.6 5.6 5.6 5.6 6.0 6.1 6.2 6.3 6.5 $29.2 $29.1 $28.9 $28.8 $29.3 4Q16 1Q17 2Q17 3Q17 4Q17 Commercial Finance Rail Real Estate Finance Business Capital (2) 5.0 4.8 4.6 4.5 4.3 2.2 2.2 2.2 2.2 2.5 $7.1 $7.0 $6.8 $6.7 $6.7 4Q16 1Q17 2Q17 3Q17 4Q17 Legacy Consumer Mortgages (LCM) Other Consumer Banking ($ in billions)
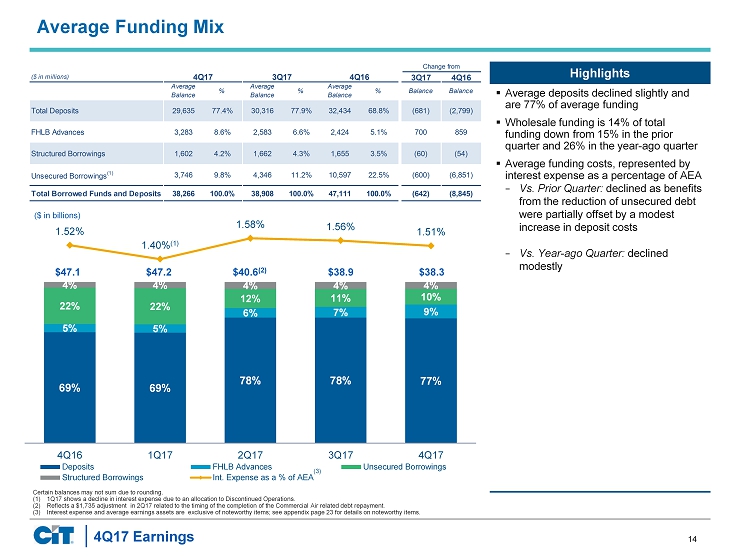
14 4Q17 Earnings Highlights Average Funding Mix ▪ Average deposits declined slightly and are 77% of average funding ▪ Wholesale funding is 14% of total funding down from 15% in the prior quarter and 26% in the year - ago quarter ▪ Average funding costs, represented by interest expense as a percentage of AEA − Vs. Prior Quarter: declined as benefits from the reduction of unsecured debt were partially offset by a modest increase in deposit costs − Vs. Year - ago Quarter: declined modestly 69% 69% 78% 78% 77% 5% 5% 6% 7% 9% 22% 22% 12% 11% 10% 4% 4% 4% 4% 4% 1.52% 1.40% (1) 1.58% 1.56% 1.51% 4Q16 1Q17 2Q17 3Q17 4Q17 Deposits FHLB Advances Unsecured Borrowings Structured Borrowings Int. Expense as a % of AEA (3) $47.1 $47.2 $40.6 (2) $38.9 $38.3 Certain balances may not sum due to rounding. (1) 1Q17 shows a decline in interest expense due to an allocation to Discontinued Operations. (2) Reflects a $1,735 adjustment in 2Q17 related to the timing of the completion of the Commercial Air related debt repayment. (3) Interest expense and average earnings assets are exclusive of noteworthy items; see appendix page 23 for details on notewort hy items. ($ in billions) Change from ($ in millions) 3Q17 4Q16 Average Balance % Average Balance % Average Balance % Balance Balance Total Deposits 29,635 77.4% 30,316 77.9% 32,434 68.8% (681) (2,799) FHLB Advances 3,283 8.6% 2,583 6.6% 2,424 5.1% 700 859 Structured Borrowings 1,602 4.2% 1,662 4.3% 1,655 3.5% (60) (54) Unsecured Borrowings (1) 3,746 9.8% 4,346 11.2% 10,597 22.5% (600) (6,851) Total Borrowed Funds and Deposits 38,266 100.0% 38,908 100.0% 47,111 100.0% (642) (8,845) 4Q17 3Q17 4Q16
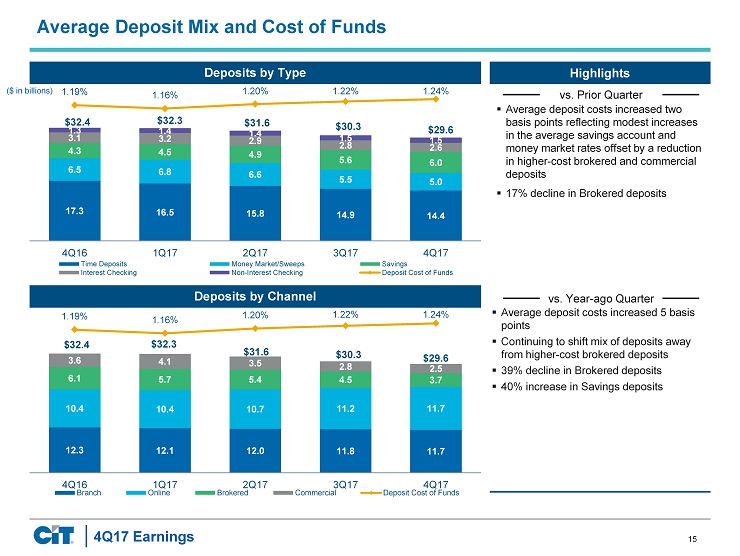
15 4Q17 Earnings Highlights vs. Prior Quarter vs. Year - ago Quarter Average Deposit Mix and Cost of Funds Deposits by Type Deposits by Channel ▪ Average deposit costs increased two basis points reflecting modest increases in the average savings account and money market rates offset by a reduction in higher - cost brokered and commercial deposits ▪ 17% decline in Brokered deposits 17.3 16.5 15.8 14.9 14.4 6.5 6.8 6.6 5.5 5.0 4.3 4.5 4.9 5.6 6.0 3.1 3.2 2.9 2.8 2.6 1.3 1.4 1.4 1.5 1.5 $32.4 $32.3 $31.6 $30.3 $29.6 1.19% 1.16% 1.20% 1.22% 1.24% 4Q16 1Q17 2Q17 3Q17 4Q17 Time Deposits Money Market/Sweeps Savings Interest Checking Non-Interest Checking Deposit Cost of Funds 12.3 12.1 12.0 11.8 11.7 10.4 10.4 10.7 11.2 11.7 6.1 5.7 5.4 4.5 3.7 3.6 4.1 3.5 2.8 2.5 $32.4 $32.3 $31.6 $30.3 $29.6 1.19% 1.16% 1.20% 1.22% 1.24% 4Q16 1Q17 2Q17 3Q17 4Q17 Branch Online Brokered Commercial Deposit Cost of Funds ($ in billions) ▪ Average deposit costs increased 5 basis points ▪ Continuing to shift mix of deposits away from higher - cost brokered deposits ▪ 39% decline in Brokered deposits ▪ 40% increase in Savings deposits

16 4Q17 Earnings Highlights vs. Prior Quarter vs. Year - ago Quarter Asset Quality Trends – Continuing Operations (Excluding Noteworthy Items) (1) Non - accrual Loans & Net Charge - offs Allowance for Loan Losses – Commercial ▪ Provision for credit losses increased $15 million reflecting the establishment of reserves on asset growth in Commercial Banking ▪ Non - accrual loans as a percent of average loans declined 17 bps reflecting a decrease in Commercial Finance from Loan payoffs ▪ Net charge - offs declined 10 bps ▪ Allowance for loan losses increased slightly reflecting higher loan balances ▪ Provision for credit losses decreased $7 million on lower charge - offs ▪ Non - accrual loans as a percent of average loans declined by 18 bps ▪ Net charge - offs declined by 6 bps 279 259 257 265 221 0.32% 0.37% 0.38% 0.36% 0.26% 4Q16 1Q17 2Q17 3Q17 4Q17 Non-accrual Loans Net Charge-offs % (2 ) 408 424 398 392 402 1.81% 1.85% 1.78% 1.73% 1.74% 4Q16 1Q17 2Q17 3Q17 4Q17 Allowance for Loan Losses (ALLL) ALLL % to Loans Non - accrual Loans as a % of Loans 0.94% 0.87% 0.88% 0.93% 0.76% ($ in millions) (1) See appendix page 23 for details on noteworthy items. (2) Percentage of average loans and excluding charge - offs related to transfer of reverse mortgages to held for sale in 3Q17 .

17 4Q17 Earnings Highlights vs. Prior Quarter vs. Year - ago Quarter Strong Capital Position Risk Based Capital Ratios (1) Loans and Leases - to - Deposit Ratio ▪ CET1 capital ratio increased approximately 40 bps ▪ CET1 capital increased as earnings excluding the goodwill impairment were partially offset by dividends ▪ Risk - weighted assets (RWA) decreased primarily reflecting the sale of certain investment securities and a decrease in on - and off - balance sheet factoring balances, partially offset by an increase in loans ▪ CET1 capital ratio increased approximately 60 bps ▪ Total capital ratio increased approximately 150 bps (1) Capital ratios preliminary as of 12/31/17 and are based on fully phased - in Basel III estimates. 14.6% 15.1% 16.2% 15.7% 16.1% 13.8% 14.3% 14.4% 14.0% 14.4% 13.9% 14.7% 12.1% 13.4% 13.8% 4Q16 1Q17 2Q17 3Q17 4Q17 Total Capital Ratio CET1 Ratio Tier 1 Leverage Ratio 150% 150% 120% 127% 130% 98% 97% 96% 102% 104% 4Q16 1Q17 2Q17 3Q17 4Q17 Consolidated Bank

18 4Q17 Earnings (1) See appendix pages 23 and 24 for details on noteworthy items included. (2) Average earning assets (AEA) components include interest - earning cash, securities purchased under agreement to resell, investmen t securities, indemnification assets, loans and operating lease equipment, less the credit balances of factoring clients. (3) As a percentage of average earnings assets. (4) Operating expenses exclusive of restructuring costs and intangible asset amortization. (5) Total operating expenses exclusive of restructuring charges and amortization of intangibles divided by total revenue (net fi nan ce revenue and other income). (6) For 4Q17 and FY17 excluding noteworthy items, the first value is only excluding noteworthy items, whereas the second value is ex cluding noteworthy and discrete items. (7) Capital ratios preliminary as of 12/31/17 and based on fully phased - in Basel III estimates. (8) Return on average tangible common equity for continuing operations adjusted to remove the impact of intangible amortization, goo dwill impairment and the impact of the valuation allowance reversal from income from continuing operations, while average tangible common equity is reduced for disallowed deferred tax assets and, in 2 Q17 and 3Q16, ~$3 billion of capital reduction associated with the Commercial Air sale. Key Performance Metrics – Continuing Operations ($ in millions) 4Q17 3Q17 4Q16 2017 2016 4Q17 3Q17 4Q16 2017 2016 AEA (2) 44,562 45,454 46,965 46,852 47,664 44,562 45,454 46,965 45,922 47,664 Net Finance Margin (3) 3.6% 3.5% 3.6% 3.4% 3.6% 3.5% 3.5% 3.6% 3.5% 3.6% Credit Provision (3) 0.3% 0.3% 0.3% 0.2% 0.4% 0.3% 0.1% 0.3% 0.2% 0.4% Other Non-Interest Income (3) 1.2% 0.6% (1.0%) 0.8% 0.3% 1.0% 0.8% 0.9% 0.8% 0.7% Operating Expenses (3)(4) 2.4% 2.4% 2.8% 2.4% 2.6% 2.4% 2.4% 2.6% 2.4% 2.5% Net Efficiency Ratio (5) 49.6% 57.8% 109.2% 56.4% 65.5% 53.4% 55.5% 58.0% 56.3% 57.6% Tax Rate (6) (50.3%) (116.3%) 1.5% (35.4%) NM 27.9% / 39.4% 28.5% 27.9% 30.3% / 33.6% 40.4% CET1 Ratio (7) 14.4% 14.0% 13.8% 14.4% 13.8% 14.4% 14.0% 13.8% 14.4% 13.8% Adjusted ROATCE (8) 8.42% 14.58% NM 7.72% 3.17% 8.47% 9.20% 8.37% 8.24% 6.71% Reported Excluding Noteworthy Items (1)

19 4Q17 Earnings Key Performance Metrics and 2018 Targets See corresponding footnotes on the following page. Reported Excluding Noteworthy Items(1) FY 2017 FY 2017 AEA (2) $46,852 $45,922 Flat Core Average Loans and Leases (3) $30,278 $30,278 Mid Single-Digit Growth Net Finance Margin 3.43% 3.49% 3.20–3.40% Core Operating Expenses (4) $1,111 $1,111 $1,050 Net Efficiency Ratio (5) 56.4% 56.3% Mid 50s Net Charge Offs (6) 0.39% 0.34% 35–45 bps Effective Tax Rate (7) (35.4%) 30.3% / 33.6% 25-26% excluding discrete items 2018 Target ($ in millions) ▪ Medium Term ROTCE Target updated to 11 - 12% ▪ To achieve ~9.5 - 10% ROTCE at end of 2018 with CET1 of ~11.5 - 12.0% ▪ ROTCE to improve toward target in 2019 from revenue growth, continuous improvement in efficiency ratio and further reduction in the CET1 ratio ROTCE Update

20 4Q17 Earnings (1) See appendix page 23 for details on noteworthy items included. (2) Average earning assets (AEA) components include interest earning cash, securities purchased under agreement to resell, invest men t securities, indemnification assets, loans and operating lease equipment, less the credit balances of factoring clients. (3) Core average loans and leases excludes credit balances of factoring clients, NACCO AHFS, Legacy Consumer Mortgages, and NSP. (4) Operating expenses exclusive of restructuring costs and intangible assets amortization. (5) Total operating expenses exclusive of restructuring charges and amortization of intangibles divided by total revenue (net fin anc e revenue and other non - interest income). (6) As a percent of average loans. (7) For 4Q17 excluding noteworthy items, the first value is only excluding noteworthy items, whereas the second value is excludin g n oteworthy and discrete items. Reported Excluding Noteworthy Items (1) 4Q17 4Q17 AEA (2) $44,562 $44,562 Core Average Loans and Leases (3) $30,566 $30,566 Net Finance Margin 3.59% 3.51% ▪ Toward the upper end of our 3.2-3.4% range Core Operating Expenses (4) $266 $266 Net Efficiency Ratio (5) 49.6% 53.4% Net Charge Offs (6) 0.26% 0.26% ▪ Within the annual target range of 35-45 bps excluding any discrete items Effective Tax Rate (7) (50.3%) 27.9% / 39.4% ▪ 25-26% excluding discrete items ($ in millions) 1Q18 Outlook Commentary ▪ Operating expenses up on benefit restarts Low single-digit quarterly growth in core average loans and leases, offset by run-off in non-core portfolios; AEA flat ▪ Quarterly Performance and 1Q18 Outlook

21 4Q17 Earnings Executing on Our Priorities to Simplify, Strengthen and Grow CIT Enhance Operational Efficiency 2 Maintain Strong Risk Management 5 Optimize Capital Structure 4 Maximize Potential of Core Businesses 1 Reduce Funding Costs 3 A Leading National Bank Focused on Lending and Leasing to the Middle Market and Small Businesses Focusing on Our Strategic Priorities
22 4Q17 Earnings APPENDIX

23 4Q17 Earnings Quarterly Noteworthy Items (1) Per share data based on 131.3 million, 136.1 million, 183.8 million, 203.3 million, and 202.1 million for 4Q17, 3Q17, 2Q17, 1Q17, and 4Q16, respectively; do llar impacts are rounded. (2) Excess interest cost, interest income and increase in average earning assets are the result of a timing difference between th e r eceipt of the proceeds from the Commercial Air sale and the completion of the related debt and capital actions. Segment Item Line Item Pre-Tax After-Tax Per Share (1) Balance Sheet Corporate TRS Termination Charge Other Income ($243) ($147) ($0.73) Consumer Banking Consumer Goodwill Impairment Goodwill Impairment ($319) ($319) ($1.58) Commercial Banking Commercial Services Goodwill Impairment Goodwill Impairment ($35) ($28) ($0.14) NSP Canadian Assertion Change Tax Provision - ($54) ($0.27) NSP Canada Portfolio Sale Gain Other Income $22 $16 $0.08 Consumer Banking Legacy OneWest Bank Matters Operating Expenses ($27) ($17) ($0.08) Corporate Restructuring Expenses Operating Expenses ($4) ($3) ($0.01) Commercial Air Tax Provision - ($847) ($4.19) Commercial Air Suspended Depreciation $106 $66 $0.33 Financial Freedom Reserve ($27) ($16) ($0.08) Business Air Impairment ($7) ($5) ($0.02) Corporate Entity Restructuring Tax Provision - ($14) ($0.07) Corporate Restructuring Expenses Operating Expenses ($15) ($10) ($0.05) NSP Currency Translation Adjustments Other Income ($8) ($7) ($0.03) Commercial Air Suspended Depreciation $113 $69 $0.34 Commercial Air Secured Debt Expenses ($39) ($34) ($0.17) TC-CIT Joint Venture Gain $14 $13 $0.06 Corporate Debt Extinguishment Costs Debt Extinguishment Costs ($165) ($100) ($0.54) Corporate Excess Interest Cost (2) Interest Expense ($23) ($15) ($0.08) Corporate Interest Income (2) Interest Income $9 $6 $0.03 Corporate Commercial Air Asset Adjustment (2) Average Earning Assets ($3,686) Corporate Resolution of Legacy Tax Items Tax Provision - $19 $0.11 Corporate NACCO DTA Recognition Tax Provision $0 $7 ($0.04) Corporate Restructuring Charges Operating Expenses ($3) ($2) ($0.01) Commercial Air Gain on Sale $135 $100 $0.54 Financial Freedom Net Settlement Items and Servicing Rights Impairment $20 $12 $0.07 Corporate Strategic Tax Item - Restructuring of an International Legal Entity Tax Provision - $140 $1.03 Corporate Debt Redemption Debt Extinguishment Costs ($54) ($33) ($0.24) Corporate Restructuring Charges Operating Expenses ($3) ($2) ($0.02) Commercial Banking NACCO Suspended Depreciation Depreciation on Operating Lease Equipment $8 $5 $0.04 Consumer Banking Financial Freedom Transaction - Impairment on REO Other Non-Interest Income - Gains on OREO Sales ($5) ($3) ($0.02) Consumer Banking Financial Freedom Transaction - Impairment on Reverse Mortgage-Related Assets Other Non-Interest Income - Impairment on Assets Held for Sale ($9) ($6) ($0.04) Consumer Banking Financial Freedom Transaction - Impairment on HECMs-HFS Other Non-Interest Income - Impairment on Assets Held for Sale ($12) ($8) ($0.06) Consumer Banking Financial Freedom Transaction - Impairment on HECMs-HFI Credit Provision/Charge-offs ($15) ($9) ($0.07) Discontinued Operations Financial Freedom Related Impairment ($4) ($2) ($0.02) Corporate LIHTC Methodology Change Other Income $29 $29 $0.22 Corporate LIHTC Methodology Change Tax Provision - ($38) ($0.29) Corporate Impact of US Corporate Tax Reform Tax Provision - $12 $0.09 Commercial Banking NACCO Suspended Depreciation Depreciation on Operating Lease Equipment $9 $6 $0.05 Commercial Banking NACCO Related Tax Items Tax Provision - $10 $0.08 Commercial Banking Commercial Goodwill Impairment Goodwill Impairment ($256) ($222) ($1.69) Corporate Restructuring Charges Operating Expenses ($32) ($20) ($0.15) 4Q17 Continuing Operations ($ in millions, except for per share data) Discontinued Operations 2Q17 Continuing Operations 4Q16 Continuing Operations Discontinued Operations 1Q17 Continuing Operations Discontinued Operations 3Q17 Continuing Operations
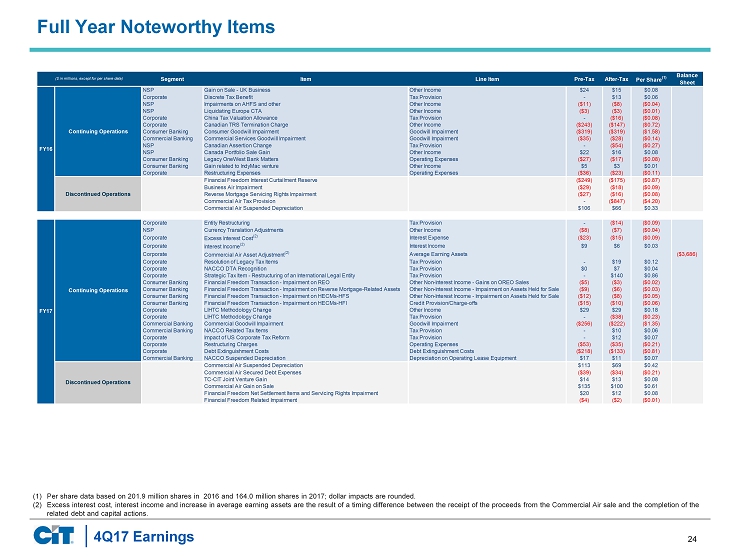
24 4Q17 Earnings (1) Per share data based on 201.9 million shares in 2016 and 164.0 million shares in 2017; dollar impacts are rounded. (2) Excess interest cost, interest income and increase in average earning assets are the result of a timing difference between th e r eceipt of the proceeds from the Commercial Air sale and the completion of the related debt and capital actions. Full Year Noteworthy Items Segment Item Line Item Pre-Tax After-Tax Per Share (1) Balance Sheet NSP Gain on Sale - UK Business Other Income $24 $15 $0.08 Corporate Discrete Tax Benefit Tax Provision - $13 $0.06 NSP Impairments on AHFS and other Other Income ($11) ($8) ($0.04) NSP Liquidating Europe CTA Other Income ($3) ($3) ($0.01) Corporate China Tax Valuation Allowance Tax Provision - ($16) ($0.08) Corporate Canadian TRS Termination Charge Other Income ($243) ($147) ($0.72) Consumer Banking Consumer Goodwill Impairment Goodwill Impairment ($319) ($319) ($1.58) Commercial Banking Commercial Services Goodwill Impairment Goodwill Impairment ($35) ($28) ($0.14) NSP Canadian Assertion Change Tax Provision - ($54) ($0.27) NSP Canada Portfolio Sale Gain Other Income $22 $16 $0.08 Consumer Banking Legacy OneWest Bank Matters Operating Expenses ($27) ($17) ($0.08) Consumer Banking Gain related to IndyMac venture Other Income $5 $3 $0.01 Corporate Restructuring Expenses Operating Expenses ($36) ($23) ($0.11) Financial Freedom Interest Curtailment Reserve ($249) ($175) ($0.87) Business Air Impairment ($29) ($18) ($0.09) Reverse Mortgage Servicing Rights Impairment ($27) ($16) ($0.08) Commercial Air Tax Provision - ($847) ($4.20) Commercial Air Suspended Depreciation $106 $66 $0.33 Corporate Entity Restructuring Tax Provision - ($14) ($0.09) NSP Currency Translation Adjustments Other Income ($8) ($7) ($0.04) Corporate Excess Interest Cost (2) Interest Expense ($23) ($15) ($0.09) Corporate Interest Income (2) Interest Income $9 $6 $0.03 Corporate Commercial Air Asset Adjustment (2) Average Earning Assets ($3,686) Corporate Resolution of Legacy Tax Items Tax Provision - $19 $0.12 Corporate NACCO DTA Recognition Tax Provision $0 $7 $0.04 Corporate Strategic Tax Item - Restructuring of an International Legal Entity Tax Provision - $140 $0.86 Consumer Banking Financial Freedom Transaction - Impairment on REO Other Non-Interest Income - Gains on OREO Sales ($5) ($3) ($0.02) Consumer Banking Financial Freedom Transaction - Impairment on Reverse Mortgage-Related Assets Other Non-Interest Income - Impairment on Assets Held for Sale ($9) ($6) ($0.03) Consumer Banking Financial Freedom Transaction - Impairment on HECMs-HFS Other Non-Interest Income - Impairment on Assets Held for Sale ($12) ($8) ($0.05) Consumer Banking Financial Freedom Transaction - Impairment on HECMs-HFI Credit Provision/Charge-offs ($15) ($10) ($0.06) Corporate LIHTC Methodology Change Other Income $29 $29 $0.18 Corporate LIHTC Methodology Change Tax Provision - ($38) ($0.23) Commercial Banking Commercial Goodwill Impairment Goodwill Impairment ($256) ($222) ($1.35) Commercial Banking NACCO Related Tax Items Tax Provision - $10 $0.06 Corporate Impact of US Corporate Tax Reform Tax Provision - $12 $0.07 Corporate Restructuring Charges Operating Expenses ($53) ($35) ($0.21) Corporate Debt Extinguishment Costs Debt Extinguishment Costs ($218) ($133) ($0.81) Commercial Banking NACCO Suspended Depreciation Depreciation on Operating Lease Equipment $17 $11 $0.07 Commercial Air Suspended Depreciation $113 $69 $0.42 Commercial Air Secured Debt Expenses ($39) ($34) ($0.21) TC-CIT Joint Venture Gain $14 $13 $0.08 Commercial Air Gain on Sale $135 $100 $0.61 Financial Freedom Net Settlement Items and Servicing Rights Impairment $20 $12 $0.08 Financial Freedom Related Impairment ($4) ($2) ($0.01) FY16 Continuing Operations Discontinued Operations ($ in millions, except for per share data) Discontinued Operations Continuing Operations FY17

25 4Q17 Earnings Commercial Banking Consumer Banking Commercial Finance $9.7 Real Estate Finance $5.6 Rail $6.3 Rail: NACCO $1.1 Business Capital $6.5 Average Loans and Leases: $29.3 Legacy Consumer Mortgages $3.4 Reverse Mortgages $0.9 Other Consumer Banking $2.5 Average Loans: $6.7 Certain balances may not sum due to rounding. (1) Net of credit balances of factoring clients of $1.6 billion. A Leading National Bank for Lending and Leasing to the Middle Market and Small Businesses ▪ Commercial Finance : Middle - market lender with expertise in targeted industries and products. Emphasis on asset growth and lead - managed transactions. ▪ Rai l: Leading railcar lessor providing financial solutions to customers in the U.S., Canada and Mexico. Focus on maintaining utilization rate; market demand pressuring renewal pricing. Sale of European Rail business (NACCO) expected to close in the second half of 2018. ▪ Real Estate Finance : Leading lender to commercial real estate investors and developers; deep industry relationships, underwriting experience and market expertise. ▪ Business Capital : Leading equipment lessor and lender; among the nations largest providers of factoring services. Trusted business partner providing innovative technology, industry expertise and unique residual knowledge. ▪ Legacy Consumer Mortgages : Run - off legacy consumer mortgage portfolio. High margins and loss share agreement. Reverse Mortgage portfolio expected to be sold in the second quarter of 2018. ▪ Other Consumer Banking : − Consumer deposit products, residential mortgage and SBA products offered through OneWest retail branches. − Online banking : Well - recognized Direct Banking channel offers online savings accounts & CDs nationally. ($ in billions)

26 4Q17 Earnings Highlights vs. Prior Quarter vs. Year - ago Quarter Commercial Banking ▪ Net Finance Revenue: decreased $5 million from the prior quarter, primarily driven by higher interest expense, lower purchase accounting accretion in Commercial Finance and Real Estate Finance and lower net rental income in Rail, partially offset by interest recoveries and the impact of asset growth and higher interest rates ▪ Other Non - Interest Income: increased $2 million from the prior quarter, as higher capital markets fee income in Commercial Finance was partially offset by lower gains on asset sales in Business Capital and Rail ▪ Operating Expenses: essentially unchanged ▪ Goodwill Impairment: $256 million mostly related to Equipment Finance in our Commercial Banking segment ▪ Provision for Credit Losses: increased reflecting the establishment of reserves on asset growth in Commercial Finance ▪ Net Finance Revenue: decreased primarily due to higher interest expense, lower purchase accounting accretion and lower net rental income in Rail, partially offset by interest recoveries and the impact of higher interest rates ▪ Other Non - Interest Income: decreased $19 million, primarily driven by higher interest expense and lower gains on sales as the year - ago quarter included a $22 million gain on an investment related to a loan workout in Commercial Finance ▪ Operating Expenses: decreased by $15 million, reflecting cost reduction initiatives ▪ Goodwill Impairment: in the year - ago quarter, we recognized a $35 million charge related to Commercial Services in our Commercial Banking segment ▪ Provision for Credit Losses: increased modestly as lower net charge - offs were more than offset by the establishment of reserves due to asset growth in the current quarter Certain balances may not sum due to rounding. (1) Net of depreciation and maintenance and other operating lease expenses. Change from ($ in millions) 4Q17 3Q17 4Q16 3Q17 4Q16 $ % $ % Interest Income 315 309 322 5 1.6% (8) (2.3%) Net Operating Lease Revenues(1) 120 123 125 (3) (2.4%) (5) (3.6%) Interest Expense 139 131 127 7 5.7% 12 9.4% Net Finance Revenue 296 301 320 (5) (1.8%) (24) (7.4%) Other Non-Interest Income 73 71 92 2 3.0% (19) (20.3%) Provision for Credit Losses 29 11 31 18 NM (2) (7.1%) Operating Expenses 168 169 183 (1) (0.4%) (15) (8.4%) Goodwill Impairment 256 - 35 256 NM 221 NM Pre-Tax (Loss) Income from Continuing Operations (83) 193 163 (276) NM (246) NM Key Metrics Average Earning Assets 29,507 29,011 29,505 496 1.7% 3 0.0% Net Finance Margin 4.01% 4.16% 4.34% Net Efficiency Ratio 45.1% 44.9% 44.1% PTI-ROAEA (1.1%) 2.7% 2.2% (15) bps (33) bps 20 bps 100 bps NM NM

27 4Q17 Earnings Commercial Banking Divisional Performance Commercial Finance Rail 10,647 10,217 9,858 9,541 9,749 5.54% 5.16% 5.61% 5.58% 5.61% 4.15% 3.83% 4.09% 3.97% 3.94% 4Q16 1Q17 2Q17 3Q17 4Q17 AEA Gross Yield Net Finance Margin 7,287 7,320 7,393 7,543 7,583 12.22% 11.98% 11.70% 11.44% 11.25% 4.29% 4.47% 4.20% 4.29% 4.14% 4Q16 1Q17 2Q17 3Q17 4Q17 AEA Gross Yield Net Finance Margin ($ in millions) 4Q17 3Q17 4Q16 $ % $ % Average Loans and Leases 9,655 9,450 10,564 204 2.2% (909) (8.6%) AEA 9,749 9,541 10,647 208 2.2% (898) (8.4%) Net Finance Revenue 96 95 110 1 1.4% (14) (13.0%) Gross Yield 5.6% 5.6% 5.5% Net Finance Margin 3.9% 4.0% 4.2% Change from (10) bps (30) bps - 10 bps 3Q17 4Q16 ($ in millions) 4Q17 3Q17 4Q16 3Q17 4Q16 $ % $ % Average Loans and Leases 7,484 7,462 7,174 22 0.3% 309 4.3% AEA 7,583 7,543 7,287 41 0.5% 297 4.1% Net Finance Revenue 79 81 78 (2) (3.0%) 0 0.5% Gross Yield 11.3% 11.4% 12.2% Net Finance Margin 4.1% 4.3% 4.3% (10) bps (90) bps (20) bps (20) bps Change from
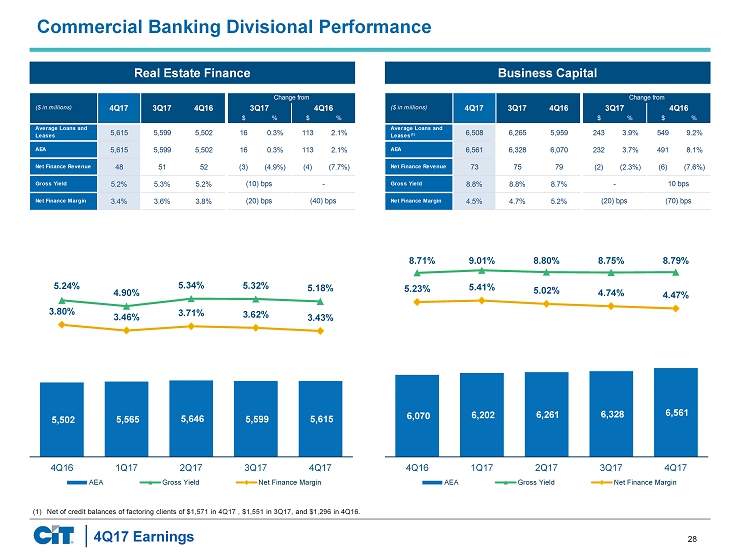
28 4Q17 Earnings Commercial Banking Divisional Performance Real Estate Finance Business Capital 5,502 5,565 5,646 5,599 5,615 5.24% 4.90% 5.34% 5.32% 5.18% 3.80% 3.46% 3.71% 3.62% 3.43% 4Q16 1Q17 2Q17 3Q17 4Q17 AEA Gross Yield Net Finance Margin 6,070 6,202 6,261 6,328 6,561 8.71% 9.01% 8.80% 8.75% 8.79% 5.23% 5.41% 5.02% 4.74% 4.47% 4Q16 1Q17 2Q17 3Q17 4Q17 AEA Gross Yield Net Finance Margin (1) Net of credit balances of factoring clients of $1,571 in 4Q17 , $1,551 in 3Q17, and $1,296 in 4Q16. ($ in millions) 4Q17 3Q17 4Q16 3Q17 4Q16 $ % $ % Average Loans and Leases 5,615 5,599 5,502 16 0.3% 113 2.1% AEA 5,615 5,599 5,502 16 0.3% 113 2.1% Net Finance Revenue 48 51 52 (3) (4.9%) (4) (7.7%) Gross Yield 5.2% 5.3% 5.2% Net Finance Margin 3.4% 3.6% 3.8% Change from (10) bps - (20) bps (40) bps ($ in millions) 4Q17 3Q17 4Q16 3Q17 4Q16 $ % $ % Average Loans and Leases(1) 6,508 6,265 5,959 243 3.9% 549 9.2% AEA 6,561 6,328 6,070 232 3.7% 491 8.1% Net Finance Revenue 73 75 79 (2) (2.3%) (6) (7.6%) Gross Yield 8.8% 8.8% 8.7% Net Finance Margin 4.5% 4.7% 5.2% Change from - 10 bps (20) bps (70) bps

29 4Q17 Earnings Highlights vs. Prior Quarter vs. Year - ago Quarter Consumer Banking ▪ Net Finance Revenue: decreased, as higher negative income on the indemnification asset for the covered loans and lower interest income due to suspended purchase accounting accretion from the held for sale reverse mortgage portfolio were partially offset by an increase in the benefit in interest expense received from the other segments for the value of the excess deposits Consumer Banking generates ▪ Provision for Credit Losses: decreased $17 million; the prior quarter included a $15 million noteworthy item related to the Financial Freedom Transaction ▪ Other Non - Interest Income: increased $36 million; prior quarter included $27 million of noteworthy items related to the Financial Freedom Transaction and due to an increase in gains on asset sales from the reverse mortgage portfolio ▪ Operating Expenses: essentially unchanged ▪ Net Finance Revenue: decreased, as higher negative income on the indemnification asset for the covered loans and lower interest income due to suspended purchase accounting accretion from the held for sale reverse mortgage portfolio were partially offset by an increase in the benefit in interest expense received from the other segments for the value of the excess deposits Consumer Banking generates ▪ Other Non - Interest Income: increased $6 million, due to an increase in gains on asset sales from the reverse mortgage portfolio ▪ Goodwill Impairment: i n the year - ago quarter, we recognized $319 goodwill impairment charge related to our Consumer Banking segment ▪ Operating Expenses: decreased by $19 million; excluding the impact of $27 million of noteworthy items in the year - ago quarter, expenses increased slightly due to higher advertising and marketing Change from ($ in millions) 4Q17 3Q17 4Q16 3Q17 4Q16 $ % $ % Interest Income 84 92 107 (8) (8.6%) (23) (21.1%) Interest (Benefit) (20) (16) (4) (4) (23.1%) (16) NM Net Finance Revenue 104 108 111 (4) (3.9%) (7) (5.9%) Other Non-Interest Income 13 (23) 7 36 NM 6 88.6% Provision for Credit Losses 2 19 6 (17) (90.5%) (4) (69.5%) Operating Expenses 104 106 123 (3) (2.5%) (19) (15.6%) Goodwill Impairment - - 319 - - (319) NM Pre-Tax Income (Loss) from Continuing Operations 12 (40) (331) 52 NM 342 NM Key Metrics Average Earning Assets 6,886 6,904 7,458 (19) (0.3%) (572) (7.7%) Net Finance Margin 6.04% 6.27% 5.93% Net Efficiency Ratio 84.4% 118.9% 100.5% PTI-ROAEA 0.7% (2.3%) (17.7%) (23) bps 11 bps NM NM 300 bps NM
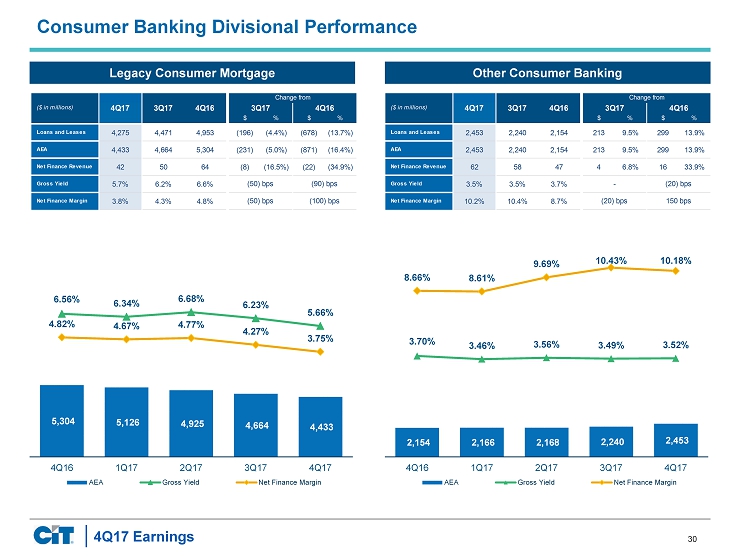
30 4Q17 Earnings Consumer Banking Divisional Performance Legacy Consumer Mortgage Other Consumer Banking 5,304 5,126 4,925 4,664 4,433 6.56% 6.34% 6.68% 6.23% 5.66% 4.82% 4.67% 4.77% 4.27% 3.75% 4Q16 1Q17 2Q17 3Q17 4Q17 AEA Gross Yield Net Finance Margin 2,154 2,166 2,168 2,240 2,453 3.70% 3.46% 3.56% 3.49% 3.52% 8.66% 8.61% 9.69% 10.43% 10.18% 4Q16 1Q17 2Q17 3Q17 4Q17 AEA Gross Yield Net Finance Margin ($ in millions) 4Q17 3Q17 4Q16 3Q17 4Q16 $ % $ % Loans and Leases 4,275 4,471 4,953 (196) (4.4%) (678) (13.7%) AEA 4,433 4,664 5,304 (231) (5.0%) (871) (16.4%) Net Finance Revenue 42 50 64 (8) (16.5%) (22) (34.9%) Gross Yield 5.7% 6.2% 6.6% Net Finance Margin 3.8% 4.3% 4.8% Change from (50) bps (90) bps (50) bps (100) bps ($ in millions) 4Q17 3Q17 4Q16 3Q17 4Q16 $ % $ % Loans and Leases 2,453 2,240 2,154 213 9.5% 299 13.9% AEA 2,453 2,240 2,154 213 9.5% 299 13.9% Net Finance Revenue 62 58 47 4 6.8% 16 33.9% Gross Yield 3.5% 3.5% 3.7% Net Finance Margin 10.2% 10.4% 8.7% Change from - (20) bps (20) bps 150 bps

31 4Q17 Earnings NACCO Related – Noteworthy Items $10 million net tax benefits including the revaluation of net DTLs caused by enacted French tax reform Change in Accounting for LIHTC Investments – Noteworthy Items Cumulative earnings adjustment to reflect the change in our accounting policy for LIHTCs from the equity method to the proportional amortization method to better reflect the economics of our LIHTC investments ▪ $38 million expense impacting tax provision (Note this is partially offset by a $29 million benefit impacting other income) Other Tax Items – Discrete Reversed $26 million of DTA valuation allowances established in 3Q17 Other discrete tax charges for the quarter of ~$3 million The net impact on 4Q17 of the U.S. Tax Cut and Jobs Act is a $12 million one - time benefit, reflected in the provision for income taxes line item The $12 million net benefit is comprised of three components: 1. A $3 million benefit due to the revaluation of our net federal DTLs caused by a reduction in the corporate tax rate 2. A $14 million benefit from the reduction of DTLs on previously untaxed and unremitted earnings 3. A $5 million expense due to the revaluation of our LIHTC investments as the reduced corporate tax rate will create less future tax credits We have recorded the $12 million net benefit from U.S. tax reform as a Noteworthy Item for 4Q17 U.S. Tax Reform Other 4Q17 Tax Impacts U.S. Tax Reform and Other Tax Items Affecting 4Q17 • Tax provision excluding noteworthy and other discrete items is ~39% for 4Q17 and ~34% for FY 2017 • We expect the go forward Effective Tax Rate before the impact of discrete items to be in the 25 - 26% area reflecting the U.S. tax reform and mix of business

32 4Q17 Earnings Highlights Petroleum and gas 46% Rail 18% Agriculture 14% Cement and Building Products 6% Petrochemicals 6% Coal and Utilities 3% Chemicals (non petrochemical) 3% Other 2% Steel and Metals 1% Mining 1% Total Net Investment:~$6.3 billion Covered Hopper - Other, 32% Covered Hopper - O&G Related, 8% Tank Cars - Other, 14% Tank Cars O&G Related, 13% Mill/Coil Gondolas, 10% Coal, 9% Boxcars, 7% Flatcars, 1% Other, 6% Locomotives, 0.3% Total Cars: ~117k O&G = Oil and Gas Includes Operating Leases only Diversified North American Rail Fleet Diversified fleet serving a broad range of customers and industries ▪ Approximately 500 clients ▪ ~76% shippers and ~24% railroads ▪ Strong customer service and long - term customer relationships ▪ Young, well maintained equipment (average age of 12 years) Utilization and lease rate trends off peak levels across portfolio Energy Related Rail Cars: ▪ Tank cars: ~15,000 for the transportation of crude ▪ Sand cars: ~9,000 supporting crude and natural gas drilling ▪ Coal cars: ~11,000 for the transportation of coal Portfolio management strategies: ▪ Shorten lease terms while lease rates are weaker ▪ Bank funding on new deliveries ▪ Selective disposal of non - performing assets ▪ Divert cars from crude oil to alternative services (e.g. to ethanol and other refined products, etc.) Fleet by Type Operating Leases by Industry

33 4Q17 Earnings Non - GAAP Disclosures (1) Certain balances may not sum due to rounding. (1) Reconciliations of non - GAAP measurements to GAAP measurements that are included in our quarterly earnings release are not repeat ed in this presentation. (2) Operating expenses exclusive of restructuring costs and intangible amortization is a non - GAAP measure used by management to comp are period over period expenses. (3) Net efficiency ratio is a non - GAAP measurement used by management to measure operating expenses (before restructuring costs and intangible amortization) to the level of total net revenues. Quarter Ended Quarter Ended Quarter Ended December 31, September 30, December 31, Adjusted Other Non-Interest Income 2017 2017 2016 Other Non-Interest Income 137 63 (118) LIHTC Methodology Change (29) Financial Freedom Transaction - Impairment on REO 5 Financial Freedom Transaction - Impairment on Reverse Mortgage Indemnification Asset 9 Financial Freedom Transaction - Impairment on HECMs-HFS 12 TRS Termination Charge 243 Canada Portfolio Sale Gain (22) Adjusted Other Non-Interest Income 108 90 103 Adjusted Other Non-Interest Income as a % of AEA 0.97% 0.79% 0.88% Quarter Ended Quarter Ended Quarter Ended December 31, September 30, December 31, Adjusted Operating Expenses 2017 2017 2016 Operating expenses 304 277 341 Intangible asset amortization 6 6 6 Provision for Restructuring Costs 32 3 4 Legacy OneWest Bank Matters - - 27 Operating expenses exclusive of noteworthy items and intangible assets amortization(2) 266 268 304 Adjusted operating expenses (exclusive of noteworthy items and intangible assets amortization) as a % of AEA 2.39% 2.36% 2.59% Quarter Ended Quarter Ended Quarter Ended December 31, September 30, December 31, Adjusted Net Efficiency Ratio(3) 2017 2017 2016 Net Finance Revenue, excluding noteworthy items 391 393 421 Other Non-Interest Income, excluding noteworthy items 108 90 103 Total net revenues, excluding noteworthy items 499 483 524 Adjusted operating expenses exclusive of noteworthy items and intangible assets amortization(2) 266 268 304 Adjusted Net Efficiency Ratio 53.4% 55.5% 57.9%
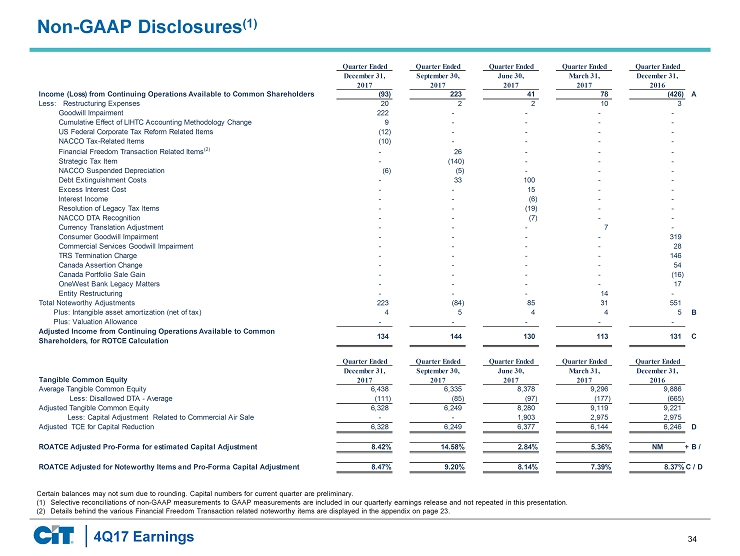
34 4Q17 Earnings Non - GAAP Disclosures (1) Certain balances may not sum due to rounding. Capital numbers for current quarter are preliminary. (1) Selective reconciliations of non - GAAP measurements to GAAP measurements are included in our quarterly earnings release and not r epeated in this presentation. (2) Details behind the various Financial Freedom Transaction related noteworthy items are displayed in the appendix on page 23. Quarter Ended Quarter Ended Quarter Ended Quarter Ended Quarter Ended December 31, September 30, June 30, March 31, December 31, 2017 2017 2017 2017 2016 Income (Loss) from Continuing Operations Available to Common Shareholders (93) 223 41 78 (426) A Less: Restructuring Expenses 20 2 2 10 3 Goodwill Impairment 222 - - - - Cumulative Effect of LIHTC Accounting Methodology Change 9 - - - - US Federal Corporate Tax Reform Related Items (12) - - - - NACCO Tax-Related Items (10) - - - - Financial Freedom Transaction Related Items (2) - 26 - - - Strategic Tax Item - (140) - - - NACCO Suspended Depreciation (6) (5) - - - Debt Extinguishment Costs - 33 100 - - Excess Interest Cost - - 15 - - Interest Income - - (6) - - Resolution of Legacy Tax Items - - (19) - - NACCO DTA Recognition - - (7) - - Currency Translation Adjustment - - - 7 - Consumer Goodwill Impairment - - - - 319 Commercial Services Goodwill Impairment - - - - 28 TRS Termination Charge - - - - 146 Canada Assertion Change - - - - 54 Canada Portfolio Sale Gain - - - - (16) OneWest Bank Legacy Matters - - - - 17 Entity Restructuring - - - 14 - Total Noteworthy Adjustments 223 (84) 85 31 551 Plus: Intangible asset amortization (net of tax) 4 5 4 4 5 B Plus: Valuation Allowance - - - - - Adjusted Income from Continuing Operations Available to Common Shareholders, for ROTCE Calculation 134 144 130 113 131 C Quarter Ended Quarter Ended Quarter Ended Quarter Ended Quarter Ended December 31, September 30, June 30, March 31, December 31, Tangible Common Equity 2017 2017 2017 2017 2016 Average Tangible Common Equity 6,438 6,335 8,378 9,296 9,886 Less: Disallowed DTA - Average (111) (85) (97) (177) (665) Adjusted Tangible Common Equity 6,328 6,249 8,280 9,119 9,221 Less: Capital Adjustment Related to Commercial Air Sale - - 1,903 2,975 2,975 Adjusted TCE for Capital Reduction 6,328 6,249 6,377 6,144 6,246 D ROATCE Adjusted Pro-Forma for estimated Capital Adjustment 8.42% 14.58% 2.84% 5.36% NM A + B / D ROATCE Adjusted for Noteworthy Items and Pro-Forma Capital Adjustment 8.47% 9.20% 8.14% 7.39% 8.37%C / D

35 4Q17 Earnings