
1Q20 Earnings April 21, 2020 Exhibit 99.2
Important Notice This presentation contains forward-looking statements within the meaning of applicable federal securities laws that are based upon our current expectations and assumptions concerning future events, which are subject to a number of risks and uncertainties that could cause actual results to differ materially from those anticipated. The words “expect,” “anticipate,” “estimate,” “forecast,” “initiative,” “objective,” “plan,” “goal,” “project,” “outlook,” “priorities,” “target,” “intend,” “evaluate,” “pursue,” “commence,” “seek,” “may,” “will,” “would,” “could,” “should,” “believe,” “potential,” “continue,” or the negative of any of those words or similar expressions is intended to identify forward-looking statements. All statements contained in this press release, other than statements of historical fact, including without limitation, statements about our plans, strategies, prospects and expectations regarding future events and our financial performance, are forward-looking statements that involve certain risks and uncertainties. In particular, any projections or expectations regarding the acquisition by CIT Bank of Mutual of Omaha Bank, our future revenues, expenses, earnings, capital expenditures, deposits or stock price, as well as the assumptions on which such expectations are based, are such forward-looking statements reflecting only our current judgment and are not guarantees of future performance or results. While these statements represent our current judgment on what the future may hold, and we believe these judgments are reasonable, these statements are not guarantees of any events or financial results, and our actual results may differ materially. Important factors that could cause our actual results to be materially different from our expectations include, among others, the risk that: (i) CIT is unsuccessful in implementing its strategy and business plan, including planned or potential acquisitions or divestitures; (ii) CIT is unable to react to and address key business and regulatory issues; (iii) CIT is unable to achieve the projected revenue growth from its new business initiatives or the projected expense reductions from efficiency improvements; (iv) CIT becomes subject to liquidity constraints and higher funding costs; (v) the parties to a transaction do not obtain regulatory or other approvals or satisfy closing conditions to the transaction on a timely basis, or at all, or approvals are subject to conditions that are not anticipated; (vi) CIT Bank experiences difficulties and delays in integrating CIT Bank’s and Mutual of Omaha Bank’s respective businesses or fully realizing cost savings and other benefits; (vii) changes in asset quality and credit risk, interest rates and capital markets or other economic conditions; or (viii) the duration, extent and severity of the recent COVID-19 (coronavirus) pandemic, including its impacts across our business, operations and employees as well as its effect on our customers and service providers and on economies and markets more generally. We further describe these and other risks that could affect our results in Item 1A, “Risk Factors,” of our latest Annual Report on Form 10-K for the year ended December 31, 2019, which was filed with the Securities and Exchange Commission. Information regarding CIT’s capital ratios consists of preliminary estimates. These estimates are forward-looking statements and are subject to change, possibly materially, as CIT completes its financial statements. Accordingly, you should not place undue reliance on the forward-looking statements contained in this press release. These forward-looking statements speak only as of the date on which the statements were made. The Company undertakes no obligation to update publicly or otherwise revise any forward-looking statements, except where expressly required by law. Non-GAAP Financial Measures Net finance revenue, net operating lease revenue and average earning assets are non-GAAP measurements used by management to gauge portfolio performance. Operating expenses excluding restructuring costs and intangible amortization is a non-GAAP measurement used by management to compare period over period expenses. Net efficiency ratio measures operating expenses (net of restructuring costs and intangible amortization) to our level of total net revenues. Total assets from continuing operations is a non-GAAP measurement used by management to analyze the total asset change on a more consistent basis. Tangible book value and tangible book value per common share are non-GAAP metrics used to analyze banks. Net income excluding noteworthy items, income from continuing operations excluding noteworthy items, and Return of Tangible Common Equity excluding noteworthy items are non-GAAP measures used by management. The Company believes that adjusting for these items provides a measure of the underlying performance of the Company and of continuing operations.
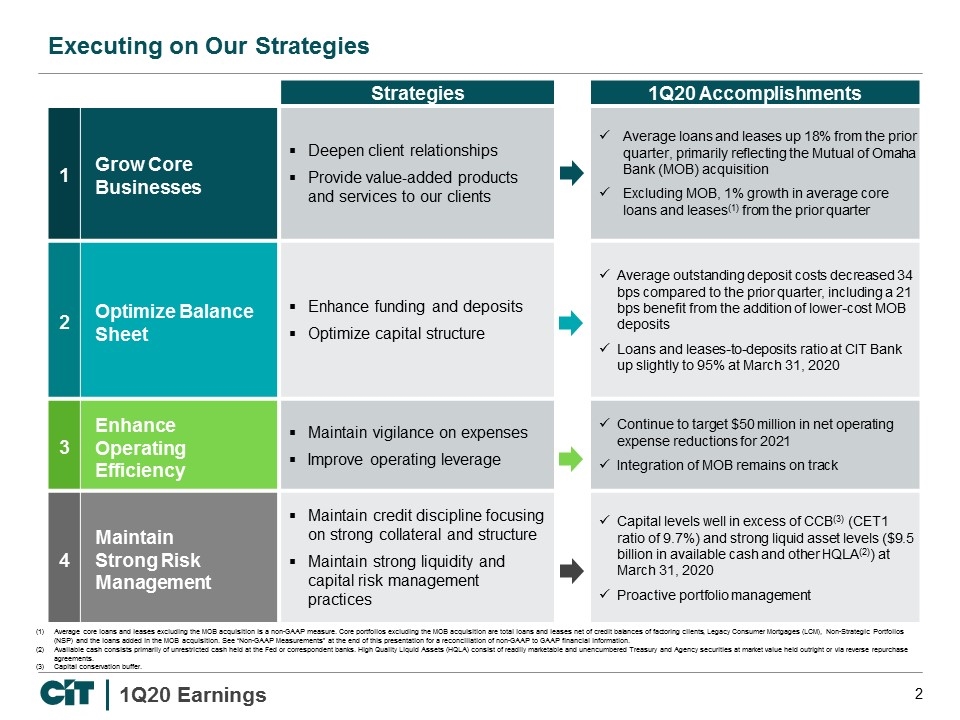
Strategies 1Q20 Accomplishments 1 Grow Core Businesses Deepen client relationships Provide value-added products and services to our clients Average loans and leases up 18% from the prior quarter, primarily reflecting the Mutual of Omaha Bank (MOB) acquisition Excluding MOB, 1% growth in average core loans and leases(1) from the prior quarter 2 Optimize Balance Sheet Enhance funding and deposits Optimize capital structure Average outstanding deposit costs decreased 34 bps compared to the prior quarter, including a 21 bps benefit from the addition of lower-cost MOB deposits Loans and leases-to-deposits ratio at CIT Bank up slightly to 95% at March 31, 2020 3 Enhance Operating Efficiency Maintain vigilance on expenses Improve operating leverage Continue to target $50 million in net operating expense reductions for 2021 Integration of MOB remains on track 4 Maintain Strong Risk Management Maintain credit discipline focusing on strong collateral and structure Maintain strong liquidity and capital risk management practices Capital levels well in excess of CCB(3) (CET1 ratio of 9.7%) and strong liquid asset levels ($9.5 billion in available cash and other HQLA(2)) at March 31, 2020 Proactive portfolio management Executing on Our Strategies Average core loans and leases excluding the MOB acquisition is a non-GAAP measure. Core portfolios excluding the MOB acquisition are total loans and leases net of credit balances of factoring clients, Legacy Consumer Mortgages (LCM), Non-Strategic Portfolios (NSP) and the loans added in the MOB acquisition. See “Non-GAAP Measurements” at the end of this presentation for a reconciliation of non-GAAP to GAAP financial information. Available cash consists primarily of unrestricted cash held at the Fed or correspondent banks. High Quality Liquid Assets (HQLA) consist of readily marketable and unencumbered Treasury and Agency securities at market value held outright or via reverse repurchase agreements. Capital conservation buffer.
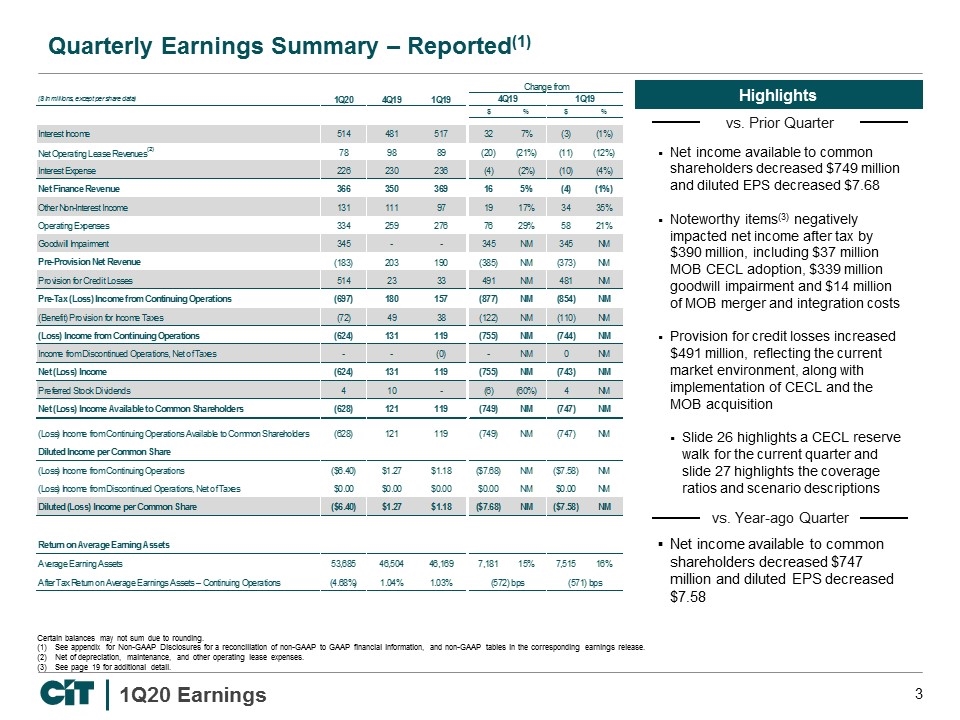
Net income available to common shareholders decreased $749 million and diluted EPS decreased $7.68 Noteworthy items(3) negatively impacted net income after tax by $390 million, including $37 million MOB CECL adoption, $339 million goodwill impairment and $14 million of MOB merger and integration costs Provision for credit losses increased $491 million, reflecting the current market environment, along with implementation of CECL and the MOB acquisition Slide 26 highlights a CECL reserve walk for the current quarter and slide 27 highlights the coverage ratios and scenario descriptions Certain balances may not sum due to rounding. See appendix for Non-GAAP Disclosures for a reconciliation of non-GAAP to GAAP financial information, and non-GAAP tables in the corresponding earnings release. Net of depreciation, maintenance, and other operating lease expenses. See page 19 for additional detail. Quarterly Earnings Summary – Reported(1) Net income available to common shareholders decreased $747 million and diluted EPS decreased $7.58 vs. Prior Quarter vs. Year-ago Quarter
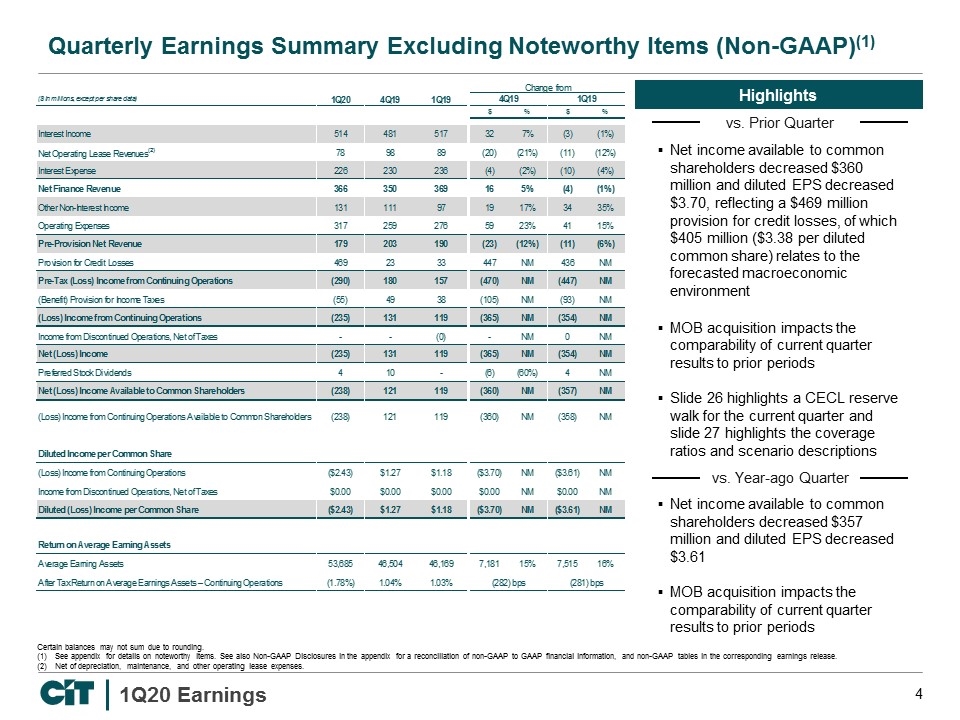
Net income available to common shareholders decreased $360 million and diluted EPS decreased $3.70, reflecting a $469 million provision for credit losses, of which $405 million ($3.38 per diluted common share) relates to the forecasted macroeconomic environment MOB acquisition impacts the comparability of current quarter results to prior periods Slide 26 highlights a CECL reserve walk for the current quarter and slide 27 highlights the coverage ratios and scenario descriptions Certain balances may not sum due to rounding. See appendix for details on noteworthy items. See also Non-GAAP Disclosures in the appendix for a reconciliation of non-GAAP to GAAP financial information, and non-GAAP tables in the corresponding earnings release. Net of depreciation, maintenance, and other operating lease expenses. Quarterly Earnings Summary Excluding Noteworthy Items (Non-GAAP)(1) Net income available to common shareholders decreased $357 million and diluted EPS decreased $3.61 MOB acquisition impacts the comparability of current quarter results to prior periods vs. Prior Quarter vs. Year-ago Quarter
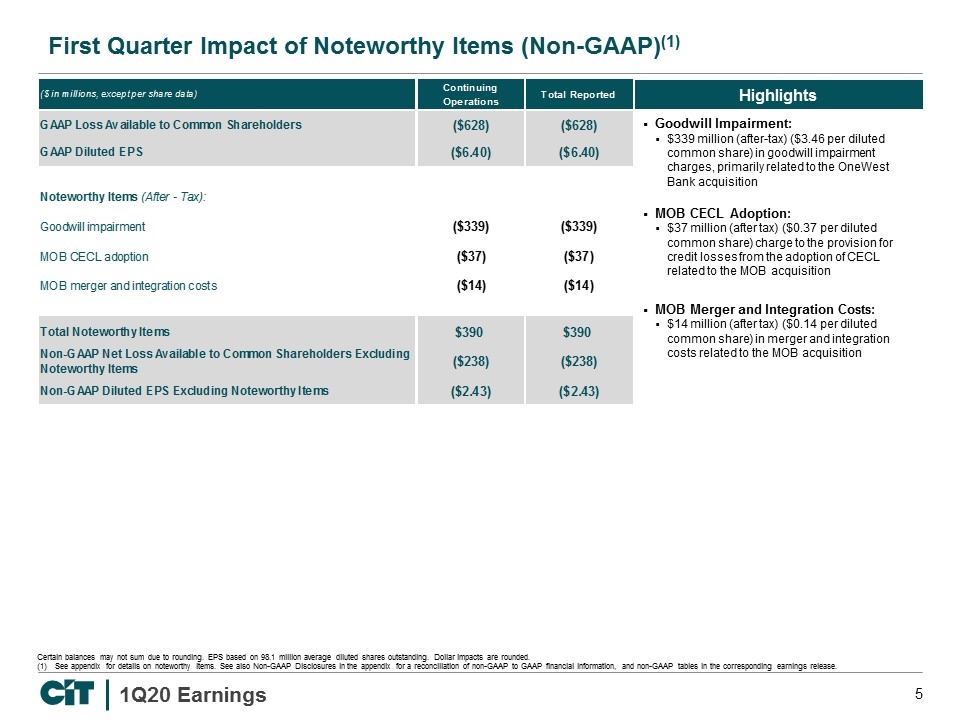
Certain balances may not sum due to rounding. EPS based on 98.1 million average diluted shares outstanding. Dollar impacts are rounded. See appendix for details on noteworthy items. See also Non-GAAP Disclosures in the appendix for a reconciliation of non-GAAP to GAAP financial information, and non-GAAP tables in the corresponding earnings release. First Quarter Impact of Noteworthy Items (Non-GAAP)(1) Goodwill Impairment: $339 million (after-tax) ($3.46 per diluted common share) in goodwill impairment charges, primarily related to the OneWest Bank acquisition MOB CECL Adoption: $37 million (after tax) ($0.37 per diluted common share) charge to the provision for credit losses from the adoption of CECL related to the MOB acquisition MOB Merger and Integration Costs: $14 million (after tax) ($0.14 per diluted common share) in merger and integration costs related to the MOB acquisition
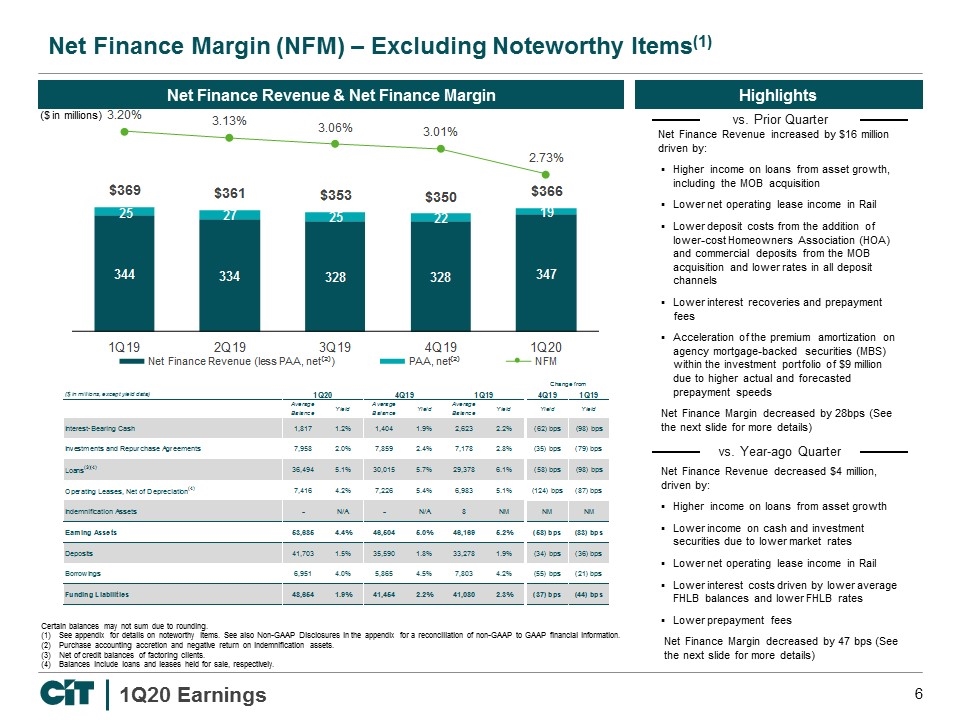
Net Finance Revenue increased by $16 million driven by: Higher income on loans from asset growth, including the MOB acquisition Lower net operating lease income in Rail Lower deposit costs from the addition of lower-cost Homeowners Association (HOA) and commercial deposits from the MOB acquisition and lower rates in all deposit channels Lower interest recoveries and prepayment fees Acceleration of the premium amortization on agency mortgage-backed securities (MBS) within the investment portfolio of $9 million due to higher actual and forecasted prepayment speeds Net Finance Margin decreased by 28bps (See the next slide for more details) Certain balances may not sum due to rounding. See appendix for details on noteworthy items. See also Non-GAAP Disclosures in the appendix for a reconciliation of non-GAAP to GAAP financial information. Purchase accounting accretion and negative return on indemnification assets. Net of credit balances of factoring clients. Balances include loans and leases held for sale, respectively. Net Finance Margin (NFM) – Excluding Noteworthy Items(1) Net Finance Revenue decreased $4 million, driven by: Higher income on loans from asset growth Lower income on cash and investment securities due to lower market rates Lower net operating lease income in Rail Lower interest costs driven by lower average FHLB balances and lower FHLB rates Lower prepayment fees Net Finance Margin decreased by 47 bps (See the next slide for more details) Net Finance Revenue & Net Finance Margin ($ in millions) vs. Prior Quarter vs. Year-ago Quarter
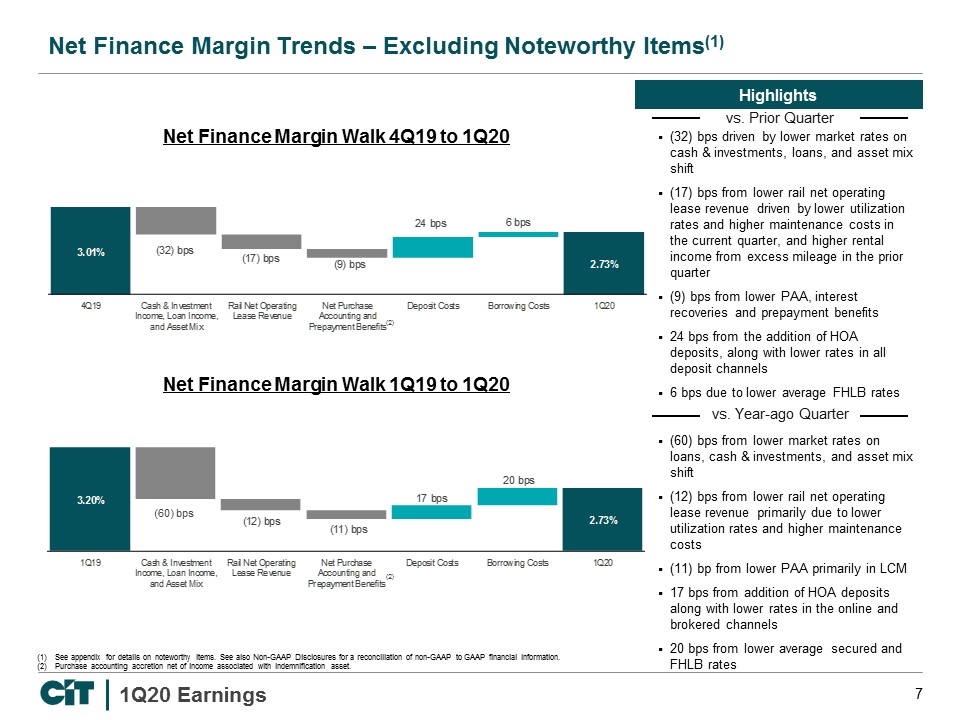
Net Finance Margin Walk 1Q19 to 1Q20 (32) bps driven by lower market rates on cash & investments, loans, and asset mix shift (17) bps from lower rail net operating lease revenue driven by lower utilization rates and higher maintenance costs in the current quarter, and higher rental income from excess mileage in the prior quarter (9) bps from lower PAA, interest recoveries and prepayment benefits 24 bps from the addition of HOA deposits, along with lower rates in all deposit channels 6 bps due to lower average FHLB rates See appendix for details on noteworthy items. See also Non-GAAP Disclosures for a reconciliation of non-GAAP to GAAP financial information. Purchase accounting accretion net of income associated with indemnification asset. Net Finance Margin Trends – Excluding Noteworthy Items(1) (60) bps from lower market rates on loans, cash & investments, and asset mix shift (12) bps from lower rail net operating lease revenue primarily due to lower utilization rates and higher maintenance costs (11) bp from lower PAA primarily in LCM 17 bps from addition of HOA deposits along with lower rates in the online and brokered channels 20 bps from lower average secured and FHLB rates (2) vs. Prior Quarter vs. Year-ago Quarter Net Finance Margin Walk 4Q19 to 1Q20 (2) (60) bps
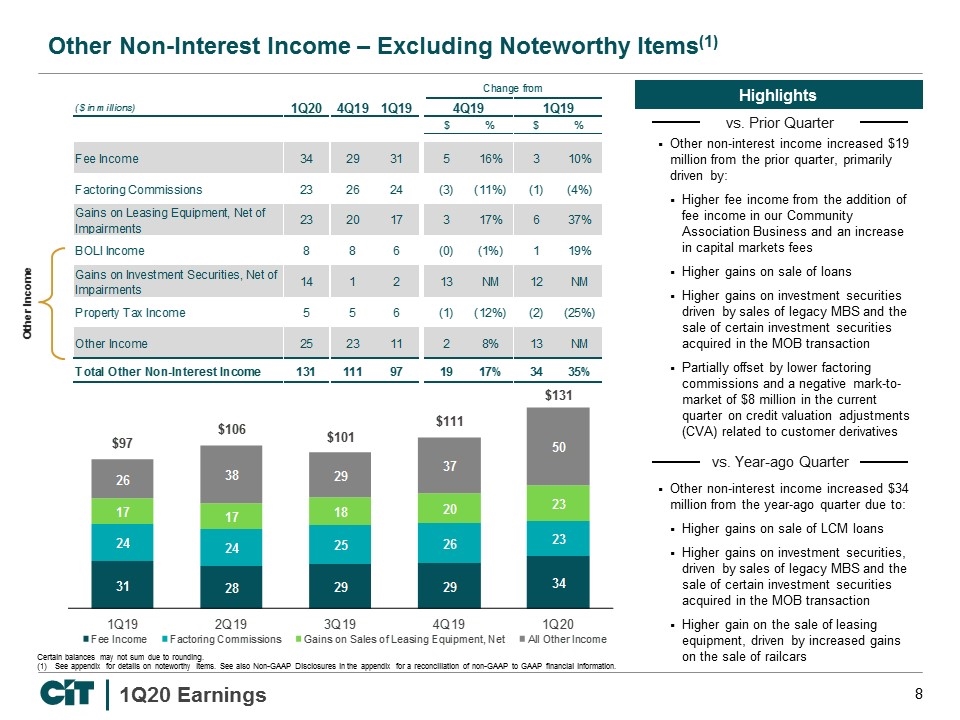
Other non-interest income increased $19 million from the prior quarter, primarily driven by: Higher fee income from the addition of fee income in our Community Association Business and an increase in capital markets fees Higher gains on sale of loans Higher gains on investment securities driven by sales of legacy MBS and the sale of certain investment securities acquired in the MOB transaction Partially offset by lower factoring commissions and a negative mark-to-market of $8 million in the current quarter on credit valuation adjustments (CVA) related to customer derivatives Certain balances may not sum due to rounding. See appendix for details on noteworthy items. See also Non-GAAP Disclosures in the appendix for a reconciliation of non-GAAP to GAAP financial information. Other Non-Interest Income – Excluding Noteworthy Items(1) Other non-interest income increased $34 million from the year-ago quarter due to: Higher gains on sale of LCM loans Higher gains on investment securities, driven by sales of legacy MBS and the sale of certain investment securities acquired in the MOB transaction Higher gain on the sale of leasing equipment, driven by increased gains on the sale of railcars Other Income vs. Prior Quarter vs. Year-ago Quarter
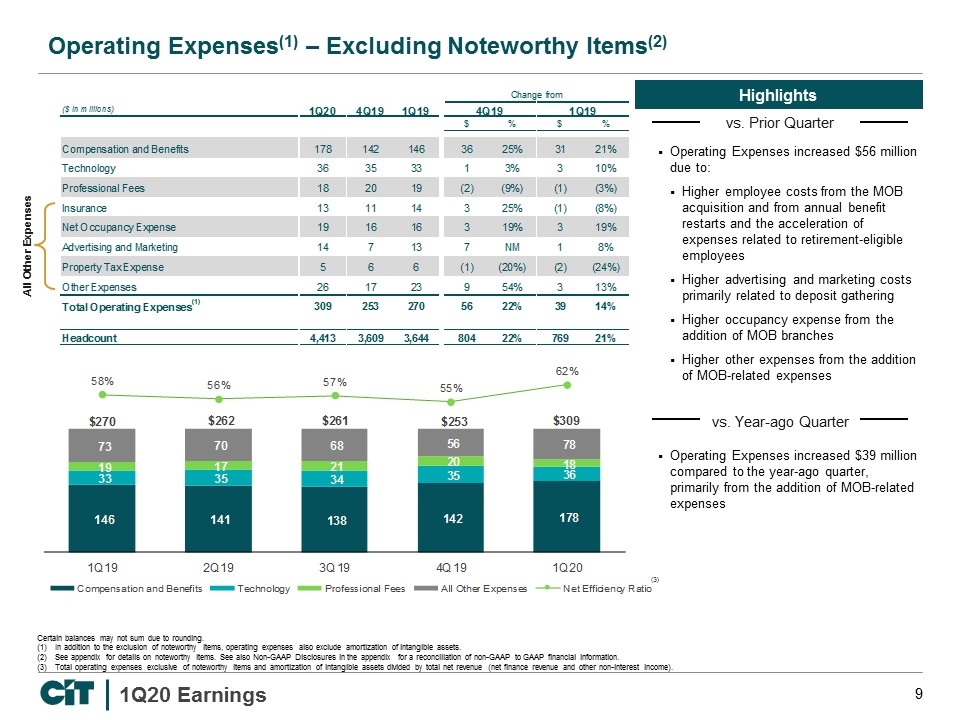
All Other Expenses Operating Expenses(1) – Excluding Noteworthy Items(2) vs. Prior Quarter vs. Year-ago Quarter Certain balances may not sum due to rounding. In addition to the exclusion of noteworthy items, operating expenses also exclude amortization of intangible assets. See appendix for details on noteworthy items. See also Non-GAAP Disclosures in the appendix for a reconciliation of non-GAAP to GAAP financial information. Total operating expenses exclusive of noteworthy items and amortization of intangible assets divided by total net revenue (net finance revenue and other non-interest income). (3) Operating Expenses increased $56 million due to: Higher employee costs from the MOB acquisition and from annual benefit restarts and the acceleration of expenses related to retirement-eligible employees Higher advertising and marketing costs primarily related to deposit gathering Higher occupancy expense from the addition of MOB branches Higher other expenses from the addition of MOB-related expenses Operating Expenses increased $39 million compared to the year-ago quarter, primarily from the addition of MOB-related expenses
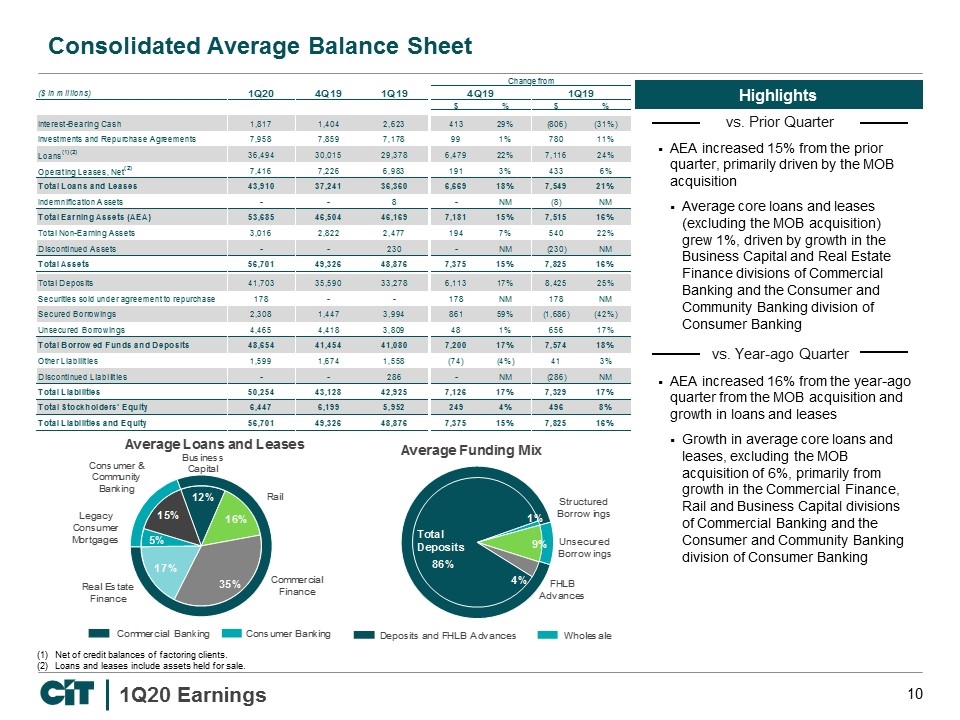
Consolidated Average Balance Sheet vs. Prior Quarter vs. Year-ago Quarter Net of credit balances of factoring clients. Loans and leases include assets held for sale. AEA increased 15% from the prior quarter, primarily driven by the MOB acquisition Average core loans and leases (excluding the MOB acquisition) grew 1%, driven by growth in the Business Capital and Real Estate Finance divisions of Commercial Banking and the Consumer and Community Banking division of Consumer Banking AEA increased 16% from the year-ago quarter from the MOB acquisition and growth in loans and leases Growth in average core loans and leases, excluding the MOB acquisition of 6%, primarily from growth in the Commercial Finance, Rail and Business Capital divisions of Commercial Banking and the Consumer and Community Banking division of Consumer Banking
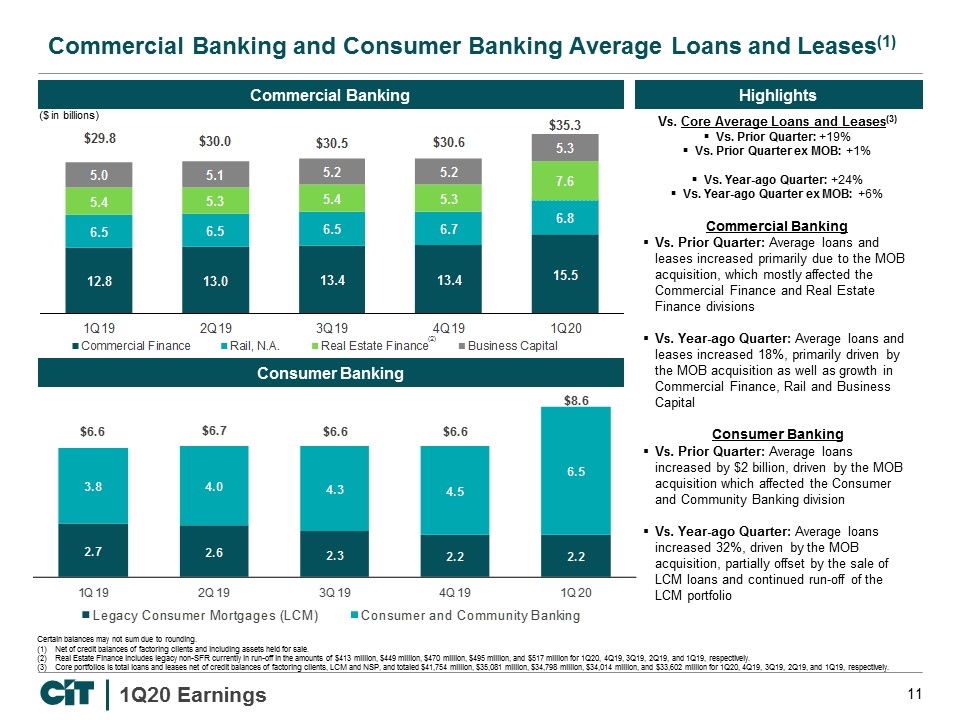
Commercial Banking and Consumer Banking Average Loans and Leases(1) ($ in billions) (2) Consumer Banking Certain balances may not sum due to rounding. Net of credit balances of factoring clients and including assets held for sale. Real Estate Finance includes legacy non-SFR currently in run-off in the amounts of $413 million, $449 million, $470 million, $495 million, and $517 million for 1Q20, 4Q19, 3Q19, 2Q19, and 1Q19, respectively. Core portfolios is total loans and leases net of credit balances of factoring clients, LCM and NSP, and totaled $41,754 million, $35,081 million, $34,798 million, $34,014 million, and $33,602 million for 1Q20, 4Q19, 3Q19, 2Q19, and 1Q19, respectively. Commercial Banking Vs. Core Average Loans and Leases(3) Vs. Prior Quarter: +19% Vs. Prior Quarter ex MOB: +1% Vs. Year-ago Quarter: +24% Vs. Year-ago Quarter ex MOB: +6% Commercial Banking Vs. Prior Quarter: Average loans and leases increased primarily due to the MOB acquisition, which mostly affected the Commercial Finance and Real Estate Finance divisions Vs. Year-ago Quarter: Average loans and leases increased 18%, primarily driven by the MOB acquisition as well as growth in Commercial Finance, Rail and Business Capital Consumer Banking Vs. Prior Quarter: Average loans increased by $2 billion, driven by the MOB acquisition which affected the Consumer and Community Banking division Vs. Year-ago Quarter: Average loans increased 32%, driven by the MOB acquisition, partially offset by the sale of LCM loans and continued run-off of the LCM portfolio
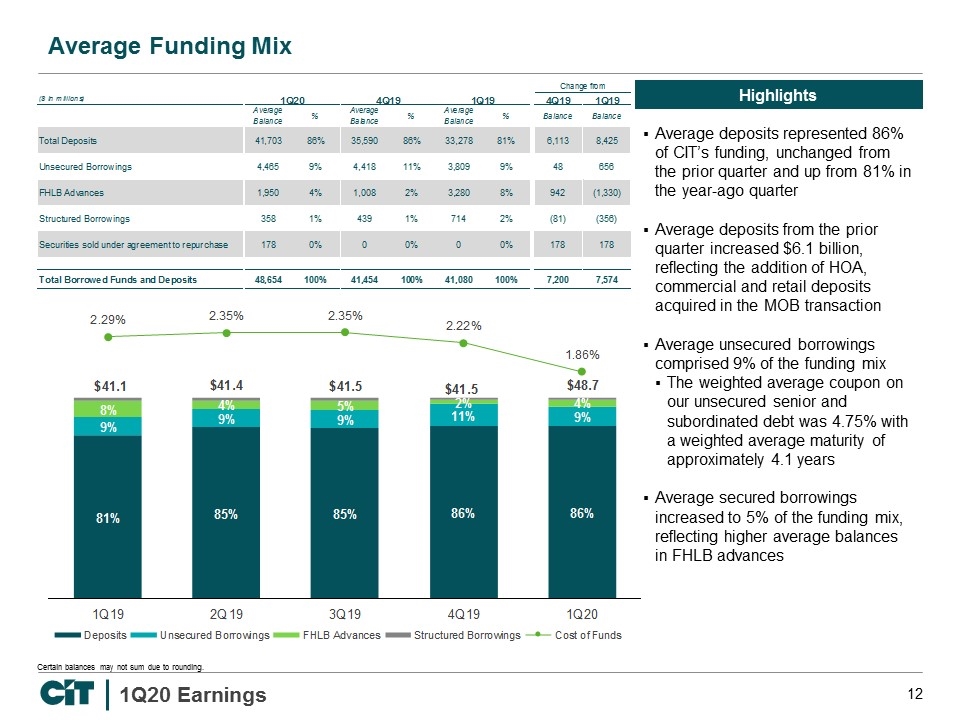
Average Funding Mix Certain balances may not sum due to rounding. Average deposits represented 86% of CIT’s funding, unchanged from the prior quarter and up from 81% in the year-ago quarter Average deposits from the prior quarter increased $6.1 billion, reflecting the addition of HOA, commercial and retail deposits acquired in the MOB transaction Average unsecured borrowings comprised 9% of the funding mix The weighted average coupon on our unsecured senior and subordinated debt was 4.75% with a weighted average maturity of approximately 4.1 years Average secured borrowings increased to 5% of the funding mix, reflecting higher average balances in FHLB advances
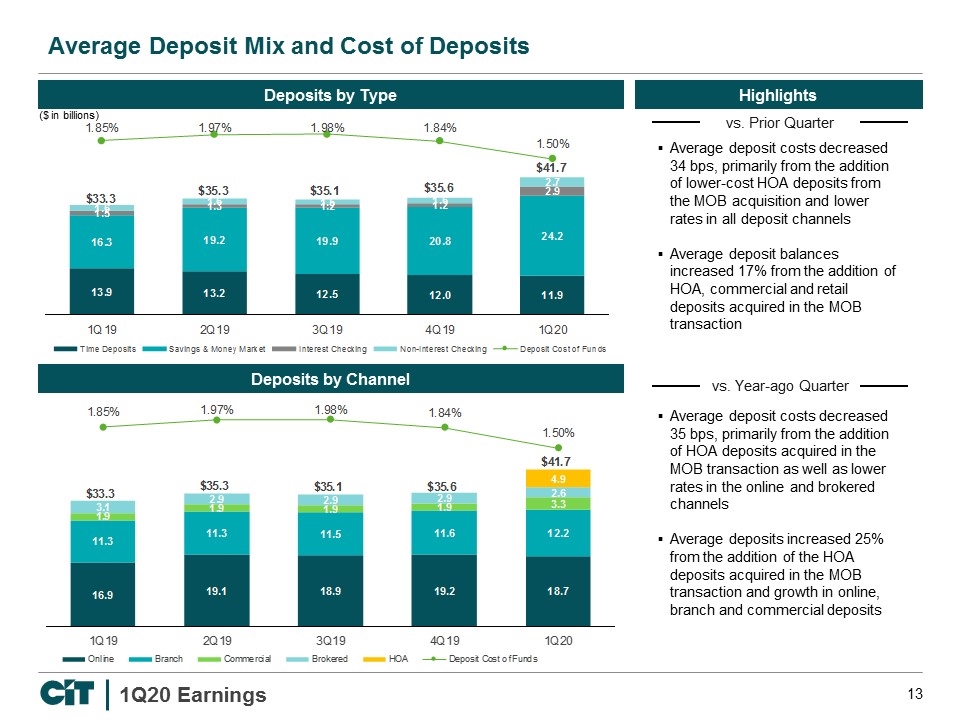
Average Deposit Mix and Cost of Deposits vs. Prior Quarter vs. Year-ago Quarter Deposits by Type Deposits by Channel ($ in billions) Average deposit costs decreased 34 bps, primarily from the addition of lower-cost HOA deposits from the MOB acquisition and lower rates in all deposit channels Average deposit balances increased 17% from the addition of HOA, commercial and retail deposits acquired in the MOB transaction Average deposit costs decreased 35 bps, primarily from the addition of HOA deposits acquired in the MOB transaction as well as lower rates in the online and brokered channels Average deposits increased 25% from the addition of the HOA deposits acquired in the MOB transaction and growth in online, branch and commercial deposits
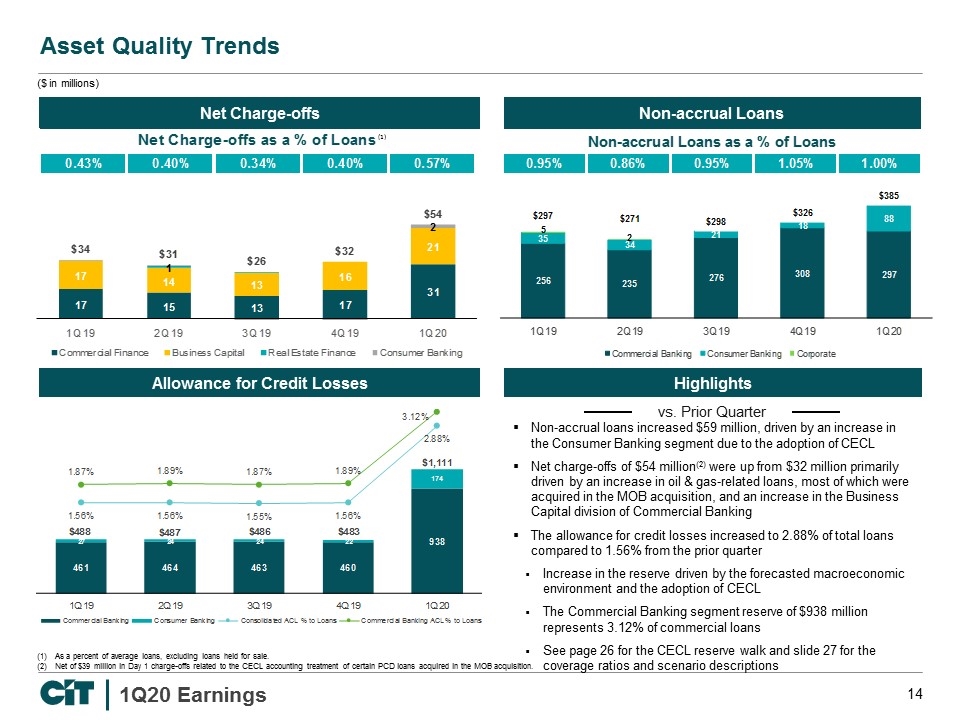
Asset Quality Trends Allowance for Credit Losses ($ in millions) Non-accrual Loans Net Charge-offs As a percent of average loans, excluding loans held for sale. Net of $39 million in Day 1 charge-offs related to the CECL accounting treatment of certain PCD loans acquired in the MOB acquisition. (1) Non-accrual loans increased $59 million, driven by an increase in the Consumer Banking segment due to the adoption of CECL Net charge-offs of $54 million(2) were up from $32 million primarily driven by an increase in oil & gas-related loans, most of which were acquired in the MOB acquisition, and an increase in the Business Capital division of Commercial Banking The allowance for credit losses increased to 2.88% of total loans compared to 1.56% from the prior quarter Increase in the reserve driven by the forecasted macroeconomic environment and the adoption of CECL The Commercial Banking segment reserve of $938 million represents 3.12% of commercial loans See page 26 for the CECL reserve walk and slide 27 for the coverage ratios and scenario descriptions Highlights vs. Prior Quarter
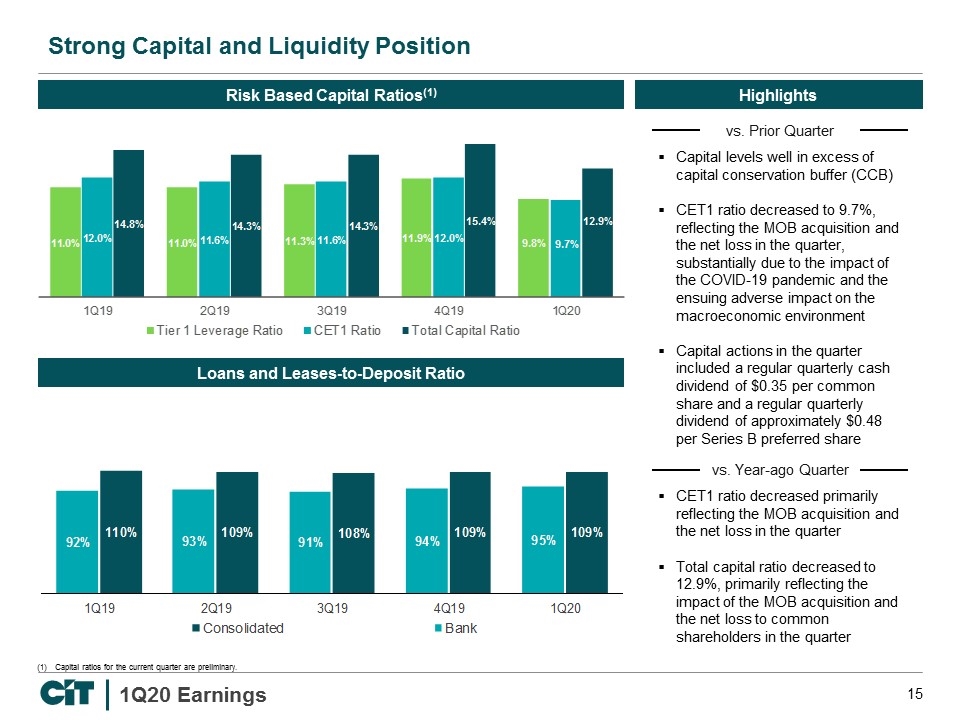
Strong Capital and Liquidity Position Capital ratios for the current quarter are preliminary. Risk Based Capital Ratios(1) Loans and Leases-to-Deposit Ratio vs. Prior Quarter vs. Year-ago Quarter Capital levels well in excess of capital conservation buffer (CCB) CET1 ratio decreased to 9.7%, reflecting the MOB acquisition and the net loss in the quarter, substantially due to the impact of the COVID-19 pandemic and the ensuing adverse impact on the macroeconomic environment Capital actions in the quarter included a regular quarterly cash dividend of $0.35 per common share and a regular quarterly dividend of approximately $0.48 per Series B preferred share CET1 ratio decreased primarily reflecting the MOB acquisition and the net loss in the quarter Total capital ratio decreased to 12.9%, primarily reflecting the impact of the MOB acquisition and the net loss to common shareholders in the quarter
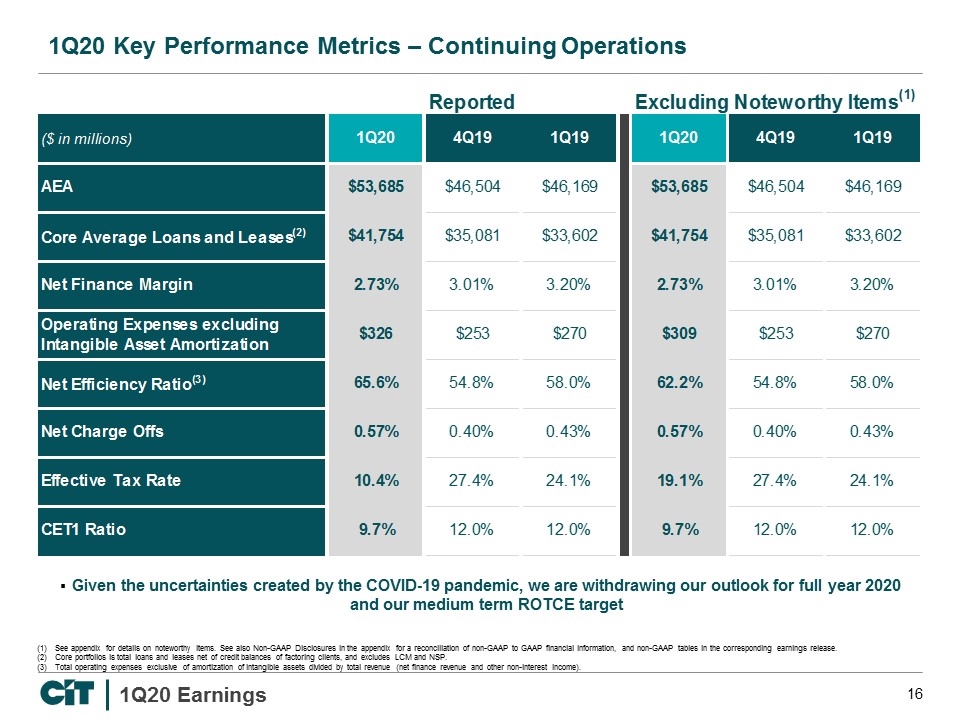
1Q20 Key Performance Metrics – Continuing Operations See appendix for details on noteworthy items. See also Non-GAAP Disclosures in the appendix for a reconciliation of non-GAAP to GAAP financial information, and non-GAAP tables in the corresponding earnings release. Core portfolios is total loans and leases net of credit balances of factoring clients, and excludes LCM and NSP. Total operating expenses exclusive of amortization of intangible assets divided by total revenue (net finance revenue and other non-interest income). Given the uncertainties created by the COVID-19 pandemic, we are withdrawing our outlook for full year 2020 and our medium term ROTCE target
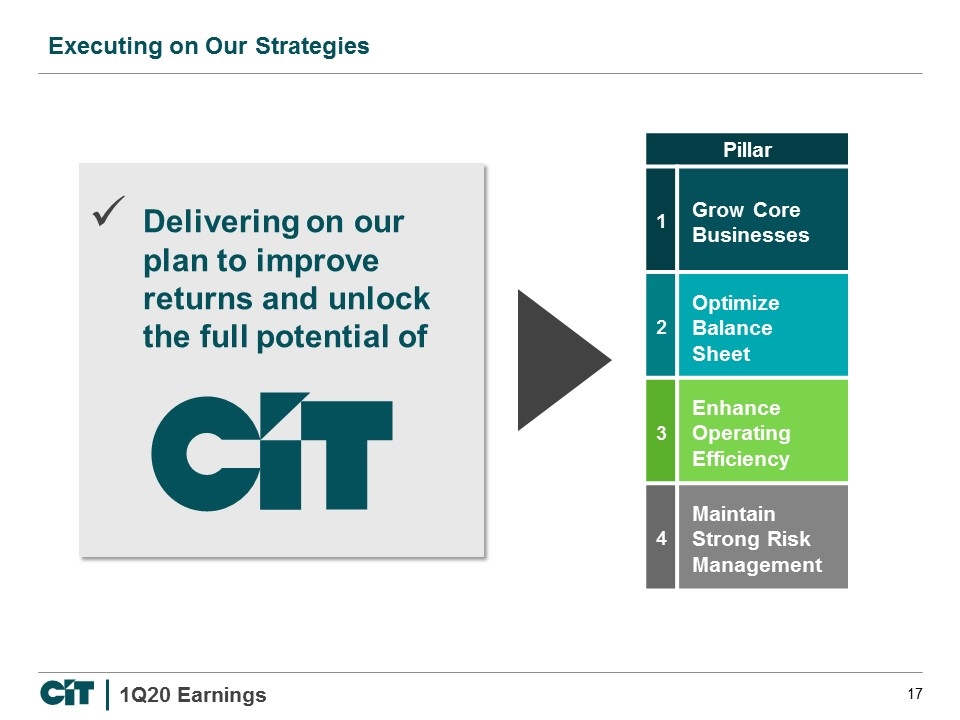
Executing on Our Strategies Pillar 1 Grow Core Businesses 2 Optimize Balance Sheet 3 Enhance Operating Efficiency 4 Maintain Strong Risk Management Delivering on our plan to improve returns and unlock the full potential of
Appendix
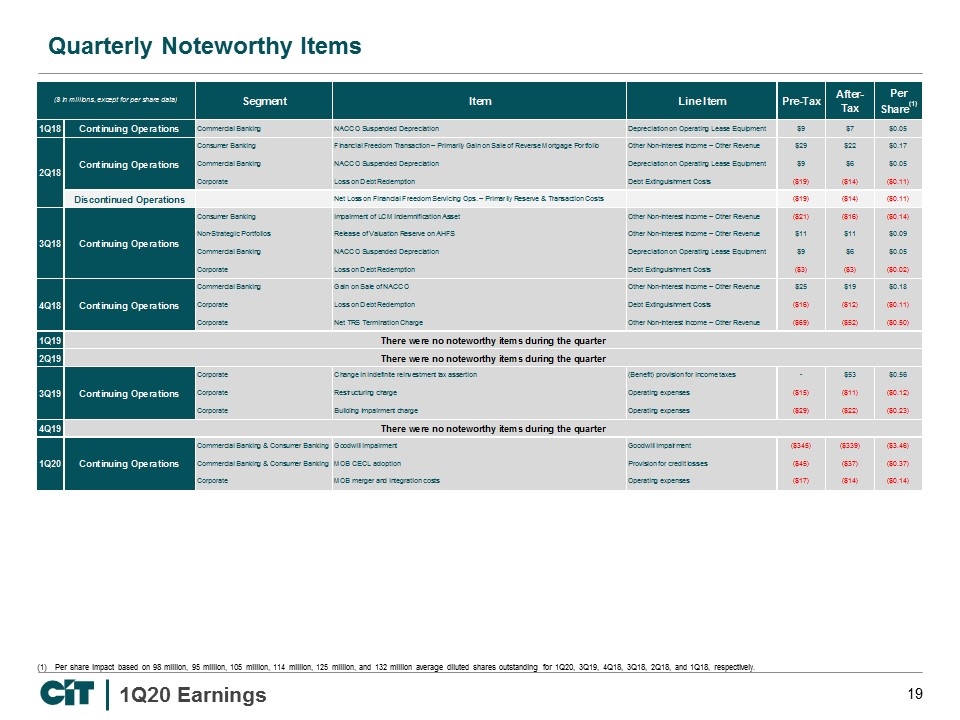
Quarterly Noteworthy Items Per share impact based on 98 million, 95 million, 105 million, 114 million, 125 million, and 132 million average diluted shares outstanding for 1Q20, 3Q19, 4Q18, 3Q18, 2Q18, and 1Q18, respectively.
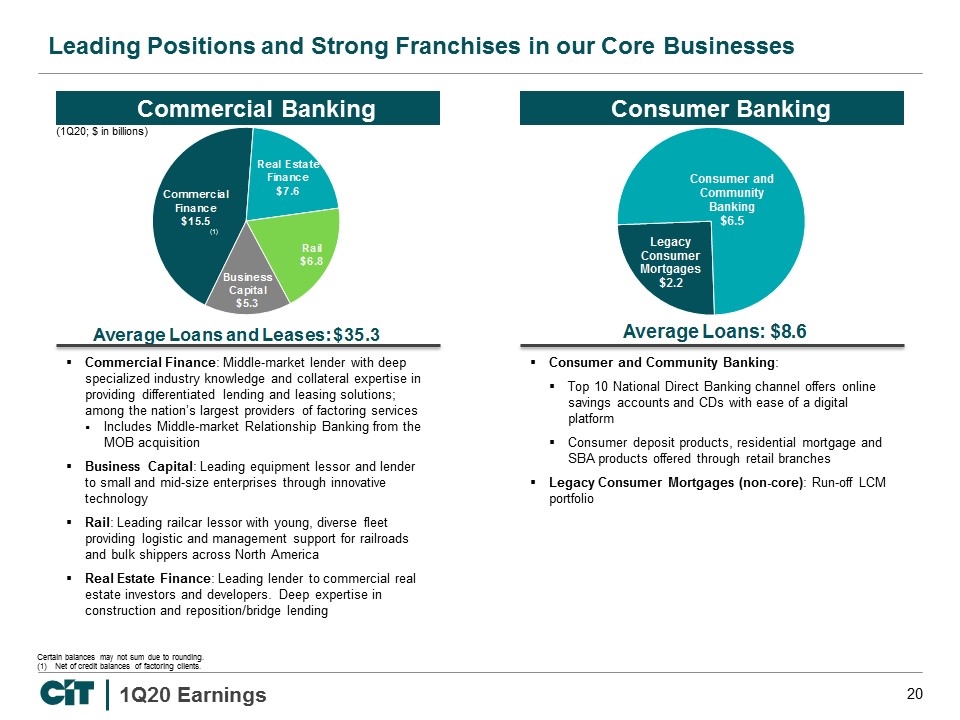
Leading Positions and Strong Franchises in our Core Businesses Certain balances may not sum due to rounding. Net of credit balances of factoring clients. Consumer Banking (1Q20; $ in billions) (1) Commercial Banking Commercial Finance: Middle-market lender with deep specialized industry knowledge and collateral expertise in providing differentiated lending and leasing solutions; among the nation’s largest providers of factoring services Includes Middle-market Relationship Banking from the MOB acquisition Business Capital: Leading equipment lessor and lender to small and mid-size enterprises through innovative technology Rail: Leading railcar lessor with young, diverse fleet providing logistic and management support for railroads and bulk shippers across North America Real Estate Finance: Leading lender to commercial real estate investors and developers. Deep expertise in construction and reposition/bridge lending Consumer and Community Banking: Top 10 National Direct Banking channel offers online savings accounts and CDs with ease of a digital platform Consumer deposit products, residential mortgage and SBA products offered through retail branches Legacy Consumer Mortgages (non-core): Run-off LCM portfolio
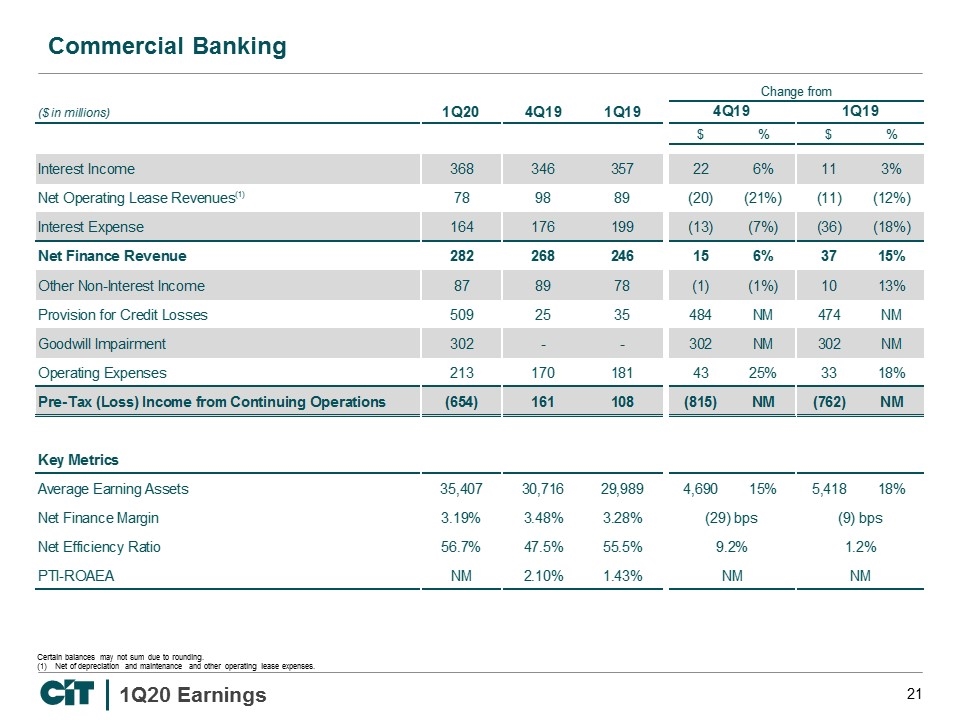
Commercial Banking Certain balances may not sum due to rounding. Net of depreciation and maintenance and other operating lease expenses.
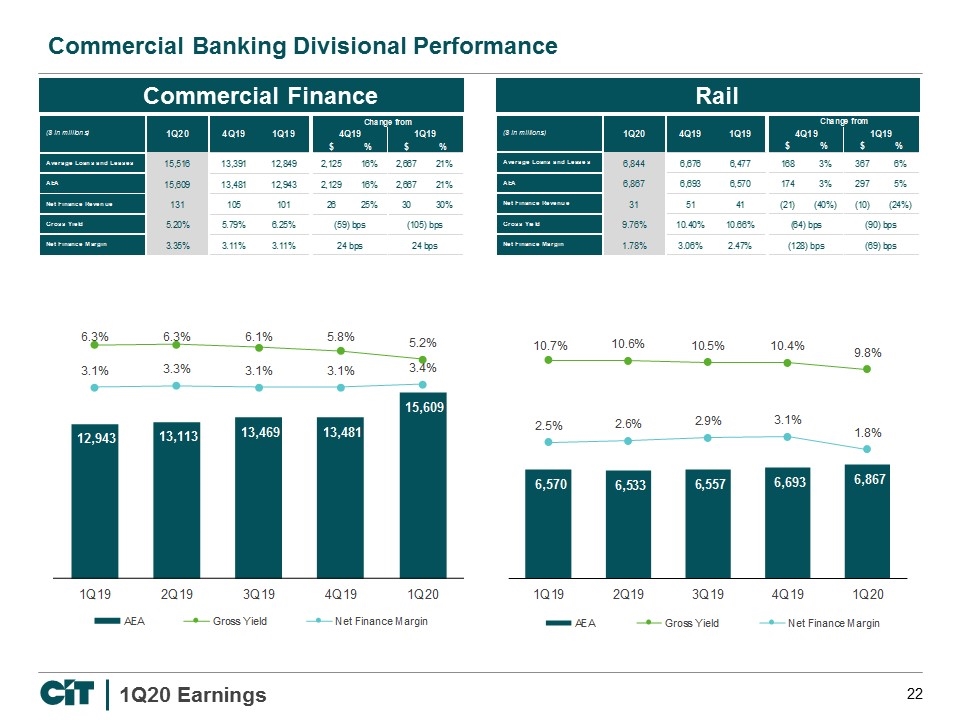
Commercial Banking Divisional Performance Commercial Finance Rail
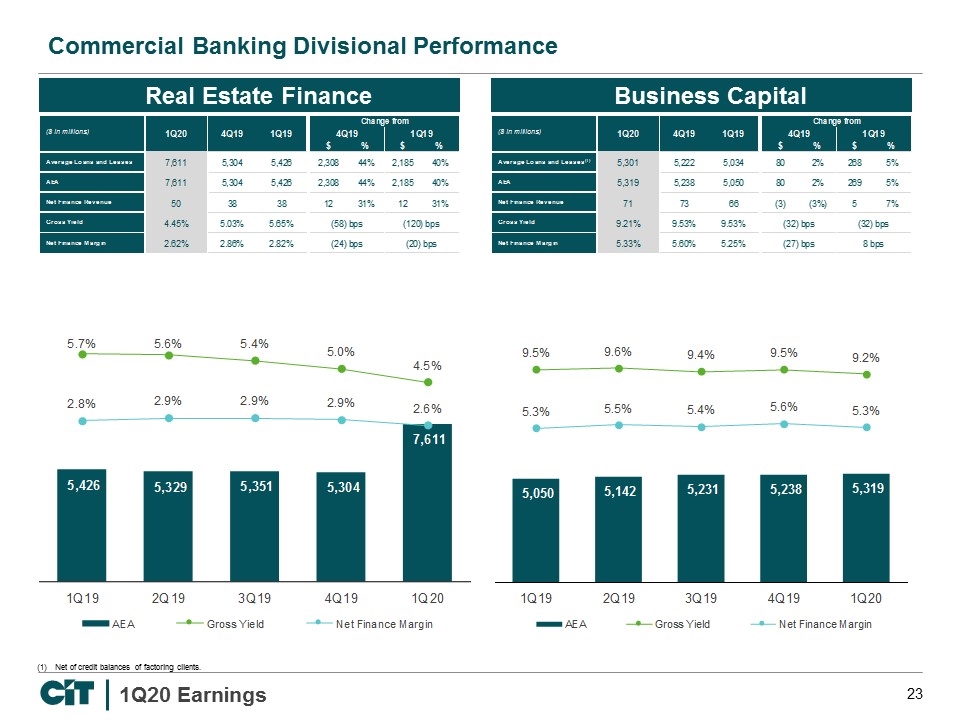
Commercial Banking Divisional Performance Net of credit balances of factoring clients. Real Estate Finance Business Capital
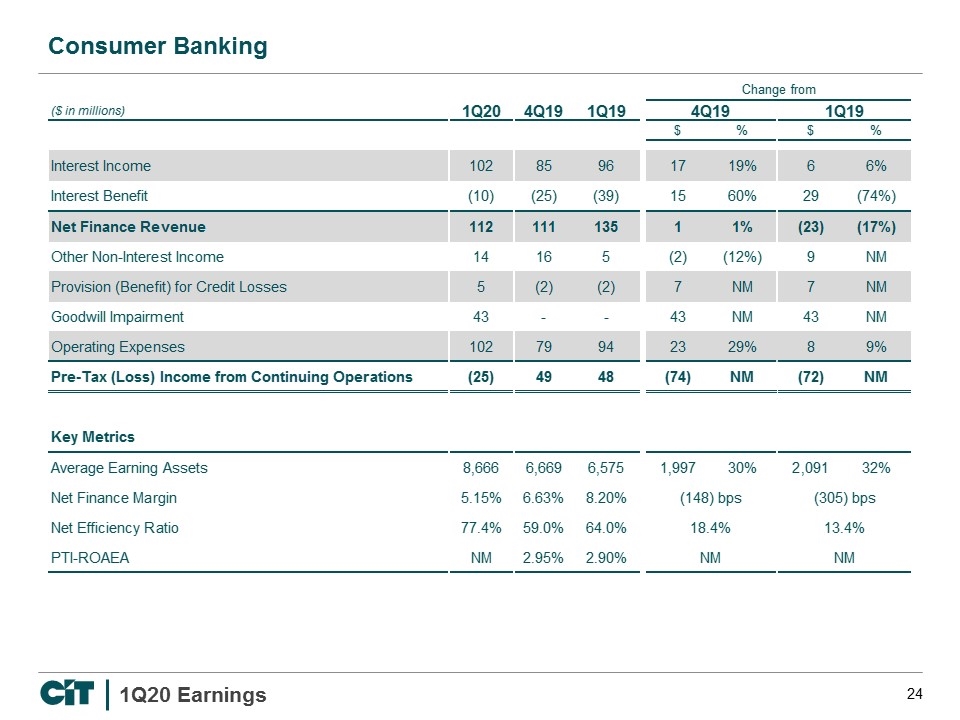
Consumer Banking
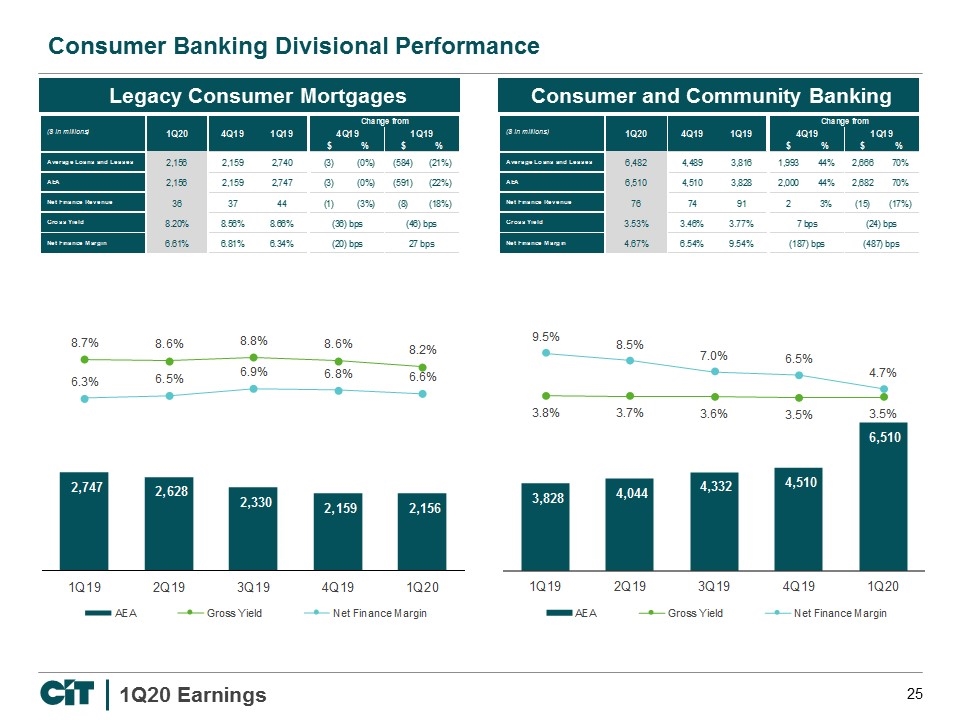
Consumer Banking Divisional Performance Legacy Consumer Mortgages Consumer and Community Banking
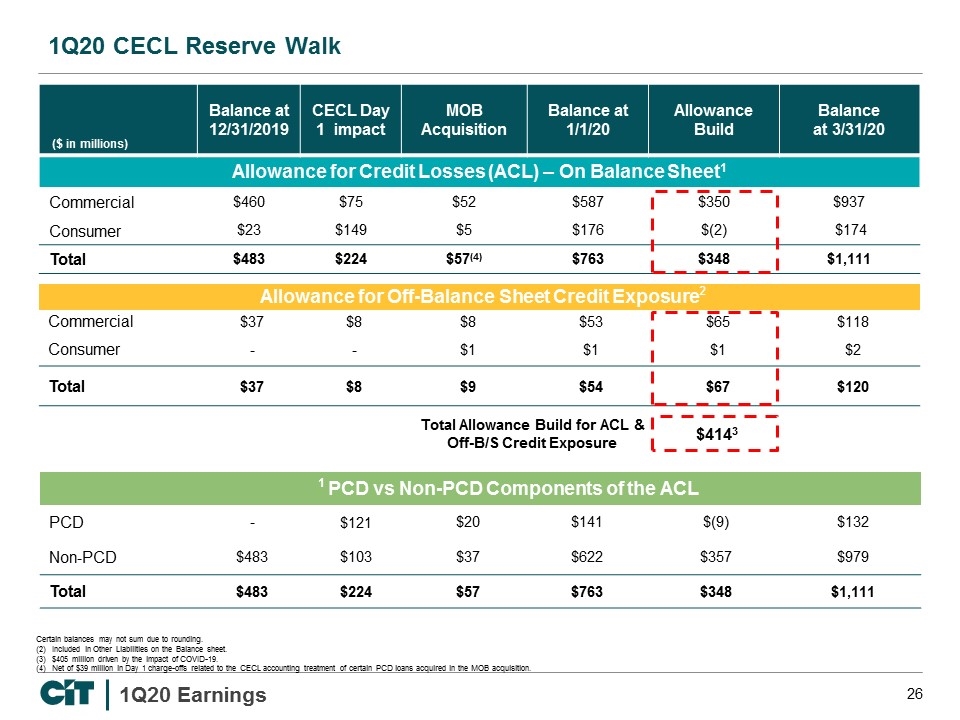
1Q20 CECL Reserve Walk ($ in millions) Balance at 12/31/2019 CECL Day 1 impact MOB Acquisition Balance at 1/1/20 Allowance Build Balance at 3/31/20 Allowance for Credit Losses (ACL) – On Balance Sheet1 Commercial $460 $75 $52 $587 $350 $937 Consumer $23 $149 $5 $176 $(2) $174 Total $483 $224 $57(4) $763 $348 $1,111 Allowance for Off-Balance Sheet Credit Exposure2 Commercial $37 $8 $8 $53 $65 $118 Consumer - - $1 $1 $1 $2 Total $37 $8 $9 $54 $67 $120 Certain balances may not sum due to rounding. (2) Included in Other Liabilities on the Balance sheet. (3) $405 million driven by the impact of COVID-19. (4) Net of $39 million in Day 1 charge-offs related to the CECL accounting treatment of certain PCD loans acquired in the MOB acquisition. 1 PCD vs Non-PCD Components of the ACL PCD - $121 $20 $141 $(9) $132 Non-PCD $483 $103 $37 $622 $357 $979 Total $483 $224 $57 $763 $348 $1,111 Total Allowance Build for ACL & Off-B/S Credit Exposure $4143
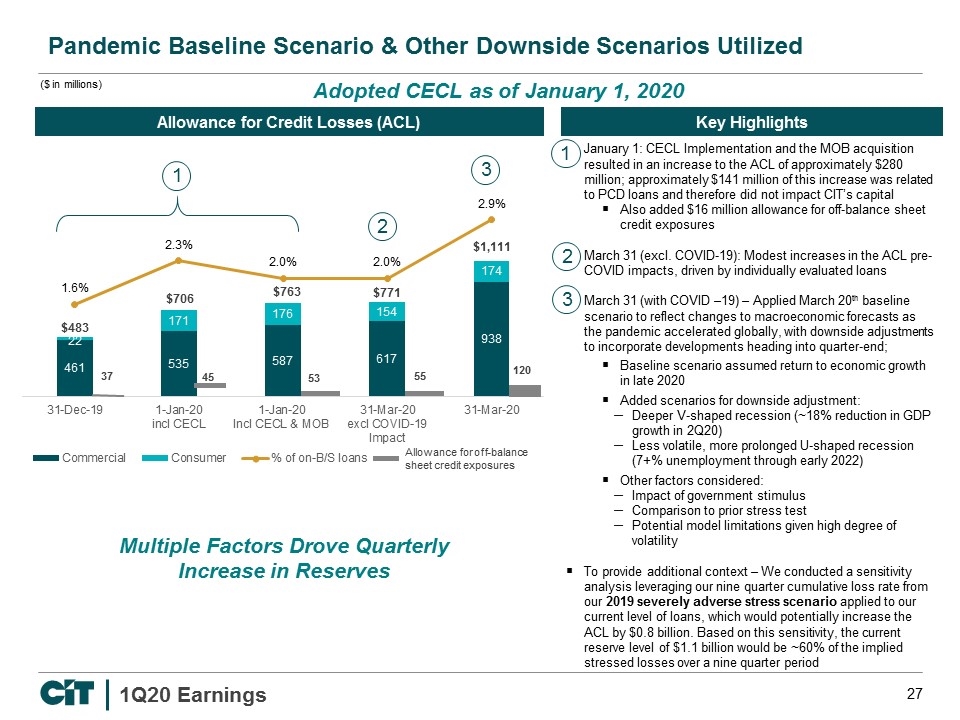
Multiple Factors Drove Quarterly Increase in Reserves Allowance for off-balance sheet credit exposures 37 53 55 120 ($ in millions) Key Highlights Pandemic Baseline Scenario & Other Downside Scenarios Utilized Allowance for Credit Losses (ACL) 45 Adopted CECL as of January 1, 2020 1 2 3 January 1: CECL Implementation and the MOB acquisition resulted in an increase to the ACL of approximately $280 million; approximately $141 million of this increase was related to PCD loans and therefore did not impact CIT’s capital Also added $16 million allowance for off-balance sheet credit exposures March 31 (excl. COVID-19): Modest increases in the ACL pre-COVID impacts, driven by individually evaluated loans March 31 (with COVID –19) – Applied March 20th baseline scenario to reflect changes to macroeconomic forecasts as the pandemic accelerated globally, with downside adjustments to incorporate developments heading into quarter-end; Baseline scenario assumed return to economic growth in late 2020 Added scenarios for downside adjustment: Deeper V-shaped recession (~18% reduction in GDP growth in 2Q20) Less volatile, more prolonged U-shaped recession (7+% unemployment through early 2022) Other factors considered: Impact of government stimulus Comparison to prior stress test Potential model limitations given high degree of volatility To provide additional context – We conducted a sensitivity analysis leveraging our nine quarter cumulative loss rate from our 2019 severely adverse stress scenario applied to our current level of loans, which would potentially increase the ACL by $0.8 billion. Based on this sensitivity, the current reserve level of $1.1 billion would be ~60% of the implied stressed losses over a nine quarter period 1 2 3
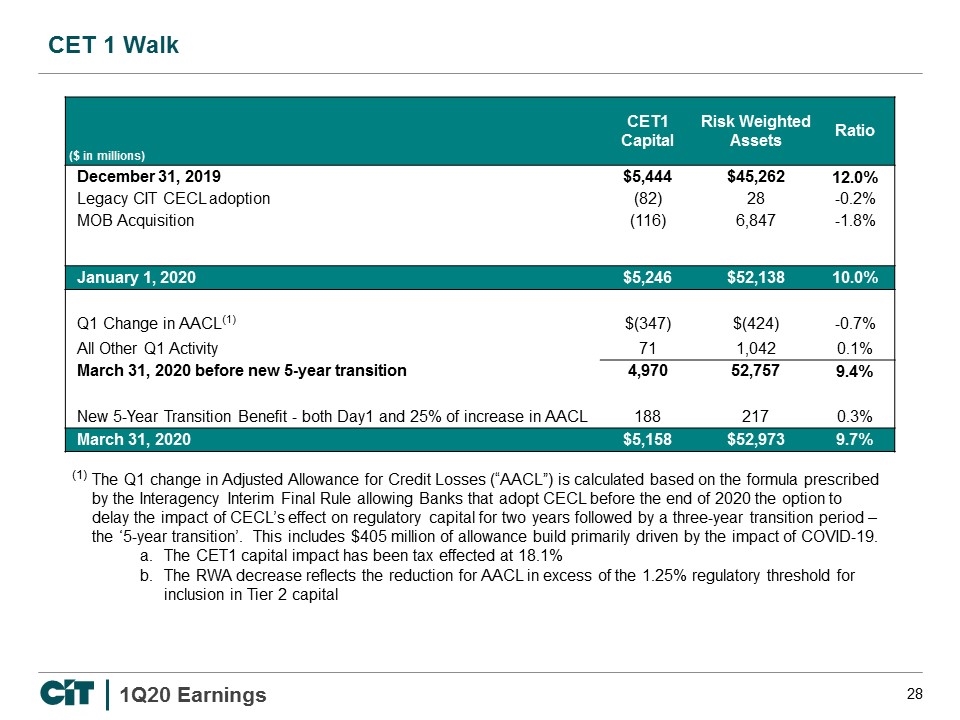
CET 1 Walk The Q1 change in Adjusted Allowance for Credit Losses (“AACL”) is calculated based on the formula prescribed by the Interagency Interim Final Rule allowing Banks that adopt CECL before the end of 2020 the option to delay the impact of CECL’s effect on regulatory capital for two years followed by a three-year transition period – the ‘5-year transition’. This includes $405 million of allowance build primarily driven by the impact of COVID-19. The CET1 capital impact has been tax effected at 18.1% The RWA decrease reflects the reduction for AACL in excess of the 1.25% regulatory threshold for inclusion in Tier 2 capital ($ in millions) CET1 Capital Risk Weighted Assets Ratio December 31, 2019 $5,444 $45,262 12.0% Legacy CIT CECL adoption (82) 28 -0.2% MOB Acquisition (116) 6,847 -1.8% January 1, 2020 $5,246 $52,138 10.0% Q1 Change in AACL(1) $(347) $(424) -0.7% All Other Q1 Activity 71 1,042 0.1% March 31, 2020 before new 5-year transition 4,970 52,757 9.4% New 5-Year Transition Benefit - both Day1 and 25% of increase in AACL 188 217 0.3% March 31, 2020 $5,158 $52,973 9.7% (1)
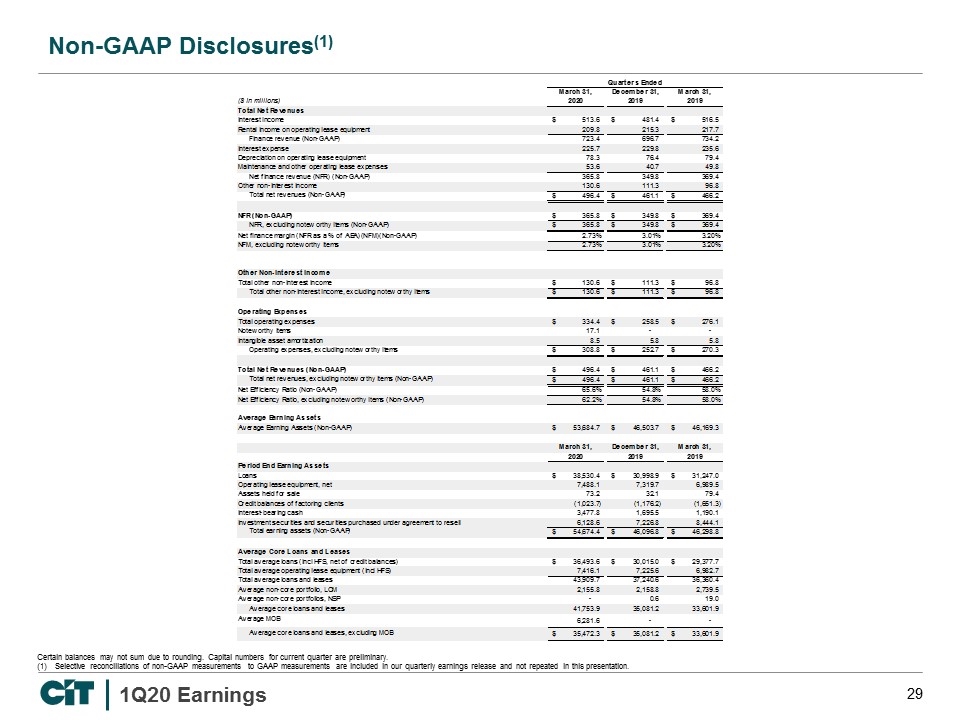
Non-GAAP Disclosures(1) Certain balances may not sum due to rounding. Capital numbers for current quarter are preliminary. Selective reconciliations of non-GAAP measurements to GAAP measurements are included in our quarterly earnings release and not repeated in this presentation. ($ in millions)
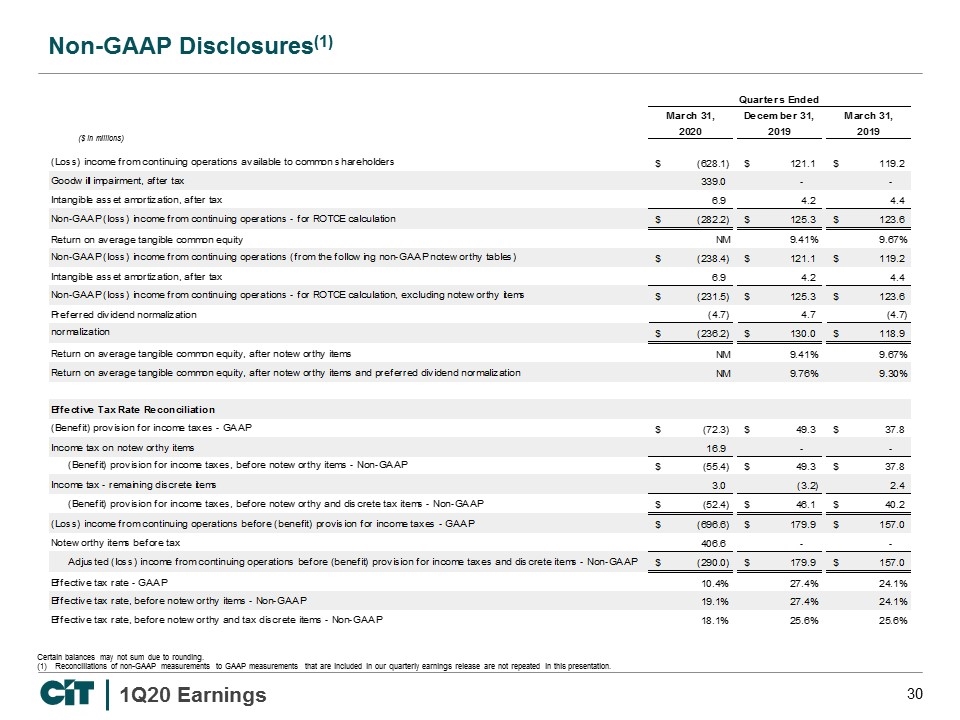
Non-GAAP Disclosures(1) Certain balances may not sum due to rounding. Reconciliations of non-GAAP measurements to GAAP measurements that are included in our quarterly earnings release are not repeated in this presentation. ($ in millions)
