Annual Report 2015

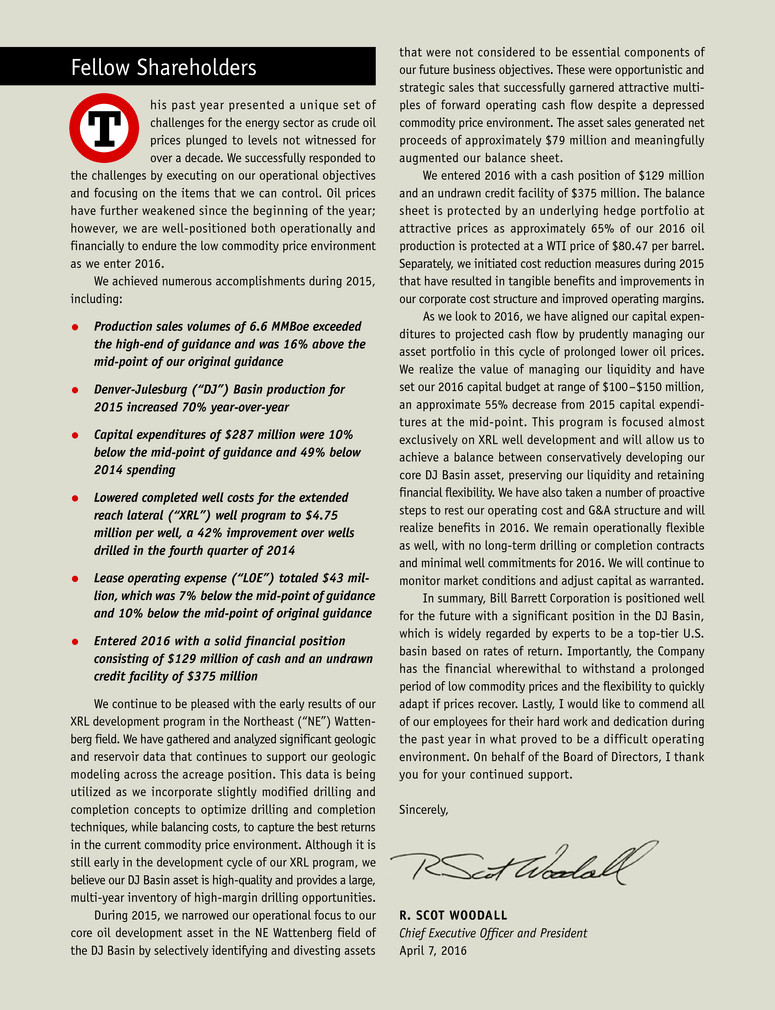
his past year presented a unique set of challenges for the energy sector as crude oil prices plunged to levels not witnessed for over a decade. We successfully responded to the challenges by executing on our operational objectives and focusing on the items that we can control. Oil prices have further weakened since the beginning of the year; however, we are well-positioned both operationally and financially to endure the low commodity price environment as we enter 2016. We achieved numerous accomplishments during 2015, including: • Production sales volumes of 6.6 MMBoe exceeded the high-end of guidance and was 16% above the mid-point of our original guidance • Denver-Julesburg (“DJ”) Basin production for 2015 increased 70% year-over-year • Capital expenditures of $287 million were ??% below the ???-????? of guidance and 49% below 2014 spending • Lowered completed well costs for the extended reach lateral (“XRL”) well program to $4.75 million per well, a 42% improvement over wells drilled in the fourth quarter of 2014 • Lease operating expense (“LOE”) totaled $43 mil- lion, which was 7% below the ???-????? of guidance and 10% below the mid-point of original guidance • Entered 2016 with a solid financial position consisting of $129 million of cash and an undrawn credit facility of $375 million We continue to be pleased with the early results of our XRL development program in the Northeast (“NE”) Watten- berg field. We have gathered and analyzed significant geologic and reservoir data that continues to support our geologic modeling across the acreage position. This data is being utilized as we incorporate slightly modified drilling and completion concepts to optimize drilling and completion techniques, while balancing costs, to capture the best returns in the current commodity price environment. Although it is still early in the development cycle of our XRL program, we believe our DJ Basin asset is high-quality and provides a large, multi-year inventory of high-margin drilling opportunities. During 2015, we narrowed our operational focus to our core oil development asset in the NE Wattenberg field of the DJ Basin by selectively identifying and divesting assets T that were not considered to be essential components of our future business objectives. These were opportunistic and strategic sales that successfully garnered attractive multi- ples of forward operating cash flow despite a depressed commodity price environment. The asset sales generated net proceeds of approximately $79 million and meaningfully augmented our balance sheet. We entered 2016 with a cash position of $129 million and an undrawn credit facility of $375 million. The balance sheet is protected by an underlying hedge portfolio at attractive prices as approximately 65% of our 2016 oil production is protected at a WTI price of $80.47 per barrel. Separately, we initiated cost reduction measures during 2015 that have resulted in tangible benefits and improvements in our corporate cost structure and improved operating margins. As we look to 2016, we have aligned our capital expen- ditures to projected cash flow by prudently managing our asset portfolio in this cycle of prolonged lower oil prices. We realize the value of managing our liquidity and have set our 2016 capital budget at range of $100–$150 million, an approximate 55% decrease from 2015 capital expendi- tures at the mid-point. This program is focused almost exclusively on XRL well development and will allow us to achieve a balance between conservatively developing our core DJ Basin asset, preserving our liquidity and retaining financial flexibility. We have also taken a number of proactive steps to rest our operating cost and G&A structure and will realize benefits in 2016. We remain operationally flexible as well, with no long-term drilling or completion contracts and minimal well commitments for 2016. We will continue to monitor market conditions and adjust capital as warranted. In summary, Bill Barrett Corporation is positioned well for the future with a significant position in the DJ Basin, which is widely regarded by experts to be a top-tier U.S. basin based on rates of return. Importantly, the Company has the financial wherewithal to withstand a prolonged period of low commodity prices and the flexibility to quickly adapt if prices recover. Lastly, I would like to commend all of our employees for their hard work and dedication during the past year in what proved to be a difficult operating environment. On behalf of the Board of Directors, I thank you for your continued support. Sincerely, R. SCOT WOODALL Chief Executive Officer and President April 7, 2016 Fellow Shareholders

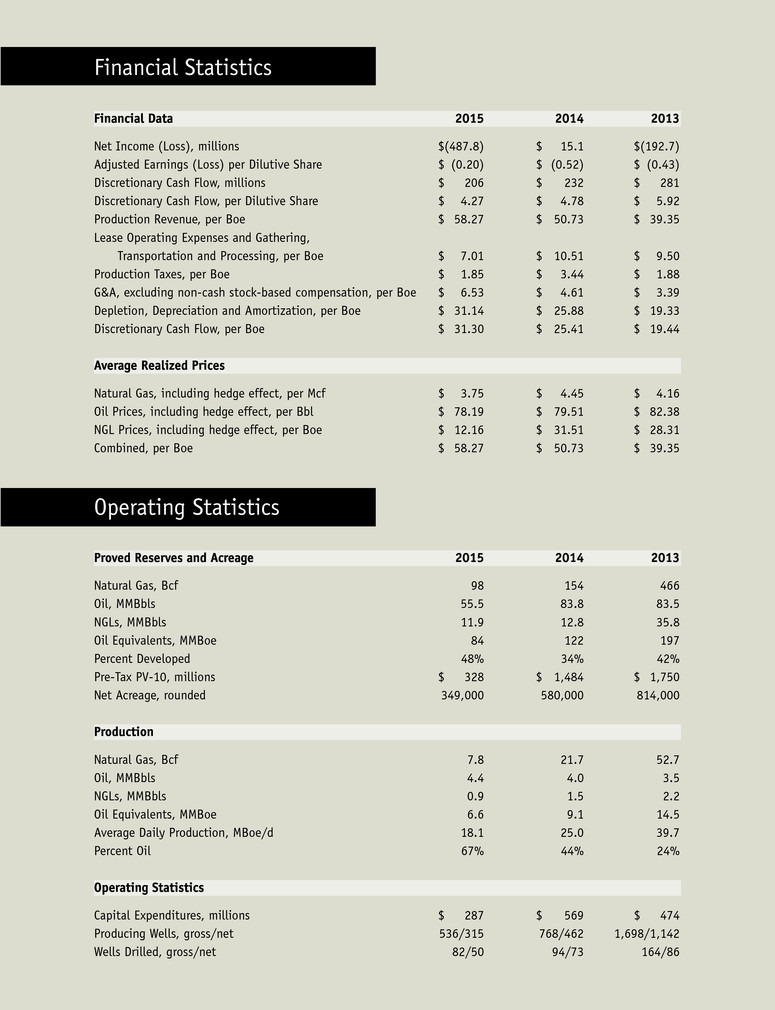
Financial Statistics Operating Statistics Financial Data 2015 2014 2013 Net Income (Loss), millions $(487.8) $ 15.1 $(192.7) Adjusted Earnings (Loss) per Dilutive Share $ (0.20) $ (0.52) $ (0.43) Discretionary Cash Flow, millions $ 206 $ 232 $ 281 Discretionary Cash Flow, per Dilutive Share $ 4.27 $ 4.78 $ 5.92 Production Revenue, per Boe $ 58.27 $ 50.73 $ 39.35 Lease Operating Expenses and Gathering, Transportation and Processing, per Boe $ 7.01 $ 10.51 $ 9.50 Production Taxes, per Boe $ 1.85 $ 3.44 $ 1.88 G&A, excluding non-cash stock-based compensation, per Boe $ 6.53 $ 4.61 $ 3.39 Depletion, Depreciation and Amortization, per Boe $ 31.14 $ 25.88 $ 19.33 Discretionary Cash Flow, per Boe $ 31.30 $ 25.41 $ 19.44 Average Realized Prices Natural Gas, including hedge effect, per Mcf $ 3.75 $ 4.45 $ 4.16 Oil Prices, including hedge effect, per Bbl $ 78.19 $ 79.51 $ 82.38 NGL Prices, including hedge effect, per Boe $ 12.16 $ 31.51 $ 28.31 Combined, per Boe $ 58.27 $ 50.73 $ 39.35 Proved Reserves and Acreage 2015 2014 2013 Natural Gas, Bcf 98 154 466 Oil, MMBbls 55.5 83.8 83.5 NGLs, MMBbls 11.9 12.8 35.8 Oil Equivalents, MMBoe 84 122 197 Percent Developed 48% 34% 42% Pre-Tax PV-10, millions $ 328 $ 1,484 $ 1,750 Net Acreage, rounded 349,000 580,000 814,000 Production Natural Gas, Bcf 7.8 21.7 52.7 Oil, MMBbls 4.4 4.0 3.5 NGLs, MMBbls 0.9 1.5 2.2 Oil Equivalents, MMBoe 6.6 9.1 14.5 Average Daily Production, MBoe/d 18.1 25.0 39.7 Percent Oil 67% 44% 24% Operating Statistics Capital Expenditures, millions $ 287 $ 569 $ 474 Producing Wells, gross/net 536/315 768/462 1,698/1,142 Wells Drilled, gross/net 82/50 94/73 164/86

BOARD OF DIRECTORS Jim W. Mogg, Chairman of the Board, Past Chairman of DCP Midstream Partners Carin M. Barth, President of LB Capital, Inc. Kevin O. Meyers, Past Senior Vice President, Exploration and Production, Americas of ConocoPhillips and President of Conoco Phillips Canada William F. Owens, Former Governor of Colorado Edmund P. Segner, Past President and Chief of Staff of EOG Resources, Inc. Randy I. Stein, Tax, Accounting and Business Consultant, Former Principal of PricewaterhouseCoopers LLP Michael E. Wiley, Past Chairman and Chief Executive Officer of Baker Hughes Incorporated OFFICERS R. Scot Woodall, Chief Executive Officer and President Terry R. Barrett, Senior Vice President — Geosciences William M. Crawford, Senior Vice President — Treasury and Finance David R. Macosko, Senior Vice President — Accounting Troy L. Schindler, Senior Vice President — Operations William K. Stenzel, Senior Vice President — Engineering, Planning and Business Development Kenneth A. Wonstolen, Senior Vice President — General Counsel Duane J. Zavadil, Senior Vice President — EH&S, Regulatory and Government Affairs Michelle Vion Choka, Vice President — Human Resources Jerry D. Vigil, Vice President — Information Technology CORPORATE INFORMATION Corporate Office 1099 18th St., Suite 2300 Denver, Colorado 80202 Telephone: 303-293-9100 Fax: 303-291-0420 www.billbarrettcorp.com Investor Relations Larry C. Busnardo Senior Director — Investor Relations lbusnardo@billbarrettcorp.com Annual Shareholders’ Meeting Our Annual Shareholder’s Meeting will be held At 8:30 a.m. (MDT) on Tuesday, May 17, 2016 Bill Barrett Corporation, Corporate Headquarters 1099 18th St., Suite 2300 Denver, CO 80202 Transfer Agent Computershare 211 Quality Circle, Suite 210 College Station, TX 77845 www.computershare.com/investor Independent Auditors Deloitte & Touche LLP Denver, Colorado Independent Reservoir Engineers Netherland, Sewell & Associates, Inc. Dallas, Texas DISCLOSURE STATEMENTS Please reference the accompanying Form 10-K for the year-ended December 31, 2015, as well as current reports on Form 8-K and quarterly reports on Form 10-Q, for further information regarding the following disclosures. SEC filings are posted to the Company’s website at www.billbarrettcorp.com. Forward-Looking Statements This report contains forward-looking statements. All statements other than statements of historical fact are forward-looking statements. A number of potential risks and uncertainties could cause actual results to differ materially from projections and expectations. Please see the “Cautionary Note Regarding Forward-Looking Statements” and “Risks Related to the Oil and Natural Gas Industry and our Business” in the accompanying 10-K. Non-GAAP Measures Non-GAAP measures included herein included Adjusted Earnings (Loss), Discretionary Cash Flow, Pre-Tax PV10, and General and Administrative Expenses before Long-Term Cash and Equity Incentive Compensation. These measures are included because management believes they are useful to investors in evaluating the Company’s operating performance. These measures are widely used in the oil and natural gas industry. Calculations of these measures may differ by company. Please refer to the Company’s fourth quarter and full year earnings releases dated March 1, 2016 and February 25, 2015 for reconciliations of these measures to the closes GAAP measure.


