Exhibit 99.2
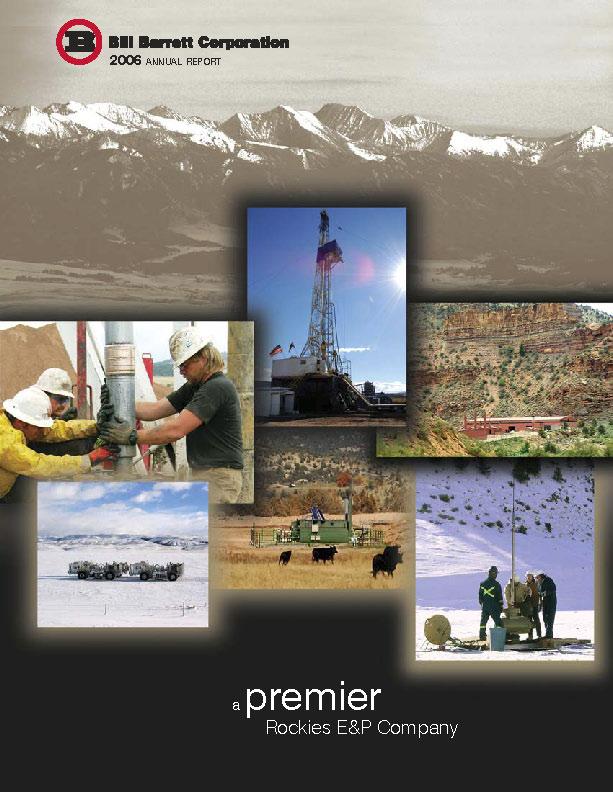
Bill Barrett Corporation
2006 ANNUAL REPORT
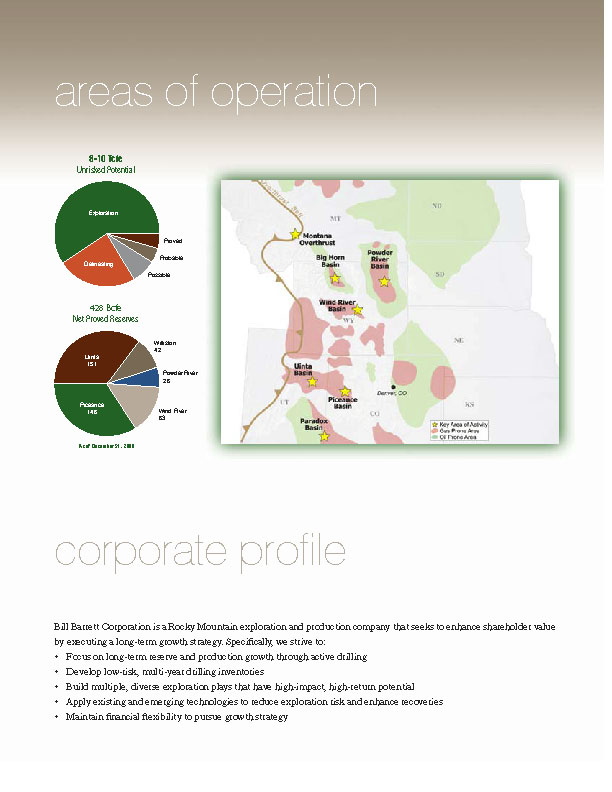
Corporate Profile
Bill Barren Corporation is a Rocky Mountain exploration and production company that seeks to enhance shareholder value by executing a long-term growth strategy. Specifically, we strive to:
Focus on long-term reserve and production growth through active drilling
Develop low-risk, multi-year drilling inventories
Build multiple, diverse exploration plays that have high-impact, high-return potential
Apply existing and emerging technologies to reduce exploration risk and enhance recoveries
Maintain financial flexibility to pursue growth strategy
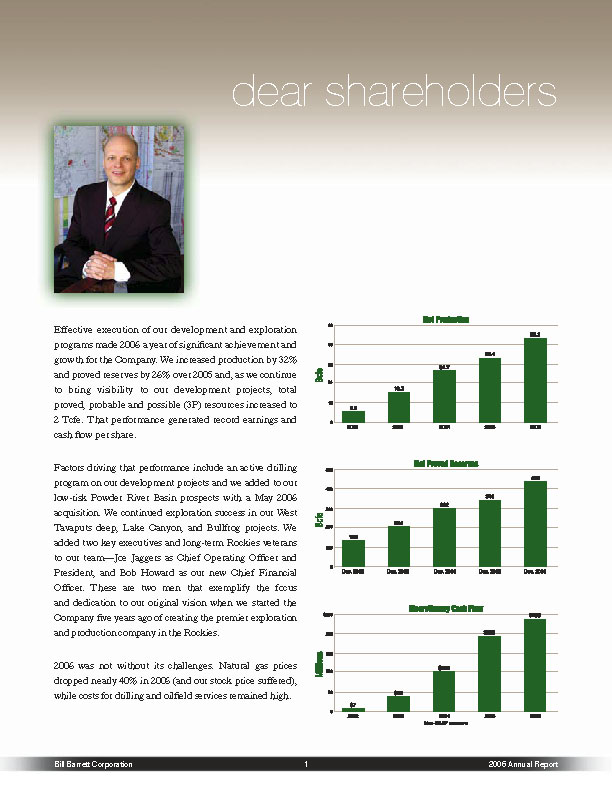
Effective execution of our development and exploration programs made 2006 a year of significant achievement and growth for the Company. We increased production by 32% and proved reserves by 26% over 2005 and, as we continue to bring visibility to our development projects, total proved, probable and possible (3P) resources increased to 2 Tcfe. That performance generated record earnings and cash flow per share.
Factors driving that performance include an active drilling program on our development projects and we added to our low-risk Powder Riser Basin prospects with a May 2006 acquisition. We continued exploration success in our West Tavaputs deep, Lake Canyon, and Bullfrog projects. We added two key executives and long-term Rockies veterans to our team—Joe Jaggers as Chief Operating Officer and President, and Bob Howard as our new Chief Financial Officer. These are two men that exemplify the focus and dedication to our original vision when we started the Company five years ago of creating the premier exploration and production company in the Rockies.
2006 was not without its challenges. Natural gas prices dropped nearly 40% in 2006 (and our stock price suffered), while costs for drilling and oilfield services remained high.
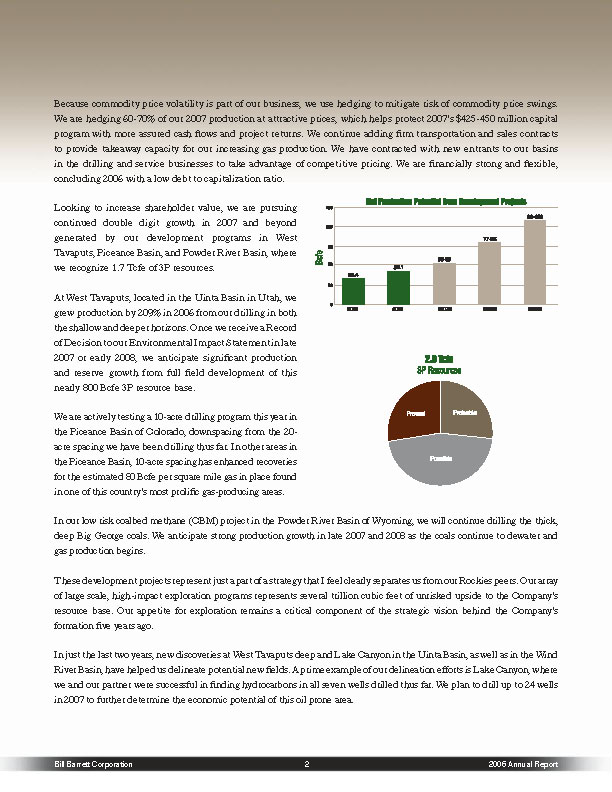
In the drilling and service businesses to take advantage of competitive pricing. We are financially strong and flexible, concluding 2006 with a low debt to capitalization ratio.
Looking to increase shareholder value, we are pursuing continued double digit growth in 2007 and beyond generated by our development programs in West Tavaputs, Piceance Basin, and Powder River Basin, where we recognize 1.7 Tcfe of 3P resources.
At West Tavaputs, located in the Uinta Basin in Utah, we grew production by 209% in 2006 from our drilling in both the shallow and deeper horizons. Once we receive a Record of Decision to our Environmental Impact Statement in late 2007 or early 2008, we anticipate significant production and reserve growth from full field development of this nearly 800 Bcfe 3P resource base.
We are actively testing a 10-acre drilling program this year in the Piceance Basin of Colorado, downspacing from the 20-acre spacing we have been drilling thus far. In other areas in the Piceance Basin, 10-acre spacing has enhanced recoveries for the estimated 80 Bcfe per square mile gas in place found in one of this country’s most prolific gas-producing areas.
In our low risk coalbed methane ((CBM) project in the Powder River Basin of Wyoming, we will continue drilling the thick, deep Big George coals. We anticipate strong production growth in late 2007 and 2008 as the coals continue to dewater and gas production begins.
These development projects represent just a part of a strategy that I feel clearly separates us from our Rockies peers. Our array of large scale, high-impact exploration programs represents several trillion cubic feet of unrisked upside to the Company’s resource base. Our appetite for exploration remains a critical component of the strategic vision behind the Company’s formation five years ago.
In just the last two years, new discoveries at West Tavaputs deep and Lake Canyon in the Uinta Basin, as well as in the Wind River Basin, have helped us delineate potential new fields. A prime example of our delineation efforts is Lake Canyon, where we and our partner were successful in finding hydrocarbons in all seven wells drilled thus far. We plan to drill up to 24 wells in 2007 to further determine the economic potential of this oil prone urea.
In the Wind River Basin, we are seeking a partner to keep one tig continoulsy drilling the deep Lakota, Muddy and Ftontier to further explore the higher risk, high potential we had in two earlier discoveries.
In 2007, we plan to test four high-profile exploration prospects in the Big Horn Basin, Montana Overthrust, Paradox Basin, and Uinta Basin. Success in any one of these has the potential to significantly increase the size of the Company’s reserve base.
In the Big Horn Basin, we are testing a potential multi-Tcf basin-centered gas play in an area traditionally considered an oil-prone basin. In our Montana Overthrust prospect, over 150 square miles of 3-D seismic survey data has identified numerous large four-way structures. We plan two exploration test wells there this summer. In our Yellow Jacket shale prospect in the Paradox Basin, we have drilled, cored, and set casing on two wells. We are pursuing a shale concept in the Hook area of the Uinta Basin and, in the neighboring Woodside area, we plan to test wells to explore a four-way closure.
Another of our strategic objectives is the use of technology. For example, we have over 2,700 square miles of 3-D seismic data for our prospects to help our geologic understanding and mitigate drilling risk. The application of evolving completion technology was instrumental to improving our Piceance Basin well performance.
We consistently review our portfolio of prospects to ensure they all fit within our strategic objectives. We will add with bolt-on acquisitions similar to our May 2006 Powder River Basin purchase, or divest properties similar to our decision to sell our Williston properties. Thus, we constantly strive to deploy capital in an attempt to maximize long-term value to shareholders.
These first five years for our Company have gone by fast, and I hope you agree that we have accomplished much of what we set out to do here in the Rockies. We are well-positioned to continue delivering a clean, efficient and domestic energy supply to our country’s economy. With the Rockies Express Pipeline adding 1.8 Bcf per day capacity from Colorado to Ohio in 2009, we see improved realized prices for our production. In 2006, the Rockies region emerged, for the first time ever, as the country’s most prolific gas producing region, eclipsing the Gulf of Mexico. Additionally, the Department of Energy projects the Rockies to be one of the few regions in the country to show any significant growth in natural gas production over the next 20 years. Many of you are aware that it is precisely this ascendance of Rockies gas production that the Company was founded on.
With your continued support, we will be able to develop the potential of the natural gas resources of the Rockies as we continue to become a premier Rockies E&P company. I thank you, the shareholders, for investing with us.
Sincerely,
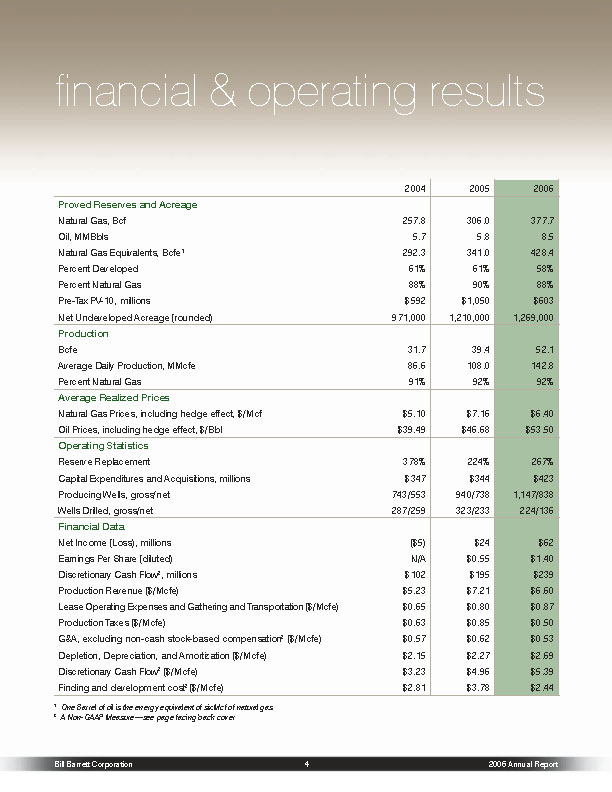
2004
2005
2006
Proved Reserves and Acreage
Natural Gas, Bcf
257.8
306.0
377.7
Oil, MMBbls
5.7
5.8
8.5
Natural Gas Equivalents. Bcfe’
292.3
341.0
428.4
Percent Developed
61%
61%
58%
Percent Natural Gas
88%
90%
88%
Pre-Tax PV-10, millions
$592
$1,050
$603
Net Undeveloped Acreage (rounded)
971,000
1,210,000
1,269,000
Production
Bofe
31.7
39.4
52.1
Average Daily Production, MMcfe
86.6
108.0
142.8
Percent Natural Gas
91%
92%
92%
Average Realized Prices
Natura Gas Prices, including hedge effect, $Mcf
$5.10
$7.16
$6.40
Oil Prices including hedge effect, $/Bbl.
$39.49
$46.68
$53.50
Operating Statistics
Reserve Replacement
378%
224%
267%
Capital Expenditures and Acquisitions millions
$347
$344
$423
Producing Wells, gross/net
743/553
040/738
1,147/838
Wells Drilled, gross/net
287/259
323/233
224/136
Financial Data
Net Income (Loss), millions
($5)
$24
$62
Earnings Per Share (diluted)
N/A
$0.55
$1.40
Discretionary Cash Flow 2, millions
$102
$195
$239
Production Revenue ($/Mcfe)
$5.23
$7.21
$6.60
Lease Operating Expenses and Gathering and Transportation ($/Mcfe)
$30.65
S0.80
$0.87
Production Takes ($/Mcfe)
$0 63
$0.85
$0.50
G&A, excluding non-cash stock based compensation ($/Mcfe)
$0.57
$0.62
$0.53
Depletion, Depreciation, and Amortization ($/Mcfe)
$2.15
$2.27
$2.69
Discretionary Cash Flow2 ($/Mcfe)
$5.23
$4.96
$5.39
Finding and development cost2 ($/Mcfe)
$2.81
$3.78
$2.44
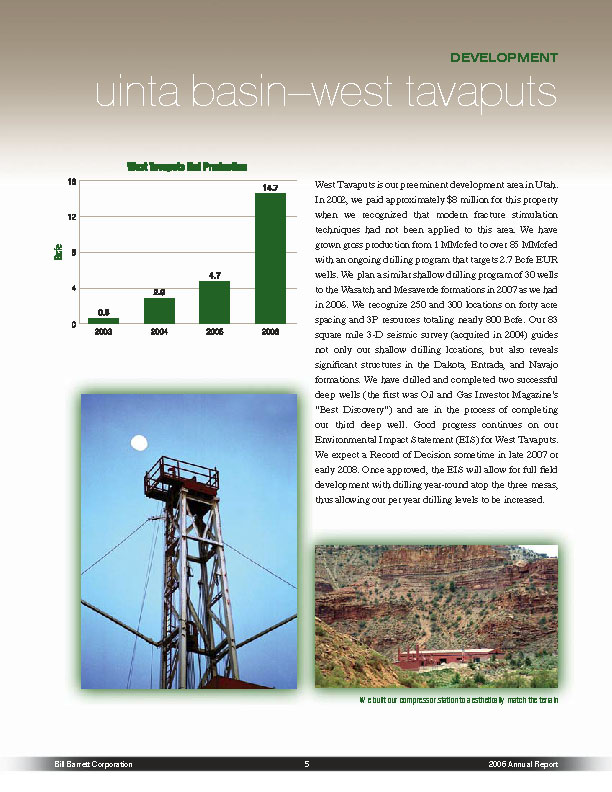
uinta basin – west tavaputs
West Tavaputs Net Production
West Tavaputs is our preeminent development area in Utah. In 2002, we paid approximately $8 million for this property when we recognized that modern fracture stimulation techniques had not been applied to this area. We have grown gross production from 1 MMcfed to over 85 MMcfed with an ongoing drilling program that targets 2.7 Befe EUR wells. We plan a similar shallow drilling program of 30 wells to the Wasatch and Mesaverde formations in 2007 as we had in 2006. We recognize 250 and 300 locations on forty acre spacing and 3P resources totaling nearly 800 Befe. Our 83 square mile 3-D seismic survey (acquired in 2004) guides not only our shallow drilling locations, but also reveals significant structures in the Dakota, Entrada, and Navajo formations. We have drilled and completed two successful deep wells (the first was Oil and Gas Investor Magazine’s “Best Discovery”) and are in the process of completing our third deep well. Good progress continues on our (Environmental Impact Statement (EIS) for West Tavaputs. We expect a Record of Decision sometime in late 2007 or early 2008. Once approved, the EIS will allow for full field development with drilling year-round atop the three mesas, thus allowing our per year drilling levels to be increased.
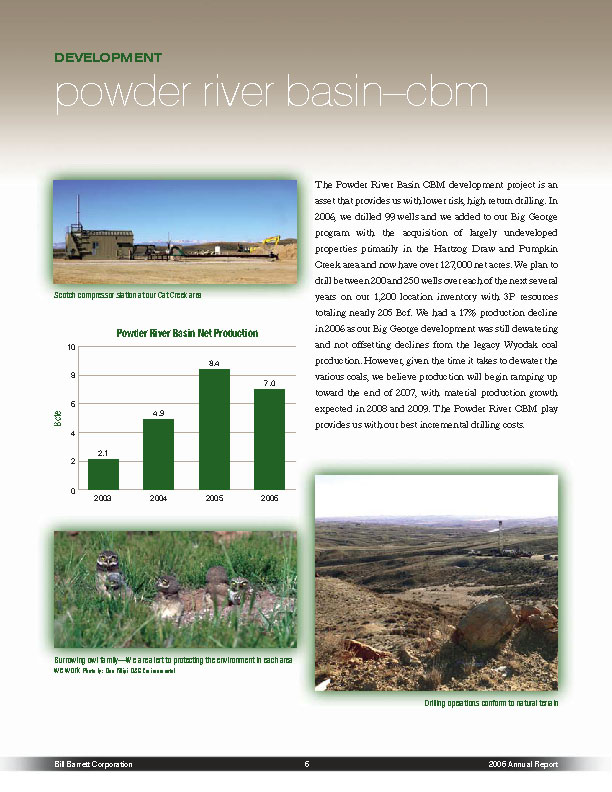
Powder river basin-cbm
Powder River Basin Net Production
The Powder River Basin CBM development project is an asset that provides us with lower risk, high return drilling. In 2006, we drilled 99 wells and we added to our Big George program with the acquisition of largely undeveloped properties primarily in the Hartzog Draw and Pumpkin Greek area and now have over 127,000 net acres. We plan to drill between 200 and 250 wells over each of the next several years on our 1,200 location inventory with 3P resources totaling nearly 205 Bef. We had a 17% production decline in 2006 as our Big George development was still dewatering and not offsetting declines from the legacy Wyodak coal production. However, given the time it takes to dewater the various coals, we believe production will begin ramping up toward the end of 2007, with material production growth expected in 2008 and 2009. The Powder River CBM play provides us with our best incremental drilling costs.
Burrowing owl family-We are alert to protecting the environment in each area we work Photo by: Dan FIllipi, O&G Enviorment.
Piceance basin
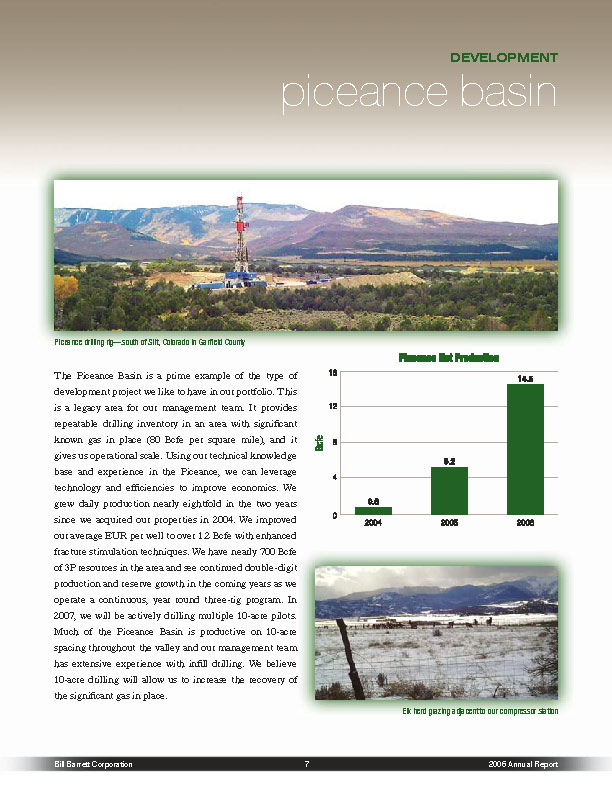
The Piceance Basin is a prime example of the type of development project we like to have in our portfolio. This is a legacy area for our management team. It provides repeatable drilling inventory in an area with significant known gas in place (80 Befe per square mile), and it gives us operational scale. Using our technical knowledge base and experience in the Piceance, we can leverage technology and efficiencies to improve economics. We grew daily production nearly eightfold in the two years since we acquired our properties in 2004. We improved our average EUR per well to over 1.2 Befe with enhanced fracture stimulation techniques. We have nearly 700 Befe of 3P resources in the area and see continued double-digit production and reserve growth in the coming years as we operate a continuous, year round three-rig program. In 2007, we will be actively drilling multiple 10-acre pilots. Much of the Piceance Basin is productive on 10-acre spacing throughout the valley and our management team has extensive experience with infill drilling. We believe 10-acre drilling will allow us to increase the recovery of the significant gas in place.
Piceance drilling ng-south of Sift, Colorado in Garfield Country.
Elk herd grazing adjacent to our compressor station
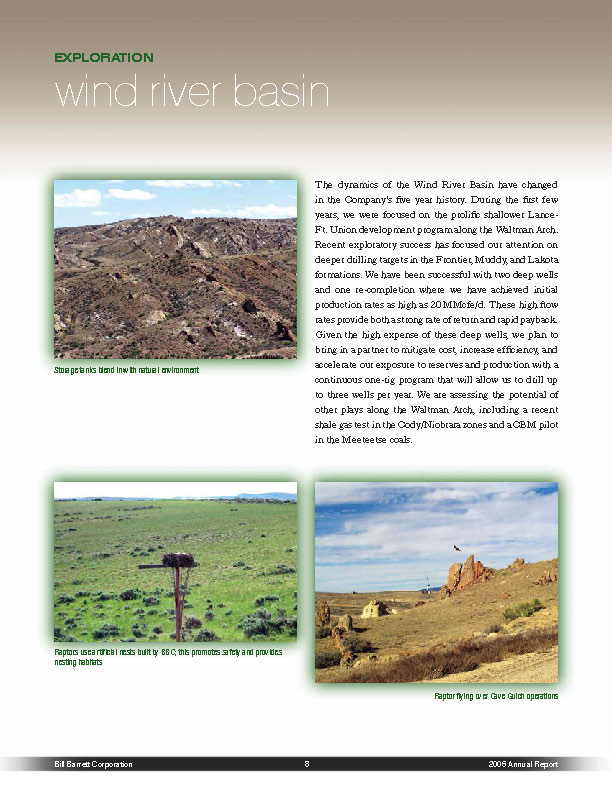
Wind river basin
The dynamics of the Wind River Basin have changed in the Company’s five year history. During the first few years, we were focused on the prolific shallower Lance-Ft. Union development program along the Waltman Arch. Recent exploratory success has focused our attention on deeper drilling targets in the Frontier, Muddy, and Lakota formations. We have been successful with two deep wells and one re-completion where we have achieved initial production rates as high as 20 MMcfe/d. These high flow rates provide both a strong rate of return and rapid payback. Given the high expense of these deep wells, we plan to bring in a partner to mitigate cost, increase efficiency, and accelerate our exposure to reserves and production with a continuous one-rig program that will allow us to drill up to three wells per year. We are assessing the potential of other plays along the Waltman Arch, including a recent shale gas test in the Cody/Niobrara zones and a(CBM pilot in the Meeteetse coals.
Storage tanks blend in with natural environment.
Raptors use artificial nests built by BBC; this promotes safety and provides nesting habitats.
Raptor flying over Cave Gulch Operations
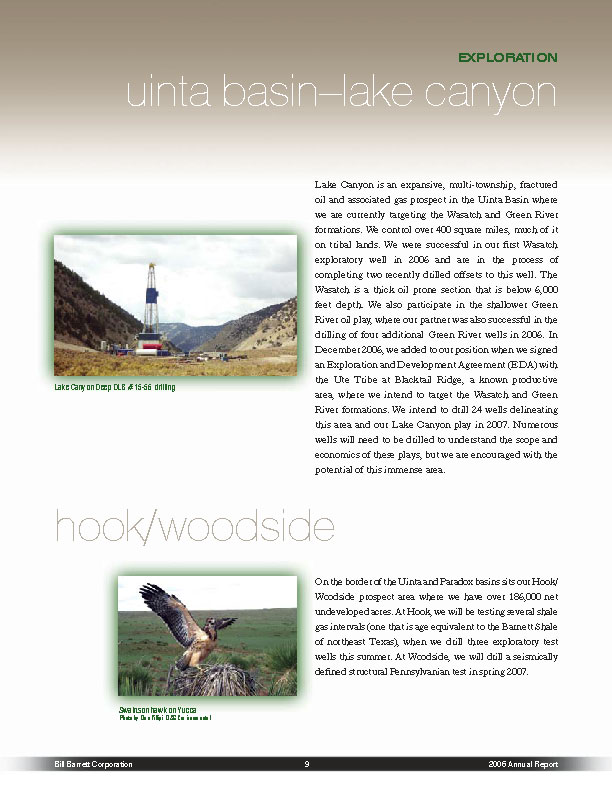
Unita basin-lake canyon
Lake Canyon is an expansive, multi-township, fractured oil and associated gas prospect in the Uinta Basin where we are currently targeting the Wasatch and Green River formations. We control over 400 square miles, much of it on tribal lands. We were successful in our first Wasatch exploratory well in 2006 and are in the process of completing two recently drilled offsets to this well. The Wasatch is a thick oil prone section that is below 6,000 feet depth. We also participate in the shallower Green River oil play, where our partner was also successful in the drilling of four additional Green River wells in 2006. In December 2006, we added to our position when we signed an Exploration and Development Agreement (EDA) with the Ute Tribe at Blacktail Ridge, a known productive area, where we intend to target the Wasatch and Green River formations. We intend to drill 24 wells delineating this area and our Lake Canyon play in 2007. Numerous wells will need to be drilled to understand the scope and economics of these plays, but we are encouraged with the potential of this immense area.
Lake Canyon Deep DLB # 15-56 drilling
Hook/woodside
On the border of the Uinta and Paradox basins sits our H look/ Woodside prospect area where we have over 186,000 net undeveloped acres. At Hook, we will be testing several shale gas intervals (one that is age equivalent to the Barnett Shale of northeast Texas), when we drill three exploratory test wells this summer. At Woodside, we will drill a seismically defined structural Pennsylvanian test in spring 2007.
Swainson hawk on Yucca
Photo by Dan Fillipi. 0&G Environmental
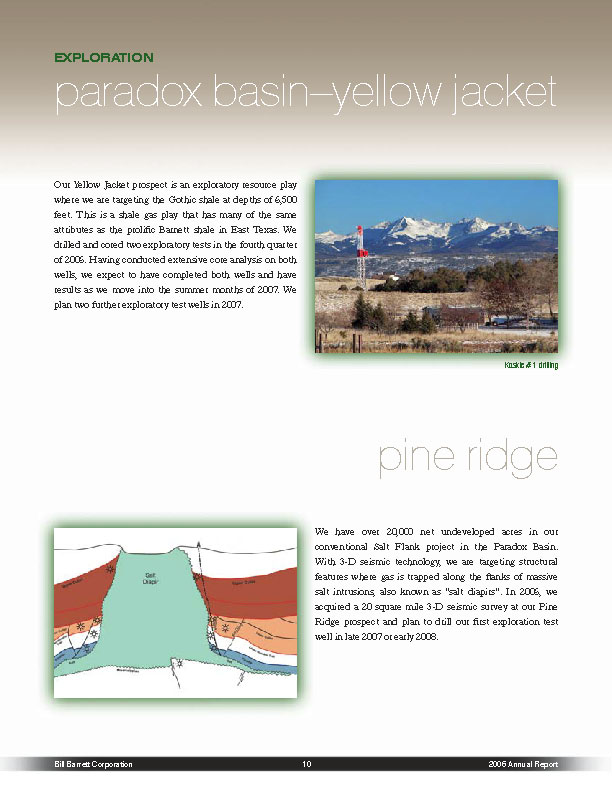
Our Yellow Jacket prospect is an exploratory resource play where we are targeting the Gothic shale at depths of 6,500 feet. This is a shale gas play that has many of the same attributes as the prolific Barnett shale in East Texas. We drilled and cored two exploratory tests in the fourth quarter of 2006. Having conducted extensive core analysis on both wells, we expect to have completed both wells and have results as we move into the summer months of 2007. We plan two further exploratory test wells in 2007.
pine ridge
We have over 20,000 net undeveloped acres in our conventional Salt Flank project in the Paradox Basin. With 3-D seismic technology, we are targeting structural features where gas is trapped along the flanks of massive salt intrusions, also known as “salt diapers”. In 2006, we acquired a 20 square mile 3-D seismic survey at our Pine Ridge prospect and plan to drill our first exploration test well in late 2007 or early 2008.
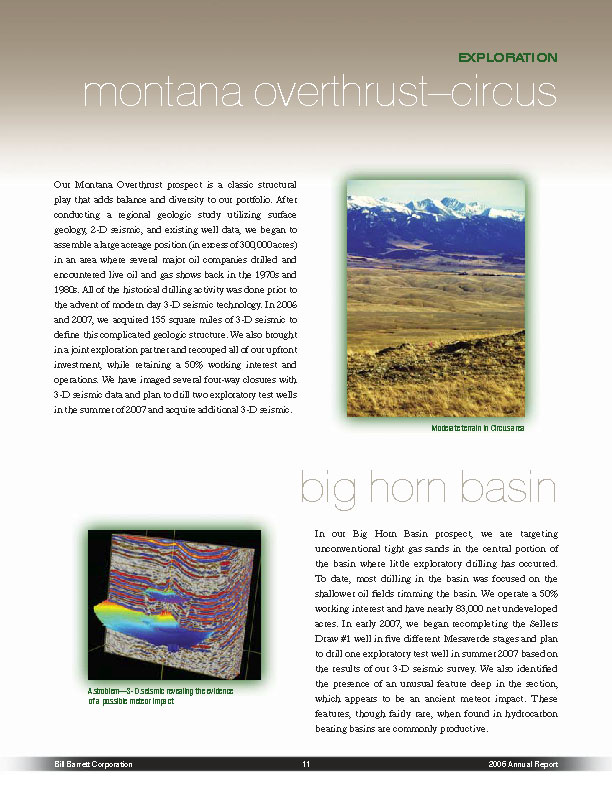
Our Montana Overthrust prospect is a classic structural play that adds balance and diversity to our portfolio. After conducting a regional geologic study utilizing surface geology, 2-D seismic, and existing well data, we began to assemble a large acreage position (in excess of 300,000 acres) in an area where several major oil companies drilled and encountered live oil and gas shows back in the 1970s and 1980s. All of the historical drilling activity was done prior to the advent of modern day 3-D seismic technology. In 2006 and 2007, we acquired 155 square miles of 3-D seismic to define this complicated geologic structure. We also brought in a joint exploration partner and recouped all of our upfront investment, while retaining a 50% working interest and operations. We have imaged several four-way closures with 3-D seismic data and plan to drill two exploratory test wells in the summer of 2007 and acquire additional 3-D seismic.
big horn basin
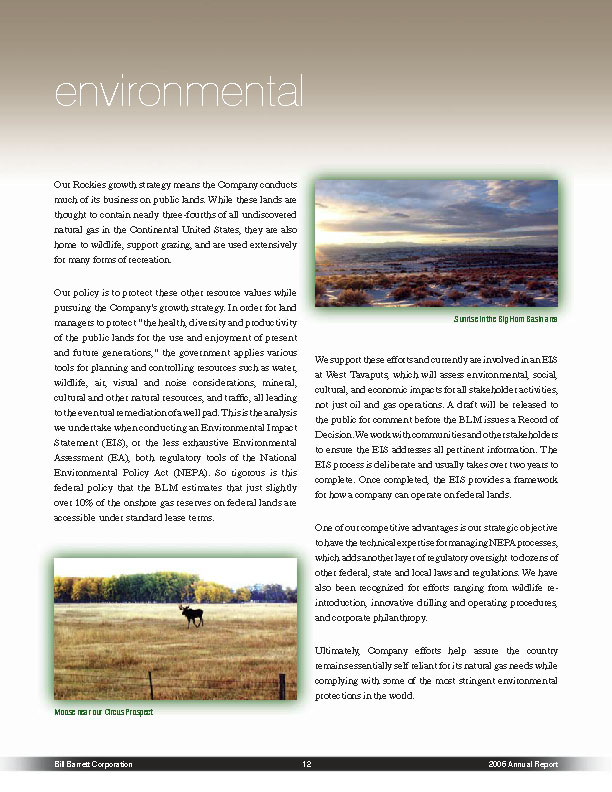
In our Big Horn Basin prospect, we are targeting unconventional tight gas sands in the central portion of the basin where little exploratory drilling has occurred. To date, most drilling in the basin was focused on the shallower oil fields rimming the basin. We operate a 50% working interest and have nearly 83,000 net undeveloped acres. In early 2007, we began recompleting the Sellers Draw # 1 well in five different Mesaverde stages and plan to drill one exploratory test well in summer 2007 based on the results of our 3-D seismic survey. We also identified the presence of an unusual feature deep in the section, which appears to be an ancient meteor impact. These features, though fairly rare, when found in hydrocarbon bearing basins are commonly productive.
Our Rockies growth strategy means the Company conducts much of its business on public lands. While these lands are thought to contain nearly three-fourths of all undiscovered natural gas in the Continental United States, they are also home to wildlife, support grazing, and are used extensively for many forms of recreation.
Our policy is to protect these other resource values while pursuing the Company’s growth strategy. In order for land managers to protect “the health, diversity and productivity of the public lands for the use and enjoyment of present and future generations,” the government applies various tools for planning and controlling resources such as water, wildlife, air, visual and noise considerations, mineral, cultural and other natural resources, and traffic, all leading to the eventual remediation of a well pad. This is the analysis we undertake when conducting an Environmental Impact Statement (ELS), or the less exhaustive Environmental Assessment (EA), both regulatory tools of the National Environmental Policy Act (NEPA). So rigorous is this federal policy that the BLM estimates that just slightly over 10% of the onshore gas reserves on federal lands are accessible under standard lease terms.
We support these efforts and currently are involved in an EIS at West Tavaputs, which will assess environmental, social, cultural, and economic impacts for all stakeholder activities, not just oil and gas operations. A draft will be released to the public for comment before the BLM issues a Record of Decision. We work with communities and other stakeholders to ensure the EIS addresses all pertinent information. The EIS process is deliberate and usually takes over two years to complete. Once completed, the EIS provides a framework for how a company can operate on federal lands.
One of our competitive advantages is our strategic objective to have the technical expertise for managing NEPA processes, which adds another layer of regulatory oversight to dozens of other federal, state and local laws and regulations. We have also been recognized for efforts ranging from wildlife re-introduction, innovative drilling and operating procedures, and corporate philanthropy.
Ultimately, Company efforts help assure the country remains essentially self reliant for its natural gas needs while complying with some of the most stringent environmental protections in the world.
corporate information
CORPORATE OFFICE TRANSFER AGENT
1099 Eighteenth Street, Suite 2300 Mellon Investor Services LLC
Denver, Colorado 80202 Ridgefield Park, New Jersey
Telephone: 303-293-9100
Fax: 303-291-0420 INDEPENDENT AUDITORS
Internet: www.billbarrettcorp.com Deloitte & Touche LLP
Denver, Colorado
ANNUAL STOCKHOLDERS’ MEETING
Our annual stockholders’ meeting INDEPENDENT AND OUTSIDE RESERVOIR ENGINEERS
will be held at 9:30 a.m. (MST) Ryder Scott Company, L.P.
on Wednesday, May 9, 2007 at the Denver, Colorado
Westin Tabor Center Auditorium Netherland Sewell & Associates, Inc.
1672 Lawrence Street Dallas, Texas
Denver, Colorado 80202
NON-GAAP MEASURES
Discretionary cash flow is computed as net loss plus depreciation, depletion, amortization and impairment expenses, deferred income taxes, exploration expenses, non-cash stock-based compensation, losses (gains) on sale of properties, and certain other non-cash charges. The non-GAAP measure of discretionary cash flow is presented because management believes that it provides useful additional information to investors for analysis of the Company’s ability to internally generate funds for exploration, development and acquisitions. In addition, discretionary cash flow is widely used by professional research analysts and others in the valuation, comparison and investment recommendations of companies in the oil and gas exploration and production industry, and many investors use the published research of industry research analysts in making investment decisions. Discretionary cash flow should not be considered in isolation or as a substitute for net income, income from operations, net cash provided by operating activities or other income, profitability, cash flow or liquidity measures prepared in accordance with accounting principles generally accepted in the United States of America (“GAAP”). Because discretionary cash flow excludes some, but not all, items that affect net income and net cash provided by operating activities and may vary among companies, the discretionary cash flow amounts presented may not be comparable to similarly titled measures of other companies.
The Company calculates organic finding and development cost, or F&D cost, per Mcfe, by dividing (x) costs incurred less asset retirement obligation and less material acquisitions and less certain non-cash capital items less proceeds received for divesting and joint exploration agreement, by (y) reserve additions for the year less reserves acquired for cash, netted against reserves disposed. Consistent with industry practice, future capital expenditures to develop proved undeveloped reserves or capital associated with furniture, fixtures and equipment are not included in costs incurred. The methods the Company uses to calculate its F&D cost may differ significantly from methods used by other companies to compute similar measures. As a result, the Company’s F&D cost may not be comparable to similar measures provided by other companies. The Company believes that providing a non-GAAP measure of F&D cost is useful to investors in evaluating the cost, on a per thousand cubic feet of natural gas equivalent basis, to add proved reserves. However, this measure is provided in addition to, and not as an alternative for, and should be read in conjunction with, the information contained in its financial statements prepared in accordance with GAAP. Due to various factors, including timing differences in the addition of proved reserves and the related costs to develop those reserves, F&D cost do not necessarily reflect precisely the costs associated with particular reserves. As a result of various factors that could materially affect the timing and amounts of future increases in reserves and the timing and amounts of future costs, the Company cannot assure you that its future F&D cost will not differ material from those presented.
For a reconciliation of these non-GAAP measures to financial information prepared in accordance with GAAP, refer to our Current Reports on Form 8-K filed with the Securities and Exchange Commission (SEC).
FORWARD LOOKING STATEMENTS AND OTHER NOTICES
This report contains forward-looking statements regarding Bill Barrett Corporation’s future plans and expected performance based on assumptions the Company believes to be reasonable. A number of risks and uncertainties could cause actual results to differ materially from these statements, including, without limitation, the success rate of exploration efforts and the timeliness of development activities, fluctuations in oil and gas prices, and other risk factors described in the Company’s accompanying Annual Report on Form 10-K for the year ended December 31, 2006.
The SEC permits oil and gas companies, in their filings with the SEC, to disclose only proved reserves that a company has demonstrated by actual production or conclusive formation tests to be economically and legally producible under existing economic and operating conditions. Bill Barrett Corporation may use certain terms in this report and other communications relating to reserves, resources, and production that the SEC’s guidelines strictly prohibit the Company from including in filings with the SEC. It is recommended that U.S. investors closely consider the Company’s disclosures in the accompanying Annual Report on Form 10-K for the year ended December 31, 2006 filed with the SEC. This document is available through the SEC by calling 1-800-SEC-0330 (U.S.) and on the SEC website at www.sec.gov.
The New York Stock Exchange’s Rule 303A,12(a) requires chief executive officers of listed companies to certify that they are not aware of any violations by their company of the exchange’s corporate governance listing standards. This annual certification by the chief executive officer of Bill Barrett Corporation has been filed with the New York Stock Exchange. In addition, Bill Barrett Corporation has filed, as exhibits to its most recently filed Form 10-K, the SEC certifications required for the chief executive officer and chief financial officer under Section 302 of the Sarbanes-Oxley Act.
Standing (left to right): Kevin M. Finnegan, Vice President-information Systems. Ouane J. Zavadil, Vice President-Government and Regulatory Affairs, Huntington T. Walker, Senior Vice President-Land, Joseph N. Jaggers. Chief Operating Officer, President and Director. Fredrick J. Barrett, Chief Executive Officer and Chairman, Terry R. Barrett, Senior Vice President Exploration-Northern Division, Francis B. Barron, Senior Vice President and General Counsel. Lynn Boone Henry, Vice President-Planning and Reserves, David R. Macosko, Vice President-Accounting Sitting: Wilfred R. (Roy) Roux, Senior Vice President- Geophysics, Kurt M. Reinecke, Senior Vice President Exploration-Southern Division: Not pictured: Robert W. Howard, Chief Financial Officer
directors
Fredrick J. Barrett James M. Fitzgibbons Randy A. Foutch Jeffrey A. Harris Joseph N. Jaggers Philiope S.E. Schreiber Randy Stein Michael E. Wiley
Chief Executive Director Director Director Chief Operating Officer Director Director Director
Officer and Chairman and Director
Bill Barrett Corporation
OUR VALUES
Integrity in the way we conduct our business, respect the environment, and analyze our opportunities
Growth in production, reserves, and our share price
Teamwork in the way we manage our business and work with our partners
Allegiance to our investors, employees, suppliers, and the communities in which we operate