Exhibit 99.1
Bill Barrett Corporation
2009 ANNUAL REPORT
Clean Abundant Domestic Energy
Bill Barrett Corporation
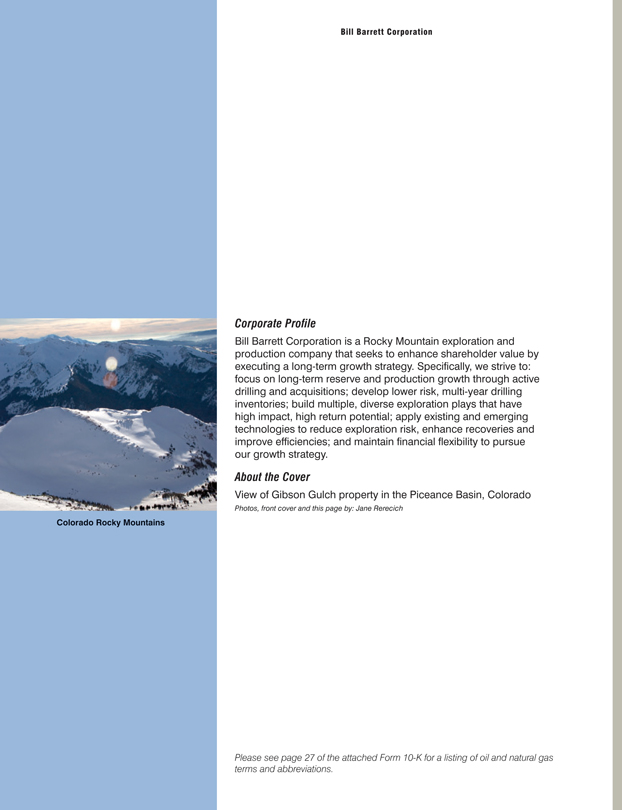
Corporate Profile
Bill Barrett Corporation is a Rocky Mountain exploration and production company that seeks to enhance shareholder value by executing a long-term growth strategy. Specifically, we strive to: focus on long-term reserve and production growth through active drilling and acquisitions; develop lower risk, multi-year drilling inventories; build multiple, diverse exploration plays that have high impact, high return potential; apply existing and emerging technologies to reduce exploration risk, enhance recoveries and improve efficiencies; and maintain financial flexibility to pursue our growth strategy.
About the Cover
View of Gibson Gulch property in the Piceance Basin, Colorado
Photos, front cover and this page by: Jane Rerecich
Please see page 27 of the attached Form 10-K for a listing of oil and natural gas terms and abbreviations.

2009 Annual Report
2009 Financial and Operating Results
2009 2008 2007 Proved Reserves and Acreage
Natural Gas, Bcf 918.1 784.3 538.3 Oil, MMBbls 7.8 5.7 3.2 Natural Gas Equivalents, Bcfe1 964.8 818.3 557.6 Percent Developed 50 % 53 % 59 % Percent Natural Gas 95 % 96 % 97 % Pre-Tax PV-10, millions $685 $1,039 $1,204 Net Undeveloped Acreage, rounded 1,251,000 1,203,000 1,186,000
Production
Bcfe 89.7 77.6 61.2 Average Daily Production, MMcfe 246 212 168 Percent Natural Gas 95 % 95 % 94 %
Average Realized Prices
Natural Gas, including hedge effect, per Mcf $6.96 $7.61 $5.89 Oil Prices, including hedge effect, per Bbl $59.03 $69.55 $59.87
Operating Statistics
Reserve Replacement 264 % 436 % 382 % Capital Expenditures, millions $406 $601 $444 Producing Wells, gross/net 1,585/1,236 1,463/1,140 1,221/948 Wells Drilled, gross/net 186/164 430/331 314/237
Financial Data
Net Income, millions $50 $105 $27 Earnings Per Share, diluted $1.12 $2.34 $0.60 Discretionary Cash Flow2, millions $460 $429 $249 Production Revenue, per Mcfe $7.10 $7.81 $6.13 Lease Operating Expenses and Gathering, Transportation and Processing, per Mcfe $1.15 $1.08 $1.06 Production Taxes, per Mcfe $0.15 $0.57 $0.37 G&A, excluding non-cash stock-based compensation, per Mcfe $0.42 $0.52 $0.52 Depletion, Depreciation, and Amortization, per Mcfe $2.83 $2.66 $2.87 Discretionary Cash Flow2, per Mcfe $5.12 $5.53 $4.06 Finding and Development Cost2, per Mcfe $1.68 $1.76 $1.83 Finding and Development Cost, three-year average2, per Mcfe $1.74 $1.99 $2.48
1 Converted on the bases of one barrel of oil is the energy equivalent of six Mcf of natural gas
2 A non-GAAP measure —see page 10
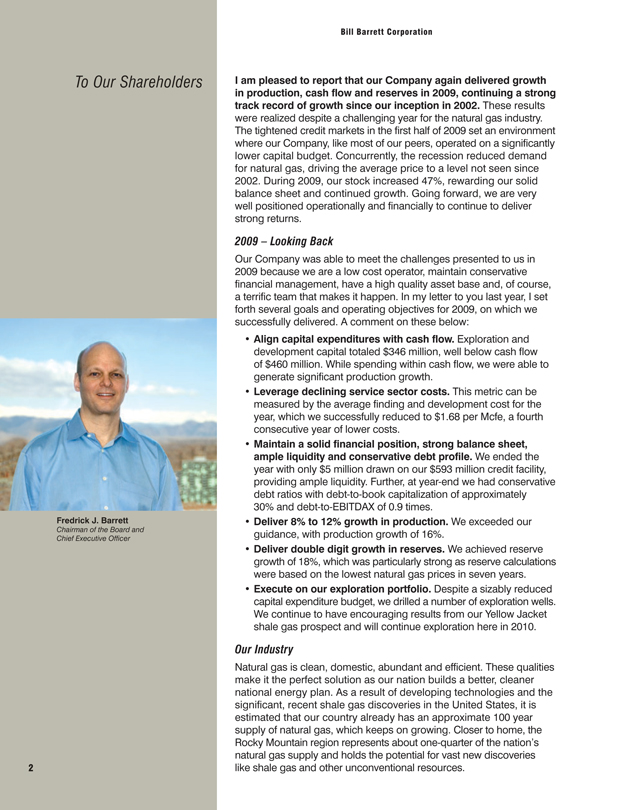
To Our Shareholders
Fredrick J. Barrett
Chairman of the Board and Chief Executive Officer
Bill Barrett Corporation
I am pleased to report that our Company again delivered growth in production, cash flow and reserves in 2009, continuing a strong track record of growth since our inception in 2002. These results were realized despite a challenging year for the natural gas industry. The tightened credit markets in the first half of 2009 set an environment where our Company, like most of our peers, operated on a significantly lower capital budget. Concurrently, the recession reduced demand for natural gas, driving the average price to a level not seen since 2002. During 2009, our stock increased 47%, rewarding our solid balance sheet and continued growth. Going forward, we are very well positioned operationally and financially to continue to deliver strong returns.
2009 – Looking Back
Our Company was able to meet the challenges presented to us in 2009 because we are a low cost operator, maintain conservative financial management, have a high quality asset base and, of course, a terrific team that makes it happen. In my letter to you last year, I set forth several goals and operating objectives for 2009, on which we successfully delivered. A comment on these below:
• Align capital expenditures with cash flow. Exploration and development capital totaled $346 million, well below cash flow of $460 million. While spending within cash flow, we were able to generate significant production growth.
• Leverage declining service sector costs. This metric can be measured by the average finding and development cost for the year, which we successfully reduced to $1.68 per Mcfe, a fourth consecutive year of lower costs.
• Maintain a solid financial position, strong balance sheet, ample liquidity and conservative debt profile. We ended the year with only $5 million drawn on our $593 million credit facility, providing ample liquidity. Further, at year-end we had conservative debt ratios with debt-to-book capitalization of approximately 30% and debt-to-EBITDAX of 0.9 times.
• Deliver 8% to 12% growth in production. We exceeded our guidance, with production growth of 16%.
• Deliver double digit growth in reserves. We achieved reserve growth of 18%, which was particularly strong as reserve calculations were based on the lowest natural gas prices in seven years.
• Execute on our exploration portfolio. Despite a sizably reduced capital expenditure budget, we drilled a number of exploration wells.
We continue to have encouraging results from our Yellow Jacket shale gas prospect and will continue exploration here in 2010.
Our Industry
Natural gas is clean, domestic, abundant and efficient. These qualities make it the perfect solution as our nation builds a better, cleaner national energy plan. As a result of developing technologies and the significant, recent shale gas discoveries in the United States, it is estimated that our country already has an approximate 100 year supply of natural gas, which keeps on growing. Closer to home, the Rocky Mountain region represents about one-quarter of the nation’s natural gas supply and holds the potential for vast new discoveries like shale gas and other unconventional resources.
2009 Annual Report
The potential of the Rocky Mountain region as a growing natural gas supply base has recently improved through new pipeline capacity. Also, planned capacity additions in 2011 will provide sufficient access to multiple premium markets for the foreseeable future.
As a Rockies-based Company, all of us at Bill Barrett Corporation appreciate the beauty and recreation afforded by the region. Our team diligently works with environmental, wildlife and sportsmen groups to ensure that our exploration and development activities are designed with all stakeholders in mind. For example, our development plans for West Tavaputs include leading edge technologies and designs that will deliver no net impact to our surroundings and have a surface “footprint” insignificant compared with our renewable energy counterparts. We consider this Company an industry leading steward of the environment and will maintain our commitment to operating responsibly.
2010 – Looking Ahead
In 2010, we are focused on bringing a key growth catalyst into development. We are seeking to obtain the Environmental Impact Statement Record of Decision at West Tavaputs, which will enable full scale, responsible development of this key asset. We continue to work with stakeholders on the resolution of litigation regarding our Cottonwood Gulch acquisition. This area has a Record of Decision and Resource Management Plan already in place, which could enable development of substantial possible reserves. Also, we are working to unlock the technology needed to bring our Yellow Jacket shale gas prospect to development as we apply the latest in horizontal drilling and completion technologies. We also continue to develop our core assets in the Piceance and Powder River Basins as well as increase the oil portion of our portfolio from our emerging Blacktail Ridge program. In addition, we continue to evaluate opportunities to acquire assets and manage our portfolio through purchase and divestiture. Importantly, our strong financial position affords us the flexibility to accelerate our 2010 development program yet stay poised for new projects should the opportunity arise.
Our goals in 2010 include targeting double digit production and reserve growth, aligning capital expenditures with expected cash flows, keeping our finding and development costs consistent with the three-year average, and initiating development on one of several future growth catalysts. As always, we are committed to executing our 2010 plan in a manner that maintains strong returns for our shareholders and promotes corporate responsibility in all facets of our operations.
Thank you to all of our shareholders and employees, and we look forward to a successful 2010.
Sincerely,
Fredrick J. Barrett
Chairman of the Board and Chief Executive Officer
March 25, 2010
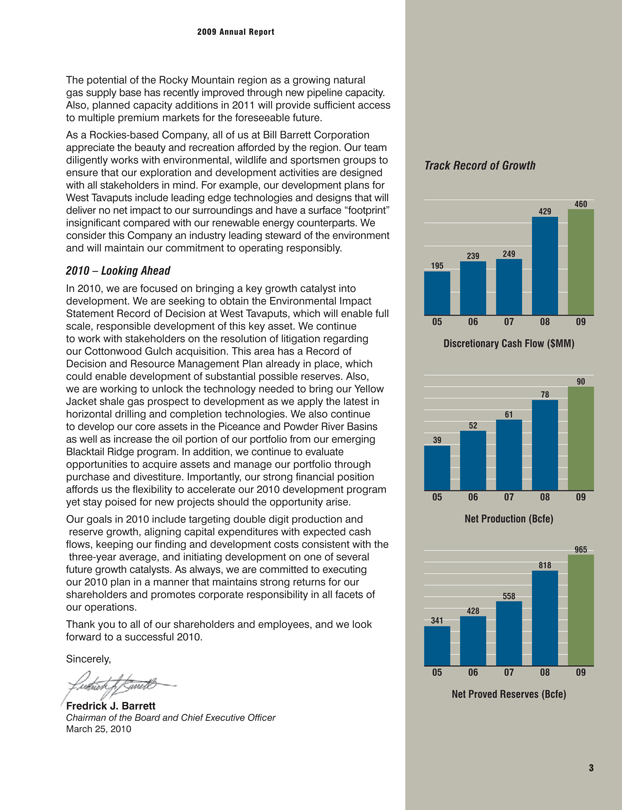
Track Record of Growth
460 429
239 249 195
05 06 07 08 09 Discretionary Cash Flow ($MM)
90 78
61 52 39
05 06 07 08 09 Net Production (Bcfe)
965 818
558 428 341
05 06 07 08 09 Net Proved Reserves (Bcfe)
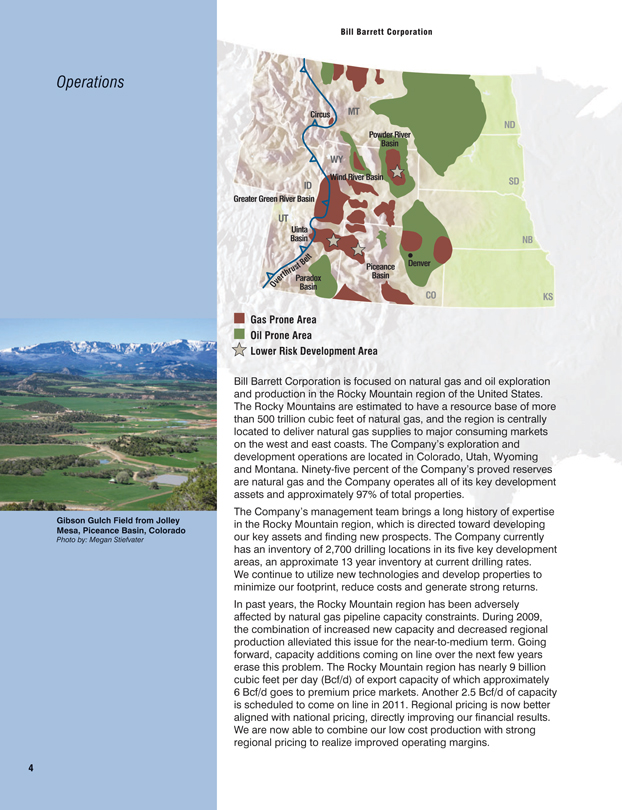
Operations
Gibson Gulch Field from Jolley Mesa, Piceance Basin, Colorado
Photo by: Megan Stiefvater
Bill Barrett Corporation
Circus MT
Powder River Basin WY
ID Wind River Basin Greater Green River Basin
UT Uinta Basin
l t
B e Denver s t Piceance
r u
t h Basin v e r Paradox O Basin
CO
Gas Prone Area Oil Prone Area
Lower Risk Development Area
Bill Barrett Corporation is focused on natural gas and oil exploration and production in the Rocky Mountain region of the United States. The Rocky Mountains are estimated to have a resource base of more than 500 trillion cubic feet of natural gas, and the region is centrally located to deliver natural gas supplies to major consuming markets on the west and east coasts. The Company’s exploration and development operations are located in Colorado, Utah, Wyoming and Montana. Ninety-five percent of the Company’s proved reserves are natural gas and the Company operates all of its key development assets and approximately 97% of total properties.
The Company’s management team brings a long history of expertise in the Rocky Mountain region, which is directed toward developing our key assets and finding new prospects. The Company currently has an inventory of 2,700 drilling locations in its five key development areas, an approximate 13 year inventory at current drilling rates. We continue to utilize new technologies and develop properties to minimize our footprint, reduce costs and generate strong returns. In past years, the Rocky Mountain region has been adversely affected by natural gas pipeline capacity constraints. During 2009, the combination of increased new capacity and decreased regional production alleviated this issue for the near-to-medium term. Going forward, capacity additions coming on line over the next few years erase this problem. The Rocky Mountain region has nearly 9 billion cubic feet per day (Bcf/d) of export capacity of which approximately
6 Bcf/d goes to premium price markets. Another 2.5 Bcf/d of capacity is scheduled to come on line in 2011. Regional pricing is now better aligned with national pricing, directly improving our financial results. We are now able to combine our low cost production with strong regional pricing to realize improved operating margins.
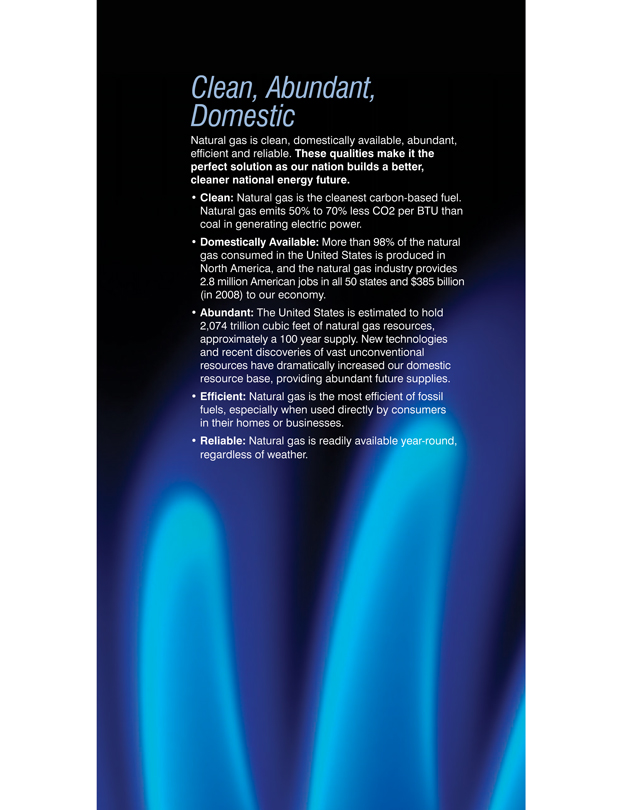
Clean, Domestic Abundant,
Natural gas is clean, domestically available, abundant, efficient and reliable. These qualities make it the perfect solution as our nation builds a better, cleaner national energy future.
• Clean: Natural gas is the cleanest carbon-based fuel. Natural gas emits 50% to 70% less CO2 per BTU than coal in generating electric power.
• Domestically Available: More than 98% of the natural gas consumed in the United States is produced in North America, and the natural gas industry provides 2.8 million American jobs in all 50 states and $385 billion (in 2008) to our economy.
• Abundant: The United States is estimated to hold 2,074 trillion cubic feet of natural gas resources, approximately a 100 year supply. New technologies and recent discoveries of vast unconventional resources have dramatically increased our domestic resource base, providing abundant future supplies. • Efficient: Natural gas is the most efficient of fossil fuels, especially when used directly by consumers in their homes or businesses.
• Reliable: Natural gas is readily available year-round, regardless of weather.
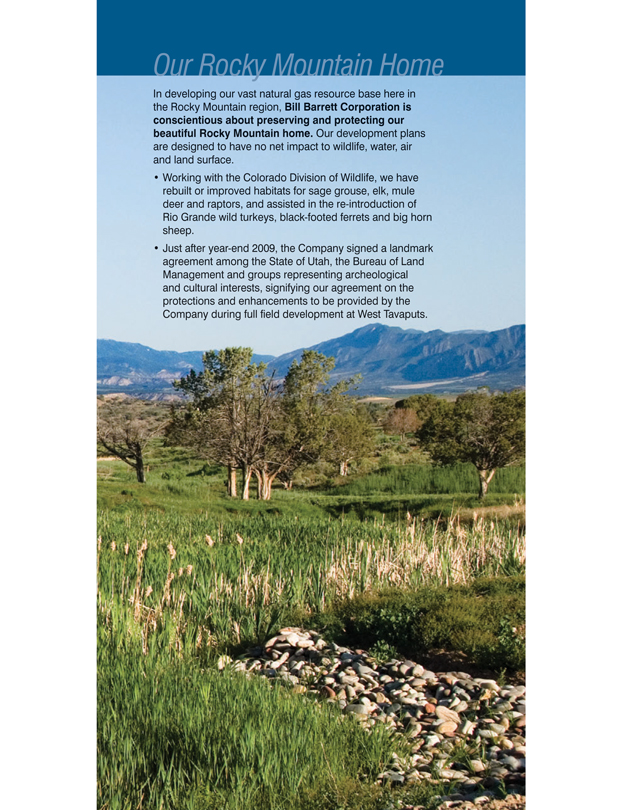
Our Rocky Mountain Home
In developing our vast natural gas resource base here in the Rocky Mountain region, Bill Barrett Corporation is conscientious about preserving and protecting our beautiful Rocky Mountain home. Our development plans are designed to have no net impact to wildlife, water, air and land surface.
• Working with the Colorado Division of Wildlife, we have rebuilt or improved habitats for sage grouse, elk, mule deer and raptors, and assisted in the re-introduction of Rio Grande wild turkeys, black-footed ferrets and big horn sheep.
• Just after year-end 2009, the Company signed a landmark agreement among the State of Utah, the Bureau of Land Management and groups representing archeological and cultural interests, signifying our agreement on the protections and enhancements to be provided by the Company during full field development at West Tavaputs.
2009 Annual Report
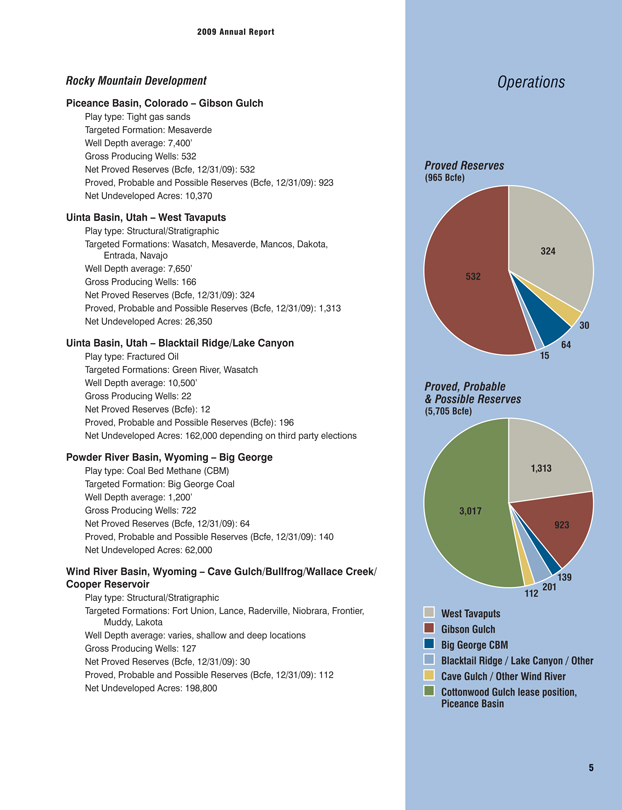
Rocky Mountain Development
Piceance Basin, Colorado – Gibson Gulch
Play type: Tight gas sands Targeted Formation: Mesaverde Well Depth average: 7,400’ Gross Producing Wells: 532
Net Proved Reserves (Bcfe, 12/31/09): 532
Proved, Probable and Possible Reserves (Bcfe, 12/31/09): 923 Net Undeveloped Acres: 10,370
Uinta Basin, Utah – West Tavaputs
Play type: Structural/Stratigraphic
Targeted Formations: Wasatch, Mesaverde, Mancos, Dakota, Entrada, Navajo Well Depth average: 7,650’ Gross Producing Wells: 166 Net Proved Reserves (Bcfe, 12/31/09): 324 Proved, Probable and Possible Reserves (Bcfe, 12/31/09): 1,313 Net Undeveloped Acres: 26,350
Uinta Basin, Utah – Blacktail Ridge/Lake Canyon
Play type: Fractured Oil
Targeted Formations: Green River, Wasatch Well Depth average: 10,500’ Gross Producing Wells: 22 Net Proved Reserves (Bcfe): 12 Proved, Probable and Possible Reserves (Bcfe): 196
Net Undeveloped Acres: 162,000 depending on third party elections
Powder River Basin, Wyoming – Big George
Play type: Coal Bed Methane (CBM) Targeted Formation: Big George Coal Well Depth average: 1,200’ Gross Producing Wells: 722 Net Proved Reserves (Bcfe, 12/31/09): 64
Proved, Probable and Possible Reserves (Bcfe, 12/31/09): 140 Net Undeveloped Acres: 62,000
Wind River Basin, Wyoming – Cave Gulch/Bullfrog/Wallace Creek/ Cooper Reservoir
Play type: Structural/Stratigraphic
Targeted Formations: Fort Union, Lance, Raderville, Niobrara, Frontier, Muddy, Lakota Well Depth average: varies, shallow and deep locations Gross Producing Wells: 127 Net Proved Reserves (Bcfe, 12/31/09): 30 Proved, Probable and Possible Reserves (Bcfe, 12/31/09): 112 Net Undeveloped Acres: 198,800
Operations
Proved Reserves
(965 Bcfe)
324
532
30 64 15
Proved, Probable
& Possible Reserves
(5,705 Bcfe)
1,313
3,017
923
139 201 112 West Tavaputs Gibson Gulch Big George CBM
Blacktail Ridge / Lake Canyon / Other Cave Gulch / Other Wind River Cottonwood Gulch lease position, Piceance Basin

Operations
Piceance Basin
Photo by: Monty Shed
Bill Barrett Corporation
Gibson Gulch – Piceance Basin, Colorado
Our Gibson Gulch operations in the Piceance Basin exemplify our reputation as a low cost operator and our Rocky Mountain expertise. Here we have expanded operations significantly since this 2004 acquisition. Net production was increased from less than 3 million cubic feet equivalent per day (MMcfe/d) to average 100 MMcfe/d in 2009 and proved reserves were increased from 46 Bcfe to 532 Bcfe at year-end 2009. During this same period, we also reduced the average time it takes to drill one well from 15 days to as little as five days spud-to-spud, and lowered operating costs. In addition, we reduced surface area disturbance with the implementation of a water management system and minimized our footprint by increasing the number of wells drilled per pad to up to 16. At Gibson Gulch, the natural gas is liquids rich, offering the opportunity to process the natural gas and receive significantly stronger revenues for production. The Company owns its regional compression facilities, having capacity for 140 million cubic feet per day (MMcf/d). The Gibson Gulch program offers strong margins from its low cost production and currently has a nine year drilling inventory. The Company plans to drill 120 to 130 wells in the area in 2010.
West Tavaputs – Uinta Basin, Utah
Growth at West Tavaputs has come through a combination of our regional geologic expertise, operational improvements and environmental management. Here, operations have grown from
1 MMcfe/d of net production and 3 Bcfe of proved reserves at the time of its acquisition in 2002 to 83 MMcfe/d of average net production and 324 Bcfe of proved reserves in 2009. While the Company continues to develop this significant asset, the pace of development has slowed as the Company continues to work with the Bureau of Land Management to obtain a Record of Decision on its Environmental Impact Statement. During 2009, the Company worked closely with archeological, wildlife and wilderness groups to address their concerns regarding full-field development of the project. The Company’s development plans are designed to have zero net effect on the environment. The Company plans to drill eight wells in the area during the first half of 2010 and, with finalization of the Record of Decision, expects to increase its activity later in the year.
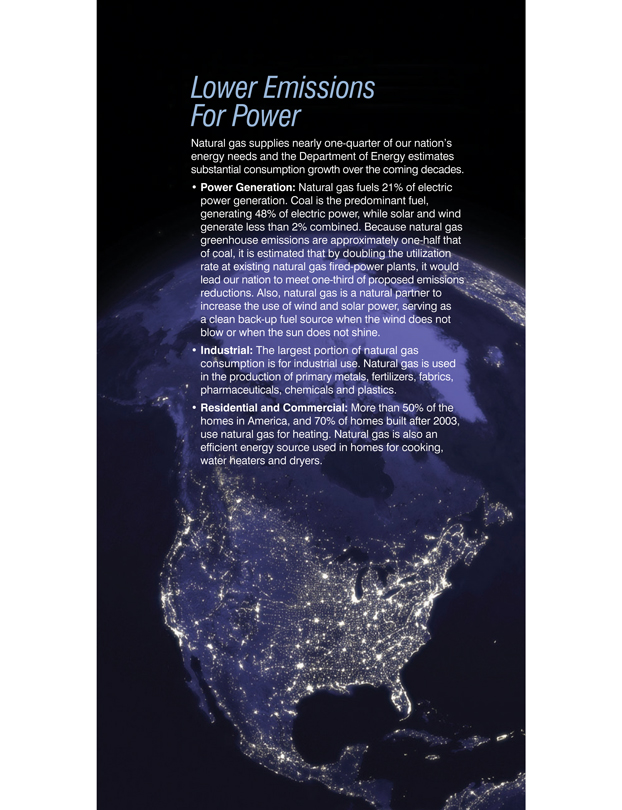
For Lower Power Emissions
Natural gas supplies nearly one-quarter of our nation’s energy needs and the Department of Energy estimates substantial consumption growth over the coming decades. • Power Generation: Natural gas fuels 21% of electric power generation. Coal is the predominant fuel, generating 48% of electric power, while solar and wind generate less than 2% combined. Because natural gas greenhouse emissions are approximately one-half that of coal, it is estimated that by doubling the utilization rate at existing natural gas fired-power plants, it would lead our nation to meet one-third of proposed emissions reductions. Also, natural gas is a natural partner to increase the use of wind and solar power, serving as a clean back-up fuel source when the wind does not blow or when the sun does not shine.
• Industrial: The largest portion of natural gas consumption is for industrial use. Natural gas is used in the production of primary metals, fertilizers, fabrics, pharmaceuticals, chemicals and plastics.
• Residential and Commercial: More than 50% of the homes in America, and 70% of homes built after 2003, use natural gas for heating. Natural gas is also an efficient energy source used in homes for cooking, water heaters and dryers.
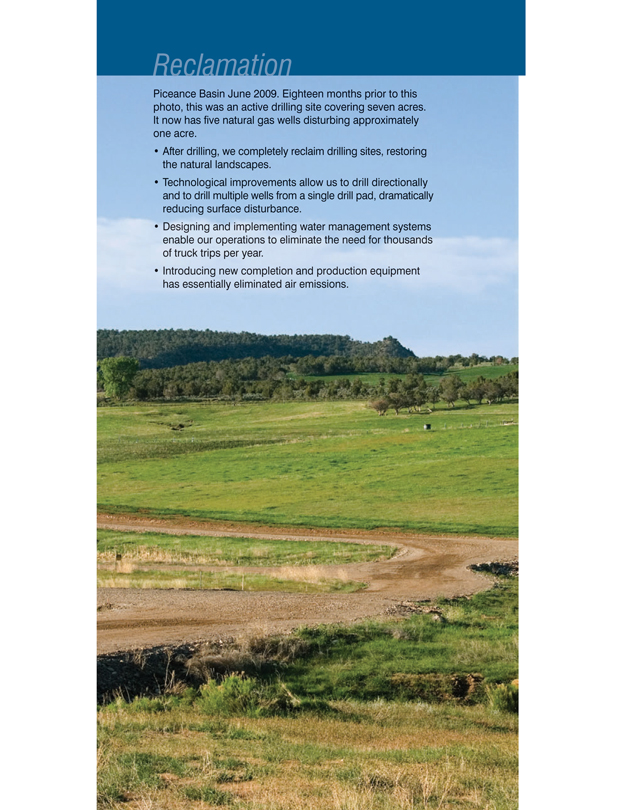
Reclamation
Piceance Basin June 2009. Eighteen months prior to this photo, this was an active drilling site covering seven acres. It now has five natural gas wells disturbing approximately one acre.
• After drilling, we completely reclaim drilling sites, restoring the natural landscapes.
• Technological improvements allow us to drill directionally and to drill multiple wells from a single drill pad, dramatically reducing surface disturbance.
• Designing and implementing water management systems enable our operations to eliminate the need for thousands of truck trips per year.
• Introducing new completion and production equipment has essentially eliminated air emissions.
2009 Annual Report
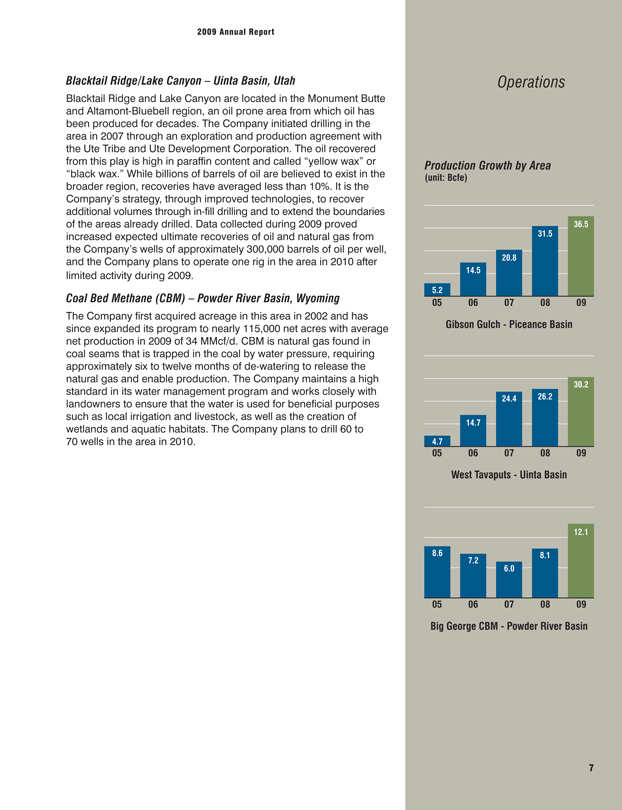
Blacktail Ridge/Lake Canyon – Uinta Basin, Utah
Blacktail Ridge and Lake Canyon are located in the Monument Butte and Altamont-Bluebell region, an oil prone area from which oil has been produced for decades. The Company initiated drilling in the area in 2007 through an exploration and production agreement with the Ute Tribe and Ute Development Corporation. The oil recovered from this play is high in paraffin content and called “yellow wax” or “black wax.” While billions of barrels of oil are believed to exist in the broader region, recoveries have averaged less than 10%. It is the Company’s strategy, through improved technologies, to recover additional volumes through in-fill drilling and to extend the boundaries of the areas already drilled. Data collected during 2009 proved increased expected ultimate recoveries of oil and natural gas from the Company’s wells of approximately 300,000 barrels of oil per well, and the Company plans to operate one rig in the area in 2010 after limited activity during 2009.
Coal Bed Methane (CBM) – Powder River Basin, Wyoming
The Company first acquired acreage in this area in 2002 and has since expanded its program to nearly 115,000 net acres with average net production in 2009 of 34 MMcf/d. CBM is natural gas found in coal seams that is trapped in the coal by water pressure, requiring approximately six to twelve months of de-watering to release the natural gas and enable production. The Company maintains a high standard in its water management program and works closely with landowners to ensure that the water is used for beneficial purposes such as local irrigation and livestock, as well as the creation of wetlands and aquatic habitats. The Company plans to drill 60 to 70 wells in the area in 2010.
Operations
Production Growth by Area
(unit: Bcfe)
36.5 31.5
20.8 14.5
5.2
05 06 07 08 09 Gibson Gulch—Piceance Basin
30.2 24.4 26.2
14.7
4.7
05 06 07 08 09 West Tavaputs—Uinta Basin
12.1
8.6 8.1
7.2 6.0
05 06 07 08 09 Big George CBM—Powder River Basin
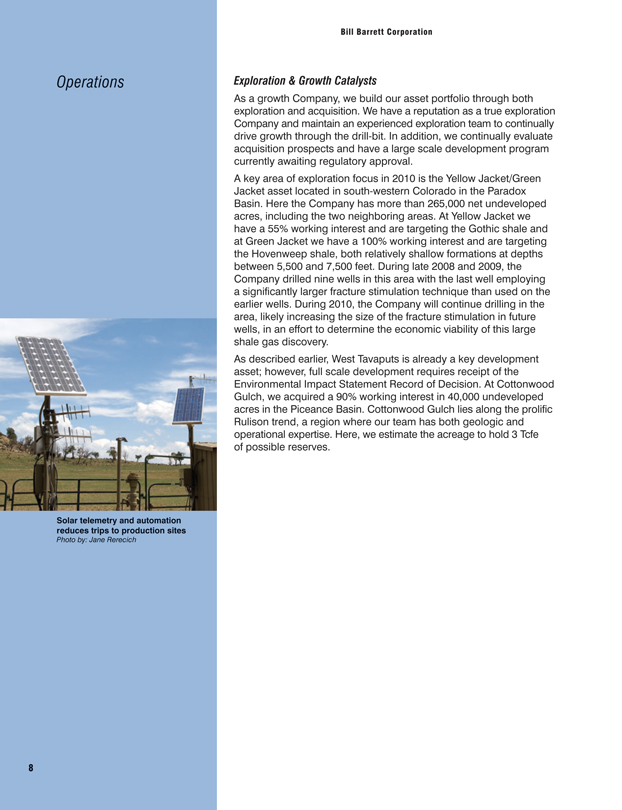
Operations
Solar telemetry and automation reduces trips to production sites
Photo by: Jane Rerecich
Bill Barrett Corporation
Exploration & Growth Catalysts
As a growth Company, we build our asset portfolio through both exploration and acquisition. We have a reputation as a true exploration Company and maintain an experienced exploration team to continually drive growth through the drill-bit. In addition, we continually evaluate acquisition prospects and have a large scale development program currently awaiting regulatory approval.
A key area of exploration focus in 2010 is the Yellow Jacket/Green Jacket asset located in south-western Colorado in the Paradox Basin. Here the Company has more than 265,000 net undeveloped acres, including the two neighboring areas. At Yellow Jacket we have a 55% working interest and are targeting the Gothic shale and at Green Jacket we have a 100% working interest and are targeting the Hovenweep shale, both relatively shallow formations at depths between 5,500 and 7,500 feet. During late 2008 and 2009, the Company drilled nine wells in this area with the last well employing a significantly larger fracture stimulation technique than used on the earlier wells. During 2010, the Company will continue drilling in the area, likely increasing the size of the fracture stimulation in future wells, in an effort to determine the economic viability of this large shale gas discovery.
As described earlier, West Tavaputs is already a key development asset; however, full scale development requires receipt of the Environmental Impact Statement Record of Decision. At Cottonwood Gulch, we acquired a 90% working interest in 40,000 undeveloped acres in the Piceance Basin. Cottonwood Gulch lies along the prolific Rulison trend, a region where our team has both geologic and operational expertise. Here, we estimate the acreage to hold 3 Tcfe of possible reserves.
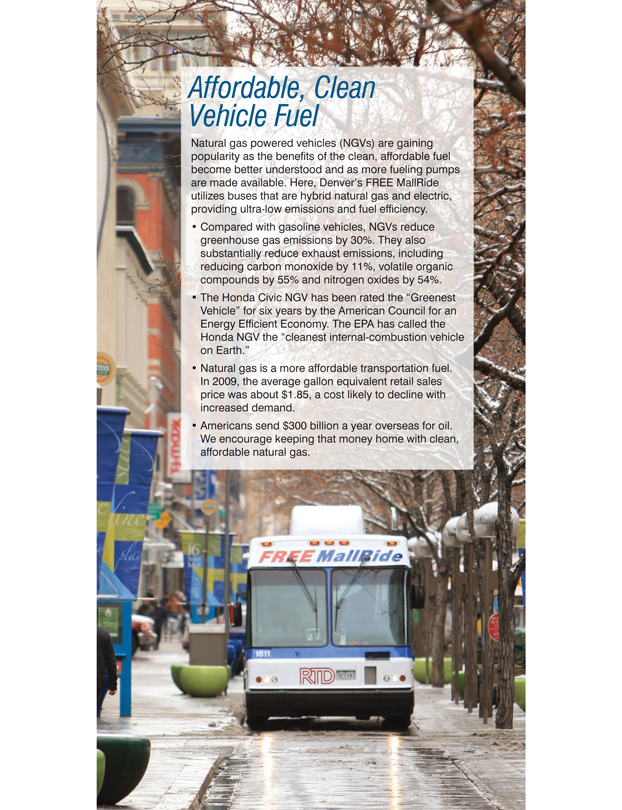
Vehicle Affordable, Fuel Clean
Natural gas powered vehicles (NGVs) are gaining popularity as the benefits of the clean, affordable fuel become better understood and as more fueling pumps are made available. Here, Denver’s FREE MallRide utilizes buses that are hybrid natural gas and electric, providing ultra-low emissions and fuel efficiency.
• Compared with gasoline vehicles, NGVs reduce greenhouse gas emissions by 30%. They also substantially reduce exhaust emissions, including reducing carbon monoxide by 11%, volatile organic compounds by 55% and nitrogen oxides by 54%.
• The Honda Civic NGV has been rated the “Greenest
Vehicle” for six years by the American Council for an Energy Efficient Economy. The EPA has called the Honda NGV the “cleanest internal-combustion vehicle on Earth.”
• Natural gas is a more affordable transportation fuel. In 2009, the average gallon equivalent retail sales price was about $1.85, a cost likely to decline with increased demand.
• Americans send $300 billion a year overseas for oil.
We encourage keeping that money home with clean, affordable natural gas.

#1 Green Vehicle
At Bill Barrett Corporation, our Denver employees enjoy the use of a Honda Civic GX NGV. The car has a driving range of approximately 180 miles and costs less than $10 to fill up. Employees enter a lottery to have use of the NGV for two weeks at a time —a very popular program.
“The NGV difference only becomes clear when refueling…easy, quick and no gasoline smell!”
Fred Le Grand – Reservoir Engineer
“I was pleasantly surprised by the car’s responsiveness and even more satisfied at the price tag when filling it up. This would make a great commuter car for people living in the suburbs of any city.”
Dominic Spencer – Drilling Engineer
“I loved driving the car…and it was great to talk to friends and strangers to educate them on the benefits of natural gas versus gasoline.”
Lisa Humbert – Geophysicist
Bill Barrett Corporation
AnnuAl RepoRt on FoRm 10-k
For the year ended December 31, 2009
Bill Barrett Corporation
Forward Looking Statements
This report contains forward-looking statements regarding Bill Barrett Corporation’s future plans and expected performance based on assumptions the Company believes to be reasonable. A number of risks and uncertainties could cause actual results to differ materially from these statements, including, without limitation, fluctuations in oil and gas prices, the ability to receive drilling permits and other regulatory approvals, the timeliness of development activities, and other risk factors described in the Company’s accompanying Annual Report on Form 10-K for the year ended December 31, 2009.
New York Stock Exchange Certification
The New York Stock Exchange’s Rule 303A.12(a) requires chief executive officers of listed companies to certify that they are not aware of any violations by their companies of the exchange’s corporate governance listing standards. This annual certification by the chief executive officer of Bill Barrett Corporation has been filed with the New York Stock Exchange. In addition, Bill Barrett Corporation has filed, as exhibits to its most recently filed Form 10-K, the SEC certifications required for the chief executive officer and chief financial officer under Section 302 of the Sarbanes-Oxley Act.
Non-GAAP Measure
Discretionary cash flow is computed as net income plus depreciation, depletion, and amortization, impairment expenses, deferred income taxes, dry hole costs and abandonment expenses, exploration expenses, non-cash stock-based compensation, losses (gains) on disposals of properties, and certain other non-cash charges. The non-GAAP measure of discretionary cash flow is presented because management believes that it provides useful additional information to investors for analysis of the Company’s ability to internally generate funds for exploration, development and acquisitions. In addition, discretionary cash flow is widely used by professional research analysts and others in the valuation, comparison and investment recommendations of companies in the oil and gas exploration and production industry, and many investors use the published research of industry research analysts in making investment decisions. Discretionary cash flow should not be considered in isolation or as a substitute for net income, income from operations, net cash provided by operating activities or other income, profitability, cash flow or liquidity measures prepared in accordance with accounting principles generally accepted in the United States of America (“GAAP”). Because discretionary cash flow excludes some, but not all, items that affect net income and net cash provided by operating activities and may vary among companies, the discretionary cash flow amounts presented may not be comparable to similarly titled measures of other companies.
Finding and development cost, or F&D cost, per Mcfe, is calculated, by costs incurred adjusted to: subtract the asset retirement obligation amount; subtract material non-cash capital items; subtract proceeds received from joint exploration agreements and certain property sales; and subtract capitalize interest; divided by reserve additions for the year. Consistent with industry practice, future capital expenditures to develop proved undeveloped reserves or capital associated with furniture, fixtures and equipment are not included in costs incurred. The method the Company uses to calculate its F&D cost may differ significantly from methods used by other companies to compute similar measures. As a result, the Company’s F&D cost may not be comparable to similar measures provided by other companies. The Company believes that providing a non-GAAP measure of F&D cost is useful to investors in evaluating the cost, on a per Mcfe basis, to add proved reserves. However, this measure is provided in addition to, and not as an alternative for, and should be read in conjunction with, the information contained in its financial statements prepared in accordance with GAAP. Due to various factors, including timing differences in the addition of proved reserves and the related costs to develop those reserves, F&D cost does not necessarily reflect precisely the costs associated with particular reserves. As a result of various factors that could materially affect the timing and amounts of future increases in reserves and the timing and amounts of future costs, the Company cannot assure you that its future F&D cost will not differ materially from those presented.
For a reconciliation of these non-GAAP measures to financial information prepared in accordance with GAAP, refer to our Current Reports on Form 8-K, including the February 23, 2010 Form 8-K, filed with the Securities and Exchange Commission (SEC).
Reserve Disclosure
The SEC, under its recently revised guidelines, permits oil and gas companies to disclose probable and possible reserves in their filings with the SEC. The Company does not plan to include probable and possible reserve estimates in its filings with the SEC.
The Company has provided internally generated estimates for probable and possible reserves in this report. The estimates are consistent with the guidelines outlined in the SPE/WPC/AAPG/SPEE Petroleum Resources Management System. The estimates are not prepared or reviewed by third party engineers and do not conform to SEC guidelines for estimating probable and possible reserves. Our probable and possible reserve estimate methodology differs from the new SEC guidelines including our use of commodity pricing. Rather than the SEC simple 12-month average of the 2009 first day of the month oil and gas prices, we use strip pricing, which we use internally for planning and budgeting purposes. Because these estimates were not prepared in accordance with SEC guidelines, they may not be included in SEC filings. The Company’s estimate of probable and possible reserves is provided in this report because management believes it is useful, additional information that is widely used by the investment community in the valuation, comparison and analysis of companies. The Company’s methods for estimating probable and possible reserves may differ from methods used by other companies to disclose non-proved reserves and our estimate may not be comparable to similarly titled measures provided by other companies. U.S. investors are urged to consider closely the disclosure in our accompanying Annual Report on Form 10-K, for the year ended December 31, 2009, available on the Company’s website at www.billbarrettcorp.com or from the corporate offices at 1099 18th Street, Suite 2300, Denver, CO 80202. You can also obtain this form from the SEC by calling 1-800-SEC-0330 or at www.sec.gov.
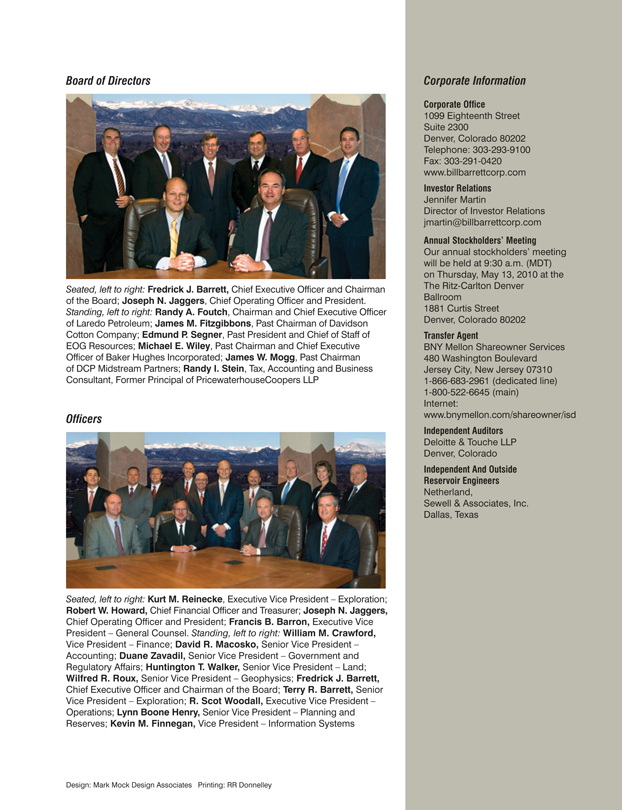
Board of Directors
Seated, left to right: Fredrick J. Barrett, Chief Executive Officer and Chairman of the Board; Joseph N. Jaggers, Chief Operating Officer and President. Standing, left to right: Randy A. Foutch, Chairman and Chief Executive Officer of Laredo Petroleum; James M. Fitzgibbons, Past Chairman of Davidson Cotton Company; Edmund P. Segner, Past President and Chief of Staff of EOG Resources; Michael E. Wiley, Past Chairman and Chief Executive Officer of Baker Hughes Incorporated; James W. Mogg, Past Chairman of DCP Midstream Partners; Randy I. Stein, Tax, Accounting and Business Consultant, Former Principal of PricewaterhouseCoopers LLP
Officers
Seated, left to right: Kurt M. Reinecke, Executive Vice President – Exploration; Robert W. Howard, Chief Financial Officer and Treasurer; Joseph N. Jaggers, Chief Operating Officer and President; Francis B. Barron, Executive Vice President – General Counsel. Standing, left to right: William M. Crawford, Vice President – Finance; David R. Macosko, Senior Vice President – Accounting; Duane Zavadil, Senior Vice President – Government and Regulatory Affairs; Huntington T. Walker, Senior Vice President – Land; Wilfred R. Roux, Senior Vice President – Geophysics; Fredrick J. Barrett, Chief Executive Officer and Chairman of the Board; Terry R. Barrett, Senior Vice President – Exploration; R. Scot Woodall, Executive Vice President – Operations; Lynn Boone Henry, Senior Vice President – Planning and Reserves; Kevin M. Finnegan, Vice President – Information Systems
Design: Mark Mock Design Associates Printing: RR Donnelley
Corporate Information
Corporate Office
1099 Eighteenth Street Suite 2300 Denver, Colorado 80202 Telephone: 303-293-9100 Fax: 303-291-0420 www.billbarrettcorp.com
Investor Relations
Jennifer Martin
Director of Investor Relations jmartin@billbarrettcorp.com
Annual Stockholders’ Meeting
Our annual stockholders’ meeting will be held at 9:30 a.m. (MDT) on Thursday, May 13, 2010 at the The Ritz-Carlton Denver Ballroom 1881 Curtis Street Denver, Colorado 80202
Transfer Agent
BNY Mellon Shareowner Services 480 Washington Boulevard Jersey City, New Jersey 07310 1-866-683-2961 (dedicated line) 1-800-522-6645 (main) Internet: www.bnymellon.com/shareowner/isd
Independent Auditors
Deloitte & Touche LLP Denver, Colorado
Independent And Outside Reservoir Engineers
Netherland,
Sewell & Associates, Inc. Dallas, Texas
Bill Barrett Corporation
1099 18th Street, Suite 2300 Denver, Colorado 80202 303-293-9100 www.billbarrettcorp.com