UNITED STATES
SECURITIES AND EXCHANGE COMMISSION
Washington, D.C. 20549
FORM 10-K
(Mark one)
| x | ANNUAL REPORT PURSUANT TO SECTION 13 OR 15(d) OF THE SECURITIES EXCHANGE ACT OF 1934 |
For the fiscal year ended December 31, 2011
or
| ¨ | TRANSITION REPORT PURSUANT TO SECTION 13 OR 15(d) OF THE SECURITIES EXCHANGE ACT OF 1934 |
For the transition period from to
Commission File No. 001-32367
BILL BARRETT CORPORATION
(Exact name of registrant as specified in its charter)
| Delaware | 80-0000545 | |
| (State or other jurisdiction of incorporation or organization) | (IRS Employer Identification No.) | |
1099 18th Street, Suite 2300 Denver, Colorado | 80202 | |
(Address of principal executive offices) | (Zip Code) | |
(303) 293-9100
(Registrant’s telephone number, including area code)
Securities registered pursuant to Section 12(b) of the Act:
Title of each class | Name of each exchange on which registered | |
| Common Stock, $.001 par value | New York Stock Exchange | |
| Series A Junior Participating Preferred Stock Purchase Rights | New York Stock Exchange |
Securities registered pursuant to Section 12(g) of the Act: None
Indicate by check mark if the registrant is a well-known seasoned issuer, as defined in Rule 405 of the Securities Act. x Yes ¨ No
Indicate by check mark if the registrant is not required to file reports pursuant to Section 13 or Section 15(d) of the Act. ¨ Yes x No
Indicate by check mark whether the registrant (1) has filed all reports required to be filed by Section 13 or 15(d) of the Securities Exchange Act of 1934 during the preceding 12 months (or for such shorter period that the registrant was required to file such reports), and (2) has been subject to such filing requirements for the past 90 days. x Yes ¨ No
Indicate by check mark whether the registrant has submitted electronically and posted on its corporate Web site, if any, every Interactive Data File required to be submitted and posted pursuant to Rule 405 of Regulation S-T (§232.405 of this chapter) during the preceding 12 months (or for such shorter period that the registrant was required to submit and post such files). x Yes ¨ No
Indicate by check mark if disclosure of delinquent filers pursuant to Item 405 of Regulation S-K (§ 229.405 of this chapter) is not contained herein, and will not be contained, to the best of registrant’s knowledge, in definitive proxy or information statements incorporated by reference in Part III of this Form 10-K or any amendment to this Form 10-K. ¨
Indicate by check mark whether the registrant is a large accelerated filer, an accelerated filer, a non-accelerated filer, or a smaller reporting company. See the definitions of “large accelerated filer,” “accelerated filer” and “smaller reporting company” in Rule 12b-2 of the Exchange Act.
| Large accelerated filer | x | Accelerated filer | ¨ | |||
| Non-accelerated filer | ¨ (Do not check if a smaller reporting company) | Smaller reporting company | ¨ |
Indicate by check mark whether the registrant is a shell company (as defined in Rule 12b-2 of the Act). ¨ Yes x No
The aggregate market value of the voting and non-voting common equity held by non-affiliates of the registrant as of June 30, 2011 based on the $46.35 closing price of the registrant’s common stock on the New York Stock Exchange was $1,916,660,148.*
| * | Calculated based on beneficial ownership of our common stock on January 27, 2012. Without assuming that any of the registrant’s directors, executive officers, or 10 percent or greater beneficial owners is an affiliate, the shares of which they are beneficial owners have been deemed to be owned by affiliates solely for this calculation. |
As of January 27, 2012, the registrant had 47,835,848 outstanding shares of $.001 per share par value common stock.
DOCUMENTS INCORPORATED BY REFERENCE
The information required in Part III of this Annual Report on Form 10-K is incorporated by reference from the registrant’s definitive proxy statement for the registrant’s Annual Meeting of Stockholders to be held in May 2012 to be filed pursuant to Regulation 14A no later than 120 days after the end of the registrant’s fiscal year ended December 31, 2011.
CAUTIONARY NOTE REGARDING FORWARD-LOOKING STATEMENTS
This Annual Report on Form 10-K contains “forward-looking statements” within the meaning of Section 27A of the Securities Act of 1933, as amended, or the Securities Act, Section 21E of the Securities Exchange Act of 1934, as amended, (the “Exchange Act”), and the Private Securities Litigation Reform Act of 1995. Forward-looking statements include statements as to our future plans, estimates, beliefs and expected performance. Specifically, forward-looking statements may include statements about our:
| • | business and financial strategy; |
| • | oil and natural gas reserves; |
| • | realized oil and natural gas prices; |
| • | production; |
| • | exploration and development drilling prospects, inventories, projects and programs; |
| • | ability to obtain industry partners for our prospects on favorable terms to reduce our capital risks and accelerate our exploration activities; |
| • | liabilities resulting from litigation concerning alleged damages related to environmental issues, pollution, contamination, personal injury, royalties, marketing, title to properties, validity of leases, trespass, mineral trespass, or other matters that may not be covered by an effective indemnity or insurance; |
| • | ability to receive drilling and other permits, regulatory approvals and required surface access and rights of way; |
| • | identified drilling locations; |
| • | economic and competitive conditions; |
| • | derivative and hedging activities; |
| • | compliance with environmental and other regulations; |
| • | changing regulatory environment, such as initiatives related to drilling and well completion techniques including hydraulic fracturing; |
| • | cost and availability of third party facilities for gathering, processing, refining and transportation; |
| • | hedge counterparties’ ability to fulfill their obligations; |
| • | lease operating expenses and costs related to the acquisition and development of oil and gas properties; |
| • | availability and costs of drilling rigs and field services; |
| • | the ability to obtain and the cost of financing; |
| • | general and administrative costs, oilfield services costs and other expenses related to our business; |
| • | technology; |
| • | ability to retain and attract new employees with industry technical experience; |
| • | future operating results; and |
| • | plans, objectives, expectations and intentions. |
All of these types of statements, other than statements of historical fact included in or incorporated into this Annual Report on Form 10-K, are forward-looking statements. These forward-looking statements may be found in “Items 1 and 2. Business and Properties,” “Item 1A. Risk Factors,” “Item 7. Management’s Discussion and
- 1 -
Analysis of Financial Condition and Results of Operations” and other sections of this Annual Report on Form 10-K. In some cases, you can identify forward-looking statements by terminology such as “may,” “could,” “should,” “expect,” “plan,” “project,” “intend,” “anticipate,” “believe,” “estimate,” “predict,” “potential,” “pursue,” “target,” “seek,” “objective,” or “continue,” the negative of such terms or other comparable terminology.
Forward-looking statements are dependent upon events, risks and uncertainties that may be outside our control. Our actual results could differ materially from those discussed in these forward-looking statements. Factors that could cause or contribute to such differences include, but are not limited to, the following risks and uncertainties:
| • | volatility of market prices received for natural gas, natural gas liquids (“NGLs”) and oil; |
| • | ability to receive drilling and other permits, regulatory approvals and required surface access and rights of way; |
| • | legislative or regulatory changes including initiatives related to drilling and completion techniques including hydraulic fracturing; |
| • | economic and competitive conditions; |
| • | debt and equity market conditions; |
| • | derivative and hedging activities; |
| • | exploration risks such as drilling unsuccessful wells; |
| • | the ability to obtain industry partners for our prospects on favorable terms to reduce our capital risks and accelerate our exploration activities; |
| • | costs and availability of third party facilities for gathering, processing, refining and transportation; |
| • | future processing volumes and pipeline throughput; |
| • | reductions in the borrowing base under our revolving bank credit facility (the “Amended Credit Facility”); |
| • | the potential for production decline rates from our wells to be greater than we expect; |
| • | ability to replace natural production declines with new drilling or recompletion activities; |
| • | changes in estimates of proved reserves; |
| • | potential failure to achieve expected production from existing and future exploration or development projects; |
| • | declines in the values of our oil and natural gas properties resulting in impairments; |
| • | capital expenditures and other contractual obligations; |
| • | liabilities resulting from litigation concerning alleged damages related to environmental issues, pollution, contamination, personal injury, royalties, marketing, title to properties, validity of leases, or other matters that may not be covered by an effective indemnity or insurance; |
| • | higher than expected costs and expenses including production, drilling and well equipment costs; |
| • | occurrence of property acquisitions or divestitures; |
| • | changes in tax rates; |
| • | compliance with environmental and other regulations; and |
- 2 -
| • | other uncertainties, as well as those factors discussed below and elsewhere in this Annual Report on Form 10-K, particularly under the “Cautionary Note Regarding Forward-Looking Statements” and in Item 1A,” Risk Factors” all of which are difficult to predict. |
In light of these risks, uncertainties and assumptions, the forward-looking events discussed may not occur. Readers should not place undue reliance on these forward-looking statements, which reflect management’s views only as of the date hereof. Other than as required under the securities laws, we do not undertake any obligation to publicly correct or update any forward-looking statements whether as a result of changes in internal estimates or expectations, new information, subsequent events or circumstances or otherwise.
The forward-looking statements contained in this Annual Report on Form 10-K are largely based on our expectations, which reflect estimates and assumptions made by our management. These estimates and assumptions reflect our best judgment based on currently known market conditions and other factors. Although we believe such estimates and assumptions to be reasonable, they are inherently uncertain and involve a number of risks and uncertainties that are beyond our control. In addition, management’s assumptions about future events may prove to be inaccurate. Management cautions all readers that the forward-looking statements contained in this Annual Report on Form 10-K are not guarantees of future performance, and we cannot assure any reader that such statements will be realized or that forward-looking events and circumstances will occur. Actual results may differ materially from those anticipated or implied in the forward-looking statements due to many factors including those listed in “Item 1A. Risk Factors” and elsewhere in this Annual Report on Form 10-K. All forward-looking statements speak only as of the date of this Annual Report on Form 10-K. We do not intend to, and do not undertake any obligation to, publicly update or revise any forward-looking statements as a result of new information, future events or otherwise. These cautionary statements qualify all forward-looking statements attributable to us or persons acting on our behalf.
- 3 -
PART I
| Items 1 and | 2. Business and Properties |
BUSINESS
General
Bill Barrett Corporation together with our wholly-owned subsidiaries (“the Company”, “we,” “our” or “us”) explores for and develops oil and natural gas in the Rocky Mountain region of the United States. We seek to build stockholder value through profitable growth in reserves and production, which we expect will include investing in and profitably developing key existing development programs as well as growth through exploration and acquisitions. We seek high quality exploration and development projects with potential for providing long-term drilling inventories that generate high returns. Substantially all of our revenues are generated through the sale of oil and natural gas production and natural gas liquids (“NGLs”) recovery at market prices and from the settlement of commodity hedges.
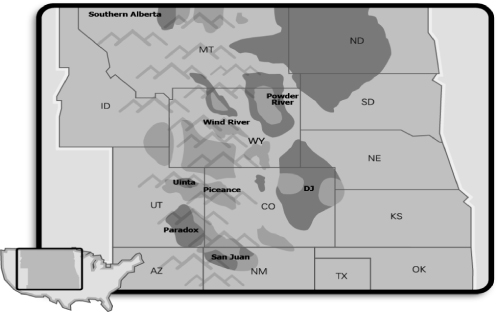
We were formed in January 2002 and are incorporated in the State of Delaware. In December 2004, we completed our initial public offering of 14,950,000 shares of our common stock at a price to the public of $25.00 per share. Since inception, we have built our portfolio of exploration and development properties primarily through acquisitions where we seek to add value through our geologic and operational expertise. Our acquisitions have included key assets in the Piceance (Colorado), Uinta (Utah), Denver-Julesburg (Colorado and Wyoming), Powder River (Wyoming) and Wind River (Wyoming) Basins in the Rocky Mountain region (the “Rockies”).
We are committed to exploring for, developing and producing oil and natural gas in a responsible manner. We work diligently with environmental, wildlife and community organizations to ensure that our exploration and development activities are designed with all stakeholders in mind.
We operate in one industry segment, which is the exploration, development and production of crude oil and natural gas, and all of our operations are conducted in the United States. Consequently, we currently report a single reportable segment. See “Financial Statements” and the notes to our consolidated financial statements for financial information about this reportable segment. See definitions of oil and natural gas terms below at “— Glossary of Oil and Natural Gas Terms.”
The following table provides information regarding our operations by basin as of December 31, 2011:
Basin/Area | State | Estimated Net Proved Reserves(1) (Bcfe) | December 2011 Average Daily Net Production (MMcfe/d) | Net Producing Wells(8) | Net Undeveloped Acreage | |||||||||||||
Piceance | CO | 596.0 | 136.8 | 779.8 | 42,633 | (2) | ||||||||||||
Uinta—West Tavaputs | UT | 460.7 | 104.6 | 258.0 | 22,618 | (3) | ||||||||||||
Uinta Oil | UT | 172.8 | 20.5 | 71.2 | 53,240 | (4) | ||||||||||||
Denver-Julesburg | CO/WY | 41.1 | 4.8 | 156.6 | 52,075 | |||||||||||||
Powder River—CBM | WY | 55.7 | 34.6 | 472.0 | 45,652 | |||||||||||||
Powder River—Deep | WY | 3.0 | 1.3 | 10.7 | 23,001 | (5) | ||||||||||||
Wind River | WY | 35.2 | 12.5 | 144.3 | 180,273 | |||||||||||||
Paradox | CO/UT | 0.0 | 0.2 | 5.9 | 365,988 | |||||||||||||
Other | Various | 0.2 | 0.2 | 5.9 | 465,978 | (6) | ||||||||||||
|
|
|
|
|
|
|
| |||||||||||
Total | 1,364.7 | 315.5 | 1,904.4 | 1,251,458 | (7) | |||||||||||||
|
|
|
|
|
|
|
| |||||||||||
| (1) | Our proved reserves were determined in accordance with Securities and Exchange Commission, or SEC, guidelines, using the average price on the first of each month for natural gas (CIG price) and oil (WTI |
- 4 -
| price), which averaged $3.93 per MMBtu of natural gas and $92.71 per barrel of oil in 2011, without giving effect to hedging transactions. CIG refers to Colorado Interstate Gas price as quoted in Platt’s Gas Daily on the first flow day of each month. WTI refers to West Texas Intermediate price as quoted by Plains All American Pipeline, L.P. using crude oil price bulletins for the first day of each month. Our reserves estimates are based on a reserve report prepared by us and audited by our independent third party petroleum engineers. See “—Oil and Gas Data—Proved Reserves.” |
| (2) | Includes 36,281 net acres associated with our Cottonwood Gulch prospect. |
| (3) | Does not include an additional 16,119 net undeveloped acres that are subject to drill-to-earn agreements. |
| (4) | Does not include an additional 60,888 net undeveloped acres that are subject to drill-to-earn agreements. |
| (5) | Does not include an additional 11,141 net undeveloped acres that are subject to drill-to-earn agreements. |
| (6) | Does not include an additional 35,093 net undeveloped acres that are subject to drill-to-earn agreements. |
| (7) | Does not include an additional 123,241 net undeveloped acres that are subject to drill-to-earn agreements. |
| (8) | Net wells are the sum of our fractional working interests owned in gross wells. |
Our Offices
We were founded in 2002 and are incorporated in Delaware. Our principal executive offices are located at 1099 18th Street, Suite 2300, Denver, Colorado 80202, and our telephone number at that address is (303) 293-9100.
Areas of Operation
- 5 -
Overview
Through our operations, we seek to offer a balance of lower risk development assets with higher risk exploration. We had four key active development programs as of December 31, 2011 including the Gibson Gulch area in the Piceance Basin, the Uinta Oil Program in the Uinta Basin, the West Tavaputs area in the Uinta Basin and, following an acquisition in August 2011, a primarily oil program in the Denver-Julesburg Basin. We hold acreage in a number of basins with plans for drilling activity in the Powder River, Southern Alberta, Paradox and San Juan Basins. We also seek to balance the commodity mix in our portfolio and are actively working to increase the proportion of oil in our reserves and production. Among our four key development programs, three of the programs target oil and high British Thermal Unit (“BTU”) content natural gas that can be processed into NGLs, while our exploration program is exclusively focused on oil and high BTU content natural gas.
Piceance Basin
The Piceance Basin is located in northwestern Colorado. We began operations in the Gibson Gulch area of the Piceance Basin on September 1, 2004 with the purchase of producing and undeveloped properties.
Key Statistics
| • | Estimated proved reserves as of December 31, 2011—596.0 Bcfe. |
| • | Producing wells—We had interests in 826 gross (779.8 net) producing wells as of December 31, 2011, and we serve as the operator in 796 gross producing wells. |
| • | 2011 net production—48.8 Bcfe. |
| • | Acreage—We held 42,633 net undeveloped acres, including the Cottonwood Gulch prospect, as of December 31, 2011. |
| • | Capital expenditures—Our capital expenditures for 2011 were $209.2 million for participation in the drilling of 121 gross wells and to expand our compression and gathering facilities in the Piceance Basin. |
| • | As of December 31, 2011, we were in the process of drilling three gross (3.0 net) wells and waiting to complete 44 gross (44.0 net) wells within the Piceance Basin. |
The Gibson Gulch area is a basin-centered gas play along the north end of the Divide Creek anticline near the eastern limits of the Piceance Basin’s productive Mesaverde (Williams Fork) trend at depths of approximately 7,500 feet. Through 2006, we drilled on a 20-acre well density. Beginning in 2007, we commenced drilling on 10-acre density and our year-end reserves include proved reserves associated with 10-acre density.
Our natural gas production in this basin is currently gathered through our own gathering system and EnCana Oil & Gas Corporation’s gathering system and delivered to markets through a variety of pipelines, including pipelines owned by Questar Pipeline Company, Northwest Pipeline, Colorado Interstate Gas, TransColorado Pipeline, Wyoming Interstate Gas Company Pipeline and Rockies Express Pipeline LLC. The energy content of our Piceance gas is 1.15 BTU per cubic foot and the natural gas is processed at an Enterprise Products Partners L.P. plant in Meeker, Colorado. We have the option annually to elect to process liquids with Enterprise Products Partners L.P. and receive the value of NGLs for a portion of our production. In 2009, 2010 and 2011, we elected the liquids option and are receiving Oil Price Information Service (“OPIS”) Mt. Belvieu prices for our NGLs, which are currently priced at a premium to natural gas on an energy equivalent basis.
We are currently running a three rig drilling program in the Piceance Basin, which may be adjusted throughout the year as business conditions and operating results warrant.
- 6 -
Uinta Basin
The Uinta Basin is located in northeastern Utah. Our development operations are conducted through two key programs; the West Tavaputs area, and our Uinta Oil Program. We also have a position in several exploration prospects in the Uinta Basin.
West Tavaputs Area
Key Statistics
| • | Estimated proved reserves as of December 31, 2011—460.7 Bcfe. |
| • | Producing wells—We had interests in 271 gross (258 net) producing wells as of December 31, 2011, and we serve as the operator in 271 gross producing wells. |
| • | 2011 net production—32.0 Bcfe. |
| • | Acreage—We held 22,618 net undeveloped acres as of December 31, 2011, along with 16,119 net acres that are subject to drill-to-earn agreements. |
| • | Capital expenditures—In 2011, our capital expenditures were $269.1 million to drill 92 gross wells and install compression and gathering facilities. |
| • | As of December 31, 2011, we were in the process of drilling one gross (1.0 net) well and waiting to complete 17 gross (12.5 net) wells. |
We serve as operator of our interests in the West Tavaputs Area. As of December 31, 2011, we had identified 622 potential drilling locations and 460.7 Bcfe of estimated proved reserves with a weighted average working interest of 96%. We are actively drilling our shallow program, which targets the gas-productive sands of the Wasatch and Mesaverde formations at depths down to 7,600 feet on average. We drilled 92 wells in 2011 and completed 89 wells. Two of the new wells this year targeted the Mancos and Niobrara formations to test these deeper horizons. Additionally, two recompletions were performed on existing wells in the Mancos and Niobrara formations. We believe that further research in drilling these formations horizontally is warranted when natural gas prices recover.
We are currently running a one rig drilling program to drill and complete wells in the Wasatch and Measverde formations in the West Tavaputs area of the Uinta Basin which may be adjusted throughout the year as business conditions and operating results warrant.
Our natural gas production in the West Tavaputs Area is currently gathered through our own gathering systems and delivered into Questar Pipeline Company and Three Rivers Gathering, LLC. Gas delivered into Questar Pipeline is processed by Questar Transportation Services Company, and gas delivered into Three Rivers Gathering can be processed by QEP Field Services Co and Chipita Processing LLC. Gas can then be marketed through a variety of pipelines including Questar Pipeline Company, Northwest Pipeline, CIG, Ruby Pipeline LLC, Rockies Express Pipeline LLC, and Wyoming Interstate Gas Company Pipeline.
Uinta Oil Program
Key Statistics
| • | Estimated proved reserves as of December 31, 2011—172.8 Bcfe. |
| • | Producing wells—We had interests in 121 gross (71.2 net) producing wells as of December 31, 2011, and we serve as operator in 92 gross wells. |
| • | 2011 net production—6.2 Bcfe. |
- 7 -
| • | Acreage—We held 53,240 net undeveloped acres as of December 31, 2011, along with 60,888 net acres that are subject to drill-to-earn agreements. |
| • | Capital expenditures—In 2011, our capital expenditures were $250.6 million to drill 45 gross (23.2 net) wells, which included $116.8 million in acquisition costs for oil properties and related assets in the East Bluebell area. |
| • | As of December 31, 2011, we were in the process of drilling three gross (1.6 net) wells and waiting to complete two gross (1.0 net) wells. |
The Uinta Oil Program is a fractured oil play with multiple pay zones, and we believe that it has significant exploratory upside. This program currently consists of three main areas of development including Blacktail Ridge, Lake Canyon and newly acquired East Bluebell. As part of our strategy to increase the oil share of our production mix, we increased our net acreage position to 76,743 net acres during 2011. As of December 31, 2011, we had identified three formations—the Green River, Wasatch and Uteland Butte—with 1,688 potential drilling locations and 172.8 Bcfe of estimated proved reserves and a weighted average working interest of 54%.
For the 2012 Green River-Wasatch development program, we are continuing to drill interior field locations as well as testing the western productivity extent of the field on 160 acre density. In addition to the Green River-Wasatch vertical program, we are extending the Uteland Butte horizontal program, horizontally testing a member of the Wasatch formation, continuing further exploration drilling in the Mahogany and completing a horizontal test of the Black Shale. We are also in the planning stages of selecting 80 acre pilot test areas across the field. We are currently running a three rig drilling program in the Uinta Oil Program which may be adjusted throughout the year as business conditions and operating results warrant.
Our gas production is gathered and processed by various third parties along with our own gathering systems, and our oil production is sold and trucked to the Salt Lake City area to be refined.
Blacktail Ridge
The Blacktail Ridge area consists of both vertical and horizontal wells that target the Wasatch, Green River, Uteland Butte and Mahogany formations. At December 31, 2011, we had an acreage position of 23,037 net acres with an additional 16,660 net acres subject to drill-to-earn agreements. Under our exploration and development agreement with the Ute Indian Tribe of the Uintah and Ouray Reservation, (“Ute Tribe”), and Ute Development Corporation, we serve as operator and have the right to earn a minimum of a 50% working interest in all formations. To earn these interests, we are required to drill a minimum of eight wells per year in the Wasatch formation. Through December 31, 2011, we had earned 17,588 gross (8,794 net) tribal acres in this area by fulfilling our drilling obligations through that date. The Ute Tribe assigned its participation rights pursuant to the exploration and development agreement to Ute Energy Corporation (“Ute Energy”).
Lake Canyon
The Lake Canyon area consists of both vertical and horizontal wells that target the Wasatch, Green River, and Uteland Butte formations. At December 31, 2011, we had an acreage position of 21,595 net acres with an additional 44,228 net acres subject to drill-to-earn agreements. Under the amended exploration and development agreement with the Ute Tribe and Ute Development Corporation, we operate the northern block of Lake Canyon (consisting of 19,781 net tribal acres) with a 75% working interest, and our industry partner operates the southern block where we retain a 25% working interest. This agreement also requires us and our industry partner to drill at least two wells per year from 2012 through 2015 and an additional 14 wells at some point between 2012 and 2015. Through December 31, 2011, we had earned 10,200 gross (4,640 net) tribal acres in this area by fulfilling our drilling obligations through that date. The Ute Tribe assigned its participation rights pursuant to the Lake Canyon amended agreement to Ute Energy.
- 8 -
East Bluebell
On June 8, 2011, we closed on an acquisition of oil properties and related assets in the Uinta Basin referred to as East Bluebell. The acquired properties, which consist of 20,413 net acres, are located approximately 35 miles east-northeast of the Blacktail Ridge and Lake Canyon projects with a mixture of fee, state, federal and tribal minerals both unitized and non-unitized. Three federal units exist within the acquired leasehold—Aurora Unit, Ouray Valley Unit and Roosevelt Unit. Also included in the acquisition was associated gathering and transportation infrastructure.
Denver-Julesburg Basin
The Denver—Julesburg Basin (“DJ Basin”) is located in Colorado’s eastern plains and parts of southern Wyoming, western Kansas and western Nebraska.
Key Statistics
| • | Estimated proved reserves as of December 31, 2011—41.1 Bcfe. |
| • | Producing wells—We had interests in 216 gross (156.6 net) producing wells as of December 31, 2011, and we serve as operator in 148 gross wells. |
| • | 2011 net production—0.6 Bcfe. |
| • | Acreage—We held 52,075 net undeveloped acres as of December 31, 2011. |
| • | Capital expenditures—Our capital expenditures for 2011 were $177.8 million for participation in the drilling of eight gross wells, which included $145.6 million for the acquisition of oil and gas properties and related assets. |
| • | As of December 31, 2011, we were in the process of drilling one gross (1.0 net) well and waiting to complete two gross (2.0 net) wells within the DJ Basin. |
The main oil and gas formations being targeted in the DJ Basin are the tight Muddy “J” Sandstone, Codell Sandstone and the Niobrara. Recent development in the DJ Basin has focused on the Niobrara utilizing horizontal well technology.
On August 16, 2011, we closed on an acquisition of oil and gas properties in the DJ Basin. This acquisition included approximately 26,416 gross (17,074 net) development and exploratory acreage in the Niobrara oil play in the Borie, Chalk Bluffs and Briggsdale prospect areas of Laramie County, Wyoming and Weld County, Colorado. With the acquisition, we also obtained operatorship of 126 producing wells and an interest in another 60 non-operated wells. We acquired another 21,903 gross acres (14,800 net) in the Niobrara oil and gas play in the Greater Wattenberg Area of Weld and Adams Counties in Colorado. Activity to date has focused on minor vertical drilling, re-completing existing producing wells, and extending horizontal Niobrara drilling away from existing production. Our gas production is gathered and processed by third parties, and our oil production is sold at the lease location and then trucked to markets.
We are currently running a one rig drilling program to drill and complete horizontal wells targeting oil in the Niobrara formation in the DJ Basin, which may be adjusted throughout the year as business conditions and operating results warrant.
Powder River Basin
The Powder River Basin is primarily located in northeastern Wyoming. Our development operations are conducted in our coalbed methane (“CBM”) fields along with a Powder River Deep Program targeting oil.
- 9 -
Coalbed Methane
Key Statistics
| • | Estimated proved reserves as of December 31, 2011—55.7 Bcfe. |
| • | Producing wells—We had interests in 742 gross (472 net) producing wells as of December 31, 2011, and we serve as operator in 580 gross wells. |
| • | 2011 net production—13.2 Bcfe. |
| • | Acreage—We held 45,652 net undeveloped acres as of December 31, 2011. |
| • | Capital expenditures—In 2011, our capital expenditures for the Powder River Basin-CBM were $4.2 million for completions and recompletions. |
| • | As of December 31, 2011, we were not in the process of drilling or completing any CBM wells within the Powder River Basin. |
Coalbed methane wells are drilled to 1,200 feet on average, targeting the Big George Coals, typically producing water in a process called dewatering. This process lowers reservoir pressure, allowing the gas to desorb from the coal and flow to the well bore. As the reservoir pressure declines, the wells begin producing methane gas at an increasing rate. As the wells mature, the production peaks, stabilizes and then begins declining. The average life of a coalbed well can range from five to 11 years depending on the coal seam. Our natural gas production in this basin is gathered through gathering and pipeline systems owned by Fort Union Gas Gathering, LLC and Thunder Creek Gas Services. In 2012, we plan to drill and complete five gross operated wells.
Powder River Deep
Our Powder River Deep Program consists of vertical and horizontal wells targeting various Cretaceaous oil bearing horizons including the Parkman, Sussex, Shannon, Niobrara, Turner and Frontier formations. We also have an interest in an active Parkman waterflood. At December 31, 2011, we had an interest in 51 gross (10.7 net) producing wells with estimated net proved reserves of 3.0 Bcfe, and we serve as operator in seven gross wells. We have increased our net acreage position to 27,201 net acres throughout 2011, along with 11,141 net acres that are subject to drill-to-earn agreements. In 2012, we plan to drill and complete eight gross operated wells and expect to participate in 18 gross (2.3 net) non-operated wells.
Wind River Basin
The Wind River Basin is located in central Wyoming. Our activities are concentrated primarily in the eastern Wind River Basin, along the greater Waltman Arch, where we generally serve as operator. In addition, we have a number of exploration projects, some of which are in areas of the Wind River Basin where we have no existing development operations. We are seeking industry partners to enter into joint exploration agreements that may involve the sale of a portion of our interests and joint drilling obligations for certain exploration projects in the Wind River Basin.
Key Statistics
| • | Estimated proved reserves as of December 31, 2011—35.2 Bcfe. |
| • | Producing wells—We had interests in 152 gross (144.3 net) producing wells as of December 31, 2011, and we serve as operator in 148 gross wells. |
| • | 2011 net production—5.3 Bcfe. |
| • | Acreage—We held 180,273 net undeveloped acres as of December 31, 2011. |
- 10 -
| • | Capital expenditures—In 2011, our capital expenditures for the Wind River Basin were $4.4 million for recompletions, exploration drilling and facility upgrades. |
| • | As of December 31, 2011, we were not in the process of drilling or completing wells within the Wind River Basin. |
Our natural gas production in this basin is gathered through our own gathering systems and delivered to markets through pipelines owned by Kinder Morgan Interstate (“KMI”) and Colorado Interstate Gas (“CIG”).
Paradox Basin
The Paradox Basin is located in southwestern Colorado and southeastern Utah.
Key Statistics
| • | Producing wells—We had interests in six gross (5.9 net) producing, or capable of producing, wells as of December 31, 2011, and we serve as operator in six gross wells. |
| • | Acreage—We held 365,988 net undeveloped acres as of December 31, 2011. |
| • | Capital expenditures—Our capital expenditures for 2011 for the Paradox Basin were $2.5 million for extending mineral leases. |
| • | As of December 31, 2011, we were not in the process of drilling or completing wells within the Paradox Basin. |
Our Paradox Basin prospect targets oil, natural gas and associated natural gas liquids from the Gothic and Hovenweep shales at average vertical depths of 5,800 and 5,700 feet, respectively. Through December 31, 2011, we had drilled four exploratory vertical wells to gather rock property data and nine horizontal well bores in the Gothic shale. Six of the horizontal wells were on production at various times in 2011, of which two have continually produced from inception and thusfar exhibit flat decline curves. We drilled one vertical science well in the Hovenweep shale, which was immediately converted into a horizontal wellbore in 2008. As the first horizontal well ever to be drilled and completed in the Hovenweep shale, sustainable high BTU gas was established during production testing in early 2009, but was recorded as a dry hole in 2010. In 2011, with a better understanding of our production coupled with new data from other portions of the basin, we believe that the liquid-rich natural gas and oil are available for drilling and production. We serve as operator in this area where we have a working interest close to 100%. In 2012, we plan to drill and complete two wells in the Gothic shale.
Oil and Gas Data
Proved Reserves
The following table presents our estimated net proved oil and natural gas reserves and the present value of our estimated proved reserves at each of December 31, 2011, 2010 and 2009 based on reserve reports prepared by us and audited in their entirety by outside independent third party petroleum engineers. While we are not required by the SEC or accounting regulations or pronouncements to have our estimates independently audited, we are required by our revolving credit agreement with our lenders to have an independent third party engineering firm perform an annual audit of our estimated reserves. All of our proved reserves included in our reserve reports are located in North America. Netherland, Sewell & Associates, Inc., or “NSAI”, audited all of our reserves estimates at December 31, 2011, 2010 and 2009. NSAI is retained by and reports to the Reserves Committee of our Board of Directors, which is comprised of independent directors. When compared on a well-by-well or lease-by-lease basis, some of our internal estimates of net proved reserves are greater and some are less than the estimates of outside independent third party petroleum engineers. However, in the aggregate, the independent third party petroleum engineer estimates of total net proved reserves are within 10% of our internal
- 11 -
estimates. In addition to a third party audit, our reserves are reviewed by our Reserves Committee. The Reserves Committee reviews the final reserves estimates in conjunction with NSAI’s audit letter and meets with the key representative of NSAI to discuss NSAI’s review process and findings. Our estimates of net proved reserves have not been filed with or included in reports to any federal authority or agency, other than the SEC, since January 1, 2011.
| As of December 31, | ||||||||||||
Proved Reserves: | 2011 | 2010 | 2009 | |||||||||
Proved Developed Reserves: | ||||||||||||
Natural gas (Bcf) | 632.5 | 499.4 | 455.3 | |||||||||
Oil (MMBbls) | 10.4 | 6.0 | 4.1 | |||||||||
Total proved developed reserves (Bcfe)(1) | 694.9 | 535.2 | 480.2 | |||||||||
Proved Undeveloped Reserves: | ||||||||||||
Natural gas (Bcf) | 548.6 | 540.9 | 462.7 | |||||||||
Oil (MMBbls) | 20.2 | 7.0 | 3.6 | |||||||||
|
|
|
|
|
| |||||||
Total proved undeveloped reserves (Bcfe)(1) | 669.7 | 583.2 | 484.6 | |||||||||
|
|
|
|
|
| |||||||
Total Proved Reserves (Bcfe)(1) | 1,364.7 | 1,118.3 | 964.8 | |||||||||
|
|
|
|
|
| |||||||
| (1) | Total does not add because of rounding. |
The data in the above table represents estimates only. Oil and natural gas reserve engineering is an estimation of accumulations of oil and natural gas that cannot be measured exactly. The accuracy of any reserves estimate is a function of the quality of available data and engineering and geological interpretation and judgment. Accordingly, reserves estimates may vary from the quantities of oil and natural gas that are ultimately recovered. See “Item 1A. Risk Factors.”
Proved developed oil and gas reserves are reserves that can be expected to be recovered through existing wells with existing equipment and operating methods. Proved undeveloped oil and gas reserves are reserves that are expected to be recovered from new wells on undrilled acreage, or from existing wells where a relatively major expenditure is required for recompletion. Proved undeveloped reserves on undrilled acreage are limited to those locations on development spacing areas that are offsetting economic producers that are reasonably certain of economic production when drilled. Proved undeveloped reserves for other undrilled development spacing areas can be claimed only where it can be demonstrated with reasonable certainty that there is continuity of economic production from the existing productive formation. Proved undeveloped reserves are included when they are scheduled to be drilled within five years.
At December 31, 2011, our proved undeveloped reserves were 669.7 Bcfe. At December 31, 2010, our proved undeveloped reserves were 583.2 Bcfe. During 2011, 132.4 Bcfe, or 22.7% of our December 31, 2010 proved undeveloped reserves (182 wells), were converted into proved developed reserves and required $209.9 million of drilling and completion capital and $20 million of facilities capital. These wells produced 24.0 Bcfe in 2011. An additional 4.8 Bcfe were removed from the proved undeveloped reserves category because they were either traded, sold or removed because they were not included in our near term development plans. Positive engineering and pricing revisions added 58.1 Bcfe to the proved undeveloped reserves category at December 31, 2011. The positive engineering revision in the proved undeveloped reserve category in the Gibson Gulch area of the Piceance Basin included 11.0 Bcfe resulting from the addition of proved undeveloped reserves in locations greater than one spacing unit from economic producers. Production from the Gibson Gulch area is from a very large, basin-centered gas accumulation containing reservoirs with no apparent downdip water. The reasonable certainty for economic reserves from these locations is supported by geologic, engineering and economic data in addition to well productivity across the Gibson Gulch area and across the Piceance Basin. The positive engineering revision in the Blacktail Ridge area of the Uinta Basin included 47.9 Bcfe resulting from increased operational focus and engineering and geological study. Small pricing revisions occurred in many of our
- 12 -
producing areas due to the pricing change from $3.95 per MMBtu CIG for the year ended December 31, 2010 to $3.93 per MMBtu CIG for the year ended December 31, 2011 and from $75.96 per Bbl WTI for the year ended December 31, 2010 to $92.71 per Bbl WTI for the year ended December 31, 2011. The proved undeveloped reserves from December 31, 2010 that remain in the proved undeveloped reserves category at December 31, 2011 are 422.0 Bcfe. The December 31, 2011 proved undeveloped reserves of 669.7 Bcfe is calculated by adding (i) the December 31, 2010 proved undeveloped reserves of 583.2 Bcfe , plus (ii) the proved undeveloped reserves generated in 2011 from the 2010 and 2011 drilling programs (118.0 Bcfe) and acquisitions (71.5 Bcfe), plus (iii) the sum of the engineering and pricing revisions (58.1 Bcfe), minus (a) the proved undeveloped reserves that were either traded, sold, exceeded the five year limit or not included in the near term development plan (4.8 Bcfe), minus (b) the proved undeveloped reserves converted to proved developed reserves (156.3 Bcfe, which includes their production of 24.0 Bcfe). The 118.0 Bcfe of new proved undeveloped reserves generated in 2011 were the result of estimating reserves with reasonable certainty of economic production when drilled on undrilled acreage in development spacing areas that were directly offsetting new economic producers.
The majority of production from the Gibson Gulch area of the Piceance Basin is from the discontinuous fluvial sands of the Williams Fork formation. The resource is consistent across the Gibson Gulch area and results in low variability of estimated ultimate recoveries. The 2011 results of proved undeveloped drilled wells in offsets that are two and three spacing units from economic producing wells were positive and supported a fourth offset in the proved undeveloped reserve category internal to the producing area of the field as of December 31, 2011 (four wells, 2.4 Bcfe). New technologies were not used to support these reserves. The opportunity to use this data to prove more than one direct offset from economic producers is the result of a change in definition of undeveloped oil and gas reserves included in the SEC’s “Modernization of Oil and Gas Reporting” and applied in our December 31, 2009, 2010 and 2011 reserve reports. The proved undeveloped reserves added in the Gibson Gulch area at December 31, 2011 were 19.5 Bcfe, of which 11.0 Bcfe were attributed to the addition of proved undeveloped reserves in locations greater than one spacing unit from economic producers. Acquisitions added 2.3 Bcfe of the 19.5 Bcfe proved undeveloped reserve addition in Gibson Gulch.
In 2010, the results of the proved undeveloped drilled wells in Gibson Gulch in offsets that are two spacing units from economic producing wells were positive and supported a third offset in the proved undeveloped reserve category as of December 31, 2010 (39 wells, 24.7 Bcfe). New technologies were not used to support these reserves. The proved undeveloped reserves added in the Gibson Gulch area at December 31, 2010 were 124.7 Bcfe, of which 24.7 Bcfe were attributed to the addition of an offset that is three spacing units from economic producers.
At December 31, 2011, we also revised our proved reserves upward by 37.9 Bcfe, excluding pricing revisions, due primarily to the positive results of increased operational focus and engineering and geological study of our Blacktail Ridge property. Blacktail Ridge became a focus for us in 2011 following positive results from our 2010 drilling program. An additional positive revision of 5.5 Bcfe occurred due to the positive change in oil pricing described above.
We use our internal reserves estimates rather than the estimates from independent third party engineering firms because we believe that our reserve and operations engineers are more knowledgeable about the wells due to our continual analysis throughout the year as compared to the relatively short term analysis performed by the independent third party engineers. We use our internal reserves estimates on all properties regardless of the positive or negative variance to the independent third party engineers. If a variance greater than 10% occurs at the field level, it may suggest that a difference in methodology or evaluation techniques exists between us and the independent third party engineers. These differences are investigated by us and the independent third party engineers and discussed with the independent third party engineers to confirm that we used the proper methodologies and techniques in estimating reserves for these fields. These variances also are reviewed with our Reserves Committee of our Board of Directors. These differences are not resolved to a specified tolerance at the field or property level. In the aggregate, the independent third party petroleum engineer estimates of total net proved reserves are within 10% of our internal estimates.
- 13 -
The internal review process of our wells and the related reserves estimates, and the related internal controls we utilize, includes but is not limited to the following:
| • | A comparison is made and documented of actual and historical data from our production system to the data in the reserve database. This ensures the accuracy of the production data, which supplies the basis for forecasting. |
| • | A comparison is made and documented of land and lease record to interest data in the reserve database. This ensures that the costs and revenues will be properly determined in the reserves estimation. |
| • | A comparison is made of the historical costs (capital and expenses) to the capital and lease operating costs in the reserve database. Documentation lists reasons for deviation from direct use of historical data. This ensures that all costs are properly included in the reserve database. |
| • | A comparison is made of input data to data in the reserve database of all property acquisitions, disposals, retirements or transfers to verify that all are accounted for accurately. |
| • | Natural gas pricing for the first flow day of every month is collected from Platts Gas Daily and Plains All American Pipeline, L.P. At the end of the year, the 12-month average prices are determined. A similar collection process occurs with pricing deductions supplied by our internal marketing group, and a 12-month average is calculated at year end. A comparison is made of our determination of SEC pricing requirements to that supplied by the third party independent engineering firm. This provides verification of the pricing calculations. |
| • | A final check is made of all economic data inputs in the reserve database by comparing them to documentation provided by our internal marketing, land, accounting, production and operations groups. This provides a second check to ensure accuracy of input data in the reserve database. |
| • | Accurate classification of reserves is verified by comparing independent classification analyses by our internal reservoir engineers and the third party independent engineers. Discrepancies are discussed and differences are jointly resolved. |
| • | Internal reserves estimates are reviewed by well and by area by the Senior Vice President—Planning and Reserves. A variance by well to the previous year-end reserve report is used as a tool in this process. This review is independent of the reserves estimation process. |
| • | Reserves variances are discussed among the internal reservoir engineers and the Senior Vice President—Planning and Reserves. Our internal reserves estimates are reviewed by senior management and, beginning with the year-end 2011 reserves, the Reserves Committee of the Board prior to publication. |
Within our Company, the technical person primarily responsible for overseeing the preparation of the reserves estimates is Lynn E. Boone. Ms. Boone is our Senior Vice President—Planning and Reserves and has been responsible for our reserves estimates since 2003. Ms. Boone attended the Colorado School of Mines and graduated in 1982 with a Bachelor of Science degree in Chemical and Petroleum Refining Engineering. She attended the University of Oklahoma and graduated in 1985 with a Master of Science degree in Petroleum Engineering. Ms. Boone has been involved in evaluations and the estimation of reserves and resources for 25 years.
The reserves estimates shown herein have been independently audited by NSAI, a worldwide leader of petroleum property analysis for industry and financial organizations and government agencies. NSAI was founded in 1961 and performs consulting petroleum engineering services under Texas Board of Professional Engineers Registration No. F-002699. Within NSAI, the technical person primarily responsible for auditing the estimates set forth in the NSAI audit letter incorporated herein is Dan Paul Smith. Mr. Smith has been practicing consulting petroleum engineering at NSAI since 1980. He is a Registered Professional Engineer in the State of Texas (License No. 49093) and has over 30 years of practical experience in petroleum engineering and in the estimation and evaluation of reserves. He graduated from Mississippi State University in 1973 with a Bachelor of Science Degree in Petroleum Engineering.
- 14 -
NSAI performed a well-by-well audit of all of our properties and of our estimates of proved reserves and then provided us with its audit report concerning our estimates. The audit completed by NSAI, at our request, is a collective application of a series of procedures performed by NSAI. These audit procedures may be the same or different from audit procedures performed by other independent third party engineering firms for other oil and gas companies. NSAI’s audit report does not state the degree of its concurrence with the accuracy of our estimate for the proved reserves attributable to our interest in any specific basin, property or well.
The NSAI audit process of our wells and reserves estimates is intended to determine the percentage difference, in the aggregate, of our internal net proved reserves estimate and future net revenue (discounted 10%) and the reserves estimate and net revenue as determined by NSAI. The audit process includes the following:
| • | The NSAI engineer performs an independent decline curve analysis on proved producing wells based on production and pressure data. This data is provided to NSAI by us as well as other companies operating in the Powder River Basin. |
| • | The NSAI engineer may verify the production data with the public data. |
| • | The NSAI engineer uses his or her individual interpretation of the information and knowledge of the reservoir and area to make an independent analysis of proved producing reserves. |
| • | The NSAI technical staff will prepare independent maps and volumetric analyses on our properties and offsetting properties. They review our geologic maps, log data, core data, pertinent pressure data, test information and pertinent technical analyses, as well as data from offsetting producers. |
| • | For the reserves estimates of proved non-producing and proved undeveloped locations, the NSAI engineer will estimate the potential for depletion by generating a potentiometric surface map, which relates directly to remaining gas-in-place, and analyzing this information with the maps generated earlier in the process. |
| • | The NSAI engineer will estimate the hydrocarbon recovery of the remaining gas-in-place based upon his/her knowledge and experience. |
| • | The NSAI engineer does not verify our working and net revenue interests or product price deductions. |
| • | The NSAI engineer does not verify our capital costs although he/she may ask for confirming information. |
| • | The NSAI engineer reviews 12 months of operating cost, revenue and pricing information that we provide. |
| • | The NSAI engineer confirms the oil and gas prices used for the SEC reserves estimate. |
| • | NSAI confirms that its reserves estimate is within a 10% variance of our internal net reserves estimate and estimated future net revenue (discounted 10%), in the aggregate, before an audit letter is issued. |
| • | The audit by NSAI is not performed such that differences in reserves or revenue on a well level are resolved to any specific tolerance. |
The reserves audit letter provided by NSAI states that “in our opinion the estimates of Bill Barrett’s proved reserves and future revenue shown herein are, in the aggregate, reasonable” following an independent estimation of reserve quantities with economic parameters and other factual data provided by us and accepted by NSAI. The audit letter also includes a statement of dates pertaining to the NSAI work performed, the methodology used, the assumptions made and a discussion of uncertainties that they believe are inherent in reserves estimates.
Future prices received for production and costs may vary, perhaps significantly, from the prices and costs assumed for purposes of these estimates. The Standardized Measure shown should not be construed as the current market value of the reserves. The 10% discount factor used to calculate present value, which is required by Financial Accounting Standards Board pronouncements (“FASB”), is not necessarily the most appropriate
- 15 -
discount rate. The present value, no matter what discount rate is used, is materially affected by assumptions as to timing of future production, which may prove to be inaccurate.
From time to time, we engage NSAI to review and/or evaluate the reserves of properties that we are considering purchasing and to provide technical consulting on well testing. NSAI and its respective employees have no interest in those properties, and the compensation for these engagements is not contingent on NSAI’s estimates of reserves and future cash inflows for the subject properties. During 2011 and 2010, we paid NSAI approximately $318,000 and $230,000, respectively, for auditing our reserves estimates.
On December 31, 2008, the SEC published final rules and interpretations updating its oil and gas reserves reporting requirements called “Modernization of Oil and Gas Reporting.” Many of the revisions were updates to definitions in the existing oil and gas rules to make them consistent with the Petroleum Resource Management system, which is a widely accepted set of evaluation guidelines that are designed to support assessment processes throughout the resource asset lifecycle. These guidelines were prepared by the Society of Petroleum Engineers, or SPE, Oil and Gas Reserves Committee with cooperation from many industry organizations. One of the key changes to the previous SEC rules related to using a 12-month average commodity price to calculate the value of proved reserves versus the former method of using year-end prices. Other key revisions included the ability to include nontraditional resources in reserves, the use of new technology for determining reserves, the opportunity to establish proved undeveloped reserves without the requirement of an adjacent producing well and permitting disclosure of probable and possible reserves. Companies were required to comply with the amended disclosure requirements for registration statements filed after January 1, 2010, and for annual reports for fiscal years ending on or after December 31, 2009. All of our reserves estimates were prepared in accordance with these rules.
- 16 -
Production and Price History
The following table sets forth information regarding net production of oil and natural gas and certain price and cost information for each of the periods indicated:
| Year Ended December 31, | ||||||||||||
| 2011 | 2010 | 2009 | ||||||||||
Production Data: | ||||||||||||
Natural gas (MMcf) | 97,856 | 89,964 | 85,485 | |||||||||
Oil (MBbls) | 1,490 | 1,089 | 710 | |||||||||
Combined volumes (MMcfe) | 106,796 | 96,498 | 89,745 | |||||||||
Daily combined volumes (MMcfe/d) | 292.6 | 264.4 | 245.9 | |||||||||
Piceance—Gibson Gulch Production Data(1): | ||||||||||||
Natural gas (MMcf) | 45,606 | 44,736 | 33,904 | |||||||||
Oil (MBbls) | 540 | 563 | 425 | |||||||||
Combined volumes (MMcfe) | 48,846 | 48,114 | 36,454 | |||||||||
Daily combined volumes (MMcfe/d) | 133.8 | 131.8 | 99.9 | |||||||||
Uinta—West Tavaputs Production Data(1): | ||||||||||||
Natural gas (MMcf) | 31,719 | 24,021 | 29,862 | |||||||||
Oil (MBbls) | 54 | 34 | 53 | |||||||||
Combined volumes (MMcfe) | 32,043 | 24,225 | 30,180 | |||||||||
Daily combined volumes (MMcfe/d) | 87.8 | 66.4 | 82.7 | |||||||||
Average Prices(2): | ||||||||||||
Natural gas (per Mcf) | $ | 6.46 | $ | 6.74 | $ | 6.96 | ||||||
Oil (per Bbl) | $ | 80.63 | $ | 69.91 | $ | 59.03 | ||||||
Combined (per Mcfe) | $ | 7.05 | $ | 7.07 | $ | 7.10 | ||||||
Average Costs ($ per Mcfe): | ||||||||||||
Lease operating expense | $ | 0.53 | $ | 0.54 | $ | 0.52 | ||||||
Gathering, transportation and processing expense | 0.87 | 0.72 | 0.63 | |||||||||
|
|
|
|
|
| |||||||
Total Production costs excluding production taxes | $ | 1.40 | $ | 1.26 | $ | 1.15 | ||||||
Production tax expense | 0.35 | 0.34 | 0.15 | |||||||||
Depreciation, depletion and amortization(3) | 2.70 | 2.70 | 2.83 | |||||||||
General and administrative(4) | 0.45 | 0.42 | 0.42 | |||||||||
| (1) | The Gibson Gulch area in the Piceance Basin and West Tavaputs area in the Uinta Basin were our only fields that contained 15% or more of our total proved reserves as of December 31, 2011. |
| (2) | Includes the effects of hedging transactions, which resulted in increased average natural gas prices by $0.75, $1.48 and $3.10 per Mcf in 2011, 2010 and 2009, respectively, reduced average oil prices by $1.34 per Bbl in 2011 and increased average oil prices by $1.98 and $9.47 per Bbl in 2010 and 2009, respectively. |
| (3) | The depreciation, depletion and amortization (“DD&A”), per Mcfe for the year ended December 31, 2009 excludes the December 2009 production associated with our properties held for sale in the Uinta Basin, as these properties were excluded from amortization during the appropriate periods in which these properties were classified as held for sale. |
| (4) | General and administrative expense presented herein excludes non-cash stock-based compensation of $19.0 million, $16.9 million and $16.5 million for the years ended December 31, 2011, 2010 and 2009, respectively. If included, these non-cash stock based compensation expenses would have increased general and administrative expense by $0.18 per Mcfe for each period presented. General and administrative expense excluding non-cash stock-based compensation is a non-GAAP measure. Non-cash stock-based compensation is combined with general and administrative expense for a total of $66.8 million, $57.8 million and $54.4 million for the years ended December 31, 2011, 2010 and 2009, respectively, in the Consolidated Statements of Operations. Management believes the separate presentation of the non-cash component of general and administrative expense is useful because the cash portion provides a better |
- 17 -
| understanding of our required cash for general and administrative expense. We also believe that this disclosure allows for a more accurate comparison to our peers, which may have higher or lower stock-based compensation expense. |
Productive Wells
The following table sets forth information at December 31, 2011 relating to the productive wells in which we owned a working interest as of that date. Productive wells consist of producing wells and wells capable of production, including natural gas wells awaiting pipeline connections to commence deliveries and oil wells awaiting connection to production facilities. Gross wells are the total number of producing wells in which we have an interest, and net wells are the sum of our fractional working interests owned in gross wells.
| Gas | Oil | |||||||||||||||
| Gross Wells | Net Wells | Gross Wells | Net Wells | |||||||||||||
Basin | ||||||||||||||||
Piceance | 826.0 | 779.8 | 0 | 0 | ||||||||||||
Uinta—West Tavaputs | 271.0 | 258.0 | 0 | 0 | ||||||||||||
Uinta Oil | 7.0 | 1.6 | 114.0 | 69.6 | ||||||||||||
DJ | 193.0 | 137.9 | 23.0 | 18.7 | ||||||||||||
Powder River—CBM | 742.0 | 472.0 | 0 | 0 | ||||||||||||
Powder River Deep | 2.0 | 0.7 | 49.0 | 10.0 | ||||||||||||
Wind River | 152.0 | 144.3 | 0 | 0 | ||||||||||||
Other | 9.0 | 6.9 | 10 | 4.9 | ||||||||||||
|
|
|
|
|
|
|
| |||||||||
Total | 2,202.0 | 1,801.2 | 196.0 | 103.2 | ||||||||||||
|
|
|
|
|
|
|
| |||||||||
Developed and Undeveloped Acreage
The following table sets forth information as of December 31, 2011 relating to our leasehold acreage.
| Developed Acreage(1) | Undeveloped Acreage(2) | |||||||||||||||
| Gross | Net | Gross | Net | |||||||||||||
Basin/Area | ||||||||||||||||
Piceance | 10,495 | 8,845 | 47,582 | 42,633 | (3) | |||||||||||
Uinta—West Tavaputs | 16,022 | 14,552 | 26,857 | 22,618 | (4) | |||||||||||
Uinta Oil | 34,529 | 23,503 | 123,840 | 53,240 | (5) | |||||||||||
DJ | 24,671 | 17,142 | 107,287 | 52,075 | ||||||||||||
Powder River—CBM | 80,352 | 50,493 | 78,561 | 45,652 | ||||||||||||
Powder River Deep | 12,065 | 4,200 | 59,428 | 23,001 | (6) | |||||||||||
Wind River | 7,214 | 5,773 | 212,783 | 180,273 | ||||||||||||
Paradox | 11,547 | 11,062 | 464,389 | 365,988 | ||||||||||||
Other | 2,162 | 1,481 | 692,791 | 465,978 | (7) | |||||||||||
|
|
|
|
|
|
|
| |||||||||
Total | 199,057 | 137,052 | 1,813,518 | 1,251,458 | (8) | |||||||||||
|
|
|
|
|
|
|
| |||||||||
| (1) | Developed acres are acres spaced or assigned to productive wells. |
| (2) | Undeveloped acres are acres on which wells have not been drilled or completed to a point that would permit the production of commercial quantities of oil or natural gas, regardless of whether such acreage contains proved reserves. |
| (3) | Includes 40,312 gross and 36,281 net acreage associated with the Cottonwood Gulch property. |
| (4) | Does not include an additional 16,119 net undeveloped acres that are subject to drill-to-earn agreements. |
- 18 -
| (5) | Does not include an additional 60,888 net undeveloped acres that are subject to drill-to-earn agreements. |
| (6) | Does not include an additional 11,141 net undeveloped acres that are subject to drill-to-earn agreements. |
| (7) | Does not include an additional 35,093 net undeveloped acres that are subject to drill-to-earn agreements. |
| (8) | Does not include an additional 123,241 net undeveloped acres that are subject to drill-to-earn agreements. |
Many of the leases comprising the undeveloped acreage set forth in the table above will expire at the end of their respective primary terms unless production from the leasehold acreage has been established prior to such date, in which event the lease will remain in effect until the cessation of production. We generally have been able to obtain extensions of the primary terms of our federal leases for the period in which we have been unable to obtain drilling permits due to environmental stipulations, pending environmental analysis or related legal challenge. The following table sets forth, as of December 31, 2011, the expiration periods of the gross and net acres that are subject to leases summarized in the above table of undeveloped acreage.
| Undeveloped Acres Expiring | ||||||||
Twelve Months Ending: | Gross | Net | ||||||
December 31, 2012 | 232,149 | 144,166 | (1) | |||||
December 31, 2013 | 232,609 | 154,413 | (2) | |||||
December 31, 2014 | 211,402 | 111,867 | ||||||
December 31, 2015 | 148,802 | 100,095 | ||||||
December 31, 2016 and later(3) | 988,556 | 740,917 | ||||||
|
|
|
| |||||
Total | 1,813,518 | 1,251,458 | ||||||
|
|
|
| |||||
| (1) | Paradox Basin represents 91,440 net acres expiring during the twelve months ending December 31, 2012. We anticipate exercising the option to renew and extend on approximately 79% of the Paradox Basin expiring acreage. |
| (2) | Paradox Basin represents 35,686 net acres expiring during the twelve months ending December 31, 2013. We anticipate exercising the option to renew and extend on approximately 70% of the Paradox Basin expiring acreage. Deseret Basin represents 63,000 net acres expiring during the twelve months ending December 31, 2013. |
| (3) | Includes 346,997 gross and 224,484 net undeveloped acres held by production from other leasehold acreage or held by federal units. |
- 19 -
Drilling Results
The following table sets forth information with respect to wells completed during the periods indicated. The information should not be considered indicative of future performance, nor should it be assumed that there is necessarily any correlation between the number of productive wells drilled and quantities of reserves found or economic value. Productive wells are wells that are found to be capable of producing hydrocarbons in sufficient quantities such that proceeds from the sale of the production exceed production expenses and taxes.
| Year Ended December 31, 2011 | Year Ended December 31, 2010 | Year Ended December 31, 2009 | ||||||||||||||||||||||
| Gross | Net | Gross | Net | Gross | Net | |||||||||||||||||||
Development | ||||||||||||||||||||||||
Productive | 279.0 | 191.4 | 241.0 | 221.1 | 265.0 | 236.1 | ||||||||||||||||||
Dry | 0.0 | 0.0 | 0.0 | 0.0 | 0.0 | 0.0 | ||||||||||||||||||
Exploratory | ||||||||||||||||||||||||
Productive | 6.0 | 3.3 | 4.0 | 3.1 | 6.0 | 3.0 | ||||||||||||||||||
Dry(1) | 3.0 | 1.4 | 8.0 | 6.1 | 14.0 | 9.5 | ||||||||||||||||||
|
|
|
|
|
|
|
|
|
|
|
| |||||||||||||
Total | ||||||||||||||||||||||||
Productive | 285 | 194.7 | 245.0 | 224.2 | 271.0 | 239.1 | ||||||||||||||||||
Dry | 3.0 | 1.4 | 8.0 | 6.1 | 14.0 | 9.5 | ||||||||||||||||||
| (1) | The exploratory dry hole category for the year ended December 31, 2009 excludes two scientific wells that were drilled for data gathering purposes that are included in exploration expense in the Consolidated Statement of Operations. |
Operations
General
In general, we serve as operator of wells in which we have a greater than 50% working interest. In addition, we seek to be operator of wells in which we have lesser interests. As operator, we obtain regulatory authorizations, design and manage the development of a well and supervise operation and maintenance activities on a day-to-day basis. We do not own drilling rigs or the majority of the other oil field service equipment used for drilling or maintaining wells on the properties we operate. We do construct, operate and maintain a majority of the gas gathering and compression facilities associated with our gas fields. Independent contractors engaged by us provide the majority of the equipment and personnel associated with these activities. We employ drilling, production and reservoir engineers and geologists and other specialists who work to improve production rates, increase reserves and lower the cost of operating our oil and natural gas properties.
Marketing and Customers
We market the majority of the oil and natural gas production from properties we operate for both our account and the account of the other working interest owners in these properties. We sell our production to a variety of purchasers under contracts with daily, monthly, seasonal, annual or multi-year terms, all at market prices. Purchasers include pipelines, processors, marketing companies, local distribution companies, and end users. We normally sell production to a relatively small number of customers, as is customary in the exploration, development and production business. However, based on the current demand for oil and natural gas and the availability of other purchasers, we believe that the loss of any one or all of our major purchasers would not have a material adverse effect on our financial condition and results of operations.
- 20 -
During 2011, we had three customers account for 45% of our oil and gas production revenues. During 2010, we had two customers account for 25% of our oil and gas production revenues. During 2009, we had two customers account for 25% of our oil and gas production revenues. Management believes that the loss of any individual purchaser would not have a long-term material adverse impact on our financial position or results of operations.
We enter into hedging transactions with unaffiliated third parties for portions of our production revenues to achieve more predictable cash flows and to reduce our exposure to fluctuations in commodities prices. For a more detailed discussion, see “Item 7. Management’s Discussion and Analysis of Financial Condition and Results of Operations—Overview” and “Item 7A. Quantitative and Qualitative Disclosures About Market Risk.”
Our natural gas is transported through our own and third party gathering systems and pipelines, and we incur processing, gathering and transportation expenses to move our natural gas from the wellhead to a purchaser-specified delivery point. These expenses vary based on the volume and distance shipped, and the fee charged by the third-party gatherer, processor or transporter. Capacity on these gathering systems and pipelines is occasionally limited and at times unavailable because of repairs or improvements, or as a result of priority transportation agreements with other gas shippers. While our ability to market our natural gas has been only infrequently limited or delayed, if transportation space is restricted or is unavailable, our cash flow from the affected properties could be adversely affected. In certain instances, we enter into firm transportation agreements to provide for pipeline capacity to flow and sell a portion of our gas volumes. In order to meet pipeline specifications, we are required, in some cases, to process our gas before we can transport it. We typically contract with third parties in the Piceance, Wind River, Uinta, Powder and Paradox Basins to process our natural gas. We also may enter into firm sales agreements to ensure that we are selling to a purchaser that has contracted for pipeline capacity. These agreements are subject to the limitations discussed above in this paragraph.
Our oil production is collected in tanks and sold to third parties that collect the oil in trucks and transport it to refiners. We sell our oil production to a variety of purchasers under monthly, annual or multi-year terms. Our oil contracts are priced either off of New York Mercantile Exchange (“NYMEX”) or area oil posting with location or transportation differentials. We contract only for volumes that have been produced.
- 21 -
The following table sets forth information about material long-term firm transportation contracts for pipeline capacity and firm processing contracts, both of which typically require a demand charge and firm sales contracts. We source the gas to meet these commitments from our producing properties. At the time we entered into these commitments, we estimated that our production, and the production of joint interest owners that we market, would be sufficient to meet these commitments. Under firm gathering, transportation and processing contracts, we are obligated to deliver minimum daily gas volumes, or pay the respective gathering, transportation or processing fees for any deficiencies in deliveries. With the firm sales contracts, we are obligated to sell minimum daily gas volumes. If the volumes are not met, we will bear our proportionate share of costs related to the volume shortfall.
Type of Arrangement | Pipeline System / Location | Deliverable Market | Gross Deliveries (MMBtu/d) | Term | ||||||||
Firm Sales | White River Hub | Rocky Mountains | 15,000 | 04/10 – 03/12 | ||||||||
Firm Sales | White River Hub | Rocky Mountains | 15,000 | 02/10 – 03/12 | ||||||||
Firm Sales | Rockies Express | Rocky Mountains | 15,000 | 01/10 – 03/12 | ||||||||
Firm Sales | White River Hub | Rocky Mountains | 15,000 | 11/11 – 03/12 | ||||||||
Firm Sales | Rockies Express | Northeast | 10,000 | 11/11 – 03/12 | ||||||||
Firm Sales | Rockies Express | Northeast | 15,000 | 11/11 – 10/12 | ||||||||
Firm Sales | Cheyenne Hub | Rocky Mountains | 15,000 | 11/11 – 03/12 | ||||||||
Firm Sales | Cheyenne Hub | Rocky Mountains | 5,000 | 11/11 – 03/12 | ||||||||
Firm Sales | Kinder Morgan | Rocky Mountains | 10,000 | 11/11 – 03/12 | ||||||||
Firm Sales | Questar Pipeline | Rocky Mountains | 5,000 | 11/11 – 03/12 | ||||||||
Firm Sales | Questar Pipeline | Rocky Mountains | 7,000 | 11/11 – 03/12 | ||||||||
Firm Sales | Questar Pipeline | Rocky Mountains | 20,000 | 11/11 – 03/12 | ||||||||
Firm Sales | Questar Pipeline | Rocky Mountains | 5,000 | 04/11 – 03/12 | ||||||||
Firm Sales | Ruby Pipeline | West Coast | 25,000 | 11/11 – 03/12 | ||||||||
Firm Sales | Cheyenne Hub | Rocky Mountains | 10,000 | 04/12 – 10/12 | ||||||||
Firm Sales | White River Hub | Rocky Mountains | 10,000 | 04/12 – 10/12 | ||||||||
Firm Sales | Questar Pipeline | Rocky Mountains | 10,000 | 04/12 – 10/12 | ||||||||
Firm Gathering | Encana | Rocky Mountains | Varies | 01/10 – 10/19 | ||||||||
Firm Transport | WIC Medicine Bow | Rocky Mountains | 5,000 | 06/08 – 03/14 | ||||||||
Firm Transport | WIC Medicine Bow | Rocky Mountains | 30,000 | 11/07 – 03/15 | ||||||||
Firm Transport | WIC Medicine Bow | Rocky Mountains | 25,000 | 07/09 – 06/19 | ||||||||
Firm Transport | WIC Medicine Bow | Rocky Mountains | Varies | 12/08 – 06/13 | ||||||||
Firm Transport | WIC Kanda | Rocky Mountains | 15,000 | 12/08 – 11/23 | ||||||||
Firm Transport | WIC Kanda(1) | West Coast | 65,000 | 11/10 – 08/21 | ||||||||
Firm Transport | Questar Pipeline | Rocky Mountains | 12,000 | 11/05 – 10/15 | ||||||||
Firm Transport | Questar Pipeline | Rocky Mountains | 25,000 | 01/07 – 12/16 | ||||||||
Firm Transport | Cheyenne Plains | Midcontinent | 9,000 | 02/05 – 04/17 | ||||||||
Firm Transport | Cheyenne Plains | Midcontinent | 5,000 | 05/17 – 04/18 | ||||||||
Firm Transport | Questar Pipeline | Rocky Mountains | 25,000 | 11/07 – 10/17 | ||||||||
Firm Transport | Rockies Express | Northeast | 25,000 | 01/08 – 11/19 | ||||||||
Firm Transport | Ruby Pipeline | West Coast | 50,000 | 08/11 – 08/21 | ||||||||
Firm Transport | Questar Gas | Rocky Mountains | 70,000 | 06/09 – 05/20 | ||||||||
Firm Processing | Questar Gas | Rocky Mountains | 70,000 | 06/09 – 05/20 | ||||||||
Firm Processing | Questar Pipeline | Rocky Mountains | 50,000 | 08/06 – 08/16 | ||||||||
| (1) | This contract was taken out in conjunction with the Ruby Pipeline contract; and therefore, has an end date of ten years from the in-service date of the Ruby Pipeline. |
- 22 -
Hedging Activities
We have an active commodity hedging program, of which the purpose is to mitigate the risks of volatile prices of natural gas, NGLs and oil. Typically, we intend to hedge approximately 50% to 70% of our oil and natural gas production on a forward 12-month basis using a combination of swaps, cashless collars and other financial derivative instruments with counterparties that we believe are creditworthy. To date 10 of our 17 lenders (or affiliates of lenders) under our credit facility are also hedging counterparties. We are not required to post collateral for these hedges other than the security for our credit facility. For additional information on our hedging activities, see “Item 7A. Quantitative and Qualitative Disclosures About Market Risk.”
Competition
The oil and natural gas industry is intensely competitive, and we compete with a large number of other companies, some of which have greater resources. Many of these companies not only explore for and produce oil and natural gas, but also carry on midstream and refining operations and market petroleum and other products on a regional, national or worldwide basis. These companies are able to pay more for productive oil and natural gas properties and exploratory prospects or define, evaluate, bid for and purchase a greater number of properties and prospects than our financial or human resources permit. In addition, these companies have a greater ability to continue exploration activities during periods of low oil and natural gas market prices. Our larger or integrated competitors are better able to absorb the burden of existing, and any changes to, federal, state, local and Native American tribal laws and regulations than we can, which could adversely affect our competitive position. Our ability to acquire additional properties and to discover reserves in the future will depend on our ability to evaluate and select suitable properties and to consummate transactions in a highly competitive environment. In addition, because we have fewer financial and human resources than many companies in our industry, we may be at a disadvantage in bidding for exploratory prospects and producing oil and natural gas properties.
Title to Properties
As is customary in the oil and gas industry, we initially conduct only a cursory review of the title to our properties on which we do not have proved reserves. Prior to the commencement of drilling operations on those properties, we conduct a thorough title examination and perform curative work for significant defects. To the extent title opinions or other investigations reflect title defects on those properties, we are typically responsible for curing any title defects at our expense. We generally will not commence drilling operations on a property until we have cured any material title defects on such property. We have obtained title opinions on substantially all of our producing properties and believe that we utilize methods consistent with practices customary in the oil and natural gas industry and that our practices are adequately designed to enable us to acquire satisfactory title to our producing properties. Prior to completing an acquisition of producing oil and natural gas leases, we perform title reviews on the most significant leases and, depending on the materiality of the properties, we may obtain a title opinion or review previously obtained title opinions. Our oil and natural gas properties are subject to customary royalty and other interests, liens for current taxes and other burdens that we believe do not materially interfere with the use of our properties or affect the carrying value of the properties.
Seasonal Nature of Business
Generally, but not always, the demand for natural gas decreases during the spring and fall months and increases during the summer and winter months. Seasonal anomalies such as mild winters or cool summers sometime lessen this fluctuation. In addition, certain natural gas users utilize natural gas storage facilities and purchase some of their anticipated winter requirements during lower demand periods. This can also lessen seasonal demand fluctuations. Seasonal weather conditions and lease stipulations can limit our drilling and producing activities and other oil and natural gas operations in certain areas of the Rockies. These seasonal anomalies can pose challenges for meeting our well drilling objectives and can increase competition for equipment, supplies and personnel during the spring and summer months, which could lead to shortages and increase costs or delay our operations.
- 23 -
Environmental Matters and Regulation
General. Our operations are subject to stringent federal, state and local laws and regulations governing the discharge of materials into the environment or otherwise relating to environmental protection. Our operations are subject to the same environmental laws and regulations as other companies in the oil and gas exploration and production industry. These laws and regulations:
| • | require the acquisition of various permits before drilling commences; |
| • | require the installation of expensive pollution control equipment; |
| • | restrict the types, quantities and concentration of various substances that can be released into the environment in connection with drilling and production activities; |
| • | limit or prohibit drilling activities on lands lying within environmentally sensitive areas, wilderness, wetlands and other protected areas; |
| • | require measures to prevent pollution from former operations, such as pit closure and plugging of abandoned wells; |
| • | impose substantial liabilities for pollution resulting from our operations; |
| • | with respect to operations affecting federal lands or leases, require time consuming environmental analysis with uncertain outcomes; and |
| • | expose us to litigation by environmental and other special interest groups. |
These laws, rules and regulations may also restrict the rate of oil and natural gas production below the rate that would otherwise be possible. The regulatory burden on the oil and gas industry increases the cost and timing of doing business and consequently affects profitability. Additionally, Congress and federal and state agencies frequently revise the environmental laws and regulations, and any changes that result in delay or more stringent and costly permitting, waste handling, disposal and clean-up requirements for the oil and gas industry could have a significant impact on our operating costs.
We believe that we substantially are in compliance with and have complied, with all applicable environmental laws and regulations. We have made and will continue to make expenditures in our efforts to comply with all environmental regulations and requirements. We consider these a normal, recurring cost of our ongoing operations and not an extraordinary cost of compliance with governmental regulations. We believe that our continued compliance with existing requirements have been accounted for and will not have a material adverse impact on our financial condition and results of operations. However, we cannot predict the passage of or quantify the potential impact of any more stringent future laws and regulations at this time. For the year ended December 31, 2011, we did not incur any material capital expenditures for remediation or retrofit of pollution control equipment at any of our facilities.
The environmental laws and regulations that could have a material impact on the oil and natural gas exploration and production industry and our business are as follows:
National Environmental Policy Act. Oil and natural gas exploration and production activities on federal lands are subject to the National Environmental Policy Act, or NEPA. NEPA requires federal agencies, including the Departments of Interior and Agriculture, to evaluate major agency actions having the potential to significantly impact the environment. In the course of such evaluations, an agency will have an environmental assessment prepared that assesses the potential direct, indirect and cumulative impacts of a proposed project and project alternatives. If impacts are considered significant, the agency will prepare a more detailed Environmental Impact Statement. These environmental analyses are made available for public review and comment. All of our current exploration and production activities, as well as proposed exploration and development plans, on federal lands require governmental permits that trigger the requirements of NEPA. Certain federal permits on
- 24 -
non-federal lands may also trigger NEPA requirements. This process has the potential to delay the development of oil and natural gas projects. Authorizations under NEPA also are subject to protest, appeal or litigation, which can delay or halt projects.
Waste Handling. The Resource Conservation and Recovery Act, or RCRA, and comparable state statutes affect oil and gas exploration and production activities by imposing regulations on the generation, transportation, treatment, storage, disposal and cleanup of “hazardous wastes” and on the disposal of non-hazardous wastes. Under the oversight of the Environmental Protection Agency, or EPA, the individual states administer some or all of the provisions of RCRA, sometimes in conjunction with their own, more stringent requirements. Drilling fluids, produced waters and most of the other wastes associated with the exploration, development and production of crude oil, natural gas, or geothermal energy constitute “solid wastes,” which are regulated under the less stringent, non-hazardous waste provisions, but there is no guarantee that the EPA or the individual states will not adopt more stringent requirements for the handling of non-hazardous wastes or categorize some non-hazardous wastes as hazardous for future regulation. Indeed, legislation has been proposed from time to time in Congress to re-categorize certain oil and gas exploration and production wastes as “hazardous wastes.”
We believe that we are in substantial compliance with the requirements of RCRA and related state and local laws and regulations, and that we have held, and continue to hold, all necessary and up-to-date approvals, permits, registrations and other authorizations to the extent that our operations require them under such laws and regulations. Although we believe that the current costs of managing our wastes as they are presently classified are reflected in our budget, any legislative or regulatory reclassification of oil and natural gas exploration and production wastes could increase our costs to manage and dispose of such wastes.
Comprehensive Environmental Response, Compensation and Liability Act. The Comprehensive Environmental Response, Compensation and Liability Act, or CERCLA, also known as the “superfund” law, imposes strict, joint and several liability, without regard to fault or legality of conduct, on classes of persons who are considered to be responsible for a release or threatened release of a “hazardous substance” into the environment. These persons may include current and past owners or operators of the disposal site, or site where the release or threatened release of a “hazardous substance” occurred, and companies that disposed of or arranged for the disposal of the hazardous substance. Under CERCLA, such persons may be subject to joint and several liability for the costs of cleaning up the hazardous substances that have been released into the environment, for damages to natural resources and for the costs of certain health studies. In addition, it is not uncommon for neighboring landowners and other third parties to file claims under CERCLA and/or state common law for cleanup costs, personal injury and property damage allegedly caused by the hazardous substances released into the environment. In the course of our operations, we use materials that, if released, could be subject to CERCLA. Therefore, governmental agencies or third parties may seek to hold us responsible under CERCLA for all or part of the costs to clean up sites at which such “hazardous substances” have been released.
Water Discharges. The Federal Water Pollution Control Act, also known as the Clean Water Act, and analogous state laws impose restrictions and strict controls regarding the discharge of pollutants, including produced waters and other oil and gas wastes, into waters of the United States. The discharge of pollutants into regulated waters is prohibited, except in accordance with the terms of a permit issued by the EPA or the state. These prescriptions also prohibit the discharge of dredge and fill material in regulated waters, including jurisdictional wetlands, unless authorized by a permit issued by the U.S. Army Corps of Engineers. Federal and state regulatory agencies can impose administrative penalties, civil and criminal judicial actions, as well as other enforcement mechanisms for non-compliance with discharge permits or other requirements of the federal Clean Water Act and analogous state laws and regulations. We maintain all required discharge permits necessary to conduct our operations, and we believe we are in substantial compliance with the terms thereof. Obtaining permits has the potential to delay the development of oil and natural gas projects. These same regulatory programs also limit the total volume of water that can be discharged, hence limiting the rate of development.
Air Emissions. The Federal Clean Air Act, and associated state laws and regulations, regulate emissions of various air pollutants through the issuance of permits and the imposition of other requirements. In addition, the
- 25 -
EPA has developed, and continues to develop, stringent regulations governing emissions of toxic air pollutants at specified sources. The EPA has recently deemed carbon dioxide (“CO2”) and other greenhouse gases to be a danger to public health, which is leading to regulation in a manner similar to other pollutants. The EPA now requires reporting of greenhouse gases, such as CO2 and methane, from operations. Most of our facilities are now required to obtain permits before work can begin, and existing facilities are often required to incur capital costs in order to remain in compliance. These regulations may increase the costs of compliance for some facilities we own or operate, and federal and state regulatory agencies can impose administrative, civil and criminal penalties for non-compliance with air permits or other requirements of the Federal Clean Air Act and associated state laws and regulations. We believe that we are in substantial compliance with all air emissions regulations and that we hold all necessary and valid construction and operating permits for our operations. Obtaining permits has the potential to delay the development of oil and natural gas projects.
Climate Change. The Kyoto Protocol to the United Nations Framework Convention on Climate Change went into effect in February 2005 and requires all industrialized nations that ratified the Protocol to reduce or limit greenhouse gas emissions to a specified level by 2012. The United States has not ratified the Protocol, and the U.S. Congress has not passed proposed legislation directed at reducing greenhouse gas emissions. However, there is increasing public pressure from environmental groups and some states for the United States to develop a national program for regulating greenhouse gas emissions, and several states have already adopted regulations or announced initiatives focused on decreasing or stabilizing greenhouse gas emissions associated with industrial activity, primarily CO2 emissions from power plants. The EPA has also taken certain regulatory actions to address issues related to climate change. The oil and natural gas exploration and production industry is a direct source of certain greenhouse gas emissions, namely CO2 and methane, and future restrictions on the combustion of fossil fuels or the venting of natural gas could impact our future operations. Our operations are not currently adversely impacted by current state and local climate change initiatives and, at this time, it is not possible to accurately estimate how potential future laws or regulations addressing greenhouse gas emissions could impact our business. However, future laws or regulations could result in substantial expenditures or reduced demand for oil or natural gas.
Homeland Security. Legislation continues to be introduced in Congress, and development of regulations continues in the Department of Homeland Security and other agencies, concerning the security of industrial facilities, including oil and natural gas facilities. Our operations may be subject to such laws and regulations. Presently, it is not possible to accurately estimate the costs we could incur to comply with any such facility security laws or regulations, but such expenditures could be substantial.
Other Regulation of the Oil and Gas Industry
The oil and gas industry is extensively regulated by numerous federal, state and local authorities, including Native American tribes. Legislation affecting the oil and gas industry is under constant review for amendment or expansion, frequently increasing the regulatory burden. Also, numerous departments and agencies, federal, state, local, and Native American tribes are authorized by statute to issue rules and regulations binding on the oil and gas industry and its individual members, some of which carry substantial penalties for failure to comply. Although the regulatory burden on the oil and gas industry increases our cost of doing business and, consequently, affects our profitability, these burdens generally do not affect us any differently or to any greater or lesser extent than they affect other companies in the industry with similar types, quantities and locations of production.
Drilling and Production. Our operations are subject to various types of regulation at federal, state, local and Native American tribal levels. These types of regulation include requiring permits for the drilling of wells, drilling bonds and reports concerning operations. Most states, and some counties, municipalities and Native American tribes also regulate one or more of the following:
| • | the location of wells; |
- 26 -
| • | the method of drilling and casing wells; |
| • | the rates of production or “allowables;” |
| • | the surface use and restoration of properties upon which wells are drilled and other third parties; |
| • | wildlife management and protection; |
| • | the protection of archeological and paleontological resources; |
| • | property mitigation measures; |
| • | the plugging and abandoning of wells; and |
| • | notice to, and consultation with, surface owners and other third parties. |
State laws regulate the size and shape of drilling and spacing units or proration units governing the pooling of oil and natural gas properties. Some states allow forced pooling or integration of tracts to facilitate exploration while other states rely on voluntary pooling of lands and leases. In some instances, forced pooling or unitization may be implemented by third parties and may reduce our interest in the unitized properties. In addition, state conservation laws can establish maximum rates of production from oil and natural gas wells, generally prohibit the venting or flaring of natural gas and impose requirements regarding the ratability of production. These laws and regulations may limit the amount of natural gas and oil we can produce from our wells or limit the number of wells or the locations at which we can drill. Moreover, each state generally imposes a production or severance tax with respect to the production and sale of oil, natural gas and NGLs within its jurisdiction.
Hydraulic Fracturing.Our completion operations are subject to regulation, which may increase in the short- or long-term. The well completion technique known as hydraulic fracturing is used to stimulate production of natural gas and oil has come under increased scrutiny by the environmental community, and local, state and federal jurisdictions. Hydraulic fracturing involves the injection of water, sand and additives under pressure, usually down casing that is cemented in the wellbore, into prospective rock formations at depth to stimulate oil and natural gas production. We use this completion technique on substantially all our wells other than our coal bed methane wells.
For example, under the direction of Congress, the EPA has undertaken a study of the effect of hydraulic fracturing on drinking water and groundwater. Congress also is currently considering legislation to amend the Federal Safe Drinking Water Act to require the disclosure of chemicals used by the oil and gas industry in the hydraulic fracturing process. Certain states, including Colorado and Wyoming, have issued similar disclosure rules. In addition, the Department of Interior is considering expanded or new regulations concerning the use of hydraulic fracturing on lands under its jurisdiction, which includes many of the lands on which we conduct or plan to conduct operations. Furthermore, moratoria on hydraulic fracturing have been imposed in certain areas (although we have not been directly affected by these moratoria because they are in states where we do not have operations) and legislation has been proposed at local, state and federal levels.
Natural Gas Sales and Transportation. Historically, federal legislation and regulatory controls have affected the price of the natural gas we produce and the manner in which we market our production. The Federal Energy Regulatory Commission, or FERC, has jurisdiction over the transportation and sale or resale of natural gas in interstate commerce by natural gas companies under the Natural Gas Act of 1938 and the Natural Gas Policy Act of 1978. Since 1978, various federal laws have been enacted that have resulted in the complete removal of all price and non-price controls for sales of domestic natural gas sold in “first sales,” which include all of our sales of our own production.
FERC also regulates interstate natural gas transportation rates and service conditions, which affects the marketing of natural gas that we produce, as well as the revenues we receive for sales of our natural gas. Commencing in 1985, FERC promulgated a series of orders, regulations and rule makings that significantly
- 27 -
fostered competition in the business of transporting and marketing gas. Today, interstate pipeline companies are required to provide nondiscriminatory transportation services to producers, marketers and other shippers, regardless of whether such shippers are affiliated with an interstate pipeline company. FERC’s initiatives have led to the development of a competitive, unregulated, open access market for gas purchases and sales that permits all purchasers of gas to buy gas directly from third-party sellers other than pipelines. However, the natural gas industry historically has been very heavily regulated; therefore, we cannot guarantee that the less stringent regulatory approach recently pursued by FERC and Congress will continue indefinitely into the future, nor can we determine what effect, if any, future regulatory changes may have on our natural gas-related activities.
Under FERC’s current regulatory regime, transmission services must be provided on an open-access, non-discriminatory basis at cost-based rates or at market-based rates if the transportation market at issue is sufficiently competitive. Gathering services, which occur upstream of jurisdictional transmission services, are regulated by state agencies. Although its policy is still in flux, FERC recently has reclassified certain jurisdictional transmission facilities as non-jurisdictional gathering facilities, which has the tendency to increase our costs of transporting gas to point-of-sale locations.
Operations on Native American Reservations. A portion of our leases in the Uinta Basin are, and some of our future leases in this and other areas may be, regulated by Native American tribes. In addition to regulation by various federal, state and local agencies and authorities, an entirely separate and distinct set of laws and regulations applies to lessees, operators and other parties within the boundaries of Native American reservations. Various federal agencies within the U.S. Department of the Interior, particularly the Minerals Management Service, the Bureau of Indian Affairs, the Bureau of Land Management (“BLM”) and the Environmental Protection Agency, together with each Native American tribe, promulgate and enforce regulations pertaining to oil and gas operations on Native American reservations. These regulations include lease provisions, royalty matters, drilling and production requirements, environmental standards, tribal employment and tribal contractor preferences and numerous other matters.
Native American tribes are subject to various federal statutes and oversight by the Bureau of Indian Affairs and Bureau of Land Management. However, each Native American tribe is a sovereign nation and has the right to enact and enforce certain other laws and regulations entirely independent from federal, state and local statutes and regulations, as long as they do not supersede or conflict with such federal statutes. These tribal laws and regulations include various fees, taxes, requirements to employ Native American tribal members and numerous other conditions that apply to lessees, operators and contractors conducting operations within the boundaries of a Native American reservation. Further, lessees and operators within a Native American reservation are subject to the Native American tribal court system, unless there is a specific waiver of sovereign immunity by the Native American tribe allowing resolution of disputes between the Native American tribe and those lessees or operators to occur in federal or state court.
Therefore, we are subject to various laws and regulations pertaining to Native American tribal surface ownership, Native American oil and gas leases, fees, taxes and other burdens, obligations and issues unique to oil and gas ownership and operations within Native American reservations. One or more of these requirements, or delays in obtaining necessary approvals or permits pursuant to these regulations, may increase our costs of doing business on Native American tribal lands and have an impact on the economic viability of any well or project on those lands.
Employees
As of January 27, 2012, we had 313 employees of whom 181 work in our Denver office and 132 work in our field offices. We also contract for the services of independent consultants involved in land, regulatory, accounting, financial and other disciplines as needed. None of our employees are represented by labor unions or covered by any collective bargaining agreement. We believe that our relations with our employees are good.
- 28 -
Offices
As of December 31, 2011, we leased approximately 62,633 square feet of office space in Denver, Colorado at 1099 18th Street, where our principal offices are located. The lease for our Denver office expires in March 2019. We also own field offices in Waltman, Wyoming, Roosevelt, Utah and Silt, Colorado, and we lease field offices in Gillette, Wyoming, Cortez, Colorado and Greeley, Colorado. We believe that our facilities are adequate for our current operations and that we can obtain additional leased space if needed.
Website and Code of Business Conduct and Ethics
Our website address is http://www.billbarrettcorp.com. We make available free of charge through our website our annual report on Form 10-K, quarterly reports on Form 10-Q, current reports on Form 8-K and all amendments to those reports as soon as reasonably practicable after such material is electronically filed with or furnished to the SEC via EDGAR and posted at http://www.sec.gov. Additionally, our Code of Business Conduct and Ethics, which includes our code of ethics for senior financial management, Corporate Governance Guidelines and the charters of our Audit Committee, Compensation Committee and Nominating, Reserves Committee and Corporate Governance Committee are posted on our website at http://www.billbarrettcorp.com and are available in print free of charge to any stockholder who requests them. Requests should be sent by mail to our corporate secretary at our principal office at 1099 18th Street, Suite 2300, Denver, Colorado 80202. We intend to disclose on our website any amendments or waivers to our Code of Business Conduct and Ethics that are required to be disclosed pursuant to Item 5.05 of Form 8-K. This Annual Report on Form 10-K and our website contain information provided by other sources that we believe are reliable. We cannot assure you that the information obtained from other sources is accurate or complete. No information on our website is incorporated by reference herein or deemed to be part of this Annual Report on Form 10-K.
Annual CEO Certification
As required by New York Stock Exchange rules, on May 16, 2011 we submitted an annual certification signed by our Chief Executive Officer certifying that he was not aware of any violation by us of New York Stock Exchange corporate governance listing standards as of the date of the certification.
- 29 -
GLOSSARY OF OIL AND NATURAL GAS TERMS
The following are abbreviations and definitions of certain terms used in this document, which are commonly used in the oil and gas industry:
2-D seismic.The standard acquisition technique used to image geologic formations over a broad area. Data is collected by a single line of energy sources which reflect seismic waves to a single line of geophones. 2-D seismic data produces an image of a single vertical plane of sub-surface data.
3C 3-D seismic. A three dimensional seismic survey employing three-component geophones. These multi-component geophones record three orthogonal components of ground motion and provide information about shear waves that are unobtainable by conventional 3-D seismic surveys.
3-D seismic. Acoustical reflection data that depict the subsurface strata in three dimensions. 3-D seismic typically provides a more detailed and accurate interpretation of the subsurface strata than 2-D, or two-dimensional, seismic.
Basin-centered gas. A regional, abnormally pressured, gas-saturated accumulation in low-permeability reservoirs lacking a down-dip water contact.
Bbl. Stock tank barrel, or 42 U.S. gallons liquid volume.
Bcf. Billion cubic feet of natural gas.
Bcfe. Billion cubic feet equivalent, determined using the ratio of six Mcf of natural gas to one Bbl of crude oil, condensate or natural gas liquids.
BtuorBritish thermal unit. The quantity of heat required to raise the temperature of one pound of water by one degree Fahrenheit.
Coalbed methane or CBM. Natural gas formed as a byproduct of the coal formation process, which is trapped in coal seams and can be produced into a pipeline.
Completion.Installation of permanent equipment for production of oil and gas, or, in the case of a dry well, to reporting to the appropriate authority that the well has been abandoned.
Condensate.A mixture of hydrocarbons that exists in the gaseous phase at original reservoir temperature and pressure, but that, when produced, is in the liquid phase at surface pressure and temperature.
Curtailments.The delivery of gas below contract entitlements due to system restrictions.
Delineation. The process of drilling wells away from, or that is removed from, a known point of well control.
Desorb.A physical process whereby gas molecules are liberated from a host rock, such as a shale or coal reservoir, when the formation pressure is reduced.
Developed acreage. The number of acres that are allocated or assignable to productive wells or wells capable of production.
Development well. A well drilled within the proved area of a natural gas or oil reservoir to the depth of a stratigraphic horizon known to be productive.
Down-dip. The occurrence of a formation at a lower elevation than a nearby area.
- 30 -
Drill-to-earn. The process of earning an interest in leasehold acreage by drilling a well pursuant to a farm-in, exploration, or other agreement.
Dry hole or Dry well.An exploratory, development, or extension well that proves to be incapable of producing either oil or gas in sufficient quantities to justify completion as an oil or gas well.
Environmental Assessment or EA.A study that can be required pursuant to federal law prior to drilling a well.
Environmental Impact Statement or EIS.A more detailed study that can be required pursuant to federal law of the potential direct, indirect and cumulative impacts of a project that may be made available for public review and comment.
Exploratory well. A well drilled to find a new field or to find a new reservoir in a field previously found to be productive of oil or gas in another reservoir.
Field. An area consisting of either a single reservoir or multiple reservoirs, all grouped on or related to the same individual geological structural feature and/or stratigraphic condition.
Gross acres or gross wells. The total acres or wells, as the case may be, in which a working interest is owned.
Horizontal Drilling.A drill rig operation of drilling vertically to a defined depth and then mechanically steering the drill bit to drill horizontally within a designated zone typically defined as the prospective pay zone to be completed for oil and or gas.
Hydraulic fracturing. The injection of water, sand and additives under pressure, usually down casing that is cemented in the wellbore, into prospective rock formations at depth to stimulate natural gas and oil production.
Identified drilling locations. Total gross locations specifically identified and scheduled by management as an estimation of our multi-year drilling activities on existing acreage. Our actual drilling activities may change depending on the availability of capital, regulatory approvals, seasonal restrictions, natural gas and oil prices, costs, drilling results and other factors.
MBbls. Thousand barrels of crude oil or other liquid hydrocarbons.
Mcf. Thousand cubic feet of natural gas.
Mcf/d. Mcf per day.
Mcfe. Thousand cubic feet equivalent, determined using the ratio of six Mcf of natural gas to one Bbl of crude oil, condensate or natural gas liquids.
MMBbls. Million barrels of crude oil or other liquid hydrocarbons.
MMBtu. Million British Thermal Units.
MMcf. Million cubic feet of natural gas.
MMcf/d. MMcf per day.
MMcfe. Million cubic feet equivalent, determined using the ratio of six Mcf of natural gas to one Bbl of crude oil, condensate or natural gas liquids.
MMcfe/d. MMcfe per day.
- 31 -
Net acres or net wells. The sum of the fractional working interest owned in gross acres or gross wells, as the case may be.
Net revenue interest. An owner’s interest in the revenues of a well after deducting proceeds allocated to royalty and overriding interests.
NGLs.Natural gas liquids.
Overpressured. A subsurface formation that exerts an abnormally high formation pressure on a wellbore drilled into it.
Play.A term used to describe an accumulation of oil and/or natural gas resources known to exist, or thought to exist based on geotechnical research, over a large area expanse.
Plugging and abandonment. Refers to the sealing off of fluids in the strata penetrated by a well so that the fluids from one stratum will not escape into another or to the surface. Regulations of all states require plugging of abandoned wells.
Potentiometric surface.An imaginary surface defined by the level to which water in an aquifer would rise due to the natural pressure in the rocks.
Productive well.An exploratory, development, or extension well that is not a dry well.
Prospect. A specific geographic area which, based on supporting geological, geophysical or other data and also preliminary economic analysis using reasonably anticipated prices and costs, is deemed to have potential for the discovery of commercial hydrocarbons.
Proved developed reserves or PDP. Reserves that can be expected to be recovered through existing wells with existing equipment and operating methods.
Proved reserves. The quantities of oil, natural gas and natural gas liquids, which, by analysis of geoscience and engineering data, can be estimated with reasonable certainty to be economically producible – from a given date forward, from known reservoirs, and under existing economic conditions, operating methods, and government regulations.
Proved undeveloped reserves or PUD.Reserves that are expected to be recovered from new wells on undrilled acreage, or from existing wells where a relatively major expenditure is required for recompletion.
Recompletion. The process of re-entering an existing wellbore that is either producing or not producing and completing new reservoirs in an attempt to establish or increase existing production.
Resource Management Plan or RMP.A document that describes the Bureau of Land Management’s intended uses of lands that are under its jurisdiction.
Reservoir. A porous and permeable underground formation containing a natural accumulation of producible natural gas and/or oil that is confined by impermeable rock or water barriers and is separate from other reservoirs.
Salt diapir.A generally long and linear geologic structure formed from the emplacement of a large column of salt into pre-existing rock layers.
Shale gas. Considered to be an unconventional accumulation of natural gas where the gas is recovered from extremely low permeability shales, generally through the use of horizontal drilling and massive hydraulic fracturing.
- 32 -
Shale oil. Considered to be an unconventional accumulation of oil where the oil is recovered from extremely low permeability shales, generally through the use of horizontal drilling and massive hydraulic fracturing.
Standardized Measure. The present value of estimated future cash inflows from proved natural gas and oil reserves, less future development and production costs and future income tax expenses, using prices and costs as of the date of estimation without future escalation, without giving effect to hedging activities, non-property related expenses such as general and administrative expenses, debt service and depreciation, depletion and amortization and discounted using an annual discount rate of 10% to reflect timing of future cash flows.
Stratigraphic play. An oil or natural gas formation contained within an area created by permeability and porosity changes characteristic of the alternating rock layer that result from the sedimentation process.
Structural play. An accumulation of oil and gas in rock strata that has been folded or faulted.
Tcf. Trillion cubic feet (of gas)
Undeveloped acreage. Lease acreage on which wells have not been drilled or completed to a point that would permit the production of commercial quantities of natural gas and oil regardless of whether such acreage contains proved reserves.
Working interest. The operating interest that gives the owner the right to drill, produce and conduct operating activities on the property and receive a share of production and requires the owner to pay a share of the costs of drilling and production operations.
| Item 1A. | Risk Factors |
Our business involves a high degree of risk. If any of the following risks, or any risk described elsewhere in this Form 10-K, actually occurs, our business, financial condition or results of operations could suffer. The risks described below are not the only ones facing us. Additional risks not presently known to us or that we currently consider immaterial also may adversely affect our Company.
Risks Related to the Oil and Natural Gas Industry and Our Business
Oil and natural gas prices are volatile and a decline in oil and natural gas prices can significantly affect our financial results, impede our growth and result in downward adjustments in our estimated proved oil and gas reserves.
Our revenue, profitability and cash flow depend upon the prices and demand for oil and natural gas. The markets for these commodities are very volatile, and even relatively modest drops in prices can significantly affect our financial results and impede our growth. Changes in oil and natural gas prices have a significant impact on the value of our reserves and on our cash flow. Prices for oil and natural gas may fluctuate widely in response to relatively minor changes in the supply of and demand for oil and natural gas, market uncertainty and a variety of additional factors that are beyond our control, such as:
| • | the domestic and foreign supply of oil and natural gas; |
| • | economic conditions in the United States, and the level of consumer product demand; |
| • | domestic and foreign governmental regulations; |
| • | variations between product prices at sales points and applicable index prices. |
| • | overall domestic and global economic conditions; |
| • | political and economic conditions in oil producing countries, including the Middle East and South America; |
- 33 -
| • | the ability of members of the Organization of Petroleum Exporting Countries to agree to and maintain oil price and production controls; |
| • | weather conditions; |
| • | technological advances affecting energy consumption; |
| • | proximity and capacity of oil and gas pipelines, refineries and other transportation facilities; and |
| • | the price and availability of alternative fuels. |
Lower oil and natural gas prices may not only decrease our revenues on a per unit basis, but also may reduce the amount of oil and natural gas that we can produce economically. This may result in our having to make substantial downward adjustments to our estimated proved reserves. If this occurs or if our estimates of development costs increase, production data factors change or our exploration or development results deteriorate, successful efforts accounting rules may require us to write down, as a non-cash charge to earnings, the carrying value of our oil and natural gas properties for impairments. We are required to perform impairment tests on our assets whenever events or changes in circumstances lead to a reduction of the estimated useful life or estimated future cash flows that would indicate that the carrying amount may not be recoverable or whenever management’s plans change with respect to those assets. We may incur impairment charges in the future, which could have a material adverse effect on our results of operations in the period taken.
Our exploratory and development drilling efforts and our well operations may not be profitable or achieve our targeted returns.
We acquire significant amounts of unproved property in order to attempt to further our exploration and development efforts. Exploration and development drilling and production activities are subject to many risks, including the risk that no commercially productive reservoirs will be discovered. We acquire unproved properties and lease undeveloped acreage that we believe will enhance our growth potential and increase our earnings over time. From time to time, we may seek industry partners to help mitigate our risk on certain exploration prospects. We cannot assure you that all prospects will be economically viable or that we will not abandon our initial investments. Additionally, there can be no assurance that unproved property acquired by us or undeveloped acreage leased by us will be profitably developed, that new wells drilled by us in prospects that we pursue will be productive, that we will recover all or any portion of our investment in such unproved property or wells, or that we will succeed in bringing on additional partners.
Drilling for oil and natural gas may involve unprofitable efforts, not only from dry wells but also from wells that are productive but do not produce sufficient commercial quantities to cover the drilling, operating and other costs. The cost of drilling, completing and operating a well is often uncertain, and many factors can adversely affect the economics of a well or property. Drilling operations may be curtailed, delayed or canceled as a result of unexpected drilling conditions, equipment failures or accidents, shortages of equipment or personnel, environmental issues and for other reasons. We rely to a significant extent on seismic data and other advanced technologies in identifying unproved property prospects and in conducting our exploration activities. The seismic data and other technologies we use do not allow us to know conclusively, prior to acquisition of unproved property or drilling a well, whether oil or natural gas is present or may be produced economically. The use of seismic data and other technologies also requires greater pre-drilling expenditures than traditional drilling strategies. Drilling results in our shale plays may be more uncertain than in other shale plays that are more mature and have longer established drilling and production histories, and we can provide no assurance that drilling and completion techniques that have proven to be successful in other shale formations to maximize recoveries will be ultimately successful when used in our shale prospects. As a result, we may incur future dry hole costs and or impairment charges due to any of these factors.
- 34 -
A U.S. and global economic downturn could have a material adverse effect on our business and operations.
The European sovereign debt crisis has increased concerns about global economic recovery. Any or all of the following may occur as a result of a renewed crisis in the global financial and securities markets and resulting economic downturn:
| • | The economic slowdown could lead to lower demand for oil and natural gas by individuals and industries, which in turn has resulted and could continue to result in lower prices for the oil and natural gas sold by us, lower revenues and possibly losses. This is exacerbated by increases in gas supply resulting from increases in U.S. gas production. |
| • | The lenders under our revolving credit facility may become more restrictive in their lending practices or unable or unwilling to fund their commitments, which would limit our access to capital to fund our capital expenditures and operations. This would limit our ability to generate revenues as well as limit our projected production and reserves growth, leading to declining production and possibly losses. |
| • | We may be unable to obtain additional debt or equity financing, which would require us to limit our capital expenditures and other spending. This would lead to lower growth in our production and reserves than if we were able to spend more than our cash flow. Financing costs may significantly increase as lenders may be reluctant to lend without receiving higher fees and spreads. |
| • | The losses incurred by financial institutions as well as the insolvency of some financial institutions heightens the risk that a counterparty to our hedge arrangements could default on its obligations. These losses and the possibility of a counterparty declaring bankruptcy or being placed in conservatorship or receivership may affect the ability of the counterparties to meet their obligations to us on hedge transactions, which could reduce our revenues from hedges at a time when we are also receiving a lower price for our natural gas and oil sales. As a result, our financial condition could be materially, adversely affected. |
| • | Our credit facility bears floating interest rates based on the London Interbank Offer Rate, or LIBOR. As banks were reluctant to lend to each other to avoid risk, LIBOR increased to unprecedented spread levels in 2008. While spreads returned to normal levels in late 2009 and 2010, they increased again in late 2011 in response to the European sovereign debt crisis. While this increase did not reach the levels seen in 2008, such spread levels are possible in the future. Such increases cause higher interest expense for unhedged levels of LIBOR-based borrowings. |
| • | Our credit facility requires the lenders to redetermine our borrowing base semi-annually. The redeterminations are based on our proved reserves and hedge position based on price assumptions that our lenders require us to use to calculate reserves pursuant to the credit facility. The lenders could reduce their price assumptions used to determine reserves for calculating our borrowing base due to lower commodities and futures prices and our borrowing base could be reduced. This would reduce our funds available to borrow. |
| • | Bankruptcies of financial institutions or illiquidity of money market funds may limit or delay our access to our cash equivalent deposits, causing us to lose some or all of those funds or to incur additional costs to borrow funds needed on a short-term basis that were previously funded from our money market deposits. |
| • | Bankruptcies of purchasers of our oil and natural gas could lead to the delay or failure of us to receive the revenues from those sales. |
Our development and exploration operations require substantial capital and we may be unable to obtain needed capital or financing on satisfactory terms or at all, which could lead to a loss of properties and a decline in our oil and natural gas reserves.
The oil and natural gas industry is capital intensive. We make and expect to continue to make substantial capital expenditures in our business and operations for the exploration for and development, production and
- 35 -
acquisition of oil and natural gas reserves. To date, we have financed capital expenditures primarily with sales of our equity and debt securities, proceeds from bank borrowings and cash generated by operations. We intend to finance our capital expenditures with cash flow from operations and our existing financing arrangements. Our cash flow from operations and access to capital are subject to a number of variables, including:
| • | our proved reserves; |
| • | the level of oil and natural gas we are able to produce from existing wells; |
| • | the prices at which oil, natural gas and NGLs are sold; |
| • | our ability to acquire, locate and produce new reserves; |
| • | global credit and securities markets; and |
| • | the ability and willingness of lenders and investors to provide capital and the cost of that capital. |
If our revenues or the borrowing base under our credit facility decreases as a result of lower oil and natural gas prices, operating difficulties, declines in reserves or for any other reason, we may have limited ability to obtain the capital necessary to sustain our operations at current or planned levels. We may, from time to time, need to seek additional financing. Our credit facility and senior note indentures place certain restrictions on our ability to obtain new financing. There can be no assurance as to the availability or terms of any additional financing.
If additional capital is needed, we may not be able to obtain debt or equity financing on terms favorable to us, or at all. If cash generated by operations or available under our credit facility is not sufficient to meet our capital requirements, the failure to obtain additional financing could result in a curtailment of our operations relating to exploration and development of our prospects, which in turn could lead to a possible loss of properties and a decline in our oil and natural gas reserves as well as our revenues and results of operations.
Drilling for and producing oil and natural gas are risky activities with many uncertainties that could adversely affect our business, financial condition or results of operations.
Our drilling activities subject us to many risks, including the risk that we will not discover commercially productive reservoirs. Drilling for oil and natural gas can be unprofitable, not only from dry holes, but from productive wells that do not produce sufficient revenues to return a profit. In addition, our drilling and producing operations may be curtailed, delayed or canceled or subject us to liabilities as a result of other factors, including:
| • | unusual or unexpected geological formations or other features; |
| • | pressures; |
| • | fires; |
| • | blowouts; |
| • | loss of drilling fluid circulation; |
| • | title problems; |
| • | facility or equipment malfunctions; |
| • | leaks of natural gas, oil, condensate, natural gas liquids, produced water and other hydrocarbons or losses of these hydrocarbons as a result of accidents during drilling and completion operations or in the gathering and transportation of hydrocarbons, malfunctions of or leaks from pipelines, measurement equipment or processing or other facilities in our operations or at delivery points to third parties; |
| • | other hazards, including those associated with high-sulfur content, or sour gas, such as an accidental discharge of hydrogen sulfide gas; |
| • | unexpected operational events; |
- 36 -
| • | shortages or delivery delays of equipment and services; |
| • | objections from surface owners and nearby surface owners in the areas where we operate; |
| • | compliance with environmental and other governmental requirements and related lawsuits; and |
| • | adverse weather conditions. |
The occurrence of these events could also impact third parties, including persons living near our operations, our employees and employees of our contractors, leading to injuries, death, environmental damage, property damage, or suspension of operations. As a result, we face the possibility of liabilities from these events that could adversely affect our business, financial condition or results of operations as well as adverse publicity that could lead to delays in or cessation of our operations in the affected area and loss of related assets or revenues.
Additionally, the coalbeds in the Powder River Basin from which we produce methane gas typically contain water, which may hamper our ability to produce gas in commercial quantities. This water must be partially removed in order for the gas to detach from the coal and flow to the well bore. Our ability to remove and economically dispose of sufficient quantities of water from the coal seam will determine whether we can produce coalbed methane in commercial quantities.
Any of these risks can cause substantial losses, including personal injury or loss of life, damage to or destruction of property, natural resources and equipment, pollution, environmental contamination or loss of wells and other regulatory penalties.
We ordinarily maintain insurance against various losses and liabilities arising from our operations; however, insurance against all operational risks is not available to us. Additionally, we may elect not to obtain insurance if we believe that the cost of available insurance is excessive relative to the perceived risks presented. For example, we do not carry business interruption insurance for these reasons. Thus, losses could occur for uninsurable or uninsured risks or in amounts in excess of existing insurance coverage. The occurrence of an event that is not fully covered by insurance could have a material adverse impact on our business activities, financial condition and results of operations.
We are subject to complex federal, state, tribal, local and other laws and regulations that could adversely affect the cost, manner or feasibility of doing business and the recording of proved reserves.
Our exploration, development, production and marketing operations are subject to extensive environmental regulation at the federal, state and local levels including those governing emissions to air, wastewater discharges, hazardous and solid wastes, remediation of soil, protection of surface and groundwater, and preservation of natural resources. In addition, a portion of our leases in the Uinta Basin are, and some of our future leases may be, regulated by Native American tribes. Under these laws and regulations, we could be held liable for personal injuries, property damage (including site clean-up and restoration costs) and other damages. Failure to comply with these laws and regulations may also result in the suspension or termination of our operations and subject us to administrative, civil, and criminal penalties, including the assessment of natural resource damages. Environmental and other governmental laws and regulations also increase the costs to plan, design, drill, install, operate and abandon oil and natural gas wells and related facilities. Moreover, public interest in environmental protection has increased in recent years, and environmental organizations have opposed, with some success, certain drilling projects.
Our Powder River Basin coalbed methane exploration and production activities involve the permitted discharge of produced groundwater into adjacent lands and waterways. The environmental soundness of discharging produced groundwater pursuant to water discharge permits has come under increased scrutiny. Moratoriums on the issuance of additional water discharge permits, or requirements for more costly methods of handling these produced waters, may affect future well development. Compliance with more stringent laws or regulations, more vigorous enforcement policies of the regulatory agencies, difficulties in negotiating required surface use agreements with land owners or receiving other governmental approvals could delay our Powder
- 37 -
River Basin exploration and production activities and/or require us to make material expenditures for the installation and operation of systems and equipment for pollution control and/or remediation, all of which could have a material adverse effect on our financial condition or results of operations.
Part of the regulatory environment in which we operate includes, in some cases, federal requirements for performing or preparing environmental assessments, environmental impact studies and/or plans of development before commencing exploration and production activities. In addition, our activities are subject to state regulation of oil and natural gas production and Native American tribes conservation practices and protection of correlative rights. These regulations affect our operations and limit the quantity of oil and natural gas we may produce and sell. A major risk inherent in our drilling plans is the need to obtain drilling and other permits from state, local and Native American tribal authorities. Delays in obtaining regulatory approvals or drilling and other permits, the failure to obtain a drilling permit for a well, or the receipt of a permit with excessive conditions or costs, could have a material adverse effect on our ability to explore on or develop our properties. In addition, if we do not reasonably believe that we can obtain the drilling permits in a timely fashion covering locations for which we recorded proved undeveloped reserves, we may be required to write down the level of our proved reserves. Additionally, the oil and natural gas regulatory environment could change in ways that might substantially increase the financial and managerial costs to comply with the requirements of these laws and regulations and, consequently, adversely affect our profitability. Furthermore, we may be put at a competitive disadvantage to larger companies in our industry that can spread these additional costs over a greater number of wells, larger operating areas, and other aspects of their businesses. See “Items 1 and 2. Business and Properties—Business—Operations—Environmental Matters and Regulation” and “Items 1 and 2. Business and Properties—Business—Operations—Other Regulation of the Oil and Gas Industry.”
Federal and state legislation and regulatory initiatives relating to well completion techniques known as hydraulic fracturing could result in increased costs and additional operating restrictions or delays and inability to book future reserves.
Hydraulic fracturing is a well completion technique that involves the injection of water, sand and chemicals under pressure, usually down casing that is cemented in the wellbore, into prospective rock formations at depth to stimulate oil and natural gas production. Sponsors of bills proposed before the U.S. Senate and House of Representatives have asserted that chemicals used in the fracturing process could adversely affect drinking water supplies, and the proposed legislation would require the reporting and public disclosure of chemicals used in the fracturing process. Under the direction of Congress, the EPA has undertaken a study of the effect of well completion techniques known as hydraulic fracturing on drinking water and groundwater. Congress also is currently considering legislation to amend the Federal Safe Drinking Water Act to require the disclosure of chemicals used by the oil and gas industry in the hydraulic fracturing process. Certain states, including Colorado and Wyoming, have issued similar disclosure rules. In addition, the Department of Interior is considering expanded or new regulations concerning the use of hydraulic fracturing on lands under its jurisdiction, which includes many of the lands on which we conduct or plan to conduct operations. The adoption of any future federal or state laws or implementing regulations imposing reporting or permitting obligations on, or otherwise limiting, the hydraulic fracturing process could make it more difficult to perform, or even prohibit, hydraulic fracturing, and complete oil and natural gas wells. Any such laws and or regulations may also increase our costs of compliance and doing business, and prevent us from accessing, developing and recording reserves in the future.
Our estimated reserves are based on many assumptions that may turn out to be inaccurate. Any material inaccuracies in these assumptions will materially affect the quantities of our reserves.
Underground accumulations of oil and natural gas cannot be measured in an exact way. Oil and natural gas reserve engineering requires estimates of underground accumulations of oil and natural gas and assumptions concerning future oil and natural gas prices, production levels and operating and development costs. As a result, estimated quantities of proved reserves and projections of future production rates and the timing of development expenditures may be incorrect.
- 38 -
Our estimates of proved reserves are determined at prices and costs at the date of the estimate. Any significant variance from these prices and costs could greatly affect our estimates of reserves. We prepare our own estimates of proved reserves, which are audited by independent third party petroleum engineers. Over time, our internal engineers may make material changes to reserves estimates taking into account the results of actual drilling, testing and production. For additional information about these risks and their impact on our reserves, see “Items 1 and 2. Business and Properties—Oil and Gas Data—Proved Reserves” and “Supplementary Information to Consolidated Financial Statements—Supplementary Oil and Gas Information (unaudited)—Analysis of Changes in Proved Reserves” in this Annual Report on Form 10-K.
Unless we replace our oil and natural gas reserves, our reserves and production will decline, which would adversely affect our business, financial condition and results of operations.
Producing oil and natural gas reservoirs generally are characterized by declining production rates that vary depending upon reservoir characteristics and other factors. The rate of decline will change if production from our existing wells declines in a different manner than we have estimated and can change under other circumstances. Thus, our future oil and natural gas reserves and production and, therefore, our cash flow and income are highly dependent upon our success in efficiently developing and exploiting our current reserves and economically finding or acquiring additional recoverable reserves. We may not be able to develop, find or acquire additional reserves to replace our current and future production at acceptable costs.
Prospects that we decide to drill may not yield oil or natural gas in commercially viable quantities.
We describe some of our prospects and our plans to explore those prospects in “Items 1 and 2. Business and Properties.” A prospect is a specific geographic area which, based on supporting geological, geophysical or other data and also preliminary economic analysis using reasonably anticipated prices and costs, is deemed to have potential for the discovery of commercial hydrocarbons. Our prospects are in various stages of evaluation, ranging from a prospect that is ready to drill to a prospect that will require substantial additional seismic data processing and interpretation. However, the use of seismic data and other technologies and the study of producing fields in the same area will not enable us to know conclusively prior to drilling and testing whether oil or natural gas will be present or, if present, whether oil or natural gas will be present in sufficient quantities to recover drilling or completion costs or to be economically viable. If we drill additional wells that we identify as dry holes in our current and future prospects, our drilling success rate may decline and materially harm our business. The cost of drilling, completing and operating any well is often uncertain, and new wells may not be productive. Such uncertainties may harm our business and results of operations.
Certain of our coalbed methane leases in the Powder River Basin are in areas that may have been partially depleted or drained by offset wells or impacted by nearby coal mining activities.
In the Powder River Basin, nearly all of our current operations are in coalbed methane plays, and our key project areas are located in areas that have been the most active drilling areas in the Rockies. As a result, many of our leases are in areas that may have already been partially depleted or drained by earlier offset drilling. This may inhibit our ability to find economically recoverable quantities of natural gas in these areas. In addition, activities related to the mining of coal near our operations, including core-hole drilling to determine the aerial extent of coal deposits and the mining of coal, may introduce oxygen into our producing wells and compressors, causing production to be shut-in, or allowing hydrocarbons to escape before they can be recovered. This would lead to a loss of reserves and revenues.
Our identified drilling location inventories are scheduled out over several years, making them susceptible to uncertainties that could materially alter the occurrence or timing of their drilling.
Our management has specifically identified and scheduled drilling locations as an estimation of our future multi-year drilling activities on our existing acreage. These identified drilling locations represent a significant part of our growth strategy. Our ability to drill and develop these locations depends on a number of uncertainties,
- 39 -
including the availability of capital, seasonal conditions, regulatory approvals, natural gas and oil prices, costs and drilling results. Because of these uncertainties, we do not know if the numerous potential drilling locations we have identified will ever be drilled or if we will be able to produce oil or natural gas from these or any other potential drilling locations. As such, our actual drilling activities may differ materially differ from those presently identified, which could adversely affect our business.
Our use of 2-D and 3-D seismic data is subject to interpretation and may not accurately identify the presence of oil and natural gas and, which could adversely affect the results of our drilling operations.
Even when properly used and interpreted, 2-D and 3-D seismic data and visualization techniques are tools used to assist geoscientists in identifying subsurface structures and hydrocarbon indicators and do not enable geoscientists to know whether hydrocarbons are, in fact, present in those structures and the amount of hydrocarbons. We are employing 3C 3-D seismic technology to evaluate certain of our projects. The implementation and practical use of 3C 3-D seismic technology is relatively new, unproven and unconventional, which can lessen its effectiveness, at least in the near term, and increase our costs. In addition, the use of 3-D seismic and other advanced technologies requires greater predrilling expenditures than traditional drilling strategies, and we could incur greater drilling and testing expenses as a result of such expenditures, which may result in a reduction in our returns or losses. As a result, our drilling activities may not be successful or economical, and our overall drilling success rate or our drilling success rate for activities in a particular area could decline.
We often gather 3-D seismic data over large areas. Our interpretation of seismic data delineates those portions of an area that we believe are desirable for drilling. Therefore, we may choose not to acquire option or lease rights prior to acquiring seismic data, and, in many cases, we may identify hydrocarbon indicators before seeking option or lease rights in the location. If we are not able to lease those locations on acceptable terms, we will have made substantial expenditures to acquire and analyze 3-D data without having an opportunity to attempt to benefit from those expenditures.
Substantially all of our producing properties are located in the Rocky Mountains, making us vulnerable to risks associated with operating in one major geographic area.
Our operations have been focused on the Rockies, which means our current producing properties and new drilling opportunities are geographically concentrated in that area. Because our operations are not as diversified geographically as many of our competitors, the success of our operations and our profitability may be disproportionately exposed to the effect of any regional events, including fluctuations in prices of oil and natural gas produced from the wells in the region, natural disasters, restrictive governmental regulations, transportation capacity constraints, weather, curtailment of production or interruption of transportation, and any resulting delays or interruptions of production from existing or planned new wells.
Seasonal weather conditions and lease stipulations adversely affect our ability to conduct drilling activities in some of the areas where we operate.
Oil and natural gas operations in the Rocky Mountains are adversely affected by seasonal weather conditions and lease stipulations designed to protect various wildlife. In certain areas on federal lands, drilling and other oil and natural gas activities can only be conducted during limited times of the year. This limits our ability to operate in those areas and can intensify competition during those times for drilling rigs, oil field equipment, services, supplies and qualified personnel, which may lead to periodic shortages. These constraints and the resulting shortages or high costs could delay our operations and materially increase our operating and capital costs.
- 40 -
Properties that we buy may not produce as projected and we may be unable to determine reserve potential, identify liabilities associated with the properties or obtain protection from sellers against them.
One of our growth strategies is to capitalize on opportunistic acquisitions of oil and natural gas reserves. Our reviews of acquired properties are inherently incomplete, because it generally is not feasible to review in depth every individual property involved in each acquisition. Ordinarily, we will focus our review efforts on the higher value properties and will sample the remaining properties for reserve potential. However, even a detailed review of records and properties may not necessarily reveal existing or potential problems, nor will it permit us to become sufficiently familiar with the properties to assess fully their deficiencies and potential. Inspections may not always be performed on every well, and environmental problems, such as ground water contamination, are not necessarily observable even when an inspection is undertaken. Even when problems are identified, we often assume certain environmental and other risks and liabilities in connection with acquired properties.
Market conditions or operational impediments may hinder our access to oil and natural gas markets or delay our production.
Market conditions or the unavailability of satisfactory oil and natural gas transportation arrangements may hinder our access to oil and natural gas markets or delay our production. The availability of a ready market for our oil and natural gas production depends on a number of factors, including the demand for and supply of oil and natural gas and the proximity of our reserves to pipelines and terminal facilities. Our ability to market our production depends in substantial part on the availability and capacity of gathering systems, pipelines, processing facilities and refineries owned and operated by third parties. Our failure to obtain such services on acceptable terms could materially harm our business. We may be required to shut in wells for a lack of a market or because of inadequacy or unavailability of natural gas pipeline, gathering system capacity or processing facilities. If that were to occur, we would be unable to realize revenue from those wells until production arrangements were made to deliver the production to market.
Our hedging activities could result in financial losses or could reduce our income.
To achieve a more predictable cash flow and to reduce our exposure to adverse fluctuations in the prices of commodities, we currently, and will likely in the future, enter into hedging arrangements for a significant portion of our production revenues. Hedging arrangements for a portion of our production revenues expose us to the risk of financial loss in some circumstances, including when:
| • | there is a change in the expected differential between the underlying price in the hedging agreement and actual prices received; |
| • | there is a change in the mark to market value of our derivatives; or |
| • | the counterparty to the hedging contract defaults on its contractual obligations. |
In addition, these types of hedging arrangements limit the benefit we would receive from increases in commodities prices and may expose us to cash margin requirements if we hedge with counterparties who are not parties to our credit facility.
Our counterparties are typically financial institutions that are lenders under our credit facility or affiliates of such lenders. The risk that a counterparty may default on its obligations was heightened by the financial sector crisis of 2008-2009, the current European sovereign debt crisis and losses incurred by many banks and other financial institutions, including some of our counterparties or their affiliates. These losses may affect the ability of the counterparties to meet their obligations to us on hedge transactions, which would reduce our revenues from hedges at a time when we are also receiving a lower price for our production revenues, thus triggering the hedge payments. As a result, our financial condition could be materially adversely affected.
- 41 -
Federal legislation may decrease our ability to enter into, and increase the cost, and risk of entering into, hedge transactions.
The Dodd-Frank Wall Street Reform and Consumer Protective Act (“Dodd-Frank” or the “new law”) was signed into law on July 21, 2010. Dodd-Frank regulates derivative transactions, including our commodity derivative swaps. The new law required the Treasury Department to implement final administrative procedures related to derivatives within one year, but many of such procedures have still not been implemented. The effect of such rules on our business is currently uncertain. However, we expect that as a commercial end user using derivatives to manage commercial risks, we will be exempt from posting collateral requirements and mandatory trading on a centralized exchange. We expect to be able to continue to trade with our counterparties, which are all lenders in our credit facility, or affiliates of lenders, although we may only be able to hedge with separately capitalized affiliates of our lenders. We do expect that the cost to hedge will increase as a result of fewer counterparties in the market and the pass-through of increased capital costs of bank subsidiaries. Decreasing our ability to enter into hedging transactions would expose us to additional risks related to commodity price volatility and impair our ability to have certainty with respect to a portion of our cash flow, which could lead to decreases in capital spending and, therefore, decreases in future production and reserves. Entering into hedging transactions with an affiliate of a lender will, in the absence of a guarantee from such lender of the obligations of its affiliate, likely eliminate our ability to offset amounts we owe such lender against amounts owed us under such hedging agreements thereby increasing our risk under such hedging agreements.
The inability of one or more of our customers to meet their obligations may adversely affect our financial results.
Substantially all of our accounts receivable result from oil and natural gas sales or joint interest billings to third parties in the energy industry. This concentration of customers and joint interest owners may impact our overall credit risk in that these entities may be similarly affected by changes in economic and other conditions. In addition, our oil and natural gas hedging arrangements expose us to credit risk in the event of nonperformance by counterparties. An economic downturn, a delayed economic recovery, and the European sovereign debt crisis further increase these risks.
Competition in the oil and natural gas industry is intense, which may adversely affect our ability to succeed.
The oil and natural gas industry is intensely competitive, and we compete with other companies that have greater resources. Many of these companies not only explore for and produce oil and natural gas, but also carry on midstream and refining operations and market petroleum and other products on a regional, national or worldwide basis. These companies are able to pay more for productive oil and natural gas properties and exploratory prospects or define, evaluate, bid for and purchase a greater number of properties and prospects than our financial or human resources permit. In addition, these companies have a greater ability to continue exploration activities during periods of low oil and natural gas market prices. Our larger or integrated competitors are better able to absorb the burden of existing and any changes to federal, state, local and Native American tribal laws and regulations than we are, which could adversely affect our competitive position. Our ability to acquire additional properties and to discover reserves in the future will depend on our ability to evaluate and select suitable properties and to consummate transactions in a highly competitive environment. In addition, because we have fewer financial and human resources than many companies in our industry, we may be at a disadvantage in bidding for exploratory prospects and producing oil and natural gas properties.
The ability of our lenders to fund their lending obligations under our revolving credit facility may be limited, which would affect our ability to fund our operations.
Our revolving credit facility has commitments from 17 lenders. If credit markets become turbulent as a result of an economic downturn, delayed economic recovery or other factors, our lenders may become more restrictive in their lending practices or may be unable to fund their commitments, which would limit our access to
- 42 -
capital to fund our capital expenditures and operations. This would limit our ability to generate revenues as well as limit our projected production and reserves growth, leading to declining production and potentially losses and could lead to defaults by our hedge counterparties.
We face risks related to rating agency downgrades.
If one or more rating agencies downgrades our outstanding debt, raising debt capital could become more difficult and more costly and we may be required to provide collateral or other credit support to certain counterparties. Providing credit support increases our costs and can limit our liquidity.
Compliance with Environmental Protection Agency (“EPA”) regulations is expected to become increasingly costly and may lead to our inability to obtain permits necessary to construct and operate new facilities.
The EPA regulates the level of ozone in ambient air and may propose to lower the allowed level of ozone in the future. Because of climate processes, most of the Rockies, where we operate, has higher levels of ozone. As a result of these existing and possible more stringent standards, we may not be able to obtain permits necessary to construct and operate new facilities, or, if we obtain the permits, the added costs to comply with the permit requirements could substantially increase our operating expenses, which would reduce our profits or make certain operations uneconomical.
Possible additional regulation related to global warming and climate change could have an adverse effect on our operations and demand for oil and gas.
Scientific studies have suggested that emissions of certain gases, commonly referred to as “greenhouse gases”, including carbon dioxide and methane, may be contributing to warming of the Earth’s atmosphere. The Kyoto Protocol to the United Nations Framework Convention on Climate Change went into effect in February 2005 and requires all industrialized nations that ratified the Protocol to reduce or limit greenhouse gas emissions to a specified level by 2012. The United States has not ratified the Protocol, and the U.S. Congress has not passed proposed legislation directed at reducing greenhouse gas emissions. However, there is increasing public pressure from environmental groups and some states for the United States to develop a national program for regulating greenhouse gas emissions, and several states have already adopted regulations or announced initiatives focused on decreasing or stabilizing greenhouse gas emissions associated with industrial activity, primarily CO2 emissions from power plants. The EPA has also taken certain regulatory actions to address issues related to climate change. Passage of state or federal climate control legislation or other regulatory initiatives or the adoption of regulations by the EPA and analogous state agencies that restrict emissions of greenhouse gases in areas in which we conduct business could have an adverse effect on our operations and demand for oil and gas.
Possible additional regulation could have an adverse effect on our operations.
Proposed energy legislation and new regulations, driven in part by the Macondo oil spill in the Gulf of Mexico, could limit our ability to operate on federal lands, delay access to federal lands, and increase the cost of our operations. These include the Consolidated Land, Energy, and Aquatic Resources Act (CLEAR), the Clean Energy Jobs and Oil Company Accountability Act, the Blowout Prevention Act, and public land leasing reforms. The inability to access federal lands, as well as delays and the increased cost of operating on federal lands could result in losses of revenues, increased costs and devaluing of our assets.
Our business could be negatively impacted by security threats, including cyber-security threats, and other disruptions.
As an oil and natural gas producer, we face various security threats, including cyber-security threats to gain unauthorized access to sensitive information or to render data or systems unusable, threats to the safety of our employees, threats to the security of our facilities and infrastructure or third party facilities and infrastructure,
- 43 -
such as processing plants and pipelines, and threats from terrorist acts. Cyber-security attacks in particular are evolving and include but are not limited to, malicious software, attempts to gain unauthorized access to data, and other electronic security breaches that could lead to disruptions in critical systems, unauthorized release of confidential or otherwise protected information and corruption of data. Although we utilize various procedures and controls to monitor and protect against these threats and to mitigate our exposure to such threats, there can be no assurance that these procedures and controls will be sufficient in preventing security threats from materializing. If any of these events were to materialize, they could lead to losses of sensitive information, critical infrastructure, personnel or capabilities, essential to our operations and could have a material adverse effect on our reputation, financial position, results of operations, or cash flows.
Risks Related to Our Common Stock
Provisions in our certificate of incorporation and bylaws and Delaware law make it more difficult to effect a change in control of us, which could adversely affect the price of our common stock.
Delaware corporate law and our current certificate of incorporation and bylaws contain provisions that could delay, defer or prevent a change in control of us or our management. These provisions include:
| • | a classified board of directors; |
| • | giving the board the exclusive right to fill all board vacancies; |
| • | permitting removal of directors only for cause and with a super-majority vote of the stockholders; |
| • | requiring special meetings of stockholders to be called only by the board; |
| • | requiring advance notice for stockholder proposals and director nominations; |
| • | prohibiting stockholder action by written consent; |
| • | prohibiting cumulative voting in the election of directors; and |
| • | allowing for authorized but unissued common and preferred shares, including shares used in our shareholder rights plan. |
These provisions also could discourage proxy contests and make it more difficult for our stockholders to elect directors and take other corporate actions. As a result, these provisions could make it more difficult for a third party to acquire us, even if doing so would benefit our stockholders, which may limit the price that investors are willing to pay in the future for shares of our common stock.
Risks Related to our Senior Notes, Convertible Notes and Amended Credit Facility
We may not be able to generate enough cash flow to meet our debt obligations, including our obligations and commitments under our senior notes, our convertible senior notes and our revolving credit facility.
We expect our earnings and cash flow to vary significantly from year to year due to the cyclical nature of our industry. As a result, the amount of debt that we can manage in some periods may not be appropriate for us in other periods. In addition, our future cash flow may be insufficient to meet our debt obligations and commitments, including our 9.875% Senior Notes due 2016 (“9.875% Senior Notes”) and our 7.625% Senior Notes due 2019 (“7.625% Senior Notes”), our 5% Convertible Senior Notes due 2028 (“Convertible Notes”) and our revolving credit facility (“Amended Credit Facility”). Any insufficiency could negatively impact our business. A range of economic, competitive, business, and industry factors will affect our future financial performance, and, as a result, our ability to generate cash flow from operations and to repay our debt, including the notes. Many of these factors, such as oil and gas prices, economic and financial conditions in our industry and the global economy or competitive initiatives of our competitors, are beyond our control.
- 44 -
As of December 31, 2011, the total outstanding principal amount of our long term indebtedness was approximately $892.5 million, and we had approximately $804.0 million in additional borrowing capacity under our Amended Credit Facility, which, if borrowed, would be secured debt effectively senior to the Senior Notes and Convertible Notes to the extent of the value of the collateral securing that indebtedness. Our Amended Credit Facility has $900.0 million in commitments. The borrowing base is dependent on our proved reserves and was, as of December 31, 2011, $1.1 billion based on our June 30, 2011 proved reserves and hedge position. Our borrowing capacity is reduced by a $26.0 million letter of credit. As of December 31, 2011, the outstanding principal balance under our Amended Credit Facility was $70.0 million.
If we do not generate enough cash flow from operations to satisfy our debt obligations, we may have to undertake one or more alternative financing plans, such as:
| • | refinancing or restructuring our debt; |
| • | selling assets; |
| • | reducing or delaying capital investments; or |
| • | seeking to raise additional capital. |
However, any alternative financing plans that we undertake, if necessary, may not allow us to meet our debt obligations. Our inability to generate sufficient cash flow to satisfy our debt obligations, including our obligations under the notes, or to obtain alternative financing, could materially and adversely affect our business, financial condition, results of operations and prospects.
Our debt could have important consequences. For example, it could:
| • | increase our vulnerability to general adverse economic and industry conditions; |
| • | limit our ability to fund future capital expenditures and working capital, to engage in future acquisitions or development activities, or to otherwise realize the value of our assets and opportunities fully because of the need to dedicate a substantial portion of our cash flow from operations to payments of interest and principal on our debt or to comply with any restrictive terms of our debt; |
| • | limit our flexibility in planning for, or reacting to, changes in our business and the industry in which we operate; |
| • | impair our ability to obtain additional financing in the future; and |
| • | place us at a competitive disadvantage compared to our competitors that have less debt. |
In addition, if we fail to comply with the covenants or other terms of any agreements governing our debt, our lenders and holders of our convertible notes and our senior notes may have the right to accelerate the maturity of that debt and foreclose upon the collateral, if any, securing that debt. Realization of any of these factors could adversely affect our financial condition.
Restrictions in our existing and future debt agreements could limit our growth and our ability to respond to changing conditions.
Our Amended Credit Facility contains a number of significant covenants in addition to covenants restricting the incurrence of additional debt. Our Amended Credit Facility requires us, among other things, to maintain certain financial ratios or reduce our debt. These restrictions also limit our ability to obtain future financings to withstand a future downturn in our business or the economy in general, or to otherwise conduct necessary corporate activities. We may also be prevented from taking advantage of business opportunities that arise because of the limitations that the restrictive covenants under the indenture governing the notes and our Amended Credit Facility impose on us.
- 45 -
Our Amended Credit Facility limits the amounts we can borrow up to a borrowing base amount, which the lenders, in their sole discretion, determine based upon projected revenues from the oil and natural gas properties securing our loan. The lenders can unilaterally adjust the borrowing base and the borrowings permitted to be outstanding under our Amended Credit Facility. Any increase in the borrowing base requires the consent of the lenders holding 98% of the commitments. If the required lenders do not agree on an increase, then the borrowing base will be the lowest borrowing base acceptable to the required number of lenders. Outstanding borrowings in excess of the borrowing base must be repaid immediately or we must pledge other oil and natural gas properties as additional collateral. We do not currently have any substantial unpledged properties, and we may not have the financial resources in the future to make mandatory principal prepayments required under the Amended Credit Facility.
A breach of any covenant in our Amended Credit Facility or the agreements and indentures governing our other indebtedness would result in a default under that agreement or indenture after any applicable grace periods. A default, if not waived, could result in acceleration of the debt outstanding under the agreement and in a default with respect to, and an acceleration of, the debt outstanding under other debt agreements. The accelerated debt would become immediately due and payable. If that occurs, we may not be able to make all of the required payments or borrow sufficient funds to refinance such debt or take other actions to pay accelerated debt. Even if new financing were available at that time, it may not be on terms that are acceptable to us.
Risks Relating to Tax
We may incur more taxes and certain of our projects may become uneconomic if certain federal income tax deductions currently available with respect to oil and natural gas exploration and development are eliminated as a result of future legislation.
President Obama has proposed eliminating certain key U.S. federal income tax deductions and credits currently available to oil and natural gas exploration and production companies. These changes include, but are not limited to
| • | the repeal of the percentage depletion allowance for oil and natural gas properties, |
| • | the elimination of current deductions for intangible drilling and development costs, |
| • | the elimination of the deduction for certain U.S. production activities, |
| • | an extension of the amortization period for certain geological and geophysical expenditures. |
It is unclear whether any of the foregoing changes will actually be enacted or how soon any such changes could become effective. The passage of any legislation changing U.S. federal income tax law could eliminate certain tax deductions that are currently available with respect to oil and natural gas exploration and development. Any such change could negatively impact our financial condition and results of operations by increasing the costs we incur which in turn would make it uneconomic to drill some prospects if commodity prices are not sufficiently high, resulting in lower revenues and decreases in production and reserves.
| Item 1B. | Unresolved Staff Comments |
Not applicable.
| Item 3. | Legal Proceedings |
We are not a party to any material pending legal or governmental proceedings, other than ordinary routine litigation incidental to our business. While the ultimate outcome and impact of any proceeding cannot be predicted with certainty, our management believes that the resolution of any proceeding will not have a material adverse effect on our financial condition or results of operations.
| Item 4. | Mine Safety Disclosures |
Not applicable
- 46 -
PART II
| Item 5. | Market for Registrant’s Common Equity, Related Stockholder Matters and Issuer Purchases of Equity Securities |
Market For Registrant’s Common Equity.
Our common stock is listed on the New York Stock Exchange under the symbol “BBG.”
The range of high and low sales prices for our common stock for the two most recent fiscal years as reported by the New York Stock Exchange was as follows:
| High | Low | |||||||
2011 | ||||||||
First Quarter | $ | 42.85 | $ | 35.45 | ||||
Second Quarter | 46.86 | 39.36 | ||||||
Third Quarter | 52.13 | 36.24 | ||||||
Fourth Quarter | 44.94 | 31.96 | ||||||
2010 | ||||||||
First Quarter | $ | 35.48 | $ | 29.00 | ||||
Second Quarter | 36.87 | 28.88 | ||||||
Third Quarter | 37.68 | 29.52 | ||||||
Fourth Quarter | 41.52 | 35.69 | ||||||
On January 27, 2012, the closing sales price for our common stock as reported by the NYSE was $27.53 per share.
Holders. On January 27, 2012, the number of holders of record of common stock was 468.
Dividends. We have not paid any cash dividends since our inception. Because we anticipate that all earnings will be retained for the development of our business and our Amended Credit Facility and Senior Notes prohibit the payment of cash dividends, no cash dividends will be paid on our common stock in the foreseeable future. See “Item 7. Management’s Discussion and Analysis of Financial Condition and Results of Operations” for additional discussion of restrictions on the payment of dividends.
Unregistered Sales of SecuritiesThere were no sales of unregistered equity securities during the year ended December 31, 2011.
Issuer Purchases of Equity Securities.The following table contains information about our acquisitions of equity securities during the three months ended December 31, 2011:
Period | Total Number of Shares(1) | Weighted Average Price Paid Per Share | Total Number of Shares (or Units) Purchased as Part of Publicly Announced Plans or Programs | Maximum Number (or Approximate Dollar Value) of Shares (or Units) that May Yet Be Purchased Under the Plans or Programs | ||||||||||||
October 1 – 31, 2011 | 0 | N/A | 0 | 0 | ||||||||||||
November 1 – 30, 2011 | 312 | $ | 41.79 | 0 | 0 | |||||||||||
December 1 – 31, 2011 | 4,321 | 33.10 | 0 | 0 | ||||||||||||
|
|
|
|
|
| |||||||||||
Total | 4,633 | $ | 33.69 | 0 | 0 | |||||||||||
|
|
|
|
|
| |||||||||||
| (1) | Represents shares delivered by employees to satisfy the exercise price of stock options and tax withholding obligations in connection with the exercise of stock options and shares withheld from employees to satisfy tax withholding obligations in connection with the vesting of shares of restricted common stock issued pursuant to our employee incentive plans. |
- 47 -
Stockholder Return Performance Presentation
As required by applicable rules of the SEC, the performance graph shown below was prepared based upon the following assumptions:
| 1. | $100 was invested in our common stock on December 31, 2006, and $100 was invested in each of the Standard & Poors 500 Index and the Standard & Poors MidCap 400 Index-Energy Sector at the closing price on December 31, 2006. |
| 2. | Dividends are reinvested on the ex-dividend dates. |
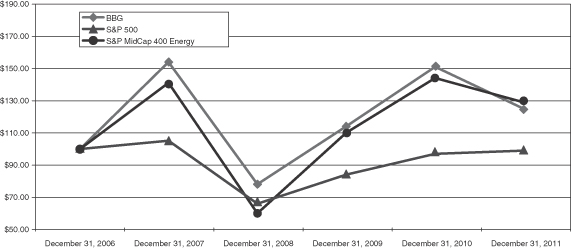
| December 31, 2006 | December 31, 2007 | December 31, 2008 | December 31, 2009 | December 31, 2010 | December 31, 2011 | |||||||||||||||||||
BBG | $ | 100 | $ | 154 | $ | 78 | $ | 114 | $ | 151 | $ | 125 | ||||||||||||
S&P MidCap 400- Energy | 100 | 141 | 60 | 110 | 144 | 129 | ||||||||||||||||||
S&P 500 | 100 | 105 | 66 | 84 | 97 | 99 | ||||||||||||||||||
| Item 6. | Selected Financial Data |
The following table presents our selected historical financial data for the years ended December 31, 2011, 2010, 2009, 2008 and 2007. Future results may differ substantially from historical results because of changes in oil and gas prices, production increases or declines and other factors. This information should be read in conjunction with the consolidated financial statements and notes thereto and “Item 7. Management’s Discussion and Analysis of Financial Condition and Results of Operations” presented elsewhere in this Annual Report on Form 10-K.
- 48 -
Selected Historical Financial Information
The consolidated statement of operations information for the years ended December 31, 2011, 2010 and 2009 and the balance sheet information as of December 31, 2011 and 2010 are derived from our audited consolidated financial statements included elsewhere in this report. The consolidated statement of operations information for the years ended December 31, 2008 and 2007 and the balance sheet information at December 31, 2009, 2008 and 2007 are derived from audited consolidated financial statements that are not included in this report. The information in this table should be read in conjunction with the consolidated financial statements and accompanying notes and other financial data included herein.
| Year Ended December 31, | ||||||||||||||||||||
| 2011 | 2010 | 2009 | 2008 | 2007 | ||||||||||||||||
| (in thousands, except per share data) | ||||||||||||||||||||
Statement of Operations Data: | ||||||||||||||||||||
Operating and other revenues | ||||||||||||||||||||
Oil and gas production(1) | $ | 780,751 | $ | 708,452 | $ | 647,839 | $ | 605,881 | $ | 374,956 | ||||||||||
Commodity derivative gain (loss) | (14,263 | ) | (10,579 | ) | (54,567 | ) | 7,920 | 0 | ||||||||||||
Other | 4,873 | 591 | 4,891 | 4,110 | 15,314 | |||||||||||||||
|
|
|
|
|
|
|
|
|
| |||||||||||
Total operating and other revenues | 771,361 | 698,464 | 598,163 | 617,911 | 390,270 | |||||||||||||||
Operating expenses: | ||||||||||||||||||||
Lease operating expense | 56,603 | 52,040 | 46,492 | 44,318 | 41,643 | |||||||||||||||
Gathering, transportation and processing expense | 93,423 | 69,089 | 56,608 | 39,342 | 23,163 | |||||||||||||||
Production tax expense | 37,498 | 32,738 | 13,197 | 44,410 | 22,744 | |||||||||||||||
Exploration expense | 3,645 | 9,121 | 3,227 | 8,139 | 8,755 | |||||||||||||||
Impairment, dry hole costs and abandonment expense | 117,599 | 44,664 | 52,285 | 32,065 | 25,322 | |||||||||||||||
Depreciation, depletion and amortization | 288,421 | 260,665 | 253,573 | 206,316 | 172,054 | |||||||||||||||
General and administrative expense(2) | 47,744 | 40,884 | 37,940 | 40,454 | 32,074 | |||||||||||||||
Non-cash stock-based compensation expense(2) | 19,036 | 16,908 | 16,458 | 16,752 | 10,154 | |||||||||||||||
|
|
|
|
|
|
|
|
|
| |||||||||||
Total operating expenses | 663,969 | 526,109 | 479,780 | 431,796 | 335,909 | |||||||||||||||
|
|
|
|
|
|
|
|
|
| |||||||||||
Operating income | 107,392 | 172,355 | 118,383 | 186,115 | 54,361 | |||||||||||||||
Other income and expense: | ||||||||||||||||||||
Interest income and other income (expense) | (397 | ) | 402 | 438 | 2,036 | 2,391 | ||||||||||||||
Interest expense | (58,616 | ) | (44,302 | ) | (30,647 | ) | (19,717 | ) | (12,754 | ) | ||||||||||
|
|
|
|
|
|
|
|
|
| |||||||||||
Total other income and expense | (59,013 | ) | (43,900 | ) | (30,209 | ) | (17,681 | ) | (10,363 | ) | ||||||||||
|
|
|
|
|
|
|
|
|
| |||||||||||
Income before income taxes | 48,379 | 128,455 | 88,174 | 168,434 | 43,998 | |||||||||||||||
Provision for income taxes | 17,672 | 47,953 | 37,956 | 63,175 | 17,244 | |||||||||||||||
|
|
|
|
|
|
|
|
|
| |||||||||||
Net income | $ | 30,707 | $ | 80,502 | $ | 50,218 | $ | 105,259 | $ | 26,754 | ||||||||||
|
|
|
|
|
|
|
|
|
| |||||||||||
Income per common share: | ||||||||||||||||||||
Basic | $ | 0.66 | $ | 1.78 | $ | 1.12 | $ | 2.37 | $ | 0.61 | ||||||||||
Diluted | $ | 0.65 | $ | 1.75 | $ | 1.12 | $ | 2.34 | $ | 0.60 | ||||||||||
Weighted average common shares outstanding, basic | 46,535.6 | 45,217.6 | 44,723.1 | 44,432.4 | 44,049.7 | |||||||||||||||
Weighted average common shares outstanding, diluted | 47,236.7 | 45,877.4 | 45,036.0 | 45,036.5 | 44,677.5 | |||||||||||||||
- 49 -
| Year Ended December 31, | ||||||||||||||||||||
| 2011 | 2010 | 2009 | 2008 | 2007 | ||||||||||||||||
| (in thousands) | ||||||||||||||||||||
Selected Cash Flow and Other Financial Data: | ||||||||||||||||||||
Net income | $ | 30,707 | $ | 80,502 | $ | 50,218 | $ | 105,259 | $ | 26,754 | ||||||||||
Depreciation, depletion, impairment and amortization | 388,699 | 276,281 | 273,227 | 206,316 | 172,054 | |||||||||||||||
Other non-cash items | 55,102 | 101,079 | 132,885 | 109,376 | 40,938 | |||||||||||||||
Change in assets and liabilities | 4,840 | (10,674 | ) | 24,414 | (18,004 | ) | 11,707 | |||||||||||||
|
|
|
|
|
|
|
|
|
| |||||||||||
Net cash provided by operating activities | $ | 479,348 | $ | 447,188 | $ | 480,744 | $ | 402,947 | $ | 251,453 | ||||||||||
|
|
|
|
|
|
|
|
|
| |||||||||||
Capital expenditures(3) (4) | $ | 987,341 | $ | 473,268 | $ | 406,420 | $ | 601,115 | $ | 443,678 | ||||||||||
|
|
|
|
|
|
|
|
|
| |||||||||||
| (1) | Oil and gas production revenues include the effects of cash flow hedging transactions. |
| (2) | Non-cash stock-based compensation expense is presented herein as a separate line item but is combined with general and administrative expense in the Consolidated Statements of Operations for a total of $66.8 million, $57.8 million, $54.4 million, $57.2 million and $42.2 million for the years ended December 31, 2011, 2010, 2009, 2008 and 2007, respectively. This separate presentation is a non-GAAP measure. Management believes the separate presentation of the non-cash component of general and administrative expense is useful because the cash portion provides a better understanding of our required cash for general and administrative expense. We also believe that this disclosure allows for a more accurate comparison to our peers, which may have higher or lower stock-based compensation expense. |
| (3) | Excludes future reclamation liability accruals of $12.1 million, $1.3 million, negative $1.2 million, $8.2 million and $1.3 million for the years ended December 31, 2011, 2010, 2009, 2008 and 2007, respectively, and includes exploration, dry hole and abandonment costs, which are expensed under successful efforts accounting, of $21.0 million, $38.2 million, $35.9 million, $14.9 million and $29.0 million for the years ended December 31, 2011, 2010, 2009, 2008 and 2007, respectively. Also includes furniture, fixtures and equipment costs of $8.9 million, $2.1 million, $2.1 million, $4.9 million and $4.6 million for the years ended December 31, 2011, 2010, 2009, 2008 and 2007, respectively. |
| (4) | Not deducted from the amount are $2.0 million, $2.9 million, $3.7 million, $2.4 million and $96.5 million of proceeds received principally from the sale of interests in oil and gas properties during the years ended December 31, 2011, 2010, 2009, 2008 and 2007, respectively. |
| As of December 31, | ||||||||||||||||||||
| 2011 | 2010 | 2009 | 2008 | 2007 | ||||||||||||||||
| (in thousands) | ||||||||||||||||||||
Balance Sheet Data: | ||||||||||||||||||||
Cash and cash equivalents | $ | 57,331 | $ | 58,690 | $ | 54,405 | $ | 43,063 | $ | 60,285 | ||||||||||
Other current assets | 189,012 | 148,958 | 125,634 | 270,311 | 71,142 | |||||||||||||||
Oil and natural gas properties, net of accumulated depreciation, depletion, amortization and impairment | 2,383,196 | 1,796,288 | 1,639,212 | 1,548,633 | 1,182,664 | |||||||||||||||
Other property and equipment, net of depreciation | 23,568 | 15,531 | 14,444 | 13,186 | 10,865 | |||||||||||||||
Oil and natural gas properties held for sale, net of accumulated depreciation, depletion, amortization and impairment | 0 | 0 | 5,604 | 0 | 2,303 | |||||||||||||||
Other assets | 34,823 | 19,033 | 26,824 | 119,300 | 2,428 | |||||||||||||||
|
|
|
|
|
|
|
|
|
| |||||||||||
Total assets | $ | 2,687,930 | $ | 2,038,500 | $ | 1,866,123 | $ | 1,994,493 | $ | 1,329,687 | ||||||||||
|
|
|
|
|
|
|
|
|
| |||||||||||
Current liabilities | $ | 233,198 | $ | 165,957 | $ | 153,292 | $ | 225,794 | $ | 139,568 | ||||||||||
Long-term debt | 882,240 | 404,399 | 402,250 | 407,411 | 274,000 | |||||||||||||||
Other long-term liabilities | 353,654 | 327,182 | 282,026 | 262,055 | 142,608 | |||||||||||||||
Stockholders’ equity | 1,218,838 | 1,140,962 | 1,028,555 | 1,099,233 | 773,511 | |||||||||||||||
|
|
|
|
|
|
|
|
|
| |||||||||||
Total liabilities and stockholders’ equity | $ | 2,687,930 | $ | 2,038,500 | $ | 1,866,123 | $ | 1,994,493 | $ | 1,329,687 | ||||||||||
|
|
|
|
|
|
|
|
|
| |||||||||||
- 50 -
| Item 7. | Management’s Discussion and Analysis of Financial Condition and Results of Operations |
Introduction
The following discussion and analysis should be read in conjunction with the “Selected Financial Data” and the accompanying consolidated financial statements and related notes included elsewhere in this Annual Report on Form 10-K. This section and other parts of this Annual Report on Form 10-K contain forward-looking statements that involve risks and uncertainties. See the “Cautionary Note Regarding Forward-Looking Statements” at the beginning of this Annual Report on Form 10-K. Forward-looking statements are not guarantees of future performance and our actual results may differ significantly from the results discussed in the forward-looking statements. Factors that might cause such differences include, but are not limited to, those discussed in the subsection entitled “Risk Factors” above, which are incorporated herein by reference. We assume no obligation to revise or update any forward-looking statements for any reason, except as required by law.
Overview
We explore for and develop oil and natural gas in the Rocky Mountain region of the United States. We seek to build stockholder value through profitable growth in reserves and production, which we expect will include investing in and profitably developing key existing development programs as well as growth through exploration and acquisitions. We seek high quality exploration and development projects with potential for providing long-term drilling inventories that generate high returns. Substantially all of our revenues are generated through the sale of oil and natural gas production and NGLs recovery at market prices and from the settlement of commodity hedges.
We were formed in January 2002 and are incorporated in the State of Delaware. In December 2004, we completed our initial public offering of 14,950,000 shares of our common stock at a price to the public of $25.00 per share. Since inception, we have built our portfolio of exploration and development properties primarily through acquisitions where we seek to add value through our geologic and operational expertise. Our acquisitions have included key assets in the Piceance (Colorado) Uinta (Utah), Denver-Julesburg (Colorado and Wyoming), Powder River (Wyoming) and Wind River (Wyoming) Basins in the Rockies.
We are committed to exploring for, developing and producing oil and natural gas in a responsible manner. We work diligently with environmental, wildlife and community organizations to ensure that our exploration and development activities are designed with all stakeholders in mind.
While there are currently no unannounced agreements for the acquisition of any material businesses or assets, future acquisitions could have a material impact on our financial condition and results of operations by increasing our proved reserves, production, and revenues as well as expenses and future capital expenditures. We currently anticipate that we would finance any future acquisitions with available borrowings under our Amended Credit Facility, other indebtedness, and/or debt, equity or equity-linked securities. Our prior acquisitions and capital expenditures were financed with a combination of funding from the sale of our equity securities, our Amended Credit Facility, other debt financing and cash flows from operations.
Because of our rapid growth through acquisitions and, more recently, development of our properties, our historical results of operations and period-to-period comparisons of these results and certain financial data may not be meaningful. In addition past results are not indicative of future results.
- 51 -
The following table summarizes the estimated net proved reserves and related Standardized Measure for the years indicated. The Standard Measure is not intended to represent the current market value of our estimated oil and natural gas reserves.
| Year Ended December 31, | ||||||||||||
| 2011 | 2010 | 2009 | ||||||||||
Estimated net proved reserves (Bcfe) | 1,364.7 | 1,118.3 | 964.8 | |||||||||
Standardized Measure(1) (in millions) | $ | 1,616.1 | $ | 1,132.4 | $ | 590.8 | ||||||
| (1) | December 31, 2011 was based on average prices of $3.93 CIG for natural gas and $92.71 WTI for oil using the current SEC requirements. December 31, 2010 was based on average prices of $3.95 CIG for natural gas and $75.96 WTI for oil using the current SEC requirements. December 31, 2009 was based on average prices of $3.04 CIG for natural gas and $57.65 WTI for oil using the current SEC requirements. |
The following table summarizes the average sales prices received for natural gas and oil, before the effects of hedging contracts, for the years indicated:
| Year Ended December 31, | ||||||||||||
| 2011 | 2010 | 2009 | ||||||||||
Natural gas (Mcf) | $ | 5.71 | $ | 5.26 | $ | 3.86 | ||||||
Oil (Bbl) | $ | 81.97 | $ | 67.93 | $ | 49.56 | ||||||
The following table summarizes the average sales prices received for natural gas and oil, after the effects of hedging contracts, for the years indicated:
| Year Ended December 31, | ||||||||||||
| 2011 | 2010 | 2009 | ||||||||||
Natural gas (Mcf) | $ | 6.46 | $ | 6.74 | $ | 6.96 | ||||||
Oil (Bbl) | $ | 80.63 | $ | 69.91 | $ | 59.03 | ||||||
Commodity prices, particularly in the Rockies, are inherently volatile and are influenced by many factors outside of our control. We plan our activities and capital budget using what we believe to be conservative sales price assumptions and our existing hedge position. Our strategic objective is to hedge 50% to 70% of our anticipated production on a forward 12-month basis using a combination of swaps, cashless collars and other financial derivative instruments. We focus our efforts on increasing oil and natural gas reserves and production while controlling costs at a level that is appropriate for long-term operations. Our future earnings and cash flows are dependent on our ability to manage our revenues and overall cost structure to a level that allows for profitable production.
Like all oil and gas exploration and production companies, we face the challenge of natural production declines. As initial reservoir pressures are depleted, oil and gas production from a typical well naturally decreases. Thus, an oil and gas exploration and production company depletes part of its asset base with each unit of oil or natural gas it produces. We attempt to overcome this natural decline by drilling to find additional reserves and acquiring more reserves than we produce. Our future growth will depend on our ability to continue to add reserves in excess of production. We will maintain our focus on costs to add reserves through drilling and acquisitions as well as the costs necessary to produce such reserves. Our ability to add reserves through drilling is dependent on our capital resources and can be limited by many factors, including our ability to timely obtain drilling permits and regulatory approvals. See “ —Trends and Uncertainties—Regulatory Trends” below. The permitting and approval process has been more difficult in recent years than in the past due to more stringent rules, such as those enacted by the Colorado Oil and Gas Conservation Commission (“COGCC”) in 2009, increased activism from environmental and other groups, which has extended the time it takes us to receive permits, and other necessary approvals. Because of our relatively small size and concentrated property base, we
- 52 -
can be disproportionately disadvantaged by delays in obtaining or failing to obtain drilling approvals compared to companies with larger or more dispersed property bases. As a result, we may be less able to shift drilling activities to areas where permitting may be easier, and we have fewer properties over which to spread the costs related to complying with these regulations and the costs or foregone opportunities resulting from delays.
Results of Operations
The following table sets forth selected operating data for the periods indicated:
Year Ended December 31, 2011 Compared with Year Ended December 31, 2010
| Year Ended December 31, | Increase (Decrease) | |||||||||||||||
| 2011 | 2010 | Amount | Percent | |||||||||||||
| ($ in thousands, except per unit data) | ||||||||||||||||
Operating Results: | ||||||||||||||||
Operating and other revenues | ||||||||||||||||
Oil and gas production | $ | 780,751 | $ | 708,452 | $ | 72,299 | 10 | % | ||||||||
Commodity derivative loss | (14,263 | ) | (10,579 | ) | (3,684 | ) | (35 | )% | ||||||||
Other | 4,873 | 591 | 4,282 | 725 | % | |||||||||||
|
|
|
|
|
| |||||||||||
Total operating and other revenues | $ | 771,361 | $ | 698,464 | $ | 72,897 | 10 | % | ||||||||
|
|
|
|
|
| |||||||||||
Operating expenses | ||||||||||||||||
Lease operating expense | 56,603 | 52,040 | 4,563 | 9 | % | |||||||||||
Gathering, transportation and processing expense | 93,423 | 69,089 | 24,334 | 35 | % | |||||||||||
Production tax expense | 37,498 | 32,738 | 4,760 | 15 | % | |||||||||||
Exploration expense | 3,645 | 9,121 | (5,476 | ) | (60 | )% | ||||||||||
Impairment, dry hole costs and abandonment expense | 117,599 | 44,664 | 72,935 | 163 | % | |||||||||||
Depreciation, depletion and amortization | 288,421 | 260,665 | 27,756 | 11 | % | |||||||||||
General and administrative expense(1) | 47,744 | 40,884 | 6,860 | 17 | % | |||||||||||
Non-cash stock-based compensation expense(1) | 19,036 | 16,908 | 2,128 | 13 | % | |||||||||||
|
|
|
|
|
| |||||||||||
Total operating expenses | $ | 663,969 | $ | 526,109 | $ | 137,860 | 21 | % | ||||||||
|
|
|
|
|
| |||||||||||
Production Data: | ||||||||||||||||
Natural gas (MMcf) | 97,856 | 89,964 | 7,892 | 9 | % | |||||||||||
Oil (MBbls) | 1,490 | 1,089 | 401 | 37 | % | |||||||||||
Combined volumes (MMcfe) | 106,796 | 96,498 | 10,298 | 11 | % | |||||||||||
Daily combined volumes (MMcfe/d) | 293 | 264 | 29 | 11 | % | |||||||||||
Average Prices(2): | ||||||||||||||||
Natural gas (per Mcf)(4) | $ | 6.46 | $ | 6.74 | $ | (0.28 | ) | (4 | )% | |||||||
Oil (per Bbl) | 80.63 | 69.91 | 10.72 | 15 | % | |||||||||||
Combined (per Mcfe) | 7.05 | 7.07 | (0.02 | ) | 0 | % | ||||||||||
Average Costs (per Mcfe): | ||||||||||||||||
Lease operating expense | $ | 0.53 | $ | 0.54 | $ | (0.01 | ) | (2 | )% | |||||||
Gathering, transportation and processing expense | 0.87 | 0.72 | 0.15 | 21 | % | |||||||||||
Production tax expense | 0.35 | 0.34 | 0.01 | 3 | % | |||||||||||
Depreciation, depletion and amortization | 2.70 | 2.70 | 0.00 | 0 | % | |||||||||||
General and administrative expense(3) | 0.45 | 0.42 | 0.03 | 7 | % | |||||||||||
| (1) | Non-cash stock-based compensation expense is presented herein as a separate line item but is combined with general and administrative expense in the Consolidated Statements of Operations for a total of $66.8 million and $57.8 million for the years ended December 31, 2011 and 2010, respectively. This separate presentation is a non-GAAP measure. Management believes the separate presentation of the non-cash |
- 53 -
| component of general and administrative expense is useful because the cash portion provides a better understanding of our required cash for general and administrative expense. We also believe that this disclosure allows for a more accurate comparison to our peers, which may have higher or lower stock-based compensation expense. |
| (2) | Average prices shown in the table are net of the effects of all of our realized commodity hedging transactions. Our average realized price calculation includes all cash settlements for commodity derivatives, whether or not they qualify for hedge accounting. As a result of our realized hedging transactions, natural gas production revenues and oil production revenues increased (decreased) by the following (in millions): |
| Year Ended December 31, | ||||||||
| 2011 | 2010 | |||||||
Natural gas production revenues | $ | 73.9 | $ | 133.2 | ||||
Oil production revenues | $ | (2.0 | ) | $ | 2.2 | |||
Before the effects of hedging, the average prices we received for natural gas and oil were as follows:
| Year Ended December 31, | ||||||||
| 2011 | 2010 | |||||||
Natural gas (per Mcf)(4) | $ | 5.71 | $ | 5.26 | ||||
Oil (per Bbl) | $ | 81.97 | $ | 67.93 | ||||
| (3) | Excludes non-cash stock-based compensation expense as described in footnote (1) above. Average costs per Mcfe for general and administrative expense, including non-cash stock-based compensation expense, as presented in the Consolidated Statements of Operations, were $0.63 and $0.60 for the years ended December 31, 2011 and 2010, respectively. |
| (4) | Natural gas average prices include the effect of NGL related revenue. |
Production Revenues and Volumes. Production revenues increased to $780.8 million for the year ended December 31, 2011 from $708.5 million for the year ended December 31, 2010 due to an 11% increase in production and a 1% decrease in oil and natural gas prices on a per Mcfe basis after the effects of realized cash flow hedges. The effects of realized hedges only include settlements from hedging instruments that were designated as cash flow hedges and exclude those that do not qualify, or were not designated, as cash flow hedges such as basis only and NGL swaps. The settlements from hedging instruments that were not designated as cash flow hedges are included in the line item “Commodity derivative loss” within operating revenues in the Consolidated Statements of Operations. See below for more information related to the Commodity derivative loss line item. The net increase in production added approximately $75.3 million of production revenues, and the decrease in average price reduced production revenues by approximately $3.0 million.
- 54 -
Total production volumes increased to 106.8 Bcfe for the year ended December 31, 2011 from 96.5 Bcfe for the year ended December 31, 2010 due to increased production in the Piceance, Uinta and Powder River Basins and production from the DJ Basin wells we acquired in August 2011. The increased production was partially offset by a decrease in production in the Wind River Basin. Additional information concerning production is in the following table:
| Year Ended December 31, 2011 | Year Ended December 31, 2010 | % Increase (Decrease) | ||||||||||||||||||||||||||||||||||
| Oil | Natural Gas | Total | Oil | Natural Gas | Total | Oil | Natural Gas | Total | ||||||||||||||||||||||||||||
| (MBbls) | (MMcf) | (MMcfe) | (MBbls) | (MMcf) | (MMcfe) | (MBbls) | (MMcf) | (MMcfe) | ||||||||||||||||||||||||||||
Piceance Basin | 540 | 45,606 | 48,846 | 563 | 44,736 | 48,114 | (4 | )% | 2 | % | 2 | % | ||||||||||||||||||||||||
Uinta-West Tavaputs | 54 | 31,719 | 32,043 | 34 | 24,021 | 24,225 | 59 | % | 32 | % | 32 | % | ||||||||||||||||||||||||
Uinta Oil | 779 | 1,575 | 6,249 | 438 | 877 | 3,505 | 78 | % | 80 | % | 78 | % | ||||||||||||||||||||||||
DJ Basin | 47 | 270 | 552 | 0 | 0 | 0 | nm | * | nm | * | nm | * | ||||||||||||||||||||||||
Powder River-CBM | 0 | 13,223 | 13,223 | 0 | 13,386 | 13,386 | 0 | % | (1 | )% | (1 | )% | ||||||||||||||||||||||||
Powder River Deep | 40 | 104 | 344 | 22 | 4 | 136 | 82 | % | 2500 | % | 153 | % | ||||||||||||||||||||||||
Wind River Basin | 22 | 5,208 | 5,340 | 22 | 6,770 | 6,902 | 0 | % | (23 | )% | (23 | )% | ||||||||||||||||||||||||
Other | 8 | 151 | 199 | 10 | 170 | 230 | (20 | )% | (11 | )% | (13 | )% | ||||||||||||||||||||||||
|
|
|
|
|
|
|
|
|
|
|
| |||||||||||||||||||||||||
Total | 1,490 | 97,856 | 106,796 | 1,089 | 89,964 | 96,498 | 37 | % | 9 | % | 11 | % | ||||||||||||||||||||||||
|
|
|
|
|
|
|
|
|
|
|
| |||||||||||||||||||||||||
| * | Not meaningful. |
The production increase in the Piceance Basin was primarily the result of our initial sales from 119 new gross wells during 2011. The production increase in the Uinta Basin resulted primarily from our development activities in the West Tavaputs area with initial sales from 86 new gross wells during 2011. In addition, we had increased production resulting from our Uinta Oil Program at Blacktail Ridge and Lake Canyon, which had initial sales from 33 new gross wells during 2011, as well as the acquisition of East Bluebell in June 2011, which added 610 MMcfe of additional production. The production increase in the Powder River Basin was due to increased oil production in the Powder River Basin due to initial sales on 20 new gross conventional wells in 2011, offset by natural production declines in our natural gas producing coalbed methane fields with no significant drilling or recompletion activities to offset these declines. Further, the producing wells we acquired within the DJ Basin field in August 2011, added to our production increases during 2011. The production decrease in the Wind River Basin was due to natural production declines with no significant drilling or recompletion activities to offset these declines.
Hedging Activities. In 2011, approximately 67% of our natural gas volumes (excluding basis-only swaps, which were equivalent to 7% of our natural gas volumes), 53% of our NGL related recoveries and 66% of our oil volumes were subject to financial hedges, which resulted in an increase in natural gas revenues of $73.9 million and a decrease in oil revenues of $2.0 million after settlements for all commodity derivatives, including basis-only and NGL swaps. In 2010, approximately 74% of our natural gas volumes (excluding basis-only swaps, which were equivalent to 12% of our natural gas volumes), 54% of NGL related volumes and 53% of our oil volumes were subject to financial hedges, which resulted in an increase in natural gas revenues of $133.2 million and an increase in oil revenues of $2.2 million after settlements for all commodity derivatives, including basis-only swaps. The decrease in revenues related to hedging natural gas resulted from the expiration of hedges entered into at higher prices and our inability to enter into new hedges at those prices because natural gas prices have fallen since we entered into those hedges. This trend is expected to continue based on future prices and hedge quotes.
Commodity Derivative Loss.The “Commodity derivative loss” line item on the Consolidated Statements of Operations is comprised of ineffectiveness on cash flow hedges and realized and unrealized gains and losses on hedges that do not qualify for cash flow hedge accounting or were not designated as cash flow hedges. Ineffectiveness on cash flow hedges relates to slight differences between the contracted location and the actual delivery location. Unrealized gains and losses represent the change in the fair value of the derivative instruments
- 55 -
that do not qualify for cash flow hedge accounting, which includes our basis only swaps and NGL swaps. As those instruments settle, their settlement will be presented as realized gains and losses within this same line item. In addition to the basis only and NGL swaps, we had certain cash flow hedges that were de-designated in 2011 and settled prior to December 31, 2011. As a result, their settlements were reflected in realized gains and losses for the year ended December 31, 2011.
Commodity derivative loss decreased to a loss of $14.3 million for the year ended December 31, 2011 from a loss of $10.6 million for the year ended December 31, 2010 primarily due to the increase in realized losses and the decrease in unrealized gains resulting from the change in fair value of our basis only swaps as of December 31, 2011.
The table below summarizes the realized and unrealized gains and losses we recognized in commodity derivative loss for the periods indicated:
| Year Ended December 31, | ||||||||
| 2011 | 2010 | |||||||
| (in thousands) | ||||||||
Realized losses on derivatives not designated as cash flow hedges | $ | (28,054 | ) | $ | (26,166 | ) | ||
Unrealized ineffectiveness gains (losses) recognized on derivatives designated as cash flow hedges | 1,026 | (2,256 | ) | |||||
Unrealized gains on derivatives not designated as cash flow hedges | 12,765 | 17,843 | ||||||
|
|
|
| |||||
Total commodity derivative loss | $ | (14,263 | ) | $ | (10,579 | ) | ||
|
|
|
| |||||
Effective January 1, 2012, we elected to discontinue hedge accounting prospectively. Consequently, as of January 1, 2012 we will no longer designate any hedges as cash flow hedges and we will de-designate all commodity hedge instruments that were previously designated as cash flow hedges. As such, subsequent to January 1, 2012, we will recognize unrealized gains and losses from prospective changes in commodity derivative fair values immediately in the consolidated statement of operations rather than deferring any such amounts in accumulated other comprehensive income. This change in reporting will have no impact on our reported cash flows, although future results of operations will be affected by unrealized gains and losses, which fluctuate with volatile oil and gas prices. We expect to reclassify $50.8 million of the net after-tax derivative loss from AOCI to earnings during the next 12 months.
Other Operating Revenues. Other operating revenues increased to $4.9 million for the year ended December 31, 2011 from $0.6 million for the year ended December 31, 2010. Other operating revenues for 2011 primarily consisted of $2.9 million of income from gathering, compression and salt-water disposal fees received from third parties and $2.0 million in net gains realized from the sale and exchange of properties. Other operating revenues for 2010 consisted of $2.6 million of income from gathering, compression and salt-water disposal fees received from third parties offset by $2.0 million in net losses realized from the sale and exchange of properties.
Lease Operating Expense. Lease operating expense decreased to $0.53 per Mcfe for the year ended December 31, 2011 from $0.54 per Mcfe for the year ended December 31, 2010. The year ended December 31, 2010 included $2.4 million of nonrecurring remediation efforts related to a minor condensate leak at the Dry Canyon Compressor Station in the Uinta Basin, which increased lease operating expense by $0.02 per Mcfe. The drilling program in our Blacktail Ridge field in the Uinta Basin throughout 2011 has increased water production. The additional trucking and disposal costs associated with this water production are primarily responsible for the overall increase in lease operating expense.
Gathering, Transportation and Processing Expense. Gathering, transportation and processing expense increased to $0.87 per Mcfe for the year ended December 31, 2011 from $0.72 per Mcfe for the year ended December 31, 2010. Increased production from the West Tavaputs field within the Uinta Basin has led to an increase in volumes gathered, transported and processed under higher cost structured agreements, that resulted in
- 56 -
higher costs on a per unit basis. As a result, gathering, transportation and processing expense increased approximately $0.10 per Mcfe for the year ended December 31, 2011 compared to the year ended December 31, 2010. Firm transportation agreements related to West Tavaputs that became effective in late July 2011 for the Ruby Pipeline and Wyoming Interstate Company Pipeline were the primary reason for this increase. The remaining increase in gathering, transportation and processing expense on a per unit basis related to new gathering and transportation agreements in the Blacktail Ridge field and the Piceance Basin, which added approximately $0.02 per Mcfe for each area. In 2011, we incurred one-time charges of $0.01 per Mcfe related to gathering and processing agreements in the Paradox and Powder River Basins.
We have entered into long-term firm transportation contracts for a portion of our production to guarantee capacity on major pipelines and reduce the risk and impact related to possible production curtailments that may arise due to limited pipeline capacity. The majority of our long-term firm transportation agreements are for gas production in the Piceance and Uinta Basins where we expect to allocate a portion of our capital expenditure programs in future years. In addition, we have entered into long-term firm processing contracts on a portion of our production in the Piceance and Uinta Basins. Included in gathering, transportation and processing expense are $0.33 and $0.19 per Mcfe of firm transportation and gathering expense for the years ended December 31, 2011 and 2010, respectively, and $0.05 and $0.04 per Mcfe of firm processing expense from long-term contracts for years ended December 31, 2011 and 2010 respectively. The increase in firm transportation and gathering expense to $0.33 per Mcfe for the year ended December 31, 2011 compared with $0.18 per Mcfe for the year ended December 31, 2010 was the result of additional long-term contracts executed with various pipelines for our natural gas production in the Piceance and Uinta Basins as mentioned above.
Production Tax Expense. Total production taxes increased to $37.5 million for the year ended December 31, 2011 from $32.7 million for the year ended December 31, 2010. The increase in production taxes is primarily related to an increase in production revenues during the year ended December 31, 2011. Production taxes are primarily based on the wellhead values of production, which exclude gains and losses associated with hedging activities. Production tax expense for the year ended December 31, 2010 included a one-time reduction of $2.2 million related to amended 2004 through 2009 State of Utah annual severance tax calculations. Production taxes as a percentage of natural gas and oil sales before hedging adjustments was 5.5% for the year ended December 31, 2011 compared with 6.0% for the year ended December 31, 2010, which included a reduction of 0.4% related to the nonrecurring item associated with Utah severance taxes.
Production tax rates vary across the different areas in which we operate. As the proportion of our production changes from area to area, our average production tax rate will vary depending on the quantities produced from each area and the production tax rates in effect for those areas. The decrease in the overall production tax rate is consistent with our production increase throughout 2011 from states with lower production tax rates.
Exploration Expense. Exploration expense decreased to $3.6 million for the year ended December 31, 2011 from $9.1 million for the year ended December 31, 2010. Exploration expense for the year ended December 31, 2011 consisted of $2.7 million for seismic programs and $0.9 million for delay rentals. Exploration expense for the year ended December 31, 2010 consisted of $3.5 million for seismic programs, $1.1 million for delay rentals, $0.1 million related to the evaluation of non-acquired assets and $4.4 million for one scientific well drilled for data gathering purposes.
Impairment, Dry Hole Costs and Abandonment Expense. Our impairment, dry hole costs and abandonment expense increased to $117.6 million for the year ended December 31, 2011 from $44.7 million for the year ended December 31, 2010. For the year ended December 31, 2011, impairment expense was $100.3 million, abandonment expense was $3.9 million and dry hole costs were $13.4 million. For the year ended December 31, 2010, impairment expense was $15.6 million, abandonment expense was $2.6 million and dry hole costs were $26.5 million.
- 57 -
We evaluate the impairment of our proved oil and gas properties on a property-by-property basis whenever events or changes in circumstances indicate a property’s carrying amount may not be recoverable. If the carrying amount exceeds the property’s estimated fair value, we will adjust the carrying amount of the property to fair value through a charge to impairment expense. As a result of declining natural gas prices, we recorded a $75.2 million impairment charge regarding proved oil and gas properties within the CBM fields of the Powder River Basin and a $7.6 million impairment charge regarding proved oil and gas properties within the Wallace Creek field of the Wind River Basin for the year ended December 31, 2011. For the year ended December 31, 2010, we did not record any impairment charges on proved oil and gas properties.
Unproved oil and gas properties are also assessed periodically for impairment on a property-by-property basis based on remaining lease terms, drilling results, reservoir performance, commodity price outlooks or future plans to develop existing acreage. During the year ended December 31, 2011, we recorded a $17.5 million impairment charge regarding unproved oil and gas properties within various exploration projects. This non-cash impairment charge was primarily a result of unfavorable market conditions as well as uneconomic drilling results in exploratory areas where we currently have no plans to develop or evaluate the remaining acreage. For the year ended December 31, 2010, we recorded a $15.6 million impairment charge regarding unproved oil and gas properties within various exploration projects.
We generally expect impairments of unproved properties to be more likely to occur in periods of low commodity prices because we will be less likely to devote capital to exploration activities. We continue to review our acreage position and future drilling plans based on the current price environment. If our attempts to market interests in certain properties to industry partners are unsuccessful, additional leasehold impairments and abandonments in exploration prospects may be recorded.
We account for oil and gas exploration and production activities using the successful efforts method of accounting under which we capitalize exploratory well costs until a determination is made as to whether or not the wells have found proved reserves. Exploratory wells that discover potentially economic reserves in areas where a major capital expenditure would be required before production could begin and where the economic viability of that major capital expenditure depends upon the successful completion of further exploratory work in the area remain capitalized if the well finds a sufficient quantity of reserves to justify its completion as a producing well, and we are making sufficient progress assessing the reserves and the economic and operating viability of the project. If proved reserves are not assigned to an exploratory well, the costs of drilling the well are charged to expense. Otherwise, the costs remain capitalized and are depleted as production occurs. As of December 31, 2011, there were no exploratory well costs included in unproved oil and gas properties that had been capitalized for a period greater than one year since the completion of drilling.
Dry hole costs of $13.4 million for the year ended December 31, 2011 were associated with one uneconomic exploratory well in the McRae Gap prospect of the Wind River Basin and two unsuccessful exploratory wells within the northern DJ Basin on acreage acquired prior to our 2011 DJ Basin acquisition. Dry hole costs of $26.5 million for the year ended December 31, 2010 were associated with seven unsuccessful exploratory wells within the Paradox Basin and one unsuccessful exploratory well in each of the Uinta and Big Horn basins.
Depreciation, Depletion and Amortization.DD&A was $288.4 million for the year ended December 31, 2011 compared with $260.7 million for the year ended December 31, 2010. The increase of $27.7 million was a result of increased production during the year ended December 31, 2011 compared with the year ended December 31, 2010. The weighted average DD&A rate for each of the years ended December 31, 2011 and 2010 was $2.70 per Mcfe. Under successful efforts accounting, DD&A expense is separately computed for each producing area based on geologic and reservoir delineation. The capital expenditures for proved properties for each area compared to the proved reserves corresponding to each producing area determine a weighted average DD&A rate for current production. Future DD&A rates will be adjusted to reflect future capital expenditures and proved reserve changes in specific areas.
- 58 -
General and Administrative Expense. General and administrative expense, excluding non-cash stock-based compensation, increased to $47.7 million for the year ended December 31, 2011 from $40.9 million for the year ended December 31, 2010. General and administrative expense, excluding non-cash stock-based compensation, is a non-GAAP measure. See Note 1 to the table on page 47 for a reconciliation and explanation. This increase was primarily due to a 12% increase in headcount in 2011, which increased employee compensation and benefits. On a per Mcfe basis, general and administrative expense, excluding non-cash stock based compensation, increased to $0.45 in 2011 from $0.42 in 2010.
Non-cash stock-based compensation expense was $19.0 million for the year ended December 31, 2011 compared with $16.9 million for the year ended December 31, 2010. Non-cash stock-based compensation expense for 2011 and 2010 related primarily to the vesting of our stock option awards and nonvested shares of common stock granted to employees.
The components of non-cash stock-based compensation expense for 2011 and 2010 are shown in the following table:
| Year Ended December 31, | ||||||||
| 2011 | 2010 | |||||||
| (in thousands) | ||||||||
Stock options and nonvested equity shares of common stock | $ | 18,100 | $ | 16,016 | ||||
Shares issued for 401(k) plan | 629 | 579 | ||||||
Shares issued for directors’ fees | 307 | 313 | ||||||
|
|
|
| |||||
Total | $ | 19,036 | $ | 16,908 | ||||
|
|
|
| |||||
Interest Expense. Interest expense increased to $58.6 million for the year ended December 31, 2011 from $44.3 million for the year ended December 31, 2010. The increase was primarily due to an increase in our weighted average outstanding debt, including our Amended Credit Facility, Convertible Notes, 9.875% Senior Notes and 7.625% Senior Notes, to $587.4 million for the year ended December 31, 2011 from $403.4 million for the year ended December 31, 2010. The increase in our weighted average outstanding debt was primarily due to the issuance of our $400.0 million aggregate principal amount of 7.625% Senior Notes on September 27, 2011 and an increase in the outstanding debt balance on our Amended Credit Facility during the year ended December 31, 2011. However, our effective interest rate decreased to 10.2% for the year ended December 31, 2011 compared with 12.1% for the year ended December 31, 2010.
Interest cost is capitalized as a component of property cost for significant exploration and development projects that require greater than six months to be readied for their intended use. We capitalized interest costs of $1.4 million and $4.2 million for the years ended December 31, 2011 and 2010, respectively. For the year ended December 31, 2011, we had fewer projects in progress as compared with the year ended December 31, 2010, which resulted in a lower amount of interest costs that were capitalized during the period.
Income Tax Expense. Income tax expense totaled $17.7 million and $48.0 million for the years ended December 31, 2011 and 2010, resulting in effective tax rates of 36.5% and 37.3% in 2011 and 2010, respectively. Our effective tax rate differs from the federal statutory rate primarily because we recorded stock-based compensation expense and other operating expenses that are not deductible for income tax purposes as well as the effect of state income taxes. The effective tax rate decrease from 2010 to 2011 was primarily the result of a net reduction in permanent differences affecting the tax rate calculation, principally the increase in tax deductible compensation related to incentive stock options. Additionally, a greater proportion of our operating revenue was attributable to lower tax rate jurisdictions, thereby decreasing the overall statutory tax rate. The effect of this rate decrease on our prior year net deferred tax liability was included in income tax expense for 2011. At December 31, 2011, we had approximately $125.3 million of federal tax net operating loss carryforwards, or “NOLs”, which expire through 2031. We also had a federal alternative minimum tax credit carryforward of $0.1million, which has no expiration date. We believe it is more likely than not that we will use these tax attributes to
- 59 -
offset and reduce current tax liabilities in future years. During 2011, we booked a valuation allowance of $4.2 million against a deferred tax asset of the same amount for state income tax credit carryforwards. The valuation allowance has no impact on our income tax expense, as the credits were not recorded as deferred tax assets in prior years. We believe it is more likely than not that this deferred tax asset will not be realized.
The following table sets forth selected operating data for the periods indicated:
Year Ended December 31, 2010 Compared with Year Ended December 31, 2009
| Year Ended December 31, | Increase (Decrease) | |||||||||||||||
| 2010 | 2009 | Amount | Percent | |||||||||||||
| ($ in thousands, except per unit data) | ||||||||||||||||
Operating Results: | ||||||||||||||||
Operating and other revenues | ||||||||||||||||
Oil and gas production | $ | 708,452 | $ | 647,839 | $ | 60,613 | 9 | % | ||||||||
Commodity derivative loss | (10,579 | ) | (54,567 | ) | 43,988 | 81 | % | |||||||||
Other | 591 | 4,891 | (4,300 | ) | (88 | )% | ||||||||||
|
|
|
|
|
| |||||||||||
Total operating and other revenues | $ | 698,464 | $ | 598,163 | $ | 100,301 | 17 | % | ||||||||
|
|
|
|
|
| |||||||||||
Operating expenses | ||||||||||||||||
Lease operating expense | 52,040 | 46,492 | 5,548 | 12 | % | |||||||||||
Gathering, transportation and processing expense | 69,089 | 56,608 | 12,481 | 22 | % | |||||||||||
Production tax expense | 32,738 | 13,197 | 19,541 | 148 | % | |||||||||||
Exploration expense | 9,121 | 3,227 | 5,894 | 183 | % | |||||||||||
Impairment, dry hole costs and abandonment expense | 44,664 | 52,285 | (7,621 | ) | (15 | )% | ||||||||||
Depreciation, depletion and amortization | 260,665 | 253,573 | 7,092 | 3 | % | |||||||||||
General and administrative expense(1) | 40,884 | 37,940 | 2,944 | 8 | % | |||||||||||
Non-cash stock-based compensation expense(1) | 16,908 | 16,458 | 450 | 3 | % | |||||||||||
|
|
|
|
|
| |||||||||||
Total operating expenses | $ | 526,109 | $ | 479,780 | $ | 46,329 | 10 | % | ||||||||
|
|
|
|
|
| |||||||||||
Production Data: | ||||||||||||||||
Natural gas (MMcf) | 89,964 | 85,485 | 4,479 | 5 | % | |||||||||||
Oil (MBbls) | 1,089 | 710 | 379 | 53 | % | |||||||||||
Combined volumes (MMcfe) | 96,498 | 89,745 | 6,753 | 8 | % | |||||||||||
Daily combined volumes (MMcfe/d) | 264 | 246 | 18 | 7 | % | |||||||||||
Average Prices(2): | ||||||||||||||||
Natural gas (per Mcf)(4) | $ | 6.74 | $ | 6.96 | $ | (0.22 | ) | (3 | )% | |||||||
Oil (per Bbl) | 69.91 | 59.03 | 10.88 | 18 | % | |||||||||||
Combined (per Mcfe) | 7.07 | 7.10 | (0.03 | ) | 0 | % | ||||||||||
Average Costs (per Mcfe): | ||||||||||||||||
Lease operating expense | $ | 0.54 | $ | 0.52 | $ | 0.02 | 4 | % | ||||||||
Gathering, transportation and processing expense | 0.72 | 0.63 | 0.09 | 14 | % | |||||||||||
Production tax expense | 0.34 | 0.15 | 0.19 | 127 | % | |||||||||||
Depreciation, depletion and amortization | 2.70 | 2.83 | (0.13 | ) | (5 | )% | ||||||||||
General and administrative expense(3) | 0.42 | 0.42 | 0.00 | 0 | % | |||||||||||
| (1) | Non-cash stock-based compensation expense is presented herein as a separate line item but is combined with general and administrative expense in the Consolidated Statements of Operations for a total of $57.8 million and $54.4 million for the years ended December 31, 2010 and 2009, respectively. This separate presentation is a non-GAAP measure. Management believes the separate presentation of the non-cash component of general and administrative expense is useful because the cash portion provides a better |
- 60 -
| understanding of our required cash for general and administrative expense. We also believe that this disclosure allows for a more accurate comparison to our peers, which may have higher or lower stock-based compensation expense. |
| (2) | Average prices shown in the table are net of the effects of all of our realized commodity hedging transactions. Our average realized price calculation includes all cash settlements for commodity derivatives, whether or not they qualify for hedge accounting. As a result of our realized hedging transactions, natural gas production revenues and oil production revenues increased (decreased) by the following amounts (in millions) for the periods indicated: |
| Year Ended December 31, | ||||||||
| 2010 | 2009 | |||||||
Natural gas production revenues | $ | 133.2 | $ | 265.1 | ||||
Oil production revenues | 2.2 | 6.7 | ||||||
Before the effects of hedging, the average prices we received for natural gas and oil were as follows:
| Year Ended December 31, | ||||||||
| 2010 | 2009 | |||||||
Natural gas (per Mcf) | $ | 5.26 | $ | 3.86 | ||||
Oil (per Bbl) | 67.93 | 49.56 | ||||||
| (3) | Excludes non-cash stock-based compensation expense as described in footnote (1) above. Average costs per Mcfe for general and administrative expense, including non-cash stock-based compensation expense, as presented in the Consolidated Statements of Operations, were $0.60 and $0.61 for the years ended December 31, 2010 and 2009, respectively. |
| (4) | Natural gas average prices include the effect of NGL related revenue. |
Production Revenues and Volumes. Production revenues increased to $708.5 million for the year ended December 31, 2010 from $647.8 million for the year ended December 31, 2009 due to an 8% increase in production and a 2% increase in natural gas and oil prices on a per Mcfe basis after the effects of realized cash flow hedges. The effects of realized hedges only include settlements from hedging instruments that were designated as cash flow hedges and exclude those that do not qualify, or were not designated, as cash flow hedges such as basis only and NGL swaps. The settlements from hedging instruments that were not designated as cash flow hedges are included in the line item “Commodity derivative loss” within operating revenues in the Consolidated Statements of Operations. See below for more information related to the Commodity derivative gain (loss) line item. The net increase in production added approximately $49.6 million of production revenues, and the increase in average price increased production revenues by approximately $11.1 million.
During the year ended December 31, 2010, we realized production revenues of approximately $68.5 million, or $0.71 per Mcfe, compared with $28.8 million, or $0.32 per Mcfe, for the year ended December 31, 2009 related to NGL values received for a portion of our gas production in the Piceance Basin. There is no assurance that in the future the amount received related to NGLs resulting from the processing of natural gas will exceed the additional cost of processing or the price of natural gas. In addition, as we reduce activities in the Piceance Basin in 2010, we expect production revenues related to NGL values to decline.
- 61 -
Total production volumes for the year ended December 31, 2010 of 96.5 Bcfe increased from 89.7 Bcfe for the year ended December 31, 2009 due to increased gas production in the Piceance and Powder River Basins and increased oil production in the Uinta Basin. The increased production was partially offset by a decrease in gas production in the Uinta and Wind River Basins. Additional information concerning production is in the following table:
| Year Ended December 31, 2010 | Year Ended December 31, 2009 | % Increase (Decrease) | ||||||||||||||||||||||||||||||||||
| Oil | Natural Gas | Total | Oil | Natural Gas | Total | Oil | Natural Gas | Total | ||||||||||||||||||||||||||||
| (MBbls) | (MMcf) | (MMcfe) | (MBbls) | (MMcf) | (MMcfe) | (MBbls) | (MMcf) | (MMcfe) | ||||||||||||||||||||||||||||
Piceance Basin | 563 | 44,736 | 48,114 | 425 | 33,904 | 36,454 | 32 | % | 32 | % | 32 | % | ||||||||||||||||||||||||
Uinta Basin | 472 | 24,898 | 27,730 | 227 | 30,849 | 32,211 | 108 | % | (19 | )% | (14 | )% | ||||||||||||||||||||||||
Wind River Basin | 22 | 6,770 | 6,902 | 26 | 8,240 | 8,396 | (15 | )% | (18 | )% | (18 | )% | ||||||||||||||||||||||||
Powder River Basin | 0 | 13,386 | 13,386 | 0 | 12,081 | 12,081 | 0 | % | 11 | % | 11 | % | ||||||||||||||||||||||||
Other | 32 | 174 | 366 | 32 | 411 | 603 | 0 | % | (58 | )% | (39 | )% | ||||||||||||||||||||||||
|
|
|
|
|
|
|
|
|
|
|
| |||||||||||||||||||||||||
Total | 1,089 | 89,964 | 96,498 | 710 | 85,485 | 89,745 | 53 | % | 5 | % | 8 | % | ||||||||||||||||||||||||
|
|
|
|
|
|
|
|
|
|
|
| |||||||||||||||||||||||||
The production increase in the Piceance Basin was the result of our continued development activities, with initial sales on 161 new gross wells throughout 2010. The production increase in the Powder River Basin was the result of our continued development activities, with initial sales from 43 new gross wells throughout 2010. Although we reduced our 2010 development activities in the Powder River Basin as the result of lower natural gas prices, our production in that basin has benefited from prior years’ development programs due to the extended dewatering process of the coal bed methane wells. The production increase in oil from the Uinta Basin resulted from our ongoing development program at Blacktail Ridge and Lake Canyon with initial sales from 19 new gross wells throughout 2010. The production decrease in the Wind River Basin is due to natural production declines in our Cave Gulch, Cooper Reservoir and Wallace Creek fields with no significant drilling or recompletion activities to offset these declines. The decrease in gas production from the Uinta Basin is due to natural production declines as well as a limited development program compared to prior years in our West Tavaputs field, partially offset by higher volumes from our Blacktail Ridge/Lake Canyon development. Due to the issuance of the final EIS and ROD in the West Tavaputs field of the Uinta Basin authorizing full field development, we anticipate an overall increase in production in this basin in 2011. The increase of production in the Uinta Basin may be slightly offset by an anticipated reduction in production in the Piceance and Wind River Basins due to natural production declines and a reduced drilling schedule in those areas.
Hedging Activities. For the year ended December 31, 2010, approximately 74% of our natural gas volumes (excluding basis only swaps, which were equivalent to 12% of our natural gas volumes) and 53% of our oil volumes were subject to financial hedges, which resulted in an increase in natural gas revenues of $133.2 million and an increase in oil revenues of $2.2 million after settlements for all commodity derivatives, including basis only and NGL swaps. For the year ended December 31, 2009, approximately 79% of our natural gas volumes (excluding basis only swaps, which were equivalent to 4% of our natural gas volumes) and 52% of our oil volumes were subject to financial hedges, which resulted in an increase in natural gas revenues of $265.1 million and an increase in oil revenues of $6.7 million after settlements for all commodity derivatives, including basis only swaps. The decrease in revenues related to hedging natural gas resulted from the expiration of hedges entered into at higher prices and our inability to enter into new hedges at those prices because natural gas prices have fallen since we entered into those hedges. This trend is expected to continue based on future prices and hedge quotes.
Commodity Derivative Loss. The overall change in commodity derivative loss from a loss of $54.6 million for the year ended December 31, 2009 to a loss of $10.6 million for the year ended December 31, 2010 was primarily due to the unrealized gains resulting from the change in fair value of our basis only swaps as of December 31, 2010.
- 62 -
The table below summarizes the realized and unrealized gains and losses we recognized in commodity derivative loss for the periods indicated:
| Year Ended December 31, | ||||||||
| 2010 | 2009 | |||||||
| (in thousands) | ||||||||
Realized losses on derivatives not designated as cash flow hedges | $ | (26,166 | ) | $ | (10,902 | ) | ||
Unrealized ineffectiveness losses recognized on derivatives designated as cash flow hedges | (2,256 | ) | (5,572 | ) | ||||
Unrealized gains (losses) on derivatives not designated as cash flow hedges | 17,843 | (38,093 | ) | |||||
|
|
|
| |||||
Total commodity derivative loss | $ | (10,579 | ) | $ | (54,567 | ) | ||
|
|
|
| |||||
Other Operating Revenues. Other operating revenues decreased to $0.6 million for the year ended December 31, 2010 from $4.9 million for the year ended December 31, 2009. Other operating revenues for the year ended December 31, 2010 primarily consisted of $2.0 million in net losses realized from the sale and exchange of properties offset by $2.6 million of income from gathering, compression and salt-water disposal fees received from third parties. Other operating revenues for the year ended December 31, 2009 primarily consisted of $1.4 million in gains realized from the sale of properties as well as $3.5 million in gathering, compression and salt-water disposal fees received from third parties for the use of our facilities.
Lease Operating Expense. Lease operating expense increased to $0.54 per Mcfe for the year ended December 31, 2010 from $0.52 per Mcfe for the year ended December 31, 2009. The increase was primarily due to remediation efforts related to a condensate leak at our Dry Canyon Compressor Station in the Uinta Basin. The condensate leak was detected in March 2010 and remediation of the area resulted in an additional $2.4 million (or $0.02 per Mcfe) in lease operating expense for the year ended December 31, 2010.
Gathering, Transportation and Processing Expense. Gathering, transportation and processing expense increased to $0.72 per Mcfe for the year ended December 31, 2010 from $0.63 per Mcfe for the year ended December 31, 2009. Higher fees associated with the Rockies Express Pipeline (“REX”) contributed to the increase in expense as the final two segments of the pipeline were completed, giving us access to gas sales delivery points farther east. In addition, we recognized expense associated with the start-up of new firm contracts to gather, transport and process our production from the Powder River and Uinta Basins ahead of anticipated production increases.
Included in gathering, transportation and processing expense are $0.19 and $0.17 per Mcfe of firm transportation and gathering expense and $0.04 and $0.05 per Mcfe of firm processing expense from long-term contracts for the years ended December 31, 2010 and 2009, respectively. The increase in firm transportation expense to $0.19 per Mcfe for the year ended December 31, 2010 from $0.17 per Mcfe for the year ended December 31, 2009 was the result of additional long-term contracts executed with various pipelines for our natural gas production in the Powder River and Uinta Basins and higher fees on REX as mentioned above.
Production Tax Expense. Total production taxes increased to $32.7 million for the year ended December 31, 2010 from $13.2 million for the year ended December 31, 2009. The increase in production taxes is primarily related to an increase in production and increase in oil and natural gas prices during the year ended December 31, 2010. Production taxes are primarily based on the wellhead values of production, which exclude gains and losses associated with hedging activities. Production tax expense for the year ended December 31, 2010 included a one-time reduction of $2.2 million related to amended 2004 through 2009 State of Utah annual severance tax calculations. In 2009, we reduced our production tax expense by $5.0 million based upon amended Colorado severance tax returns for the years 2004 through 2008. The amended Colorado severance tax returns completed in 2009 were nonrecurring adjustments based on a settlement agreement with the State of Colorado relating to the severance tax computation. Our 2009 production tax expense
- 63 -
also included a decrease of $3.4 million primarily related to a surplus of ad valorem taxes withheld from 2008 based on the estimated mill levy rates compared to the actual rates. Production taxes as a percentage of oil and natural gas sales before hedging adjustments was 6.0% for the year ended December 31, 2010, which included a reduction of 0.4% related to the nonrecurring item associated with the Utah severance tax. For the year ended December 31, 2009, production taxes as a percentage of oil and natural gas sales before hedging adjustments was 3.6%, which included a reduction of 2.3% related to these nonrecurring items associated with the Colorado severance and ad valorem taxes.
Exploration Expense. Exploration expense increased to $9.1 million for the year ended December 31, 2010 from $3.2 million for the year ended December 31, 2009. Exploration expense for 2010 consisted of $3.5 million for seismic programs, $1.1 million for delay rentals, $0.1 million related to the evaluation of non-acquired assets and $4.4 million for one scientific well drilled for data gathering purposes. Exploration expense for 2009 consisted of $1.7 million for seismic programs, $1.1 million for delay rentals and $0.4 million related to the evaluation of non-acquired assets.
Impairment, Dry Hole Costs and Abandonment Expense. Our impairment, dry hole costs and abandonment expense decreased to $44.7 million for the year ended December 31, 2010 from $52.3 million for the year ended December 31, 2009. For the year ended December 31, 2010, impairment expense was $15.6 million, abandonment expense was $2.6 million and dry hole costs were $26.5 million. For the year ended December 31, 2009, impairment expense was $19.7 million, abandonment expense was $1.9 million and dry hole costs were $30.7 million.
We evaluate the impairment of our proved oil and gas properties on a property-by-property basis whenever events or changes in circumstances indicate a property’s carrying amount may not be recoverable. If the carrying amount exceeds the property’s estimated fair value, we will adjust the carrying amount of the property to fair value through a charge to impairment expense. For the year ended December 31, 2010, we did not record any impairment charges on proved oil and gas properties. For 2009, we recorded a non-cash impairment charge of $2.8 million to our proved oil and gas properties in the North Hill Creek field, located in the Uinta Basin based upon our fair value analysis. For 2009, we also recorded a non-cash impairment charge of $16.9 million to our proved oil and gas properties in the Yellow Jacket prospect, located in the Paradox Basin. This impairment expense was primarily the result of sub-economic performing wells in the Yellow Jacket prospect.
Unproved oil and gas properties are also assessed periodically for impairment on a property-by-property basis based on remaining lease terms, drilling results, reservoir performance, commodity price outlooks or future plans to develop existing acreage. During the year ended December 31, 2010, we recorded a $15.6 million impairment charge regarding unproved oil and gas properties within various exploration projects. This non-cash impairment charge was primarily a result of unfavorable market conditions as well as uneconomic drilling results in exploratory areas where we had no future plans to develop or evaluate the remaining acreage based on 2011 capital allocation plans that were finalized during the fourth quarter of 2010. In addition, we incurred non-cash impairment charges on unproved oil and gas properties related to acreage in other areas that we no longer considered prospective. For the year ended December 31, 2009, we did not record an impairment on unproved oil and gas properties.
We account for oil and gas exploration and production activities using the successful efforts method of accounting under which we capitalize exploratory well costs until a determination is made as to whether or not the wells have found proved reserves. If proved reserves are not assigned to an exploratory well, the costs of drilling the well are charged to expense. Otherwise, the costs remain capitalized and are depleted as production occurs. Dry hole costs of $26.5 million for the year ended December 31, 2010 were associated with seven unsuccessful exploratory wells within the Paradox Basin and one unsuccessful exploratory well in each of the Uinta and Big Horn Basins. Dry hole costs of $30.7 million for the year ended December 31, 2009 were associated with six unsuccessful exploratory wells within the Montana Overthrust area, four unsuccessful exploratory wells within the Uinta Basin, two unsuccessful exploratory wells within the Paradox Basin and one unsuccessful exploratory well in each of the Big Horn and Laramie Basins.
- 64 -
The following table shows the costs of the remaining exploratory wells for which drilling was completed and which are included in unproved oil and gas properties as of December 31, 2010 pending determination of whether the wells will be assigned proved reserves. The following table does not include $0.1 million related to exploratory wells in progress for which drilling had not been completed at December 31, 2010:
| Time Elapsed Since Drilling Completed | ||||||||||||||||
| 0-12 Months | 1-2 Years | 3-5 Years | Total | |||||||||||||
| (in thousands) | ||||||||||||||||
Costs of wells for which drilling has been completed | $ | 2,917 | $ | 558 | $ | 5,566 | $ | 9,041 | ||||||||
Number of wells for which drilling has been completed | 1 | 7 | 36 | 44 | ||||||||||||
As of December 31, 2010, exploratory well costs that have been capitalized for a period greater than one year since the completion of drilling were $6.1 million, all of which were related to exploratory wells located in the Powder River Basin. In this basin, we drill wells into various coal seams. In order to produce gas from the coal seams, a period of dewatering lasting up to 36 months, or in some cases longer, is required prior to obtaining sufficient gas production to justify capital expenditures for compression and gathering and to classify the reserves as proved.
The exploratory well costs are suspended pending the completion of an economic evaluation including, but not limited to, results of additional appraisal drilling, facilities, infrastructure, well test analysis, additional geological and geophysical data and approval of a development plan. Management believes these projects with suspended exploratory drilling costs have the potential for sufficient quantities of hydrocarbons to justify their development and is actively pursuing efforts to assess whether reserves can be attributed to their respective areas. If additional information becomes available that raises substantial doubt regarding the economic or operational viability of any of these projects, the associated costs will be expensed.
Depreciation, Depletion and Amortization. DD&A was $260.7 million for the year ended December 31, 2010 compared with $253.6 million for the year ended December 31, 2009. The increase of $7.1 million was a result of increased production for 2010 compared with 2009, offset by a decrease in the DD&A rate. The increase in production accounted for $18.8 million of additional DD&A expense, which is partially offset by $11.7 million related to an overall decrease in the DD&A rate.
During 2010, the weighted average DD&A rate was $2.70 per Mcfe. During 2009, the weighted average DD&A rate was $2.83 per Mcfe. Under successful efforts accounting, DD&A expense is separately computed for each producing area based on geologic and reservoir delineation. The capital expenditures for proved properties for each area compared to the proved reserves corresponding to each producing area determine a weighted average DD&A rate for current production. Future DD&A rates will be adjusted to reflect future capital expenditures and proved reserve changes in specific areas.
General and Administrative Expense. General and administrative expense, excluding non-cash stock-based compensation, increased to $40.9 million for the year ended December 31, 2010 from $37.9 million for the year ended December 31, 2009. General and administrative expense, excluding non-cash stock-based compensation, is a non-GAAP measure. See Note 1 to the table on page 53 for a reconciliation and explanation. This increase was primarily due to an increase in employee compensation and benefit programs as well as an increase in costs associated with our efforts, and our support of industry-wide efforts, to educate the public concerning the benefits of natural gas. On a per Mcfe basis, general and administrative expense, excluding non-cash stock based compensation, was $0.42 for both years ended December 31, 2010 and 2009.
Non-cash stock-based compensation expense was $16.9 million in 2010 compared with $16.5 million in 2009. Non-cash stock-based compensation expense for 2010 and 2009 related primarily to the vesting of our stock option awards and nonvested shares of common stock granted to employees.
- 65 -
The components of non-cash stock-based compensation expense for 2010 and 2009 are shown in the following table:
| Year Ended December 31, | ||||||||
| 2010 | 2009 | |||||||
| (in thousands) | ||||||||
Stock options and nonvested equity shares of common stock | $ | 16,016 | $ | 15,428 | ||||
Shares issued for 401(k) plan | 579 | 778 | ||||||
Shares issued for directors’ fees | 313 | 252 | ||||||
|
|
|
| |||||
Total | $ | 16,908 | $ | 16,458 | ||||
|
|
|
| |||||
Interest Expense. Interest expense increased to $44.3 million for the year ended December 31, 2010 from $30.6 million for the year ended December 31, 2009 due to a higher effective interest rate in 2010 compared with 2009. Our effective interest rate increased to 12.1% for the year ended December 31, 2010 compared with 8.1% for the year ended December 31, 2009 primarily due to interest expense on our Senior Notes that were issued in July 2009 along with increased commitment fees due to lower outstanding debt balances on our Amended Credit Facility during 2010. Our weighted average outstanding debt balance for the year ended December 31, 2010 was $403.4 million compared with $429.8 million in 2009.
Interest cost is capitalized as a component of property cost for significant exploration and development projects that require greater than six months to be readied for their intended use. We capitalized interest costs of $4.2 million and $4.6 million for the years ended December 31, 2010 and 2009, respectively.
Income Tax Expense. Income tax expense totaled $48.0 million for the year ended December 31, 2010 and $38.0 million for the year ended December 31, 2009, resulting in effective tax rates of 37.3% and 43.0% in 2010 and 2009, respectively. Our effective tax rate differs from the federal statutory rate primarily because we recorded stock-based compensation expense and other operating expenses that are not deductible for income tax purposes as well as the effect of state income taxes. The effective tax rate decrease from 2009 to 2010 was primarily the result of a net reduction in permanent differences affecting the tax rate calculation, principally the increase in tax deductible compensation related to incentive stock options. Additionally, a greater proportion of our operating revenue was attributable to lower tax rate jurisdictions, thereby decreasing the overall statutory tax rate. The effect of this rate decrease on our prior year net deferred tax liability was included in income tax expense for 2010. At December 31, 2010, we had approximately $94.8 million of federal tax net operating loss carryforwards, or “NOLs”, which expire through 2029. We also had a federal alternative minimum tax credit carryforward of $0.1 million, which has no expiration date. We believe it is more likely than not that we will use these tax attributes to offset and reduce current tax liabilities in future years.
Capital Resources and Liquidity
Our primary sources of liquidity since our formation in January 2002 have been net cash provided by operating activities, sales and other issuances of equity and debt securities, including our Convertible Notes and senior notes, bank credit facilities, proceeds from joint exploration agreements and sales of interests in properties. Our primary use of capital has been for the exploration, development and acquisition of oil and natural gas properties. As we pursue profitable reserves and production growth, we continually monitor the capital resources, including issuance of equity and debt securities, available to us to meet our future financial obligations, planned capital expenditure activities and liquidity. Our future success in growing proved reserves and production will be highly dependent on capital resources available to us and our success in finding or acquiring additional reserves. The credit market dislocation that has existed over the past several years has improved; however, the costs to raise future debt and equity capital may be higher than previous issuances and such dislocations may recur. We are monitoring market conditions and are considering taking on additional debt, which may be in the form of bank debt, debt securities or other sources of financing. We cannot assure you that we will take on any such debt
- 66 -
or what the terms would be. We have on file with the SEC an effective universal shelf registration statement that we may use for future securities offerings. We believe that we have significant liquidity available to us from cash flows from operations and under our Amended Credit Facility for our planned uses of capital. In addition, our hedge positions currently provide relative certainty on a majority of our cash flows from operations through 2012 even with the general decline in the price of natural gas. See, “—Trends and Uncertainties—Declining Commodity Prices” below. We actively review acquisition opportunities on an ongoing basis. If we were to make significant additional acquisitions for cash, we may need to obtain additional equity or debt financing, which may be at a higher cost than previous issuances.
At December 31, 2011, we had cash and cash equivalents of $57.3 million and a $70.0 million balance outstanding under our Amended Credit Facility. On October 18, 2011, we further amended our Amended Credit Facility, to extend the maturity date to October 31, 2016, increase commitments to $900.0 million from 17 lenders and increase the borrowing base to $1.1 billion based upon June 30, 2011 reserves and hedge positions. The amendment also decreased the interest margin to LIBOR plus applicable margins of 1.5% to 2.5% or ABR plus 0.5% to 1.5% and reduced the commitment fee to between 0.375% to 0.5% based on borrowing base utilization. Our borrowing capacity was reduced by $26.0 million to $804.0 million due to an outstanding irrevocable letter of credit related to a firm transportation agreement. We currently expect that the holders of our Convertible Notes will put the notes to us in March 2012, and we have sufficient availability under our Amended Credit Facility with which to repay the Convertible Notes.
Cash Flow from Operating Activities
Net cash provided by operating activities was $479.3 million, $447.2 million and $480.7 million in 2011, 2010 and 2009, respectively. The changes in net cash provided by operating activities are discussed above in “—Results of Operations.”
Commodity Hedging Activities
Our operating cash flow is sensitive to many variables, the most significant of which is the volatility of prices for natural gas, NGLs and oil. Prices for these commodities are determined primarily by prevailing market conditions. National and worldwide economic activity and political stability, weather, infrastructure capacity to reach markets, supply levels and other variable factors influence market conditions for these products. These factors are beyond our control and are difficult to predict. For additional information on the impact of changing prices on our financial position, see “Item 7A. Quantitative and Qualitative Disclosure about Market Risk” below.
To mitigate some of the potential negative impact on cash flow caused by changes in natural gas, NGL and oil prices, we have entered into financial commodity swap and cashless collar contracts (purchased put options and written call options) to receive fixed prices for a portion of our production revenue. The cashless collars are used to establish floor and ceiling prices on anticipated future oil and natural gas production revenue. We typically hedge a fixed price for natural gas at our sales points (NYMEX less basis) to mitigate the risk of differentials to the NYMEX Henry Hub Index. In addition to the swaps and collars, we also have entered into basis only swaps. With a basis only swap, we have hedged the difference between the NYMEX price and the price received for our natural gas production at the specific delivery location. At December 31, 2011, we had in place natural gas financial swaps covering portions of our 2012, 2013 and 2014 production, NGL and basis only financial swaps covering portions of our 2012 production and crude oil financial collars and swaps covering portions of our 2012, 2013 and 2014 production.
In addition to financial contracts, we may at times enter into various physical commodity contracts for the sale of natural gas that cover varying periods of time and have varying pricing provisions. These physical commodity contracts qualify for the normal purchase and normal sales exception and, therefore, are not subject to hedge or mark-to-market accounting. The financial impact of physical commodity contracts is included in oil and gas production revenues at the time of settlement.
- 67 -
All derivative instruments, other than those that meet the normal purchase and normal sales exception as mentioned above, are recorded at fair market value and are included in the Consolidated Balance Sheets as assets or liabilities. All fair values are adjusted for non-performance risk. For derivative instruments that qualify and are designated as cash flow hedges, changes in fair value, to the extent the hedges are effective, are recognized in accumulated other comprehensive income (“AOCI”) until the forecasted transaction occurs. The ineffective portion of hedge derivatives is reported in commodity derivative loss in the Consolidated Statements of Operations. Realized gains and losses on cash flow hedges are transferred from AOCI and recognized in earnings and included within oil and gas production revenues in the Consolidated Statements of Operations as the associated production occurs.
During the term of a derivative instrument, if we determine that the hedge is no longer effective or necessary, hedge accounting is prospectively discontinued. All subsequent changes in the derivative’s fair value are recorded in earnings, and all accumulated gains or losses, based on the effective portion of the derivative at that date, recorded in AOCI will remain in AOCI and are reclassified to earnings when the underlying transaction occurs. If the forecasted transaction to which the hedging instrument had been designated is no longer probable of occurring within the specified time period, the hedging instrument loses cash flow hedge accounting treatment and all subsequent mark-to-market gains and losses are recorded in earnings, and all accumulated gains or losses recorded in AOCI related to the hedging instrument are also reclassified to earnings.
Some of our derivatives do not qualify for hedge accounting or are not designated as cash flow hedges but are, to a degree, an economic offset to our commodity price exposure. If a derivative instrument does not qualify as a cash flow hedge or is not designated as a cash flow hedge, the change in the fair value of the derivative is recognized in commodity derivative loss in the Consolidated Statements of Operations. These mark-to-market adjustments produce a degree of earnings volatility but have no cash flow impact relative to changes in market prices. Our cash flow is only impacted when the underlying physical sales transaction takes place in the future and when the associated derivative instrument contract is settled by making a payment to or receiving a payment from the counterparty. Realized gains and losses of derivative instruments that do not qualify as cash flow hedges are recognized in commodity derivative loss in the Consolidated Statements of Operations and are reflected in cash flows from operations on the Consolidated Statements of Cash Flows.
In addition to the swaps and collars discussed above, we have entered into basis only swaps to hedge the difference between the NYMEX price and the price received for our natural gas production at the specific delivery location. Although we believe this is an appropriate part of a mitigation strategy, the basis only swaps do not qualify for hedge accounting because the total future cash flow has not been fixed. As a result, the changes in fair value of these derivative instruments are recorded in earnings.
We have also entered into swap contracts to hedge a portion of the amount received related to NGLs resulting from the processing of our gas. Our NGL hedges were not designated as cash flow hedges, and the fair value of these derivative instruments were recorded in earnings.
At December 31, 2011, the estimated fair value of all of our commodity derivative instruments was a net asset of $83.3 million, comprised of current and noncurrent assets and liabilities, including a fair value liability of $7.6 million for basis only swaps and a fair value liability of $0.02 million for NGL swaps. We will reclassify the appropriate cash flow hedge amounts from AOCI to gains and losses included in natural gas and oil production operating revenues as the hedged production quantities are produced. Based on current projected market prices, the net amount of existing unrealized after-tax income relating to cash flow hedges as of December 31, 2011 to be reclassified from AOCI to earnings in the next 12 months would be a gain of approximately $50.8 million. Any actual increase or decrease in revenues will depend upon market conditions over the period during which the forecasted transactions occur. We anticipate that all originally forecasted transactions related to our derivatives that continue to be accounted for as cash flow hedges will occur by the end of the originally specified time periods.
The hedge instruments designated as cash flow hedges are at liquid trading locations but may contain slight differences compared to the delivery location of the forecasted sale, which may result in ineffectiveness.
- 68 -
Ineffectiveness related to our cash flow derivative instruments was an unrealized gain of $1.0 million, and unrealized losses of $2.3 million and $5.6 million for the years ended December 31, 2011, 2010 and 2009, respectively, which was reported in commodity derivative loss in the Consolidated Statements of Operations. Although those derivatives may not achieve 100% effectiveness for accounting purposes, we believe our derivative instruments continue to be highly effective in achieving our risk management objectives.
The table below summarizes the realized and unrealized gains and losses that we recognized related to our oil and natural gas derivative instruments for the periods indicated:
| Year Ended December 31, | ||||||||||||
| 2011 | 2010 | 2009 | ||||||||||
| (in thousands) | ||||||||||||
Realized gains on derivatives designated as cash flow hedges(1) | $ | 99,922 | $ | 161,496 | $ | 282,734 | ||||||
|
|
|
|
|
| |||||||
Realized losses on derivatives not designated as cash flow hedges | (28,054 | ) | (26,166 | ) | (10,902 | ) | ||||||
Unrealized ineffectiveness gains (losses) recognized on derivatives designated as cash flow hedges | 1,026 | (2,256 | ) | (5,572 | ) | |||||||
Unrealized gains (losses) on derivatives not designated as cash flow hedges | 12,765 | 17,843 | (38,093 | ) | ||||||||
|
|
|
|
|
| |||||||
Total commodity derivative loss(2) | $ | (14,263 | ) | $ | (10,579 | ) | $ | (54,567 | ) | |||
|
|
|
|
|
| |||||||
| (1) | Included in “Oil and gas production” revenues in the Consolidated Statements of Operations. |
| (2) | Included in “Commodity derivative loss” in the Consolidated Statements of Operations. |
The following table summarizes all of our hedges in place as of December 31, 2011:
Contract | Total Hedged Volumes | Quantity Type | Weighted Average Floor Price | Weighted Average Ceiling Price | Weighted Average Fixed Price | Basis Differential | Index Price(1) | Fair Market Value (in thousands) | ||||||||||||||||||||
Cashless Collars: | ||||||||||||||||||||||||||||
2012 | ||||||||||||||||||||||||||||
Oil | 146,400 | Bbls | $ | 92.50 | $ | 131.30 | N/A | N/A | WTI | $ | 704 | |||||||||||||||||
Swap Contracts: | ||||||||||||||||||||||||||||
2012 | ||||||||||||||||||||||||||||
Natural gas | 18,145,000 | MMBtu | N/A | N/A | $ | 4.69 | N/A | CIG | $ | 35,130 | ||||||||||||||||||
Natural gas | 36,890,000 | MMBtu | N/A | N/A | $ | 4.40 | N/A | NWPL | $ | 43,293 | ||||||||||||||||||
Natural gas liquids(3) | 27,375,000 | Gallons | N/A | N/A | $ | 1.44 | N/A | Mt. Belvieu | $ | (16 | ) | |||||||||||||||||
Oil | 1,354,200 | Bbls | N/A | N/A | $ | 101.22 | N/A | WTI | $ | 3,237 | ||||||||||||||||||
2013 | ||||||||||||||||||||||||||||
Natural gas | 1,825,000 | MMBtu | N/A | N/A | $ | 5.01 | N/A | CIG | $ | 3,020 | ||||||||||||||||||
Natural gas | 7,275,000 | MMBtu | N/A | N/A | $ | 4.15 | N/A | NWPL | $ | 2,203 | ||||||||||||||||||
Oil | 511,000 | Bbls | N/A | N/A | $ | 100.33 | N/A | WTI | $ | 2,239 | ||||||||||||||||||
2014 | ||||||||||||||||||||||||||||
Natural gas | 3,650,000 | MMbtu | N/A | N/A | $ | 3.80 | N/A | NWPL | $ | (1,042 | ) | |||||||||||||||||
Oil | 219,000 | Bbls | N/A | N/A | $ | 103.08 | N/A | WTI | $ | 2,113 | ||||||||||||||||||
Basis Only Swap Contracts(2): | ||||||||||||||||||||||||||||
2012 | ||||||||||||||||||||||||||||
Natural gas | 3,660,000 | MMBtu | N/A | N/A | N/A | $ | (1.24 | ) | NWPL | $ | (4,024 | ) | ||||||||||||||||
Natural gas | 3,660,000 | MMBtu | N/A | N/A | N/A | $ | (1.20 | ) | CIG | $ | (3,588 | ) | ||||||||||||||||
|
| |||||||||||||||||||||||||||
Total | $ | 83,269 | ||||||||||||||||||||||||||
|
| |||||||||||||||||||||||||||
- 69 -
The following table includes all hedges entered into subsequent to December 31, 2011 through January 27, 2012:
Contract | Total Hedged Volumes | Quantity Type | Weighted Average Floor Price | Weighted Average Ceiling Price | Weighted Average Fixed Price | Basis Differential | Index Price | |||||||||||||||||
Swap Contracts: | ||||||||||||||||||||||||
2012 | ||||||||||||||||||||||||
Natural gas | 3,515,000 | MMBtu | N/A | N/A | $ | 2.91 | N/A | NWPL | ||||||||||||||||
Natural gas liquids(4) | 750,000 | Gallons | N/A | N/A | $ | 0.79 | N/A | Mt. Belvieu | ||||||||||||||||
Oil | 106,700 | Bbls | N/A | N/A | $ | 101.60 | N/A | WTI | ||||||||||||||||
2013 | ||||||||||||||||||||||||
Natural gas | 12,750,000 | MMBtu | N/A | N/A | $ | 3.44 | N/A | NWPL | ||||||||||||||||
Oil | 109,500 | Bbls | N/A | N/A | $ | 100.50 | N/A | WTI | ||||||||||||||||
2014 | ||||||||||||||||||||||||
Natural gas | 1,825,000 | MMBtu | N/A | N/A | $ | 3.70 | N/A | NWPL | ||||||||||||||||
| (1) | CIG refers to Colorado Interstate Gas Rocky Mountains and NWPL refers to Northwest Pipeline Corporation price as quoted in Platt’s Inside FERC on the first business day of each month. Mt. Belvieu refers to the average daily price as quoted by Oil Price Information Service (“OPIS”) for Mont Belvieu spot gas liquid prices. WTI refers to West Texas Intermediate price as quoted on the New York Mercantile Exchange. |
| (2) | Represents a swap of the basis between the NYMEX price and the spot price of the index listed under Index Price above. |
| (3) | Weighted average fixed price includes purity ethane, propane, normal butane, isobutane and natural gasoline hedges. |
| (4) | Weighted average fixed price includes propane hedges only. |
By removing the price volatility from a portion of our natural gas, oil and NGL related revenue for 2012, 2013 and 2014, we have mitigated, but not eliminated, the potential effects of changing prices on our operating cash flow for those periods. While mitigating negative effects of falling commodity prices, these derivative contracts also limit the benefits we would receive from increases in commodity prices.
Effective January 1, 2012, we elected to discontinue hedge accounting prospectively. Consequently, as of January 1, 2012, we will no longer designate any hedges as cash flow hedges and we will de-designate all commodity hedge instruments that were previously designated as cash flow hedges. The election to de-designate our commodity hedges will not impact our reported cash flows, does not affect the economic substance of these transactions and changes only how these transactions are accounted for in our consolidated financial statements. We expect to reclassify $50.8 million of the net after-tax derivative loss from AOCI to earnings during the next 12 months. For a more detailed discussion, see “Item 7. Management’s Discussion and Analysis of Financial Condition and Results of Operations, “ —Overview” and “Item 7A. Quantitative and Qualitative Disclosures about Market Risk.”
By using derivative instruments that are not traded or settled on an exchange to hedge exposures to changes in commodity prices, we expose ourselves to the credit risk of our counterparties. Credit risk is the potential failure of the counterparty to perform under the terms of the derivative contract. When the fair value of a derivative contract is positive, the counterparty is expected to owe us, which creates credit risk. Derivative financial instruments that hedge the price of oil and gas are generally executed with major financial or commodities trading institutions that expose us to market and credit risks and may, at times, be concentrated with certain counterparties or groups of counterparties. It is our policy to enter into derivative contracts with counterparties that are lenders under our Amended Credit Facility, affiliates of lenders in our Amended Credit Facility or potential lenders in our Amended Credit Facility. Two counterparties that were lenders in the
- 70 -
Amended Credit Facility withdrew from the facility when we amended the facility in October 2011. We will continue to monitor the credit worthiness of these two counterparties during the remaining duration of the derivatives that were entered into while they were lenders in the Amended Credit Facility. Furthermore, where the counterparty is a lender, in the event of an insolvency of such counterparty our hedging agreements and applicable law permit us to set-off amounts we owe under the Amended Credit Facility against amounts owed to us by such counterparty under such hedging agreements. Where the counterparty is not a lender and the counterparty’s obligations are not guaranteed by a lender, such set off may not be possible even where the relevant agreement provides for it.
Capital Expenditures
Our capital expenditures are summarized in the following tables:
| Year Ended December 31, | ||||||||||||
| (in millions) | ||||||||||||
| 2011 | 2010 | 2009 | ||||||||||
Basin/Area | ||||||||||||
Piceance | $ | 209.2 | $ | 269.8 | $ | 194.8 | ||||||
Uinta—West Tavaputs | 269.1 | 85.9 | 76.4 | |||||||||
Uinta Oil | 132.3 | 56.7 | 17.3 | |||||||||
DJ | 32.2 | 11.8 | 0.0 | |||||||||
Powder River—CBM | 4.1 | 11.4 | 13.9 | |||||||||
Powder River Deep | 32.1 | 12.9 | 0 | |||||||||
Wind River | 4.4 | 8.3 | 5.1 | |||||||||
Paradox | 2.5 | 7.1 | 25.2 | |||||||||
Other | 18.6 | 9.4 | 13.7 | |||||||||
|
|
|
|
|
| |||||||
Total excluding acquisitions | $ | 704.5 | $ | 473.3 | $ | 346.4 | ||||||
Acquisitions: | ||||||||||||
Piceance | 0.0 | 0.0 | 60.0 | |||||||||
Uinta (East Bluebell) | 118.2 | 0.0 | 0.0 | |||||||||
DJ | 149.5 | 0.0 | 0.0 | |||||||||
Powder River Conventional | 15.1 | 0.0 | 0.0 | |||||||||
|
|
|
|
|
| |||||||
Total including acquisitions | $ | 987.3 | $ | 473.3 | $ | 406.4 | ||||||
|
|
|
|
|
| |||||||
| Year Ended December 31, | ||||||||||||
| (in millions) | ||||||||||||
| 2011 | 2010 | 2009 | ||||||||||
Acquisitions of proved and unproved properties and other real estate | $ | 350.2 | $ | 30.1 | $ | 71.8 | ||||||
Drilling, development, exploration and exploitation of natural gas and oil properties(1) | 624.6 | 432.0 | 329.3 | |||||||||
Geologic and geophysical costs | 3.6 | 9.1 | 3.2 | |||||||||
Furniture, fixtures and equipment | 8.9 | 2.1 | 2.1 | |||||||||
|
|
|
|
|
| |||||||
Total(2)(3) | $ | 987.3 | $ | 473.3 | $ | 406.4 | ||||||
|
|
|
|
|
| |||||||
| (1) | Includes related gathering and facilities costs. |
| (2) | For the years ended December 31, 2011, 2010 and 2009, we received $2.0 million, $2.9 million and $3.7 million, respectively, of proceeds principally from the sale of interests in oil and gas properties, which are not deducted from the capital expenditures presented above. |
| (3) | Excludes future reclamation liability accruals of $12.1 million, $1.3 million and negative $1.2 million for the years ended December 31, 2011, 2010 and 2009, respectively, and includes exploration, dry hole and abandonment costs, which are expensed under successful efforts accounting, of $21.0 million, $38.2 million and $35.9 million for the years ended December 31, 2011, 2010 and 2009, respectively. |
- 71 -
Capital expenditures for acquisitions of proved and unproved properties and other real estate were $350.2 million for the year ended December 31, 2011. This was primarily related to our acquisitions of unproved and proved properties in the DJ, Powder River and Uinta Basins. The increase in drilling, development, exploration and exploitation of oil and natural gas properties to $624.6 million from $432.0 million for the year ended December 31, 2010 is related to an increase in development drilling and completion activities within the Piceance, Uinta, Powder River and DJ Basins.
Our current estimate for a capital expenditure budget in 2012 is $900.0 million to $1.0 billion for exploratory and development programs including facilities costs and excluding acquisitions. Capital expenditures may be adjusted throughout the year as business conditions and operating results warrant. If we are successful in exploratory activities or overcoming legal and regulatory hurdles, we may consider increasing our capital budget. We believe that we have sufficient available liquidity through 2012 with the Amended Credit Facility, our hedge positions and cash flow from operations to fund our budgeted capital expenditures. Future cash flows are subject to a number of variables, including our level of oil and natural gas production, commodity prices and operating costs. There can be no assurance that operations and other capital resources will provide sufficient amounts of cash flow to maintain planned levels of capital expenditures.
The amount, timing and allocation of capital expenditures is generally discretionary and within our control. If oil and natural gas prices decline to levels below our acceptable levels or costs increase to levels above our acceptable levels, we could choose to defer a portion of our budgeted capital expenditures until later periods to achieve the desired balance between sources and uses of liquidity generally by prioritizing capital projects to first focus on those that we believe will have the highest expected financial returns and ability to generate near-term cash flow. We routinely monitor and adjust our capital expenditures, including acquisitions and divestitures, in response to changes in prices, availability of financing, drilling and acquisition costs, industry conditions, the timing of regulatory approvals, the availability of rigs, success or lack of success in drilling activities, contractual obligations, internally generated cash flow and other factors both within and outside of our control.
Financing Activities
Amended Credit Facility.On March 16, 2010, we amended our revolving credit facility and extended the maturity date to April 1, 2014. The Amended Credit Facility bears interest, based on the borrowing base usage, at the (i) London Interbank Offered Rate (“LIBOR”) plus applicable margins ranging from 2.0% to 3.0% or (ii) an alternate base rate (“ABR”), based upon the greater of the prime rate, the federal funds effective rate plus 0.5% or the adjusted one month LIBOR plus 1.0% plus applicable margins ranging from 1.0% to 2.0%. These terms were in effect until October 18, 2011, at which time the we further amended the Amended Credit Facility to extend the maturity date to October 31, 2016, increase commitments to $900.0 million and increase the borrowing base to $1.1 billion based upon June 30, 2011 reserves and hedge positions. The amendment also decreased the interest margin to LIBOR plus applicable margins of 1.5% to 2.5% or ABR plus 0.5% to 1.5% and reduced the commitment fee to between 0.375% to 0.5% based on borrowing base utilization. The average annual interest rates incurred on the Amended Credit Facility were 2.5% and 2.2% for each of the years ended December 31, 2011 and 2010, respectively.
The Amended Credit Facility contains financial covenants that requires us to maintain a ratio of Total Debt to EBITDAX (as defined by the Amended Credit Facility) not to exceed 4 to 1 and an Adjusted Current Ratio (as defined in the Amended Credit Facility) not to fall below 1 to 1. As defined by the Amended Credit Facility, our ratio of Total Debt to EBITDAX was 1.8 to 1 and our Adjusted Current Ratio was 4.8 to 1 at December 31, 2011. Therefore , we were and are currently in compliance with all financial covenants at December 31, 2011 and havecomplied with all financial covenants for all prior periods. For information concerning the effect of changes in interest rates on interest payments under this facility, see “Item 7A. Quantitative and Qualitative Disclosure about Market Risk—Interest Rate Risks” below.
- 72 -
As of December 31, 2011, we had $70.0 million outstanding under the Amended Credit Facility compared with a zero balance as of December 31, 2010. As credit support for future payment under a contractual obligation, a $26.0 million letter of credit was issued under the Amended Credit Facility, effective May 4, 2010, which further reduces the borrowing capacity of the Amended Credit Facility by $26.0 million to $804.0 million. During the year ended December 31, 2011, our average outstanding balance under the Amended Credit Facility was $75.6 million with a maximum outstanding balance during the year of $330.0 million.
Convertible Notes. On March 12, 2008, we issued $172.5 million aggregate principal amount of Convertible Notes. The full $172.5 million principal amount of the Convertible Notes is currently outstanding. The Convertible Notes mature on March 15, 2028, unless earlier converted, redeemed or purchased by us. As of January 1, 2009, with the adoption of new authoritative accounting guidance under FASB Accounting Standards Codification (“ASC”) subtopic 470-20,Debt with Conversion Options, we recorded a debt discount of $23.1 million, which represented the fair value of the equity conversion feature as of the date of the issuance of the Convertible Notes. The value of the equity conversion feature was also recorded as additional paid-in capital, net of $8.6 million of deferred taxes. The conversion price is approximately $66.33 per share of our common stock, equal to the applicable conversion rate of 15.0761 shares of our common stock, subject to adjustment upon certain events. Upon conversion of the Convertible Notes, holders will receive, at our election, cash, shares of common stock or a combination of cash and shares of common stock. The Convertible Notes bear interest at a rate of 5% per annum, payable semi-annually in arrears on March 15 and September 15 of each year, which began on September 15, 2008.
The Convertible Notes are senior unsecured obligations and rank equal in right of payment to all of our existing and future senior unsecured indebtedness; are senior in right of payment to all of our future subordinated indebtedness; and are effectively subordinated to all of our secured indebtedness with respect to the collateral securing such indebtedness. The Convertible Notes are fully and unconditionally guaranteed by our subsidiaries. There is no established market for the Convertible Notes, and the Convertible Notes are not traded on a public exchange. Based on market-based parameters of the various components of the Convertible Notes, the estimated fair value was approximately $173.4 million as of December 31, 2011.
On or after March 26, 2012, we may redeem for cash all or a portion of the Convertible Notes at a redemption price equal to 100% of the principal amount of the Convertible Notes to be redeemed, plus accrued and unpaid interest, if any, up to, but excluding, the applicable redemption date. Holders of the Convertible Notes may require us to purchase (put to us) all or a portion of their Convertible Notes for cash on each of March 20, 2012, March 20, 2015, March 20, 2018 and March 20, 2023 at a purchase price equal to 100% of the principal amount of the Convertible Notes to be repurchased, plus accrued and unpaid interest, if any, up to but excluding the applicable purchase date. We currently expect that the Convertible Notes will be put to us on March 20, 2012. We also have the option to call the Convertible Notes at any time thereafter. We have sufficient funds available under our Amended Credit Facility with which to pay the redemption price.
9.875% Senior Notes. On July 8, 2009, we issued $250.0 million in principal amount of 9.875% Senior Notes due 2016 at 95.172% of par. The 9.875% Senior Notes will mature on July 15, 2016. Interest is payable in arrears semi-annually on January 15 and July 15, which began on January 15, 2010. We received net proceeds of $232.3 million (net of related offering costs), which were used to repay a portion of the borrowings under the Amended Credit Facility. The 9.875% Senior Notes are our senior unsecured obligations and rank equal in right of payment with all of our other existing and future senior unsecured indebtedness, including the Convertible Notes. The 9.875% Senior Notes are fully and unconditionally guaranteed by our subsidiaries. The aggregate estimated fair value of the 9.875% Senior Notes was approximately $273.8 million as of December 31, 2011 based on quoted market trades of these instruments. The 9.875% Senior Notes include certain covenants that limit our ability to incur additional indebtedness, pay dividends, make restricted payments, create liens and sell assets. We are in compliance and have complied with all covenants for all periods.
7.625% Senior Notes.On September 27, 2011, we issued $400.0 million in principal amount of 7.625% Senior Notes due 2019 at par. The 7.625% Senior Notes will mature on October 1, 2019. Interest is payable in
- 73 -
arrears semi-annually on April 1 and October 1 beginning April 1, 2012. We received net proceeds of $393.0 million (net of related offering costs), which were used to repay the outstanding borrowings under the Amended Credit Facility. The 7.625% Senior Notes are our senior unsecured obligations and rank equal in right of payment with all of our other existing and future senior unsecured indebtedness. The 7.625% Senior Notes are fully and unconditionally guaranteed by our subsidiaries. The aggregate estimated fair value of the 7.625% Senior Notes was approximately $418.0 million as of December 31, 2011 based on quoted market trades of these instruments. The 7.625% Senior Notes include certain covenants that limit our ability to incur additional indebtedness, pay dividends, make restricted payments, create liens and sell assets. We are currently in compliance with all financial covenants and have complied with all financial covenants since issuance.
Our outstanding debt is summarized below (in thousands):
| As of December 31, 2011 | As of December 31, 2010 | |||||||||||||||||||||||||||
| Maturity Date | Principal | Unamortized Discount | Carrying Amount | Principal | Unamortized Discount | Carrying Amount | ||||||||||||||||||||||
Amended Credit Facility(1) | October 31, 2016 | $ | 70,000 | $ | 0 | $ | 70,000 | $ | 0 | $ | 0 | $ | 0 | |||||||||||||||
9.875% Senior Notes(2) | July 15, 2016 | 250,000 | (8,802 | ) | 241,198 | 250,000 | (10,234 | ) | 239,766 | |||||||||||||||||||
Convertible Notes(3) | March 15, 2028 | (4) | 172,500 | (1,458 | ) | 171,042 | 172,500 | (7,867 | ) | 164,633 | ||||||||||||||||||
7.625% Senior Notes(5) | October 1, 2019 | 400,000 | 0 | 400,000 | 0 | 0 | 0 | |||||||||||||||||||||
|
|
|
|
|
|
|
|
|
|
|
| |||||||||||||||||
Total Long-Term Debt | $ | 892,500 | $ | (10,260 | ) | $ | 882,240 | $ | 422,500 | $ | (18,101 | ) | $ | 404,399 | ||||||||||||||
|
|
|
|
|
|
|
|
|
|
|
| |||||||||||||||||
| (1) | The recorded value of the Amended Credit Facility approximates its fair value due to its floating rate structure. |
| (2) | The aggregate estimated fair value of the 9.875% Senior Notes was approximately $273.8 million as of December 31, 2011 based on reported market trades of these instruments. |
| (3) | The aggregate estimated fair value of the Convertible Notes was approximately $173.4 million as of December 31, 2011. Because there is no active, public market for the Convertible Notes, the fair value was based on market-based parameters of the various components of the Convertible Notes and over-the-counter trades. |
| (4) | We currently expect that the holders will put the Convertible Notes to us in March 2012, and would require the Company to settle the notes in cash. We have sufficient funds available under our Amended Credit Facility with which to pay the redemption price. We also have the option to call the Convertible Notes at any time thereafter. |
| (5) | The aggregate estimated fair value of the 7.625% Senior Notes was approximately $418.0 million as of December 31, 2011 based on reported market trades of these instruments. |
Credit Ratings.Our credit risk is evaluated by two independent rating agencies based on publicly available information and information obtained during our ongoing discussions with the rating agencies. Moody’s Investor Services and Standard & Poor’s Rating Services currently rate our 9.875% Senior Notes and 7.625% Senior Notes and have assigned us a credit rating. We do not have any provisions that are linked to our credit ratings, nor do we have any credit rating triggers that would accelerate the maturity of amounts due under our Amended Credit Facility, Convertible Notes, the 9.875% Senior Notes or the 7.625% Senior Notes. However, our ability to raise funds and the costs of any financing activities will be affected by our credit rating at the time any such financing activities are conducted.
Shelf Registration Statement.We have on file with the SEC an effective universal shelf registration statement to allow us to offer an indeterminate amount of securities in the future. We used the shelf registration statement to issue the 7.625% Senior Notes in September 2011. Under the registration statement, we may periodically offer from time to time debt securities, common stock, preferred stock, warrants and other securities
- 74 -
or any combination of such securities in amounts, prices and on terms announced when and if the securities are offered. However, we recognize that the issuance of additional securities in periods of market volatility may be less likely or may have terms less favorable to us. The specifics of any future offerings, along with the use of proceeds of any securities offered, will be described in detail in a prospectus supplement at the time of any such offering.
Contractual Obligations.A summary of our contractual obligations as of and subsequent to December 31, 2011 is provided in the following table:
| Payments Due By Year | ||||||||||||||||||||||||||||
| 2012 | 2013 | 2014 | 2015 | 2016 | After 2016 | Total | ||||||||||||||||||||||
| (in thousands) | ||||||||||||||||||||||||||||
Notes payable(1) | $ | 553 | $ | 553 | $ | 553 | $ | 553 | $ | 70,553 | $ | 737 | $ | 73,502 | ||||||||||||||
9.875% Senior Notes(2) | 24,688 | 24,688 | 24,688 | 24,688 | 263,372 | 0 | 362,124 | |||||||||||||||||||||
7.625% Senior Notes(3) | 30,500 | 30,500 | 30,500 | 30,500 | 30,500 | 483,875 | 636,375 | |||||||||||||||||||||
Convertible Notes(4) | 174,536 | 0 | 0 | 0 | 0 | 0 | 174,536 | |||||||||||||||||||||
Purchase commitments(5)(6) | 11,388 | 1,424 | 0 | 0 | 0 | 0 | 12,812 | |||||||||||||||||||||
Drilling rig commitments(6)(7) | 29,832 | 4,875 | 0 | 0 | 0 | 0 | 34,706 | |||||||||||||||||||||
Office and office equipment leases and other(8) | 2,774 | 2,629 | 2,185 | 1,844 | 1,845 | 4,253 | 15,530 | |||||||||||||||||||||
Firm transportation and processing agreements(6)(9) | 61,771 | 61,874 | 61,892 | 60,780 | 58,781 | | 196,688 131,532 | | 501,786 | |||||||||||||||||||
Asset retirement obligations(10) | 715 | 1,431 | 702 | | 234 1,800 | | 225 | 65,995 | 69,302 | |||||||||||||||||||
Derivative liability(11) | 2,543 | 0 | 506 | 0 | 0 | 0 | 3,049 | |||||||||||||||||||||
|
|
|
|
|
|
|
|
|
|
|
|
|
| |||||||||||||||
Total | $ | 339,300 | $ | 127,974 | $ | 121,026 | $ | 118,599 | $ | 425,276 | $ | 751,548 | $ | 1,883,723 | ||||||||||||||
|
|
|
|
|
|
|
|
|
|
|
|
|
| |||||||||||||||
| (1) | Included in notes payable is the outstanding principal amount under our Amended Credit Facility due October 31, 2016. This table does not include future commitment fees, interest expense or other fees on our Amended Credit Facility because the Amended Credit Facility is a floating rate instrument, and we cannot determine with accuracy the timing of future loan advances, repayments or future interest rates to be charged. Also included in notes payable is a $26.0 million letter of credit that accrues interest at 2.0% and 0.125% per annum for participation fees and fronting fees, respectively. The expected term for the letter of credit is April 30, 2018. |
| (2) | On July 8, 2009, we issued $250.0 million aggregate principal amount of 9.875% Senior Notes. We are obligated to make annual interest payments through maturity in 2016 equal to $24.7 million. |
| (3) | On September 27, 2011, we issued $400.0 million aggregate principal amount of 7.625% Senior Notes. We are obligated to make annual interest payments through maturity in 2019 equal to $30.5 million. |
| (4) | On March 12, 2008, we issued $172.5 million aggregate principal amount of Convertible Notes. For purposes of the contractual obligations table, we assume that the holders of our Convertible Notes will not exercise the conversion feature, and will put the Convertible Notes to us in March 2012. This would require us to settle the notes with $172.5 million in cash in 2012. We have funds available under our Amended Credit Facility to repay the Convertible Notes. We also are obligated to make annual interest payments equal to $8.6 million. |
| (5) | We have one take-or-pay CO2 purchasing agreement that expires in February 2013. The agreement imposes a minimum volume commitment to purchase CO2 at a contracted price. The contract provides CO2 used in fracture stimulation operations in our Uinta Basin. Should we not take delivery of the minimum volume required, we would be obligated to pay for the deficiency. At this time, our planned volumes needed exceed the minimum requirement, and we do not anticipate any deficiency payments. |
- 75 -
| (6) | The values in the table represent the gross amounts that we are financially committed to pay. However, we will record in our financial statements our proportionate share based on our working interest and net revenue interest, which will vary from property to property. |
| (7) | We currently have five drilling rigs under contract. Three expire in 2012 and two expire in 2013. These contracts may be terminated but we would be required to pay a penalty of $21.9 million. All other rigs currently performing work for us are on a well-by-well basis and, therefore, can be released without penalty at the conclusion of drilling on the current well. These latter types of drilling obligations have not been included in the table above. |
| (8) | We renewed the lease for our principal offices in Denver in September 2010. The lease now extends through March 2019. |
| (9) | We have entered into contracts that provide firm processing rights and firm transportation capacity on pipeline systems. The remaining terms on these contracts range from one to 12 years and require us to pay transportation demand and processing charges regardless of the amount of gas we deliver to the processing facility or pipeline. |
| (10) | Neither the ultimate settlement amounts nor the timing of our asset retirement obligations can be precisely determined in advance. See “—Critical Accounting Policies and Estimates” below for a more detailed discussion of the nature of the accounting estimates involved in estimating asset retirement obligations. |
| (11) | Derivative liabilities represent the net fair value for oil and gas commodity derivatives presented as liabilities in our Consolidated Balance Sheets as of December 31, 2011. Our total long term derivative liability is $0.4 million, including $0.5 million presented under 2014 above less a net asset of $0.1 million for the year 2013 excluded from the table due to its asset position. The ultimate settlement amounts of our derivative liabilities are unknown because they are subject to continuing market fluctuations. See “—Critical Accounting Policies and Estimates” below for a more detailed discussion of the nature of the accounting estimates involved in valuing derivative instruments. |
In addition to the commitments above, we have commitments for the purchase of facilities and infrastructure of $10.5 million as of and subsequent to December 31, 2011.
Trends and Uncertainties
Regulatory Trends
Our future Rocky Mountain operations and cost of doing business may be affected by changes in regulations and the ability to obtain drilling permits. The regulatory environment continues to become more restrictive, which limits our ability and increases the cost to conduct our operations. Areas in which we operate are subject to federal, state, local and tribal regulations. All these jurisdictions have imposed additional and more restrictive regulations recently and there are initiatives underway to implement additional regulations and prohibitions on oil and gas activities. New rules may further impact the ability and extend the time necessary to obtain drilling permits and other required approvals, which creates substantial uncertainty about our production and capital expenditure targets.
Federal.At the federal level, the policies of the current administration and the Department of Interior have resulted in a more restrictive regulatory environment for oil and gas activities on public lands. The Secretary of Interior has issued policy directives that require additional analysis prior to leasing federal lands. These policies are directed at reducing controversy and improving predictability of the leasing process. Until these policies are implemented and the requisite analyses are completed, the rate of federal leasing will be decreased. The BLM and the U.S. Forest Service also have withdrawn parcels from planned lease sales in areas near our operations. A lawsuit seeks review of federal resource management plans prepared by the BLM for areas of Utah, including areas in which we operate. If this challenge is successful, it could impact our ability to operate and to obtain additional leases in the area. Additional litigation seeking to halt our and other companies’ exploration and development activities throughout the Rockies can be expected. Proposals to cause expiration of undeveloped leases, to further limit funding for processing of federal drilling permits and to eliminate categorical exclusions for oil and gas activities have been reintroduced.
- 76 -
State.We also are experiencing increased attempts to more strictly regulate oil and gas activities at the state level. New rules have been imposed by the COGCC including rules requiring disclosure of chemicals used in hydraulic fracturing. Legislation has been introduced in other states that mimics that passed in Colorado and several states have proposed severance tax increases.
Local. Counties in Colorado and other states regulate oil and gas activities through local land use rules. Garfield County, Colorado, where our Piceance Basin operations are located, has begun requiring special use permits for activities that previously were regulated by the COGCC, adding new requirements and delays over previous operations. We expect additional attempts to regulate activities related to oil and gas operations by counties and local governments.
Tribal.We have experienced delays in obtaining permits to drill wells and access and rights of way agreements on tribal property, including our Lake Canyon and Black Tail Ridge projects. The failure to obtain permits has led us to declare a force majeure event in order to protect our rights under our Black Tail Ridge exploration and development agreement. Because of the current staffing of the permitting authorities, we believe that delays in obtaining permits will continue for the foreseeable future, which will delay our ability to drill wells in these areas.
Hydraulic Fracturing.The well completion technique known as hydraulic fracturing to stimulate production of natural gas and oil has come under increased scrutiny by the environmental community, and local, state and federal jurisdictions. Hydraulic fracturing involves the injection of water, sand and additives under pressure, usually down casing that is cemented in the wellbore, into prospective rock formations at depth to stimulate oil and natural gas production. We use this completion technique on substantially all our wells other than our coal bed methane wells. In reaction to the increased scrutiny of this technique, moratoria have been imposed in certain areas (although we have not been directly affected by these moratoria because they are in states where we do not have operations) and legislation proposed at local, state and federal levels. Although it is not possible at this time to predict the final outcome of the proposed legislation regarding hydraulic fracturing, any new restrictions on hydraulic fracturing that may be imposed in areas in which we conduct business could result in increased compliance costs or additional operating restrictions and, if the use of hydraulic fracturing is limited or prohibited, would lead to our inability to access, develop and book natural gas and oil reserves in the future.
Air Quality Regulation. The EPA regulates the level of ozone in ambient air and is proposing lowering the allowed level of ozone. Because of certain climate processes, most of the Rockies, where we operate, has higher levels of ozone. As a result of these existing and possibly more stringent standards, we may not be able to obtain permits necessary to construct and operate new facilities, or, if we obtain the permits, the added costs to comply with the requirements could substantially increase our operating expenses, which would reduce our profits or make certain operations uneconomic. In addition, at the state level, permits for air emissions my take longer to obtain, which would delay our ability to produce.
Potential Impacts of Regulatory Trends. The increase in regulatory burdens and potential for continued lawsuits seeking to block activities as described above is likely to cause delays to our planned activities and could prevent some of these activities. This is expected to increase our costs and could result in lower production and reserves as our properties naturally decline without replacement production and reserves from new wells in addition to a reduction in the value of our accumulated leases, especially federal leases which make up approximately 53% of our leaseholds. For example, until we obtain regulatory approvals to commence activities in our Cottonwood Gulch area, we are unable to record additional reserves in this area. We currently are unable to estimate the total magnitude of these potential losses.
- 77 -
Declining Commodity Prices.
If average commodity prices decline and remain at low levels, it could increase the likelihood of impairments and write-downs of properties, reducing the value of our reserves and thus the borrowing base of our Amended Credit Facility. We have protected the cash flow from approximately 60% of our anticipated 2012 production, 25% of our 2013 production, as well as approximately 10% of our 2014 production with hedges. However our ability to hedge at price levels similar to those for prior years is unlikely given current futures prices, which will likely result in a decline in our revenue per unit of production.
Critical Accounting Policies and Estimates
The discussion and analysis of our financial condition and results of operations are based upon our consolidated financial statements, which have been prepared in accordance with accounting principles generally accepted in the United States. The preparation of these financial statements requires us to make estimates and assumptions that affect the reported amounts of assets, liabilities, revenues and expenses and related disclosure of contingent assets and liabilities. Certain accounting policies involve judgments and uncertainties to such an extent that there is reasonable likelihood that materially different amounts could have been reported under different conditions, or if different assumptions had been used. We evaluate our estimates and assumptions on a regular basis. We base our estimates on historical experience and various other assumptions that are believed to be reasonable under the circumstances, the results of which form the basis for making judgments about the carrying values of assets and liabilities that are not readily apparent from other sources. Actual results may differ from these estimates and assumptions used in preparation of our consolidated financial statements. We provide expanded discussion of our more significant accounting policies, estimates and judgments below. We believe these accounting policies reflect our more significant estimates and assumptions used in preparation of our consolidated financial statements. See Note 2 of the Notes to the Consolidated Financial Statements for a discussion of additional accounting policies and estimates made by management.
Oil and Gas Properties
Our oil and natural gas exploration and production activities are accounted for using the successful efforts method. Under this method, all property acquisition costs and costs of exploratory and development wells are capitalized when incurred, pending determination of whether the property has proved reserves. If an exploratory well does not find proved reserves, the costs of drilling the well are charged to expense and included within cash flows from investing activities in the Consolidated Statements of Cash Flows. The costs of development wells are capitalized whether productive or nonproductive. All exploratory wells are evaluated for economic viability within one year of well completion, and the related capitalized costs are reviewed quarterly. Exploratory wells that discover potentially economic reserves in areas where a major capital expenditure would be required before production could begin and where the economic viability of that major capital expenditure depends upon the successful completion of further exploratory work in the area remain capitalized if the well finds a sufficient quantity of reserves to justify its completion as a producing well, and we are making sufficient progress assessing the reserves and the economic and operating viability of the project. Oil and gas lease acquisition costs are also capitalized. Interest cost is capitalized as a component of property cost for significant exploration and development projects that require greater than six months to be readied for their intended use.
The application of the successful efforts method of accounting requires managerial judgment to determine the proper classification of wells designated as developmental or exploratory, which will ultimately determine the proper accounting treatment of the costs incurred. In addition to development on exploratory wells, we may drill scientific wells that are only used for data gathering purposes. The costs associated with these scientific wells are expensed as incurred as exploration expense. The results from a drilling operation can take considerable time to analyze, and the determination that commercial reserves have been discovered requires both judgment and industry experience.
- 78 -
Other exploration costs, including certain geological and geophysical expenses and delay rentals for gas and oil leases, are charged to expense as incurred. The sale of a partial interest in a proved property is accounted for as a cost recovery and no gain or loss is recognized as long as this treatment does not significantly affect the unit-of-production depletion rate. A gain or loss is recognized for all other sales of proved properties and is classified in other operating revenues. Maintenance and repairs are charged to expense, and renewals and betterments are capitalized to the appropriate property and equipment accounts.
Unproved oil and gas property costs are transferred to proved oil and gas properties if the properties are subsequently determined to be productive. Proceeds from sales of partial interests in unproved leases are accounted for as a recovery of cost without recognizing any gain until all costs are recovered. Unproved oil and gas properties are assessed periodically for impairment on a property-by-property basis based on remaining lease terms, drilling results, reservoir performance, commodity price outlooks or future plans to develop acreage and allocate capital. During the year ended December 31, 2011, we impaired $17.5 million of the carrying value of unevaluated oil and gas properties compared with $15.6 million of the carrying value of unevaluated oil and gas properties for the year ended December 31, 2010. This non-cash impairment charge recorded in 2011 was primarily a result of unfavorable market conditions as well as uneconomic drilling results in exploratory areas where we have no future plans to develop or evaluate the remaining acreage based on current 2012 capital allocation plans. We generally expect impairments of unproved properties to be more likely to occur in periods of low commodity prices because we will be less likely to devote capital to exploration activities. We continue to review our acreage position and future drilling plans based on the current price environment. If our attempts to market interests in certain of our properties to industry partners are unsuccessful, additional leasehold impairments and abandonments in exploration projects may be recorded.
We review our proved oil and natural gas properties for impairment whenever events and circumstances indicate that a decline in the recoverability of their carrying value may have occurred. We estimate the expected future cash flows of our oil and gas properties and compare these undiscounted future cash flows to the carrying amount of the oil and gas properties to determine if the carrying amount is recoverable. If the carrying amount exceeds the estimated undiscounted future cash flows, we will adjust the carrying amount of the oil and natural gas properties to fair value. The factors used to determine fair value include, but are not limited to, recent sales prices of comparable properties, the present value of future cash flows, net of estimated operating and development costs using estimates of reserves, future commodity pricing, future production estimates, anticipated capital expenditures and various discount rates commensurate with the risk associated with realizing the projected cash flows. As a result of declining natural gas prices, we recorded a $75.2 million impairment charge regarding proved oil and gas properties within the Powder River Basin coalbed methane project and a $7.6 million impairment charge regarding proved oil and gas properties within the Wallace Creek field of the Wind River Basin for the year ended December 31, 2011. For the year ended December 31, 2010, we did not record any impairment charges on proved oil and gas properties.
The successful efforts method of accounting can have a significant impact on the operational results reported when we are entering a new exploratory area in anticipation of finding a gas and oil field that will be the focus of future development drilling activity. If initial exploratory wells are unsuccessful, they are expensed. Seismic costs can be substantial, which will result in additional exploration expenses when incurred.
Our investment in oil and natural gas properties includes an estimate of the future costs associated with dismantlement, abandonment and restoration of our properties. The present value of the estimated future costs to dismantle, abandon and restore a well location are added to the capitalized costs of our oil and gas properties and recorded as a long-term liability. The capitalized cost is included in the oil and natural gas property costs that are depleted over the life of the assets.
The recognition of an asset retirement obligation (“ARO”) requires that management make numerous estimates, assumptions and judgments regarding such factors as amounts, future advances in technology, timing
- 79 -
of settlements, the credit-adjusted risk-free rate to be used and inflation rates. In periods subsequent to initial measurement of the ARO, we must recognize period-to-period changes in the liability resulting from the passage of time, revisions to either the amount of the original estimate of undiscounted cash flows or changes in inflation factors and changes to our credit-adjusted risk-free rate as market conditions warrant. Any such changes that result in upward or downward revisions in the estimated obligation will result in an adjustment to the related capitalized asset and corresponding liability on a prospective basis and an adjustment in our DD&A expense in future periods.
The provision for depletion of oil and gas properties is calculated on a field-by-field basis using the unit-of-production method. Oil is converted to natural gas equivalents, Mcfe, at the rate of one barrel to six Mcf. Our rate of recording DD&A is dependent upon our estimates of total proved and proved developed reserves, which incorporate assumptions regarding future development and abandonment costs as well as our level of capital spending. If the estimates of total proved or proved developed reserves decline, the rate at which we record DD&A expense increases, reducing our net income. This decline may result from lower market prices, which may make it uneconomic to drill for and produce higher cost fields. We are unable to predict changes in reserve quantity estimates as such quantities are dependent on the success of our exploitation and development program, as well as future economic conditions.
Oil and Gas Reserve Quantities
Our estimate of proved reserves is based on the quantities of oil and natural gas that geological and engineering data demonstrate with reasonable certainty to be commercially recoverable in future years from known reservoirs under existing economic and operating conditions. Our proved reserves estimates are audited on a well-by-well basis by an independent third party engineering firm. In the aggregate, the independent third party petroleum engineer estimates of total net proved reserves are within 10% of our internal estimates as of December 31, 2011.
Reserves and their relation to estimated future net cash flows impact our depletion and impairment calculations. As a result, adjustments to depletion and impairment are made concurrently with changes to reserves estimates. We prepare our reserves estimates, and the projected cash flows derived from these reserves estimates, in accordance with SEC guidelines. Our independent third party engineering firm adheres to the same guidelines when auditing our reserve reports. The accuracy of our reserves estimates is a function of many factors including the following: the quality and quantity of available data, the interpretation of that data, the accuracy of various mandated economic assumptions and the judgments of the individuals preparing the reserves estimates.
The process of estimating oil and natural gas reserves is very complex, requiring significant decisions in the evaluation of all available geological, geophysical, engineering and economic data. The data for a given field may also change substantially over time as a result of numerous factors, including additional development activity, evolving production history and continued reassessment of the viability of production under varying economic conditions. As a result, material revisions to existing reserves estimates may occur from time to time. Although every reasonable effort is made to ensure that the reported reserves estimates represent the most accurate assessments possible, the subjective decisions and variances in available data for various fields make these estimates generally less precise than other estimates included in our financial statements. As such, reserves estimates may materially vary from the ultimate quantities of oil and natural gas eventually recovered.
At December 31, 2011, we revised our proved reserves upward by 37.9 Bcfe, excluding pricing revisions, due primarily to the positive results of increased operational focus and engineering and geological study of our Blacktail Ridge field. Blacktail Ridge became a focus for us in 2011, following positive results from our 2010 drilling program. A positive revision of 5.5 Bcfe occurred due to the pricing change from $3.95 per MMBtu CIG
- 80 -
for the year ended December 31, 2010 to $3.93 per MMBtu CIG for the year ended December 31, 2011 and $75.96 per Bbl WTI for the year ended December 31, 2010 to $92.71 per Bbl WTI for the year ended December 31, 2011.
At December 31, 2010, we revised our proved reserves upward by 39.8 Bcfe, excluding pricing revisions, due to improved production performance in the Piceance and Wind River Basins and the addition of 24.7 Bcfe of reserves from third offsetting development spacing areas added as proved undeveloped in the Piceance Basin. A positive revision of 27.4 Bcfe occurred due to the pricing change from $3.04 per MMBtu CIG for the year ended December 31, 2009 to $3.95 per MMBtu for the year ended December 31, 2010 and $57.65 per Bbl WTI for the year ended December 31, 2009 to $75.96 per Bbl for the year ended December 31, 2010.
At December 31, 2009, we revised our proved reserves upward by 101.5 Bcfe, excluding pricing revisions, due to improved production performance in Piceance, West Tavaputs and Blacktail Ridge and the recovery of NGLs and reduced drilling and completion costs in Piceance. Also included in the engineering revisions is the addition of 64 Bcfe from second offsetting development spacing areas added as proved undeveloped in the Piceance Basin. The pricing revision at year-end 2009 based on prices of $3.04 per MMBtu and $57.65 per barrel of oil required under new SEC rules for estimating reserves, relative to the year-end 2008 prices of $4.61 per MMBtu and $41.00 per barrel of oil required under the former SEC rules, resulted in a downward revision of our proved reserves of 42.8 Bcfe. Prices were adjusted by lease for quality, transportation fees and regional price differences.
Revenue Recognition
We record revenues from the sales of natural gas, NGLs and oil in the month that delivery to the purchaser has occurred and title has transferred. We receive payment from one to three months after delivery. At the end of each month, we estimate the amount of production delivered to purchasers and the price we will receive. Variances between our estimated revenue and actual payment are recorded in the month the payment is received. Historically, any differences have been insignificant.
Derivative Instruments and Hedging Activities
We use derivative financial instruments to achieve a more predictable cash flow from our natural gas, NGLs, and oil production by reducing our exposure to price fluctuations. For the year ended December 31, 2011, these transactions included swaps, basis only swaps and cashless collars. These derivative instruments are recorded at fair market value and included in the balance sheet as assets or liabilities.
The accounting for changes in the fair value of a derivative instrument depends on the intended use of the derivative and the resulting designation, which is established at the inception of a derivative. We are required to formally document, at the inception of a hedge, the hedging relationship and the entity’s risk management objective and strategy for undertaking the hedge, including identification of the hedging instrument, the hedged item or transaction, the nature of the risk being hedged, the method that will be used to assess effectiveness and the method that will be used to measure hedge ineffectiveness of derivative instruments that receive hedge accounting treatment.
For derivative instruments designated as cash flow hedges, changes in fair value, to the extent the hedge is effective, are recognized in AOCI until the hedged item is recognized in earnings. Hedge effectiveness is assessed at least quarterly based on total changes in the derivative’s fair value. Any ineffective portion of the derivative instrument’s change in fair value is recognized immediately in earnings.
We use financial derivative instruments that have not been designated as hedges, but they still protect us from changes in commodity prices. These instruments are marked to market with the resulting changes in fair value recorded in earnings.
- 81 -
The estimates of the fair values of our derivative instruments require substantial judgment. These values are based upon, among other things, option pricing models, futures prices, volatility, time to maturity and credit risk. The values we report in our financial statements change as these estimates are revised to reflect actual results, changes in market conditions or other factors, many of which are beyond our control.
Changes in the fair values of derivatives that do not qualify for cash flow hedge accounting treatment can have an impact on our results of operations and could include large non-cash fluctuations, but generally will not impact our liquidity or capital resources. Settlements of derivative instruments, regardless of whether they qualify for hedge accounting, do have an impact on our liquidity and results of operations. Generally, if actual market prices are higher than the hedge price of the derivative instruments, our net earnings and cash flow from operations will be lower relative to the results that would have occurred absent these instruments.
As of December 31, 2011, the fair value of all of our derivative instruments, including basis only and NGL swaps that are not designated as cash flow hedges, was a net asset of $83.3 million, comprised of current assets and liabilities and noncurrent assets and liabilities. The deferred income tax effect on the fair value of the cash flow hedge derivatives at December 31, 2011 totaled $33.7 million, which is recorded in current and noncurrent deferred tax liabilities.
Effective January 1, 2012, we elected to discontinue hedge accounting prospectively. Consequently, as of January 1, 2012 we will no longer designate any hedges as cash flow hedges and we will de-designate all commodity hedge instruments that were previously designated as cash flow hedges. As a result of discontinuing hedge accounting on January 1, 2012, the mark-to-market value of all commodity hedge instruments within AOCI at December 31, 2011 will be frozen in AOCI as of the de-designation date and will be reclassified into earnings in future periods as the original hedged transactions affect earnings.
Income Taxes and Uncertain Tax Positions
Income taxes are provided for the tax effects of transactions reported in the financial statements and consist of taxes currently payable plus deferred income taxes related to certain income and expenses recognized in different periods for financial and income tax reporting purposes. Deferred income tax assets and liabilities represent the future tax return consequences of those differences, which will either be taxable or deductible when assets are recovered or settled. Deferred income taxes are also recognized for tax credits that are available to offset future income taxes. Deferred income taxes are measured by applying currently enacted tax rates to the differences between financial statement and income tax reporting. We routinely assess the realizability of our deferred tax assets. If we conclude that it is more likely than not that some portion or all of the deferred tax assets will not be realized under accounting standards, the tax asset would be reduced by a valuation allowance. We consider future taxable income in making such assessments. Numerous judgments and assumptions are inherent in the determination of future taxable income, including factors such as future operating conditions (particularly as related to prevailing oil and natural gas prices). There can be no assurance that facts and circumstances will not materially change and require us to establish deferred tax asset valuation allowances in a future period.
Accounting guidance for recognizing and measuring uncertain tax positions prescribes a more likely than not recognition threshold that a tax position must meet for any of the benefit of the uncertain tax position to be recognized in the financial statements. Guidance is also provided regarding de-recognition, classification and disclosure of these uncertain tax positions. Based on this guidance, we regularly analyze tax positions taken or expected to be taken in a tax return based on the threshold prescribed. Tax positions that do not meet or exceed this threshold are considered uncertain tax positions. Penalties, if any, related to uncertain tax positions would be recorded in other expenses. We currently do not have any uncertain tax positions recorded as of December 31, 2011.
- 82 -
We are subject to taxation in many jurisdictions, and the calculation of our tax liabilities involves dealing with uncertainties in the application of complex tax laws and regulations in various taxing jurisdictions. If we ultimately determine that the payment of these liabilities will be unnecessary, we reverse the liability and recognize a tax benefit during the period in which we determine the liability no longer applies. Conversely, we record additional tax charges in a period in which we determine that a recorded tax liability is less than we expect the ultimate assessment to be.
Stock-Based Compensation
We recognize compensation expense for all share-based payment awards made to employees and directors. Stock-based compensation expense is measured at the grant date based on the fair value of the award and is recognized as expense on a straight-line basis over the requisite service period, which is generally the vesting period. Judgments and estimates are made regarding, among other things, the appropriate valuation methodology to follow in valuing stock compensation awards and the related inputs required by those valuation methodologies. The Black-Scholes option-pricing model uses assumptions regarding expected volatility of our common stock, the risk-free interest rates, expected term of the awards and other valuation inputs, which are subject to change. Any such changes could result in different valuations and thus impact the amount of stock-based compensation expense recognized. The Monte Carlo simulation method uses assumptions regarding random projections and must be repeated numerous times to achieve a probable assessment. Any change in inputs or number of inputs to this calculation could impact the valuation and thus the stock-based compensation expense recognized.
We recorded non-cash stock-based compensation expense of $19.4 million, $17.4 million, and $16.9 million for the years ended December 31, 2011, 2010 and 2009, respectively, for option grants, option modifications, nonvested equity shares of common stock and nonvested performance-based equity shares of common stock.
New Accounting Pronouncements
In January 2010, the FASB issued Accounting Standards Update 2010-06,Improving Disclosures about Fair Value Measurements, which amended FASB ASC 820,Fair Value Measurements and Disclosures.The intent of this update is to improve disclosure requirements related to fair value measurements and disclosures. New disclosures were required regarding transfers in and out of Levels 1 and 2 and activity within Level 3 fair value measurements, as well as clarification of existing disclosures regarding the level of disaggregation of derivative contracts and disclosures about fair value measurement inputs and valuation techniques. The guidance was effective for interim and annual periods beginning after December 15, 2009, except for the Level 3 reconciliation disclosures, which were effective for interim and annual periods beginning after December 15, 2010. We adopted the provisions on January 1, 2010, except for the Level 3 reconciliation disclosures, which were adopted on January 1, 2011. Adoption of the disclosure requirements did not have a material impact on our financial position or results of operations.
In December 2010, the FASB issued Accounting Standards Update 2010-29,Business Combinations: Disclosure of Supplementary Pro Forma Information for Business Combinations, which amended FASB ASC Topic 805,Business Combinations. The objective of this update is to clarify and expand the pro forma revenue and earnings disclosure requirements for business combinations. The guidance was effective for fiscal years beginning after December 15, 2010, and we adopted the provision on January 1, 2011. Adoption of the disclosure requirements did not have a material impact on our financial position or results of operations.
In May 2011, the FASB issued Accounting Standards Update 2011-04,Fair Value Measurement: Amendments to Achieve Common Fair Value Measurement and Disclosure Requirements in U.S. GAAP and IFRS, which amended FASB ASC Topic 820,Fair Value Measurement. The objective of this update is to create common fair value measurement and disclosure requirements between GAAP and International Financial
- 83 -
Reporting Standards (“IFRS”). The amendments clarify existing fair value measurement and disclosure requirements and make changes to particular principles or requirements for measuring or disclosing information about fair value measurements. These amendments are not expected to have a significant impact on companies applying GAAP. This provision is effective for interim and annual periods beginning after December 15, 2011. Adoption of this update is not expected to have a material impact on our disclosures and financial statements.
In June 2011, the FASB issued Accounting Standards Update 2011-05,Presentation of Comprehensive Income, which amended FASB ASC Topic 220, Comprehensive Income. The intent of this update is to improve the comparability, consistency and transparency of financial reporting and to increase the prominence of items reported in other comprehensive income. To facilitate convergence of GAAP and IFRS, the FASB eliminated the option to present components of other comprehensive income as part of the statement of stockholders’ equity and requires an entity to present total comprehensive income, the components of net income and the components of other comprehensive income either in a single continuous statement or in two separate but consecutive statements. The guidance is effective for interim and annual periods beginning after December 15, 2011. Adoption of this update is not expected to have a material impact on our disclosures and financial statements.
In December 2011, the FASB issued Accounting Standards Update 2011-12,Deferral of the Effective Date for Amendments to the Presentation of Reclassifications of Items Out of Accumulated Other Comprehensive Income in Accounting Standards Update No. 2011-05. The intent of this update is to indefinitely defer certain provisions of Accounting Standards Update 2011-05Presentation of Comprehensive Income, which require entities to present reclassification adjustments by component in both the statement where net income is presented and the statement where other comprehensive income is presented for both interim and annual financial statements. Adoption of this update is not expected to have a material impact on our disclosures and financial statements.
| Item 7A. | Quantitative and Qualitative Disclosures about Market Risk |
The primary objective of the following information is to provide forward-looking quantitative and qualitative information about our potential exposure to market risks. The term “market risk” refers to the risk of loss arising from adverse changes in natural gas and oil prices and interest rates. The disclosures are not meant to be precise indicators of expected future losses, but rather indicators of reasonably possible losses. This forward-looking information provides indicators of how we view and manage our ongoing market risk exposures. All of our market risk sensitive instruments were entered into for purposes other than speculative trading.
Commodity Price Risk
Our primary market risk exposure is in the prices we receive for our production. Realized pricing is primarily driven by the prevailing worldwide price for crude oil and spot regional market prices applicable to our U.S. natural gas production. Pricing for natural gas, NGLs and oil has been volatile and unpredictable for several years, and we expect this volatility to continue in the future. The prices we receive for future production depend on many factors outside of our control, including volatility in the differences between product prices at sales points and the applicable index price. Based on our average daily production and our derivative contracts in place during 2011, our income before income taxes for the year ended December 31, 2011 would have decreased by approximately $5.5 million for each $0.10 decrease per MMBtu in natural gas prices and approximately $0.7 million for each $1.00 per barrel decrease in crude oil prices. The Company is more susceptible to proved and unproved property impairments due to the current commodity price environment.
We routinely enter into commodity hedges relating to a portion of our projected production revenue through various financial transactions that hedge future prices received. These transactions may include financial price swaps whereby we will receive a fixed price and pay a variable market price to the contract counterparty and cashless price collars that set a floor and ceiling price for the hedged production. If the applicable monthly price indices are outside of the ranges set by the floor and ceiling prices in the various collars, we and the counterparty
- 84 -
to the collars would be required to settle the difference. These commodity hedging activities are intended to support oil and natural gas prices at targeted levels that provide an acceptable rate of return and to manage our exposure to natural gas and oil price fluctuations. In addition to the swaps and collars discussed above, we also entered into basis only swaps. With a basis only swap, subject to the risk that our counterparty will be unable to perform its obligations under the swap, we have fixed the difference between the NYMEX price and the price received for our natural gas production at the specific delivery location to mitigate the risk of large differences between NYMEX (Henry Hub) and our primary sales points, CIG and NWPL. We may consider entering into hedge transactions based on a NYMEX price in the future with a volume equal to the volume for our basis only swaps, thereby effectively fixing a price for CIG or NWPL.
As of January 27, 2012, we have financial derivative instruments related to natural gas, NGLs and oil volumes in place for the following periods indicated. Further detail of these hedges is summarized in the table presented under “Item 7. Management’s Discussion and Analysis of Financial Condition and Results of Operations—Capital Resources and Liquidity—Commodity Hedging Activities.”
| For the year 2012 | For the year 2013 | For the year 2014 | ||||||||||
Oil (Bbls) | 1,607,300 | 620,500 | 219,000 | |||||||||
Natural Gas (MMbtu) | 58,550,000 | 21,850,000 | 5,475,000 | |||||||||
Natural Gas Basis (MMbtu) | 7,320,000 | 0 | 0 | |||||||||
Natural Gas Liquids (Gallons) | 28,125,000 | 0 | 0 | |||||||||
Interest Rate Risks
At December 31, 2011, there was $70.0 million outstanding balance under our Amended Credit Facility, which bears interest at floating rates. The average annual interest rate incurred on this debt was 2.5% and 2.2% for each of the years ended December 31, 2011 and 2010, respectively. A 1.0% increase in each of the average LIBOR rate and federal funds rate for the year ended December 31, 2011 would have resulted in an estimated $0.8 million increase in interest expense for the year ended December 31, 2011. We also had $172.5 million principal amount of Convertible Notes and $250.0 million of Senior Notes due in 2016 and $400.0 million of Senior Notes due in 2019 outstanding at December 31, 2011, which have fixed cash interest rates of 5.0%, 9.875% and 7.625% per annum, respectively.
| Item 8. | Financial Statements and Supplementary Data |
The information required by this item is included below in “Item 15. Exhibits, Financial Statement Schedules”.
| Item 9. | Changes in and Disagreements with Accountants on Accounting and Financial Disclosure |
None.
| Item 9A. | Controls and Procedures |
Evaluation of Disclosure Controls and Procedures.As of December 31, 2011, we carried out an evaluation, under the supervision and with the participation of management, including the Chief Executive Officer and Chief Financial Officer, of the effectiveness of the design and operation of our disclosure controls and procedures pursuant to Rules 13a-15 and 15d-15 of the Securities Exchange Act of 1934 (the “Exchange Act”). Based upon that evaluation, the Chief Executive Officer and Chief Financial Officer concluded that our disclosure controls and procedures are effective as of December 31, 2011.
Management’s Report on Internal Control Over Financial Reporting.Our management is responsible for establishing and maintaining internal control over financial reporting. Our internal control over financial
- 85 -
reporting is a process designed under the supervision of the Chief Executive Officer and Chief Financial Officer to provide reasonable assurance regarding the reliability of financial reporting and the preparation of financial statements for external purposes in accordance with generally accepted accounting principles.
Management assessed the effectiveness of our internal control over financial reporting. In making this assessment, it used the criteria set forth by the Internal Control—Integrated Framework issued by the Committee of Sponsoring Organizations of the Treadway Commission. Based on our assessment we have concluded that, as of December 31, 2011, our internal control over financial reporting is effective.
Our independent registered public accounting firm has issued an attestation report on our internal control over financial reporting. That report is set forth below.
Changes in Internal Controls.There has been no change in our internal control over financial reporting during the fourth fiscal quarter of 2011 that has materially affected, or is reasonably likely to materially affect, our internal control over financial reporting.
- 86 -
REPORT OF INDEPENDENT REGISTERED PUBLIC ACCOUNTING FIRM
To the Board of Directors and Stockholders of
Bill Barrett Corporation
Denver, Colorado
We have audited the internal control over financial reporting of Bill Barrett Corporation and subsidiaries (the “Company”) as of December 31, 2011, based on criteria established inInternal Control—Integrated Frameworkissued by the Committee of Sponsoring Organizations of the Treadway Commission. The Company’s management is responsible for maintaining effective internal control over financial reporting and for its assessment of the effectiveness of internal control over financial reporting, included in the accompanyingManagement’s Report on Internal Control Over Financial Reporting. Our responsibility is to express an opinion on the Company’s internal control over financial reporting based on our audit.
We conducted our audit in accordance with the standards of the Public Company Accounting Oversight Board (United States). Those standards require that we plan and perform the audit to obtain reasonable assurance about whether effective internal control over financial reporting was maintained in all material respects. Our audit included obtaining an understanding of internal control over financial reporting, assessing the risk that a material weakness exists, testing and evaluating the design and operating effectiveness of internal control based on the assessed risk, and performing such other procedures as we considered necessary in the circumstances. We believe that our audit provides a reasonable basis for our opinion.
A company’s internal control over financial reporting is a process designed by, or under the supervision of, the company’s principal executive and principal financial officers, or persons performing similar functions, and effected by the company’s board of directors, management, and other personnel to provide reasonable assurance regarding the reliability of financial reporting and the preparation of financial statements for external purposes in accordance with generally accepted accounting principles. A company’s internal control over financial reporting includes those policies and procedures that (1) pertain to the maintenance of records that, in reasonable detail, accurately and fairly reflect the transactions and dispositions of the assets of the company; (2) provide reasonable assurance that transactions are recorded as necessary to permit preparation of financial statements in accordance with generally accepted accounting principles, and that receipts and expenditures of the company are being made only in accordance with authorizations of management and directors of the company; and (3) provide reasonable assurance regarding prevention or timely detection of unauthorized acquisition, use, or disposition of the company’s assets that could have a material effect on the financial statements.
Because of the inherent limitations of internal control over financial reporting, including the possibility of collusion or improper management override of controls, material misstatements due to error or fraud may not be prevented or detected on a timely basis. Also, projections of any evaluation of the effectiveness of the internal control over financial reporting to future periods are subject to the risk that the controls may become inadequate because of changes in conditions, or that the degree of compliance with the policies or procedures may deteriorate.
In our opinion, the Company maintained, in all material respects, effective internal control over financial reporting as of December 31, 2011, based on the criteria established inInternal Control—Integrated Frameworkissued by the Committee of Sponsoring Organizations of the Treadway Commission.
We have also audited, in accordance with the standards of the Public Company Accounting Oversight Board (United States), the consolidated financial statements as of and for the year ended December 31, 2011 of the Company and our report dated February 23, 2012, expressed an unqualified opinion on those financial statements and included an explanatory paragraph regarding the Company’s adoption of a new accounting standard in 2009.
/s/ Deloitte & Touche LLP
Denver, Colorado
February 23, 2012
- 87 -
| Item 9B. | Other Information |
None.
- 88 -
PART III
| Item 10. | Directors, Executive Officers and Corporate Governance |
Information regarding our directors and executive officers will be included in an amendment to this Form 10-K or in the “Directors and Executive Officers” section of the proxy statement for the 2012 annual meeting of stockholders, in either case, to be filed within 120 days after December 31, 2011, and is incorporated by reference to this report.
Code of Business Conduct and Ethics
We have adopted a Code of Business Conduct and Ethics that applies to our Chief Executive Officer (our principal executive officer), Chief Financial Officer (our principal financial officer) and Senior Vice President – Accounting (our principal accounting officer) as well as other officers and employees. A copy of our Code of Business Conduct and Ethics is located on our website at www.billbarrettcorp.com under Corporate Governance in the Investor Relations sections.
| Item 11. | Executive Compensation |
Information regarding executive compensation will be included in an amendment to this Form 10-K or in the “Executive Compensation” section of the proxy statement for the 2012 annual meeting of stockholders, in either case, to be filed within 120 days after December 31, 2011, and is incorporated by reference to this report.
| Item 12. | Security Ownership of Certain Beneficial Owners and Management and Related Stockholder Matters |
Information regarding beneficial ownership will be included in an amendment to this Form 10-K or in the “Beneficial Owners of Securities” section of the proxy statement for the 2012 annual meeting of stockholders, in either case, to be filed within 120 days after December 31, 2011, and is incorporated by reference to this report.
Equity Compensation Plan Information
The following table provides aggregate information presented as of December 31, 2011 with respect to all compensation plans under which equity securities are authorized for issuance.
Plan Category | (a) Number of Securities to Be Issued Upon Exercise of Outstanding Options, Warrants and Rights | (b) Weighted Averaged Exercise Price of Outstanding Options, Warrants and Rights | (c) Number of Securities Remaining Available for Future Issuance (Excluding Securities Reflected in Column (a)) | |||||||||
Equity compensation plans approved by shareholders | 2,885,506 | $ | 33.46 | (1) | 1,381,646 | |||||||
Equity compensation plans not approved by shareholders | 0 | 0 | 0 | |||||||||
|
|
|
|
|
| |||||||
Total | 2,885,506 | $ | 33.46 | 1,381,646 | ||||||||
|
|
|
|
|
| |||||||
| (1) | The weighted average exercise price relates to the 2,885,506 outstanding options included in column (a). Column (a) does not include 835,258 nonvested shares of common stock (restricted stock) granted under our shareholder-approved equity compensation plans. |
- 89 -
| Item 13. | Certain Relationships and Related Transactions and Director Independence |
Information regarding certain relationships and related transactions will be included in an amendment to this Form 10-K or in the “Transactions Between the Company and Related Parties” and “Directors and Executive Officers” sections of the proxy statement for the 2011 annual meeting of stockholders, in either case, to be filed within 120 days after December 31, 2011, and is incorporated by reference to this report.
| Item 14. | Principal Accountant Fees and Services |
Information regarding principal accounting fees and services will be included in an amendment to this Form 10-K or in the “Fees to Independent Auditors” section of the proxy statement for the 2012 annual meeting of stockholders, in either case, to be filed within 120 days after December 31, 2011, and is incorporated by reference to this report.
- 90 -
PART IV
| Item 15. | Exhibits and Financial Statement Schedules |
(a)(1) and (a)(2) Financial Statements and Financial Statement Schedules
See “Item 8. Financial Statements and Supplementary Data” beginning on page F-1.
(a)(3) Exhibits.
Exhibit Number | Description of Exhibits | |
| 3.1 | Restated Certificate of Incorporation of Bill Barrett Corporation. [Incorporated by reference to Exhibit 3.4 of our Current Report on Form 8-K filed with the Commission on December 20, 2004.] | |
| 3.2 | Bylaws of Bill Barrett Corporation. [Incorporated by reference to Exhibit 3.5 of our Current Report on Form 8-K filed with the Commission on December 20, 2004.] | |
| 4.1(a) | Specimen Certificate of Common Stock. [Incorporated by reference to Exhibit 4.1 of Amendment No. 1 to our Registration Statement on Form 8-A filed with the Commission on December 20, 2004.] | |
| 4.1(b) | Indenture, dated March 12, 2008, between Bill Barrett Corporation and Deutsche Bank Trust Company Americas, as Trustee. [Incorporated by reference to Exhibit 4.1 of our Current Report on Form 8-K filed with the Commission on March 12, 2008.] | |
| 4.1(c) | Indenture, dated July 8, 2009, between Bill Barrett Corporation and Deutsche Bank Trust Company Americas, as Trustee. [Incorporated by reference to Exhibit 4.1 of our Current Report on Form 8-K filed with the Commission on July 8, 2009.] | |
| 4.2(a) | Registration Rights Agreement, dated March 28, 2002, among Bill Barrett Corporation and the investors named therein. [Incorporated by reference to Exhibit 4.2 of Amendment No. 2 to our Registration Statement on Form S-1 (Registration No. 333-114554) filed with the Commission on August 31, 2004.] | |
| 4.2(b) | First Supplemental Indenture, dated March 12, 2008, by and between Bill Barrett Corporation and Deutsche Bank Trust Company Americas, as Trustee (including form of 5% Convertible Senior Notes due 2028). [Incorporated by reference to Exhibit 4.2 of our Current Report on Form 8-K filed with the Commission on March 12, 2008.] | |
| 4.2(c) | First Supplemental Indenture, dated July 8, 2009, by Bill Barrett Corporation and Deutsche Bank Trust Company Americas, as Trustee (including form of 9.875% Senior Notes due 2016). [Incorporated by reference to Exhibit 4.2 of our Current Report on Form 8-K filed with the Commission on July 8, 2009.] | |
| 4.3(a) | Stockholders’ Agreement, dated March 28, 2002 and as amended to date, among Bill Barrett Corporation and the investors named therein. [Incorporated by reference to Exhibit 4.3 to Amendment No. 2 to our Registration Statement on Form S-1 (Registration No. 333-114554) filed with the Commission on August 31, 2004.] | |
| 4.3(b) | Second Supplemental Indenture, dated July 8, 2009, by Bill Barrett Corporation, Bill Barrett CBM Corporation, Bill Barrett CBM LLC, Circle B Land Company LLC and Deutsche Bank Trust Company Americas, as Trustee. [Incorporated by reference to Exhibit 4.3 of our Current Report on Form 8-K with the Commission on July 8, 2009.] | |
| 4.3(c) | Third Supplemental Indenture, dated September 27, 2011, by Bill Barrett Corporation, Bill Barrett CBM Corporation, Circle B Land Company LLC, GB Acquisition Corporation, Elk Production Uintah, LLC, Aurora Gathering, LLC and Deutsche Bank Trust Company Americas, as Trustee (including form of 7.625% Senior Notes due 2019). [Incorporated by reference to Exhibit 4.2 of our Current Report on Form 8-K with the Commission on September 27, 2011.] | |
- 91 -
Exhibit Number | Description of Exhibits | |
| 4.3(d)** | Second Supplemental Indenture, dated August 3, 2011, by Bill Barrett Corporation, Bill Barrett CBM Corporation, Circle B Land Company LLC, GB Acquisition Corporation, Elk Production Uintah, LLC, Aurora Gathering, LLC and Deutsche Bank Trust Company Americas, as Trustee. | |
| 4.3(e)* | Third Supplemental Indenture, dated as of August 3, 2011, by Bill Barrett Corporation, Bill Barrett CBM Corporation, Circle B Land Company LLC, GB Acquisition Corporation, Elk Production Uintah, LLC, Aurora Gathering, LLC and Deutsche Bank Trust Company Americas, as Trustee. [Incorporated by reference to Exhibit 99(D)(4) of our Schedule TO filed with the Commission on February 21, 2012.] | |
| 4.4 | Form of Rights Agreement concerning Shareholder Rights Plan, which includes, as Exhibit A thereto, the Certificate of Designations of Series A Junior Participating Preferred Stock of Bill Barrett Corporation, and, as Exhibit B thereto, the Form of Right Certificate. [Incorporated by reference to Exhibit 4.4 to Amendment No. 1 to our Registration Statement on Form 8-A filed with the Commission on December 20, 2004.] | |
| 4.5 | Form of Certificate of Designations of Series A Junior Participating Preferred Stock of Bill Barrett Corporation. [Incorporated by reference to Exhibit 4.4 (Exhibit A) to Amendment No. 1 to our Registration Statement on Form 8-A filed with the Commission on December 20, 2004.] | |
| 4.6 | Form of Right Certificate. [Incorporated by reference to Exhibit 4.4 (Exhibit A) to Amendment No. 1 to our Registration Statement on Form 8-A filed with the Commission on December 20, 2004.] | |
| 10.1(a) | Third Amended and Restated Credit Agreement, dated as of March 16, 2010, among Bill Barrett Corporation and the banks named therein. [Incorporated by reference to Exhibit 10.1 to our Current Report on Form 8-K filed with the Commission on March 17, 2010.] | |
| 10.1(b) | First Amendment to Third Amended and Restated Credit Agreement dated as of October 18, 2011 among Bill Barrett Corporation and the banks named therein. [Incorporated by reference to Exhibit 10.1 to our Current Report on Form 8-K filed with the Commission on October 18, 2011.] | |
| 10.2 | Stock Purchase Agreement, dated March 28, 2002, among Bill Barrett Corporation and the investors named therein. [Incorporated by reference to Exhibit 10.2 to Amendment No. 2 to our Registration Statement on Form S-1 (Registration No. 333-114554) filed with the Commission on August 31, 2004.] | |
| 10.3(a)* | Form of Indemnification Agreement dated April 15, 2004, between Bill Barrett Corporation and each of the directors and certain executive officers of the Company. [Incorporated by reference to Exhibit 10.10(a) to Amendment No. 2 to our Registration Statement on Form S-1 (Registration No. 333-114554) filed with the Commission on August 31, 2004.] | |
| 10.3(b)* | Schedule of officers and directors party to Indemnification Agreements dated April 15, 2004 with Bill Barrett Corporation. [Incorporated by reference to Exhibit 10.10(b) to Amendment No. 2 to our Registration Statement on Form S-1 (Registration No. 333-114554) filed with the Commission on August 31, 2004.] | |
| 10.4* | Amended and Restated 2002 Stock Option Plan. [Incorporated by reference to Exhibit 10.12 to Amendment No. 2 to our Registration Statement on Form S-1 (Registration No. 333-114554) filed with the Commission on August 31, 2004.] | |
| 10.5(a)* | Form of Tranche A Stock Option Agreement for 2002 Stock Option Plan. [Incorporated by reference to Exhibit 10.13(a) to Amendment No. 4 to our Registration Statement on Form S-1 (Registration No. 333-114554) filed with the Commission on October 13, 2004.] | |
| 10.5(b)* | Form of Tranche B Stock Option Agreement for 2002 Stock Option Plan. [Incorporated by reference to Exhibit 10.13(b) to Amendment No. 4 to our Registration Statement on Form S-1 (Registration No. 333-114554) filed with the Commission on October 13, 2004.] | |
- 92 -
Exhibit Number | Description of Exhibits | |
| 10.6* | 2003 Stock Option Plan. [Incorporated by reference to Exhibit 10.14 to Amendment No. 3 to our Registration Statement on Form S-1 (Registration No. 333-114554) filed with the Commission on September 22, 2004.] | |
| 10.7* | Form of Stock Option Agreement for 2003 Stock Option Plan. [Incorporated by reference to Exhibit 10.15 to Amendment No. 4 to our Registration Statement on Form S-1 (Registration No. 333-114554) filed with the Commission on October 13, 2004.] | |
| 10.8 | Form of Management Rights Agreement between Bill Barrett Corporation and certain investors. [Incorporated by reference to Exhibit 10.16 to Amendment No. 4 to our Registration Statement on Form S-1 (Registration No. 333-114554) filed with the Commission on October 13, 2004.] | |
| 10.9 | Regulatory Side Letter, dated March 28, 2002, between J.P. Morgan Partners (BHCA), L.P. and Bill Barrett Corporation. [Incorporated by reference to Exhibit 10.17 to Amendment No. 4 to our Registration Statement on Form S-1 (Registration No. 333-114554) filed with the Commission on October 13, 2004.] | |
| 10.10* | Form of Change in Control Severance Protection Agreement, revised as of November 16, 2006, for named executive officers. [Incorporated by reference to Exhibit 10.10 to our Annual Report on Form 10-K for the year ended December 31, 2006.] | |
| 10.11* | 2004 Stock Incentive Plan. [Incorporated by reference to Exhibit 10.21 to Amendment No. 4 to our Registration Statement on Form S-1 (Registration No. 333-114554) filed with the Commission on October 13, 2004.] | |
| 10.12* | Revised Form of Stock Option Agreement for 2004 Stock Option Plan. [Incorporated by reference to Exhibit 10.19 to our Annual Report on Form 10-K for the year ended December 31, 2005.] | |
| 10.13* | Form of Restricted Common Stock Award Agreement for 2004 Stock Incentive Plan. [Incorporated by reference to Exhibit 10-19 to our Annual Report on Form 10-K for the year ended December 31, 2005.] | |
| 10.14(a)* | Form of Performance Vesting Restricted Stock Agreement for 2004 Stock Incentive Plan. [Incorporated by reference to Exhibit 10-19 to our Annual Report on Form 10-K for the year ended December 31, 2005.] | |
| 10.14(b) | Form of Performance Vesting Restricted Stock Agreement for 2004 Stock Incentive Plan (2009 Temporary Supplemental Grant). [Incorporated by reference to Exhibit 10.14(b) to our Quarterly Report on Form 10-Q for the three months ended March 31, 2009.] | |
| 10.15* | 2008 Stock Incentive Plan. [Incorporated by reference to Exhibit 10.1 to our Current Report on Form 8-K filed with the Commission on May 16, 2008.] | |
| 10.16* | Form of Stock Option Agreement for 2008 Stock Incentive Plan. [Incorporated by reference to Exhibit 10.16 to our Annual Report on Form 10-K for the year ended December 31, 2008.] | |
| 10.17* | Severance Plan. [Incorporated by reference to Exhibit 10.23 to Amendment No. 4 to our Registration Statement on Form S-1 (Registration No. 333-114554) filed with the Commission on October 13, 2004.] | |
| 12.1** | Computation of Ratio of Earnings to Fixed Charges | |
| 21.1** | Subsidiaries of the Registrant. | |
| 23.1** | Consent of Deloitte & Touche LLP. | |
| 23.2** | Consent of Netherland, Sewell & Associates, Inc., Independent Petroleum Engineers. | |
- 93 -
Exhibit Number | Description of Exhibits | |
| 31.1** | Rule 13a-14(a)/15d-14(a) Certification of Chief Executive Officer. | |
| 31.2** | Rule 13a-14(a)/15d-14(a) Certification of Chief Financial Officer. | |
| 32** | Section 1350 Certification of Chief Executive Officer and Chief Financial Officer. | |
| 99.1** | Report of Netherland, Sewell & Associates, Inc. dated January 12, 2012, concerning audit of oil and gas reserve estimates. | |
| 101*** | The following materials from the Bill Barrett Corporation Annual Report on Form 10-K for the year ended December 31, 2011 (and related periods), formatted in XBRL (eXtensible Business Reporting Language) include (i) the Consolidated Balance Sheets, (ii) the Consolidated Statements of Operations, (iii) the Consolidated Statements of Stockholders’ Equity and Comprehensive Income, (iv) the Consolidated Statements of Cash Flows, and (v) Notes to the Consolidated Financial Statements. | |
| * | Indicates a management contract or compensatory plan or arrangement, as required by Item 15(a)(3). |
| ** | Filed herewith. |
| *** | Users of this data are advised pursuant to Rule 401 of Regulation S-T that the financial information contained in the XBRL-Related Documents is unaudited. Furthermore, users of this data are advised in accordance with Rule 406T of Regulation S-T promulgated by the Securities and Exchange Commission that this Interactive Data File is deemed not filed or part of a registration statement or prospectus for purposes of Sections 11 or 12 of the Securities Act of 1933, as amended, is deemed not filed for purposes of Section 18 of the Securities Exchange Act of 1934, as amended, and otherwise is not subject to liability under these Sections. |
- 94 -
SIGNATURES
Pursuant to the requirements of Section 13 or 15(d) of the Securities Exchange Act of 1934, the registrant has duly caused this report to be signed on its behalf by the undersigned, thereunto duly authorized.
| BILL BARRETT CORPORATION | ||||
| Date: February 23, 2012 | By: | /s/ FREDRICK J. BARRETT | ||
Fredrick J. Barrett Chairman, Chief Executive Officer and President | ||||
Pursuant to the requirements of the Securities Exchange Act of 1934, this report has been signed below by the following persons on behalf of the registrant and in the capacities and on the dates indicated.
Signature | Title | Date | ||
/S/ FREDRICK J. BARRETT Fredrick J. Barrett | Chairman of the Board of Directors, Chief Executive Officer and President (Principal Executive Officer) | February 23, 2012 | ||
/S/ ROBERT W. HOWARD Robert W. Howard | Chief Financial Officer and Treasurer (Principal Financial Officer) | February 23, 2012 | ||
/S/ DAVID R. MACOSKO David R. Macosko | Senior Vice President—Accounting (Principal Accounting Officer) | February 23, 2012 | ||
/S/ JAMES M. FITZGIBBONS James M. Fitzgibbons | Director | February 23, 2012 | ||
/S/ WILLIAM F. OWENS William F. Owens | Director | February 23, 2012 | ||
/S/ KEVIN O. MEYERS Kevin O. Meyers | Director | February 23, 2012 | ||
/S/ JIM W. MOGG Jim W. Mogg | Director | February 23, 2012 | ||
/S/ EDMUND P. SEGNER, III Edmund P. Segner, III | Director | February 23, 2012 | ||
/S/ RANDY STEIN Randy Stein | Director | February 23, 2012 | ||
/S/ MICHAEL E. WILEY Michael E. Wiley | Director | February 23, 2012 | ||
- 95 -
INDEX TO FINANCIAL STATEMENTS
F-1
REPORT OF INDEPENDENT REGISTERED PUBLIC ACCOUNTING FIRM
To the Board of Directors and Stockholders of
Bill Barrett Corporation
Denver, Colorado
We have audited the accompanying consolidated balance sheets of Bill Barrett Corporation and subsidiaries (the “Company”) as of December 31, 2011 and 2010, and the related consolidated statements of operations, stockholders’ equity and comprehensive income, and cash flows for each of the three years in the period ended December 31, 2011. These financial statements are the responsibility of the Company’s management. Our responsibility is to express an opinion on the financial statements based on our audits.
We conducted our audits in accordance with the standards of the Public Company Accounting Oversight Board (United States). Those standards require that we plan and perform the audit to obtain reasonable assurance about whether the financial statements are free of material misstatement. An audit includes examining, on a test basis, evidence supporting the amounts and disclosures in the financial statements. An audit also includes assessing the accounting principles used and significant estimates made by management, as well as evaluating the overall financial statement presentation. We believe that our audits provide a reasonable basis for our opinion.
In our opinion, such consolidated financial statements present fairly, in all material respects, the financial position of Bill Barrett Corporation and subsidiaries as of December 31, 2011 and 2010, and the results of their operations and their cash flows for each of the three years in the period ended December 31, 2011, in conformity with accounting principles generally accepted in the United States of America.
As discussed in Note 2 to the consolidated financial statements, the Company changed its method of oil and gas reserve estimation and related required disclosures in 2009 with the implementation of new accounting guidance.
We have also audited, in accordance with the standards of the Public Company Accounting Oversight Board (United States), the Company’s internal control over financial reporting as of December 31, 2011, based on the criteria established in Internal Control—Integrated Framework issued by the Committee of Sponsoring Organizations of the Treadway Commission and our report dated February 23, 2012 expressed an unqualified opinion on the Company’s internal control over financial reporting.
/s/ Deloitte & Touche LLP
Denver, Colorado
February 23, 2012
F-2
CONSOLIDATED BALANCE SHEETS
| As of December 31, | ||||||||
| 2011 | 2010 | |||||||
| (in thousands, except share data) | ||||||||
Assets: | ||||||||
Current Assets: | ||||||||
Cash and cash equivalents | $ | 57,331 | $ | 58,690 | ||||
Accounts receivable, net of allowance for doubtful accounts of $848 and $814 as of December 31, 2011 and 2010, respectively | 101,500 | 72,594 | ||||||
Derivative assets | 77,280 | 64,920 | ||||||
Prepayments and other current assets | 10,232 | 11,444 | ||||||
|
|
|
| |||||
Total current assets | 246,343 | 207,648 | ||||||
Property and Equipment—At cost, successful efforts method for oil and gas properties: | ||||||||
Proved oil and gas properties | 3,513,050 | 2,752,981 | ||||||
Unproved oil and gas properties, excluded from amortization | 480,416 | 274,282 | ||||||
Furniture, equipment and other | 39,168 | 28,501 | ||||||
|
|
|
| |||||
| 4,032,634 | 3,055,764 | |||||||
Accumulated depreciation, depletion, amortization and impairment | (1,625,870 | ) | (1,243,945 | ) | ||||
|
|
|
| |||||
Total property and equipment, net | 2,406,764 | 1,811,819 | ||||||
Deferred financing costs and other noncurrent assets | 34,823 | 19,033 | ||||||
|
|
|
| |||||
Total | $ | 2,687,930 | $ | 2,038,500 | ||||
|
|
|
| |||||
Liabilities and Stockholders’ Equity: | ||||||||
Current Liabilities: | ||||||||
Accounts payable and accrued liabilities | $ | 136,661 | $ | 83,981 | ||||
Amounts payable to oil and gas property owners | 15,793 | 19,803 | ||||||
Production taxes payable | 48,600 | 38,410 | ||||||
Derivative liabilities | 2,543 | 943 | ||||||
Deferred income taxes | 29,601 | 22,820 | ||||||
|
|
|
| |||||
Total current liabilities | 233,198 | 165,957 | ||||||
Long-Term debt | 882,240 | 404,399 | ||||||
Asset retirement obligations | 68,587 | 52,270 | ||||||
Deferred income taxes | 281,789 | 266,009 | ||||||
Derivatives and other noncurrent liabilities | 3,278 | 8,903 | ||||||
Stockholders’ Equity: | ||||||||
Common stock, $0.001 par value; authorized 150,000,000 shares; 47,809,903 and 46,813,269 shares issued and outstanding at December 31, 2011 and 2010, respectively, with 835,258 and 891,453 shares subject to restrictions, respectively | 47 | 46 | ||||||
Additional paid-in capital | 869,856 | 830,903 | ||||||
Retained Earnings | 292,891 | 262,184 | ||||||
Treasury stock, at cost: zero shares at December 31, 2011 and December 31, 2010 | 0 | 0 | ||||||
Accumulated other comprehensive income | 56,044 | 47,829 | ||||||
|
|
|
| |||||
Total stockholders’ equity | 1,218,838 | 1,140,962 | ||||||
|
|
|
| |||||
Total | $ | 2,687,930 | $ | 2,038,500 | ||||
|
|
|
| |||||
See notes to consolidated financial statements.
F-3
CONSOLIDATED STATEMENTS OF OPERATIONS
| Year Ended December 31, | ||||||||||||
| 2011 | 2010 | 2009 | ||||||||||
| (in thousands, except share and per share amounts) | ||||||||||||
Operating and Other Revenues: | ||||||||||||
Oil and gas production | $ | 780,751 | $ | 708,452 | $ | 647,839 | ||||||
Commodity derivative loss | (14,263 | ) | (10,579 | ) | (54,567 | ) | ||||||
Other | 4,873 | 591 | 4,891 | |||||||||
|
|
|
|
|
| |||||||
Total operating and other revenues | 771,361 | 698,464 | 598,163 | |||||||||
Operating Expenses: | ||||||||||||
Lease operating expense | 56,603 | 52,040 | 46,492 | |||||||||
Gathering, transportation and processing expense | 93,423 | 69,089 | 56,608 | |||||||||
Production tax expense | 37,498 | 32,738 | 13,197 | |||||||||
Exploration expense | 3,645 | 9,121 | 3,227 | |||||||||
Impairment, dry hole costs and abandonment expense | 117,599 | 44,664 | 52,285 | |||||||||
Depreciation, depletion and amortization | 288,421 | 260,665 | 253,573 | |||||||||
General and administrative expense | 66,780 | 57,792 | 54,398 | |||||||||
|
|
|
|
|
| |||||||
Total operating expenses | 663,969 | 526,109 | 479,780 | |||||||||
|
|
|
|
|
| |||||||
Operating Income | 107,392 | 172,355 | 118,383 | |||||||||
Other Income and Expense: | ||||||||||||
Interest income and other income (expense) | (397 | ) | 402 | 438 | ||||||||
Interest expense | (58,616 | ) | (44,302 | ) | (30,647 | ) | ||||||
|
|
|
|
|
| |||||||
Total other income and expense | (59,013 | ) | (43,900 | ) | (30,209 | ) | ||||||
|
|
|
|
|
| |||||||
Income before Income Taxes | 48,379 | 128,455 | 88,174 | |||||||||
Provision for Income Taxes | 17,672 | 47,953 | 37,956 | |||||||||
|
|
|
|
|
| |||||||
Net Income | $ | 30,707 | $ | 80,502 | $ | 50,218 | ||||||
|
|
|
|
|
| |||||||
Net Income Per Common Share, Basic | $ | 0.66 | $ | 1.78 | $ | 1.12 | ||||||
|
|
|
|
|
| |||||||
Net Income Per Common Share, Diluted | $ | 0.65 | $ | 1.75 | $ | 1.12 | ||||||
|
|
|
|
|
| |||||||
Weighted Average Common Shares Outstanding, Basic | 46,535,632 | 45,217,566 | 44,732,051 | |||||||||
|
|
|
|
|
| |||||||
Weighted Average Common Shares Outstanding, Diluted | 47,236,663 | 45,887,392 | 45,035,972 | |||||||||
|
|
|
|
|
| |||||||
See notes to consolidated financial statements.
F-4
CONSOLIDATED STATEMENTS OF STOCKHOLDERS’ EQUITY AND COMPREHENSIVE INCOME
For the years ended December 31, 2009, 2010, and 2011
| Common Stock | Additional Paid-In Capital | Retained Earnings | Treasury Stock | Accumulated Other Comprehensive Income | Total Stockholders’ Equity | Compre- hensive Income (Loss) | ||||||||||||||||||||||
| (in thousands) | ||||||||||||||||||||||||||||
Balance—December 31, 2008 | $ | 45 | $ | 775,652 | $ | 131,464 | $ | 0 | $ | 192,072 | $ | 1,099,233 | ||||||||||||||||
Exercise of options, restricted stock activity and shares exchanged for exercise and tax withholding | 0 | 880 | 0 | (2,065 | ) | 0 | (1,185 | ) | $ | 0 | ||||||||||||||||||
APIC pool for excess tax benefits related to share-based compensation | 0 | 52 | 0 | 0 | 0 | 52 | 0 | |||||||||||||||||||||
Stock-based compensation | 0 | 17,899 | 0 | 0 | 0 | 17,899 | 0 | |||||||||||||||||||||
Retirement of treasury stock | 0 | (2,065 | ) | 0 | 2,065 | 0 | 0 | 0 | ||||||||||||||||||||
Comprehensive income: | ||||||||||||||||||||||||||||
Net income | 0 | 0 | 50,218 | 0 | 0 | 50,218 | 50,218 | |||||||||||||||||||||
Effect of derivative financial instruments, net of $80,468 of taxes | 0 | 0 | 0 | 0 | (137,662 | ) | (137,662 | ) | (137,662 | ) | ||||||||||||||||||
|
|
|
|
|
|
|
|
|
|
|
|
|
| |||||||||||||||
Total comprehensive income (loss) | $ | (87,444 | ) | |||||||||||||||||||||||||
|
| |||||||||||||||||||||||||||
Balance—December 31, 2009 | $ | 45 | $ | 792,418 | $ | 181,682 | $ | 0 | $ | 54,410 | $ | 1,028,555 | ||||||||||||||||
Exercise of options, restricted stock activity and shares exchanged for exercise and tax withholding | 1 | 23,777 | 0 | (3,685 | ) | 0 | 20,093 | $ | 0 | |||||||||||||||||||
APIC pool for excess tax benefits related to share-based compensation | 0 | (52 | ) | 0 | 0 | 0 | (52 | ) | 0 | |||||||||||||||||||
Stock-based compensation | 0 | 18,445 | 0 | 0 | 0 | 18,445 | 0 | |||||||||||||||||||||
Retirement of treasury stock | 0 | (3,685 | ) | 0 | 3,685 | 0 | 0 | 0 | ||||||||||||||||||||
Comprehensive income (loss): | ||||||||||||||||||||||||||||
Net income | 0 | 0 | 80,502 | 0 | 0 | 80,502 | 80,502 | |||||||||||||||||||||
Effect of derivative financial instruments, net of $4,086 of taxes | 0 | 0 | 0 | 0 | (6,581 | ) | (6,581 | ) | (6,581 | ) | ||||||||||||||||||
|
|
|
|
|
|
|
|
|
|
|
|
|
| |||||||||||||||
Total comprehensive income | $ | 73,921 | ||||||||||||||||||||||||||
|
| |||||||||||||||||||||||||||
Balance—December 31, 2010 | $ | 46 | $ | 830,903 | $ | 262,184 | $ | 0 | $ | 47,829 | $ | 1,140,962 | ||||||||||||||||
Exercise of options, restricted stock activity and shares exchanged for exercise and tax withholding | 1 | 22,838 | 0 | (4,436 | ) | 0 | 18,403 | $ | 0 | |||||||||||||||||||
Stock-based compensation | 0 | 20,551 | 0 | 0 | 0 | 20,551 | 0 | |||||||||||||||||||||
Retirement of treasury stock | 0 | (4,436 | ) | 0 | 4,436 | 0 | 0 | 0 | ||||||||||||||||||||
Comprehensive income: | ||||||||||||||||||||||||||||
Net income | 0 | 0 | 30,707 | 0 | 0 | 30,707 | 30,707 | |||||||||||||||||||||
Effect of derivative financial instruments, net of $4,886 of taxes | 0 | 0 | 0 | 0 | 8,215 | 8,215 | 8,215 | |||||||||||||||||||||
|
|
|
|
|
|
|
|
|
|
|
|
|
| |||||||||||||||
Total comprehensive income | $ | 38,922 | ||||||||||||||||||||||||||
|
| |||||||||||||||||||||||||||
Balance—December 31, 2011 | $ | 47 | $ | 869,856 | $ | 292,891 | $ | 0 | $ | 56,044 | $ | 1,218,838 | ||||||||||||||||
|
|
|
|
|
|
|
|
|
|
|
| |||||||||||||||||
See notes to consolidated financial statements.
F-5
CONSOLIDATED STATEMENTS OF CASH FLOWS
| Year Ended December 31, | ||||||||||||
| 2011 | 2010 | 2009 | ||||||||||
| (in thousands) | ||||||||||||
Operating Activities: | ||||||||||||
Net Income | $ | 30,707 | $ | 80,502 | $ | 50,218 | ||||||
Adjustments to reconcile to net cash provided by operations: | ||||||||||||
Depreciation, depletion and amortization | 288,421 | 260,665 | 253,573 | |||||||||
Deferred income taxes | 17,688 | 57,361 | 31,867 | |||||||||
Impairment, dry hole costs and abandonment expense | 117,599 | 44,664 | 52,285 | |||||||||
Unrealized derivative (gain) loss | (13,791 | ) | (15,587 | ) | 43,665 | |||||||
Stock compensation and other non-cash charges | 21,953 | 18,980 | 17,750 | |||||||||
Amortization of debt discounts and deferred financing costs | 13,886 | 12,031 | 8,410 | |||||||||
Gain on sale of properties | (1,955 | ) | (806 | ) | (1,386 | ) | ||||||
APIC pool for excess tax benefits related to share-based compensation | 0 | 52 | (52 | ) | ||||||||
Change in operating assets and liabilities: | ||||||||||||
Accounts receivable | (27,680 | ) | (10,021 | ) | 3,854 | |||||||
Prepayments and other assets | 1,809 | (6,939 | ) | (922 | ) | |||||||
Accounts payable, accrued and other liabilities | 24,531 | 2,812 | 20,046 | |||||||||
Amounts payable to oil and gas property owners | (4,010 | ) | (352 | ) | 3,088 | |||||||
Production taxes payable | 10,190 | 3,826 | (1,652 | ) | ||||||||
|
|
|
|
|
| |||||||
Net cash provided by operating activities | 479,348 | 447,188 | 480,744 | |||||||||
Investing Activities: | ||||||||||||
Additions to oil and gas properties, including acquisitions | (947,206 | ) | (444,871 | ) | (450,411 | ) | ||||||
Additions of furniture, equipment and other | (11,142 | ) | (4,107 | ) | (3,971 | ) | ||||||
Proceeds from sale of properties and other investing activities | 1,702 | 2,661 | 3,748 | |||||||||
|
|
|
|
|
| |||||||
Net cash used in investing activities | (956,646 | ) | (446,317 | ) | (450,634 | ) | ||||||
Financing Activities: | ||||||||||||
Proceeds from credit facility | 400,000 | 20,000 | 100,000 | |||||||||
Principal payments on credit facility | (330,000 | ) | (25,000 | ) | (349,000 | ) | ||||||
Proceeds from issuance of senior notes | 400,000 | 0 | 237,930 | |||||||||
Proceeds from stock option exercises | 22,247 | 23,707 | 880 | |||||||||
Deferred financing costs and other | (16,308 | ) | (15,293 | ) | (8,578 | ) | ||||||
|
|
|
|
|
| |||||||
Net cash provided by (used in) financing activities | 475,939 | 3,414 | (18,768 | ) | ||||||||
|
|
|
|
|
| |||||||
Increase (Decrease) in Cash and Cash Equivalents | (1,359 | ) | 4,285 | 11,342 | ||||||||
Beginning Cash and Cash Equivalents | 58,690 | 54,405 | 43,063 | |||||||||
|
|
|
|
|
| |||||||
Ending Cash and Cash Equivalents | $ | 57,331 | $ | 58,690 | $ | 54,405 | ||||||
|
|
|
|
|
| |||||||
See notes to consolidated financial statements.
F-6
NOTES TO CONSOLIDATED FINANCIAL STATEMENTS
For the years ended December 31, 2011, 2010 and 2009
1. Organization
Bill Barrett Corporation, a Delaware corporation, together with its wholly-owned subsidiaries (collectively, the “Company”) is an independent oil and gas company engaged in the exploration, development and production of natural gas and crude oil. Since its inception in January 2002, the Company has conducted its activities principally in the Rocky Mountain region of the United States.
2. Summary of Significant Accounting Policies
Basis of Presentation. The accompanying consolidated financial statements include the accounts of the Company. These statements have been prepared in accordance with accounting principles generally accepted in the United States of America (“GAAP”). All intercompany accounts and transactions have been eliminated in consolidation.
Use of Estimates. In the course of preparing the Company’s financial statements in accordance with GAAP, management makes various assumptions, judgments and estimates to determine the reported amount of assets, liabilities, revenues and expenses and in the disclosure of commitments and contingencies. Changes in these assumptions, judgments and estimates will occur as a result of the passage of time and the occurrence of future events and, accordingly, actual results could differ from amounts initially established.
Areas requiring the use of assumptions, judgments and estimates relate to the expected cash settlement of the Company’s 5% Convertible Senior Notes due 2028 (“Convertible Notes”) in computing diluted earnings per share, volumes of oil and natural gas reserves used in calculating depreciation, depletion and amortization (“DD&A”); the amount of expected future cash flows used in determining possible impairments of oil and gas properties and the amount of future capital costs used in these calculations. Assumptions, judgments and estimates also are required in determining future asset retirement obligations, the timing of dry hole costs, impairments of undeveloped properties, valuing deferred tax assets, and estimating fair values of derivative instruments and stock-based payment awards.
Cash Equivalents. The Company considers all highly liquid investments with an original maturity of three months or less when purchased to be cash equivalents.
Oil and Gas Properties. The Company’s oil and gas exploration and production activities are accounted for using the successful efforts method. Under this method, all property acquisition costs and costs of exploratory and development wells are capitalized when incurred, pending determination of whether the well has found proved reserves. If an exploratory well does not find proved reserves, the costs of drilling the well are charged to expense and included within cash flows from investing activities in the Consolidated Statements of Cash Flows. If an exploratory well does find proved reserves, the costs remain capitalized. The costs of development wells are capitalized whether proved reserves are added or not. Oil and gas lease acquisition costs are also capitalized. Interest cost is capitalized as a component of property cost for significant exploration and development projects that require greater than six months to be readied for their intended use. The weighted average interest rates used to capitalize interest for the years ended December 31, 2011, 2010 and 2009 were 10.2%, 12.1% and 8.1%, respectively, which include interest and amortization of discounts and deferred financing fees on the Company’s Convertible Notes, its 9.875% Senior Notes due 2016 (“9.875% Senior Notes), its 7.625% Senior Notes due 2019 (“7.625% Senior Notes”) and its credit facility. The Company capitalized interest costs of $1.4 million, $4.2 million and $4.6 million for the years ended December 31, 2011, 2010 and 2009, respectively.
F-7
Other exploration costs, including certain geological and geophysical expenses and delay rentals for oil and gas leases, are charged to expense as incurred. The sale of a partial interest in a proved property is accounted for as a cost recovery and no gain or loss is recognized as long as this treatment does not significantly affect the unit-of-production amortization rate. A gain or loss is recognized for all other sales of proved properties and is classified in other operating revenues. Maintenance and repairs are charged to expense, and renewals and betterments are capitalized to the appropriate property and equipment accounts.
Unproved oil and gas property costs are transferred to proved oil and gas properties if the properties are subsequently determined to be productive or are assigned proved reserves. Proceeds from sales of partial interests in unproved leases are accounted for as a recovery of cost without recognizing any gain until all costs are recovered. Unproved oil and gas properties are assessed periodically for impairment based on remaining lease terms, drilling results, reservoir performance, commodity price outlooks, future plans to develop acreage and other relevant matters.
Materials and supplies consist primarily of tubular goods and well equipment to be used in future drilling operations or repair operations and are carried at the lower of cost or market value, on a first-in, first-out basis.
The following table sets forth the net capitalized costs and associated accumulated DD&A and non-cash impairments relating to the Company’s oil and natural gas producing activities:
| As of December 31, | ||||||||
| 2011 | 2010 | |||||||
| (in thousands) | ||||||||
Proved properties | $ | 599,619 | $ | 437,741 | ||||
Wells and related equipment and facilities | 2,636,424 | 2,083,329 | ||||||
Support equipment and facilities | 259,672 | 219,280 | ||||||
Materials and supplies | 17,335 | 12,631 | ||||||
|
|
|
| |||||
Total proved oil and gas properties | $ | 3,513,050 | $ | 2,752,981 | ||||
Unproved properties | 339,210 | 172,242 | ||||||
Wells and facilities in progress | 141,206 | 102,040 | ||||||
|
|
|
| |||||
Total unproved oil and gas properties, excluded from amortization | $ | 480,416 | $ | 274,282 | ||||
Accumulated depreciation, depletion, amortization and impairment | (1,610,271 | ) | (1,230,975 | ) | ||||
|
|
|
| |||||
Total oil and gas properties, net | $ | 2,383,195 | $ | 1,796,288 | ||||
|
|
|
| |||||
Net changes in capitalized exploratory well costs for the years ended December 31, 2011, 2010 and 2009, respectively, are reflected in the following table:
| Year Ended December 31, | ||||||||||||
| 2011 | 2010 | 2009 | ||||||||||
| (in thousands) | ||||||||||||
Beginning of period | $ | 9,041 | $ | 51,494 | $ | 120,091 | ||||||
Additions to capitalized exploratory well costs pending the determination of proved reserves | 110 | 37,870 | 241,380 | |||||||||
Reclassifications to wells, facilities and equipment based on the determination of proved reserves | (6,179 | ) | (61,977 | ) | (279,287 | ) | ||||||
Exploratory well costs charged to dry hole costs and abandonment expense | (2,972 | ) | (18,346 | ) | (30,690 | ) | ||||||
|
|
|
|
|
| |||||||
End of period | $ | 0 | $ | 9,041 | $ | 51,494 | ||||||
|
|
|
|
|
| |||||||
F-8
All exploratory wells are evaluated for economic viability within one year of well completion, and the related capitalized costs are reviewed quarterly. Exploratory wells that discover potentially economic reserves in areas where a major capital expenditure would be required before production could begin, and where the economic viability of that major capital expenditure depends upon the successful completion of further exploratory work in the area, remain capitalized if the well finds a sufficient quantity of reserves to justify its completion as a producing well and the Company is making sufficient progress assessing the reserves and the economic and operating viability of the project. As of December 31, 2011, there were no exploratory well costs that have been capitalized for a period greater than one year since the completion of drilling.
The Company reviews its proved oil and gas properties for impairment whenever events and circumstances indicate that a decline in the recoverability of their carrying value may have occurred. The Company estimates the expected undiscounted future cash flows of its oil and gas properties and compares such undiscounted future cash flows to the carrying amount of the oil and gas properties to determine if the carrying amount is recoverable. The Company considers oil and gas properties impaired when the estimated undiscounted cash flows are less than the asset’s carrying value or if other qualitative factors indicate that the carrying value is less than the estimated fair value of the oil and gas property; for example in a low commodity price environment. If the carrying amount exceeds the estimated undiscounted future cash flows, the Company will adjust the carrying amount of the oil and gas properties to fair value. The factors used to determine fair value include, but are not limited to, recent sales prices of comparable properties, the present value of future cash flows, net of estimated operating and development costs using estimates of reserves, future commodity pricing, future production estimates, anticipated capital expenditures and various discount rates commensurate with the risk and current market conditions associated with realizing the expected cash flows projected.
During the years ended December 31, 2011, 2010 and 2009, the Company recognized non-cash impairment charges of $100.3 million, $15.6 million and $19.7 million, respectively, which were included within impairment, dry hole costs and abandonment expense in the Consolidated Statements of Operations.
As a result of declining natural gas prices, the Company recorded a non-cash impairment charge of $82.8 million regarding proved oil and gas properties within the Powder River and Wind River Basins for the year ended December 31, 2011. For the year ended December 31, 2010 the Company did not record any impairment charges on proved oil and gas properties. For the year ended December 31, 2009 the Company recorded an impairment charge of $2.8 million based upon the fair value analysis of proved oil and gas properties in the North Hill Creek field located in the Uinta Basin. These properties were subsequently sold in 2010 for an immaterial loss. Further, in 2009, the Company recorded a non-cash impairment charge of $16.9 million on its proved oil and gas properties in the Yellow Jacket prospect located in the Paradox Basin. The impairment expense was primarily the result of sub-economic performing wells in the Yellow Jacket prospect.
For the year ended December 31, 2011 the Company recorded a non-cash impairment charge of $17.5 million related to certain unproved oil and gas properties within various exploration projects. This non-cash impairment charge was primarily a result of unfavorable market conditions as well as uneconomic drilling results in exploratory areas where the Company has no future plans to develop or evaluate the remaining acreage based on current 2012 capital allocation plans. The non-cash impairment charge of $15.6 million for the year ended December 31, 2010 related to certain unproved oil and gas properties within various exploration projects. This non-cash impairment charge was primarily a result of unfavorable market conditions as well as uneconomic drilling results in exploratory areas where the Company had no future plans to develop or evaluate the remaining acreage based on 2011 capital allocation plans. In addition, the Company incurred non-cash impairment charges on unproved oil and gas properties related to acreage in other areas that the Company no longer considered prospective. For the year ended December 31, 2009 the Company did not record any impairment charges on unproved oil and gas properties.
F-9
The provision for DD&A of oil and gas properties is calculated on a field-by-field basis using the unit-of-production method. Oil is converted to natural gas equivalents, Mcfe, at the rate of one barrel to six Mcfe. Estimated future dismantlement, restoration and abandonment costs, which are net of estimated salvage values, are taken into consideration by this calculation.
On December 31, 2008, the SEC adopted the final rules and interpretations updating its oil and gas reserves reporting requirements. Many of the revisions were updates to definitions in the existing oil and gas rules to make them consistent with the Petroleum Resource Management System, which is a widely accepted set of evaluation guidelines that were designed to support assessment processes throughout the resource asset lifecycle. These guidelines were prepared by the Society of Petroleum Engineers (“SPE”) Oil and Gas Reserves Committee with cooperation from many industry organizations. One of the key changes to the previous SEC rules related to using a 12-month average commodity price to calculate the value of proved reserves versus the previous method of using year-end prices. Other key revisions included the ability to include nontraditional resources in reserves, the use of new technology for determining reserves, the opportunity to establish proved undeveloped reserves without the requirement of an adjacent producing well and permitting disclosure of probable and possible reserves. The SEC required companies to comply with the amended disclosure requirements for registration statements filed after January 1, 2010, and for annual reports for fiscal years ending on or after December 31, 2009. The new SEC rules were effective beginning with the Company’s 2009 filing, and all new rules and disclosure requirements were incorporated.
In January 2010, the Financial Accounting Standards Board (“FASB”) issued Accounting Standards Update 2010-03,Extractive Activities- Oil and Gas (Topic 932), Oil and Gas Reserve Estimation and Disclosures, which aligned the FASB oil and gas reserve estimation and disclosure requirements with the requirements in the SEC’s final rule as discussed above. The adoption of the FASB Accounting Standards Codification (“ASC”) Topic 932 changed the methodology under which the Company calculated proved oil and gas reserves. The Company’s fourth quarter 2009 DD&A and impairment calculations were based upon proved reserves that were determined using the new reserve guidelines, whereas DD&A and impairment calculations in previous quarters within 2009 were based on the prior SEC methodology. The Company’s 2011 and 2010 DD&A and impairment calculations were based on the current SEC and FASB guidance.
Furniture, Equipment and Other. Land and other office and field equipment are recorded at cost. Costs of renewals and improvements that substantially extend the useful lives of the assets are capitalized. Leasehold improvements are amortized over the lesser of the estimated life of the improvements or the life of the lease. Maintenance and repairs are expensed when incurred. Depreciation of other property and equipment is computed using the straight-line method over their estimated useful lives of three to 20 years. Upon retirement or disposition of assets, the costs and related accumulated depreciation are removed from the accounts with the resulting gains or losses, if any, reflected in results of operations.
Accounts Payable and Accrued Liabilities. Accounts payable and accrued liabilities are comprised of the following:
| As of December 31, | ||||||||
| 2011 | 2010 | |||||||
| (in thousands) | ||||||||
Accrued drilling and facility costs | $ | 66,809 | $ | 39,912 | ||||
Accrued lease operating, gathering, transportation and processing expenses | 17,711 | 15,610 | ||||||
Accrued general and administrative expenses | 11,052 | 9,020 | ||||||
Trade payables and other | 41,089 | 19,439 | ||||||
|
|
|
| |||||
Total accounts payable and accrued liabilities | $ | 136,661 | $ | 83,981 | ||||
|
|
|
| |||||
F-10
Environmental Liabilities. Environmental expenditures that relate to an existing condition caused by past operations and that do not contribute to current or future revenue generation are expensed. Liabilities are accrued when environmental assessments and/or clean-ups are probable, and the costs can be reasonably estimated.
Revenue Recognition. The Company records revenues from the sales of natural gas, natural gas liquids (“NGLs”) and crude oil when delivery to the purchaser has occurred and title has transferred. The Company uses the sales method to account for gas imbalances. Under this method, revenue is recorded on the basis of gas actually sold by the Company. In addition, the Company records revenue for its share of gas sold by other owners that cannot be volumetrically balanced in the future due to insufficient remaining reserves. The Company also reduces revenue for other owners’ gas sold by the Company that cannot be volumetrically balanced in the future due to insufficient remaining reserves. The Company’s remaining over- and under-produced gas balancing positions are considered in the Company’s proved oil and gas reserves. Gas imbalances at December 31, 2011 and 2010 were not material.
Comprehensive Income (Loss). Comprehensive income (loss) consists of net income and the effective component of derivative instruments classified as cash flow hedges. Comprehensive income (loss) is presented net of income taxes in the Consolidated Statements of Stockholders’ Equity and Comprehensive Income.
Derivative Instruments and Hedging Activities. The Company periodically uses derivative financial instruments to achieve a more predictable cash flow from its natural gas, NGLs and oil sales by reducing its exposure to price fluctuations. Derivative instruments are recorded at fair market value and included in the Consolidated Balance Sheets as assets or liabilities.
The accounting for changes in the fair value of a derivative instrument depends on the intended use of the derivative and the resulting designation, which is established at the inception of a derivative. The Company is required to formally document, at the inception of a hedge, the hedging relationship and the risk management objective and strategy for undertaking the hedge, including identification of the hedging instrument, the hedged item or transaction, the nature of the risk being hedged, the method that will be used to assess effectiveness and the method that will be used to measure hedge ineffectiveness of derivative instruments that receive hedge accounting treatment.
For derivative instruments designated as cash flow hedges, changes in fair value, to the extent the hedge is effective, are recognized in accumulated other comprehensive income (“AOCI”) until the hedged item is recognized in earnings. Hedge effectiveness is assessed quarterly based on total changes in the derivative’s fair value. Any ineffective portion of the derivative instrument’s change in fair value is recognized immediately in earnings.
The Company utilizes financial derivative instruments that have not been designated as cash flow hedges, but they still protect the Company from changes in commodity prices. These instruments are marked to market with the resulting changes in fair value recorded in earnings. For additional discussion of derivatives, please see Note 8.
Deferred Financing Costs. Costs incurred in connection with the execution or modification of the Company’s credit facility, and in connection with the Convertible Notes, 9.875% Senior Notes and 7.625% Senior Notes, are capitalized and amortized over the life, or expected life, of the debt using the straight-line method, which approximates the effective interest method.
Income Taxes. Income taxes are provided for the tax effects of transactions reported in the financial statements and consist of taxes currently payable plus deferred income taxes related to certain income and expenses recognized in different periods for financial and income tax reporting purposes. Deferred income tax assets and liabilities represent the future tax return consequences of those differences, which will either be taxable or deductible when assets are recovered or liabilities are settled. Deferred income taxes are also recognized for tax credits that are available to offset future income taxes. Deferred income taxes are measured by applying currently enacted tax rates.
F-11
The Company accounts for uncertainty in income taxes for tax positions taken or expected to be taken in a tax return. Only tax positions that meet the more-likely-than-not recognition threshold will be recognized.
Asset Retirement Obligations. The estimated fair value of the future costs associated with dismantlement, abandonment and restoration of oil and gas properties is recorded generally upon acquisition or completion of a well. The net estimated costs are discounted to present values using a credit-adjusted, risk-free rate over the estimated economic life of the oil and gas properties. Such costs are capitalized as part of the related asset. The asset is depleted on the units-of-production method on a field-by-field basis. The associated liability is classified in current and long-term liabilities in the Consolidated Balance Sheets. The liability is periodically adjusted to reflect (1) new liabilities incurred, (2) liabilities settled during the period, (3) accretion expense and (4) revisions to estimated future cash flow requirements. The accretion expense is recorded as a component of DD&A expense in the Consolidated Statements of Operations.
Repurchases and Retirements of Capital Stock. The Company records treasury stock acquisitions at cost. Upon retirement of treasury shares, the excess of purchase or contribution cost over associated common stock par value is allocated to additional paid-in capital (“APIC”). The allocation to APIC is based on the per-share amount of capital in excess of par value for all shares.
Stock-Based Compensation. The Company recognizes compensation expense for all stock-based payment awards made to employees and directors. Stock-based compensation expense is measured at the grant date based on the fair value of the award and is recognized as expense on a straight-line basis over the requisite service period, which is generally the vesting period. The Company generally uses the Black-Scholes option-pricing model to determine the fair value of the stock-based awards, which requires the input of highly subjective assumptions, including the expected volatility of the underlying stock, the expected term of the award, the risk-free interest rate and expected future divided payments. Expected volatilities are based on the Company’s historical volatility, if available, or based on an average of volatilities of similar-sized oil and gas companies in the Rocky Mountain region. The expected life of an award is estimated using historical exercise behavior data and estimated future behavior. The risk-free interest rate is based on the U.S. Treasury yields in effect at the time of grant and extrapolated to approximate the expected life of the award. The Company does not expect to declare or pay dividends in the foreseeable future. The Company also uses the Monte Carlo simulation method to determine the fair value of market-based performance awards, which is based on random projections of stock price paths and must be repeated numerous times to achieve a probable assessment.
Earnings Per Share. Basic net income per common share is calculated by dividing net income attributable to common stock by the weighted average number of common shares outstanding during each period. Non-vested equity shares of common stock are included in the computation of basic net income per common share only after the shares become fully vested. Diluted net income per common share is calculated by dividing net income attributable to common stock by the weighted average number of common shares outstanding and other dilutive securities. Potentially dilutive securities for the diluted net income per common share calculations consist of nonvested equity shares of common stock, in-the-money outstanding stock options to purchase the Company’s common stock and shares into which the Convertible Notes are convertible.
In satisfaction of its obligation upon conversion of the Convertible Notes, the Company may elect to deliver, at its option, cash, shares of its common stock or a combination of cash and shares of its common stock. The Company currently expects to settle the Convertible Notes in cash at or near the initial redemption date of March 26, 2012; therefore, the treasury stock method was used to measure the potentially dilutive impact of shares associated with that conversion feature. The Convertible Notes issued March 12, 2008 have not been dilutive since their issuance, and therefore, did not impact the diluted net income per common share calculation for the years ended December 31, 2011, 2010 and 2009. The diluted net income per common share excludes the anti-dilutive effect of 115,215, 217,073 and 211,131 shares of stock options and nonvested performance-based shares of common stock for the years ended December 31, 2011, 2010 and 2009, respectively.
F-12
The following table sets forth the calculation of basic and diluted earnings per share:
| Year Ended December 31, | ||||||||||||
| 2011 | 2010 | 2009 | ||||||||||
| (in thousands, except per share amounts) | ||||||||||||
Net income | $ | 30,707 | $ | 80,502 | $ | 50,218 | ||||||
Basic weighted-average common shares outstanding in period | 46,535.6 | 45,217.6 | 44,723.1 | |||||||||
Add dilutive effects of stock options and nonvested equity shares of common stock | 701.1 | 669.8 | 312.9 | |||||||||
|
|
|
|
|
| |||||||
Diluted weighted-average common shares outstanding in period | 47,236.7 | 45,887.4 | 45,036.0 | |||||||||
|
|
|
|
|
| |||||||
Basic income per common share | $ | 0.66 | $ | 1.78 | $ | 1.12 | ||||||
|
|
|
|
|
| |||||||
Diluted income per common share | $ | 0.65 | $ | 1.75 | $ | 1.12 | ||||||
|
|
|
|
|
| |||||||
Industry Segment and Geographic Information. The Company operates in one industry segment, which is the exploration, development and production of natural gas and crude oil, and all of the Company’s operations are conducted in the continental United States. Consequently, the Company currently reports as a single industry segment.
New Accounting Pronouncements. In January 2010, the FASB issued Accounting Standards Update 2010-06,Improving Disclosures about Fair Value Measurements, which amended FASB ASC 820,Fair Value Measurements and Disclosures.The intent of this update is to improve disclosure requirements related to fair value measurements and disclosures. New disclosures were required regarding transfers in and out of Levels 1 and 2 and activity within Level 3 fair value measurements, as well as clarification of existing disclosures regarding the level of disaggregation of derivative contracts and disclosures about fair value measurement inputs and valuation techniques. The guidance was effective for interim and annual periods beginning after December 15, 2009, except for the Level 3 reconciliation disclosures, which were effective for interim and annual periods beginning after December 15, 2010. The Company adopted the provisions on January 1, 2010, except for the Level 3 reconciliation disclosures, which were adopted on January 1, 2011. Adoption of the disclosure requirements did not have a material impact on the Company’s financial position or results of operations.
In December 2010, the FASB issued Accounting Standards Update 2010-29,Business Combinations: Disclosure of Supplementary Pro Forma Information for Business Combinations, which amended FASB ASC Topic 805,Business Combinations. The objective of this update is to clarify and expand the pro forma revenue and earnings disclosure requirements for business combinations. The guidance was effective for fiscal years beginning after December 15, 2010, and the Company adopted the provision on January 1, 2011. Adoption of the disclosure requirements did not have a material impact on the Company’s financial position or results of operations.
In May 2011, the FASB issued Accounting Standards Update 2011-04,Fair Value Measurement: Amendments to Achieve Common Fair Value Measurement and Disclosure Requirements in U.S. GAAP and IFRS, which amended FASB ASC Topic 820,Fair Value Measurement. The objective of this update is to create common fair value measurement and disclosure requirements between GAAP and International Financial Reporting Standards (“IFRS”). The amendments clarify existing fair value measurement and disclosure requirements and make changes to particular principles or requirements for measuring or disclosing information about fair value measurements. These amendments are not expected to have a significant impact on companies applying GAAP. This provision is effective for interim and annual periods beginning after December 15, 2011. Adoption of this update is not expected to have a material impact on the Company’s disclosures and financial statements.
F-13
In June 2011, the FASB issued Accounting Standards Update 2011-05,Presentation of Comprehensive Income, which amended FASB ASC Topic 220, Comprehensive Income. The intent of this update is to improve the comparability, consistency and transparency of financial reporting and to increase the prominence of items reported in other comprehensive income. To facilitate convergence of GAAP and IFRS, the FASB eliminated the option to present components of other comprehensive income as part of the statement of stockholders’ equity and requires an entity to present total comprehensive income, the components of net income and the components of other comprehensive income either in a single continuous statement or in two separate but consecutive statements. The guidance is effective for interim and annual periods beginning after December 15, 2011. Adoption of this update is not expected to have a material impact on the Company’s disclosures and financial statements.
In December 2011, the FASB issued Accounting Standards Update 2011-12,Deferral of the Effective Date for Amendments to the Presentation of Reclassifications of Items Out of Accumulated Other Comprehensive Income in Accounting Standards Update No. 2011-05. The intent of this update is to indefinitely defer certain provisions of Accounting Standards Update 2011-05Presentation of Comprehensive Income, which require entities to present reclassification adjustments by component in both the statement where net income is presented and the statement where other comprehensive income is presented for both interim and annual financial statements. Adoption of this update is not expected to have a material impact on the Company’s disclosures and financial statements.
3. Supplemental Disclosures of Cash Flow Information
Supplemental cash flow information is as follows:
| Year Ended December 31, | ||||||||||||
| 2011 | 2010 | 2009 | ||||||||||
| (in thousands) | ||||||||||||
Cash paid for interest, net of amount capitalized | $ | 36,504 | $ | 33,174 | $ | 10,315 | ||||||
Net cash paid (received) for income taxes | (8,128 | ) | 2,691 | 6,089 | ||||||||
Supplemental disclosures of non-cash investing and financing activities: | ||||||||||||
Current liabilities that are reflected in investing activities | 66,111 | 40,694 | 33,953 | |||||||||
Current liabilities that are reflected in financing activities | 146 | 0 | 60 | |||||||||
Net increase (decrease) in asset retirement obligations | 13,185 | 776 | 829 | |||||||||
Treasury stock acquired for employee stock option exercises | 592 | 70 | 0 | |||||||||
Retirement of treasury stock | 4,436 | 3,685 | 2,065 | |||||||||
F-14
4. Acquisitions
On June 8, 2011, the Company completed an acquisition, from an unrelated party, of oil properties and related assets in the East Bluebell area of the Uinta Basin (“East Bluebell Acquisition”) located in Duchesne and Uintah Counties in Utah. The properties were purchased for approximately $116.8 million. As of December 31, 2011, the final purchase price allocation is as follows (in thousands):
Consideration given: | ||||
Cash | $ | 116,790 | ||
|
| |||
Total consideration given | $ | 116,790 | ||
|
| |||
Amounts recognized for final fair value of assets acquired and liabilities assumed: | ||||
Proved property | $ | 76,234 | ||
Unproved property | 44,027 | |||
Asset retirement obligation | (2,054 | ) | ||
Liabilities assumed | (3,880 | ) | ||
Other assets acquired | 2,463 | |||
|
| |||
Total fair value of oil and gas properties acquired | $ | 116,790 | ||
|
| |||
On August 16, 2011, the Company completed an acquisition, from an unrelated party, of oil and gas properties and related assets in the Denver-Julesburg Basin (“DJ Basin Acquisition”) located in northeastern Colorado and southeastern Wyoming. Total consideration given was approximately $145.6 million in cash. The final purchase price allocation is as follows (in thousands):
Consideration given: | ||||
Cash | $ | 145,636 | ||
|
| |||
Total consideration given | $ | 145,636 | ||
|
| |||
Amounts recognized for final fair value of assets acquired and liabilities assumed: | ||||
Proved property | $ | 93,110 | ||
Unproved property | 61,891 | |||
Asset retirement obligation | (7,670 | ) | ||
Liabilities assumed | (1,695 | ) | ||
|
| |||
Total fair value of oil and gas properties acquired | $ | 145,636 | ||
|
| |||
The East Bluebell Acquisition and the DJ Basin Acquisition qualified as business combinations and, as such, the Company estimated the fair value of each property as of the respective acquisition dates, June 8, 2011 and August 16, 2011. To estimate the fair values of the properties as of the acquisition date, the Company used a net asset value approach. The Company utilized a discounted cash flow model that took into account the following inputs to arrive at estimates of future net cash flows:
| • | Estimated ultimate recovery of crude oil and natural gas as prepared by the Company’s internal petroleum engineers; |
| • | Estimated future commodity prices based on NYMEX crude oil and gas futures prices as of each acquisition date and adjusted for estimated location and quality differentials as well as related transportation costs; |
F-15
| • | Estimated future production rates; and |
| • | Estimated timing and amounts of future operating and development costs. |
To estimate the fair value of proved properties, the Company discounted the future net cash flows using a market-based rate that the Company determined appropriate at the acquisition date for the various proved reserve categories. To compensate for the inherent risk of estimating and valuing unproved properties, the Company reduced the discounted future net cash flows of the unproved properties by additional risk-weighting factors. Due to the unobservable nature of the inputs, the fair values of the proved and unproved oil and gas properties are considered Level 3 fair value measurements.
The Company has not presented pro forma information for the acquired businesses as the impact of the acquisitions were not material to the results of operations for the twelve months ended December 31, 2011 or 2010. The results of operations from the East Bluebell Acquisition and the DJ Basin Acquisition are included in the Company’s consolidated financial statements from the acquisition dates of June 8, 2011 and August 16, 2011, respectively. Revenue related to the East Bluebell Acquisition that was included in the Company’s Consolidated Statements of Operations was approximately $7.7 million for the twelve months ended December 31, 2011 and net income was $1.7 million. Revenue related to the DJ Basin Acquisition that was included in the Company’s Consolidated Statements of Operations was approximately $6.1 million for the twelve months ended December 31, 2011 and net income was $1.0 million.
5. Long-Term Debt
The Company’s outstanding debt is summarized below (in thousands):
| As of December 31, 2011 | As of December 31, 2010 | |||||||||||||||||||||||||
Maturity Date | Principal | Unamortized Discount | Carrying Amount | Principal | Unamortized Discount | Carrying Amount | ||||||||||||||||||||
Credit Facility(1) | October 31, 2016 | $ | 70,000 | $ | 0 | $ | 70,000 | $ | 0 | $ | 0 | $ | 0 | |||||||||||||
9.875% Senior Notes(2) | July 15, 2016 | 250,000 | (8,802 | ) | 241,198 | 250,000 | (10,234 | ) | 239,766 | |||||||||||||||||
5% Convertible Notes(3) | March 15, 2028(4) | 172,500 | (1,458 | ) | 171,042 | 172,500 | (7,867 | ) | 164,633 | |||||||||||||||||
7.625% Senior Notes(5) | October 1, 2019 | 400,000 | 0 | 400,000 | 0 | 0 | 0 | |||||||||||||||||||
|
|
|
|
|
|
|
|
|
|
|
| |||||||||||||||
Total Long-Term Debt | $ | 892,500 | $ | (10,260 | ) | $ | 882,240 | $ | 422,500 | $ | (18,101 | ) | $ | 404,399 | ||||||||||||
|
|
|
|
|
|
|
|
|
|
|
| |||||||||||||||
| (1) | The recorded value of the credit facility approximates its fair value due to its floating rate structure. |
| (2) | The aggregate estimated fair value of the 9.875% Senior Notes was approximately $273.8 million as of December 31, 2011 based on reported market trades of these instruments. |
| (3) | The aggregate estimated fair value of the Convertible Notes was approximately $173.4 million as of December 31, 2011. Because there is no active, public market for the Convertible Notes, the fair value was based on market-based parameters of the various components of the Convertible Notes and over-the-counter trades. |
| (4) | The Company currently expects that the holders will put the Convertible Notes to the Company in March 2012, which would require the Company to settle the notes in cash. The Company has sufficient availability under the Amended Credit Facility with which to repay the Convertible Notes. The Company also has the option to call the Convertible Notes at any time thereafter. |
| (5) | The aggregate estimated fair value of the 7.625% Senior Notes was approximately $418.0 million as of December 31, 2011 based on reported market trades of these instruments. |
Amended Credit Facility
On March 16, 2010, the Company amended its revolving credit facility (the “Amended Credit Facility”) and extended the maturity date to April 1, 2014. The Amended Credit Facility bears interest, based on the borrowing
F-16
base usage, at the (i) London Interbank Offered Rate (“LIBOR”) plus applicable margins ranging from 2.0% to 3.0% or (ii) an alternate base rate (“ABR”), based upon the greater of the prime rate, the federal funds effective rate plus 0.5%, or the adjusted one month LIBOR plus 1.0%, plus applicable margins ranging from 1.0% to 2.0%.
On October 18, 2011, the Company further amended the Amended Credit Facility to extend the maturity date to October 31, 2016, increase commitments to $900.0 million and increase the borrowing base to $1.1 billion based upon June 30, 2011 reserves and hedge positions. The amendment also decreased the interest margin to LIBOR plus applicable margins of 1.5% to 2.5% or ABR plus 0.5% to 1.5% and reduced the commitment fee to between 0.375% to 0.5% based on borrowing base utilization. The average annual interest rates incurred on the Amended Credit Facility were 2.5% and 2.2% for each of the years ended December 31, 2011 and 2010, respectively.
The borrowing base is required to be re-determined twice per year. On June 30, 2011, the borrowing base was reaffirmed for the October 18, 2011 amendment which increased the borrowing base to $1.1 billion with commitments of $ 900.0 million based on June 30, 2011 reserves and hedge positions. Future borrowing bases will be computed based on proved oil and natural gas reserves, hedge positions and estimated future cash flows from those reserves, as well as any other outstanding debt of the Company. The Company pays annual commitment fees between 0.375% and 0.5% of the unused amount of the commitments. The Amended Credit Facility is secured by oil and natural gas properties representing at least 80% of the value of the Company’s proved reserves and the pledge of all of the stock of the Company’s subsidiaries. The Amended Credit Facility also contains certain financial covenants. The Company is currently in compliance with all financial covenants and has complied with all financial covenants for all prior periods. As of December 31, 2011, the Company had $70.0 million outstanding under the Amended Credit Facility. As credit support for future payment under a contractual obligation, a $26.0 million letter of credit was issued under the Amended Credit Facility, effective May 4, 2010, which reduced the borrowing capacity of the Amended Credit Facility by $26.0 million to $804.0 million.
5% Convertible Senior Notes Due 2028
On March 12, 2008, the Company issued $172.5 million aggregate principal amount of Convertible Notes. As of January 1, 2009 with the adoption of new authoritative accounting guidance under FASB ASC subtopic 470-20,Debt with Conversion Options, the Company recorded a debt discount of $23.1 million, which represented the fair value of the equity conversion feature as of the date of the issuance of the Convertible Notes. The value of the equity conversion feature was also recorded as APIC, net of $8.6 million of deferred taxes. The full $172.5 million principal amount of the Convertible Notes is currently outstanding. The Convertible Notes mature on March 15, 2028, unless earlier converted, redeemed or purchased by the Company. The Convertible Notes are senior unsecured obligations and rank equal in right of payment to all of the Company’s existing and future senior unsecured indebtedness; are senior in right of payment to all of the Company’s future subordinated indebtedness; and are effectively subordinated to all of the Company’s secured indebtedness with respect to the collateral securing such indebtedness. The Convertible Notes are structurally subordinated to all present and future secured and unsecured debt and other obligations of the Company’s subsidiaries. The Convertible Notes are fully and unconditionally guaranteed by the subsidiaries that guarantee the Company’s indebtedness under the Amended Credit Facility, the 9.875% Senior Notes and the 7.625% Senior Notes.
The conversion price is approximately $66.33 per share of the Company’s common stock, equal to the applicable conversion rate of 15.0761 shares of common stock, subject to adjustment, for each $1,000 of the principal amount of the Convertible Notes. Upon conversion of the Convertible Notes, holders will receive, at the Company’s election, cash, shares of common stock or a combination of cash and shares of common stock. If the conversion value exceeds $1,000, the Company will also deliver, at its election, cash, shares of common stock or a combination of cash and shares of common stock with respect to the remaining value deliverable upon conversion. Currently, it is the Company’s intention to net cash settle the Convertible Notes. However, the Company has not made a formal legal irrevocable election to net cash settle and reserves the right to settle the Convertible Notes in any manner allowed under the indenture for the Convertible Notes as business conditions warrant.
F-17
The Convertible Notes bear interest at a rate of 5% per annum, payable semi-annually in arrears on March 15 and September 15 of each year. On or after March 26, 2012, the Company may redeem for cash all or a portion of the Convertible Notes at a redemption price equal to 100% of the principal amount of the Convertible Notes to be redeemed, plus accrued and unpaid interest, if any, up to, but excluding, the applicable redemption date. Holders of the Convertible Notes may require the Company to purchase all or a portion of their Convertible Notes for cash on each of March 20, 2012, March 20, 2015, March 20, 2018 and March 20, 2023 at a purchase price equal to 100% of the principal amount of the Convertible Notes to be repurchased, plus accrued and unpaid interest, if any, up to but excluding the applicable purchase date. The Company currently expects to call the Convertible Notes to be redeemed in 2012 or that the holders will put the convertible Notes to the Company in 2012. The Company has sufficient availability under the Amended Credit Facility with which to repay the Convertible Notes.
9.875% Senior Notes Due 2016
On July 8, 2009, the Company issued $250.0 million in aggregate principal amount of 9.875% Senior Notes due 2016 at 95.172% of par resulting in a discount of $12.1 million. The 9.875% Senior Notes mature on July 15, 2016. Interest is payable in arrears semi-annually on January 15 and July 15, which began January 15, 2010. The Company received net proceeds of $232.3 million (net of related offering costs), which were used to repay a portion of the borrowings under the Amended Credit Facility. The 9.875% Senior Notes are senior unsecured obligations of the Company and rank equal in right of payment with all of the Company’s other existing and future senior unsecured indebtedness, including the Company’s Convertible Notes and 7.625% Senior Notes. The 9.875% Senior Notes are fully and unconditionally guaranteed by the subsidiaries that guarantee the Company’s indebtedness under the Amended Credit Facility, the Convertible Notes and the 7.625% Senior Notes. The 9.875% Senior Notes include certain covenants that limit the Company’s ability to incur additional indebtedness, pay dividends, make restricted payments, create liens and sell assets. The Company was in compliance with all financial covenants for all periods.
7.625% Senior Notes Due 2019
On September 27, 2011, the Company issued $400.0 million in principal amount of 7.625% Senior Notes due 2019 at par. The 7.625% Senior Notes will mature on October 1, 2019. Interest is payable in arrears semi-annually on April 1 and October 1 beginning April 1, 2012. The Company received net proceeds of $393.0 million (net of related offering costs), which were used to repay the outstanding borrowings under the Amended Credit Facility. The 7.625% Senior Notes are senior unsecured obligations and rank equal in right of payment with all of the Company’s other existing and future senior unsecured indebtedness. The 7.625% Senior Notes are fully and unconditionally guaranteed by the Company’s subsidiaries. The 7.625% Senior Notes include certain covenants that limit the Company’s ability to incur additional indebtedness, pay dividends, make restricted payments, create liens and sell assets. The Company is currently in compliance with all financial covenants and has complied with all financial covenants since issuance.
F-18
The following table summarizes the cash portion of interest expense related to the Amended Credit Facility, 9.875% and 7.625% Senior Notes and Convertible Notes along with the non-cash portion resulting from the amortization of the debt discount and transaction costs through interest expense:
| As of December 31, | ||||||||||||
| 2011 | 2010 | 2009 | ||||||||||
| (in thousands) | ||||||||||||
Amended Credit Facility(1) | ||||||||||||
Cash interest | $ | 5,432 | $ | 3,576 | $ | 5,186 | ||||||
Non-cash interest | 2,922 | 2,741 | 885 | |||||||||
9.875% Senior Notes(2) | ||||||||||||
Cash interest | $ | 24,688 | $ | 24,688 | $ | 11,795 | ||||||
Non-cash interest | 2,485 | 2,290 | 1,028 | |||||||||
Convertible Notes(3) | ||||||||||||
Cash interest | $ | 8,625 | $ | 8,625 | $ | 8,625 | ||||||
Non-cash interest | 7,548 | 7,000 | 6,498 | |||||||||
7.625% Senior Notes(4) | ||||||||||||
Cash interest | $ | 7,964 | $ | 0 | $ | 0 | ||||||
Non-cash interest | 332 | 0 | 0 | |||||||||
| (1) | Cash interest includes amounts related to interest and commitment fees paid on the Amended Credit Facility and participation and fronting fees paid on the letter of credit. |
| (2) | The stated interest rate for the 9.875% Senior Notes is 9.875% per annum with an effective interest rate of 11.3% per annum. |
| (3) | The stated interest rate for the Convertible Notes is 5% per annum with an effective interest rate of 9.7% per annum. The effective interest rate of the Convertible Notes includes amortization of the debt discount, which represented the fair value of the equity conversion feature at the time of issue. |
| (4) | The stated interest rate for the 7.625% Senior Notes is 7.625% per annum with an effective interest rate of 7.9% per annum. The cash interest will be paid with the first interest payment due on April 1, 2012. |
6. Asset Retirement Obligations
The estimated fair value of the future costs associated with dismantlement, abandonment and restoration of oil and gas properties is recorded generally upon acquisition or completion of a well. The net estimated costs are discounted to present values using a credit-adjusted discount rate over the estimated economic life of the oil and gas properties. Such costs are capitalized as part of the related asset. The asset is depleted on the units-of-production method on a field-by-field basis. The associated liability is classified in current and long-term liabilities in the Consolidated Balance Sheets. The liability is periodically adjusted to reflect (1) new liabilities incurred, (2) liabilities settled during the period, (3) accretion expense, and (4) revisions to estimated future cash flow requirements. The accretion expense is recorded as a component of DD&A expense in the Consolidated Statements of Operations.
F-19
A reconciliation of the Company’s asset retirement obligations for the years ended December 31, 2011, 2010 and 2009, which includes $1.6 million associated with assets that were held for sale as of December 31, 2009, is as follows:
| Year Ended December 31, | ||||||||||||
| 2011 | 2010 | 2009 | ||||||||||
| (in thousands) | ||||||||||||
Beginning of period | $ | 53,079 | $ | 49,067 | $ | 47,193 | ||||||
Liabilities incurred | 13,186 | 3,278 | 1,244 | |||||||||
Liabilities settled | (1,046 | ) | (3,513 | ) | (2,671 | ) | ||||||
Accretion expense | 4,083 | 3,507 | 3,301 | |||||||||
Revisions to estimate | 0 | 740 | 0 | |||||||||
|
|
|
|
|
| |||||||
End of period | $ | 69,302 | $ | 53,079 | $ | 49,067 | ||||||
|
|
|
|
|
| |||||||
Less: current asset retirement obligations | 715 | 809 | 703 | |||||||||
|
|
|
|
|
| |||||||
Long-term asset retirement obligations | $ | 68,587 | $ | 52,270 | $ | 48,364 | ||||||
|
|
|
|
|
| |||||||
7. Fair Value Measurements
Assets and Liabilities Measured on a Recurring Basis
The Company’s financial instruments, including cash and cash equivalents, accounts and notes receivable and accounts payable are carried at cost, which approximates fair value due to the short-term maturity of these instruments. The recorded value of the Amended Credit Facility, as discussed in Note 5, approximates its fair value due to its floating rate structure. The Company’s other financial and non-financial assets and liabilities that are measured on a recurring basis are measured and reported at fair value.
Fair value is defined as the price that would be received to sell an asset or paid to transfer a liability in an orderly transaction between market participants at the measurement date (exit price). The Company utilizes a mid-market pricing convention (the mid-point price between bid and ask prices) for valuation as a practical expedient for assigning fair value. The Company uses market data or assumptions that market participants would use in pricing the asset or liability, including assumptions about risk. These inputs can be readily observable, market corroborated or generally unobservable. The Company primarily applies the market and income approaches for recurring fair value measurements and utilizes the best available information. Given the Company’s historical market transactions, its markets and instruments are fairly liquid. Therefore, the Company has been able to classify fair value balances based on the observability of those inputs. A fair value hierarchy was established that prioritizes the inputs used to measure fair value. The hierarchy gives the highest priority to unadjusted quoted prices in active markets for identical assets or liabilities (Level 1 measurements) and the lowest priority to unobservable inputs (Level 3 measurements).
Level 1—Quoted prices are available in active markets for identical assets or liabilities as of the reporting date. Active markets are those in which transactions for the asset or liability occur in sufficient frequency and volume to provide pricing information on an ongoing basis. Level 1 primarily consists of financial instruments such as exchange-traded derivatives, listed securities and U.S. government treasury securities.
Level 2—Pricing inputs are other than quoted prices in active markets included in Level 1, which are either directly or indirectly observable as of the reporting date. Level 2 includes those financial instruments that are valued using models or other valuation methodologies. These models are primarily industry-standard models that consider various assumptions, including quoted forward prices for commodities, time value, volatility factors and current market and contractual prices for the underlying instruments, as well as other relevant economic measures. Substantially all of these assumptions are observable in the marketplace throughout the full term of the instrument, can be derived from observable data or are supported by
F-20
observable levels at which transactions are executed in the marketplace. Instruments in this category include non-exchange-traded derivatives such as over-the-counter forwards and options.
Level 3—Pricing inputs include significant inputs that are generally less observable than objective sources. These inputs may be used with internally developed methodologies that result in management’s best estimate of fair value. At each balance sheet date, the Company performs an analysis of all applicable instruments and includes in Level 3 all of those whose fair value is based on significant unobservable inputs.
The following tables set forth by level within the fair value hierarchy the Company’s financial assets and financial liabilities as of December 31, 2011 and 2010 that were measured at fair value on a recurring basis. Assets and liabilities are classified in their entirety based on the lowest level of input that is significant to the fair value measurement. The Company’s assessment of the significance of a particular input to the fair value measurement requires judgment and may affect the valuation of assets and liabilities and their placement within the fair value hierarchy levels.
As of December 31, 2011 | ||||||||||||||||
| Level 1 | Level 2 | Level 3 | Total | |||||||||||||
| (in thousands) | ||||||||||||||||
Assets | ||||||||||||||||
Deferred Compensation Plan | $ | 579 | $ | 0 | $ | 0 | $ | 579 | ||||||||
Cash Equivalents—Money Market Funds | 52,164 | 0 | 0 | 52,164 | ||||||||||||
Commodity Derivatives | 0 | 94,385 | 0 | 94,385 | ||||||||||||
Liabilities | ||||||||||||||||
Commodity Derivatives | $ | 0 | $ | (11,116 | ) | $ | 0 | $ | (11,116 | ) | ||||||
As of December 31, 2010 | ||||||||||||||||
| Level 1 | Level 2 | Level 3 | Total | |||||||||||||
| (in thousands) | ||||||||||||||||
Assets | ||||||||||||||||
Deferred Compensation Plan | $ | 260 | $ | 0 | $ | 0 | $ | 260 | ||||||||
Cash Equivalents—Money Market Funds | 59,997 | 0 | 0 | 59,997 | ||||||||||||
Commodity Derivatives | 0 | 81,685 | 0 | 81,685 | ||||||||||||
Liabilities | ||||||||||||||||
Commodity Derivatives | $ | 0 | $ | (25,294 | ) | $ | 0 | $ | (25,294 | ) | ||||||
All fair values reflected in the table above and on the Consolidated Balance Sheets have been adjusted for non-performance risk. For applicable financial assets carried at fair value, the credit standing of the counterparties is analyzed and factored into the fair value measurement of those assets. In addition, the fair value measurement of a liability has been adjusted to reflect the nonperformance risk of the Company. The following methods and assumptions were used to estimate the fair values of the assets and liabilities in the table above.
Level 1 Fair Value Measurements—The Company maintains a non-qualified deferred compensation plan (as discussed in more detail in Note 11) which allows certain management employees to defer receipt of a portion of their compensation. The Company maintains assets for the deferred compensation plan in a rabbi trust. The assets of the rabbi trust are invested in publicly traded mutual funds and are recorded in other current and other long-term assets on the Consolidated Balance Sheets. The company also has highly liquid short term investments in money market funds. The deferred compensation plan financial assets are reported at fair value based on active market quotes, which represent Level 1 inputs. The money market fund investments are recorded at carrying value, which approximates fair value, which represent Level 1 inputs.
Level 2 Fair Value Measurements—The fair value of the natural gas and crude oil forwards and options are estimated using a combined income and market valuation methodology with a mid-market pricing convention based upon forward commodity price and volatility curves. The curves are obtained from
F-21
independent pricing services reflecting broker market quotes. The Company did not make any adjustments to the obtained curves. The pricing services publish observable market information from multiple brokers and exchanges. No proprietary models are used by the pricing services for the inputs. The Company utilized the counterparties’ valuations to assess the reasonableness of the Company’s valuations.
Level 3 Fair Value Measurements—As of December 31, 2011 and 2010, and for the years ended December 31, 2011 and 2010, the Company did not have assets or liabilities that were measured on a recurring basis classified under a Level 3 fair value hierarchy.
Assets and Liabilities Measured on a Non-recurring Basis
The Company utilizes fair value on a non-recurring basis to perform impairment tests as required on its property and equipment when events and circumstances indicate a possible decline in the recoverability of the carrying value of such property and equipment. The inputs used to determine such fair value are primarily based upon internally developed cash flow models and would generally be classified within Level 3. The Company also applied fair value accounting guidance to measure the assets and liabilities acquired in the East Bluebell Acquisition and the DJ Basin Acquisition. These assets and liabilities are subject to fair value adjustments only in certain circumstances and are not subject to recurring revaluations. The final fair values of these items were primarily determined using the present value of estimated future cash inflows and outflows. Because of the unobservable nature of these inputs, they are classified within Level 3. See Note 4 for additional discussion of the East Bluebell Acquisition and the DJ Basin Acquisition and disclosure of the inputs used to determine the final fair value of the assets and liabilities acquired. Additionally, the Company uses fair value to determine the inception value of its asset retirement obligations. The inputs used to determine such fair value are primarily based upon costs incurred historically for similar work, as well as estimates from independent third parties for costs that would be incurred to restore leased property to the contractually stipulated condition and would generally be classified within Level 3.
8. Derivative Instruments
The Company uses financial derivative instruments as part of its price risk management program to achieve a more predictable cash flow from its production revenues by reducing its exposure to commodity price fluctuations. The Company has entered into financial commodity swap and collar contracts to fix the floor and ceiling prices related to the sale of a portion of the Company’s production. The Company does not enter into derivative instruments for speculative or trading purposes.
In addition to financial contracts, the Company may at times be party to various physical commodity contracts for the sale of natural gas that cover varying periods of time and have varying pricing provisions. These physical commodity contracts qualify for the normal purchase and normal sale exception and, therefore, are not subject to hedge or mark-to-market accounting. The financial impact of physical commodity contracts is included in oil and gas production revenues at the time of settlement.
F-22
All derivative instruments, other than those that meet the normal purchase and normal sale exception, as mentioned above, are recorded at fair value and included in the Consolidated Balance Sheets as assets or liabilities. The following table summarizes the location and fair value amounts of all derivative instruments in the Consolidated Balance Sheets as of the periods indicated:
| December 31, 2011 | December 31, 2010 | |||||||
| (in thousands) | ||||||||
Derivatives Designated as Cash Flow Hedging Instruments Assets: | ||||||||
Current: Derivative assets | $ | 80,653 | $ | 80,460 | ||||
Current: Derivative liabilities(1) | 1,984 | 0 | ||||||
Deferred financing costs and other noncurrent assets(2) | 9,064 | 0 | ||||||
Derivatives and other noncurrent liabilities(3) | (315 | ) | 1,166 | |||||
Liabilities: | ||||||||
Current: Derivative assets(4) | (1,410 | ) | (2,172 | ) | ||||
Current: Derivative liabilities | (578 | ) | (943 | ) | ||||
Deferred financing costs and other noncurrent assets(2)(4) | (162 | ) | 0 | |||||
Derivatives and other noncurrent liabilities(3) | (55 | ) | (2,925 | ) | ||||
|
|
|
| |||||
Total Derivatives Designated as cash flow hedging instruments | $ | 89,181 | $ | 75,586 | ||||
|
|
|
| |||||
Derivatives Not Designated as Cash Flow Hedging Instruments Assets: | ||||||||
Current: Derivative assets | $ | 2,589 | $ | 59 | ||||
Current: Derivative liabilities(1) | 95 | 0 | ||||||
Liabilities: | ||||||||
Current: Derivative assets(4) | (4,552 | ) | (13,427 | ) | ||||
Current: Derivative liabilities | (4,044 | ) | 0 | |||||
Derivatives and other noncurrent liabilities(3) | 0 | (5,827 | ) | |||||
|
|
|
| |||||
Total derivatives not designated as cash flow hedging instruments | $ | (5,912 | ) | $ | (19,195 | ) | ||
|
|
|
| |||||
Total Derivatives | $ | 83,269 | $ | 56,391 | ||||
|
|
|
| |||||
| (1) | Amounts are netted against derivative liability balances with the same counterparty, and, therefore, are presented as a net liability on the Consolidated Balance Sheet. |
| (2) | As of December 31, 2011, this line item on the Consolidated Balance Sheet also includes $25.9 million of deferred financing costs and other noncurrent assets. |
| (3) | As of December 31, 2011 and 2010, this line item on the Consolidated Balance Sheets also includes $2.9 million and $1.3 million of other noncurrent liabilities, respectively. |
| (4) | Amounts are netted against derivative asset balances with the same counterparty, and, therefore, are presented as a net asset on the Consolidated Balance Sheet. |
For derivative instruments that qualify and are designated as cash flow hedges, changes in fair value, to the extent the hedges are effective, are recognized in AOCI until the forecasted transaction occurs. The Company will reclassify the appropriate cash flow hedge amounts from AOCI to oil and gas production revenues in the Consolidated Statements of Operations as the hedged production quantity is sold. Based on projected market prices as of December 31, 2011, the amount to be reclassified from AOCI to net income in the next 12 months would be an after-tax net gain of approximately $50.8 million. Any actual increase or decrease in revenues will depend upon market conditions over the period during which the forecasted transactions occur. The Company anticipates that all originally forecasted transactions related to the Company’s derivatives that continue to be accounted for as cash flow hedges will occur by the end of the originally specified time periods.
The commodity hedge instruments designated as cash flow hedges are at highly liquid trading locations but may contain slight differences compared to the delivery location of the forecasted sale, which may result in ineffectiveness. Although those derivatives may not achieve 100% effectiveness for accounting purposes, the
F-23
Company believes that its derivative instruments continue to be highly effective in achieving its risk management objectives. The ineffective portion of commodity hedge derivatives is reported in commodity derivative loss in the Consolidated Statements of Operations. The following table summarizes the cash flow hedge gains and losses, net of tax, and their locations on the Consolidated Balance Sheets and Consolidated Statements of Operations as of the periods indicated:
| Derivatives Qualifying as Cash Flow Hedges | Year Ended December 31, | |||||||||||||
| 2011 | 2010 | 2009 | ||||||||||||
| (in thousands) | ||||||||||||||
Amount of Gain (Loss) Recognized in AOCI | Interest Rate Hedges(1) | $ | — | $ | — | $ | (185 | ) | ||||||
| Commodity Hedges(2) | 70,636 | 94,241 | 39,954 | |||||||||||
Amount of Gain (Loss) Reclassified from AOCI into Income | Interest Rate Hedges(1) | — | — | (505 | ) | |||||||||
| Commodity Hedges(2) | 62,421 | 100,822 | 177,936 | |||||||||||
Amount of Gain (Loss) Recognized in Income on Ineffective Hedges | Commodity Hedges(2) | 1,026 | (2,256 | ) | (5,572 | ) | ||||||||
| (1) | Gains and losses reclassified from AOCI into income are located in the Interest Expense line item in the Consolidated Statement of Operations. |
| (2) | Gains and losses reclassified from AOCI into income as well as gains and losses on ineffective hedges are located in the Oil and Gas Production Revenues and the Commodity Derivative Loss line item, respectively, in the Consolidated Statement of Operations. |
During the derivative’s term, if the Company determines that the hedge is no longer effective or necessary, hedge accounting is prospectively discontinued. All subsequent changes in the derivative’s fair value are recorded in earnings, and all accumulated gains and losses, based on the effective portion of the derivative at that date, recorded in AOCI will remain in AOCI and are reclassified to earnings when the underlying transaction occurs. If the forecasted transaction to which the hedging instrument had been designated is no longer probable of occurring within the specified time period, the hedging instrument loses cash flow hedge accounting treatment, and all subsequent mark-to-market gains and losses are recorded in earnings and all accumulated gains or losses recorded in AOCI related to the hedging instrument are also reclassified to earnings.
Some of the Company’s commodity derivative instruments do not qualify or are not designated as cash flow hedges but are, to a degree, an economic offset to the Company’s commodity price exposure. If a commodity derivative instrument does not qualify or is not designated as a cash flow hedge, the change in the fair value of the derivative is recognized in commodity derivative loss in the Consolidated Statements of Operations. These mark-to-market adjustments produce a degree of earnings volatility but have no cash flow impact relative to changes in market prices. The Company’s cash flow is only impacted when the underlying physical sales transaction takes place in the future and when the associated derivative instrument is settled by making or receiving a payment to or from the counterparty. Realized gains and losses of commodity derivative instruments that do not qualify as cash flow hedges are recognized in commodity derivative loss in the Consolidated Statements of Operations and are reflected in cash flows from operations on the Consolidated Statements of Cash Flows.
Effective January 1, 2012 the Company elected to discontinue hedge accounting prospectively. Consequently, as of January 1, 2012 the Company will no longer designate any hedges as cash flow hedges and the Company will de-designate all commodity hedge instruments that were previously designated as cash flow hedges. As a result of discontinuing hedge accounting on January 1, 2012, the mark-to-market value of all commodity hedge instruments within AOCI at December 31, 2011 will be frozen in AOCI as of the de-designation date and will be reclassified into earnings in future periods as the original hedged transactions affect earnings.
F-24
In addition to the swaps and collars discussed above, the Company has entered into basis only swaps. Basis only swaps hedge the difference between the New York Mercantile Exchange (“NYMEX”) gas price and the price received for the Company’s natural gas production at a specific delivery location. Although the Company believes that this is an appropriate part of a risk mitigation strategy, the basis only swaps do not qualify for hedge accounting because the total future cash flow has not been fixed. As a result, the changes in fair value of these derivative instruments are recorded in earnings and recognized in commodity derivative loss in the Consolidated Statements of Operations. The Company has also entered into swap contracts to hedge the amount received related to NGLs resulting from the processing of its natural gas. The NGL hedges were not designated as cash flow hedges and the changes in fair value of these derivative instruments were recorded in earnings.
The following table summarizes the location and amounts of gains and losses on derivative instruments that do not qualify for hedge accounting for the periods indicated:
| Location of Loss Recognized in Income on Derivatives | Year Ended December 31, | |||||||||||||
| 2011 | 2010 | 2009 | ||||||||||||
| (in thousands) | ||||||||||||||
Amount of Loss Recognized in Income on Derivatives | Commodity Derivative Loss | $ | (15,289 | ) | $ | (8,323 | ) | $ | (48,995 | ) | ||||
As of December 31, 2011, the Company had financial instruments in place to hedge the following volumes for the periods indicated:
| Year Ended December 31, | ||||||||||||
| 2012 | 2013 | 2014 | ||||||||||
| (in thousands) | ||||||||||||
Oil (Bbls) | 1,500,600 | 511,000 | 219,000 | |||||||||
Natural Gas (MMbtu) | 55,035,000 | 9,100,000 | 3,650,000 | |||||||||
Natural Gas Basis (MMbtu) | 7,320,000 | 0 | 0 | |||||||||
Natural Gas Liquids (Gallons) | 27,375,000 | 0 | 0 | |||||||||
As a result of the various swap and collar contracts that settled during the years ended December 31, 2011, 2010 and 2009, the Company recognized a net increase in natural gas production revenues of $73.9 million, $133.2 million and $265.1 million for the years ended December 31, 2011, 2010 and 2009, respectively. The Company also recognized a decrease in oil production revenues related to these contracts of $2.0 million for the year ended December 31, 2011 and increases of $2.2 million and $6.7 million during the years ended December 31, 2010 and 2009, respectively.
The table below summarizes the realized and unrealized gains and losses the Company recognized related to its oil and natural gas derivative instruments for the periods indicated:
| Year Ended December 31, | ||||||||||||
| 2011 | 2010 | 2009 | ||||||||||
| (in thousands) | ||||||||||||
Realized gains on derivatives designated as cash flow hedge(1) | $ | 99,922 | $ | 161,496 | $ | 282,734 | ||||||
|
|
|
|
|
| |||||||
Realized losses on derivatives not designated as cash flow hedges | $ | (28,054 | ) | $ | (26,166 | ) | $ | (10,902 | ) | |||
Unrealized ineffectiveness gains (losses) recognized on derivatives designated as cash flow hedges | 1,026 | (2,256 | ) | (5,572 | ) | |||||||
Unrealized gains (losses) on derivatives not designated as cash flow hedges | 12,765 | 17,843 | (38,093 | ) | ||||||||
|
|
|
|
|
| |||||||
Total commodity derivative loss(2) | $ | (14,263 | ) | $ | (10,579 | ) | $ | (54,567 | ) | |||
|
|
|
|
|
| |||||||
| (1) | Included in Oil and gas production revenues in the Consolidated Statements of Operations. |
| (2) | Included in Commodity derivative loss in the Consolidated Statements of Operations. |
F-25
Derivative financial instruments that hedge the price of oil and gas are generally executed with major financial or commodities trading institutions that expose the Company to market and credit risks and may, at times, be concentrated with certain counterparties or groups of counterparties. The Company has hedges in place with 12 different counterparties. Although notional amounts are used to express the volume of these contracts, the amounts potentially subject to credit risk, in the event of non-performance by the counterparties, are substantially smaller. The creditworthiness of counterparties is subject to continual review by management, and the Company believes all of these institutions currently are acceptable credit risks. Full performance is anticipated, and the Company has no past due receivables from any of its counterparties.
It is the Company’s policy to enter into derivative contracts with counterparties that are lenders in the Amended Credit Facility, affiliates of lenders in the Amended Credit Facility or potential lenders in the Amended Credit Facility. Two counterparties that were lenders in the Amended Credit Facility withdrew from the facility when the Company amended the facility in October 2011. The Company will continue to monitor the credit worthiness of these two counterparties during the remaining duration of the derivatives that were entered into while they were lenders in the Amended Credit Facility. The Company’s derivative contracts are documented using an industry standard contract known as a Schedule to the Master Agreement and International Swaps and Derivative Association, Inc. (“ISDA”) Master Agreement or other contracts. Typical terms for these contracts include credit support requirements, cross default provisions, termination events and set-off provisions. The Company is not required to provide any credit support to its counterparties other than cross collateralization with the properties securing the Amended Credit Facility. The Company has set-off provisions in its derivative contracts with lenders under its Amended Credit Facility which, in the event of a counterparty default, allow the Company to set-off amounts owed to the defaulting counterparty under the Amended Credit Facility or other obligations against monies owed the Company under derivative contracts. Where the counterparty is not a lender under the Company’s Amended Credit Facility, it may not be able to set-off amounts owed by the Company under the Amended Credit Facility, even if such counterparty is an affiliate of a lender under such facility.
9. Income Taxes
The expense for income taxes consists of the following:
| Year Ended December 31, | ||||||||||||
| 2011 | 2010 | 2009 | ||||||||||
| (in thousands) | ||||||||||||
Current: | ||||||||||||
Federal | $ | (18 | ) | $ | (7,798 | ) | $ | 6,158 | ||||
State | 0 | (1,663 | ) | 1,662 | ||||||||
Foreign | 2 | 1 | 74 | |||||||||
Deferred: | ||||||||||||
Federal | 16,804 | 53,548 | 25,513 | |||||||||
State | 884 | 3,865 | 4,549 | |||||||||
|
|
|
|
|
| |||||||
Total | $ | 17,672 | $ | 47,953 | $ | 37,956 | ||||||
|
|
|
|
|
| |||||||
F-26
Income tax expense differed from the amounts computed by applying the U.S. federal income tax rate of 35% to pretax income from continuing operations as a result of the following:
| Year Ended December 31, | ||||||||||||
| 2011 | 2010 | 2009 | ||||||||||
| (in thousands) | ||||||||||||
Income tax expense at the federal statutory rate | $ | 16,932 | $ | 44,958 | $ | 30,861 | ||||||
State income taxes, net of federal tax effect | 1,223 | 3,302 | 2,348 | |||||||||
Permanent items | (223 | ) | 457 | 1,014 | ||||||||
Deferred tax related to the changes in overall state tax rates | (286 | ) | (763 | ) | 2,783 | |||||||
Other, net | 26 | (1 | ) | 950 | ||||||||
|
|
|
|
|
| |||||||
Income tax expense | $ | 17,672 | $ | 47,953 | $ | 37,956 | ||||||
|
|
|
|
|
| |||||||
The tax effects of temporary differences that give rise to significant components of the deferred tax assets and deferred tax liabilities at December 31, 2011 and 2010 are presented below:
| As of December 31, | ||||||||
| 2011 | 2010 | |||||||
| (in thousands) | ||||||||
Current: | ||||||||
Deferred tax assets (liabilities): | ||||||||
Derivative instruments | $ | (29,360 | ) | $ | (23,168 | ) | ||
Accrued expenses | 286 | 187 | ||||||
Bad debt expense | 318 | 306 | ||||||
Prepaid expenses | (529 | ) | (278 | ) | ||||
Other | (316 | ) | 133 | |||||
|
|
|
| |||||
Total current deferred tax assets (liabilities) | $ | (29,601 | ) | $ | (22,820 | ) | ||
|
|
|
| |||||
Long-term: | ||||||||
Deferred tax assets: | ||||||||
Net operating loss carryforward | $ | 40,991 | $ | 32,724 | ||||
Deferred offering costs | 1,297 | 960 | ||||||
Stock-based compensation | 10,198 | 8,261 | ||||||
Deferred rent | 933 | 408 | ||||||
Long-term derivative instruments | 0 | 1,982 | ||||||
Minimum tax credit carryforward | 74 | 88 | ||||||
Deferred compensation | 217 | 94 | ||||||
State tax credit carryforwards | 4,172 | 0 | ||||||
Other | 227 | 127 | ||||||
Less valuation allowance | (4,172 | ) | 0 | |||||
|
|
|
| |||||
Total long-term deferred tax assets | 53,937 | 44,644 | ||||||
Deferred tax liabilities: | ||||||||
Oil and gas properties | (333,297 | ) | (307,697 | ) | ||||
Long-term derivative instruments | (1,882 | ) | 0 | |||||
Interest on convertible notes | (547 | ) | (2,956 | ) | ||||
Other | 0 | 0 | ||||||
|
|
|
| |||||
Total long-term deferred tax liabilities | (335,726 | ) | (310,653 | ) | ||||
|
|
|
| |||||
Net long-term deferred tax liabilities | $ | (281,789 | ) | $ | (266,009 | ) | ||
|
|
|
| |||||
F-27
At December 31, 2011, the Company had approximately $125.3 million of federal tax net operating loss carryforwards, that expire through 2031. The tax return net operating loss carryforward of $125.3 million is greater than the financial statement net operating loss carryforward by $13.4 million due to excess tax benefits related to stock-based compensation not recognized for financial reporting purposes. The Company has a federal alternative minimum tax credit carryforward of $0.1 million, which has no expiration date.
In assessing the realizability of deferred tax assets, management must consider whether it is more likely than not that some portion or all of the deferred tax assets will not be realized. Management considers all available evidence (both positive and negative) in determining whether a valuation allowance is required. Such evidence includes the scheduled reversal of deferred tax liabilities, projected future taxable income and tax planning strategies in making this assessment, and judgment is required in considering the relative weight of negative and positive evidence. The Company continues to monitor facts and circumstances in the reassessment of the likelihood that operating loss carryforwards, credits and other deferred tax assets will be utilized prior to their expiration. As a result, it may be determined that a deferred tax asset valuation allowance should be established. Any increases or decreases in a deferred tax asset valuation allowance would impact net income through offsetting changes in income tax expense. In 2011, the Company recorded a valuation allowance against a deferred tax asset of the same amount for state income tax credit carryforwards in the amount of $4.2 million. It is currently estimated that the $4.2 million of state income tax credits will not be utilized because the Company does not project to have sufficient future taxable income in the appropriate jurisdictions.
At December 31, 2011, the Consolidated Balance Sheet reflected a net deferred tax liability of $311.4 million, of which $33.7 million pertains to the tax effects reflected in AOCI.
The Company accounts for uncertainty in income taxes for tax positions taken or expected to be taken in a tax return. The Company recognizes the tax benefit from an uncertain tax position only if it is more likely than not that the tax position will be sustained upon examination by the taxing authorities, based on the technical merits.
A rollforward of changes in the Company’s unrecognized tax benefits is shown below:
| Year Ended December 31, | ||||||||||||
| 2011 | 2010 | 2009 | ||||||||||
| (in thousands) | ||||||||||||
Beginning balance | $ | 0 | $ | 165 | $ | 195 | ||||||
Additions based on tax positions related to the current year | 0 | 0 | 0 | |||||||||
Additions for tax positions of prior years | 0 | 0 | 0 | |||||||||
Reductions for tax positions of prior years | 0 | (165 | ) | (30 | ) | |||||||
Settlements | 0 | 0 | 0 | |||||||||
|
|
|
|
|
| |||||||
Ending balance | $ | 0 | $ | 0 | $ | 165 | ||||||
|
|
|
|
|
| |||||||
In 2011, the Company generated no uncertain tax positions. The Company anticipates that no uncertain tax positions will be recognized within the next 12-month period. The Company’s policy is to classify accrued penalties and interest related to unrecognized tax benefits in the Company’s income tax provision. As of December 31, 2011, the Company did not have any accrued interest or penalties associated with any unrecognized tax benefits, nor was any interest expense recognized during the current year.
The Company and its subsidiaries file income tax returns in the U.S. federal jurisdiction and in various states. With few exceptions, the Company is subject to U.S. federal tax examination for years 2008 through 2011 and is subject to state tax examination for years 2007 through 2011.
F-28
10. Stockholders’ Equity
Common and Preferred Stock. The Company’s authorized capital structure consists of 75,000,000 shares of preferred stock, par value $0.001 per share and 150,000,000 shares of common stock, par value $0.001 per share. In October 2004, 150,000 shares of $0.001 per share par value preferred stock were designated as Series A Junior Participating Preferred Stock, none of which are outstanding. The remainder of the authorized preferred stock is undesignated. There are no issued and outstanding shares of preferred stock.
When issued, each share of Series A Junior Participating Preferred Stock will entitle the holder thereof to 1,000 votes on all matters submitted to a vote of the Company’s stockholders.
Treasury Stock. The Company may occasionally acquire treasury stock, which is recorded at cost, in connection with the vesting and exercise of stock-based awards or for other reasons. As of December 31, 2011, all treasury stock held by the Company was retired.
The following table reflects the activity in the Company’s common and treasury stock for the periods indicated:
| Year Ended December 31, | ||||||||||||
| 2011 | 2010 | 2009 | ||||||||||
Common Stock Outstanding: | ||||||||||||
Shares at beginning of period | 46,813,269 | 45,475,585 | 45,128,431 | |||||||||
Exercise of common stock options | 836,833 | 892,624 | 37,897 | |||||||||
Shares issued for 401(k) plan | 20,913 | 22,837 | 30,502 | |||||||||
Shares issued for directors’ fees | 7,636 | 9,174 | 9,141 | |||||||||
Shares issued for nonvested equity shares of common stock | 353,716 | 633,024 | 425,379 | |||||||||
Shares retired or forfeited | (222,464 | ) | (219,975 | ) | (155,765 | ) | ||||||
|
|
|
|
|
| |||||||
Shares at end of period | 47,809,903 | 46,813,269 | 45,475,585 | |||||||||
|
|
|
|
|
| |||||||
Treasury Stock: | ||||||||||||
Shares at beginning of period | 0 | 0 | 0 | |||||||||
Treasury stock acquired | 113,715 | 115,391 | 90,937 | |||||||||
Treasury stock retired | (113,715 | ) | (115,391 | ) | (90,937 | ) | ||||||
|
|
|
|
|
| |||||||
Shares at end of period | 0 | 0 | 0 | |||||||||
|
|
|
|
|
| |||||||
F-29
Accumulated Other Comprehensive Income. The components of accumulated other comprehensive income and related tax effects for the years ended December 31, 2008, 2009, 2010 and 2011 were as follows:
| Gross | Tax Effect | Net of Tax | ||||||||||
| (in thousands) | ||||||||||||
Accumulated other comprehensive income—December 31, 2008 | $ | 305,410 | $ | (113,338 | ) | $ | 192,072 | |||||
|
|
|
|
|
| |||||||
Unrealized change in fair value of hedges | 63,794 | (24,025 | ) | 39,769 | ||||||||
Reclassification adjustment for realized gains on hedges included in net income | (281,924 | ) | 104,493 | (177,431 | ) | |||||||
|
|
|
|
|
| |||||||
Accumulated other comprehensive income—December 31, 2009 | $ | 87,280 | $ | (32,870 | ) | $ | 54,410 | |||||
|
|
|
|
|
| |||||||
Unrealized change in fair value of hedges | 150,829 | (56,588 | ) | 94,241 | ||||||||
Reclassification adjustment for realized gains on hedges included in net income | (161,496 | ) | 60,674 | (100,822 | ) | |||||||
|
|
|
|
|
| |||||||
Accumulated other comprehensive income—December 31, 2010 | $ | 76,613 | $ | (28,784 | ) | $ | 47,829 | |||||
|
|
|
|
|
| |||||||
Unrealized change in fair value of hedges | 113,023 | (42,387 | ) | 70,636 | ||||||||
Reclassification adjustment for realized gains on hedges included in net income | (99,922 | ) | 37,501 | (62,421 | ) | |||||||
|
|
|
|
|
| |||||||
Accumulated other comprehensive income—December 31, 2011 | $ | 89,714 | $ | (33,670 | ) | $ | 56,044 | |||||
|
|
|
|
|
| |||||||
11. Equity Incentive Compensation Plans and Other Employee Benefits
The Company maintains various stock-based compensation plans and other employee benefits as discussed below. Stock-based compensation is measured at the grant date based on the value of the awards, and the fair value is recognized on a straight-line basis over the requisite service period (usually the vesting period).
The following table presents the non-cash stock-based compensation related to equity awards for the periods indicated:
| Year ended December 31, | ||||||||||||
| 2011 | 2010 | 2009 | ||||||||||
| (in thousands) | ||||||||||||
Common stock options | $ | 7,569 | $ | 7,915 | $ | 7,520 | ||||||
Nonvested equity common stock | 8,703 | 6,814 | 6,947 | |||||||||
Nonvested performance-based equity | 2,535 | 2,098 | 2,402 | |||||||||
Market performance-based equity | 589 | 526 | 0 | |||||||||
|
|
|
|
|
| |||||||
Total | $ | 19,396 | $ | 17,353 | $ | 16,869 | ||||||
|
|
|
|
|
| |||||||
Unrecognized compensation cost as of December 31, 2011 was $25.4 million related to grants of nonvested stock options and nonvested equity shares of common stock that are expected to be recognized over a weighted-average period of 2.5 years.
Stock Options and Nonvested Equity Shares. In January 2002, the Company adopted a stock option plan to benefit key employees, directors and non-employees. This plan was amended and restated in its entirety by the Amended and Restated 2002 Stock Option Plan (the “2002 Option Plan”). The aggregate number of shares that the Company may issue under the 2002 Option Plan may not exceed 1,642,395 shares of the Company’s common stock. Options granted under the 2002 Option Plan expire up to ten years from the grant date. The options vest 40% on the first anniversary of the date of grant and 20% on each of the following three anniversaries of the date of grant.
F-30
In December 2003, the Company adopted its 2003 Stock Option Plan (the “2003 Option Plan”) to benefit key employees, directors and non-employees. In April 2004, the 2003 Option Plan was approved by the Company’s stockholders. The aggregate number of shares that the Company may issue under the 2003 Option Plan may not exceed 42,936 shares of the Company’s common stock. Options granted under the 2003 Option Plan expire up to ten years from the date of grant with an exercise price not less than 100% of the fair market value, as defined in the 2003 Option Plan, of the underlying common shares on the date of grant. Options granted under the 2003 Option Plan vest 25% on each of the first four anniversaries of the date of grant.
In December 2004, the Company’s stockholders approved the 2004 Stock Incentive Plan (the “2004 Incentive Plan”) for the purpose of enhancing the Company’s ability to attract and retain officers, employees, directors and consultants and to provide such persons with an interest in the Company parallel to its stockholders. The maximum number of shares that may be granted under the 2004 Incentive Plan is 4,900,000 shares. In addition, the maximum number of shares of common stock that may be granted to a participant in any one year is 1,225,000 shares. Options granted to date under the 2004 Incentive Plan generally expire seven years from the date of grant and vest 25% on each of the first four anniversaries of the date of grant.
In May 2008, the Company’s stockholders approved the 2008 Stock Incentive Plan (the “2008 Incentive Plan”). The total number of shares of the Company’s common stock available for issuance under the 2008 Incentive Plan is 3,000,000 shares, subject to adjustment for future stock splits, stock dividends and similar changes in the Company’s capitalization. The maximum number of shares of common stock that may be the subject of awards other than options and stock appreciation rights is 1,000,000 shares, while the maximum number of shares of common stock that may be issued pursuant to stock options and stock appreciation rights is 3,000,000 shares. The aggregate number of shares of common stock subject to options and/or stock appreciation rights granted during any calendar year to any one participant may not exceed 500,000 shares. The aggregate number of shares of common stock subject to restricted stock and/or restricted stock unit awards granted during any calendar year to any one participant may not exceed 500,000 shares. Options granted to date under the 2008 Incentive Plan generally expire seven years from the date of grant and vest 25% on each of the first four anniversaries of the date of grant.
The Company’s Compensation Committee may grant awards on such terms, including vesting and payment forms, as it deems appropriate within its discretion; however, no award may be exercised more than 10 years after its grant (five years in the case of an incentive stock option granted to an eligible individual who possesses more than 10% of the total combined voting power of all classes of stock of the Company). The purchase price or the manner in which the exercise price is to be determined for shares under each award will be determined by the Compensation Committee and set forth in the agreement. However, the exercise price per share under each award may not be less than 100% of the fair market value of a share on the date the award is granted (110% in the case of an incentive stock option granted to an eligible individual who possesses more than 10% of the total combined voting power of all classes of stock of the Company).
Currently, the Company’s practice is to issue new shares upon stock option exercise. The Company does not expect to repurchase any shares in the open market or issue treasury shares to settle any such exercises. For the years ended December 31, 2011, 2010 and 2009, the Company did not pay cash to repurchase any stock option exercises.
The fair value of each share-based option award under all of the Company’s plans is estimated on the date of grant using a Black-Scholes pricing model that incorporates the assumptions noted in the following table. For expected terms for which the Company had adequate historical data relating to its own common stock, estimated expected volatilities were based upon historical volatility of the Company’s common stock. Where the Company did not have enough historical data relating to its own common stock to compute volatilities associated with certain expected terms, expected volatilities were estimated based on an average of volatilities of similar sized oil and gas companies in the Rocky Mountain region whose common stock is publicly traded. The Company does not expect to declare or pay dividends in the foreseeable future; thus, the Company used a 0% expected dividend
F-31
yield, which is comparable to most of its peers in the industry. The expected terms range from 1.25 years to 6.0 years, or a weighted average of 4.5 years to 4.6 years, based on 25% of each grant’s vesting on each anniversary date and factoring in potential blackout dates, historic exercises and expectations of future employee behavior. The risk-free rate is based on the U.S. Treasury yield curve in effect on the date of grant and extrapolated to approximate the expected life of the award. The Company estimated a 4% to 10% annual compounded forfeiture rate for the years 2011, 2010 and 2009 based on historical employee turnover and actual forfeitures.
| Year Ended December 31, | ||||||||||||
| 2011 | 2010 | 2009 | ||||||||||
Weighted average volatility | 55 | % | 57 | % | 55 | % | ||||||
Expected dividend yield | 0 | % | 0 | % | 0 | % | ||||||
Weighted average expected term (in years) | 4.5 | 4.6 | 4.6 | |||||||||
Weighted average risk-free rate | 1.9 | % | 2.0 | % | 1.7 | % | ||||||
A summary of share-based option activity under all the Company’s plans as of December 31, 2011, and changes during the year then ended, is presented below:
| Shares | Weighted-average Exercise Price | Weighted-average remaining contractual term | Aggregate intrinsic value(1) | |||||||||||||
Outstanding at January 1, 2011 | 3,549,985 | $ | 31.40 | |||||||||||||
Granted | 301,124 | 40.13 | ||||||||||||||
Exercised | (836,833 | ) | 27.29 | |||||||||||||
Forfeited or expired | (128,770 | ) | 32.40 | |||||||||||||
|
| |||||||||||||||
Outstanding at December 31, 2011 | 2,885,506 | $ | 33.46 | 3.64 | $ | 10,020,833 | ||||||||||
|
| |||||||||||||||
Vested, or expected to vest, at December 31, 2011 through the life of the options | 2,825,614 | $ | 33.42 | 3.60 | $ | 9,861,682 | ||||||||||
Vested and exercisable at December 31, 2011 | 1,742,551 | $ | 33.47 | 2.77 | $ | 5,851,528 | ||||||||||
| (1) | The aggregate intrinsic value includes 1,252,934 awards outstanding at December 31, 2011, 1,233,035 awards vested or expected to vest at December 31, 2011 and 732,800 awards vested and exercisable at December 31, 2011 that have no intrinsic value based on the Company’s closing stock price of $34.07 on December 31, 2011. |
The per share weighted-average grant date fair value of options granted for the years ended December 31, 2011, 2010 and 2009 was $12.55, $10.55 and $10.79, respectively, and the total intrinsic value of options exercised during the same periods was $10.0 million, $9.7 million and $0.4 million, respectively. The aggregate intrinsic value in the preceding table represents the total pre-tax intrinsic value, based on the Company’s closing stock price of $34.07 on December 31, 2011. With respect to stock option exercises, the Company received $22.2 million, $23.7 million and $0.9 million for the years ended December 31, 2011, 2010 and 2009, respectively.
F-32
A summary of the Company’s nonvested equity shares of common stock as of December 31, 2011, 2010 and 2009, and changes during the years then ended, is presented below:
| 2011 | 2010 | 2009 | ||||||||||||||||||||||
| Shares | Weighted-average Grant Date Fair-Value | Shares | Weighted-average Grant Date Fair-Value | Shares | Weighted-average Grant Date Fair-Value | |||||||||||||||||||
Outstanding at January 1, | 603,521 | $ | 30.94 | 568,572 | $ | 30.19 | 424,303 | $ | 36.72 | |||||||||||||||
Granted | 346,956 | 39.49 | 299,996 | 32.36 | 351,700 | 24.69 | ||||||||||||||||||
Vested | (220,006 | ) | 31.83 | (205,559 | ) | 31.27 | (145,803 | ) | 35.46 | |||||||||||||||
Forfeited or expired | (90,843 | ) | 32.03 | (59,488 | ) | 29.78 | (61,628 | ) | 31.27 | |||||||||||||||
|
|
|
|
|
| |||||||||||||||||||
Outstanding at December 31, | 639,628 | $ | 35.12 | 603,521 | $ | 30.94 | 568,572 | $ | 30.19 | |||||||||||||||
|
|
|
|
|
| |||||||||||||||||||
Vested, or expected to vest, at December 31, through the life of the awards | 578,131 | $ | 34.94 | 556,822 | $ | 30.94 | 534,458 | $ | 30.19 | |||||||||||||||
The fair value of equity awards vested for the years ended December 31, 2011, 2010 and 2009 was $8.8 million, $6.9 million and $3.5 million, respectively. The excess tax benefit realized from stock options and restricted stock is recognized as a credit to APIC and is calculated as the amount by which the tax deduction the Company receives exceeds the deferred tax asset associated with recorded stock compensation expense. The Company did not realize any excess tax benefits from stock compensation for the years ended December 31, 2011, 2010 or 2009 because there was not sufficient taxable income to realize the deduction due to the availability of federal and/or state net operating loss carryforwards.
Performance Share Programs.On May 9, 2007, the Compensation Committee of the Board of Directors of the Company approved a performance share program (the “2007 Program”) pursuant to the Company’s 2004 Incentive Plan for the Company’s officers and other senior employees, pursuant to which vesting of awards is contingent upon meeting various Company-wide performance goals. Upon commencement of the 2007 Program and during each subsequent year of the 2007 Program, the Compensation Committee met to approve target and stretch goals for certain operational or financial metrics that were selected by the Compensation Committee for the upcoming year and to determine whether metrics for the prior year had been met. These performance-based awards contingently vested over a period up to four years, depending on the level at which the performance goals were achieved. Each year for four years, it was possible for up to 50% of the original shares to vest based on the achievement of the performance goals. Twenty-five percent of the total grant would vest for metrics met at the target level, and an additional 25% of the total grant would vest for performance met at the stretch level. If the actual results for a metric were between the target levels and the stretch levels, the vested number of shares was adjusted on a prorated basis of the actual results compared to the target and stretch goals. If the target level metrics were not met, no shares would vest. In any event, the total number of common shares that could vest could not exceed the original number of performance shares granted. At the end of four years, any shares that had not vested were to be forfeited. A total of 250,000 shares under the 2004 Incentive Plan were set aside for the 2007 Program.
As new goals were established each year for the performance-based awards, a new grant date and a new fair value was created for financial reporting purposes for those shares that could potentially vest in the upcoming year. Compensation cost was recognized based upon an estimate of the extent to which the performance goals would be met. If such goals were not met, no compensation cost was recognized and any previously recognized compensation cost was reversed.
F-33
Based upon Company performance in 2007, 30% of the performance shares vested in February 2008. Based upon the Company’s performance in 2008, 50% of the performance shares vested in February 2009. After the February 2009 vesting, 20% of the initial grant remained available for future performance vesting. On February 26, 2009, the Compensation Committee approved a supplemental grant to each participant remaining in the performance share program equal to 30% of the initial grant received by that participant (a total of 72,479 shares) in order to provide sufficient shares so that up to 50% of the performance shares initially granted to each participant would be available for vesting if all stretch goals for 2009 were met. Based upon the Company’s performance in 2009, 50% of the total performance shares (including the supplemental grant) vested in February 2010. The Company recorded non-cash stock-based compensation cost associated with these shares of $0.2 million and $2.4 million for the years ended December 31, 2010 and 2009, respectively.
In February 2010, the Compensation Committee approved a new performance share program (the “2010 Program”) pursuant to the Company’s 2008 Incentive Plan. A total of 325,000 shares under the 2008 Incentive Plan were set aside for this program. The 2010 Program has the same four-year term and vesting provisions as the 2007 Program. For the year ended December 31, 2010, the performance goals consisted of finding and development costs per Mcfe (weighted at 37.5%), combined lease operating expenses and general and administrative expenses (weighted at 25%) and production growth (weighted at 37.5%). Based on the Company’s performance with respect to those metrics and the Compensation Committee’s approval, 25.9% of the total grant related to the year ended December 31, 2010 performance metrics vested in February 2011. Accordingly, the Company recorded non-cash stock-based compensation cost associated with these shares of $0.2 million and $1.9 million for the years ended December 31, 2011 and 2010, respectively.
In 2010, the Company also issued nonvested equity awards that are subject to a market performance-based vesting condition, which is based on the Company’s total stockholder return (“TSR”) ranking relative to a defined peer group’s individual TSR. The aggregate grant date fair value of the market-based awards was determined using the Monte Carlo simulation method. The fair value of the market-based awards is amortized ratably over the four year requisite service period. All compensation expense related to the market-based awards will be recognized if the requisite service period is fulfilled, even if the market condition is not achieved. Based on the Company’s TSR performance and the Compensation Committee’s approval, 37.5% of the total TSR grant related to the year ended December 31, 2010 performance metrics vested in February 2011. The Company recorded non-cash stock-based compensation related to market-based equity awards of $0.5 million for the year ended December 31, 2010.
In March 2011, the Compensation Committee set the performance metrics under the 2010 Program for vesting of the performance shares based on 2011 performance. For the year ending December 31, 2011, the performance goals consist of annual production growth (weighted at 25%), increases to oil and natural gas proved, probable and possible reserves (weighted at 25%), finding and development costs (weighted at 25%) and increases to the Company’s present value (at a 10% annual discount) of future net cash flows from proved reserves (weighted at 25%). For the year ended December 31, 2011, the remaining nonvested performance shares that were granted in 2010, along with 4,922 performance-based nonvested equity shares of common stock that were granted in February 2011, were subject to the new grant date, and the fair value was remeasured at $39.88 per share. The Company granted an additional 640 performance-based nonvested equity shares of common stock at a fair value of $45.27 during the year ended December 31, 2011. Based on the Company’s performance with respect to those metrics and the Compensation Committee’s approval, 26.6% of the total grant related to the year ended December 31, 2011 performance metrics will vest in February 2012. Accordingly, the Company recorded non-cash stock-based compensation cost associated with these shares of $2.4 million for the year ended December 31, 2011. As of December 31, 2011, there was $0.2 million of total compensation expense that will be recognized through February 2012, which represents the remaining time vesting requirement.
In March 2011, the Compensation Committee set the market-based performance metrics under the 2010 Program for the vesting of the market-based performance awards based on 2011 performance. The remaining unvested market-based performance shares that were granted in 2010, along with 1,038 market-based equity
F-34
shares that were granted in February 2011, were subject to a new grant date, and the fair value was remeasured at $39.88 per share. During the year ended December 31, 2011, the Company granted an additional 160 market-based non-vested equity shares of common stock at a fair value of $45.27. The fair value of the market-based awards is amortized ratably over the requisite service period. All compensation expense related to the market-based awards will be recognized if the requisite service period is fulfilled, even if the market condition is not achieved. Based on the Company’s TSR performance and the Compensation Committee’s approval, 12.5% of the total TSR grant related to the December 31, 2011 performance metrics will vest in February 2012. The Company recorded non-cash stock-based compensation related to market-based equity awards of $0.6 million for the year ended December 31, 2011. As of December 31, 2011, there was $0.8 million of total compensation expense that will be recognized over 2.1 years.
A summary of the Company’s non-vested performance-based equity shares of common stock as of December 31, 2011, 2010 and 2009, and changes during the years then ended, is presented below:
| 2011 | 2010 | 2009 | ||||||||||||||||||||||
| Shares | Weighted- average Grant Date Fair Value | Shares | Weighted- average Grant Date Fair Value | Shares | Weighted- average Grant Date Fair Value | |||||||||||||||||||
Outstanding at January 1, | 287,932 | $ | 31.76 | 117,849 | $ | 19.58 | 165,795 | $ | 42.49 | |||||||||||||||
Vested | (81,156 | ) | 32.10 | (117,849 | ) | 19.58 | (118,425 | ) | 42.49 | |||||||||||||||
Modified, performance goals revised(1) | (192,821 | ) | 32.18 | 19.58 | (47,370 | ) | 42.49 | |||||||||||||||||
Modified, performance goals revised(1) | 192,821 | 39.88 | 19.58 | 47,370 | 19.58 | |||||||||||||||||||
Granted | 6,760 | 40.52 | 333,028 | 31.60 | 73,679 | 19.58 | ||||||||||||||||||
Forfeited or expired | (17,906 | ) | 30.94 | (45,096 | ) | 30.61 | (3,200 | ) | 19.58 | |||||||||||||||
|
|
|
|
|
| |||||||||||||||||||
Outstanding at December 31, | 195,630 | $ | 33.36 | 287,932 | $ | 31.76 | 117,849 | $ | 19.58 | |||||||||||||||
|
|
|
|
|
| |||||||||||||||||||
Vested, or expected to vest, at December 31, through the life of the awards | 183,178 | $ | 33.37 | 266,660 | $ | 31.74 | 117,849 | $ | 19.58 | |||||||||||||||
| (1) | As the Compensation Committee approved new performance metrics for the vesting of performance shares in the upcoming year, a new grant date was then created for any unvested awards that were granted in previous years, and a new fair value was established for financial reporting purposes. |
The fair value of the performance-based shares vested in the years ended December 31, 2011, 2010 and 2009 was $2.3 million, $3.7 million and $2.7 million, respectively. The fair value of the market-based performance shares vested in the year ended December 31, 2011 was $0.8 million. The Company did not have any market-based performance shares vested in the years ended December 31, 2010 and 2009.
Director Fees. The Company’s non-employee, or outside, directors may elect to receive all or a portion of their annual retainer and meeting fees in the form of the Company’s common stock issued pursuant to the Company’s 2004 Incentive Plan. After each quarter, shares of common stock with a value equal to the fees payable for that quarter, calculated using the closing price on the last trading day before the end of the quarter, will be delivered to each outside director who elected before that quarter to receive shares for payment of director fees.
A summary of the Company’s directors’ fees and share-based compensation for the years ended December 31, 2011, 2010 and 2009 is presented below:
| Year Ended December 31, | ||||||||||||
| 2011 | 2010 | 2009 | ||||||||||
Director fees (shares) | 7,636 | 9,174 | 9,141 | |||||||||
Share-based compensation (in thousands) | $ | 307 | $ | 313 | $ | 252 | ||||||
F-35
Other Employee Benefits-401(k) Savings Plan. The Company has an employee-directed 401(k) savings plan (the “401(k) Plan”) for all eligible employees over the age of 21. Under the 401(k) Plan, employees may make voluntary contributions based upon a percentage of their pretax income.
The Company matches 100% of each employee’s contribution, up to 6% of the employee’s pretax income, with 50% of the match made with the Company’s common stock. The Company’s cash and common stock contributions are fully vested upon the date of match and employees can immediately sell the portion of the match made with the Company’s common stock. The Company made matching cash and common stock contributions of $1.7 million, $1.6 million and $1.6 million for the years ended December 31, 2011, 2010 and 2009, respectively.
Deferred Compensation Plan. In 2010, the Company adopted a non-qualified deferred compensation plan for certain employees and officers whose eligibility to participate in the plan was determined by the Compensation Committee of the Company’s Board of Directors. The Company makes matching cash contributions on behalf of eligible employees up to 6% of the employee’s cash compensation once the contribution limits are reached on the Company’s 401(k) Plan. All amounts deferred and matched under the plan vest immediately.
Participants earn a return on their deferred compensation based on investment earnings of participant-selected mutual funds. Participants’ deferred compensation amounts are not directly invested in these investment vehicles; however, the Company tracks the performance of each participant’s investment selections and adjusts the deferred compensation liability accordingly. Changes in the market value of the participants’ investment selections are recorded as an adjustment to deferred compensation liabilities, with an offset to compensation expense included within general and administrative expenses in the Consolidated Statements of Operations. Deferred compensation, including accumulated earnings on the participant-directed investment selections, is distributable in cash at participant-specified dates or upon retirement, death, disability, change in control or termination of employment.
The table below summarizes the activity in the plan during the years ended December 31, 2011 and 2010 and the Company’s ending deferred compensation liability as of December 31, 2011 and 2010 (in thousands):
| 2011 | 2010 | |||||||
Beginning deferred compensation liability balance | $ | 260 | $ | 0 | ||||
Employee contributions | 183 | 145 | ||||||
Company matching contributions | 175 | 104 | ||||||
Distributions | (34 | ) | 0 | |||||
Participant earnings (losses) | (5 | ) | 11 | |||||
|
|
|
| |||||
Ending deferred compensation liability balance | $ | 579 | $ | 260 | ||||
|
|
|
| |||||
Amount to be paid within one year | $ | 157 | $ | 27 | ||||
Remaining balance to be paid beyond one year | $ | 422 | $ | 233 | ||||
The Company is not obligated to fund the liability. It has, however, established a rabbi trust to offset the deferred compensation liability and protect the interests of the plan participants. The trust assets are invested in publicly-traded mutual funds. The investments in the rabbi trust seek to offset the change in the value of the related liability. As a result, there is no expected impact on earnings or earnings per share from the changes in market value of the investment assets because the changes in market value of the trust assets are offset by changes in the value of the deferred compensation plan liability. The gains and losses from changes in fair value of the investments are included in interest and other income in the Consolidated Statements of Operations.
F-36
The following table represents the Company’s activity in the investment assets held in the rabbi trust during the years ended December 31, 2011 and 2010 (in thousands):
| 2011 | 2010 | |||||||
Beginning investment balance | $ | 260 | $ | 0 | ||||
Investment purchases | 362 | 249 | ||||||
Distributions | (34 | ) | 0 | |||||
Earnings (losses) | (9 | ) | 11 | |||||
|
|
|
| |||||
Ending investment balance | $ | 579 | $ | 260 | ||||
|
|
|
| |||||
12. Significant Customers and Other Concentrations
Significant Customers. During 2011, the Company had three customers individually account for over 10% of the Company’s oil and gas production revenues. During 2010, the Company had two customers individually account for over 10% of the Company’s oil and gas production revenues. During 2009, The Company had two customers individually account for over 10% of the Company’s oil and gas production revenues. Management believes that the loss of any individual purchaser would not have a long-term material adverse impact on the financial position or results of operations of the Company.
Concentrations of Market Risk. The future results of the Company’s oil and gas operations will be affected by the market prices of oil and natural gas. A readily available market for crude oil, natural gas and liquid products in the future will depend on numerous factors beyond the control of the Company, including weather, imports, marketing of competitive fuels, proximity and capacity of oil and gas pipelines and other transportation facilities, any oversupply or undersupply of oil, gas and liquid products, the regulatory environment, the economic environment and other regional, national and international economic and political events, none of which can be predicted with certainty.
The Company operates in the exploration, development and production phase of the oil and gas industry. Its receivables include amounts due from purchasers of oil and gas production and amounts due from joint venture partners for their respective portions of operating expenses and exploration and development costs. The Company believes that no single customer or joint venture partner exposes the Company to significant credit risk. While certain of these customers and joint venture partners are affected by periodic downturns in the economy in general or in their specific segment of the natural gas or oil industry, the Company believes that its level of credit-related losses due to such economic fluctuations has been and will continue to be immaterial to the Company’s results of operations in the long-term. Trade receivables are generally not collateralized. The Company analyzes customers’ and joint venture partners’ historical credit positions and payment histories prior to extending credit.
Concentrations of Credit Risk. Derivative financial instruments that hedge the price of oil and gas and interest rate levels are generally executed with major financial or commodities trading institutions which expose the Company to market and credit risks and may, at times, be concentrated with certain counterparties or groups of counterparties. The Company’s policy is to execute financial derivatives only with major, credit worthy financial institutions. The Company has hedges in place with 12 different counterparties, of which 10 are lenders or affiliates of lenders in the Amended Credit Facility. It is the Company’s policy to enter into derivative contracts with counterparties that are lenders in the Amended Credit Facility, affiliates of lenders in the Amended Credit Facility or potential lenders in the Amended Credit Facility. Two counterparties that were lenders in the Amended Credit Facility withdrew from the facility when the Company amended the facility in October 2011. The Company will continue to monitor the credit worthiness of these two counterparties during the remaining duration of the derivatives that were entered into while they were lenders in the Amended Credit Facility. The Company’s derivative contracts are documented using an industry standard contract known as an ISDA master agreement or other contracts.
F-37
The credit worthiness of counterparties is subject to continuing review, and the Company believes all of these institutions currently are acceptable credit risks. Full performance is anticipated, and the Company has no past due receivables from any of its counterparties. Where the counterparty is a lender under the Amended Credit Facility, the counterparty risk is mitigated to the extent that the Company is indebted to such lender under the Amended Credit Facility.
13. Commitments and Contingencies
Transportation Demand and Firm Processing Charges. The Company has entered into contracts that provide firm transportation capacity on pipeline systems and firm processing charges. The remaining terms on these contracts range from one to 12 years and require the Company to pay transportation demand and processing charges regardless of the amount of pipeline capacity utilized by the Company. The Company paid $35.3 million, $18.1 million and $15.5 million of transportation demand charges for the years ended December 31, 2011, 2010 and 2009, respectively. The Company paid $5.0 million, $4.1 million and $4.1 million of firm processing charges for the years ended December 31, 2011, 2010 and 2009, respectively. All transportation costs, including demand charges and processing charges, are included in gathering, transportation and processing expense in the Consolidated Statements of Operations.
The values in the table below represent the Company’s gross future minimum transportation demand and firm processing charges as of and subsequent to December 31, 2011. However, the Company will record in its financial statements only the Company’s proportionate share based on the Company’s working interest and net revenue interest, which will vary from property to property.
| (in thousands) | ||||
2012 | $ | 61,771 | ||
2013 | 61,874 | |||
2014 | 61,892 | |||
2015 | 60,780 | |||
2016 | 58,781 | |||
Thereafter | 196,688 | |||
|
| |||
Total | $ | 501,786 | ||
|
| |||
Drilling, Lease and Other Commitments.At December 31, 2011, the Company had three drilling rigs under contract through 2012 and two through 2013, which have total commitments of $34.7 million. These contracts may be terminated but the Company would be required to pay a penalty of $21.9 million. All other rigs currently performing work for the Company are on a well-by-well basis and, therefore, can be released without penalty at the conclusion of drilling on the current well. The Company also has one take-or-pay purchase agreement for supply of carbon dioxide (“CO2”), which has a total financial commitment of $12.8 million. Under this contract, the Company is obligated to purchase a minimum monthly volume at a set price. If the Company takes delivery of less than the minimum required amount, the Company is responsible for full payment (deficiency payment). At this time, the Company anticipates sufficient need for CO2 and, therefore, expects to avoid any deficiency payments. The CO2 is for use in fracture stimulation operations in the Company’s West Tavaputs field.
The Company leases office space, vehicles and certain equipment under non-cancelable operating leases. Office lease expense was $1.5 million, $1.5 million and $1.4 million for the years ended December 31, 2011, 2010 and 2009, respectively. Additionally, the Company has entered into various long-term agreements for telecommunication services.
F-38
Future minimum annual payments under such drilling, lease and other agreements as of and subsequent to December 31, 2011 are as follows:
| Drilling & Other Commitments(1) | Office & Equipment Leases | |||||||
| (in thousands) | ||||||||
2012 | $ | 41,220 | $ | 2,774 | ||||
2013 | 6,299 | 2,629 | ||||||
2014 | — | 2,185 | ||||||
2015 | — | 1,844 | ||||||
2016 | — | 1,845 | ||||||
Thereafter | — | 4,253 | ||||||
|
|
|
| |||||
Total | $ | 47,519 | $ | 15,530 | ||||
|
|
|
| |||||
| (1) | The values in the table represent the gross amounts that the Company is committed to pay. However, the Company will record in its financial statements only the Company’s proportionate share based on the Company’s working interest and net revenue interest, which will vary from property to property. |
In addition to the commitments above, the Company has commitments for the purchase of facilities and infrastructure as of and subsequent to December 31, 2011 of $10.5 million.
Litigation.The Company is subject to litigation, claims and governmental and regulatory proceedings arising in the course of ordinary business. It is the opinion of the Company’s management that current claims and litigation involving the Company are not likely to have a material adverse effect on its consolidated financial position, cash flows or results of operations.
14. Guarantor Subsidiaries
In addition to the Amended Credit Facility, the 9.875% Senior Notes, the 7.625% Senior Notes and the Convertible Notes, which are registered securities, are jointly and severally guaranteed on a full and unconditional basis by the Company’s 100% owned subsidiaries (“Guarantor Subsidiaries”). Presented below are the Company’s condensed consolidating balance sheets, statements of operations and statements of cash flows, as required by Rule 3-10 of Regulation S-X of the Securities Exchange Act of 1934, as amended.
F-39
The following condensed consolidating financial statements have been prepared from the Company’s financial information on the same basis of accounting as the consolidated financial statements. Investments in the subsidiaries are accounted for under the equity method. Accordingly, the entries necessary to consolidate the Company and the Guarantor Subsidiaries are reflected in the intercompany eliminations column.
Condensed Consolidating Balance Sheets
| As of December 31, 2011 | ||||||||||||||||
| Parent Issuer | Guarantor Subsidiaries | Intercompany Eliminations | Consolidated | |||||||||||||
| (in thousands) | ||||||||||||||||
Assets: | ||||||||||||||||
Current assets | $ | 244,256 | $ | 2,087 | $ | 0 | $ | 246,343 | ||||||||
Property and equipment, net | 2,301,355 | 105,409 | 0 | 2,406,764 | ||||||||||||
Intercompany receivable (payable) | 139,692 | (139,692 | ) | 0 | 0 | |||||||||||
Investment in subsidiaries | (47,384 | ) | 0 | 47,384 | 0 | |||||||||||
Noncurrent assets | 34,823 | 0 | 0 | 34,823 | ||||||||||||
|
|
|
|
|
|
|
| |||||||||
Total assets | $ | 2,672,742 | $ | (32,196 | ) | $ | 47,384 | $ | 2,687,930 | |||||||
|
|
|
|
|
|
|
| |||||||||
Liabilities and Stockholders’ Equity: | ||||||||||||||||
Current liabilities | $ | 232,347 | $ | 851 | $ | 0 | $ | 233,198 | ||||||||
Long-term debt | 882,240 | 0 | 0 | 882,240 | ||||||||||||
Deferred income taxes | 270,446 | 11,343 | 0 | 281,789 | ||||||||||||
Other noncurrent liabilities | 68,871 | 2,994 | 0 | 71,865 | ||||||||||||
Stockholders’ equity | 1,218,838 | (47,384 | ) | 47,384 | 1,218,838 | |||||||||||
|
|
|
|
|
|
|
| |||||||||
Total liabilities and stockholders’ equity | $ | 2,672,742 | $ | (32,196 | ) | $ | 47,384 | $ | 2,687,930 | |||||||
|
|
|
|
|
|
|
| |||||||||
| As of December 31, 2010 | ||||||||||||||||
| Parent Issuer | Guarantor Subsidiaries | Intercompany Eliminations | Consolidated | |||||||||||||
| (in thousands) | ||||||||||||||||
Assets: | ||||||||||||||||
Current assets | $ | 206,987 | $ | 661 | $ | 0 | $ | 207,648 | ||||||||
Property and equipment, net | 1,727,872 | 83,947 | 0 | 1,811,819 | ||||||||||||
Intercompany receivable (payable) | 65,662 | (65,662 | ) | 0 | 0 | |||||||||||
Investment in subsidiaries | (7,474 | ) | 0 | 7,474 | 0 | |||||||||||
Noncurrent assets | 19,033 | 0 | 0 | 19,033 | ||||||||||||
|
|
|
|
|
|
|
| |||||||||
Total assets | $ | 2,012,080 | $ | 18,946 | $ | 7,474 | $ | 2,038,500 | ||||||||
|
|
|
|
|
|
|
| |||||||||
Liabilities and Stockholders’ Equity: | ||||||||||||||||
Current liabilities | $ | 165,166 | $ | 791 | $ | 0 | $ | 165,957 | ||||||||
Long-term debt | 404,399 | 0 | 0 | 404,399 | ||||||||||||
Deferred income taxes | 241,105 | 24,904 | 0 | 266,009 | ||||||||||||
Other noncurrent liabilities | 60,448 | 725 | 0 | 61,173 | ||||||||||||
Stockholders’ equity | 1,140,962 | (7,474 | ) | 7,474 | 1,140,962 | |||||||||||
|
|
|
|
|
|
|
| |||||||||
Total liabilities and stockholders’ equity | $ | 2,012,080 | $ | 18,946 | $ | 7,474 | $ | 2,038,500 | ||||||||
|
|
|
|
|
|
|
| |||||||||
F-40
Condensed Consolidating Statements of Operations
| Year Ended December 31, 2011 | ||||||||||||||||
| Parent Issuer | Guarantor Subsidiaries | Intercompany Eliminations | Consolidated | |||||||||||||
| (in thousands) | ||||||||||||||||
Operating and other revenues | $ | 755,843 | $ | 15,518 | $ | 0 | $ | 771,361 | ||||||||
Operating expenses | (541,759 | ) | (55,430 | ) | 0 | (597,189 | ) | |||||||||
General and administrative | (66,780 | ) | 0 | 0 | (66,780 | ) | ||||||||||
Interest income and other income (expense) | (59,013 | ) | 0 | 0 | (59,013 | ) | ||||||||||
|
|
|
|
|
|
|
| |||||||||
Income (loss) before income taxes and equity in earnings (loss) of subsidiaries | 88,291 | (39,912 | ) | 0 | 48,379 | |||||||||||
Provision for income taxes | (17,672 | ) | 0 | 0 | (17,672 | ) | ||||||||||
Equity in earnings (loss) of subsidiaries | (39,912 | ) | 0 | 39,912 | 0 | |||||||||||
|
|
|
|
|
|
|
| |||||||||
Net income (loss) | $ | 30,707 | $ | (39,912 | ) | $ | 39,912 | $ | 30,707 | |||||||
|
|
|
|
|
|
|
| |||||||||
| Year Ended December 31, 2010 | ||||||||||||||||
| Parent Issuer | Guarantor Subsidiaries | Intercompany Eliminations | Consolidated | |||||||||||||
| (in thousands) | ||||||||||||||||
Operating and other revenues | $ | 686,516 | $ | 11,948 | $ | 0 | $ | 698,464 | ||||||||
Operating expenses | (453,543 | ) | (14,774 | ) | 0 | (468,317 | ) | |||||||||
General and administrative | (57,792 | ) | 0 | 0 | (57,792 | ) | ||||||||||
Interest and other income (expense) | (43,924 | ) | 24 | 0 | (43,900 | ) | ||||||||||
|
|
|
|
|
|
|
| |||||||||
Income (loss) before income taxes and equity in earnings (loss) of subsidiaries | 131,257 | (2,802 | ) | 0 | 128,455 | |||||||||||
Provision for income taxes | (47,953 | ) | 0 | 0 | (47,953 | ) | ||||||||||
Equity in earnings (loss) of subsidiaries | (2,802 | ) | 0 | 2,802 | 0 | |||||||||||
|
|
|
|
|
|
|
| |||||||||
Net income (loss) | $ | 80,502 | $ | (2,802 | ) | $ | 2,802 | $ | 80,502 | |||||||
|
|
|
|
|
|
|
| |||||||||
| Year Ended December 31, 2009 | ||||||||||||||||
| Parent Issuer | Guarantor Subsidiaries | Intercompany Eliminations | Consolidated | |||||||||||||
| (in thousands) | ||||||||||||||||
Operating and other revenues | $ | 590,997 | $ | 7,166 | $ | 0 | $ | 598,163 | ||||||||
Operating expenses | (412,991 | ) | (12,391 | ) | 0 | (425,382 | ) | |||||||||
General and administrative | (54,398 | ) | 0 | 0 | (54,398 | ) | ||||||||||
Interest and other income (expense) | (30,209 | ) | 0 | 0 | (30,209 | ) | ||||||||||
|
|
|
|
|
|
|
| |||||||||
Income (loss) before income taxes and equity in earnings (loss) of subsidiaries | 93,399 | (5,225 | ) | 0 | 88,174 | |||||||||||
Provision for income taxes | (37,956 | ) | 0 | 0 | (37,956 | ) | ||||||||||
Equity in earnings (loss) of subsidiaries | (5,225 | ) | 0 | 5,225 | 0 | |||||||||||
|
|
|
|
|
|
|
| |||||||||
Net income (loss) | $ | 50,218 | $ | (5,225 | ) | $ | 5,225 | $ | 50,218 | |||||||
|
|
|
|
|
|
|
| |||||||||
F-41
Condensed Consolidating Statements of Cash Flows
| Year Ended December 31, 2011 | ||||||||||||||||
| Parent Issuer | Guarantor Subsidiaries | Intercompany Eliminations | Consolidated | |||||||||||||
| (in thousands) | ||||||||||||||||
Cash flows from operating activities | $ | 486,579 | $ | (7,231 | ) | $ | 0 | $ | 479,348 | |||||||
Cash flows from investing activities: | ||||||||||||||||
Additions to oil and gas properties, including acquisitions | (884,099 | ) | (63,107 | ) | 0 | (947,206 | ) | |||||||||
Additions to furniture, fixtures and other | (11,556 | ) | 414 | 0 | (11,142 | ) | ||||||||||
Proceeds from sale of properties and other investing activities | 1,702 | 0 | 0 | 1,702 | ||||||||||||
Cash flows from financing activities: | ||||||||||||||||
Proceeds from debt | 800,000 | 0 | 0 | 800,000 | ||||||||||||
Principal payments on debt | (330,000 | ) | 0 | 0 | (330,000 | ) | ||||||||||
Intercompany transfers | (69,973 | ) | 69,973 | 0 | 0 | |||||||||||
Other financing activities | 5,938 | 1 | 0 | 5,939 | ||||||||||||
|
|
|
|
|
|
|
| |||||||||
Change in cash and cash equivalents | (1,409 | ) | 50 | 0 | (1,359 | ) | ||||||||||
Beginning cash and cash equivalents | 58,690 | 0 | 0 | 58,690 | ||||||||||||
|
|
|
|
|
|
|
| |||||||||
Ending cash and cash equivalents | $ | 57,281 | $ | 50 | $ | 0 | $ | 57,331 | ||||||||
|
|
|
|
|
|
|
| |||||||||
| Year Ended December 31, 2010 | ||||||||||||||||
| Parent Issuer | Guarantor Subsidiaries | Intercompany Eliminations | Consolidated | |||||||||||||
| (in thousands) | ||||||||||||||||
Cash flows from operating activities | $ | 442,796 | $ | 4,392 | $ | 0 | $ | 447,188 | ||||||||
Cash flows from investing activities: | ||||||||||||||||
Additions to oil and gas properties, including acquisitions | (442,585 | ) | (2,286 | ) | 0 | (444,871 | ) | |||||||||
Additions to furniture, fixtures and other | (3,819 | ) | (288 | ) | 0 | (4,107 | ) | |||||||||
Proceeds from sale of properties and other investing activities | 2,661 | 0 | 0 | 2,661 | ||||||||||||
Cash flows from financing activities: | ||||||||||||||||
Proceeds from debt | 20,000 | 0 | 0 | 20,000 | ||||||||||||
Principal payments on debt | (25,000 | ) | 0 | 0 | (25,000 | ) | ||||||||||
Intercompany transfers | 1,818 | (1,818 | ) | 0 | 0 | |||||||||||
Other financing activities | 8,414 | 0 | 0 | 8,414 | ||||||||||||
|
|
|
|
|
|
|
| |||||||||
Change in cash and cash equivalents | 4,285 | 0 | 0 | 4,285 | ||||||||||||
Beginning cash and cash equivalents | 54,405 | 0 | 0 | 54,405 | ||||||||||||
|
|
|
|
|
|
|
| |||||||||
Ending cash and cash equivalents | $ | 58,690 | $ | 0 | $ | 0 | $ | 58,690 | ||||||||
|
|
|
|
|
|
|
| |||||||||
F-42
| Year Ended December 31, 2009 | ||||||||||||||||
| Parent Issuer | Guarantor Subsidiaries | Intercompany Eliminations | Consolidated | |||||||||||||
| (in thousands) | ||||||||||||||||
Cash flows from operating activities | $ | 479,249 | $ | 1,495 | $ | 0 | $ | 480,744 | ||||||||
Cash flows from investing activities: | ||||||||||||||||
Additions to oil and gas properties, including acquisitions | (448,883 | ) | (1,528 | ) | 0 | (450,411 | ) | |||||||||
Additions to furniture, fixtures and other | (2,811 | ) | (1,160 | ) | 0 | (3,971 | ) | |||||||||
Proceeds from sale of properties and other investing activities | 3,748 | 0 | 0 | 3,748 | ||||||||||||
Cash flows from financing activities: | ||||||||||||||||
Proceeds from debt | 337,930 | 0 | 0 | 337,930 | ||||||||||||
Principal payments on debt | (349,000 | ) | 0 | 0 | (349,000 | ) | ||||||||||
Intercompany transfers | (1,193 | ) | 1,193 | 0 | 0 | |||||||||||
Other financing activities | (7,698 | ) | 0 | 0 | (7,698 | ) | ||||||||||
|
|
|
|
|
|
|
| |||||||||
Change in cash and cash equivalents | 11,342 | 0 | 0 | 11,342 | ||||||||||||
Beginning cash and cash equivalents | 43,063 | 0 | 0 | 43,063 | ||||||||||||
|
|
|
|
|
|
|
| |||||||||
Ending cash and cash equivalents | $ | 54,405 | $ | 0 | $ | 0 | $ | 54,405 | ||||||||
|
|
|
|
|
|
|
| |||||||||
SUPPLEMENTAL INFORMATION TO CONSOLIDATED FINANCIAL STATEMENTS
(In Thousands, Except Per Share Data Unless Otherwise Indicated)
(Unaudited)
Oil and Gas Producing Activities
Costs Incurred. Costs incurred in oil and gas property acquisition, exploration and development activities and related depletion per equivalent unit-of-production were as follows:
| Year Ended December 31, | ||||||||||||
| 2011 | 2010 | 2009 | ||||||||||
| (in thousands, except per Mcfe data) | ||||||||||||
Acquisition costs: | ||||||||||||
Unproved properties | $ | 183,420 | $ | 25,206 | $ | 70,108 | ||||||
Proved properties | 164,797 | 3,158 | 0 | |||||||||
Exploration costs | 20,752 | 82,858 | 185,339 | |||||||||
Development costs | 607,704 | 358,273 | 147,216 | |||||||||
Asset retirement obligation | 12,142 | 1,344 | (1,199 | ) | ||||||||
|
|
|
|
|
| |||||||
Total costs incurred | $ | 988,815 | $ | 470,839 | $ | 401,464 | ||||||
|
|
|
|
|
| |||||||
Depletion per Mcfe of production | $ | 2.64 | $ | 2.64 | $ | 2.76 | ||||||
Supplemental Oil and Gas Reserve Information. The reserve information presented below is based on estimates of net proved reserves as of December 31, 2011, 2010 and 2009 that were prepared by internal petroleum engineers in accordance with guidelines established by the SEC and were audited by the Company’s independent petroleum engineering firm Netherland, Sewell & Associates, Inc. (“NSAI”) in 2011, 2010 and 2009.
Proved oil and gas reserves are the estimated quantities of crude oil and natural gas which geological and engineering data demonstrate with reasonable certainty to be recoverable in future years from known reservoirs
F-43
under existing economic and operating conditions (i.e., prices and costs as of the date the estimate is made). Proved developed oil and gas reserves are reserves that can be expected to be recovered through existing wells with existing equipment and operating methods.
Analysis of Changes in Proved Reserves. The following table sets forth information regarding the Company’s estimated net total proved and proved developed oil and gas reserve quantities:
| Oil (MBbls) | Gas (MMcf) | Equivalent Units (MMcfe) | ||||||||||
Proved reserves: | ||||||||||||
Balance, December 31, 2008 | 5,662 | 784,322 | 818,294 | |||||||||
Purchases of oil and gas reserves in place | 0 | 487 | 487 | |||||||||
Extension, discoveries and other additions | 1,381 | 169,007 | 177,293 | |||||||||
Revisions of previous estimates | 1,451 | 49,968 | 58,674 | |||||||||
Sales of reserves | 0 | (246 | ) | (246 | ) | |||||||
Production | (710 | ) | (85,485 | ) | (89,745 | ) | ||||||
|
|
|
|
|
| |||||||
Balance, December 31, 2009 | 7,784 | 918,053 | 964,757 | |||||||||
|
|
|
|
|
| |||||||
Purchases of oil and gas reserves in place | 2 | 1,184 | 1,196 | |||||||||
Extension, discoveries and other additions | 5,275 | 153,381 | 185,031 | |||||||||
Revisions of previous estimates | 1,032 | 61,525 | 67,717 | |||||||||
Sales of reserves | (10 | ) | (3,796 | ) | (3,856 | ) | ||||||
Production | (1,089 | ) | (89,964 | ) | (96,498 | ) | ||||||
|
|
|
|
|
| |||||||
Balance, December 31, 2010 | 12,994 | 1,040,383 | 1,118,347 | |||||||||
|
|
|
|
|
| |||||||
Purchases of oil and gas reserves in place | 7,990 | 50,217 | 98,157 | |||||||||
Extension, discoveries and other additions | 6,443 | 172,741 | 211,399 | |||||||||
Revisions of previous estimates | 4,666 | 15,588 | 43,584 | |||||||||
Sales of reserves | 0 | 0 | 0 | |||||||||
Production | (1,490 | ) | (97,856 | ) | (106,796 | ) | ||||||
|
|
|
|
|
| |||||||
Balance, December 31, 2011 | 30,603 | 1,181,073 | 1,364,691 | |||||||||
|
|
|
|
|
| |||||||
Proved developed reserves: | ||||||||||||
December 31, 2009 | 4,140 | 455,323 | 480,163 | |||||||||
December 31, 2010 | 5,959 | 499,440 | 535,194 | |||||||||
December 31, 2011 | 10,413 | 632,501 | 694,979 | |||||||||
Proved undeveloped reserves: | ||||||||||||
December 31, 2009 | 3,644 | 462,730 | 484,592 | |||||||||
December 31, 2010 | 7,035 | 540,943 | 583,153 | |||||||||
December 31, 2011 | 20,190 | 548,572 | 669,712 | |||||||||
At December 31, 2011, the Company revised its proved reserves upward by 37.9 Bcfe, excluding pricing revisions, due primarily to the positive results of increased operational focus and engineering and geological study of the Company’s Blacktail Ridge field in the Uinta Basin. At December 31, 2011, the Company also revised its 2011 proved reserves upward by 5.5 Bcfe, as 2011 pricing was $3.93 per MMBtu and $92.71 per barrel of oil compared with the 2010 pricing of $3.95 per MMBtu and $75.96 per barrel of oil. Prices were adjusted by lease for quality, transportation fees and regional price differences.
At December 31, 2010, the Company revised its proved reserves upward by 39.8 Bcfe, excluding pricing revisions, due to improved production performance in Piceance and Wind River Basins and the addition of 24.7 Bcfe of reserves from the third offsetting development spacing areas added as proved undeveloped in the Piceance Basin. At December 31, 2010, the Company revised its proved reserves upward by 27.4 Bcfe, as 2010 pricing was $3.95 per MMBtu and $75.96 per barrel of oil compared to 2009 pricing of $3.04 per MMBtu and $57.65 per barrel of oil. Prices were adjusted by lease for quality, transportation fees and regional price differences.
F-44
At December 31, 2009, the Company revised its proved reserves upward by 101.5 Bcfe, excluding pricing revisions, due to improved production performance in Piceance, West Tavaputs and Blacktail Ridge and the increased revenue associated with the recovery of NGLs and reduced drilling and completion costs in Piceance. Also included in the engineering revisions was the addition of 64 Bcfe from the second offsetting development spacing areas added as proved undeveloped in the Piceance Basin. The total reserves from the second development spacing areas in the Piceance Basin was 86.3 Bcfe, of which 64 Bcfe was in the engineering revision category and 22.3 Bcfe was in the extension and discoveries category resulting from drilling and completion operations in 2009. At December 31, 2009, the Company also revised its proved reserves downward by 42.8 Bcfe, as 2009 pricing was $3.04 per MMBtu and $57.65 per barrel of oil compared to 2008 pricing of $4.61 per MMBtu and $41.00 per barrel of oil (using the former SEC end of year pricing). Prices were adjusted by lease for quality, transportation fees and regional price differences.
Standardized Measure. Certain information concerning the assumptions used in computing the valuation of proved reserves and their inherent limitations are discussed below. The Company believes such information is essential for a proper understanding and assessment of the data presented.
For the years ended December 31, 2011, 2010 and 2009, future cash inflows are calculated by applying the 12-month average pricing (as is required by the rules of the Securities and Exchange Commission) of oil and gas relating to the Company’s proved reserves to the year-end quantities of those reserves. For the year ended December 31, 2011, calculations were made using prices of $92.71 per Bbl for oil and $3.93 per MMBtu for gas, as compared to the average benchmark prices of $78.04 per Bbl for oil and $5.16 per Mcf for gas. For the year ended December 31, 2010, calculations were made using prices of $75.96 per Bbl for oil and $3.95 per MMBtu for gas, as compared to the average benchmark prices of $63.01 per Bbl for oil and $4.76 per Mcf for gas. For the year ended December 31, 2009, calculations were made using prices of $57.65 per Bbl for oil and $3.04 per MMBtu for gas, as compared to the average benchmark prices of $45.26 per Bbl for oil and $3.50 per Mcf for gas. The differences between the average benchmark prices and the average prices used in the calculation of the standardized measure are attributable to adjustments made for transportation, quality and basis differentials. The Company also records an overhead charge against its future cash flows.
The assumptions used to calculate estimated future cash inflows do not necessarily reflect the Company’s expectations of actual revenues or costs, nor their present worth. In addition, variations from the expected production rate also could result directly or indirectly from factors outside of the Company’s control, such as unexpected delays in development, changes in prices or regulatory or environmental policies. The reserve valuation further assumes that all reserves will be disposed of by production. However, if reserves are sold in place, additional economic considerations could also affect the amount of cash eventually realized.
Future development and production costs are calculated by estimating the expenditures to be incurred in developing and producing the proved oil and gas reserves at the end of the year, based on year-end costs and assuming continuation of existing economic conditions.
Future income tax expenses are calculated by applying the appropriate year-end statutory tax rates, with consideration of future tax rates already legislated, to the future pre-tax net cash flows relating to the Company’s proved oil and gas reserves. Permanent differences in oil and gas related tax credits and allowances are recognized.
F-45
The following table presents the standardized measure of discounted future net cash flows related to proved oil and gas reserves:
The “standardized measure” is the present value of estimated future cash inflows from proved natural gas and oil reserves, less future development and production costs and future income tax expenses, using prices and costs as of the date of estimation without future escalation, without giving effect to hedging activities, non-property related expenses such as general and administrative expenses, debt service and depreciation, depletion and amortization and discounted using an annual discount rate of 10% to reflect timing of future cash flows.
| Year Ended December 31, | ||||||||||||
| 2011 | 2010 | 2009 | ||||||||||
| (in thousands) | ||||||||||||
Future cash inflows | $ | 8,486,558 | $ | 5,771,398 | $ | 3,565,201 | ||||||
Future production costs | (2,072,309 | ) | (1,259,968 | ) | (923,615 | ) | ||||||
Future development costs | (1,738,182 | ) | (1,260,154 | ) | (1,035,669 | ) | ||||||
Future income taxes | (1,163,868 | ) | (832,714 | ) | (227,982 | ) | ||||||
|
|
|
|
|
| |||||||
Future net cash flows | 3,512,199 | 2,418,562 | 1,377,935 | |||||||||
10% annual discount | (1,896,111 | ) | (1,286,196 | ) | (787,143 | ) | ||||||
|
|
|
|
|
| |||||||
Standardized measure of discounted future net cash flows | $ | 1,616,088 | $ | 1,132,366 | $ | 590,792 | ||||||
|
|
|
|
|
| |||||||
The present value (at a 10% annual discount) of future net cash flows from the Company’s proved reserves is not necessarily the same as the current market value of its estimated oil and natural gas reserves. The Company bases the estimated discounted future net cash flows from its proved reserves on prices and costs in effect on the day of estimate in accordance with the applicable accounting guidance. However, actual future net cash flows from its oil and natural gas properties will also be affected by factors such as actual prices the Company receives for oil and natural gas, the amount and timing of actual production, supply of and demand for oil and natural gas and changes in governmental regulations or taxation.
The timing of both the Company’s production and incurrence of expenses in connection with the development and production of oil and natural gas properties will affect the timing of actual future net cash flows from proved reserves, and thus their actual present value. In addition, the 10% annual discount factor the Company uses when calculating discounted future net cash flows may not be the most appropriate discount factor based on interest rates in effect from time to time and risks associated with the Company or the oil and natural gas industry in general.
F-46
A summary of changes in the standardized measure of discounted future net cash flows is as follows:
| Year Ended December 31, | ||||||||||||
| 2011 | 2010 | 2009 | ||||||||||
| (in thousands) | ||||||||||||
Standardized measure of discounted future net cash flows, beginning of period | $ | 1,132,366 | $ | 590,792 | $ | 858,143 | ||||||
Sales of oil and gas, net of production costs and taxes | (493,278 | ) | (393,098 | ) | (248,499 | ) | ||||||
Extensions, discoveries and improved recovery, less related costs | 307,013 | 237,768 | 93,550 | |||||||||
Quantity revisions | 78,062 | 70,811 | 79,616 | |||||||||
Price revisions | 417,174 | 738,424 | (365,855 | ) | ||||||||
Previously estimated development costs incurred during the period | 197,994 | 195,542 | 171,241 | |||||||||
Changes in estimated future development costs | (182,991 | ) | (118,883 | ) | (40,469 | ) | ||||||
Accretion of discount | 149,637 | 68,484 | 103,891 | |||||||||
Purchases of reserves in place | 166,662 | 2,253 | 524 | |||||||||
Sales of reserves | 0 | (3,049 | ) | (65 | ) | |||||||
Changes in production rates (timing) and other | (19,293 | ) | 13,281 | (148,009 | ) | |||||||
Net changes in future income taxes | (137,258 | ) | (269,959 | ) | 86,724 | |||||||
|
|
|
|
|
| |||||||
Standardized measure of discounted future net cash flows, end of period | $ | 1,616,088 | $ | 1,132,366 | $ | 590,792 | ||||||
|
|
|
|
|
| |||||||
Quarterly Financial Data
The following is a summary of the unaudited quarterly financial data, including income before income taxes, net income and net income per common share for the years ended December 31, 2011 and 2010.
| First Quarter | Second Quarter | Third Quarter | Fourth Quarter | |||||||||||||
| (in thousands, except per share data) | ||||||||||||||||
Year ended December 31, 2011: | ||||||||||||||||
Total revenues | $ | 161,323 | $ | 194,442 | $ | 208,665 | $ | 206,931 | ||||||||
Less: costs and expenses | 125,925 | 130,588 | 161,761 | 245,695 | ||||||||||||
|
|
|
|
|
|
|
| |||||||||
Operating income (loss) | $ | 35,398 | $ | 63,854 | $ | 46,904 | $ | (38,764 | ) | |||||||
Income (loss) before income taxes | 23,419 | 51,635 | 32,887 | (59,562 | ) | |||||||||||
Net income (loss) | 15,215 | 32,636 | 20,636 | (37,780 | ) | |||||||||||
Net income (loss) per common share, basic | 0.33 | 0.70 | 0.44 | (0.81 | ) | |||||||||||
Net income (loss) per common share, diluted | 0.33 | 0.69 | 0.43 | (0.81 | ) | |||||||||||
| First Quarter | Second Quarter | Third Quarter | Fourth Quarter | |||||||||||||
| (in thousands, except per share data) | ||||||||||||||||
Year ended December 31, 2010: | ||||||||||||||||
Total revenues | $ | 157,810 | $ | 196,625 | $ | 180,631 | $ | 163,398 | ||||||||
Less: costs and expenses | 110,190 | 122,620 | 130,166 | 163,133 | ||||||||||||
|
|
|
|
|
|
|
| |||||||||
Operating income | $ | 47,620 | $ | 74,005 | $ | 50,465 | $ | 265 | ||||||||
Income (loss) before income taxes | 37,517 | 62,911 | 39,526 | (11,499 | ) | |||||||||||
Net income (loss) | 23,977 | 39,198 | 24,562 | (7,235 | ) | |||||||||||
Net income (loss) per common share, basic | 0.53 | 0.87 | 0.54 | (0.16 | ) | |||||||||||
Net income (loss) per common share, diluted | 0.53 | 0.86 | 0.54 | (0.16 | ) | |||||||||||
F-47