Exhibit 99.1
OIL GROWTH IN THE ROCKY MOUNTAIN REGION
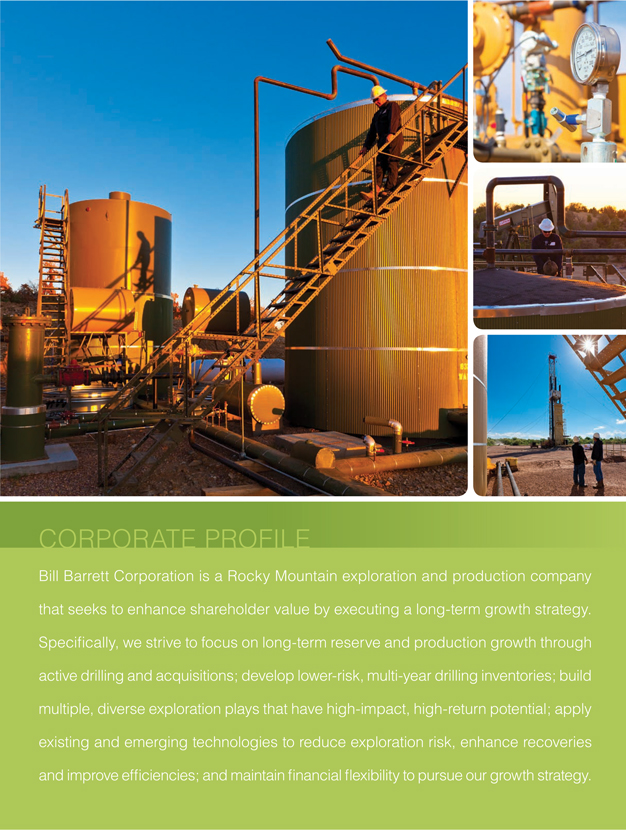
CORPORATE PROFILE
Bill Barrett Corporation is a Rocky Mountain exploration and production company that seeks to enhance shareholder value by executing a long-term growth strategy. Specifi cally, we strive to focus on long-term reserve and production growth through active drilling and acquisitions; develop lower-risk, multi-year drilling inventories; build multiple, diverse exploration plays that have high-impact, high-return potential; apply existing and emerging technologies to reduce exploration risk, enhance recoveries and improve effi ciencies; and maintain fi nancial fl exibility to pursue our growth strategy.
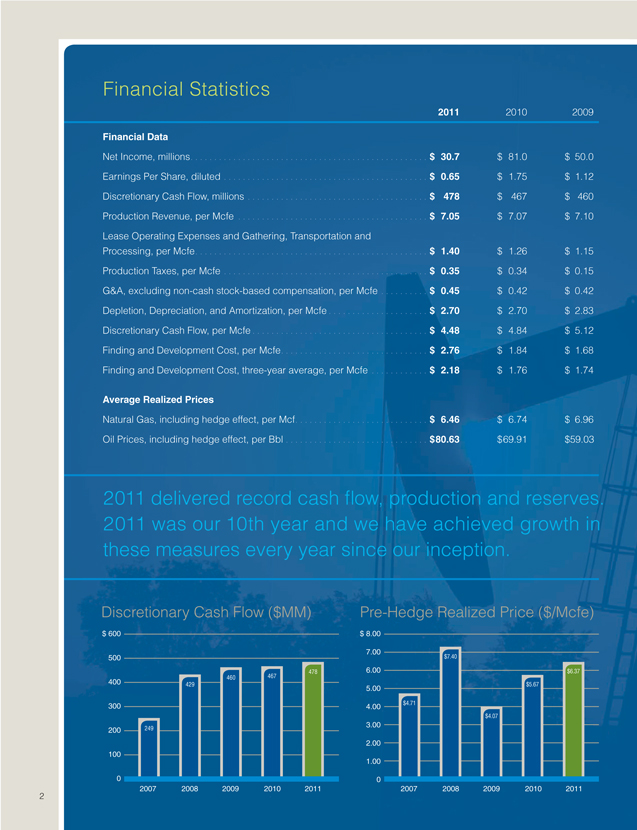
Financial Statistics
2011
2010
2009
Financial Data
Net Income, millions.
$30.7
$81.0
$50.0
Earnings Per Share, diluted
$0.65
$1.75
$1.12
Discretionary Cash Flow, millions
$478
$467
$460
Production Revenue, per Mcfe
$7.05
$7.07
$7.10
Lease Operating Expenses and Gathering, Transportation and
Processing, per Mcfe.
$1.40
$1.26
$1.15
Production Taxes, per Mcfe
$0.35
$0.34
$0.15
G&A, excluding non-cash stock-based compensation, per Mcfe
$0.45
$0.42
$0.42
Depletion, Depreciation, and Amortization, per Mcfe
$2.70
$2.70
$2.83
Discretionary Cash Flow, per Mcfe
$4.48
$4.84
$5.12
Finding and Development Cost, per Mcfe.
$2.76
$1.84
$1.68
Finding and Development Cost, three-year average, per Mcfe
$2.18
$1.76
$1.74
Average Realized Prices
Natural Gas, including hedge effect, per Mcf.
$6.46
$6.74
$6.96
Oil Prices, including hedge effect, per Bbl
$80.63
$69.91
$59.03
2011 delivered record cash fl ow, production and reserves. 2011 was our 10th year and we have achieved growth in these measures every year since our inception.
Discretionary Cash Flow ($MM) Pre-Hedge Realized Price ($/Mcfe)
$ 600 $ 8.00
500 7.00 $7.40
478 6.00 $6.37 460 467 400 429 $5.67
5.00
$4.71
300 4.00 $4.07
3.00 200 249
2.00 100
1.00
0 0
2007 2008 2009 2010 2011 2007 2008 2009 2010 2011

Operating Statistics
2011
2010
2009
Proved Reserves and Acreage
Natural Gas, Bcf
1,181
1,040
918
Oil, MMBbls
30.6
13.0
7.8
Natural Gas Equivalents, Bcfe
1,364.7
1,118.3
964.8
Percent Developed.
51%
48%
50%
Pre-Tax PV-10, millions.
$2,117
$1,496
$685
Net Undeveloped Acreage, rounded
1,251,000
1,340,000
1,251,000
Production
Natural Gas, Bcf
97.9
90.0
85.5
Oil, MBbls.
1,490
1,089
710
Natural Gas Equivalents, Bcfe
106.8
96.5
89.7
Average Daily Production, MMcfe.
293
264
246
Percent Oil and NGLs by Sales Volume*
27%
25%
19%
Operating Statistics
Reserve Replacement
331%
263%
264%
Capital Expenditures, millions
$987
$473
$406
Producing Wells, gross/net
2,398/1,904
1,860/1,448
1,585/1,236
Wells Drilled, gross/net
281/238
275/182
186/164
*Please reference the Disclosure Statements page for NGL volume information.
Net Production (Bcfe)
Net Proved Reserves (Bcfe)
120 1,600
100 1,400
107 1,365
97 1,200
90
80
1,000 1,118 78 965
60 800
61 818
40 600
400 558 20 200
0 0
2007 2008 2009 2010 2011 2007 2008 2009 2010 2011
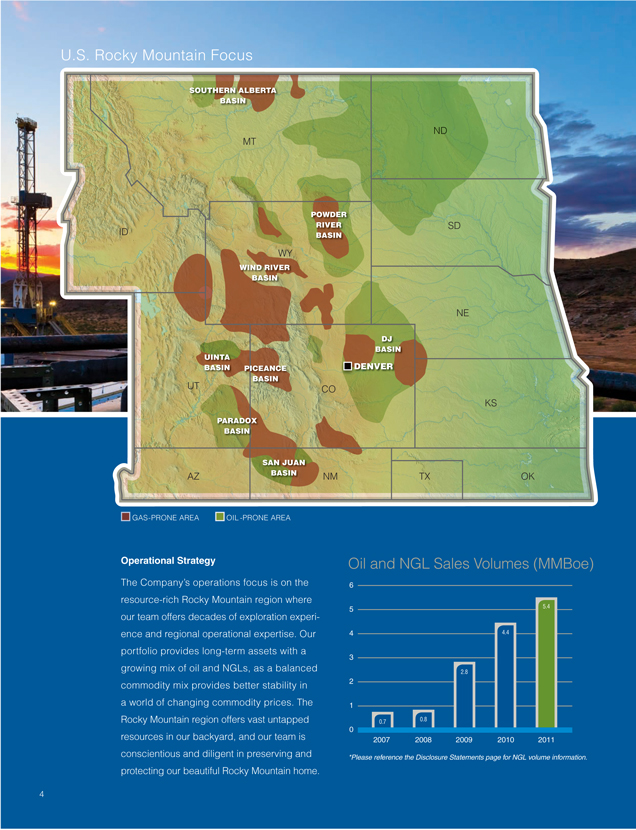
U.S. Rocky Mountain Focus
SOUTHERN ALBERTA BASIN
ND MT
POWDER
ID RIVER SD BASIN
WY
WIND RIVER BASIN
NE
DJ UINTA BASIN BASIN PICEANCE DENVER
BASIN
UT CO
KS
PARADOX BASIN
SAN JUAN BASIN
AZ NM TX OK
GAS-PRONE AREA OIL -PRONE AREA
Operational Strategy
The Company’s operations focus is on the resource-rich Rocky Mountain region where our team offers decades of exploration experience and regional operational expertise. Our portfolio provides long-term assets with a growing mix of oil and NGLs, as a balanced commodity mix provides better stability in a world of changing commodity prices. The Rocky Mountain region offers vast untapped resources in our backyard, and our team is conscientious and diligent in preserving and protecting our beautiful Rocky Mountain home.
Oil and NGL Sales Volumes (MMBoe)
2.8
0.8
0.7
0
2007 2008 2009 2010 2011
*Please reference the Disclosure Statements page for NGL volume information.
To Our Shareholders
Fredrick J. Barrett
Chairman, Chief Executive Offi cer and President
2011 delivered record cash fl ow, production and reserves. 2011 was our 10th year and we have achieved growth in these measures every year since our inception. Operating success was again realized in a diffi cult macro-economic environment when the global economy and national oversupply of natural gas created strong headwinds in our industry. The last few months of 2011 and the fi rst weeks of 2012 were defi ned by a precipitous drop in forward natural gas prices, with the natural gas price reaching a 10-year low. Due to the strength of our Company and our high-quality asset base, we are well poised to transition our business in this low gas price environment.
We have continued our strategy in this challenging natural gas price environment to increase the proportion of oil and natural gas liquids (NGLs) in our portfolio. A better balanced commodity mix in our portfolio will mitigate our exposure to the volatility of individual commodity prices. During 2011, we made excellent progress in effecting a transition to more oil by leveraging the immense liquid-rich resource base of the Rocky Mountain Region. Not only have we
positioned the Company in new oil-rich areas, but several of our legacy positions offer long-term growth and value creation through exposure to oil and NGLs pricing. Our ability to deliver strong results and to transition to oil refl ects the caliber and quality of our team and of our competitive asset base. At the Uinta Oil Program in Utah, we had successful test results with horizontal drilling in the Uteland Butte formation, and we extended reserve locations through our vertical step-out program, as we continue to expand the fi eld size of this area. We also acquired two additional oil positions in the area that include acreage with higher working interests. As a result of our activity in the area, we quadrupled the number of proved, probable and possible (3P) drilling locations and proved reserves. This is a very exciting oil program where we expect to drive more scale in 2012.
We also closed an acquisition in the Denver-Julesburg (DJ) Basin targeting oil and liquids-rich natural gas during 2011. I am pleased with our execution in the DJ to date and am enthusiastic about the potential upside in this area. The DJ is a new, key development area for us and I expect full-scale development in 2012. Success in the DJ is all about operational execution. Already, our optimization program has increased production from existing wells, and we will continue to build on this opportunity. In 2012, we will initiate horizontal drilling in the Wattenberg Field, as well as to the north in our Chalk Bluffs area along the Colorado-Wyoming border. We have already created value at this recent acquisition, and we are just getting started.
In addition to our development and acqui-
sition activities, we are pursuing oil growth
Continued oil and NGLgrowth drives better returns.
through exploration. We recognize a number of emerging oil trends as well as new concepts. During 2011, our team was busy building new land positions and preparing for an exciting 2012 exploration program. While exploration can carry higher risk, it can bring higher rewards, and we recognize the potential for “company-maker” oil concepts both within our existing development portfolio and through our exploration portfolio. We have built an exploration portfolio that includes prospects in at least six different basins from Montana to New Mexico and, in 2012, we will be active in each of these areas with virtually all of our exploration efforts employing the latest in horizontal technologies.
2012 will be a robust year for operations as we focus the drill bit on oil at our low-risk development programs, stay opportunistic through acquisitions, and test a number of new exploration concepts. We are excited about 2012 and our expectations are high.
Looking Back –
How We Performed in 2011
In my letter to you last year, I set forth several goals for 2011. We measured up well against each goal.
First, we set forth to achieve full-scale operations at West Tavaputs, following receipt of the Record of Decision for the Environmental Impact Statement from the Bureau of Land Management in the fall of 2010, and to achieve 30% production growth in this area. We rapidly brought operations to full scale with two rigs operating. We achieved 32% production growth year-over-year, and achieved 76% production growth comparing the fourth quarter of 2011 with the fourth quarter of 2010. Second, we targeted 40% growth in oil production and came close with 37% growth year-over-year and 58% growth comparing the fourth quarter of 2011 with the fourth quarter of 2010.
Third, we wanted to achieve double digit growth in proved reserves, and we accomplished this handily with 22% reserve growth to 1.4 Tcfe and, within this metric, we increased oil reserves 135%. We also targeted increased 3P reserves through drilling at our development programs and through fi eld extensions. 3P reserves were increased 20% to 3.0 Tcfe, providing our Company a solid, low-risk, long-term reserve base.
Fourth, we sought to execute an exploration program that would include six to seven basins and four new areas. We completed the program recognizing the most success with the Uteland Butte horizontal oil tests. We also noted that we wanted to stay opportunistic in regard to acquisitions and, as mentioned above, completed two transactions that broaden our exposure to oil.
Lastly, we sought to make 2011 another record year for cash fl ow, production and reserves and, again, we delivered.
Looking Ahead – Goals Going Forward
As we look ahead, we recognize that we are continuing to operate effi ciently in a diffi cult macro-economic environment. Our strategy is laid out in a three-year plan to continue the transition to a higher proportion of oil at our core programs, to continue to add scale and long-term value through exploration and acquisition and to make 2012 another record year. In 2012, we will seek to increase oil production nearly 80% from
2011 levels. We plan to meet this level through increased scale at our Uinta Oil Program with a fi ve-rig program by year-end. We also plan to test additional zones in the Uinta Oil Program and target economic success in additional horizons that will increase our recoveries in this important oil program. In addition, we’ll focus the drill bit on horizontal Niobrara development and continued optimization of the Wattenberg Field with a two-rig program in the DJ Basin by year-end.
It is the culture of our team to grow through exploration, and we have possibly the most exciting exploration program to date for our Company in place for 2012. We are targeting success in at least one of our exploration prospects with the objective of initiating a new development program in 2013. In addition, we will remain opportunistic on the acquisitions front.
Key to our three-year plan is to grow, not for the sake of production growth, but to drive the best returns by drilling the higher-margin programs and to drive cash fl ow growth. We will be managing our three-year program to deliver value creation while maintaining a disciplined balance sheet. As always, we will be focused on driving value that results in better share performance in 2012. We have positioned the Company with a diverse, robust, and quality portfolio, a signifi cant long-term oil resource base, a solid NGL inventory, and a number of large-scale natural gas growth engines for when prices strengthen.
Importantly, we will continue to explore and develop our resources with environmental stewardship and corporate responsibility, demanding minimal effect to our environment, and we are committed to providing a safe, respectful and rewarding environment for our employees.
Thank you to our shareholders and employees, and we look forward to a successful 2012.
Sincerely,
Fredrick J. Barrett
Chairman, Chief Executive Offi cer and President March 9, 2012
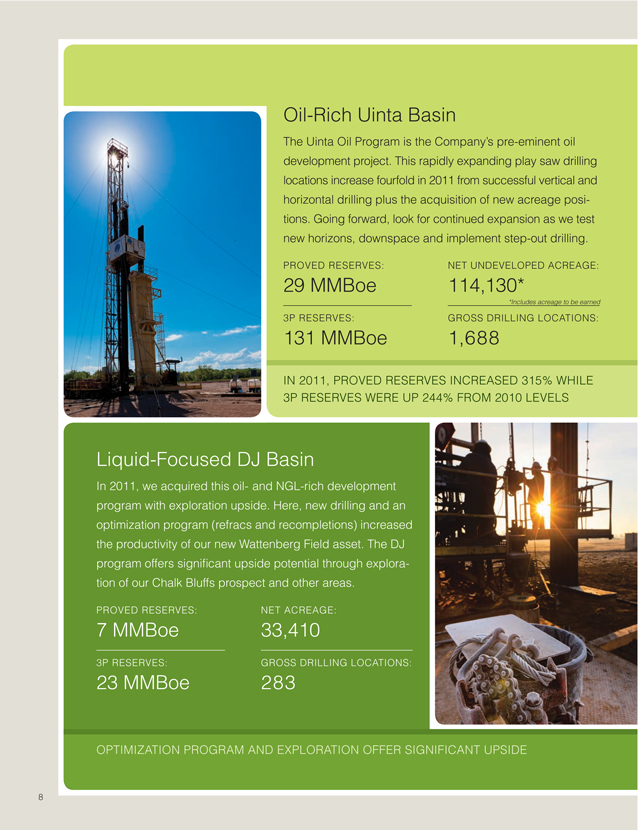
Oil-Rich Uinta Basin
The Uinta Oil Program is the Company’s pre-eminent oil development project. This rapidly expanding play saw drilling locations increase fourfold in 2011 from successful vertical and horizontal drilling plus the acquisition of new acreage positions. Going forward, look for continued expansion as we test new horizons, downspace and implement step-out drilling.
PROVED RESERVES:
29 MMBoe
3P RESERVES:
131 MMBoe
NET UNDEVELOPED ACREAGE:
114,130*
*Includes acreage to be earned
GROSS DRILLING LOCATIONS:
1,688
IN 2011, PROVED RESERVES INCREASED 315% WHILE
3P RESERVES WERE UP 244% FROM 2010 LEVELS
Liquid-Focused DJ Basin
In 2011, we acquired this oil- and NGL-rich development program with exploration upside. Here, new drilling and an optimization program (refracs and recompletions) increased the productivity of our new Wattenberg Field asset. The DJ program offers signifi cant upside potential through exploration of our Chalk Bluffs prospect and other areas.
PROVED RESERVES:
3P RESERVES:
23 MMBoe
NET ACREAGE:
33,410
GROSS DRILLING LOCATIONS:
283
OPTIMIZATION PROGRAM AND EXPLORATION OFFER SIGNIFICANT UPSIDE
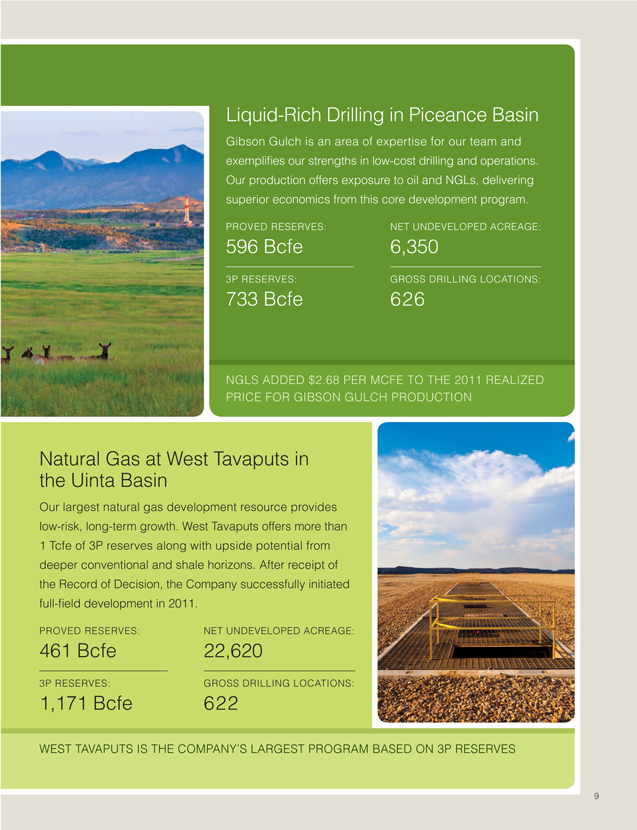
Liquid-Rich Drilling in Piceance Basin
Gibson Gulch is an area of expertise for our team and exemplifi es our strengths in low-cost drilling and operations. Our production offers exposure to oil and NGLs, delivering superior economics from this core development program.
PROVED RESERVES:
596 Bcfe
3P RESERVES:
733 Bcfe
NET UNDEVELOPED ACREAGE:
6,350
GROSS DRILLING LOCATIONS:
626
NGLS ADDED $2.68 PER MCFE TO THE 2011 REALIZED PRICE FOR GIBSON GULCH PRODUCTION
Natural Gas at West Tavaputs in the Uinta Basin
Our largest natural gas development resource provides low-risk, long-term growth. West Tavaputs offers more than
1 Tcfe of 3P reserves along with upside potential from deeper conventional and shale horizons. After receipt of the Record of Decision, the Company successfully initiated full-fi eld development in 2011.
PROVED RESERVES:
461 Bcfe
3P RESERVES:
1,171 Bcfe
NET UNDEVELOPED ACREAGE:
22,620
GROSS DRILLING LOCATIONS:
622
WEST TAVAPUTS IS THE COMPANY’S LARGEST PROGRAM BASED ON 3P RESERVES
DISCLOSURE STATEMENTS
Please reference our fi lings with the Securities and Exchange Commission (“SEC”) for further information related to the following disclosures. Reference the following Annual Report on Form 10-K for the year ended December 31, 2011, as well as Current Reports on Form 8-K and Quarterly Reports on Form 10-Q, specifi cally including the Form 8-K fi led with the SEC on February 23, 2012, regarding our Fourth Quarter and Full Year 2011 Results. SEC fi lings are posted to the Company’s website at www.billbarrettcorp.com. You may also obtain SEC fi lings by calling 1-800-SEC-0330 or at www.sec.gov.
Forward-Looking Statements
This report contains forward-looking statements regarding the Company’s future plans and expected performance based on assumptions the Company believes to be reasonable. A number of potential risks and uncertainties could cause actual results to differ materially from these statements. Please reference “Risks Related to the Oil and Natural Gas Industry and to Our Business” in the following 10-K for descriptions of such risks and uncertainties. The Company encourages readers to consider these factors and assumes no obligation to publicly revise or update any forward-looking statements.
New York Stock Exchange Certifi cation
New York Stock Exchange Rule 303A.12(a) requires the chief executive offi cers of listed companies to certify that they are not aware of any violations by their companies of the Exchange’s corporate governance listing standards. This annual certifi cation by the chief executive offi cer of Bill Barrett Corporation has been fi led with the New York Stock Exchange. In addition, Bill Barrett Corporation has fi led Exhibits to the following Form 10-K for the SEC certifi cations required for the chief executive offi cer and chief fi nancial offi cer under Section 302 of the Sarbanes-Oxley Act.
Non-GAAP Measures
Non-GAAP Measures in this report include Discretionary Cash Flow, Finding and Development Costs and Pre-tax PV10
This report contains these non-GAAP measures because management believes that they are useful to investors evaluating the Company’s operating performance. These measures are widely used in the oil and natural gas industry, including by research analysts, in the valuation, comparison and recommendation of investments. Of note, the calculation of these measures may vary substantially from company to company depending upon accounting methods, internal decisions, and capital structure, and there are signifi cant limitations in using these measures. The Company encourages readers to consider these non-GAAP measures along with the Company’s reported fi nancial statements under GAAP. The computations and reconciliations of Discretionary Cash Flow and Finding and Development Costs may be found in the Company’s Current Report on Form 8-K fi led February 23, 2012. Pre-tax PV10 is the discounted future cash fl ows of the Company as presented in the following Form 10-K, without considering the effect of income taxes.
Calculation of Natural Gas Liquids as a Percent of Sales Volumes
The Company’s natural gas production is based on wellhead volumes and its natural gas revenue includes the incremental revenue benefi t related to NGL volumes resulting from processing by the purchasers of our natural gas. Many oil and gas producing companies report NGL volumes and revenues separately from natural gas volumes and revenues. In order to provide a metric that is comparable to other oil and gas production companies,
the Company is providing the percentage of total Company sales volumes that receive NGL-related pricing based on the barrel of oil equivalent NGL volumes for revenues received from our gas purchasers or processors. The NGL volumes identifi ed by our gas purchasers or processors are converted to an oil equivalent based on 42 gallons per barrel and compared to overall gas equivalent production based on a 1 barrel to 6 Mcf ratio.
Reserve Disclosure
The SEC permits oil and gas companies to disclose probable and possible reserves in their fi lings with the SEC. The Company does not plan to include probable and possible reserve estimates in its fi lings with the SEC.
The Company has provided internally generated estimates for probable and possible reserves in this report. The estimates conform to SEC guidelines. They are not prepared or reviewed by third-party engineers. Our probable and possible reserve estimates are determined using strip pricing, which we use internally for planning and budgeting purposes. The Company’s estimate of probable and possible reserves is provided in this report because management believes it is useful additional information that is widely used by the investment community in the valuation, comparison and analysis of companies.
Board of Directors
Fredrick J. Barrett, Chairman of the Board, Chief Executive Offi cer and President
James M. Fitzgibbons, Past Chairman of Davidson Cotton Company
Kevin O. Meyers, Past Senior Vice President, Exploration and Production, Americas of ConocoPhillips and President of ConocoPhillips Canada
Jim W. Mogg, Lead Director; Past Chairman of DCP Midstream Partners
William F. Owens, Former Governor of Colorado
Edmund P. Segner, Past President and Chief of Staff of EOG Resources, Inc.
Randy I. Stein, Tax, Accounting and Business Consultant, Former Principal of PricewaterhouseCoopers LLP
Michael E. Wiley, Past Chairman and Chief Executive Offi cer of Baker Hughes Incorporated
Offi cers
Fredrick J. Barrett, Chairman of the Board, Chief Executive Offi cer and President
Robert W. Howard, Chief Financial Offi cer and Treasurer
R. Scot Woodall, Chief Operating Offi cer
Francis B. Barron, Executive Vice President — General Counsel and Secretary
Kurt M. Reinecke, Executive Vice President — Exploration Terry R. Barrett, Senior Vice President — Exploration David R. Macosko, Senior Vice President — Accounting Stephen W. Rawlings, Senior Vice President — Operations Huntington T. Walker, Senior Vice President — Land
Duane J. Zavadil, Senior Vice President — Government and Regulatory Affairs
Michael R. Craig, Vice President — Information Technology William M. Crawford, Vice President — Finance Jennifer C. Martin, Vice President — Investor Relations Larry A. Parnell, Vice President — Business Development Troy L. Schindler, Vice President — Drilling Monty D. Shed, Vice President — Production Michele Vion, Vice President — Human Resources
Corporate Information
Corporate Offi ce
1099 Eighteenth Street Suite 2300 Denver, Colorado 80202 Telephone: 303-293-9100 Fax: 303-291-0420 www.billbarrettcorp.com
Investor Relations
Jennifer C. Martin
Vice President — Investor Relations
jmartin@billbarrettcorp.com
Annual Shareholders’ Meeting
Our annual shareholders’ meeting will be held at 9:30 a.m. (MDT) on Thursday, May 10, 2012, at The Westin Denver Downtown Tabor Auditorium 1672 Lawrence Street Denver, Colorado 80202
Transfer Agent
Computershare
480 Washington Boulevard
Jersey City, New Jersey 07310-1900 1-866-683-2961 (dedicated line) 1-800-522-6645 (main) Internet: www.bnymellon.com/shareowner/ equityaccess
Independent Auditors
Deloitte & Touche LLP
Denver, Colorado
Independent and Outside
Reservoir Engineers
Netherland, Sewell & Associates, Inc.
Dallas, Texas
Design: Rassman Design | Printing: RR Donnelley | Photography: Jim Blecha
1099 Eighteenth Street, Suite 2300 Denver, Colorado 80202 303-293-9100 www.billbarrettcorp.com