FORM 6-K
SECURITIES AND EXCHANGE COMMISSION
Washington, D.C. 20549
Report of Foreign Private Issuer
Pursuant to Rule 13a-16 or 15d-16
of the Securities Exchange Act of 1934
April 25, 2019
| Commission File Number | 001-31335 | |
| AU Optronics Corp. | ||
| (Translation of registrant’s name into English) | ||
| No. 1 Li-Hsin Road 2 | ||
| Hsinchu Science Park | ||
| Hsinchu, Taiwan | ||
| (Address of principal executive offices) | ||
Indicate by check mark whether the registrant files or will file annual reports under cover Form 20-F or Form 40-F.
| Form 20-F X Form 40-F___ |
Indicate by check mark if the registrant is submitting the Form 6-K in paper as permitted by Regulation S-T Rule 101(b)(1):
____
Note: Regulation S-T Rule 101(b)(1) only permits the submission in paper of a Form 6-K if submitted solely to provide an attached annual report to security holders.
Indicate by check mark if the registrant is submitting the Form 6-K in paper as permitted by Regulation S-T Rule 101(b)(7):
____
Note: Regulation S-T Rule 101(b)(7) only permits the submission in paper of a Form 6-K if submitted to furnish a report or other document that the registrant foreign private issuer must furnish and make public under the laws of the jurisdiction in which the registrant is incorporated, domiciled or legally organized
(the registrant's "home country"), or under the rules of the home country exchange on which the registrant's securities are traded, as long as the report or other document is not a press release, is not required to be and has not been distributed to the registrant's security holders, and, if discussing a material event, has already been the subject of a Form 6-K submission or other Commission filing on EDGAR.
Indicate by check mark whether by furnishing the information contained in this Form, the registrant is also thereby furnishing the information to the Commission pursuant to Rule 12g3-2(b) under the Securities Exchange Act of 1934.
Yes ..... No ..X...
If "Yes" is marked, indicate below the file number assigned to the registrant in connection with Rule 12g3-2(b):
Not applicable
INDEX TO EXHIBITS
Item
| 1. | Taiwan Stock Exchange filing entitled, “AU Optronics Corp. reports First Quarter 2019 Financial Results in an investor conference”, dated April 25, 2019. |
| 2. | Taiwan Stock Exchange filing entitled, “AU Optronics Corp. First Quarter 2019 Results”, dated April 25, 2019 |
Signatures
Pursuant to the requirements of the Securities Exchange Act of 1934, the registrant has duly caused this report to be signed on its behalf by the undersigned, thereunto duly authorized.
| AU Optronics Corp. | |||
Date:April 25, 2019 | By: | /s/ Benjamin Tseng | |
| Name: | Benjamin Tseng | ||
| Title: | Chief Financial Officer | ||
Item 1

News Release
AU Optronics Reports First Quarter 2019 Financial Results
Issued by:AU Optronics Corp.
Issued on:April 25, 2019
Hsinchu, Taiwan, April 25, 2019–
AU Optronics Corp. ("AUO" or the "Company") (TSE: 2409; NYSE: AUO) today held its investor conference and announced its consolidated financial results for the first quarter of 2019(1).
Consolidated revenues for the first quarter of 2019 were NT$66.70 billion, down by 13.5% quarter-over-quarter. AUO’s net loss attributable to owners of the Company for the first quarter of 2019 was NT$3.69 billion, with a basic EPS(2) of -NT$0.38.
In the first quarter of 2019, large-sized panel(3) shipments totaled around 25.87 million units, down by 9.1% quarter-over-quarter. Shipments of small-and-medium-sized panels in the same quarter were around 24.96 million units, down by 22.4% quarter-over-quarter.
Highlights of consolidated results for the first quarter of 2019
| Ÿ | Revenues of NT$66.70 billion |
| Ÿ | Operating loss of NT$5.10 billion |
| Ÿ | Net loss attributable to owners of the Company at NT$3.69 billion |
| Ÿ | Basic EPS(2) was -NT$0.38 |
| Ÿ | Gross margin was 0.4% |
| Ÿ | Operating margin was -7.6% |
| Ÿ | EBITDA(4)margin was 6.1% |
| Ÿ | Operating margin of Display Segment was -7.6% |
| Ÿ | EBITDA(4)margin of Display Segment was 6.4% |
As the first quarter was the traditional slow season, the market demand remained lackluster. In addition, market prices for panels were still at low level. As a result, AUO’s revenues for the first quarter declined by 13.5% quarter-over-quarter, and the financial results were less than ideal. However, the management team has strived to maintain AUO’s financial structure at a stable and healthy status, where inventory turnover days were 37 days, and net debt to equity ratio was 12.6 %.
1/3
Looking into the second quarter, market demand has shown signs of recovery as brand customers start to prepare for the high season restocking. Besides AUO’s continuous market deployment in high value-added and non-commodity products, it will extend its value chain by integrating hardware and software services. By providing integrated total solution services, AUO aims to move towards a direction that jointly creates greater values with its customers.
| (1) | All financial information was prepared by the Company in accordance with Taiwan IFRS. |
| (2) | Basic EPS in the first quarter of 2019 were calculated based on the weighted average outstanding shares of the reporting quarter (9,624 million shares). |
| (3) | Large size refers to panels that are 10 inches and above. |
| (4) | EBITDA = Operating Profit + D&A, that is, operating profit before depreciation and amortization. |
###
ABOUT AU OPTRONICS
AU Optronics Corp. (AUO) is one of the world’s leading providers of optoelectronic solutions. Based on its profound R&D and manufacturing experience, AUO offers a full range of display applications and smart solutions integrating software and hardware, and leverages its core expertise to enter new business areas such as solar, general health and circular economy. Additionally, AUO is the first pure TFT-LCD manufacturer to be successfully listed at the New York Stock Exchange (NYSE). AUO has also been named to Dow Jones Sustainability World Index since 2010. AUO’s consolidated net revenues in 2018 were NT$307.63 billion. For more information, please visit AUO.com.
Safe Harbour Notice
AU Optronics Corp. (“AUO” or the “Company”) (TWSE: 2409; NYSE: AUO), a global leader of TFT-LCD panels, today announced the above news. Except for statements in respect of historical matters, the statements contained in this Release include “forward-looking statements” as defined in the Private Securities Litigation Reform Act of 1995. These forward-looking statements are based on our management's expectations, projections and beliefs at the time regarding matters including, among other things, future revenues and costs, financial performance, technology changes, capacity, utilization rates, yields, process and geographical diversification, future expansion plans and business strategy. Such forward looking statements are subject to a number of known and unknown risks and uncertainties that can cause actual results to differ materially from those expressed or implied by such statements, including risks related to the flat panel display industry, the TFT-LCD market, acceptance of and demand for our products, technological and development risks, competitive factors, and other risks described in the section entitled "Risk Factors" in our Annual Report on Form 20-F filed with the United States Securities and Exchange Commission on March 29, 2019. In addition, our SEC reports, including our Annual Report on Form 20-F contains other information on these and other factors that could affect our financial results and cause actual results to differ materially from any forward-looking information we may provide. We undertake no obligation to update or revise any forward-looking statements to reflect subsequent events, new information or future circumstances.
For more information, please contact:
2/3
Public Communication Dept.
| Jessie Lee | Tel: +886-3-5008800 ext 3206 | Email : jessie.jc.lee@auo.com |
| Katie Chen | Tel: +886-3-5008800 ext 3615 | Email : katie.chen@auo.com |
3/3
Item 2
AU Optronics Corp. First Quarter 2019 Results Investor Conference ⊉弒 方 20 1 9 ⴲ䧪Ჾ⨡㮓ᵸ奨㓌㗁 Apr. 25, 2019
Safe Harbor Notice 2 © 2019 AU Optronics Corporation – Proprietary and Confidential • The statements included in this presentation that are not historical in nature are “forward - looking statements” within the meaning of Section 27A of the United States Securities Act of 1933 and Section 21E of the United States Securities Exchange Act of 1934. These forward - looking statements, which may include statements regarding AU Optronics’ future results of operations, financial condition or business prospects, are subject to significant risks and uncertainties and are based on AU Optronics’ current expectations. • Actual results may differ materially from those expressed or implied in these forward - looking statements for a variety of reasons, including, among other things: the cyclical nature of our industry; our dependence on introducing new products on a timely basis; our dependence on growth in the demand for our products; our ability to compete effectively; our ability to successfully expand our capacity; our dependence on key personnel; general economic and political conditions, including those related to the TFT - LCD industry; possible disruptions in commercial activities caused by natural and human - induced disasters, including terrorist activity and armed conflict; and fluctuations in foreign currency exchange rates. • Beginning on January 1, 2013, we have adopted the International Financial Reporting Standards as issued by the International Accounting Standards Board (“IFRS”) to the extent endorsed by the ROC Financial Supervisory Commission (“FSC”) (“Taiwan IFRS”) for reporting our annual and interim consolidated financial statements in the ROC in accordance with the requirements of the FSC. All financial information contained herewithin is presented in conformity with Taiwan IFRS. Readers should be cautioned that Taiwan IFRS differs in many material respects from IFRS including to the extent that any new or amended standards or interpretations applicable under IFRS may not be timely endorsed by the FSC. • Our release of financial forecasts and forward - looking statements at any particular time does not create any duty of disclosure beyond that which is imposed by law, and we expressly disclaim any obligation to publicly update or revise any forecasts or forward - looking statements, whether as a result of new information, future events or otherwise.
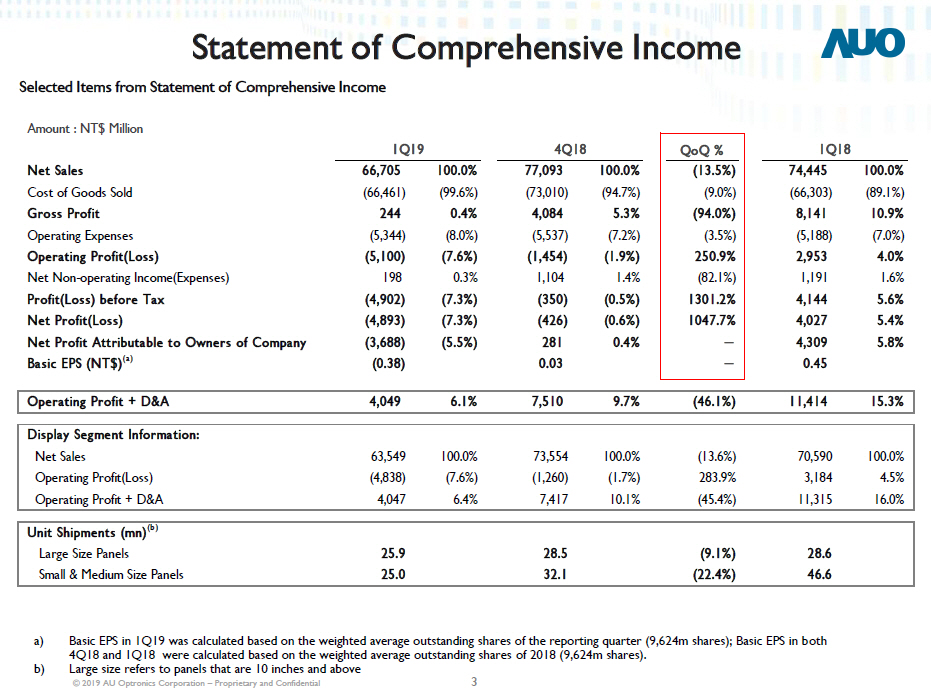
Statement of Comprehensive Income Selected Items from Statement of Comprehensive Income a) Basic EPS in 1Q19 was calculated based on the weighted average outstanding shares of the reporting quarter (9,624m shares); Basic EPS in both 4Q18 and 1Q18 were calculated based on the weighted average outstanding shares of 2018 (9,624m shares). b) Large size refers to panels that are 10 inches and above Amount : NT$ Million 1Q19 4Q18 QoQ % 1Q18 Net Sales 66,705 100 . 0 % 77,093 100 . 0 % ( 13 . 5 % ) 74,445 100 . 0 % Cost of Goods Sold (66,461) ( 99 . 6 % ) (73,010) ( 94 . 7 % ) ( 9 . 0 % ) (66,303) ( 89 . 1 % ) Gross Profit 244 0 . 4 % 4,084 5 . 3 % ( 94 . 0 % ) 8,141 10 . 9 % Operating Expenses (5,344) ( 8 . 0 % ) (5,537) ( 7 . 2 % ) ( 3 . 5 % ) (5,188) ( 7 . 0 % ) Operating Profit(Loss) (5,100) ( 7 . 6 % ) (1,454) ( 1 . 9 % ) 250 . 9 % 2,953 4 . 0 % Net Non - operating Income(Expenses) 198 0 . 3% 1,104 1 . 4% ( 82 . 1 % ) 1,191 1 . 6% Profit(Loss) before Tax (4,902) ( 7 . 3 % ) (350) ( 0 . 5 % ) 1301 . 2 % 4,144 5 . 6 % Net Profit(Loss) (4,893) ( 7 . 3 % ) (426) ( 0 . 6 % ) 1047 . 7 % 4,027 5 . 4 % Net Profit Attributable to Owners of Company (3,688) ( 5 . 5 % ) 281 0 . 4 % モ 4,309 5 . 8 % Basic EPS (NT$) (a ) (0.38) 0.03 モ 0.45 Operating Profit + D& A 4,049 6 . 1 % 7,510 9 . 7 % ( 46 . 1 % ) 11,414 15 . 3 % Display Segment Information: Net Sales 63,549 10 0 . 0% 73,554 10 0 . 0% ( 13 . 6 % ) 70,590 10 0 . 0% Operating Profit(Loss) (4,838) ( 7 . 6 % ) (1,260) ( 1 . 7 % ) 28 3 . 9% 3,184 4 . 5% Operating Profit + D&A 4,047 6 . 4% 7,417 10 . 1% ( 45 . 4 % ) 11,315 16 . 0% Unit Shipments (mn) (b ) Large Size Panels 25.9 28.5 ( 9 . 1 % ) 28.6 Small & Medium Size Panels 25.0 32.1 ( 22 . 4 % ) 46.6 3 © 2019 AU Optronics Corporation – Proprietary and Confidential
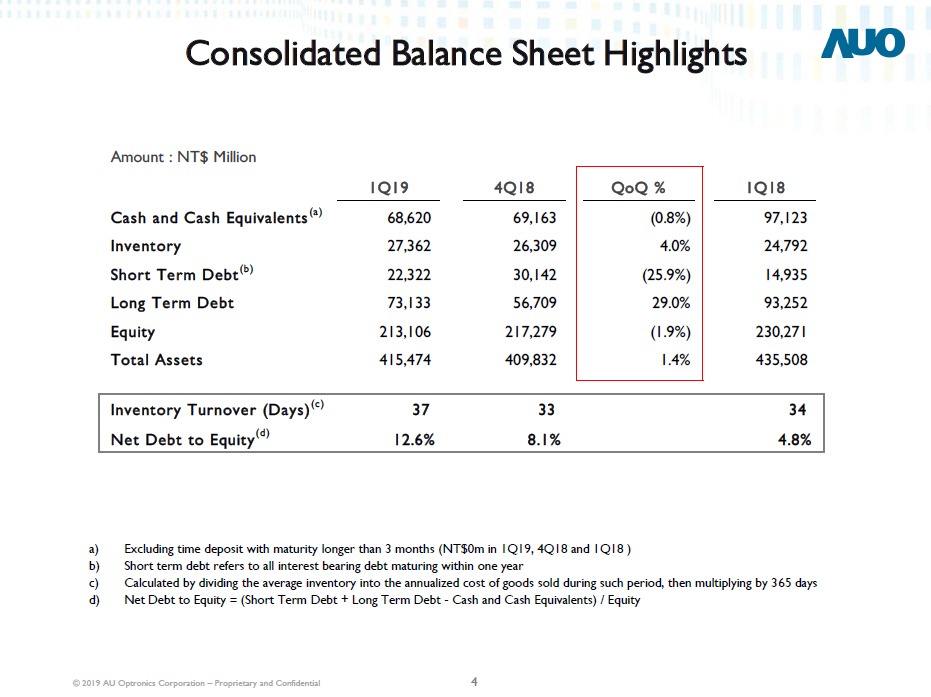
Consolidated Balance Sheet Highlights 4 © 2019 AU Optronics Corporation – Proprietary and Confidential a) Excluding time deposit with maturity longer than 3 months (NT$0m in 1Q19, 4Q18 and 1Q18 ) b) Short term debt refers to all interest bearing debt maturing within one year c) Calculated by dividing the average inventory into the annualized cost of goods sold during such period, then multiplying by 365 days d) Net Debt to Equity = (Short Term Debt + Long Term Debt - Cash and Cash Equivalents) / Equity Amount : NT$ Million 1Q19 4Q18 QoQ % 1Q18 Cash and Cash Equivalents (a ) 68 , 620 69 , 163 ( 0 . 8 % ) 97 , 123 Inventory 27 , 362 26 , 309 4 . 0% 24 , 792 Short Term Debt (b ) 22 , 322 30 , 142 ( 25 . 9 % ) 14 , 935 Long Term Debt 73 , 133 56 , 709 29 . 0% 93 , 252 Equity 21 3 , 106 21 7 , 279 ( 1 . 9 % ) 23 0 , 271 Total Assets 41 5 , 474 40 9 , 832 1 . 4% 43 5 , 508 Inventory Turnover (Days) (c) 37 33 34 Net Debt to Equity (d) 12 . 6 % 8 . 1 % 4 . 8 %
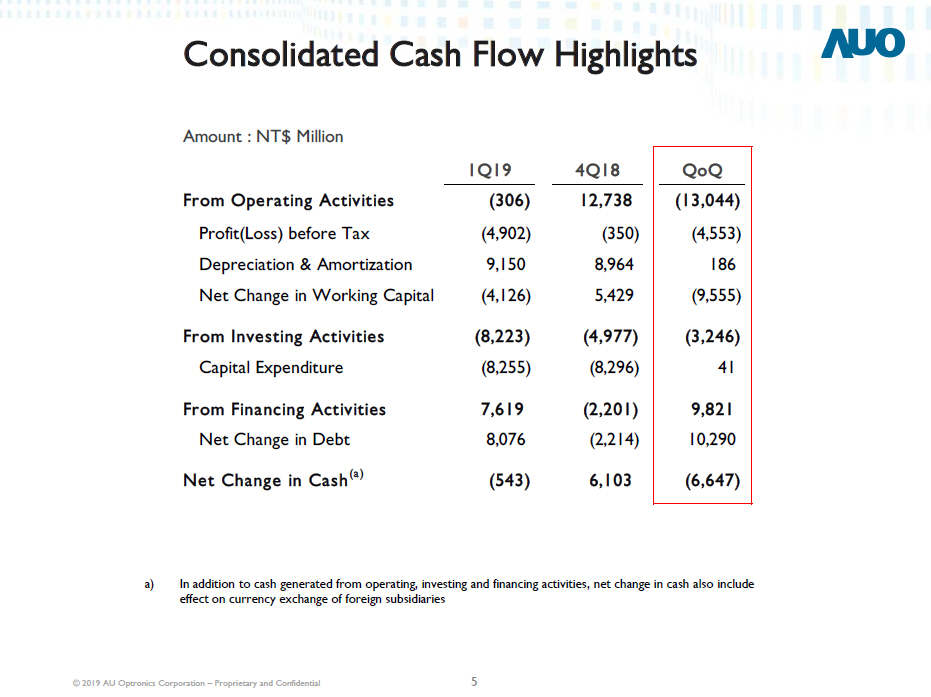
Consolidated Cash Flow Highlights 5 © 2019 AU Optronics Corporation – Proprietary and Confidential a) In addition to cash generated from operating, investing and financing activities, net change in cash also include effect on currency exchange of foreign subsidiaries Amount : NT$ Million 1Q19 4Q18 QoQ From Operating Activities ( 306 ) 12,738 ( 13 , 044 ) Profit(Loss) before Tax ( 4 , 90 2 ) ( 35 0 ) ( 4 , 55 3 ) Depreciation & Amortization 9 , 150 8 , 964 186 Net Change in Working Capital ( 4 , 12 6 ) 5 , 429 ( 9 , 55 5 ) From Investing Activities ( 8 , 223 ) ( 4 , 977 ) ( 3 , 246 ) Capital Expenditure ( 8 , 25 5 ) ( 8 , 29 6 ) 41 From Financing Activities 7 , 61 9 ( 2 , 201 ) 9,821 Net Change in Debt 8 , 076 ( 2 , 21 4 ) 10,290 Net Change in Cash (a ) ( 543 ) 6,103 ( 6 , 647 )
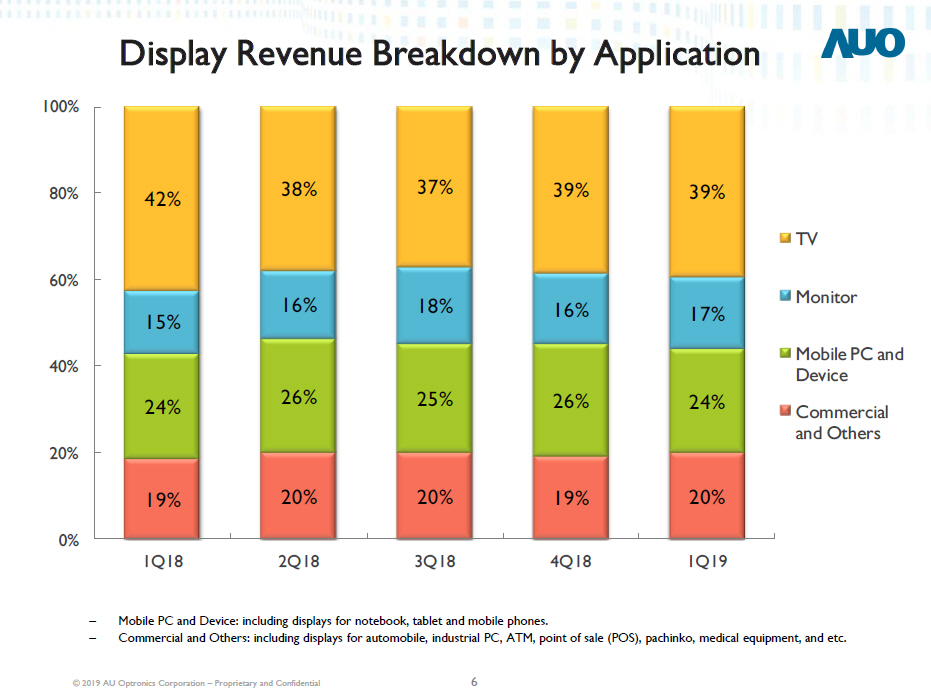
Display Revenue Breakdown by Application – Mobile PC and Device: including displays for notebook, tablet and mobile phones. – Commercial and Others: including displays for automobile, industrial PC, ATM, point of sale (POS), pachinko, medical equipment, and etc. 19% 20% 20% 19% 20% 24% 26% 25% 26% 24% 15% 16% 18% 16% 17% 42% 38% 37% 39% 39% 0% 20% 40% 60% 80% 100% 1 Q 18 2 Q 18 3 Q 18 4 Q 18 1 Q 19 TV M o n i t o r Mobile PC and Device C o mm e r c i a l and Others 6 © 2019 AU Optronics Corporation – Proprietary and Confidential
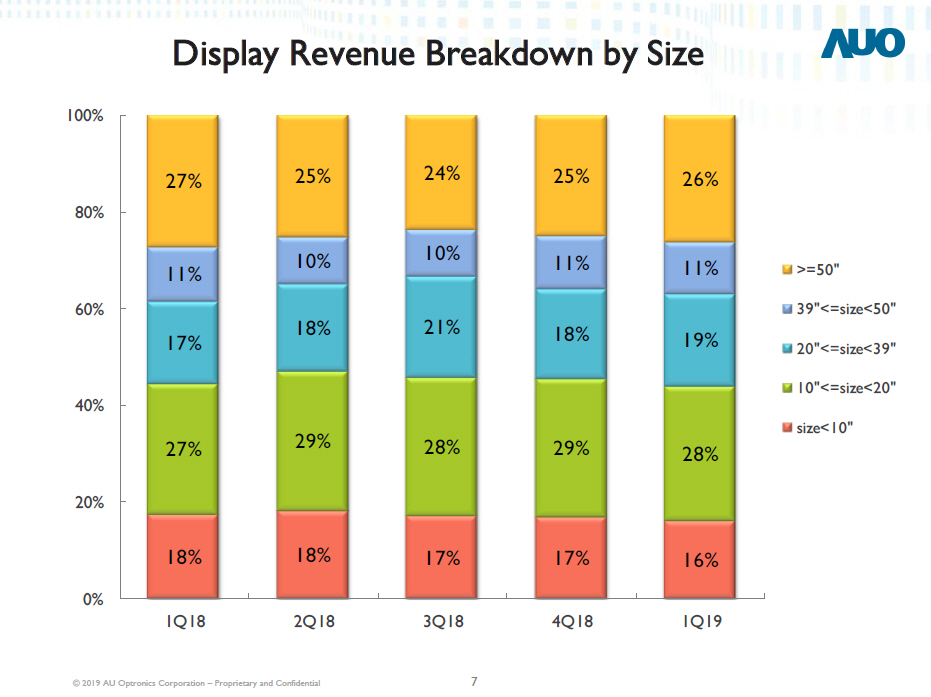
Display Revenue Breakdown by Size 18% 18% 17% 17% 16% 27% 29% 28% 29% 28% 17% 18% 21% 18% 19% 11% 10% 10% 11% 11% 27% 25% 24% 25% 26% 0% 20% 40% 60% 80% 100% 1 Q 18 2 Q 18 3 Q 18 4 Q 18 1 Q 19 >=50 " 39"<=size<50" 20"<=size<39" 10"<=size<20" size<10" 7 © 2019 AU Optronics Corporation – Proprietary and Confidential

Consolidated Shipments & ASP by Area Shipments in square meter ASP per square meter – ASP per square meter in US$ was translated from NT$ based on average exchange rates announced by Customs Administration, Mini s try of Finance of each respective quarter 6 , 41 6 6 , 26 8 6 , 70 8 6 , 67 8 6 , 34 2 0 3,500 1 Q 18 2 Q 18 3 Q 18 4 Q 18 1 Q 19 (K m 2 ) 7,000 $ 36 3 8 © 2019 AU Optronics Corporation – Proprietary and Confidential $ 36 1 $ 36 1 $ 34 5 $ 31 2 200 300 400 1 Q 18 2 Q 18 3 Q 18 4 Q 18 1 Q 19 ( U S $ ) 500

Consolidated Small & Medium Panel Shipments by Area & Revenues R e v e n u es Shipments in square meter 409 . 4 398 . 1 385 . 1 285 . 3 231 . 5 0 150 300 1Q18 2Q18 3Q18 4Q18 – Small & Medium size refers to panels that are under 10 inches 1 Q 19 (K m 2 ) 450 12 . 1 9 �� 2019 AU Optronics Corporation – Proprietary and Confidential 12 . 3 12 . 8 11 . 6 9 . 9 0 4 8 12 16 20 1 Q 18 2Q18 3 Q 18 4 Q 18 1Q19 (NT$ bn)

Bright Innovation · Amazing Life \ \ \ • • • • ! • • • \ I • • • •• - •• e
AU OPTRONICS CORP. AND SUBSIDIARIES
Consolidated Condensed Statements of Comprehensive Income
For the Three Months Ended March 31, 2019 and 2018 and December 31, 2018
(Expressed in Millions of New Taiwan Dollars (NTD) and US Dollars (USD) except for per share amounts and shares outstanding)
| Year over Year Comparison | Sequential Comparison | ||||||||||||||||||||
| 1Q19 | 1Q18 | 1Q19 | 4Q18 | ||||||||||||||||||
| USD | NTD | % | NTD | YoY% | USD | NTD | % | NTD | QoQ% | ||||||||||||
| Net Sales | 2,162 | 66,705 | 100.0 | 74,445 | (10.4) | 2,162 | 66,705 | 100.0 | 77,093 | (13.5) | |||||||||||
| Cost of Goods Sold | 2,154 | 66,461 | 99.6 | 66,303 | 0.2 | 2,154 | 66,461 | 99.6 | 73,010 | (9.0) | |||||||||||
| Gross Profit | 8 | 244 | 0.4 | 8,141 | (97.0) | 8 | 244 | 0.4 | 4,084 | (94.0) | |||||||||||
| Operating Expenses | 173 | 5,344 | 8.0 | 5,188 | 3.0 | 173 | 5,344 | 8.0 | 5,537 | (3.5) | |||||||||||
| Operating Profit(Loss) | (165) | (5,100) | (7.6) | 2,953 | - | (165) | (5,100) | (7.6) | (1,454) | 250.9 | |||||||||||
| Net Non-operating Income(Expenses) | 6 | 198 | 0.3 | 1,191 | (83.4) | 6 | 198 | 0.3 | 1,104 | (82.1) | |||||||||||
| Profit(Loss) before Income Tax | (159) | (4,902) | (7.3) | 4,144 | - | (159) | (4,902) | (7.3) | (350) | 1,301.2 | |||||||||||
| Income Tax Expense | 0 | 10 | 0.0 | (117) | - | 0 | 10 | 0.0 | (76) | - | |||||||||||
| Net Profit(Loss) | (159) | (4,893) | (7.3) | 4,027 | - | (159) | (4,893) | (7.3) | (426) | 1047.7 | |||||||||||
| Other Comprehensive Income(Loss) | 34 | 1,064 | 1.6 | 1,012 | 5.1 | 34 | 1,064 | 1.6 | 407 | 161.4 | |||||||||||
| Total Comprehensive Income(Loss) | (124) | (3,829) | (5.7) | 5,040 | - | (124) | (3,829) | (5.7) | (19) | 19606.8 | |||||||||||
| Net Profit(Loss) Attributable to: | |||||||||||||||||||||
| Owners of Company | (119) | (3,688) | (5.5) | 4,309 | - | (119) | (3,688) | (5.5) | 281 | - | |||||||||||
| Non-Controlling Interests | (39) | (1,205) | (1.8) | (282) | 327.2 | (39) | (1,205) | (1.8) | (707) | 70.4 | |||||||||||
| Net Profit(Loss) | (159) | (4,893) | (7.3) | 4,027 | - | (159) | (4,893) | (7.3) | (426) | 1,047.7 | |||||||||||
| Total Comprehensive Income(Loss) Attributable to: | |||||||||||||||||||||
| Owners of Company | (93) | (2,885) | (4.3) | 5,063 | - | (93) | (2,885) | (4.3) | 576 | - | |||||||||||
| Non-Controlling Interests | (31) | (944) | (1.4) | (24) | 3,901.2 | (31) | (944) | (1.4) | (596) | 58.4 | |||||||||||
| Total Comprehensive Income(Loss) | (124) | (3,829) | (5.7) | 5,040 | - | (124) | (3,829) | (5.7) | (19) | 19,606.8 | |||||||||||
| Basic Earnings Per Share | (0.012) | (0.38) | 0.45 | (0.012) | (0.38) | 0.03 | |||||||||||||||
| Basic Earnings Per ADS(2) | |||||||||||||||||||||
| (0.124) | (3.83) | 4.48 | (0.124) | (3.83) | 0.29 | ||||||||||||||||
| Weighted-Average Shares Outstanding ('M) | 9,624 | 9,624 | 9,624 | 9,624 | |||||||||||||||||
Note: (1) Amounts in New Taiwan dollars were translated into US dollars at the exchange rate of NTD 30.86 per USD as of March 31, 2019
(2) 1 ADS equals 10 common shares
AU OPTRONICS CORP. AND SUBSIDIARIES
Consolidated Condensed Balance Sheets
March 31, 2019 and 2018
(Expressed in Millions of New Taiwan Dollars (NTD) and US Dollars (USD) )
| March 31, 2019 | March 31, 2018 | YoY | |||||||||
| ASSETS | USD | NTD | % | NTD | % | NTD | % | ||||
| Cash and Cash Equivalents | 2,224 | 68,620 | 16.5 | 97,123 | 22.3 | (28,503) | (29.3) | ||||
| Notes & Accounts Receivables | 1,373 | 42,362 | 10.2 | 40,173 | 9.2 | 2,189 | 5.4 | ||||
| Other Current Financial Assets | 105 | 3,243 | 0.8 | 999 | 0.2 | 2,244 | 224.6 | ||||
| Inventories | 887 | 27,362 | 6.6 | 24,792 | 5.7 | 2,570 | 10.4 | ||||
| Other Current Assets | 100 | 3,098 | 0.7 | 8,116 | 1.9 | (5,018) | (61.8) | ||||
| Total Current Assets | 4,688 | 144,685 | 34.8 | 171,203 | 39.3 | (26,518) | (15.5) | ||||
| Long-term Investments | 433 | 13,357 | 3.2 | 10,132 | 2.3 | 3,225 | 31.8 | ||||
| Net Fixed Assets | 7,134 | 220,144 | 53.0 | 226,041 | 51.9 | (5,897) | (2.6) | ||||
| Right-of-use Assets | 420 | 12,946 | 3.1 | 0 | 0.0 | 12,946 | - | ||||
| Other Non-Current Assets | 789 | 24,342 | 5.9 | 28,132 | 6.5 | (3,790) | (13.5) | ||||
| Total Non-Current Assets | 8,775 | 270,789 | 65.2 | 264,305 | 60.7 | 6,484 | 2.5 | ||||
| Total Assets | 13,463 | 415,474 | 100.0 | 435,508 | 100.0 | (20,035) | (4.6) | ||||
| |||||||||||
| LIABILIIES | |||||||||||
| Short-term Borrowings | 10 | 323 | 0.1 | 3,208 | 0.7 | (2,884) | (89.9) | ||||
| Notes & Accounts Payable | 1,771 | 54,662 | 13.2 | 51,364 | 11.8 | 3,298 | 6.4 | ||||
| Current Installments of Long-term Borrowings | 713 | 21,999 | 5.3 | 11,727 | 2.7 | 10,271 | 87.6 | ||||
| Current Financial Liabilities | 1 | 39 | 0.0 | 54 | 0.0 | (15) | (28.1) | ||||
| Accrued Expense & Other Current Liabilities | 816 | 25,185 | 6.1 | 28,309 | 6.5 | (3,125) | (11.0) | ||||
| Machinery and Equipment Payable | 294 | 9,066 | 2.2 | 10,141 | 2.3 | (1,074) | (10.6) | ||||
| Total Current Liabilities | 3,606 | 111,273 | 26.8 | 104,803 | 24.1 | 6,470 | 6.2 | ||||
| Long-term Borrowings | 2,370 | 73,133 | 17.6 | 93,252 | 21.4 | (20,119) | (21.6) | ||||
| Other Non-Current Liabilities | 582 | 17,961 | 4.3 | 7,182 | 1.6 | 10,779 | 150.1 | ||||
| Total Non-Current Liabilities | 2,952 | 91,094 | 21.9 | 100,434 | 23.1 | (9,340) | (9.3) | ||||
| Total Liabilities | 6,558 | 202,368 | 48.7 | 205,237 | 47.1 | (2,870) | (1.4) | ||||
| EQUITY | |||||||||||
| Common Stock | 3,119 | 96,242 | 23.2 | 96,242 | 22.1 | 0 | 0.0 | ||||
| Capital Surplus | 1,959 | 60,462 | 14.6 | 60,539 | 13.9 | (78) | (0.1) | ||||
| Retained Earnings | 1,399 | 43,159 | 10.4 | 55,538 | 12.8 | (12,380) | (22.3) | ||||
| Other Equity | (1) | (45) | 0.0 | 897 | 0.2 | (942) | - | ||||
| Non-Controlling Interests | 431 | 13,288 | 3.2 | 17,054 | 3.9 | (3,766) | (22.1) | ||||
| Total Equity | 6,906 | 213,106 | 51.3 | 230,271 | 52.9 | (17,165) | (7.5) | ||||
| Total Liabilities & Equity | 13,463 | 415,474 | 100.0 | 435,508 | 100.0 | (20,035) | (4.6) | ||||
Note: (1) Amounts in New Taiwan dollars were translated into US dollars at the exchange rate of NTD 30.86 per USD as of March 31, 2019
(2) Cash and Cash Equivalents excluding time deposit with maturity longer than 3 months
AU OPTRONICS CORP. AND SUBSIDIARIES
Consolidated Condensed Cash Flow Statements
For the Period Ended March 31, 2019 and 2018
(Expressed in Millions of New Taiwan Dollars (NTD) and US Dollars (USD))
| Three Months 2019 | Three Months 2018 | |||||
| USD | NTD | NTD | ||||
| Cash Flow from Operating Activities: | ||||||
| Profit(Loss) before Income Taxes | (159) | (4,902) | 4,144 | |||
| Depreciation & Amortization | 296 | 9,150 | 8,461 | |||
| Share of Profit of Equity-Accounted Investees | (3) | (103) | (26) | |||
| Changes in Working Capital | (134) | (4,126) | (3,741) | |||
| Changes in Others | (10) | (324) | (375) | |||
| Net Cash Provided(Used) by Operating Activities | (10) | (306) | 8,463 | |||
| Cash Flow from Investing Activities: | ||||||
| Acquisitions of Financial Assets Measured at Fair Value | (30) | (928) | (29) | |||
| Proceeds from Disposal of Financial Assets Measured at Fair Value | 30 | 932 | 40 | |||
| Acquisitions of Property, Plant and Equipment | (267) | (8,255) | (10,562) | |||
| Proceeds from Disposal of Property, Plant and Equipment | 2 | 52 | 1,035 | |||
| Decrease(Increase) in Other Financial Assets | 1 | 39 | 17 | |||
| Decrease(Increase) in Other Assets | (2) | (64) | (260) | |||
| Net Cash Increase(Decrease) Resulting from Change in Consolidated Entity | 0 | 0 | (565) | |||
| Net Cash Provided(Used) in Investing Activities | (266) | (8,223) | (10,325) | |||
| Cash Flow from Financing Activities: | ||||||
| Increase(Decrease) in Short-term Borrowings | (7) | (229) | (190) | |||
| Increase(Decrease) in Long-term Borrowings | 269 | 8,305 | (5,778) | |||
| Payment of Lease Liabilities | (6) | (174) | 0 | |||
| Increase(Decrease) in Guarantee Deposits | 0 | 10 | (1) | |||
| Changes in Non-Controlling Interests and Others | (9) | (292) | 0 | |||
| Net Cash Provided(Used) by Financing Activities | 247 | 7,619 | (5,969) | |||
| Effect of Exchange Rate Changes on Cash and Cash Equivalents | 12 | 366 | (67) | |||
| Net Increase(Decrease) in Cash and Cash Equivalents | (18) | (543) | (7,898) | |||
| Cash and Cash Equivalents at Beginning of Period | 2,241 | 69,163 | 105,021 | |||
| Cash and Cash Equivalents at End of Period | 2,224 | 68,620 | 97,123 | |||