UNITED STATES
SECURITIES AND EXCHANGE COMMISSION
Washington, D.C. 20549
FORM 10-K
[X]ANNUAL REPORT PURSUANT TO SECTION 13 OR 15(d) OF THE SECURITIES EXCHANGE ACT OF 1934
For the fiscal year ended December 31, 2007
Commission File No: 000-49844

TEMECULA VALLEY BANCORP INC.
(Exact name of registrant as specified in its charter)
California &# 160; 46-0476193
(State or other jurisdiction of Incorporation or organization) (I.R.S. Employer identification No.)
27710 Jefferson Avenue – Suite A100, Temecula CA 92590
(Address of principal executive offices) (Zip Code)
Registrant’s telephone number, including area code:
(951) 694-9940
Securities registered pursuant to section 12(b) of the Act:
Title of Each Class Name of Each Exchange on which Registered
Common Stock, No Par Value NASDAQ
Indicate by check mark if the registrant is a well-known seasoned issuer, as defined in Rule 405 of the Securities Act.
Yes [ ] No [X]
Indicate by check mark if the registrant is not required to file reports pursuant to Section 13 or Section 15(d) of the Act.
Yes [ ] No [X]
Indicate by check mark whether the registrant (1) has filed all reports required to be filed by Section 13 or 15(d) of the Securities Exchange Act of 1934 during the preceding 12 months (or for such shorter period that the registrant was required to file such reports), and (2) has been subject to such filing requirements for the past 90 days. Yes [X] No [ ]
Indicate by check mark if disclosure of delinquent filers pursuant to Item 405 of Regulation S-K is not contained herein, and will not be contained, to the best of registrant’s knowledge, in definitive proxy or information statements incorporated by reference in Part III of this Form 10-K or any amendment to this Form 10-K. [ ]
Indicate by check mark whether the registrant is a large accelerated filer, an accelerated filer, or a non-accelerated filer. See definition of “accelerated filer and large accelerated filer” in Rule 12b-2 of the Exchange Act.
Large accelerated filer [ ] Accelerated Filer [X] Non-accelerated Filer [] Smaller reporting company [ ]
Indicate by check mark whether the registrant is a shell company (as defined in Rule 12b-2 of the Exchange Act).
Yes [ ] No [X]
The aggregate market value of the common stock held by non-affiliates of the Registrant as of June 30, 2007 was approximately $188,624,437 (based on the June 29, 2007 closing price of common stock of $17.69 per share).
Number of Registrant’s shares of common stock outstanding at March 14, 2008 was 10,063,267.
Documents incorporated by reference: Definitive Proxy Statement for the Annual Meeting of Shareholders-Part III.
TABLE OF CONTENTS
CAUTIONARY STATEMENT FOR PURPOSES OF THE "SAFE HARBOR" PROVISIONS OF THE PRIVATE SECURITIES LITIGATION REFORM ACT OF 1995
We have made forward-looking statements in this document that are subject to risks and uncertainties. These statements are based on the beliefs and assumptions of our management, and on information currently available to our management. Forward-looking statements include the information concerning our possible or assumed future results of operations, and statements preceded by, followed by, or that include the words "will”, "believes”, "expects”, "anticipates”, "intends”, "plans”, "estimates" or similar expressions. Our management believes these forward-looking statements are reasonable. However, you should not place undue reliance on the forward-looking statements, since they are based on current expectations. Actual results may differ materially from those currently expected or anticipated.
Forward-looking statements are not guarantees of performance. They involve risks, uncertainties and assumptions. Our future results and shareholder values may differ materially from those expressed in these forward-looking statements. Many of the factors described below, that will determine these results and values, are beyond our ability to control or predict. For those statements, we claim the protection of the safe harbor contained in the Private Securities Litigation Reform Act of 1995.
A number of factors, some of which are beyond our ability to predict or control, could cause future results to differ materially from those contemplated. These factors include but are not limited to:
| · | a further slowdown in the national and California economies |
| · | volatility of rate sensitive deposits |
| · | changes in the regulatory environment |
| · | increasing competitive pressure in the banking industry |
| · | operational risks including data processing system failures or fraud |
| · | asset/liability matching risks and liquidity risks |
| · | changes in the securities markets |
| · | change in loan prepayment speeds |
The consequences of these factors, any of which could hurt our business, could include, among others:
| · | increased loan delinquencies |
| · | an escalation in problem assets and foreclosures |
| · | a decline in demand for our products and services |
| · | a reduction in the value of the collateral for loans made by us, especially real estate, which, in turn would likely reduce our customers’ borrowing power and the value of assets and collateral associated with our existing loans |
| · | a reduction in the value of certain assets held by our company |
See also “Item 1A Risk Factors” and other risk factors discussed elsewhere in this Annual Report.
3
ITEM 1: BUSINESS
General
Temecula Valley Bancorp Inc.
We formed Temecula Valley Bancorp Inc. ("company" or “our company” or “our holding company”) in 2002 to serve as a holding company for Temecula Valley Bank ("bank" or “our bank”). We reincorporated our holding company from Delaware into California in December 2003 as a tax savings measure. Our holding company is a bank holding company registered with the Board of Governors of the Federal Reserve System ("Federal Reserve") under the Bank Holding Company Act of 1956, as amended ("BHCA"). Our holding company’s activities consist of owning the outstanding common stock of our bank, Temecula Valley Statutory Trust II, Temecula Valley Statutory Trust III, Temecula Valley Statutory Trust IV, Temecula Valley Statutory Trust V, and Temecula Valley Statutory Trust VI (as of January 17, 2008). Unless the context indicates otherwise, all references in this report to “we”, “us”, and “our” refer to our company and our bank on a consolidated basis.
Temecula Valley Bank
Our bank was organized in 1996 and commenced operations on December 16, 1996 as a national banking association. Our bank converted from a national charter to a state charter on June 29, 2005 to take advantage of higher legal lending limits and reduced examination fees. The deposits of our bank are insured by the Federal Deposit Insurance Corporation ("FDIC") up to the applicable limits. Our bank has no subsidiaries.
General Business
Our bank currently has eleven full-service banking offices in California providing services to customers in the Riverside, San Bernardino, and San Diego Counties. Our principal office is located in Temecula, California with other California full-service offices in Carlsbad, Corona, El Cajon, Escondido, Fallbrook, Murrieta, Ontario, Solana Beach, San Marcos, and in the Rancho Bernardo area of San Diego.
Our bank also operates loan production offices which principally generate construction and/or mortgage loans in California at the following locations: Encinitas, Fallbrook, Ontario, and Temecula. The Real Estate Industries Group of our bank focuses on construction lending and maintains loan production offices in Corona and San Rafael, both in California. Our bank also has SBA loan production offices in the following states: Arizona, California, Florida, Nevada, Oregon, and Texas.
Our holding company, as the parent of our bank, has no operations and conducts no business of its own other than owning the common shares of our bank, Temecula Valley Statutory Trust II, Temecula Valley Statutory Trust III, Temecula Valley Statutory Trust IV, Temecula Valley Statutory Trust V, and Temecula Valley Statutory Trust VI (as of January 17, 2008) . Accordingly, the discussion of the business which follows concerns the business conducted by our bank, unless otherwise indicated. No material portion of our company’s business is seasonal.
Our income is generally derived from interest on various loan products, income generated on the sale of loans, and fees earned from servicing loans and from providing deposit and other services. Our significant operating expenses are interest paid on deposits, salaries and expenses of our employees and other operating expenses such as rent.
Business Strategy
Our goals are to build a leading Southern California regional community banking franchise designed to maximize long-term returns to our shareholders by seeking to grow assets, while maintaining strong earnings. In order to achieve these goals, we intend to pursue a strategy that takes advantage of and enhances our three core business lines: community banking, construction lending and SBA lending. Specifically, our strategy relies upon our ability to continue:
Attracting Talented & Experienced Management. We have created an entrepreneurial culture with performance-based compensation that attracts highly skilled bankers. Rather than a traditional banking model of opening branches in a market followed by staffing, we expand into new markets upon hiring bankers with histories of successful business production and/or customer relationship management in our area.
4
Expanding our Community Banking Model. We have built and are expanding teams to provide a one-on-one banking relationship with our customers. By providing superior service and a wide range of loan and deposit products to our customers, we can expand our business with existing customers and build a reputation that will attract additional customers. We have built a cash management team devoted exclusively to the development and implementation of state of the art products designed to allow us to generate a higher level of core deposits from existing customers and serve new deposit customers within our markets.
We opened one new branch in 2005, two branches in 2006, and one branch in 2007. We will continue to explore branch expansion opportunities as skilled bankers become available in or around our market areas.
Maintaining Strength in Construction Lending. Our Real Estate Industries Group (“REIG”) specializes in residential, commercial and industrial construction loans to experienced, mid-sized builders in established markets. In Southern California, the primary non-owner occupied real estate concentration is San Diego County. The majority of non-owner occupied residential construction consists of projects with one to five units, followed by condominium construction and tract construction. In contrast, Northern California efforts have been focused primarily on residential condominiums in San Francisco and smaller tracts in the East Bay area. The REIG consists of experienced real estate construction lenders with decades of successful lending experience. The loan portfolios of this group include builders that typically have been customers of the loan officers for 6 years or longer. We believe our loan quality will continue to be enhanced by this degree of experience at both the loan officer and customer levels, beginning at underwriting and continuing through loan disbursement, project completion and the ultimate sale or lease of the completed product.
Building our SBA Loan Origination Volume. The expansion of the loan volume through our SBA distribution channel is dependent on hiring seasoned business development officers (“BDOs”) and increasing the number of loans closed by each BDO. We continually seek to increase the products available to our BDOs. In January 2007, we reorganized to focus greater attention in the western states. We strive to capture a greater portion of the BDOs’ referral sources’ business, thus increasing the loan production of each BDO. The referral sources are typically commercial real estate brokers, business brokers, mortgage brokers, attorneys and accountants.
Response to Market Decline. Although some of the real estate markets in which we lend have experienced significant declines in sales volume and decreased valuations over the past several months, to date our overall asset quality has not been dramatically affected due to consistently prudent underwriting practices and our gradual shift from construction lending to commercial and industrial and SBA lending.
Maintain Effective Underwriting and Servicing Standards. We do not compete primarily on the basis of price for our loan business, but compete based on established relationships with customers. We also maintain regular review and reporting procedures for all of our loans in order to judge market and other risks that can affect the types of loans we fund. This approach allows us to be discerning in evaluating loan transactions and to competently monitor market risks as a loan is funded.
Overview of Performance. Our profitability goals have been realized historically by maintenance of a strong net interest income as well as expense controls during several consecutive years of significant internal expansion. This produced earnings for 2007 of $15.1 million, compared to $16.9 million in 2006, and $14.0 million in 2005. Return on average equity was 14.18% for 2007, compared to 23.89% for 2006, and 27.71% in 2005. Return on average total assets was 1.16% for 2007, compared to 1.64% for 2006, and 1.91% for 2005.
Net interest income before provision for loan losses has increased to $65.6 million for 2007, compared to $59.8 million for 2006, and $43.5 million in 2005 due to increases in the volume of interest-earning assets in 2007 and the increases in rates and volume of interest-earning assets in 2006. Total assets increased 6.49% to $1.32 billion as of December 31, 2007, compared to $1.24 billion as of December 31, 2006, and $869.0 million as of December 31, 2005. Average interest-earning assets increased 30.36% to $1.22 billion for 2007, compared to $939.2 million for 2006, and $642.2 million in 2005. The net interest margin has decreased to 5.36% in 2007 from 6.37% in 2006, and 6.78% in 2005.
Non-interest income was $16.4 million as of December 31, 2007, compared to $19.4 million for 2006, and $23.8 million for 2005. This source of income is principally derived from SBA loan sales. The decrease in non-interest income in 2007 and 2006 is primarily due to the decrease in servicing income as a result of the decline in value of servicing rights as further described in Item 7 of this Form 10-K. We currently anticipate that for 2008, non-interest income will increase due to the expectation of a more favorable fair value adjustment of the SBA servicing assets as a result of lower prepayments and stabilization of the discount rate applied to future servicing cash flows.
5
We measure operating expenses as a percentage of average assets. As a percentage of average assets, operating expenses decreased to 3.99% for 2007, compared to 4.56% for 2006, and 5.57% for 2005. Average assets increased from $730.0 million as of December 31, 2005, to $1.03 billion as of December 31, 2006, and $1.30 billion as of December 31, 2007. The percentage decrease is a result of increases in the growth in average assets having outpaced growth in operating expenses in each of the last three years. The decrease in this ratio is a result of the company’s efforts to improve efficiency by recruiting successful, experienced bankers with a track record for high levels of production.
Lending
Loan Portfolio Composition
Total loans, including loans held-for-sale, excluding deferred loan fees, and allowance for loan losses, were $1.24 billion at December 31, 2007, compared to $1.15 billion at December 31, 2006, and $758.1 million at December 31, 2005. Contributing to the increase was the purchase of the unguaranteed portion of 7(a) loans in the amount of $77.8 million which was offset by sales of portfolio first trust deed loans of $70.2 million. Loan growth is expected to remain strong in 2008 due to the expansion of our branches and growth of the SBA wholesale lending unit.
Our loan portfolio composition is primarily construction, commercial, SBA, and real estate secured loans. SBA 7(a) loans, of which we are an active originator, comprise approximately 23% of net loans outstanding as of December 31, 2007 and 2006. Typical of community bank loan markets, a significant portion of our portfolio is real estate secured. Approximately 92% of our loan portfolio at December 31, 2007 was real estate secured, compared to 94% at December 31, 2006 and 95% at December 31, 2005. Approximately 47%, 50%, and 51% of our lending portfolio was classified as real estate construction loans as of December 31, 2007, 2006, and 2005, respectively.
In December 2006, the federal banking agencies issued final guidance to reinforce sound risk management practices for bank holding companies and banks in commercial real estate (“CRE”) loans. The guidance establishes CRE concentration thresholds as criteria for examiners to identify CRE concentration that may warrant further analysis. The implementation of these guidelines could result in increased reserves and capital costs for banks with “CRE concentration”. We believe that our CRE portfolio as of December 31, 2007 does not have the risks associated with high CRE concentration due to mitigating factors, including low loan-to-value ratios, adequate debt coverage ratios, and a wide variety of property types. Under the final guidance, our ratio of commercial real estate loans, excluding owner-occupied properties, to capital as of December 31, 2007, is approximately 382%. While this exceeds the 300% benchmark set by the guidance, we believe we have implemented enhanced risk management practices as recommended by the guidance. These practices include the review and analysis of detailed monthly construction loan status reports, detailed monthly geographic concentration reports by product type and county location, detailed monthly commercial real estate concentration reports, and centralized monitoring and servicing of our commercial real estate term loans.
The weighted-average loan-to-value for our commercial real estate loan portfolio, excluding owner occupied properties, is approximately 63% at December 31, 2007. The following table summarizes our loan portfolio, (including loans held-for-sale), excluding deferred loan fees and allowance for loan loss, by type of loan and their percentage distribution:
| December 31, | |||||||||||||||||||
| 2007 | 2006 | 2005 | 2004 | 2003 | |||||||||||||||
| Amount | Percent | Amount | Percent | Amount | Percent | Amount | Percent | Amount | Percent | ||||||||||
| Loan portfolio composition: | (dollars in thousands) | ||||||||||||||||||
| Commercial | $ | 68,761 | 6% | $ | 59,663 | 5% | $ | 25,457 | 3% | $ | 16,322 | 3% | $ | 23,630 | 7% | ||||
| Real estate - Construction | 587,992 | 47% | 570,204 | 50% | 385,378 | 51% | 203,885 | 38% | 113,847 | 31% | |||||||||
| Real estate – Other | 292,869 | 23% | 246,096 | 21% | 248,039 | 32% | 196,098 | 36% | 123,948 | 34% | |||||||||
| SBA | 286,410 | 23% | 266,581 | 23% | 94,914 | 13% | 114,799 | 22% | 98,428 | 27% | |||||||||
| Consumer | 3,632 | 1% | 3,685 | 1% | 4,306 | 1% | 2,796 | 1% | 3,193 | 1% | |||||||||
| Total Loans | $ | 1,239,664 | 100% | $ | 1,146,229 | 100% | $ | 758,094 | 100% | $ | 533,900 | 100% | $ | 363,046 | 100% | ||||
6
Loan Maturity
The following table sets forth the contractual maturities of gross loans at December 31, 2007.
| One year | More than 1 | More than 3 | More than | Total | ||||||||||
| or less | year to 3 years | years to 5 years | 5 years | loans | ||||||||||
| (dollars in thousands) | ||||||||||||||
| Commercial | $ | 39,444 | $ | 19,392 | $ | 7,610 | $ | 2,315 | $ | 68,761 | ||||
| Real estate - Construction | 477,067 | 19,041 | - | 91,884 | 587,992 | |||||||||
| Real estate – Other | 115,167 | 30,480 | 3,686 | 143,536 | 292,869 | |||||||||
| SBA | 23,993 | 591 | 3,219 | 258,607 | 286,410 | |||||||||
| Consumer | 1,555 | 814 | 1,263 | - | 3,632 | |||||||||
| Total Gross Loans Outstanding | $ | 657,226 | $ | 70,318 | $ | 15,778 | $ | 496,342 | $ | 1,239,664 | ||||
The majority of our loans have floating rates tied to Wall Street Journal prime or other market rate indicators. The following table sets forth, as of December 31, 2007, the dollar amounts of net loans outstanding with a maturity date of one year or more, and whether such loans have fixed or adjustable rates.
| Fixed | Adjustable | Total | ||||||
| (dollars in thousands) | ||||||||
| Commercial | $ | 1,530 | $ | 27,787 | $ | 29,317 | ||
| Real estate - Construction | 417 | 110,595 | 111,012 | |||||
| Real estate – Other | 37,509 | 140,193 | 177,702 | |||||
| SBA | 1,086 | 261,331 | 262,417 | |||||
| Consumer | 305 | 1,685 | 1,990 | |||||
| Total Gross Loans Outstanding | $ | 40,847 | $ | 541,591 | $ | 582,438 | ||
Loan Origination and Sale
The following table sets forth categories of loan originations, loan purchases, categories of loan sales and principal repayments of loans for the periods indicated:
| At December 31, | ||||||||||||||
| 2007 | 2006 | 2005 | 2004 | 2003 | ||||||||||
| (dollars in thousands) | ||||||||||||||
| Beginning balance | $ | 1,146,229 | $ | 758,094 | $ | 533,900 | $ | 363,046 | $ | 272,766 | ||||
| Loans originated (1): | ||||||||||||||
| Commercial | 589,187 | 437,323 | 323,219 | 237,064 | 161,376 | |||||||||
| Real estate: | ||||||||||||||
| SBA & Equity | 169,705 | 177,379 | 167,402 | 225,373 | 192,549 | |||||||||
| Construction | 1,592,706 | 1,239,794 | 897,862 | 574,150 | 367,464 | |||||||||
| Other | - | - | 11,281 | 44,942 | 96,051 | |||||||||
| Consumer | 15,360 | 5,382 | 5,200 | 1,869 | 2,422 | |||||||||
| Total loans originated | 2,366,958 | 1,859,878 | 1,404,964 | 1,083,398 | 819,862 | |||||||||
| Loans purchased: | ||||||||||||||
| SBA | 74,526 | 133,336 | - | - | - | |||||||||
| Total loans originated and purchased | 2,441,484 | 1,993,214 | 1,404,964 | 1,083,398 | 819,862 | |||||||||
| Loans sold | ||||||||||||||
| Commercial | ||||||||||||||
| Real estate: | ||||||||||||||
| SBA | 156,534 | 160,478 | 151,191 | 199,236 | 129,813 | |||||||||
| First trust deed | 58,963 | |||||||||||||
| Construction | - | - | - | - | - | |||||||||
| Other - Mortgage | - | - | 13,707 | 45,243 | 100,800 | |||||||||
| Total loans sold | 215,497 | 160,478 | 164,898 | 244,479 | 230,613 | |||||||||
| Less: | ||||||||||||||
| Principal repayments | 2,132,552 | 1,444,601 | 1,015,872 | 668,065 | 498,969 | |||||||||
| Total loans | $ | 1,239,664 | $ | 1,146,229 | $ | 758,094 | $ | 533,900 | $ | 363,046 | ||||
| Brokered Loans Originated (2) | ||||||||||||||
| Mortgage | $ | 71,066 | $ | 96,733 | $ | 63,735 | $ | 60,604 | $ | 65,358 | ||||
| SBA | $ | 61,187 | $ | 65,609 | $ | 52,470 | $ | 154,515 | $ | 65,456 | ||||
| (1) Loan originations in many cases are not funded immediately. | ||||||||||||||
| (2) Brokered refers to loans that were originated by the Bank but funded by other financial institutions. | ||||||||||||||
7
Underwriting Process
Our lending activities are guided by the basic lending policies established by our Board of Directors. Each loan must meet minimum underwriting criteria established in our lending policies and must fit within our strategies for yield and portfolio enhancement.
For all newly originated loans, upon receipt of a completed loan application from a prospective borrower, a credit report is ordered and, if necessary, additional financial information is requested. An independent appraisal is required on every property securing a loan in excess of $250 thousand, which is ordered by our Appraisal Department. In addition, the loan officer conducts a review of these appraisals for accuracy, reasonableness, and conformance to our lending policy on all applications. All revisions to the approved appraiser list must be approved by the Chief Credit Officer or Chief Appraiser.
Depending on the loan size and type, our loan approval process consists of a chain of concurrences beginning with the originating loan officer and rising through the office/division manager, the Chief Credit Officer, the Chief Administrative Officer, the Real Estate Lending Manager, the President/CEO and the Board of Directors. The number of concurring signatures obtained is dependent upon the dollar amount of the transaction and/or the total liability of the borrowing relationship. All signatures in the chain must be obtained except in the case of absence from the bank. In all cases, the signature of the highest required loan authority must be obtained.
All loans exceeding the limits of the above mentioned individuals will be forwarded to our Board of Directors Loan Committee for approval after concurrence by the appropriate chain of authority. The vote of our Directors Loan Committee will be obtained by the committee chairman telephonically or in person at the monthly Board of Directors Loan Committee meeting. The approval or declination by each member will be indicated on the signature page of the loan report.
If the loan is approved, the loan commitment specifies the terms and conditions of the proposed loan including the amount, interest rate, amortization term, a brief description of the required collateral, and the required insurance coverage. Generally, the borrower must provide proof of fire, flood (if applicable), and casualty insurance on the property serving as collateral. This insurance must be maintained during the full term of the loan. Also, generally, title insurance endorsed to our bank is required on all real estate secured loans.
We maintain SBA loan production offices in the mid and western United States and an office in Florida. SBA loan production offices are typically staffed with a business development officer who prepares the loan applications and compiles the necessary information regarding the applicant. All SBA loans are approved at our Temecula office. The other construction lending and mortgage related loan production offices, all of which are in California, are typically staffed with business development officers, underwriters, and processors who send these loans files to our main office where the credit decision is made. Our retail full-service branches may include non-SBA commercial, mortgage, and construction loan officers.
SBA Lending Programs
The SBA lending programs are designed by the federal government to assist the small business community in obtaining financing from financial institutions that are given government guarantees as an incentive to make the loan. Our bank is a Nationwide SBA "Preferred Lender". As a "Preferred Lender," we can approve a loan within the authority given us by the SBA without prior approval from the SBA. "Preferred Lenders" approve, package, fund, and service SBA loans within a range of authority that is not available to other SBA lenders without the "Preferred Lender" designation.
Our SBA loans fall into two categories, loans originated under the SBA's 7(a) Program ("7(a) loans") and loans originated under the SBA's 504 Program ("504 Loans"). For 2007, 7(a) loans have represented approximately 54% of the SBA Loans originated while 504, piggyback, USDA business, and industry loan programs have represented the balance.
Under the SBA's 7(a) Program, loans in excess of $150 thousand up to $2 million are guaranteed 75% by the SBA. Generally, this guarantee may become invalid only if the loan does not meet the SBA underwriting, documentation, and servicing guidelines. Loans under $150 thousand are guaranteed 85% by the SBA.
SBA 7(a) loans collateralized by real estate have terms of up to 25 years, while loans collateralized by equipment and working capital have terms of up to 10 years and 7 years, respectively. A minimum down payment of 10% is required on most 7(a) loans, but may require a larger down payment when the real estate collateral consists of a special purpose or
8
single use property such as a motel, service station, and/or the business is a start-up.
We generally sell the guaranteed portion SBA 7(a) loans, which is up to 85% of the loan. The remaining portion is the unguaranteed portion of the loans, a portion of which may also be sold with approval from the SBA. Approximately 5% of the 7(a) loans are generally required to stay on the books of our bank. Funding for these loans has come principally from retail deposit sources. The SBA loans generally have an interest rate of 1.00% to 2.75% over Wall Street Journal Prime Rate.
We retain the servicing on the sold guaranteed portion of 7(a) loans. The strategy of selling both the guaranteed and unguaranteed portion of the 7(a) loans allows us to manage our capital levels and to assist us in meeting the local community loan demand. Upon sale in the secondary market, the purchaser of the guaranteed portion of 7(a) loans pays a premium to us, which generally is between 4% and 8% of the guaranteed amount, and in the case of a sale of the unguaranteed portion, the premium is usually between 1% and 4%. We also receive a servicing fee equal to 1% to 5% of the guaranteed amount sold in the secondary market. In the event that a 7(a) loan has missed payments in the first three months and goes into default within 270 days of its sale, or prepays within 90 days, we might repurchase the loan and may be required to refund the premium to the purchaser. Since our bank has been open, we have repurchased 47 loans, however only 3 of these repurchased loans required a refund of the premium. No refunds were owed on the other 44 loans repurchased.
Under the SBA's 504 Program, we require a minimum down payment of 10% (more on special purpose, single use properties, or start-ups). We then enter into a 50% first trust deed loan to the borrower and an interim up to 40% second trust deed loan. The first trust deed loan must be equal to half of the original maturity of the related debenture. The second trust deed loan is usually for a term of 120 days. Within the 120 day period of entering into the loan, the second trust deed loans are refinanced by SBA certified development companies and used as collateral for SBA guaranteed debentures. For 504 construction loans, the term on the second trust deed loan is generally 18 months and the Certified Development Company cannot payoff the loan until a notice of completion is filed. The first trust deed loan on a construction project is generally a term of 25 years and 18 months. Before releasing the funds to the borrower, the first trust deed loans may be pre-sold with no recourse. We retain no servicing on 504 Loans after they are sold.
Our SBA lending program, and portions of our real estate lending, are dependent on the continual funding and programs of certain federal agencies or quasi-government corporations, including the SBA. The guaranteed portion of an SBA loan does not count towards our bank’s loans-to-one-borrower limitation which, at December 31, 2007 was $38.8 million.
SBA lending is a federal government created and administered program. As such, legislative and regulatory developments can affect the availability and funding of the program. This dependence on legislative funding and regulatory restrictions from time to time causes limitations and uncertainties with regard to the continued funding of such loans, with a resulting potential adverse financial impact on our business. Currently, the maximum limit of individual 7(a) loans which the SBA will permit is $2 million. Any reduction in the maximum loan amount or the maximum guaranty amount could have a negative impact on our business. Since the SBA lending of our bank constitutes a significant portion of our lending business, dependence on this government program, and its periodic uncertainty with availability and amounts of funding, creates greater risk for our business than do other parts of our business.
Commercial Lending/Real Estate Lending
Generally, our commercial loans are underwritten in our market area on the basis of the borrower's ability to service such debt from identified cash flow. We usually take as collateral a lien on available real estate, equipment or other assets and obtain a personal guaranty of the business principals.
In addition to commercial loans secured by real estate, we make commercial mortgage loans to finance the purchase of real property, which generally consists of real estate on which structures have already been completed or will be completed and occupied by the borrower. We offer a variety of mortgage loan products that generally are amortized over 10 to 25 years. Our commercial mortgage loans are secured by first liens on real estate. Typically, we have both fixed and variable interest rates and amortize over a 10 to 25 year period with balloon payments due at the end of 3 to 10 years. As a Preferred SBA Lender (discussed above), we also issue full term variable rate real estate loan commitments when the facility is enhanced by the underlying SBA guaranty. In underwriting commercial mortgage loans, consideration is given to the property's operating history, future operating
9
projections, current and projected occupancy, location and physical condition. The underwriting analysis also includes credit checks, appraisals, environmental assessments and a review of the financial condition of the borrower.
Construction Lending
We originate construction loans on both one-to-four-family residences and on commercial real estate properties. We originate owner-occupied construction loans to build single family residences. We also originate construction loans to companies engaged in the business of constructing homes for re-sale. These loans may be for homes currently under contract for sale or homes built for sale purposes to be marketed for sale during construction. For owner-occupied single family residences, the borrower and the property must qualify for permanent financing. Prequalification for owner-occupied single family residences is required. For commercial property, the borrower must qualify for permanent financing and the debt service coverage must be 1.20 to 1 or more (except for SBA loans). Qualification for permanent financing should be determined by the loan officer as part of the credit presentation. Absent such prequalification, we will not approve a construction loan. We originate land acquisition and development loans with the source of repayment being either the sale of finished lots or the sale of homes to be constructed on the finished lots. Construction loans are generally offered with terms up to 24 months.
Construction loans are generally made in amounts up to 75% of the value of the security property for non-owner single family residences and commercial properties and up to 75% for owner-occupied single family residences. During construction, loan proceeds are disbursed in draws as construction progresses based upon inspections of work in place by independent construction inspectors. At December 31, 2007, construction loans, including land acquisition and development loans totaled $588.0 million or approximately 47% of our total loan portfolio.
Construction loans are generally considered to involve a higher degree of credit risk than long-term financing on improved, owner-occupied real estate. Risk of loss on a construction loan is dependent largely upon the accuracy of the initial estimate of the security property's value upon completion of construction as compared to the estimated costs of construction, including interest. Also, we assume certain risks associated with the borrower's ability to complete construction in a timely and workmanlike manner. If the estimate of value proves to be inaccurate, or if construction is not performed timely or accurately, we may be confronted with a project which, when completed, has a value which is insufficient to assure full repayment.
Consumer Lending
Consumer loans include automobile loans, recreational vehicle loans, boat loans, home improvement loans, home equity lines of credit, personal loans (collateralized and uncollateralized), and deposit account collateralized loans. The terms of these loans typically range from 12 to 120 months and vary based upon the nature of collateral and size of loan. Our portfolio of consumer loans primarily consists of installment loans secured by new or used automobiles, boats and recreational vehicles, and loans secured by deposits. At December 31, 2007, consumer loans totaled $3.6 million.
As of December 31, 2007, home equity lines totaled $3.7 million, or 0.3% our gross loan portfolio. Our home equity lines are adjustable-rate and reprice with changes in our internal prime rate. Adjustable-rate home equity lines of credit are offered in amounts up to 80% of the appraised value. Home equity lines of credit are offered with terms up to 10 years.
Loan Servicing
The loan participations we sell are serviced by our loan servicing department. The loan officer is responsible for the day-to-day relationship with the customer, unless the loan becomes delinquent (60 days or more past due), at which time the responsibilities are reassigned to credit administration. Loan servicing is centralized at our corporate headquarters. As of December 31, 2007, we were servicing $447.3 million of loans originated that were sold to other investors.
Our loan servicing operations, performed by the loan servicing department, are intended to provide prompt customer service and accurate and timely information for account follow-up, financial reporting and management review. Following the funding of an approved loan, all pertinent loan data is entered into our data processing system, which provides monthly billing statements, tracks payment performance, and effects agreed upon interest rate adjustments on loans. Regular loan service efforts include payment processing and collection notices, as well as tracking the performance of additional borrower obligations with respect to the maintenance of casualty insurance coverage, payment of property taxes
10
and senior liens. When payments are not received by their contractual due date, collection efforts begin on the 11th day of delinquency with a telephone contact. If the borrower is non-responsive or the loan officer feels more stringent action may be required, the Chief Credit Officer is consulted. Notices of default are generally filed when the loan has become 30-90 days past due.
Credit Risk and Loan Review
We incur credit risk whenever we extend credit to, or enter into other transactions with, our customers. The risks associated with extensions of credit include general risk, which is inherent in the lending business, and risk specific to individual borrowers. Loan review and other loan monitoring practices provide a means for our management to ascertain whether proper credit, underwriting and loan documentation policies, procedures and practices are being followed by our loan officers and are being applied uniformly throughout our bank. The Chief Risk Officer oversees the daily administration of loan review. The Chief Credit Officer and Assistant Chief Credit Officer approve loan officer requests for changes in risk ratings. Loan officers are responsible for continually grading their loans so that individual credits properly reflect the risk inherent therein. On an annual or semi-annual basis, our Board of Directors provides for a third-party outside loan review of all loans that meet certain criteria originated since the previous review. While we continue to review these and other related functional areas, there can be no assurance that the steps we have taken to date will be sufficient to enable us to identify, measure, monitor and control all credit risk.
Concentrations of Credit
Our primary investment is in loans, 92% of which were secured by real estate as of December 31, 2007. Therefore, although we monitor the real estate loan portfolio on a regular basis to avoid undue concentrations to a single borrower or type of real estate collateral, real estate in general is considered a concentrated investment. We seek to mitigate this risk by requiring each borrower to have a certain amount of equity in the real estate at the time of origination, depending on the type of real estate and the credit quality of the borrower. Trends in the market are monitored closely by management on a regular basis.
Under state law, our ability to make aggregate secured loans-to-one-borrower is limited to 25% of unimpaired capital and surplus (as of December 31, 2007, this amount was $38.8 million).
Investment Activities
Our investment policy, as established by our Board of Directors, attempts to provide for and maintain liquidity, generate a favorable return on investments without incurring undue interest rate and credit risk, and complement our lending activities. Our company's policies provide the authority to invest in bank-qualified securities and any investment purchases outside our policy guidelines must be approved by our Board of Directors or committee thereof. Purchases and sales under this limitation and within the guidelines of our policies may be completed at the discretion of our President, Chief Financial Officer or Chief Operating Officer. At December 31, 2007, we held $3.0 million in FNMA Mortgage-backed securities, $2.9 million in Federal Home Loan Bank (“FHLB”) stock, and $4.2 million in federal funds sold.
Nonaccrual, Past Due and Restructured Loans
Nonperforming assets consist of nonperforming loans and Other Real Estate Owned (“OREO”). We had $30.9 million of nonperforming loans as of December 31 2007, of which $10.4 million was guaranteed by the SBA, compared to $19.1 million of nonperforming loans as of December 31 2006, of which $10.3 million was guaranteed by the SBA, and $8.0 million of nonperforming loans as of December 31, 2005, of which $6.5 million was government guaranteed. We had no OREO at December 31, 2007. We had $1.3 million at December 31, 2006, of which $638 thousand was guaranteed by the SBA, and $2.1 million at December 31, 2005, of which $604 thousand was guaranteed by the SBA.
Pursuant to SBA operating procedures, real estate collateral is liquidated when a loan becomes uncollectible. Should there be a shortfall in liquidation proceeds of an SBA guaranteed loan; the SBA will assume 75% - 85% of that shortfall. The ratio of nonperforming SBA loans to total loans (after reducing for SBA guarantees) was 1.66%, 0.77%, and 0.19% for the years ended December 31, 2007, 2006, and 2005, respectively.
We generally place a loan on nonaccrual status and cease accruing interest when loan payment performance is deemed unsatisfactory. All loans past due 90 days are placed on nonaccrual status, unless the loan is both well secured and in the process of collection. Cash payments received, while a loan is classified as nonaccrual, are recorded as a deduction of principal as long as doubt exists as to collection. We are sometimes required to revise a loan's interest rate or repayment terms in a troubled debt restructuring. Restructured loans totaled
11
$539 thousand at December 31, 2007. We had no restructured loans as of December 31, 2006 or 2005. Our credit administration department regularly evaluates potential problem loans as to risk exposure to determine the adequacy of our allowance for loan losses.
We review collateral value on loans secured by real estate during the internal loan review process. New appraisals are acquired when loans are categorized as renewed, nonperforming or potential problem loans. In instances where updated appraisals reflect reduced collateral values, an evaluation of the borrower's overall financial condition is made to determine the need, if any, for possible write-downs or appropriate additions to our allowance for loan losses.
The following table presents information concerning nonaccrual loans, OREO, accruing loans which are contractually past due 90 days or more, as to interest or principal payments and still accruing, and restructured loans:
| Nonaccrual, Past Due, and Restructured Loans | |||||||||||||||||
| December 31, 2007 | December 31, 2006 | ||||||||||||||||
| Gross | Government | Net | Gross | Government | Net | ||||||||||||
| Balance | Guaranteed | Balance | Balance | Guaranteed | Balance | ||||||||||||
| Nonaccrual loans (Gross): | (dollars in thousands) | ||||||||||||||||
| Commercial | $ | 371 | $ | - | $ | 371 | $ | 89 | $ | (44) | $ | 45 | |||||
| Real Estate - Construction | 11,242 | (288) | 10,954 | 5,942 | - | 5,942 | |||||||||||
| Real Estate - Other | 19,323 | (10,091) | 9,232 | 13,093 | (10,290) | 2,803 | |||||||||||
| Installment | - | - | - | - | - | - | |||||||||||
| Total | 30,936 | (10,379) | 20,557 | 19,124 | (10,334) | 8,790 | |||||||||||
| OREO | - | - | - | 1,255 | (638) | 617 | |||||||||||
| Total nonaccrual loans and OREO | $ | 30,936 | $ | (10,379) | $ | 20,557 | $ | 20,379 | $ | (10,972) | $ | 9,407 | |||||
| Gross nonaccrual loans as a percentage of total loans | 2.50% | 1.67% | |||||||||||||||
| Gross nonaccrual loans and OREO as a percentage of total loans and OREO | 2.50% | 1.78% | |||||||||||||||
| Allowance for loan losses to total net loans (including held-for-sale) | 1.29% | 1.10% | |||||||||||||||
| Allowance for loan losses to total net loans (excluding held-for-sale) | 1.56% | 1.29% | |||||||||||||||
| Allowance for loan losses to gross nonaccrual loans | 51.79% | 65.48% | |||||||||||||||
| Loans past due 90 days or more on accrual status: | |||||||||||||||||
| Commercial | $ | - | $ | 26 | |||||||||||||
| Real Estate | - | 114 | |||||||||||||||
| Installment | - | - | |||||||||||||||
| Total | $ | - | $ | 140 | |||||||||||||
| Restructured loans: | |||||||||||||||||
| On accrual status | $ | - | $ | - | |||||||||||||
| On nonaccrual status | 539 | - | |||||||||||||||
| Total | $ | 539 | $ | - | |||||||||||||
The table below summarizes the approximate changes in gross nonaccrual loans for the years ended December 31, 2007, 2006, and 2005.
| 2007 | 2006 | 2005 | ||||
| (dollars in thousands) | ||||||
| Balance, beginning of the year | $ | 19,124 | $ | 7,951 | $ | 11,799 |
| Loans placed on nonaccrual | 25,048 | 15,265 | 3,840 | |||
| Charge-offs | (1,336) | (381) | (540) | |||
| Loans returned to accrual status | (14,771) | (3,936) | (6,586) | |||
| Repayments (including interest applied to principal) | 1,460 | 2,356 | 1,920 | |||
| Transfers to OREO | 1,411 | (2,131) | (2,482) | |||
| Balance, end of year | $ | 30,936 | $ | 19,124 | $ | 7,951 |
The additional interest income that would have been recorded from nonaccrual loans if the loans had not been placed on nonaccrual status was $4.1 million, $2.0 million, and $898 thousand for the years ended December 31, 2007, 2006, and 2005, respectively.
Interest payments received on nonaccrual loans are applied to principal, unless there is no doubt as to ultimate full repayment of principal, in which case, the interest payment is recognized as interest income. Interest income not recognized on nonaccrual loans reduced the net interest margin by 34 basis points, 22 basis points, and 14 basis points for the years ended December 31, 2007, 2006, and 2005, respectively.
12
Other Real Estate Owned (“OREO”)
We had no OREO at December 31, 2007. OREO was $1.3 million at December 31, 2006, of which $638 thousand was guaranteed by the SBA, compared to $2.1 million at December 31, 2005, of which $604 thousand was guaranteed by the SBA. Our policy is to record these properties at the lower of cost or estimated fair value, net of selling expenses, at the time they are transferred into OREO, thereby tying future gains or losses from sale or potential additional write-downs to underlying changes in the market.
Potential Problem Loans
In addition to loans disclosed above as past due, nonaccrual and restructured as of December 31, 2007, management also identified further weaknesses in $6.3 million of already classified loans. Estimated potential losses from these potential credit weaknesses have been provided for in determining the allowance for loan losses at December 31, 2007.
Our management's classification of credits as nonaccrual, restructured or problems does not necessarily indicate that the principal is uncollectible in whole or part.
Allowance for Loan Losses
The allowance for loan losses is a valuation allowance for probable incurred credit losses which is established through charges to earnings in the form of a provision for loan losses. Based on an evaluation of our loan portfolio, management presents a quarterly review of the allowance for loan losses to our Board of Directors, indicating any change in the allowance since the last review and any recommendations as to adjustments. In making our evaluation, we consider the diversification by industry of our commercial loan portfolio, the effect of changes in the local real estate market on collateral values, the results of recent regulatory examinations, the effects on the loan portfolio of current economic indicators and their probable impact on borrowers, the amount of charge-offs for the period, the amount of nonperforming loans and related collateral security, and the evaluation of our loan portfolio through our loan review function. A charge-off occurs when a loan is deemed to be uncollectible. We establish specific allowances for loans which management believes require reserves greater than those allocated according to their classification or delinquent status as prescribed in Statement of Financial Accounting Standards (“SFAS”) No. 114, “Accounting by Creditors for Impairment of a Loan”, as amended by SFAS No. 118, “Accounting by Creditors for Impairment of a Loan – Income Recognition and Disclosures”. The amount of the specific allocation is based on the estimated value of the collateral securing the loans and other analyses pertinent to each situation. Loans are identified for specific allowances from information provided by several sources including asset classification, third party reviews, delinquency reports, periodic updates to financial statements, public records, and industry reports. All loan types are subject to specific allowances once identified as impaired or nonperforming.
Additionally, we use two approaches for the analysis of the performing portfolio: general factors and historical losses. These methods are further broken down into identified loan pools within our portfolio. Using these methodologies, we provide loss allocations to each identified loan classification and to performing loan pools. All pools are evaluated by both methods. We then charge to operations a provision for loan loss to maintain the allowance for loan losses at the level determined by the foregoing methodology.
We follow a loan review program to evaluate credit risk in our loan portfolio. Through the loan review process, we maintain an internally classified loan watch list, which, along with the delinquency list of loans, helps us assess the overall quality of the loan portfolio and our allowance for loan losses. Loans classified as "substandard" are those loans with clear and defined weaknesses such as a highly leveraged position, unfavorable financial ratios, uncertain repayment sources or poor financial condition, which may jeopardize ultimate recoverability of the debt.
Loans classified as "doubtful" are those loans that have characteristics similar to substandard loans but with an increased risk that a loss may occur, or at least a portion of the loan may require a charge-off if liquidated at present. Although loans classified as substandard do not duplicate loans classified as doubtful, both substandard and doubtful loans include some loans that are delinquent at least 30 days or on nonaccrual status.
In addition to loans on the internal watch list classified as substandard or doubtful, we maintain additional classifications on a separate watch list which further aids us in monitoring loan portfolios. These additional loan classifications reflect warning elements where the present status portrays one or more deficiencies that require attention in the short-
13
term or where pertinent ratios of the loan account have weakened to a point where more frequent monitoring is warranted. These loans do not have all of the characteristics of a classified loan (substandard, doubtful) but do show weakened elements as compared with those of a satisfactory credit. We regularly review these loans to aid in assessing our allowance for loan losses.
The economy of our market areas remains dependent on real estate and related industries (i.e. construction, housing). We maintain a reasonably diverse commercial and consumer loan portfolio. Downturn in real estate or construction has had an adverse effect on borrowers' ability to repay loans and has affected our results of operations and financial condition and these changes are taken into account when we evaluate our allowance. Additionally, we have several procedures in place to assist us in minimizing credit risk and maintaining the overall quality of our loan portfolio. We frequently review and update our underwriting guidelines and monitor our delinquency levels for any negative or adverse trends.
The provision for loan loss is the amount expensed and added to the allowance for loan losses. The allowance is kept at a level that is determined by a quarterly analysis of the loan portfolio and represents the probable incurred credit losses in the portfolio. The following table summarizes the activity in the allowance for loan losses for the five years ended December 31, 2007:
| Allowance for Loan Losses | ||||||||||||||
| Year ended December 31, | ||||||||||||||
| 2007 | 2006 | 2005 | 2004 | 2003 | ||||||||||
| (Dollars in Thousands) | ||||||||||||||
| Loans outstanding and loans held-for-sale | $ | 1,237,717 | $ | 1,142,693 | $ | 753,246 | $ | 530,196 | $ | 360,749 | ||||
| Average amount of loans outstanding | 1,196,849 | 922,264 | 634,731 | 446,493 | 318,600 | |||||||||
Balance of allowance for loan losses, beginning of years | 12,522 | 9,039 | 6,362 | 3,608 | 3,017 | |||||||||
| Loans charged off: | ||||||||||||||
| Commercial | (449) | (208) | (250) | (986) | (464) | |||||||||
| Real Estate - Construction | (100) | (10) | - | - | - | |||||||||
| Real Estate - Other | (787) | (159) | (286) | (105) | (37) | |||||||||
| Consumer | - | (4) | (4) | (6) | (4) | |||||||||
| Total loans charged off | $ | (1,336) | $ | (381) | $ | (540) | $ | (1,097) | $ | (505) | ||||
| Recoveries of loans previously charged off: | ||||||||||||||
| Commercial | 148 | 202 | 281 | 23 | 19 | |||||||||
| Real Estate – Construction | - | 10 | - | - | - | |||||||||
| Real Estate - Other | 88 | 1 | 39 | 3 | 33 | |||||||||
| Consumer | - | 1 | - | 4 | 22 | |||||||||
| Total recoveries of loans | $ | 236 | $ | 214 | $ | 320 | $ | 30 | $ | 74 | ||||
| Net loans charged off | (1,100) | (167) | (220) | (1,067) | (431) | |||||||||
| Provision for Loan loss expense | 4,600 | 3,650 | 2,897 | 3,821 | 1,022 | |||||||||
| Balance, end of year | $ | 16,022 | $ | 12,522 | $ | 9,039 | $ | 6,362 | $ | 3,608 | ||||
The following table describes the allocation of the allowance for loan losses among various categories of loans and certain other information for the dates indicated. The allocation is made for analytical purposes and is not necessarily indicative of the categories in which future losses may occur. The total allowance is available to absorb losses from any segment of loans.
14
| At the Years Ended December 31, | |||||||||||||
| 2007 | 2006 | ||||||||||||
| Allowance Amount | % of Allowance to Total Amount | % in Loans in Each Category to Total Loans | Allowance Amount | % of Allowance to Total Amount | % in Loans in Each Category to Total Loans | ||||||||
| (dollars in thousands) | |||||||||||||
| Commercial | $ | 719 | 4.5% | 5.6% | $ | 658 | 5.3% | 5.2% | |||||
| Real Estate | 2,458 | 15.3% | 23.6% | 2,159 | 17.2% | 25.7% | |||||||
| Construction/Land Development | 7,727 | 48.2% | 47.5% | 5,658 | 45.2% | 49.8% | |||||||
| SBA | 5,079 | 31.7% | 23.1% | 4,008 | 32.0% | 19.1% | |||||||
| Consumer & Other | 39 | 0.3% | 0.2% | 39 | 0.3% | 0.2% | |||||||
| Total | $ | 16,022 | 100.0% | 100.0% | $ | 12,522 | 100.0% | 100.0% | |||||
| At the Years Ended December 31, | |||||||||||||
| 2005 | 2004 | ||||||||||||
| Allowance Amount | % of Allowance to Total Amount | % in Loans in Each Category to Total Loans | Allowance Amount | % of Allowance to Total Amount | % in Loans in Each Category to Total Loans | ||||||||
| (dollars in thousands) | |||||||||||||
| Commercial | $ | 254 | 2.8% | 3.4% | $ | 178 | 2.8% | 3.1% | |||||
| Real Estate | 2,027 | 22.4% | 32.7% | 1,590 | 25.0% | 36.4% | |||||||
| Construction/Land Development | 4,253 | 47.1% | 50.7% | 1,958 | 30.7% | 38.0% | |||||||
| Mortgage | - | 0.0% | 0.0% | - | 0.0% | 0.4% | |||||||
| SBA | 2,462 | 27.2% | 12.6% | 2,612 | 41.1% | 21.6% | |||||||
| Consumer & Other | 43 | 0.5% | 0.6% | 24 | 0.4% | 0.5% | |||||||
| Total | $ | 9,039 | 100.0% | 100.0% | $ | 6,362 | 100.0% | 100.0% | |||||
| At the Year Ended December 31, | |||||||||||||
| 2003 | |||||||||||||
| Allowance Amount | % of Allowance to Total Amount | % in Loans in Each Category to Total Loans | |||||||||||
| (dollars in thousands) | |||||||||||||
| Commercial | $ | 154 | 4.3% | 6.5% | |||||||||
| Real Estate | 655 | 18.2% | 33.4% | ||||||||||
| Construction/Land Development | 589 | 16.3% | 31.2% | ||||||||||
| Mortgage | - | 0.0% | 0.7% | ||||||||||
| SBA | 2,184 | 60.5% | 27.3% | ||||||||||
| Consumer & Other | 26 | 0.7% | 0.9% | ||||||||||
| Total | $ | 3,608 | 100.0% | 100.0% | |||||||||
The allowance for loan losses as a percentage of net loans outstanding and loans held-for-sale was 1.29% as of December 31, 2007, 1.10% as of December 31, 2006, and 1.20% as of December 31, 2005. The allowance for loan losses as a percentage of net loans outstanding, excluding loans held-for-sale, was 1.56% as of December 31, 2007, 1.29% as of December 31 2006, and 1.35% as of December 31, 2005.
As a result of decreases in local and regional real estate values and the significant losses experienced by many financial institutions, there has been greater regulatory scrutiny of the loan portfolios. While we believe we have established our existing allowance for loan losses in accordance with U.S. generally accepted accounting principles, there can be no assurance that regulators, in reviewing our loan portfolio, will not request that we increase significantly our allowance for loan losses. In addition, because future events affecting borrowers and collateral cannot be predicted with certainty, there can be no assurance that the existing allowance for loan losses is adequate or that substantial increases will not be necessary should the quality of any loans deteriorate as a result of the factors discussed above. Any material increase in the allowance for loan losses may adversely affect our financial condition and results of operations.
15
Deposits
We offer a variety of deposit accounts, having a wide range of interest rates and terms, consisting of demand, savings, money market, and time accounts. We rely primarily on competitive pricing policies, customer service, and referrals to attract and retain these deposits. The daily average balances and weighted average rates paid on deposits and other borrowings for each of the years ended December 31, 2007, 2006, and 2005 are represented below.
| Years Ended December 31, | |||||||||||||
| 2007 | 2006 | ||||||||||||
| Average Balance | % of total Average Deposits / Borrowings | Average Rate % | Average Balance | % of total Average Deposits / Borrowings | Average Rate % | ||||||||
| (Dollars in Thousands) | |||||||||||||
| NOW | $ | 31,543 | 2.7% | 0.15% | $ | 31,161 | 3.3% | 0.15% | |||||
| Money Market | 119,922 | 10.2% | 3.71% | 83,672 | 8.8% | 3.26% | |||||||
| Savings | 29,460 | 2.5% | 0.43% | 31,685 | 3.3% | 0.39% | |||||||
| Time deposits less than $100,000 | 404,244 | 34.3% | 5.09% | 293,909 | 31.0% | 4.72% | |||||||
| Time deposits $100,000 and over | 410,680 | 34.8% | 5.31% | 315,346 | 33.3% | 4.74% | |||||||
| Other Borrowings | 39,560 | 3.4% | 7.56% | 36,906 | 3.9% | 7.41% | |||||||
| Total interest-bearing liabilities | 1,035,409 | 87.9% | 4.83% | 792,679 | 83.6% | 4.35% | |||||||
| Non interest-bearing deposits | 144,317 | 12.1% | 0.00% | 154,473 | 16.4% | 0.00% | |||||||
| Total Deposits & Other Borrowings | $ | 1,179,726 | 100.0% | 3.64% | $ | 947,152 | 100.0% | 3.64% | |||||
| Year Ended December 31, | |||||||||||||
| 2005 | |||||||||||||
| Average Balance | % of total Average Deposits / Borrowings | Average Rate % | |||||||||||
| (Dollars in Thousands) | |||||||||||||
| NOW | $ | 32,791 | 4.9% | 0.15% | |||||||||
| Money Market | 50,239 | 7.5% | 1.81% | ||||||||||
| Savings | 38,010 | 5.7% | 0.37% | ||||||||||
| Time deposits less than $100,000 | 175,124 | 26.1% | 3.17% | ||||||||||
| Time deposits $100,000 and over | 194,496 | 29.0% | 3.24% | ||||||||||
| Other Borrowings | 28,993 | 4.3% | 5.64% | ||||||||||
| Total interest-bearing liabilities | 519,653 | 77.5% | 2.81% | ||||||||||
| Non interest-bearing deposits | 151,447 | 22.5% | 0.00% | ||||||||||
| Total Deposits & Other Borrowings | $ | 671,100 | 100.0% | 2.17% | |||||||||
At December 31, 2007, we had $399.6 million in time deposits in the amounts of $100,000 or more, consisting of 2,346 accounts, maturing as follows:
| Maturity Period | Amount | Weighted Average Rate | |
| (dollars in thousands) | |||
| Three months or less | $ | 187,872 | 5.10% |
| Greater than Three Months to Six Months | 138,301 | 4.96% | |
| Greater than Six Months to Twelve Months | 71,114 | 4.89% | |
| Greater than Twelve Months | �� | 2,316 | 4.74% |
| Total | $ | 399,603 | 5.01% |
16
Short-term Borrowings
The table below is a schedule of outstanding short-term borrowings (less than or equal to 1 year):
| Year Ended December 31, | ||||||||
| 2007 | 2006 | 2005 | ||||||
| (dollars in thousands) | ||||||||
| FHLB advances | $ | - | $ | - | $ | 30,000 | ||
| Total Short-term Borrowings | $ | - | $ | - | $ | 30,000 | ||
Recently Issued Accounting Standards
See “Adoption of New Accounting Standards” and “Effect of Newly Issued but Not Yet Effective Accounting Standards” in Note A of our Consolidated Financial Statements included in this Annual Report.
Competition
We compete with many other entities with respect to originating loans, generating deposits and providing other banking services. Major banks dominate the market with multiple offices and a panoply of products and services, with very few geographic barriers. Major advertising campaigns and the ability to invest in regions of higher yield and demand often provide larger institutions a competitive edge. In addition, they are able to offer certain services which we do not offer directly and, by virtue of their greater total capitalization, have substantially higher lending limits than we offer. Other entities, both public and private, seeking to raise capital through the issuance and sale of debt or equity securities also compete with us for the acquisition of deposits. In recent years, increased competition has also developed from specialized finance and non-finance companies that offer wholesale finance, credit card and other consumer finance services (including online banking services and personal financial software). Competition for deposit and loan products remains strong from both banking and non-banking institutions and this competition directly affects the rates of products and the terms on which products are offered to consumers and businesses.
Technological innovation contributes to greater domestic and international competition by both depository and non-depository institutions. Moreover, mergers place additional pressure on banks within the industry to consolidate their operations, reduce expenses and increase revenues, and federal and state interstate banking laws which allow banks to merge with other banks across state lines enable banks to establish or expand banking operations in our most significant markets. The competitive environmental is also significantly affected by federal and state legislation which often makes it easier for non-bank financial institutions to compete with us.
Economic factors, along with legislative and technological changes, will have an ongoing impact on the competitive environment in which we operate. We attempt to anticipate and adapt to competitive conditions, but we can make no assurance as to the effectiveness of these efforts on our future business or results of operations or as to our continued ability to anticipate and adapt to changing conditions. In order to compete, we emphasize personal banking relationships and place an emphasis on continual expansion of the services and products we offer. We believe that through these efforts, we can be competitive with and distinguish ourselves from other community banks and financial services providers in our marketplace. However, we can provide no assurance that we will be able to sufficiently improve our services and/or banking products or successfully compete in our primary service areas.
Supervision and Regulation
Bank holding companies and banks are extensively regulated under state and federal law. These laws are generally intended to protect depositors and customers, not shareholders. The following is a brief summary of certain statutes and rules that affect or will affect our company and our bank. This summary is qualified in its entirety by reference to the particular statute and regulatory provisions referred to below and is not intended to be an exhaustive description of all applicable statutes and regulations. Any change in applicable laws or regulations may have a material adverse effect in our business and prospects. Our operations may be affected by legislature changes and by the policies of various regulatory authorities. We cannot accurately predict the nature or the extent of the effects on our business and earnings that fiscal or monetary policies, or new federal or state legislation may have in the future. Our company is subject to the disclosure and regulatory requirements of the Securities Act of 1933, as amended, and the Securities Exchange Act of 1934, as amended, both as administered by the Securities and Exchange Commission (“SEC”). As a listed company on NASDAQ, our holding company is subject to NASDAQ rules for listed companies.
17
Holding Company Regulation. As a bank holding company, our company principally is subject to Federal Reserve regulations. We are required to file with the Federal Reserve quarterly and annual reports and such additional information the Federal Reserve may require pursuant to the BHCA. The Federal Reserve may conduct examinations of bank holding companies and their subsidiaries.
Under a policy of the Federal Reserve, with respect to bank holding company operations, a bank holding company is required to serve as a source of financial strength to its subsidiary depository institutions and to commit resources to support such institutions in circumstances where it might not do so absent such a policy. The Federal Reserve, under the BHCA, also has the authority to require a bank holding company to terminate any activity or to relinquish control of a nonbank subsidiary (other than a nonbank subsidiary of a bank) upon the Federal Reserve's determination that such activity or control constitutes a serious risk to the financial soundness and stability of any bank subsidiary of the bank holding company. The Federal Reserve may also prohibit our company, except in certain instances prescribed by statute, from acquiring or engaging in nonbanking activities, other than activities that are deemed by the Federal Reserve to be so closely related to banking or managing or controlling banks as to be a proper incident thereto. See "Recent and Proposed Legislation" in this Section.
Federal and State Bank Regulation. As a California state-chartered bank, our bank is subject to supervision, periodic examination and regulation by the California Department of Financial Institutions (“DFI”) and the FDIC. If the regulators should determine that the financial condition, capital resources, asset quality, earnings prospects, management, liquidity or other aspects of our bank's operations are unsatisfactory or that our bank or our management is violating or has violated any law or regulation, various remedies are available to and are utilized by the regulators. Such remedies include the power to enjoin unsafe or unsound practices, to require affirmative action to correct any conditions resulting from any violation or practice, to issue an administrative order that can be judicially enforced, to direct an increase in capital, to restrict growth, to assess civil monetary penalties, to remove officers and directors and ultimately to request the FDIC to terminate our bank's deposit insurance. Our bank has never been subject to any such enforcement action.
Because California permits commercial banks chartered by the state to engage in any activity permissible for national banks, our bank can form subsidiaries to engage in activates “closely related to banking” or “nonbanking” activities and expanded financial activities. However, to form a financial subsidiary, our bank must be well capitalized and would be subject to the same capital deduction, risk management and affiliate transaction rules as applicable to national banks. Generally, a financial subsidiary is permitted to engage in activities that are “financial in nature” or incidental thereto, even though they are not permissible for the national bank to conduct directly within the bank. The definition of “financial in nature” includes, among other items, underwriting, dealing in or making a market in securities, including, for example, distributing shares of mutual funds. The subsidiary may not, however, engage as principal in underwriting insurance (other than credit life insurance), issue annuities or engage in real estate development or investment or merchant banking. Presently, our bank does not have any subsidiaries.
Statutes and regulations relate to virtually every aspect of our bank's operations, including reserves against deposits, ownership of deposit accounts, interest rates payable on deposits, loans, investments, mergers and acquisitions, borrowings, dividends, locations of branch offices and capital requirements. Further, our bank is required to maintain certain levels of capital. See "Capital Adequacy Requirements" in this Section below. Regulatory compliance requires us to incur ongoing additional expenses. This is particularly the case with respect to the compliance aspects of the Sarbanes-Oxley Act and The USA Patriot Act. At times, the cumulative costs of compliance can be significant.
Sarbanes-Oxley Act of 2002
The Sarbanes-Oxley Act of 2002 (“SOX”), imposed new and revised corporate governance, accounting and reporting requirements on us and all other companies whose securities are registered with the SEC. SOX established the Public Company Accounting Oversight Board (“PCAOB”), an accounting oversight board that enforces auditing standards and restricts the scope of services that accounting firms may provide to their public company audit clients. SOX addresses accounting oversight and corporate governance matters, including:
| · | required executive certification of financial presentations |
| · | increased requirements for board audit committees and their members |
| · | enhanced disclosure of controls and procedures and internal control over financial reporting |
| · | enhanced controls on, and reporting of, insider trading |
| · | increased penalties for financial crimes and forfeiture of executive bonuses in certain circumstances |
| · | the prohibition of accounting firms from providing various types of consulting services to public clients and requiring accounting firms to rotate partners among public client assignments every five years. |
18
USA PATRIOT Act
The USA Patriot Act of 2001 and its related regulations require insured depository institutions, broker-dealers, and certain other financial institutions to have policies, procedures and controls to detect, prevent and report money laundering and terrorist financing. Under the USA PATRIOT Act, financial institutions are subject to prohibitions against specified financial transactions and account relationships as well as enhanced due diligence and "know your customer" standards in their dealings with foreign financial institutions and foreign customers.
This area has been a particular focus for federal regulators and material deficiencies in anti-money laundering compliance can result in public enforcement actions by the banking agencies, including the imposition of civil money penalties and supervisory restrictions on growth and expansion. Such actions could have serious reputation consequence for our company and our bank.
Customer Information Security
The Federal Reserve Bank and other bank regulatory agencies have adopted final guidelines to protect a customer’s confidential and personal information. The guidelines require the creation and implementation of a comprehensive written program to protect: (i) the security and confidentiality of customer information; (ii) against threats or hazards to the security or integrity of such information; and (iii) against unauthorized access to or use of such information. We have adopted and implemented a program to comply with these requirements.
Consumer Protection Laws and Regulations
Our bank is subject to many federal and state consumer protection statutes and regulations, some of which are discussed below. Examination and enforcement by the bank regulatory agencies in these areas in the recent past has intensified.
Privacy policies are required by federal banking regulations which limit the ability of banks and other financial institutions to disclose non-public information about consumers to nonaffiliated third parties. Pursuant to those rules, financial institutions must provide initial notices to customers about their privacy policies, annual notices of their privacy policies to current customers; and a reasonable method for customers to “opt out” of disclosures to nonaffiliated third parties. These privacy protections affect how consumer information is transmitted through diversified financial companies and conveyed to outside vendors. In addition, state laws may impose more restrictive limitations on the ability of financial institution to disclose such information. California has adopted such a privacy law that among other things generally provides that customers have certain options relative to the disclosure of information to third parties.
The Fair Credit Reporting Act, as amended by the Fair and Accurate Credit Transactions Act, or “FACT Act”, requires financial firms to help deter identity theft, including developing appropriate fraud response programs, and gives consumers more control of their credit data. It also reauthorizes a federal ban on state laws that interfere with corporate credit granting and marketing practices and provides consumer’s election to opt out. We are also subject, in connection with our lending activities, to numerous federal and state laws aimed at protecting consumers including the Equal Credit Opportunity Act, the Truth in Lending Act, the Fair Housing Act, the Community Reinvestment Act, the Home Mortgage Disclosure Act, and the Real Estate Settlement Procedures Act.
Safety and Soundness Standards
In addition to measures taken under the prompt corrective action provisions, commercial banking organizations may be subject to potential enforcement actions by the federal and/or state regulators for unsafe or unsound practices in conducting their businesses or for violations of any law, rule, regulation, or any condition imposed in writing by the agency or any written agreement with the agency. The federal banking agencies have adopted guidelines designed to assist the federal banking agencies in identifying and addressing potential safety and soundness concerns before capital becomes impaired. In addition, the federal banking agencies have also adopted safety and soundness guidelines with respect to asset quality and earnings standards. These guidelines provide standards for establishing and maintaining a system to identify problem assets and prevent those assets from deteriorating.
19
Recent Regulatory Developments
From time to time, legislation is enacted which has the effect of increasing the cost of doing business, limiting or expanding permissible activities or affecting the competitive balance between banks and other financial institutions. Proposals to change the laws and regulations governing the operations and taxation of banks and other financial institutions are frequently made in Congress, in the California legislature and by various bank regulatory agencies.
Changes to federal and state laws and regulations (including changes in interpretation or enforcement) can affect the operating environment of bank holding companies and their subsidiaries in substantial and unpredictable ways. From time to time, various legislative and regulatory proposals are introduced. These proposals, if codified, may change banking statutes and regulations and our company’s operating environment in substantial and unpredictable ways. If codified, these proposals could increase or decrease the cost of doing business, limit or expand permissible activities or affect the competitive balance among banks, savings associations, credit unions and other financial institutions. We cannot accurately predict whether those changes in laws and regulations will occur, and, if those changes occur, the ultimate effect they would have upon our financial condition or results of operations. It is likely, however, that the current high level of enforcement and compliance-related activities of federal and state authorities will continue and potentially increase.
The Basel Committee on Banking Supervisions-“BASEL II”. Regulatory capital guidelines, originally published in June 2005 and adopted in final form by U.S. regulatory agencies in November 2007, are designed to promote improved risk measurement and management processes and better align minimum capital requirements with risk. The Basel II guidelines are to become operational in April 2008, but are mandatory only for banks with consolidated total assets of $250 billion or more or consolidated on-balance sheet foreign exposures of $10 billion or more. They are thus not applicable to our bank, which continues to operate under U.S. risk-based capital guidelines consistent with “Basel I” guidelines published in 1988.
Federal regulators issued for public comment in December 2006 proposed rules (designated as “Basel IA” rules) applicable to non-core banks that would have modified the existing U.S. Basel I based capital framework. The regulators announced in November 2007, however, that instead of the Basel IA proposals, a new rule making was being prepared involving a “standardized approach” that would implement some of the simpler approaches for both credit risk and operational risk from the more advanced Basel II framework. Smaller U.S. depository institutions would be allowed to elect to remain under the existing Basel-I based regulatory capital framework. The new rule making is expected to be published in the first half of 2008.
Capital Adequacy Requirements
The federal banking agencies have adopted regulations establishing minimum requirements for capital adequacy. These agencies may establish higher minimum requirements if, for example, a bank or company previously has received special attention or has a high susceptibility to interest rate risk. Under Federal Reserve regulations, the minimum ratio of total capital to risk-adjusted assets is 8%. At least half of the total capital is required to be "Tier I capital," principally consisting of qualifying capital securities and minority interests, less certain goodwill items. The remainder ("Tier II capital") may consist of a limited amount of subordinated debt, certain hybrid capital instruments and other debt securities, perpetual preferred stock, and a limited amount of the allowance for loan loss. In addition to the risk-based capital guidelines, the Federal Reserve has adopted a minimum Tier I capital (leverage) ratio, under which a bank holding company must maintain a minimum level of Tier I capital to average total consolidated assets of at least 3% in the case of a bank holding company which has the highest regulatory examination rating and is not contemplating significant growth or expansion. All other bank holding companies are expected to maintain a Tier I capital (leverage) ratio of at least 1% to 2% above the stated minimum.
As of December 31, 2007, our company's capital ratios were as follows:
| · | Tier I leverage ratio was 10.63% |
| · | Tier I risk-based ratio was 9.65% |
| · | Total risk-based ratio was 10.80% |
As of December 31, 2007, our bank’s capital ratios were as follows:
| · | Tier I leverage ratio was 10.48% |
| · | Tier I risk-based ratio was 9.51% |
| · | Total risk-based ratio was 10.66% |
20
The current risk-based capital guidelines are based upon the 1988 capital accord of the International Basel Committee on Banking Supervision. A new international accord, referred to as Basel II, which emphasizes internal assessment of credit, market and operational risk, supervisory assessment and market discipline in determining minimum capital requirements, currently becomes mandatory for large international banks outside the U.S. in 2008. New rule making is expected in 2008 that would be applicable to us and involve a standardized approach.
The federal banking regulators are required to take "prompt corrective action" with respect to capital-deficient institutions. Agency regulations define, for each capital category, the levels at which institutions are "well capitalized," "adequately capitalized," "under capitalized," "significantly under capitalized" and "critically under capitalized." A "well capitalized" bank has a total risk-based capital ratio of 10.0% or higher; a Tier I risk-based capital ratio of 6.0% or higher; a leverage ratio of 5.0% or higher; and is not subject to any written agreement, order or directive requiring it to maintain a specific capital level for any capital measure. An "adequately capitalized" bank has a total risk-based capital ratio of 8.0% or higher; a Tier I risk-based capital ratio of 4.0% or higher; a leverage ratio of 4.0% or higher (3.0% or higher if the bank was rated a composite 1 in its most recent examination report and is not experiencing significant growth); and does not meet the criteria for a well capitalized bank. A bank is "under capitalized" if it fails to meet any one of the ratios required to be adequately capitalized.
In addition to requiring undercapitalized institutions to submit a capital restoration plan, agency regulations contain broad restrictions on certain activities of undercapitalized institutions including asset growth, acquisitions, branch establishment and expansion into new lines of business. With certain exceptions, an insured depository institution is prohibited from making capital distributions, including dividends, and is prohibited from paying management fees to control persons if the institution would be undercapitalized after any such distribution or payment.
As an institution's capital decreases, the federal agency's enforcement powers become more severe. A significantly undercapitalized institution is subject to mandated capital raising activities, restrictions on interest rates paid and transactions with affiliates, removal of management, and other restrictions. A federal agency has only very limited discretion in dealing with a critically undercapitalized institution and is virtually required to appoint a receiver or conservator.
Banks with risk-based capital and leverage ratios below the required minimums may also be subject to certain administrative actions, including the termination of deposit insurance upon notice and hearing, or a temporary suspension of insurance without a hearing in the event the institution has no tangible capital.
Our bank was “well capitalized” according to the guidelines discussed above, as of December 31, 2007.
Deposit Insurance Assessments
Our bank's deposits are insured (presently $100,000 per depositor; $250,000 in the case of certain retirement accounts) by the Deposit Insurance Fund ("DIF") which is operated by the FDIC. FDIC insured depository institutions pay insurance premiums at rates based on their risk classification. On November 2, 2006, the FDIC finalized a rule intended to match an institution's deposit insurance premium to the risk an institution poses to the deposit insurance fund. Under the requirements, the FDIC designates annually a target reserve ratio for the DIF within the range of 1.15 percent and 1.5 percent. The FDIC adopted 1.25 percent as the designated reserve for 2007. Under the system, each depository institution falls within one of four risk categories depending on supervisory ratings and financial ratios. Our bank’s rate fell within the lowest risk category for 2007 and is expected to fall within this category for 2008. In 2007, the FDIC issued one-time assessment credits that can be used to offset this expense.
Our bank continues to be required to pay an assessment fee for the payment of interest on bonds that were issued by the Financing Corporation (“FICO”) as a means of capitalizing the Federal Savings and Loan Insurance Corporation. These bonds are commonly known as FICO bonds. The average rate for 2007 was 1.17 basis points per $100 of deposits. The current range of DIF assessments is between 15 and 43 basis points per $100 of domestic deposits. The average rate for our bank was 0.09% for the first quarter of 2007 and 5.67 basis points per $100 of deposits for the remainder of 2007, 0.0% for 2006 and 2005. We paid $656 thousand of FDIC assessments in 2007, $98 thousand in 2006, and $75 thousand in 2005.
The FDIC is authorized to terminate a depository institution's deposit insurance upon a finding by the FDIC that the institution's financial condition is unsafe or unsound or that the institution has engaged in unsafe or unsound practices or has violated any applicable rule, regulation, order or condition enacted or imposed by the institution's regulatory agency.
21
Change in Control
The BHCA prohibits our company from acquiring direct or indirect control of more than 5% of the outstanding voting securities or substantially all the assets of any bank or savings bank, or merging or consolidations with another bank holding company or savings bank holding company, without prior approval of the Federal Reserve. Similarly, Federal Reserve approval (or in certain cases, nondisapproval) must be obtained before any person acquiring control of a bank holding company. Control is conclusively presumed to exist if, among other things, a person acquires more that 25% of any class of voting stock of our company or controls in any manner the election of a majority of the directors of our company. Control is presumed to exist if a person acquires more that 10% of any class of voting stock and the stock is registered under Section 12 of the Exchange Act or the acquirer will be the largest stockholder after the acquisition.
Examinations
The FRB, through the BHCA, has the authority to examine and evaluate our company and its subsidiaries. The DFI and the FDIC periodically examine and evaluate non-member state-chartered banks, including our bank. These examinations review areas such as capital adequacy, allowance for loan losses, loan portfolio quality and management, consumer and other compliance issues, investments and management practices. In addition to these regular examinations, we are required to furnish quarterly and annual reports to the FDIC and Federal Reserve. The FDIC and the DFI may exercise cease and desist or other supervisory powers if actions represent unsafe or unsound practices or violations of law. Further, any proposed addition of any individual to the board of directors of a bank or the employment of any individual as a senior executive officer of a bank, or the change in responsibility of such an officer, will be subject to prior written notice to the FDIC if a bank is not in compliance with the applicable minimum capital requirements, is otherwise a troubled institution or the FDIC determines that such prior notice is appropriate for a bank. The FDIC then has the opportunity to disapprove any such appointment.
Federal Securities Law
Our company has registered its common stock with the SEC under the Exchange Act. As a result, the proxy and tender offer rules, insider trading reporting requirements, corporate governance, annual and periodic reporting and other requirements of the Exchange Act are applicable to our company.
Transactions with Insiders and Affiliates
Depository institutions are subject to the restrictions contained in Section 22(h) of the Federal Reserve Act with respect to loans to directors, executive officers and principal stockholders. Under Section 22(h), loans to directors, executive officers and stockholders who own more than 10% of a depository institution and certain affiliated entities of any of the foregoing, may not exceed, together with all other outstanding loans to such person and affiliated entities, the institution's loans-to-one-borrower limit (as discussed below). Section 22(h) also prohibits loans above amounts prescribed by the appropriate federal banking agency to directors, executive officers, and stockholders who own more than 10% of an institution, and their respective affiliates, unless such loans are approved in advance by a majority of the board of directors of the institution. Any "interested" director may not participate in the voting. The prescribed loan amount (which includes all other outstanding loans to such person), as to which such prior board of director approval is required, is the greater of $25,000 or 5% of capital and surplus (up to $500,000). Further, pursuant to Section 22(h), the Federal Reserve requires that loans to directors, executive officers, and principal stockholders be made on terms substantially the same as offered in comparable transactions with non-executive employees of the bank. There are additional limits on the amount a bank can loan to an executive officer.
Transactions between a bank and its "affiliates" are quantitatively and qualitatively restricted under the Federal Reserve Act. The Federal Deposit Insurance Act applies Sections 23A and 23B to insured nonmember banks, including our bank, in the same manner and to the same extent as if they were members of the Federal Reserve System. Regulation W incorporates the exemption from the affiliate transaction rules but expands the exemption to cover the purchase of any type of loan or extension of credit from an affiliate. Affiliates of a bank include, among other entities, the bank’s holding company and companies that are under common control with the bank. Our company is considered to be an affiliate of our bank.
Regulation W incorporates the exemption from the affiliate transaction rules but expands the exemption to cover the purchase of any type of loan or extension of credit from an affiliate. Affiliates of a bank include, among other entities, the bank's holding company and companies that are under common control with the bank. Our company is considered to be an affiliate of our bank.
22
Monetary Policy
The monetary policies of regulatory authorities, including the Federal Reserve, have a significant effect on the operating results of banks. The Federal Reserve supervises and regulates the national supply of bank credit. Among the means available to the Federal Reserve to regulate the supply of bank credit are open market purchases and sales of U.S. government securities, changes in the discount rate on borrowings from the Federal Reserve, and changes in reserve requirements with respect to deposits. These activities are used in varying combinations to influence overall growth and distribution of bank loans, investments, and deposits on a national basis and their use may affect interest rates charged on loans or paid for deposits.
Federal Reserve monetary policies and the fiscal policies of the federal government have materially affected the operating results of commercial banks in the past and are expected to continue to do so in the future. We cannot predict the nature of future monetary and fiscal policies and the effect of such policies on our future business and earnings.
Subsidiaries
Our bank is a subsidiary of our company. In September 2003, our company formed Temecula Valley Statutory Trust II, a Connecticut statutory trust, for the purpose of issuing trust preferred securities. In September 2004, our company formed Temecula Valley Statutory Trust III, a Delaware statutory trust, for the purpose of issuing trust preferred securities. In September 2005, our company formed Temecula Valley Statutory Trust IV, a Delaware statutory trust, for the purpose of issuing trust preferred securities. In September 2006, our company formed Temecula Valley Statutory Trust V, a Delaware statutory trust, for the purpose of issuing trust preferred securities. In December 2007, our company formed Temecula Valley Statutory Trust VI, a Delaware statutory trust, for the purpose of issuing trust preferred securities in 2008.
Environmental Concerns
We are not involved in manufacturing or the use or transportation of hazardous materials that might have a material adverse effect on the environment. Our principal exposure to any hazardous material risk is through our lending activities and through properties or businesses we may own, lease or acquire. Based on a general survey of our bank’s loan portfolio and the real property we lease and own in the operation of our business, we are not aware of any potential liability for hazardous waste contamination that would be reasonably likely to have a material adverse effect on our company as of the date of this report.
Employees
As of December 31, 2007, we had 325 employees (316 full time equivalent), of which 296 are full time. Approximately one third of our employees are directly involved in the origination, underwriting, and processing of SBA loans. Additional support staff is required to service the SBA loans after they are funded. There are no employees at our company. Our employees are not represented by any collective bargaining group. We consider our relations with our employees to be satisfactory.
Available Information
We do not make available on our website our annual reports on Form 10-K, quarterly reports on Form 10-Q, current reports on Form 8-K, or proxy statements for our annual shareholders meetings, or the amendments to those reports although there is a hyper-link at our website at www.temvalbank.com through the “Investor Relations-SEC Filings” page to the SEC website at www.sec.gov that contains reports, proxy statements, and other information regarding SEC registrants including our company. None of the information contained in our website or hyper-linked from our website is incorporated into this Form 10-K. We have not provided this information directly on our website because of the ease of accessing the information through our website to the SEC website. All of our annual reports on Form 10-K, quarterly reports on Form 10-Q, current reports on Form 8-K, and proxy statements for our annual shareholders meeting as well as the amendments to those reports may be obtained free of charge by contacting Donald Pitcher at (951)939-3736 as soon as possible after we have filed electronically with the SEC. You may read and copy any materials filed with the SEC at the SEC’s Public Reference Room at 100 F. Street NE., Washington DC 20549. You may obtain information on the operation of the Public Reference Room by calling the SEC at 1-800-SEC-0330.
23
ITEM 1A: RISK FACTORS
Our dependence on loans secured by real estate subjects us to risks relating to fluctuations in the real estate market and related interest rates, environmental risks, and legislation that could result in significant additional costs and capital requirements that could adversely affect our assets and results of operations.
There has been a slowdown in the real estate market due to credit market turmoil, the depth or complete effect of which is unknown. A significant portion of our loan portfolio is secured by real estate. Real estate served as the principal source of collateral with respect to approximately 92% and 94% of our loan portfolio at December 31, 2007 and December 31, 2006, respectively. During 2007, real estate markets in California and elsewhere experienced, in most cases, a modest to significant depreciation. A sustained or sudden significant decline in economic conditions or rising interest rates could have an adverse effect on the demand for new loans, the ability of borrowers to repay outstanding loans, the value of real estate and other collateral securing loans, and the value of real estate owned by us, as well as our financial condition and results of operations in general and the market value of our common stock. We have instituted stricter underwriting criteria which may further impact downward values.
In the course of business, we may acquire, through foreclosure, properties securing loans that are in default. In commercial real estate lending, there is a risk that hazardous substances could be discovered on these properties. In this event, we might be required to remove these substances from the affected properties at our sole cost and expense. The cost of this removal could substantially exceed the value of affected properties. We may not have adequate remedies against the prior owner or other responsible parties or could find it difficult or impossible to sell the affected properties, which could adversely affect our business, financial condition and operating results.
Our bank's concentration in real estate construction loans subjects it to risks such as inadequate security for repayment of those loans and fluctuations in the demand for those loans based on changes in the housing market.
We have a high concentration in real estate construction loans. Approximately 47% and 50% of our lending portfolio was classified as real estate construction loans as of December 31, 2007 and December 31, 2006, respectively. Our real estate construction loans are based upon estimates of costs and value associated with the completed project. These estimates may be inaccurate. Construction lending involves additional risks when compared to permanent residential lending because funds are advanced upon the security of the project, which is of uncertain value prior to its completion. Because of the uncertainties inherent in estimating construction costs, the market value of the completed project and the effects of governmental regulation of real property, it is relatively difficult to accurately determine the total funds required to complete a project and the related loan-to-value ratio.
Construction lending also typically involves higher loan principal amounts and is often concentrated with a small number of builders. In addition, generally during the term of a construction loan, no payment from the borrower is required since the accumulated interest is added to the principal of the loan through an interest reserve. Construction loans often involve the disbursement of substantial funds, with repayment substantially dependent on the success of the ultimate project and the ability of the borrower to sell or lease the property or obtain permanent take-out financing, rather than the ability of the borrower or guarantor to repay principal and interest. If our appraisal of the value of the completed project proves to be overstated, we may have inadequate security for the repayment of the loan upon completion of construction and may incur a loss.
Our ability to continue to originate a significant amount of construction loans is dependent on the housing market in the Riverside, San Bernardino, and San Diego County regions of Southern California and in the San Francisco Bay area. To the extent there is a continued decline in the demand for new housing in these communities, we expect that the demand for construction loans will continue to decline, our liquidity will substantially increase and our net income will be adversely affected.
Our earnings are highly dependent on our continued ability to originate, sell and service SBA loans.
Our earnings are highly dependent on our ability to generate new SBA loans, as our net income generated from our SBA activities is significant. Increases in interest rates and other economic conditions could result in decreased SBA loan demand as well as lower gains on sale.
SBA lending is a federal government created and administered program. As such, legislative and regulatory developments can affect the availability and funding of the program. This dependence on legislative funding and regulatory restrictions from time to time causes limitations and uncertainties with regard to the continued funding of such loans, with a resulting potential adverse financial impact on our business. Currently, the maximum limit on individual 7(a) loans which the SBA will permit is $2 million. Any reduction in this level
24
could adversely affect the volume of our business. Since our SBA business constitutes a significant portion of our lending program, our dependence on this government program and its periodic uncertainty relative to availability and amounts of funding creates greater risk for our business than do more stable aspects of our business.
We may incur additional costs and experience impaired operating results if we are unable to retain our key management or we are unable to attract and retain additional successful bankers in order to grow our business.
Stephen H. Wacknitz has been the president and chief executive officer of our holding company and our bank since the inception of both entities. Mr. Wacknitz and our executive management team developed numerous aspects of our current business strategy, and the implementation of that strategy depends heavily upon the active involvement of Mr. Wacknitz and our executive management team. The loss of the services of Mr. Wacknitz or other senior officers who are part of our succession planning could adversely affect our business strategy and could cause us to incur additional costs and experience impaired operating results while we seek suitable replacements. Additionally, because our business model depends on hiring successful bankers that generally bring to us additional customers, if we are unsuccessful in continuing to attract and retain producers, our growth may be impaired and the results of our operations adversely affected.
If our bank is unable to pay our holding company cash dividends to meet its cash obligations, our business, financial condition, results of operations and prospects will be adversely affected.
Dividends paid by our bank to our holding company provide cash flow used to service the interest payments on our trust preferred securities. Various statutory provisions restrict the amount of dividends our bank can pay to our holding company without regulatory approval. It is possible, depending upon the financial condition of our bank and other factors, that the applicable regulatory authorities could assert that payment of dividends or other payments, including payments to our holding company, is an unsafe or unsound practice. If our bank is unable to pay dividends to our holding company, our holding company may not be able to service its debt or pay its obligations. Our holding company's inability to receive dividends from our bank would adversely affect our business, financial condition, results of operations and prospects.
Our ability to pay cash dividends is restricted by law and contractual arrangements.
Dividends we pay to our shareholders are restricted by California law and under indentures governing trust preferred securities we have issued. We cannot assure you that we will meet the criteria specified under California law or under these indentures in the future which could result in a decrease in the amount of or complete elimination of dividends we pay to our shareholders.
Our allowance for loan losses may prove to be insufficient to absorb losses inherent in our loan portfolio.
Like all financial institutions, we maintain an allowance for loan losses to provide for loan defaults and non-performance and a reserve liability for unfunded loan commitments. The amount of future losses is susceptible to changes in economic, operating and other conditions, including changes in interest rates that may be beyond our control and losses may exceed current estimates. Although management believes the level of our loan loss allowance is adequate to absorb probable losses in our loan portfolio, management cannot predict losses or whether the allowance will be adequate or whether regulators will require us to increase this allowance. Any of these occurrences could adversely affect our business, financial condition, prospects and profitability.
Our bank’s loan losses as a percentage of net loans outstanding and loans held-for-sale was 1.29% as of December 31, 2007, 1.10% as of December 31, 2006 and 1.20% as of December 31, 2005. The allowance for loan losses as a percentage of net loans outstanding, excluding loans held-for-sale, was 1.56% as of December 31, 2007, 1.29% as of December 31, 2006 and 1.35% as of December 31, 2005.
Our bank's business, financial condition and results of operations are sensitive to and may be adversely affected by interest rate and prepayment changes.
Our earnings are substantially affected by changes in prevailing interest rates. Changes in interest rates affect the demand for new loans, the credit profile of existing loans, the rates received on loans and securities and the rates we must pay on deposits and borrowings. The difference between the rates we receive on loans and short-term investments and the rates we must pay on deposits and borrowings is known as the interest rate spread. Given our current volume and mix of interest-bearing assets and liabilities, our interest rate spread can be expected to increase when market interest rates are rising, and to decline when market interest rates are declining. Although we believe our current level of interest rate sensitivity
25
is reasonable, significant fluctuations in interest rates may adversely affect our business, financial condition and results of operations. While an increase in interest rates generally should positively affect our net interest margin, it may also cause borrowers with variable loan rates to have difficulty paying their loans and this may have the affect of lowering our loan volume and profits.
In addition, the value of our SBA servicing asset and SBA I/O strip receivable, which totaled $5.4 million and $6.6 million, respectively, at December 31, 2007, and $8.3 million and $13.2 million, respectively, at December 31, 2006, are subject to fluctuations based on changes in interest rates and prepayment speeds. Generally, we would expect the value of our SBA servicing asset to decrease in a rising interest rate environment, as well as if prepayment speeds increase. Similarly, the value of our SBA interest-only strip receivable asset is subject to fluctuations in prepayment speeds and would be expected to decrease if prepayment speeds increase.
Increasing levels of competition in banking and financial services businesses may reduce our market share or cause the prices we charge for services to fall, which may decrease our profits.
Competition may adversely affect our results of operations. The financial services business in our market area is highly competitive and becoming more so due to changes in regulation, technological advances, and the accelerating pace of consolidation among financial service providers and out-of-state financial institutions and intermediaries. We face competition both in attracting deposits and making loans. We compete for loans principally through competitive interest rates and the efficiency and quality of the services we provide. Increased competition in the banking and financial services businesses may reduce loans and deposits or cause the prices we charge for services to fall. Many of the financial intermediaries operating in our market area offer certain services, such as trust, investment, and international banking services, that we do not offer directly, and may have larger lending limits than ours, which may prompt existing or potential customers to do business with our competitors instead of us.
The recent credit market disruption has decreased market liquidity and increased competition. This has caused rates on certain deposit accounts to trend upward while market interest rates have declined. To maintain adequate liquidity levels, we will likely incur additional deposit costs.
Our success depends, in part, upon our ability to effectively use rapid-changing technology in providing and marketing products and services to our customers.
The financial services industry is undergoing rapid technological changes, with frequent introductions of new technology-driven products and services. The effective use of technology increases efficiency and enables financial institutions to better serve customers and to reduce costs. Our future success will depend, in part, upon our ability to use technology to provide products and services that will satisfy customer demands for convenience, as well as to create additional efficiencies in our operations and compliance with regulatory expectations. Many of our competitors have substantially greater resources to invest in technological improvements. We may not be able to effectively implement new technology-driven products and services or be successful in marketing those products and services to our customers.
We have not been through a variety of business cycles since we began operations and, as a result, we may not effectively evaluate our future prospects and this lack of operating history may increase the risk that we will not continue to be successful.
We began operations in 1996 and since that time the markets in which we conduct business have, until recently, experienced substantial economic growth. As a result, we do not have an operating history during a serious downturn in the real estate market for you to evaluate our performance relative to future prospects. You must consider our business and prospects in light of the risks and difficulties we will encounter if the economies of San Diego, Riverside or the San Francisco Bay area experience a severe downturn, greater than what is currently taking place. We may not be able to address these risks and difficulties successfully, which could have material adverse consequences on our business and operating results.
We may be required to raise additional capital in the future, but that capital may not be available or may not be on terms acceptable to us when it is needed.
We are required by federal regulatory authorities to maintain adequate levels of capital to support our operations. We may decide to raise additional capital to support growth, either internally or through acquisitions. In addition, the use of brokered deposits without regulatory approval is limited to banks that are “well capitalized” according to regulation. If we are unable to maintain our capital levels at “well capitalized” minimums, we could lose a significant source of funding, which would force us to utilize additional wholesale funding or
26
potentially sell loans at a time when loan sales pricing is unfavorable. Our ability to raise additional capital, if needed, will depend on conditions in the capital markets at that time, which are outside our control, and on our financial performance. Accordingly, we cannot be certain of our ability to raise additional capital in the future if needed or on terms acceptable to us. If we cannot raise additional capital when needed, our ability to further expand our operations through internal growth, deposit gathering and acquisitions could be materially impaired.
Both our holding company and our bank are subject to government regulation that limits and restricts their activities and operations.
The financial services industry is heavily regulated, and the regulatory burden on banks is increasing. Federal and state regulation is designed to protect the deposits of consumers, not to benefit shareholders. Applicable laws and regulations impose significant limitations on operations, and may change at any time, possibly causing results to vary significantly from past results including: (i) compliance expense increases or compliance difficulties; or (ii) adverse affects on loan or deposit pricing. Government policy and regulation, particularly as implemented through the Federal Reserve System, significantly affect our credit conditions.
Our business, financial condition and results of operations may be adversely affected if we are unable to insure against or control our operations risks.
We are subject to various operations risks, including, but not limited to, data processing system failures and errors, communications and information systems failures, errors and breaches, customer or employee fraud, and catastrophic failures resulting from terrorist acts or natural disasters. Should an event occur that is not prevented or detected by our internal controls, or is uninsured or in excess of applicable insurance limits, it could damage our reputation, result in a loss of customer business, cause additional regulatory scrutiny, and expose us to litigation risks and possible financial liability, any of which could adversely affect our business, financial condition and results of operations.
Our business is subject to liquidity risk, and changes in our source of funds may adversely affect our performance and financial condition by increasing our cost of funds.
Our ability to make loans is directly related to our ability to secure funding. Core deposits are our primary source of liquidity. Also, we use the national certificate of deposit (“CD”) markets, which are generally CDs purchased by other financial institutions and brokered CDs. Both the national CD market and brokered CDs are rate sensitive and generally have a higher rate than deposits generated in our local markets. We use advances from the Federal Home Loan Bank of San Francisco and Federal Fund lines of credit to satisfy temporary borrowing needs. Payments of principal and interest on loans and sales and participations of eligible loans are also a primary source for our liquidity needs. Primary uses of funds include withdrawal of and interest payments on deposits, originations and purchases of loans, and payment of operating expenses. Core deposits represent significant sources of low-cost funds. Alternative funding sources, such as large balance time deposits or borrowings, are a comparatively higher-costing source of funds. Liquidity risk arises from the inability to meet obligations when they come due or to manage the unplanned decreases or changes in funding sources. Although we believe we can continue to successfully pursue our core deposit funding strategy, significant fluctuations in core deposit balances may adversely affect our financial condition and results of operations.
Future sales of our stock by our shareholders or the perception that those sales could occur may cause our stock price to decline.
Although our common stock is listed for trading on The NASDAQ Global Select Market, the trading volume in our common stock is lower than that of other larger financial services companies. A public trading market having the desired characteristics of depth, liquidity and orderliness depends on the presence in the marketplace of willing buyers and sellers of our common stock at any given time. This presence depends on the individual decisions of investors and general economic and market conditions over which we have no control. Given the relatively low trading volume of our common stock, significant sales of our common stock in the public market, or the perception that those sales may occur, could cause the trading price of our common stock to decrease or to be lower than it otherwise might be in the absence of those sales or perceptions.
27
The existence of outstanding stock options issued to our directors, executive officers and employees may result in dilution of your ownership and adversely affect the terms on which we can obtain additional capital.
As of December 31, 2007, we had outstanding options to purchase 1,177,413 shares of our common stock at a weighted average exercise price of $10.49 per share. All of these options are held by our directors, executive officers and employees. The issuance of shares subject to options under the plans may result in dilution of your ownership of our common stock.
The exercise of stock options could also adversely affect the terms on which we can obtain additional capital. Option holders are most likely to exercise their options when the exercise price is less than the market price for our common stock. They profit from any increase in the stock price without assuming the risks of ownership of the underlying shares of common stock by exercising their options and selling the stock immediately.
A natural disaster could harm our business.
Historically, California, in which a substantial portion of our business is located, has been susceptible to natural disasters, such as earthquakes, floods and wildfires. These natural disasters could harm our operations through interference with communications, including the interruption or loss of our computer systems, which could prevent or impede us from gathering deposits, originating loans and processing and controlling the flow of business, as well as through the destruction of facilities and our operational, financial and management information systems. Additionally, natural disasters could negatively impact the values of collateral securing our loans and interrupt our borrowers’ abilities to conduct their businesses in a manner to support their debt obligations, either of which could result in losses and increased provisions for credit losses.
The risks described in this report are not the only risks we face. Additional risks and uncertainties not currently known to us or that we currently deem to be immaterial also may materially adversely affect our business, financial condition and/or operating results.
ITEM 1B: UNRESOLVED STAFF COMMENTS
None
ITEM 2: PROPERTIES
We conduct business at eleven full-service banking offices in Southern California and multiple loan production offices in twelve states, including California. The main office facilities are located at 27710 Jefferson Avenue, Suite A100, Temecula, California. As of December 31, 2007, we owned the property at one of our branch locations. The remaining banking offices and other offices are leased. Most of the leases contain multiple renewal options and provisions for rental increases, principally for changes in the cost of living index, property taxes and maintenance. Total future annual rental payments (exclusive of operating charges and real property taxes) are approximately $5.0 million, with lease expiration dates ranging from 2008 to 2014, exclusive of renewal options.
At December 31, 2007, our consolidated investment in premises and equipment, net of accumulated depreciation and amortization, totaled $5.3 million. Total occupancy expense was $3.2 million.
We believe that our existing facilities are adequate for our present purposes and that the properties are adequately covered by insurance.
ITEM 3: LEGAL PROCEEDINGS
From time to time, we are involved in legal proceedings arising in the normal course of business. After taking into consideration information furnished by counsel to our company and bank, we do not believe that there is any pending or threatened proceeding against our company or our bank which, if determined adversely, would have a material effect on our business, financial condition or results of operation.
We are not aware of any material proceedings to which any director, officer or affiliate of our company, any owner of record or beneficially of more than 5% of the voting securities of our company as of December 31, 2007, or any associate of any such director, officer, affiliate of our company, or security holder is a party adverse to our company or any of its subsidiaries or has a material interest adverse to our company or any of its subsidiaries.
28
ITEM 4: SUBMISSION OF MATTERS TO A VOTE OF SECURITY HOLDERS
No matters were submitted to a vote of security holders during the fourth quarter of the year ended December 31, 2007.
ITEM 5. MARKET FOR REGISTRANT’S COMMON EQUITY, RELATED SHAREHOLDER MATTERS AND ISSUER PURCHASES OF EQUITY SECURITIES
Trading Information
Our company’s common stock is listed on The NASDAQ Stock Market LLC under the symbol TMCV. The following table summarizes the high and low sales prices for each quarterly period ended since January 1, 2006 for our common stock, as quoted and reported by The NASDAQ Stock Market.
| Two Year Summary of Common Stock Prices | ||||||
| Quarter Ended | High | Low | Dividends | |||
| 03/31/2006 | $23.92 | $19.16 | N/A | |||
| 06/30/2006 | $24.00 | $19.85 | N/A | |||
| 09/30/2006 | $25.00 | $19.85 | N/A | |||
| 12/31/2006 | $23.86 | $20.15 | N/A | |||
| 03/31/2007 | $23.73 | $21.26 | N/A | |||
| 06/30/2007 | $21.60 | $17.69 | $0.04 cash dividend | |||
| 09/30/2007 | $18.35 | $15.76 | $0.04 cash dividend | |||
| 12/31/2007 | $17.51 | $10.03 | $0.04 cash dividend | |||
As of March 7, 2008, the closing sale price of our company’s stock, as reported by The NASDAQ Stock Market was $9.71. As of March 31, 2008, there were approximately 408 record holders of our company’s common stock. Directors and executive officers owned approximately 15.3% of our outstanding shares.
Dividends
Our company is a legal entity separate and distinct from our bank. Our company’s shareholders are entitled to receive dividends when and as declared by our Board of Directors, out of funds legally available therefore, subject to the restrictions set forth in the California General Corporation Law as well as other restrictions discussed below.
The availability of operating funds for our company and the ability of our company to pay a cash dividend depends largely on our bank’s ability to pay a cash dividend to our company. The payment of cash dividends by our bank is subject to restrictions set forth in various federal and state laws and regulations. In addition, our ability to pay dividends to our shareholders is limited by certain covenants contained in the indentures governing trust preferred securities issued by us and the debentures underlying the trust preferred securities. The indentures provide that if an Event of Default (as defined in the indentures) has occurred and is continuing, or if we are in default with respect to any obligations under our guarantee agreement which covers payments of the obligations on the trust preferred securities, or if we give notice of any intention to defer payments of interest on the debentures underlying the trust preferred securities, then we may not, among other restrictions, declare or pay any dividends (other than a dividend payable by the bank to our company) with respect to our common stock. See “Item 7. MANAGEMENT DISCUSSION AND ANALYSIS OF FINANCIAL CONDITION AND RESULTS OF OPERATIONS – Financial Condition – Capital.”
Our primary source of income is the receipt of dividends from our bank. The availability of dividends from our bank is limited by various statutes and regulations. It is possible, depending upon the financial condition of our bank, and other factors, that the Federal Reserve, the FDIC or the DFI could assert that payment of dividends or other payments is an unsafe or unsound practice. Our bank is subject to restrictions under certain federal and state laws and regulations governing banks which limit its ability to transfer funds to the holding company through intercompany loans, advances or cash dividends. Dividends paid by state banks such as our bank are regulated by the DFI under its general supervisory authority as it relates to a bank's capital requirements. A state bank may declare a dividend without the approval of the DFI as long as the total dividends declared in a calendar year do not exceed either the retained earnings or the total of net earnings for three previous fiscal years less any dividend paid during such period. During 2007, we received dividends of $13.0 million from
29
our bank. At December 31, 2007, our bank's retained earnings totaled $64.7 million Of this amount, $37.5 million may be dividended to the holding company without regulatory approval. In January 2008, the bank paid a dividend to the holding company of $13.0 million. See "Item 7. MANAGEMENT DISCUSSION AND ANALYSIS OF FINANCIAL CONDITION AND RESULTS OF OPERATIONS – Financial Condition – Liquidity Management" and Note O of the Notes to Consolidated Financial Statements contained in "Item 8. Financial Statements and Supplementary Data."
Holders of our common stock are entitled to receive dividends declared by our board of directors out of funds legally available under state law governing us and certain federal laws and regulations governing the banking and financial services business. During 2007 we paid $807 thousand in cash dividends on common stock. There were no cash dividends paid for the years 2006 and 2005. Since January 2007, we have declared the following quarterly dividends:
| Record Date | Pay Date | Amount per Share |
| July 2, 2007 | July 16, 2007 | $0.04 |
| October 1, 2007 | October 15, 2007 | $0.04 |
We can provide no assurance that we will continue to declare dividends on a quarterly basis or otherwise. The declaration of dividends by us is subject to the discretion of our board of directors. Our board of directors will take into account such matters as general business conditions, our financial results, capital requirements, contractual, legal and regulatory restrictions on the payment of dividends by us to our shareholders or by our subsidiary to the holding company, and such other factors as our board of directors may deem relevant.
Recent Sales of Unregistered Securities and Use of Proceeds
None
30
Securities Authorized for Issuance Under Equity Compensation Plans
The following table provides information as of December 31, 2007, regarding securities issued and to be issued under our equity compensation plans that were in effect during fiscal 2007:
Plan Category | Plan Name | Number of Securities to be Issued Upon Exercise of Outstanding Options, Warrants and Rights | Weighted-Average Exercise Price of Outstanding Options, Warrants and Rights | Number of Securities Remaining Available for Future Issuance Under Equity Compensation Plans (Excluding Securities Reflected in Column (a) | ||||||||
| (a) | (b) | (c) | ||||||||||
| Equity compensation plans approved by security holders | Temecula Valley Bank, N.A. 1996 Incentive and Nonqualified Stock Option Plan (Employees) (1) | 1,161,292 | $ | 10.24 | - | |||||||
| Equity compensation plans approved by security holders | Temecula Valley Bank, N.A. 1997 Nonqualified Stock Option Plan (Directors) (2) | 549,876 | $ | 4.43 | - | |||||||
| Equity compensation plans approved by security holders | Temecula Valley Bancorp Inc. 2004 Stock Incentive Plan (3) | 466,245 | $ | 17.74 | 180,884 | |||||||
| Total | 2,177,413 | $ | 10.49 | 180,884 | ||||||||
| Equity compensation plans not approved by security holders | None | - | $ | - | - | |||||||
| (1) | The Temecula Valley Bank, N.A. 1996 Incentive and Nonqualified Stock Option Plan (Employees) (the "1996 Plan") was last approved by the shareholders of the Bank the 1996 Annual Meeting of Shareholders and amended by our shareholders at a meeting in 2001. The 1996 Plan became an obligation of our company in 2002. | |||||||||||
| (2) | The Temecula Valley Bank, N.A. 1997 Nonqualified Stock Option Plan (Directors) (the “1997 Bank Plan”) was last approved by the shareholders of the bank at our 1996 Annual Meeting of Shareholders and amended by our shareholders at a meeting in 1997. The 1997 Plan became an obligation of our company in 2002. | |||||||||||
| (3) | The Temecula Valley Bancorp Inc. 2004 Stock Incentive Plan (the "2004 Plan") was last approved by the shareholders of the Company at our 2004 Annual Meeting of Shareholders. | |||||||||||
Repurchases of Common Stock
On May 22, 2007, we announced a program to repurchase up to $5.5 million (approximately 250,000 shares) of our company’s common stock in the open market, for a period of six months ending November 22, 2007. On July 23, 2007, we announced a second program to repurchase up to $10.0 million (approximately 606,060 shares) of our company’s common stock in the open market, for a period of six months ending January 20, 2008.
| Issuer Purchases of Equity Securities | |||||||||||||
| Period | ( a ) Total number of shares purchased | ( b ) Average price paid per share | ( c ) Total number of shares purchased as part of publicly announced plans or programs | ( d ) Maximum approximate dollar value that may yet be purchased under the plans or programs | |||||||||
| 1st Quarter 2007 | - | $ | - | - | $ | - | |||||||
| 2nd Quarter 2007 | 106,900 | $ | 19.53 | 106,900 | $ | 3,412,625 | |||||||
| 3rd Quarter 2007 | 577,200 | $ | 17.28 | 577,200 | $ | 3,438,306 | |||||||
| 4th Quarter 2007 | - | $ | - | - | $ | 3,438,306 | |||||||
| 684,100 | (1) | $ | 17.63 | (2) | 684,100 | (1) | $ | 3,438,306 | |||||
| 1) All shares repurchased pursuant to two stock repurchase programs publicly announced on May 22, 2007 and July 23, 2007. | |||||||||||||
| All repurchases were made in open market transactions. | |||||||||||||
| 2) This price includes a commission of $0.05 per share. | |||||||||||||
31
Stock Performance Graph
The following graph shows a comparison of stockholder return on our common stock based on the market price of the common stock with cumulative total returns for companies in the (i) NASDAQ Composite Index, (ii) the NASDAQ Bank Index, and (iii) the SNL Bank and Thrift Index, for the 5-year period beginning on December 31, 2002 though December 31, 2007. The comparison assumes $100 was invested on December 31, 2002, in our common stock and the comparison groups and assumes the reinvestment of all cash dividends prior to any tax effect and retention of all stock dividends. This graph is historical only and may not be indicative of possible future performance in the common stock. Also, we need to indicate by a footnote to the table or otherwise "Source: SNL Financial LC, Charlottesville, VA, (434) 977-1600, www.snl.com".
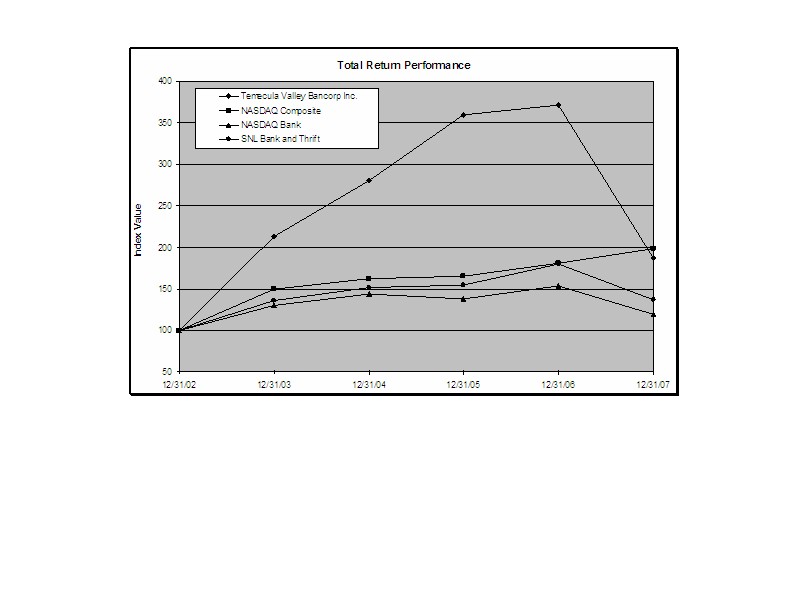
| Period Ending | ||||||
| Index | 12/31/02 | 12/31/03 | 12/31/04 | 12/31/05 | 12/31/06 | 12/31/07 |
| Temecula Valley Bancorp Inc. | 100.00 | 213.44 | 280.63 | 360.00 | 371.54 | 186.92 |
| NASDAQ Composite | 100.00 | 150.01 | 162.89 | 165.13 | 180.85 | 198.60 |
| NASDAQ Bank | 100.00 | 129.93 | 144.21 | 137.97 | 153.15 | 119.35 |
| SNL Bank and Thrift | 100.00 | 135.57 | 151.82 | 154.20 | 180.17 | 137.40 |
32
ITEM 6. SELECTED FINANCIAL DATA
The following table represents selected financial information for the five years ended December 31, 2007 for our company and subsidiaries on a consolidated basis. This table should be read in conjunction with our financial statements and related notes. All share and per share data have been restated to reflect the two-for-one stock split in December 2003.
| TEMECULA VALLEY BANCORP INC. | ||||||||||
| Selected Financial Data | ||||||||||
| For the Year Ended December 31, | ||||||||||
| 2007 | 2006 | 2005 | 2004 | 2003 | ||||||
| Income Statement: | (dollars and shares in thousands, except per share data) | |||||||||
| Interest income | $ | 115,615 | $ | 94,229 | $ | 58,125 | $ | 33,615 | $ | 23,891 |
| Interest expense | 49,983 | 34,449 | 14,584 | 6,415 | 4,947 | |||||
| Net interest income | 65,632 | 59,780 | 43,541 | 27,200 | 18,944 | |||||
| Provision for loan losses | 4,600 | 3,650 | 2,897 | 3,821 | 1,022 | |||||
Net interest income after provision for loan losses | 61,032 | 56,130 | 40,644 | 23,379 | 17,922 | |||||
| Non interest income | 16,388 | 19,444 | 23,822 | 28,698 | 24,481 | |||||
| Non interest expense | 51,905 | 46,991 | 40,627 | 33,963 | 29,121 | |||||
| Income before income taxes | 25,515 | 28,583 | 23,839 | 18,114 | 13,282 | |||||
| Provision for income taxes | 10,377 | 11,663 | 9,886 | 7,536 | 5,428 | |||||
| Net income | $ | 15,138 | $ | 16,920 | $ | 13,953 | $ | 10,578 | $ | 7,854 |
| Per Share Data: | ||||||||||
| Basic earnings per share | $ | 1.45 | $ | 1.83 | $ | 1.58 | $ | 1.24 | $ | 1.00 |
| Diluted earnings per share | $ | 1.41 | $ | 1.73 | $ | 1.46 | $ | 1.13 | $ | 0.89 |
| Cash dividends declared per common share | $ | 0.12 | N/A | N/A | N/A | N/A | ||||
| Average common shares outstanding | 10,411 | 9,235 | 8,846 | 8,503 | 7,824 | |||||
| Average common shares (dilutive) | 10,767 | 9,798 | 9,589 | 9,364 | 8,862 | |||||
| Book value per share | $ | 10.64 | $ | 9.75 | $ | 6.54 | $ | 4.90 | $ | 3.64 |
| Equity shares-beginning balance | 10,587 | 8,898 | 8,753 | 8,152 | 7,447 | |||||
| Warrants – Shares Issued | - | - | - | - | 324 | |||||
| Options – Shares Issued | 245 | 288 | 145 | 601 | 381 | |||||
| Stock offering | - | 1,401 | - | - | - | |||||
| Repurchase-retirement of stock | (684) | - | - | - | - | |||||
| Equity shares-ending balance | 10,148 | 10,587 | 8,898 | 8,753 | 8,152 | |||||
| Balance Sheet Data: | ||||||||||
| Assets | $ | 1,318,525 | $ | 1,238,189 | $ | 868,988 | $ | 606,828 | $ | 431,212 |
| Loans (including loans held for sale) | 1,237,717 | 1,142,693 | 753,246 | 530,196 | 360,749 | |||||
| Other Real Estate Owned | - | 1,255 | 2,111 | 303 | 485 | |||||
| Fed Funds Sold | 4,220 | 18,180 | 33,200 | 16,800 | 21,400 | |||||
| FRB/FHLB Stock | 2,905 | 1,996 | 3,099 | 2,378 | 1,145 | |||||
| Deposits | 1,161,071 | 1,081,501 | 742,432 | 534,767 | 383,487 | |||||
| FHLB advances | - | - | 30,000 | - | - | |||||
| Junior Subordinated Debt | 34,023 | 41,240 | 28,868 | 20,620 | 12,372 | |||||
| Stockholders' equity | 107,959 | 103,263 | 58,181 | 42,903 | 29,683 | |||||
| ALLL beginning balance | $ | 12,522 | $ | 9,039 | $ | 6,362 | $ | 3,608 | $ | 3,017 |
| Charge offs | (1,336) | (381) | (540) | (1,097) | (505) | |||||
| Recoveries | 236 | 214 | 320 | 30 | 74 | |||||
| Provision for loan losses | 4,600 | 3,650 | 2,897 | 3,821 | 1,022 | |||||
| ALLL ending balance | $ | 16,022 | $ | 12,522 | $ | 9,039 | $ | 6,362 | $ | 3,608 |
| Non-performing loans | $ | 30,936 | $ | 19,124 | $ | 7,951 | $ | 11,799 | $ | 6,765 |
| Government guaranteed portion | (10,379) | (10,335) | (6,514) | (8,140) | (5,269) | |||||
| Net non-performing loans | $ | 20,557 | $ | 8,789 | $ | 1,437 | $ | 3,659 | $ | 1,496 |
| SBA 7A participation sold - period end | $ | 436,998 | $ | 476,512 | $ | 486,710 | $ | 421,529 | $ | 287,346 |
| Other participations sold | 10,325 | 3,550 | 16,489 | 18,772 | 18,906 | |||||
| Total participation sold - period end | $ | 447,323 | $ | 480,062 | $ | 503,199 | $ | 440,301 | $ | 306,252 |
33
| TEMECULA VALLEY BANCORP INC. | ||||||||||
| Selected Financial Data | ||||||||||
| For the Year Ended December 31, | ||||||||||
| 2007 | 2006 | 2005 | 2004 | 2003 | ||||||
| Selected Ratios: | (dollars and shares in thousands) | |||||||||
| Return on average assets | 1.16% | 1.64% | 1.91% | 2.00% | 2.04% | |||||
| Return on average equity | 14.18% | 23.89% | 27.71% | 28.94% | 31.84% | |||||
| Income tax rate | 40.67% | 40.80% | 41.47% | 41.60% | 40.90% | |||||
| Tier I leverage ratio | 10.63% | 11.42% | 9.28% | 9.20% | 9.06% | |||||
| Tier I risk based ratio | 9.65% | 10.49% | 8.93% | 9.68% | 10.01% | |||||
| Total risk based ratio | 10.80% | 11.90% | 11.02% | 11.81% | 11.54% | |||||
| Average Equity / Average Assets | 8.18% | 6.88% | 6.90% | 6.93% | 6.45% | |||||
| Allowance for loan loss/net loans and loans held-for-sale | 1.29% | 1.10% | 1.20% | 1.20% | 1.00% | |||||
| Allowance for loan loss/net loans excluding loans held-for-sale | 1.56% | 1.29% | 1.35% | 1.29% | 1.05% | |||||
| Allowance for loan loss/net nonperforming loans | 77.94% | 142.46% | 629.10% | 173.88% | 256.71% | |||||
| Loan to deposit ratio | 106.60% | 105.66% | 101.46% | 99.15% | 94.07% | |||||
| Average int earning assets/average total assets | 94.04% | 91.21% | 87.96% | 86.09% | 86.34% | |||||
| Investment yield | 5.18% | 5.03% | 3.30% | 1.37% | 1.07% | |||||
| Loan yield | 9.54% | 10.12% | 9.12% | 7.48% | 7.45% | |||||
| Total interest-bearing assets | 9.44% | 10.03% | 9.05% | 7.39% | 7.16% | |||||
| Interest-bearing deposit cost | 4.72% | 4.20% | 2.64% | 1.66% | 1.82% | |||||
| Borrowing cost | 7.56% | 7.41% | 5.64% | 4.06% | 4.32% | |||||
| Net interest margin | 5.36% | 6.37% | 6.78% | 5.98% | 5.69% | |||||
| Net interest spread | 4.61% | 5.68% | 6.24% | 5.59% | 5.25% | |||||
| Efficiency ratio | 63.28% | 59.31% | 60.31% | 60.76% | 67.06% | |||||
| SBA Loan Servicing: | ||||||||||
| SBA excess servicing asset | $ | 5,350 | $ | 8,288 | $ | 8,169 | $ | 7,586 | $ | 6,117 |
| SBA I/O strip receivable asset | 6,599 | 13,215 | 22,068 | 24,680 | 20,496 | |||||
| Total SBA servicing asset | $ | 11,949 | $ | 21,503 | $ | 30,237 | $ | 32,266 | $ | 26,613 |
| SBA servicing-fee income | $ | 7,137 | $ | 9,077 | $ | 10,265 | $ | 8,738 | $ | 6,026 |
| SBA servicing-asset fair value adjustment | (11,180) | - | - | - | - | |||||
| SBA servicing-asset amortization | - | (11,487) | (7,492) | (6,120) | (4,234) | |||||
| SBA servicing-guarantee fee to SBA | (262) | (205) | (135) | (118) | (99) | |||||
| SBA servicing-net servicing income | $ | (4,305) | $ | (2,615) | $ | 2,638 | $ | 2,500 | $ | 1,693 |
| Loan Sales: | ||||||||||
| SBA 7A sales – guaranteed | $ | 89,820 | $ | 114,589 | $ | 108,912 | $ | 146,881 | $ | 129,813 |
| SBA 7A guaranteed-sales gain | 4,299 | 5,948 | 5,113 | 8,795 | 8,149 | |||||
| SBA 7A sales – unguaranteed | $ | 13,543 | $ | 20,556 | $ | 37,011 | $ | 35,365 | $ | 19,209 |
| Unguaranteed SBA 7A sales gain | 1,510 | 3,443 | 6,510 | 6,361 | 3,191 | |||||
| SBA Broker referral income | $ | 4,154 | $ | 3,056 | $ | 2,492 | $ | 2,506 | $ | 2,845 |
| Mortgage Broker referral income | 951 | 1,258 | 898 | 963 | 1,038 | |||||
| Employee Related: | ||||||||||
| Full time employees | 296 | 299 | 260 | 229 | 194 | |||||
| Part time employees | 29 | 18 | 21 | 16 | 14 | |||||
| Full time equivalent employees | 316 | 312 | 275 | 238 | 204 | |||||
| Salary continuation plan expense | $ | 1,506 | $ | 654 | $ | 723 | $ | 1,085 | $ | 531 |
| CSV life insurance balance | $ | 28,034 | $ | 24,036 | $ | 17,591 | $ | 9,594 | $ | 5,741 |
| CSV Life insurance income | $ | 1,152 | $ | 888 | $ | 605 | $ | 378 | $ | 250 |
| CSV Life insurance expense | (154) | (143) | (98) | (61) | (45) | |||||
| Net Life insurance income | $ | 998 | $ | 745 | $ | 507 | $ | 317 | $ | 205 |
34
The following table sets forth our company’s unaudited results of operations for the four quarters ended in 2007 and 2006. The only component of other comprehensive income was in 2006 and is the adjustment to fair value, net of tax, of interest-only strips, which are treated like investments in debt securities and are classified as available-for-sale starting in 2007.
| For the Quarter Ended in 2007 | ||||||||
| March 31, | June 30, | September 30, | December 31, | |||||
| Interest income | $ | 28,360 | $ | 29,904 | $ | 29,058 | $ | 28,293 |
| Interest expense | (12,110) | (12,850) | (12,541) | (12,482) | ||||
| Net interest income | 16,250 | 17,054 | 16,517 | 15,181 | ||||
| Provision for loan losses | (415) | - | (1,055) | (3,130) | ||||
| Non-interest income | 3,938 | 6,117 | 1,520 | 4,813 | ||||
| Non-interest expense | (12,664) | (14,317) | (12,641) | (12,282) | ||||
| Income before income tax expense | 7,109 | 8,854 | 4,341 | 5,212 | ||||
| Income tax expense | (2,930) | (3,603) | (1,746) | (2,098) | ||||
| Net income | $ | 4,179 | $ | 5,251 | $ | 2,595 | $ | 3,114 |
| Total comprehensive income | $ | - | $ | - | $ | - | $ | - |
| Basic earnings per share | $ | 0.39 | $ | 0.49 | $ | 0.25 | $ | 0.31 |
| Diluted earnings per share | $ | 0.38 | $ | 0.47 | $ | 0.25 | $ | 0.30 |
| Dividends declared | $ | N/A | $ | 0.04 | $ | 0.04 | $ | 0.04 |
| For the Quarter Ended in 2006 | ||||||||
| March 31, | June 30, | September 30, | December 31, | |||||
| Interest income | $ | 19,420 | $ | 21,912 | $ | 25,201 | $ | 27,696 |
| Interest expense | (6,052) | (7,375) | (9,608) | (11,414) | ||||
| Net interest income | 13,368 | 14,537 | 15,593 | 16,282 | ||||
| Provision for loan losses | (314) | (1,096) | (1,350) | (890) | ||||
| Non-interest income | 4,941 | 6,475 | 4,333 | 3,695 | ||||
| Non-interest expense | (11,077) | (12,053) | (11,604) | (12,257) | ||||
| Income before income tax expense | 6,918 | 7,863 | 6,972 | 6,830 | ||||
| Income tax expense | (2,937) | (3,333) | (2,954) | (2,439) | ||||
| Net income | $ | 3,981 | $ | 4,530 | $ | 4,018 | $ | 4,391 |
| Total comprehensive income | $ | 3,663 | $ | 3,468 | $ | 4,346 | $ | 4,862 |
| Basic earnings per share | $ | 0.44 | $ | 0.50 | $ | 0.44 | $ | 0.45 |
| Diluted earnings per share | $ | 0.42 | $ | 0.47 | $ | 0.41 | $ | 0.43 |
35
ITEM 7: MANAGEMENT DISCUSSION AND ANALYSIS OF FINANCIAL CONDITION AND RESULTS OF OPERATIONS
Management’s discussion, as well as other provisions within this report, is intended to provide additional information regarding the significant changes and trends in our Financial Condition, Statements of Income, Funds Management, and Capital Planning. Statements made in this report that state our intentions, beliefs, expectations or predictions of the future are forward-looking statements. Our actual results could differ materially from those projected in such forward-looking statements. Additional information concerning factors that could cause actual results to differ materially from those in the forward-looking statements is contained elsewhere in this report and our other filings made with the SEC. Copies of such filings may be obtained by contacting us or accessing our filings at www.sec.gov. We intend the forward-looking statements to be covered by the safe harbor provisions for forward-looking statements contained in the Private Securities Litigation Reform Act of 1995, and we are including this statement for purposes of invoking these safe harbor provisions. See "Cautionary Statement for Purposes of the "Safe Harbor" Provision of the Private Securities Litigation Reform Act of 1995," on the pages immediately following the table of contents in connection with "forward looking" statements included in this report.
Results of Operations
Net Income
Our net income and basic and diluted earnings per share for the years ended December 31, 2007, 2006, and 2005 are as follows:
| · | For 2007, net income was $15.1 million or $1.45 per basic share and $1.41 per diluted share. |
| · | For 2006, net income was $16.9 million or $1.83 per basic share and $1.73 per diluted share. |
| · | For 2005, net income was $14.0 million or $1.58 per basic share and $1.46 per diluted share. |
We have been profitable every full quarter since we opened in December 1996, except for the first quarter of 1997. Our net interest margin for the last three years has been consistently strong. This factor, coupled with gain on sale of loans and servicing income associated with SBA and mortgage loan sales, represents a significant portion of the profit dynamics of our company.
We sold $89.8 million of the guaranteed portion and $13.5 million of the unguaranteed portion of SBA 7(a) loans in 2007, which added $4.3 million and $1.5 million, respectively, to revenue. We sold $114.6 million of the guaranteed portion and $20.6 million of the unguaranteed portion of SBA 7(a) loans in 2006, which added $5.9 million and $3.4 million, respectively, to revenue, and in 2005 we sold $108.9 million of the guaranteed portion and $37.0 million of the unguaranteed portion of SBA 7(a) loans, which added $5.1 million and $6.5 million, respectively, to revenue. We expect to continue to sell SBA loans in the secondary market.
Our return on average assets and return on average equity for the years ended December 31, 2007, 2006, and 2005 are as follows:
| · | For 2007, return on average assets was 1.16%; return on average equity was 14.18%. |
| · | For 2006, return on average assets was 1.64%; return on average equity was 23.89%. |
| · | For 2005, return on average assets was 1.91%; return on average equity was 27.71%. |
Due to increasing interest rates, mortgage loan activity slowed considerably in 2004 and remained at subdued levels in 2005 and 2006. In 2007, the housing slowdown continued to decrease mortgage loan activity. During 2007, SBA 7(a) guaranteed loan sales for 2007 were $89.8 million, compared to $114.6 million in 2006, and $108.9 million in 2005.
Net Interest Income
Net interest income is the most significant component of our income from operations. Net interest income is the difference between the interest and fees earned on loans and investments (interest-earning assets) and the interest paid on deposits and other borrowings (interest-bearing liabilities). Net interest income depends on the volume of and interest rate earned on interest-earning assets and the volume of and interest rate paid on interest-bearing liabilities.
36
Net interest income was $65.6 million in 2007, compared to $59.8 million in 2006, and $43.5 million in 2005. The growth in net interest income levels have been achieved as a result of strong asset mix, which consists primarily of loans at variable rates, as well as growth of our loan portfolio. Our net interest margin was 5.36% in 2007, compared to 6.37% in 2006, and 6.78% in 2005. In the initial cycle of a flat rate environment following a rising rate environment, the net interest margin will slightly compress due to longer term, lower rate time deposits maturing and repricing at a higher rate. In a flat rate environment followed by a falling rate environment, the net interest margin will compress, mostly in the first six months, due to assets repricing more frequently than deposits. Although the yield on interest-earning assets decreased by 59 basis points for 2007, the yield on interest-bearing liabilities increased by 48 basis points for the same period. The following is a summation of various yields for interest-earning assets and interest-bearing liabilities at December 31, 2007, 2006, and 2005:
| · | Loans produced a yield of 9.54% in 2007, 10.12% in 2006, and 9.12% in 2005. The decrease in loan yields has been the result of a decreasing interest rate environment and higher nonaccrual loans. |
| · | Yield on investments, Federal Funds Sold and U.S. Agencies, increased to 5.18% in 2007, compared to 5.03% in 2006, and 3.30% in 2005. The increase in investment yields is a result of an increase in average federal funds rate from 5.03% in 2006 to 5.12% in 2007. |
| · | Total interest-earning assets yielded 9.44% in 2007, 10.03% in 2006, and 9.05% in 2005. |
| · | Cost of interest-bearing deposits increased to 4.72% in 2007, compared to 4.20% in 2006, and 2.64% in 2005. The increase is a result of the growth in higher rate interest-bearing deposits compared to the other interest-bearing deposits. |
| · | Cost of other borrowings, FHLB advances, and junior subordinated debt borrowings, increased to 7.56% in 2007, compared to 7.41% in 2006 and 5.64% in 2005. Contributing to the increase in the cost of borrowings was the slight increase in junior subordinated debt rates. |
Our goal is to maintain at least 90% of our assets as interest-earning assets. For 2007, our average interest-earning assets to total average assets were 94.04%, compared to 91.21% for 2006, and 87.96% for 2005. This ratio for 2005 was below our target due to the SBA servicing asset, the related SBA interest-only strip receivable, and the cash surrender value of life insurance (“BOLI”), our largest components of non interest-earning assets.
The following table shows average balances with corresponding interest income and interest expense as well as average yield and cost information for the last three years. Average balances are derived from daily balances, and nonaccrual loans are included as interest-bearing loans for the purposes of these tables.
37
| Average Balances with Rates Earned and Paid | |||||||||||||||||||
| Year ended December 31, | |||||||||||||||||||
| 2007 | 2006 | 2005 | |||||||||||||||||
| Interest | Average | Interest | Average | Interest | Average | ||||||||||||||
| Average | Income/ | Interest | Average | Income/ | Interest | Average | Income/ | Interest | |||||||||||
| Balance | Expense | Rate | Balance | Expense | Rate | Balance | Expense | Rate | |||||||||||
| Assets | ( dollars in thousands) | ||||||||||||||||||
| Interest-bearing deposits | $ | 593 | $ | 31 | 5.23% | $ | 54 | $ | 3 | 5.56% | $ | - | $ | - | 0.00% | ||||
Securities-HTM (1) | 2,105 | 124 | 5.89% | 381 | 19 | 4.99% | 203 | 6 | 2.96% | ||||||||||
| Federal Funds Sold | 24,815 | 1,270 | 5.12% | 16,497 | 829 | 5.03% | 7,224 | 239 | 3.29% | ||||||||||
| Total Investments | 27,513 | 1,425 | 5.18% | 16,932 | 851 | 5.03% | 7,427 | 245 | 3.30% | ||||||||||
Total Loans (2) | 1,196,849 | 114,190 | 9.54% | 922,264 | 93,378 | 10.12% | 634,731 | 57,880 | 9.12% | ||||||||||
| Total Interest Earning Assets | 1,224,362 | 115,615 | 9.44% | 939,196 | 94,229 | 10.03% | 642,158 | 58,125 | 9.05% | ||||||||||
| Allowance for Loan Loss | (12,848) | (10,311) | (7,606) | ||||||||||||||||
| Cash & Due From Banks | 12,527 | 24,286 | 25,385 | ||||||||||||||||
| Premises & Equipment | 5,413 | 5,173 | 4,673 | ||||||||||||||||
| Other Assets | 72,478 | 71,310 | 65,414 | ||||||||||||||||
| Total Assets | $ | 1,301,932 | $ | 1,029,654 | $ | 730,024 | |||||||||||||
| Liabilities and | |||||||||||||||||||
| Shareholders' Equity | |||||||||||||||||||
| Interest Bearing Demand | $ | 31,543 | 47 | 0.15% | $ | 31,161 | 47 | 0.15% | $ | 32,791 | 49 | 0.15% | |||||||
| Money Market | 119,922 | 4,445 | 3.71% | 83,672 | 2,727 | 3.26% | 50,239 | 912 | 1.81% | ||||||||||
| Savings | 29,460 | 127 | 0.43% | 31,685 | 122 | 0.39% | 38,010 | 141 | 0.37% | ||||||||||
| Time Deposits under $100,000 | 404,244 | 20,579 | 5.09% | 293,909 | 13,876 | 4.72% | 175,124 | 5,555 | 3.17% | ||||||||||
| Time Deposits $100,000 or more | 410,680 | 21,794 | 5.31% | 315,346 | 14,942 | 4.74% | 194,496 | 6,293 | 3.24% | ||||||||||
| Other Borrowings | 39,560 | 2,991 | 7.56% | 36,906 | 2,735 | 7.41% | 28,993 | 1,634 | 5.64% | ||||||||||
| Total Interest Bearing Liabilities | 1,035,409 | 49,983 | 4.83% | 792,679 | 34,449 | 4.35% | 519,653 | 14,584 | 2.81% | ||||||||||
| Non-interest Demand Deposits | 144,317 | 154,473 | 151,447 | ||||||||||||||||
| Other Liabilities | 15,704 | 11,683 | 8,569 | ||||||||||||||||
| Shareholders' Equity | 106,502 | 70,819 | 50,355 | ||||||||||||||||
| Total Liabilities and | |||||||||||||||||||
| Shareholders' equity | $ | 1,301,932 | $ | 1,029,654 | $ | 730,024 | |||||||||||||
| Net Interest Income | $ | 65,632 | $ | 59,780 | $ | 43,541 | |||||||||||||
Interest Spread (3) | 4.61% | 5.68% | 6.24% | ||||||||||||||||
Net Interest Margin (4) | 5.36% | 6.37% | 6.78% | ||||||||||||||||
| (1) There are no tax exempt investments in any of the reported years. | |||||||||||||||||||
| (2) Average balances are net of deferred fees/costs that are amortized to interest income over the term of the respective loan. | |||||||||||||||||||
| (3) Net interest spread is the yield earned on interest earning assets less the rate paid on interest bearing liabilities. | |||||||||||||||||||
| (4) Net interest margin is the net interest income divided by the interest earning assets. | |||||||||||||||||||
38
The following table shows a comparison of interest income and interest expense as the result of changes in the volumes and rates on average interest-earning assets and average interest-bearing liabilities for the years indicated.
| Rate/Volume Analysis | ||||||||||||||
| Increase/Decrease in Net Interest Income | ||||||||||||||
| Year Ended December 31 | ||||||||||||||
| 2007 | 2006 | |||||||||||||
| Assets | Volume | Rate | Total | Volume | Rate | Total | ||||||||
| (dollars in thousands) | ||||||||||||||
| Due From Banks-Time | $ | 27 | $ | 1 | $ | 28 | $ | - | $ | 3 | $ | 3 | ||
Securities-HTM (1) | 86 | 19 | 105 | 5 | 8 | 13 | ||||||||
| Federal Funds Sold | 418 | 23 | 441 | 306 | 284 | 590 | ||||||||
| Total Investments | 531 | 43 | 574 | 311 | 295 | 606 | ||||||||
Total Loans (2) | 28,071 | (7,259) | 20,812 | 26,925 | 8,573 | 35,498 | ||||||||
| Total Interest Earning Assets | $ | 28,602 | $ | (7,216) | $ | 21,386 | $ | 27,236 | $ | 8,868 | $ | 36,104 | ||
| Liabilities and Shareholders' Equity | ||||||||||||||
| Interest Bearing Demand | 1 | (1) | - | (2) | (1) | (3) | ||||||||
| Money Market | 1,181 | 537 | 1,718 | 607 | 1,209 | 1,816 | ||||||||
| Savings | (9) | 14 | 5 | (24) | 4 | (20) | ||||||||
| Time Deposits under $100,000 | 5,209 | 1,494 | 6,703 | 3,768 | 4,554 | 8,322 | ||||||||
| Time Deposits $100,000 or more | 4,517 | 2,335 | 6,852 | 3,909 | 4,740 | 8,649 | ||||||||
| Other Borrowings | 276 | (20) | 256 | 555 | 546 | 1,101 | ||||||||
| Total Interest Bearing Liabilities | 11,175 | 4,359 | 15,534 | 8,813 | 11,052 | 19,865 | ||||||||
| Net Interest Income | $ | 17,427 | $ | (11,575) | $ | 5,852 | $ | 18,423 | $ | (2,184) | $ | 16,239 | ||
| (1) There are no tax exempt investments in any of the reported years. | ||||||||||||||
| (2) Average balances are net of deferred fees/gains that are amortized to interest income over the term of the respective loan. | ||||||||||||||
Provision for Loan Loss
The allowance for loan losses represents our management’s best estimate of probable losses in our loan portfolio. We have a monitoring system to identify impaired and/or potential problem loans. This system assists in the periodic evaluation of impairment and determining the amount of the allowance for loan losses required.
Our monitoring system and allowance for loan losses methodology has evolved over a period of years, and loan classifications have been incorporated into the determination of our allowance for loan losses. Our monitoring system and allowance methodology include an assessment of individual classified loans, as well as applying loss factors to all loans not individually classified. Classified loans are reviewed individually to estimate the amount of probable loss that needs to be included in our allowance. These reviews include analysis of financial information as well as evaluation of collateral securing the credit. The analysis considers general factors such as changes in lending policies and procedures, economic trends, loan volume trends, changes in lending management and staff, trends in delinquencies, nonaccruals and charge-offs, changes in loan review and Board oversight, the effects of competition, legal and regulatory requirements, and factors inherent to each loan pool.
The provision was $4.6 million in 2007, $3.7 million in 2006, and $2.9 million in 2005. The allowance, as a percentage of net loans outstanding, including loans held-for-sale, was 1.29% as of December 31, 2007, 1.10% as of December 31, 2006, and 1.20% as of December 31, 2005. The allowance, as a percentage of net loans outstanding, excluding loans held-for-sale, was 1.56% as of December 31, 2007, 1.29% as of December 31, 2006, and 1.35% as of December 31, 2005. We plan to continue to sell the unguaranteed portion of SBA 7(a) loans to mitigate the risk associated with SBA 7(a) loans.
We had $30.9 million of nonperforming loans as of December 31, 2007, of which $10.4 million was guaranteed by the SBA, compared to $19.1 million of nonperforming loans as of December 31, 2006, of which $10.3 million was guaranteed by the SBA, and $8.0 million of nonperforming loans as of December 31, 2005, of which $6.5 million was SBA guaranteed. The majority of nonperforming assets are SBA loans, which represent $14.1 million of the net exposure. The remaining $6.4 million of conventional non-accrual loans consists of five loans. Of the two most significant of these loans, one is a $3.1 million construction loan for 25 single family residences located in Victorville, CA. Ten homes have sold and closed escrow
39
and there are five homes in escrow. The remaining 10 homes are completed and unsold. We feel that there is approximately $470,000 in loss exposure on the Victorville project. The other is a land development loan for $2.2 million located in Folsom, CA, where we do not anticipate a loss. The allowance for loan losses was $16.0 million at December 31, 2007, compared to $12.5 million at December 31, 2006, and $9.0 million at December 31, 2005. Net charge-offs were $1.1 million in 2007, $167 thousand in 2006, and $220 thousand in 2005.
Non-Interest Income
Non-interest income is an important revenue source for us. Non-interest income consists of service charges and fees, gain on sale of loans and other assets, and loan servicing, broker and other loan related income. Non-interest income was $16.4 in 2007, compared to $19.4 million in 2006, and $23.8 million in 2005. The primary contributor to the decrease in non-interest income from 2005 to 2007 was the decrease in the SBA servicing income. Servicing income was affected by higher prepayment rates in the first half of 2007 and by higher discount rates in the second half of 2007. The following table summarizes the components of non-interest income as of December 31, 2007, 2006, and 2005.
| Analysis of Changes in Non-Interest Income | ||||||||||||||||
| Increase/Decrease | Increase/Decrease | |||||||||||||||
| 2007 | Amount | % | 2006 | Amount | % | 2005 | ||||||||||
| (dollars in thousands) | ||||||||||||||||
| Service charges and fees | $ | 604 | $ | (14) | (2%) | $ | 618 | $ | 14 | 2% | $ | 604 | ||||
| Gain on loan sales | 10,124 | (3,041) | (23%) | 13,165 | (226) | (2%) | 13,391 | |||||||||
| Servicing income | (4,305) | (1,690) | 65% | (2,615) | (5,253) | (199%) | 2,638 | |||||||||
| Loan broker income | 5,104 | 790 | 18% | 4,314 | 923 | 27% | 3,391 | |||||||||
| Loan Related Income | 2,720 | 504 | 23% | 2,216 | (176) | (7%) | 2,392 | |||||||||
| Other income | 2,141 | 395 | 23% | 1,746 | 340 | 24% | 1,406 | |||||||||
| Total | $ | 16,388 | $ | (3,056) | (16%) | $ | 19,444 | $ | (4,378) | (18%) | $ | 23,822 | ||||
The following table summarizes the gain on sale of loans and other assets as of December 31, 2007, 2006, and 2005.
| Gain on Sale of Loans / Assets | ||||||||
| 2007 | 2006 | 2005 | ||||||
| (dollars in thousands) | ||||||||
| SBA 7A Unguaranteed Sales | $ | 1,510 | $ | 3,443 | $ | 6,510 | ||
| SBA 7A Guaranteed Sales | 4,294 | 5,948 | 5,113 | |||||
| 1st Trust Deed Sales | 2,064 | - | - | |||||
| SBA 504 Sales | 905 | 1,278 | 290 | |||||
| Mortgage Sales | - | - | 285 | |||||
| Other Loan Related | 1,351 | 2,496 | 1,192 | |||||
| REO Gain (Loss) | (9) | 75 | (26) | |||||
| Fixed Assets | (16) | (8) | 5 | |||||
| Total | $ | 10,099 | $ | 13,232 | $ | 13,369 | ||
The SBA servicing loss was $4.3 million in 2007 and $2.6 million in 2006. SBA servicing income was $2.6 million in 2005. The following table summarizes components of the SBA servicing income as of December 31, 2007, 2006, and 2005.
| SBA Servicing Income | ||||||||
| 2007 | 2006 | 2005 | ||||||
| (dollars in thousands) | ||||||||
| SBA Servicing Income | $ | 7,137 | $ | 9,077 | $ | 10,265 | ||
| SBA Servicing Guarantee Fee | (262) | (205) | (134) | |||||
| SBA Servicing Excess Amortization | - | (11,487) | (7,493) | |||||
| SBA Servicing Fair Value | (11,180) | - | - | |||||
| Total | $ | (4,305) | $ | (2,615) | $ | 2,638 | ||
Most SBA 7(a) guaranteed loans sold in the secondary market currently garner a cash premium over par, whereas par loan sales carry a higher servicing rate and provide higher values for interest only strips. As a result of our focus on cash premiums, the weighted-average rate on the servicing assets have been decreasing. At December 31, 2007, we were
40
servicing approximately $374.4 million of the guaranteed portion of 7(a) loans previously sold in the secondary market with a weighted-average servicing and I/O rate of 1.69%. At December 31, 2006, we were servicing approximately $399.9 million of the guaranteed portion of 7(a) loans previously sold in the secondary market with a weighted-average servicing and I/O rate of 2.01%. The decrease in servicing income has resulted from the declining fair value of the servicing and I/O assets to account for an increase in the prepayments experienced in our SBA loan portfolio, as well as a decrease in ongoing servicing income resulting from the lower servicing rate.
Non-Interest Expense
Non-interest expenses consist of salaries and benefits, occupancy, furniture and equipment, processing, office expense and professional costs such as legal and auditing, marketing and regulatory fees. These expenses are reviewed and controlled to maintain cost effective levels of operation. Non-interest expense was $51.9 million in 2007, compared to $47.0 million in 2006, and $40.6 million in 2005. Non-interest expense is expected to continue to increase as the size of our company increases. The following table summarizes the non-interest expense as of December 31, 2007, 2006, and 2005:
| Analysis of Changes in Non-Interest Expense | ||||||||||||||||
| Increase/Decrease | Increase/Decrease | |||||||||||||||
| 2007 | Amount | % | 2006 | Amount | % | 2005 | ||||||||||
| (dollars in thousands) | ||||||||||||||||
| Salaries and employee benefits | $ | 33,557 | $ | 1,568 | 5% | $ | 31,989 | $ | 5,018 | 19% | $ | 26,971 | ||||
| Occupancy of premises | 3,219 | 184 | 6% | 3,035 | 607 | 25% | 2,428 | |||||||||
| Furniture and equipment | 1,929 | 210 | 12% | 1,719 | 207 | 14% | 1,512 | |||||||||
| Data processing | 1,381 | 116 | 9% | 1,265 | 138 | 12% | 1,127 | |||||||||
| Marketing and Business Promotion | 1,176 | 205 | 21% | 971 | (151) | (13%) | 1,122 | |||||||||
| Legal and Professional | 1,387 | 244 | 21% | 1,143 | 88 | 8% | 1,055 | |||||||||
| Regulatory Assessments | 765 | 580 | 314% | 185 | (61) | (25%) | 246 | |||||||||
| Travel & Entertainment | 1,075 | (50) | (4%) | 1,125 | 177 | 19% | 948 | |||||||||
| Loan Related Expense | 3,141 | 774 | 33% | 2,367 | 229 | 11% | 2,138 | |||||||||
| Office Expenses | 2,640 | 44 | 2% | 2,596 | (81) | (3%) | 2,677 | |||||||||
| Other Expenses | 1,635 | 1,039 | 174% | 596 | 193 | 48% | 403 | |||||||||
| Total | $ | 51,905 | $ | 4,914 | 10% | $ | 46,991 | $ | 6,364 | 16% | $ | 40,627 | ||||
Salaries and benefits were $33.6 million in 2007, compared to $32.0 million in 2006, and $27.0 million in 2005. The increase in salaries and benefits is a result of the expansion of the Risk Management, Information Technology, and Appraisal Departments as well as the addition of the Solana Beach, Ontario, and San Marcos branches, the Inland Empire loan production unit, and the SBA unguaranteed purchase program, and growth of the SBA wholesale lending unit. Included in the salaries and benefits expense in 2007 and 2006 is $806 thousand and $1.1 million for stock-based compensation for all share-based payments vested in 2007 as a result of the adoption of SFAS No. 123R.
Occupancy expense was $3.2 million in 2007, compared to $3.0 million in 2006, and $2.4 million in 2005. Furniture and equipment expense was $1.9 million in 2007, compared to $1.7 million in 2006, and $1.5 million in 2005. Contributing to these increases are the costs related to the opening of the San Marcos branch in 2007, the Solana Beach and Ontario branches in 2006, and the Carlsbad branch in 2005.
Legal and professional expenses were $1.4 million in 2007 and $1.1 million in 2006 and 2005. The increase in legal and professional expenses from 2005 to 2007 is the result of increased external and internal audit fees related to Sarbanes-Oxley compliance, and legal fees associated with employment agreements, stock repurchases, and our employee stock option program.
Regulatory assessments were $765 thousand in 2007, compared to $185 thousand in 2006, and $246 thousand in 2005. In November 2006, the Federal Deposit Insurance Corporation ("FDIC") finalized a rule intended to match an institution's deposit insurance premium to the risk an institution poses to the deposit insurance fund. The final regulations adopt a new base schedule of rates that the FDIC Board could adjust up or down, depending on the revenue needs of the insurance fund. During the third quarter of 2007, we were assessed at the new deposit insurance rate retroactive to March 31, 2007. We anticipate regulatory assessment expenses of approximately $200 thousand per quarter going forward at the current deposit levels.
Loan funding expenses were $3.1 million in 2007, compared to $2.4 million in 2006, and $2.1 million in 2005. The increase in loan funding expense is a result of the continued growth in our loan portfolio.
41
Income Taxes
For 2007, the tax expense was $10.4 million, for an effective rate of 40.7%, for 2006, the tax expense was $11.7 million, for an effective rate of 40.8%, and for 2005 the tax expense was $9.9 million, for an effective rate of 41.5%. The decrease in the effective rate for 2006 was largely due to larger enterprise zone deductions in 2006 than in 2005. Deferred tax assets totaled $10.1 million at December 31, 2007, $8.5 million at December 31, 2006, and $5.7 million at December 31, 2005. Over half of the deferred tax asset is due to the tax deductibility timing difference of the provision for loan losses.
Financial Condition
General
As of December 31, 2007, total assets increased 6.49% to $1.32 billion, compared to $1.24 billion as of December 31, 2006. Total gross loans increased to $1.24 billion as of December 31, 2007, or 8.15%, compared to $1.15 billion as of December 31, 2006. Deposits grew 7.36% to $1.16 billion as of December 31, 2007, compared to $1.08 billion as of December 31, 2006.
Assets
Total assets were $1.32 billion at December 31, 2007, compared to $1.24 billion at December 31, 2006, a 6.49% increase. The increase was due to a $4.0 million increase in cash surrender value of life insurance, and an increase in gross loans, including loans held-for-sale, outstanding of $93.4 million. Asset growth is expected to continue due to the expansion of our branches, growth of the SBA wholesale lending unit, and growth of the Inland Empire loan production unit.
Total loans and loans held-for-sale, excluding deferred loan fees and allowance for loan loss, were $1.24 billion at December 31, 2007, compared to $1.15 billion at December 31, 2006, an 8.15% increase. Much of the increase is due to increases in construction loans and SBA loans. Our loan portfolio composition is primarily construction, commercial, SBA, and real estate secured loans. SBA 7(a) loans, of which we are an active originator, consisting of both commercial and real estate loans, comprise approximately 23% of loans outstanding at December 31, 2007 and 2006, and 13% as of December 31, 2005. Approximately 92% of the loan portfolio is in real estate secured loans as of December 31, 2007, compared to 94% and 95% for comparable periods in 2006 and 2005, respectively.
At December 31, 2007, approximately 6% of the loans were commercial loans, compared to approximately 5% at December 31, 2006. Even though there is softness in the residential loan market, the rate of loan growth for our bank is projected to be strong due to the addition of the Inland Empire loan production unit, the wholesale SBA program, and growth of our branch system.
The allowance for loan losses was $16.0 million at December 31, 2007, compared to $12.5 million at December 31, 2006. Net charge-offs were $1.1 million in 2007 and $167 thousand in 2006. The provision for loan losses was $4.6 million in 2007 and $3.7 million in 2006. The allowance, as a percentage of net loans outstanding, including loans held-for-sale, was 1.29% and 1.10% at December 31, 2007 and 2006, respectively. The allowance, as a percentage of net loans outstanding, excluding loans held-for-sale, was 1.56% and 1.29% at December 31, 2007 and 2006, respectively.
Federal Funds Sold were $4.2 million at December 31, 2007, compared to $18.2 million at December 31, 2006. The change from 2006 to 2007 is largely attributable net loans outstanding increasing $60.6 million more than deposits, and the increase in capital.
At December 31, 2007, the SBA servicing asset was $5.4 million, the SBA I/O strip receivable was $6.6 million, and the cash surrender value of life insurance was $28.0 million. At December 31, 2006, the SBA servicing asset was $8.3 million, the SBA I/O strip receivable was $13.2 million, and the cash surrender value of life insurance was $24.0 million.
Loan Portfolio
Moderate loan demand in 2007 resulted in a 15.3% increase in commercial loans, a 4.2% increase in construction lending, a 6.9% decrease in real estate lending, and a 23.8% increase in SBA loans. We originated brokered loans, totaling $71.1 million in 2007, compared with $96.7 million in 2006, and $63.7 million in 2005. Sales of mortgage loans totaled $13.7 million in 2005. There were no sales of mortgage loans in 2006 and 2007. The servicing portfolio, which consists of SBA loans sold to other investors, was $447.3 million as of December 31, 2007, compared to $480.0 million as of December 31, 2006, and $503.2 million as of December 31, 2005.
42
The majority of our loans have floating rates tied to Wall Street Journal or other market rate indicators. This serves to lessen the risk from movement in interest rates, particularly rate increases.
Nonperforming Assets
Nonperforming assets consist of nonaccrual loans, loans 90 or more days past due and still accruing interest, and Other Real Estate Owned (“OREO”). We had $30.9 million of nonperforming assets as of December 31 2007, of which $10.4 million was guaranteed by the SBA, compared to $20.4 million of nonperforming assets as of December 31 2006, of which $11.0 million was guaranteed by the SBA, and $10.1 million of nonperforming assets as of December 31, 2005, of which $7.1 million was government guaranteed. The majority of nonperforming assets are SBA loans, which represent $14.1 million of the net exposure. The remaining $6.4 million of conventional non-accrual loans consists of five loans. One is a $3.1 million construction loan for 25 single family residences located in Victorville, CA. Ten homes have sold and closed escrow and there are five homes in escrow. The remaining 10 homes are completed and unsold. We feel that there is approximately $470,000 in loss exposure on the Victorville project. The other is a land development loan for $2.2 million located in Folsom, CA, where we do not anticipate a loss. There was $1.3 million of OREO at December 31, 2006, of which $638 thousand was guaranteed by the SBA, compared to $2.1 million of OREO at December 31, 2005, of which $604 thousand was guaranteed by the SBA. There was no OREO at December 31, 2007.
Nonaccrual Loans
Nonaccrual loans, net of the government guaranteed portion, were $20.6 million or 1.66 % of total gross loans as of December 31, 2007, compared to $8.8 million or 0.77 % of total gross loans as of December 31, 2006, and $1.4 million or 0.19% of total gross loans as of December 31, 2005.
Classified Assets
From time to time, our management has reason to believe that certain borrowers may not be able to repay their loans within the parameters of the present repayment terms, even though, in some cases, the loans are current at the time. These loans are graded in the classified loan grades of “substandard” or “doubtful” or “loss” and include most nonperforming loans. Each classified loan is monitored at least monthly and more frequently, as necessary. Classified assets, net of government guarantees, (loans graded as substandard or lower and OREO) at December 31, 2007, 2006, and 2005 were $44.2 million, $19.5 million, and $5.0 million, respectively.
Risk Management
The investment of our funds is primarily in loans, where a greater degree of risk is normally assumed, than in other forms of investments. Sound underwriting of loans and continuing evaluations of the underlying collateral and performance of our borrowers are an integral part in the maintenance of a high level of quality in our total assets. Net loan charge-offs for the year ended December 31, 2007 were $1.1 million, or 0.09% of average gross loans outstanding, compared to $167 thousand, or 0.02% of average gross loans outstanding for the year ended December 31, 2006, and $220 thousand, or 0.03% of average gross loans outstanding, for the year ended December 31, 2005.
Allowance for Loan Losses
As of December 31, 2007, the balance in the allowance for loan losses was $16.0 million, compared to $12.5 million as of December 31, 2006, and $9.0 million as of December 31, 2005. Risks and uncertainties exist in all lending transactions and even though there have historically been very few charge offs in any category of our loans, loss allocations have been established for each loan category. These allocations are based upon loan type and loan classification, as well as market conditions for the underlying real estate and other collateral, trends in the real estate market, economic uncertainties, and other risks where it is probable that losses may be incurred. In general, there are no loss allocations established for the government guaranteed portion of loans. The allowance for loan losses was 1.29% of total net loans and loans held-for-sale as of December 31, 2007, 1.10% as of December 31, 2006, and 1.20% as of December 31, 2005. The allowance for loan losses was 1.56% of total net loans excluding loans held-for-sale as of December 31, 2007, 1.29% as of December 31, 2006, and
43
1.35% as of December 31, 2005. The allowance for loan losses as a percentage of gross nonaccrual loans was 51.79% as of December 31, 2007, compared to 65.48% as of December 31, 2006, and 113.69% as of December 31, 2005. The allowance for loan losses to nonperforming loans, net of government guarantees was 77.94% as of December 31, 2007, compared to 142.46% as of December 31, 2006, and 629.10% as of December 31, 2005.
The provision for loan losses charged to operations reflects management's judgment of the allowance for loan losses and is determined through quarterly analytical reviews of the loan portfolio, problem loans, and consideration of such other factors as our bank's loan loss experience, trends in problem loans, concentrations of credit risk, and current economic conditions, as well as the results of our bank's ongoing credit examination process and that of our regulators. As conditions change, our level of provision for loan loss and allowance for loan losses may change.
During the year ended December 31, 2007, we charged off $1.1 million (net of recoveries) and provided $4.6 million to the provision for loan losses. During the year ended December 31, 2006, we charged off $167 thousand (net of recoveries) to the allowance while providing $3.7 million to the provision for loan losses. During the year ended December 31, 2005, we charged off $220 thousand (net of recoveries) and provided $2.9 million to the provision for loan losses. Although we believe that we use the best information available to make determinations of the allowance for loan losses, future adjustments to the allowance for loan losses may be necessary and results of operations could be significantly and adversely affected if circumstances differ substantially from the assumptions used in making the determinations.
During 2005, 2006, and 2007, net charge offs as a percentage of average loans outstanding were only 0.03%, 0.02%, and 0.09%, respectively. We have established loss allocations for each homogeneous category based upon loan type, as well as specific allocations for special mention and classified loans. Certain loan types may not have incurred charge-offs or have historically had minimal losses, but it is probable that losses may be incurred. We consider trends in delinquencies, potential charge offs by loan type, market for underlying real estate or other collateral, trends in industry types, economic changes and other risks.
Accounting for the Allowance for Loan Losses
Non-homogenous exposures, representing individual credit exposures, are evaluated based upon the borrower's overall financial condition, resources, and payment record; the prospects for support from any financially responsible guarantors; and, if appropriate, the realizable value of any collateral. The allowance for loan losses attributed to these loans is established via a process that begins with estimates of probable losses in the portfolio based upon the present value of the expected future cash flows discounted in the loan's contractual effective rate, the secondary market value of the loan and the discounted fair value of collateral. This analysis includes all special mention, substandard, doubtful, and loss rated loans. The credit administration review and expertise in analyzing and working out these loans is critical to the accuracy of this process.
Each portfolio of homogeneous loans is collectively evaluated for loss potential. The allowance for loan losses is established via a process that begins with estimates of probable incurred losses in the portfolio, based upon various statistical analyses. These include historical credit loss experience, together with analyses that reflect current trends and conditions. The analysis considers general factors such as changes in lending policies and procedures, economic trends, loan volume trends, changes in lending management and staff, trends in delinquencies, nonaccruals and charge-offs, changes in loan review and Board oversight, the effects of competition, legal and regulatory requirements, and factors inherent to each loan pool.
Life Insurance -Cash Surrender Value
The cash surrender value of life insurance is bank owned life insurance (“BOLI”). The BOLI death benefit provides key man insurance for our bank, as well as providing coverage for the future payments, of the executive Salary Continuation Plan (“SCP”). As of December 31, 2007, there are 15 current and previously employed executives covered by BOLI. The BOLI had a balance of $28.0 million at December 31, 2007, compared to $24.0 million at December 31, 2006, and $17.6 million at December 31, 2005. The total death benefit at December 31, 2007 was approximately $57.2 million. The BOLI earnings in 2007, net of mortality cost, were $998 thousand, compared to $745 thousand in 2006, and $507 thousand in 2005. The net earnings of BOLI are tax-free. The SCP expense before tax in 2007 was $1.5 million, compared to $654 thousand in 2006, and $723 thousand in 2005. See the notes in the financial statements for additional information.
Servicing Asset and Interest-Only Strips Receivable
Servicing assets are recognized when loans are sold with servicing retained. Servicing assets are measured at fair value and changes in fair value are recorded in earnings in the period which the change occurs. The fair value of servicing assets is estimated by discounting the future cash flows at estimated future current market rates for the expected life of the loans. We use industry prepayment statistics in estimating the expected life of the loan.
44
SBA 7(a) loans can be sold for a premium or for par. When an SBA 7(a) loan is sold for a premium, the originator is required to retain at least 1% interest on the sold portion of the loan. The 1% interest is considered the contractual servicing fee for the loan. When an SBA 7(a) loan is sold for par, the originator generally retains a much larger interest than the required contractual servicing. The premium represents what the buyer is willing to pay the originator for the difference between the rates passed through to the buyer in a premium sale versus a par sale. When we feel that the premium is not sufficient to compensate us for the future income resulting from the higher retained interest in a par sale, we will sell the loan at par versus a premium.
The servicing assets represent the value of the contractual servicing fee less costs to service in the SBA industry have been considered 40 basis points. Therefore, the servicing asset value is based upon the contractual servicing fee of generally 1%, less servicing costs of 40 basis points. When the interest rate retained exceeds the contractual servicing fee, generally 1% for SBA 7(a) loans, the excess over 1% is considered the I/O. At December 31, 2007, 2006, and 2005, we had I/O strips of $6.6 million, $13.2 million, and $22.1 million respectively, which approximate fair value. Fair value is estimated by discounting estimated future cash flows from the I/O strips using assumptions similar to those used in valuing servicing assets. In addition, we obtain a third party valuation on a quarterly basis.
The net servicing asset decreased to $5.4 million as of December 31, 2007, compared to $8.3 million as of December 31, 2006, and $8.2 million as of December 31, 2005. The decrease reflects the decline in serviced assets from $399.9 million at December 31, 2006 to $374.4 million at December 31, 2007, the increase in discount rates used to value the servicing assets, and an increase in the prepayment assumptions. The valuation of the servicing asset reflects estimates of the expected life of the underlying loans, which may be adversely affected by higher than expected levels of pay-offs in periods of lower rates or charge-offs in periods of economic difficulty. In addition, when property values increase due to general economic conditions, borrowers have refinancing opportunities available to them which may result in higher prepayment rates. See the footnotes to the financial statements, found elsewhere in this Annual Report, for further information on servicing assets.
Investments/Financial Assets
Federal Home Loan Bank (“FHLB”) stock and FNMA mortgage-backed security, was $5.9 million at December 31, 2007 and $3.0 million at December 31, 2006. Federal Reserve Bank and FHLB stock, which are not included in the investment category, was $3.1 million at December 31, 2005. We had $4.2 million in Fed Funds Sold at December 31, 2007, compared to $18.2 million at December 31, 2006, and $33.2 million at December 31, 2005.
At the date of purchase, we are required to classify equity and debt securities into one of three categories: held-to-maturity, trading, or available-for-sale. At each annual reporting date, the appropriateness of the classification is reassessed. Investments classified as held-to-maturity are measured at amortized cost in the financial statements and can be so classified only if management has the positive intent and ability to hold those securities to maturity. Securities that are bought and held principally for the purpose of sale in the near-term are classified as trading and measured at fair value in the financial statements with unrealized gains and losses included in earnings. Investments not classified as either held-to-maturity or trading are classified as available-for-sale and measured at fair value in the financial statements with unrealized gains and losses reported, net of tax, in a separate component of shareholders' equity until realized.
For 2007, the ratio of average interest-earning assets to average total assets was 94.04%, for 2006 it was 91.21% and for 2005 it was 87.96%. Our goal is to maintain at least 90% of our assets as interest-earning. For 2005 the ratio remained below that level due to the SBA servicing asset, the related SBA interest-only strip receivable, and the cash surrender value of life insurance. Even though these assets are not considered interest-bearing for net interest margin purposes, they do produce, or are related to, income that is part of non-interest income.
Other Assets
Premises and equipment, accrued interest, and deferred tax assets are the major components of other assets. The changes in these items are as follows:
| · | Premises and equipment were $5.3 million, $5.5 million, and $4.9 million as of December 31, 2007, 2006, and 2005, respectively. The decrease has mainly been due to upgrades to information technology systems and expansion of the number of branches and loan production offices offset by depreciation. |
| · | Accrued interest was $6.8 million, $6.2 million, and $3.5 million as of December 31, 2007, 2006, and 2005, respectively. The increase in accrued interest is a direct result of the increase in loans (including loans held-for-sale). Average loan balances increased to $1.20 billion for 2007, compared to $922.3 million for 2006, and $634.7 million for 2005. |
| · | Deferred tax assets were $10.1 million, $8.5 million, and $5.7 million as of December 31, 2007, 2006, and 2005, respectively. Over half of the deferred tax asset is due to the tax deductibility timing difference of the provision for loan loss. |
45
Deposits
Sources of Funds
We offer a variety of deposit accounts, having a wide range of interest rates and terms, consisting of demand, savings, money market, and time accounts. We rely primarily on competitive pricing policies, customer service, and referrals to attract and retain these deposits. Deposits were $1.16 billion at December 31, 2007, compared to $1.08 billion at December 31, 2006, a $79.6 million or 7.36% increase. Demand deposits decreased $10.7 million, money market and NOW accounts increased $15.9 million, savings decreased $1.7 million, and certificate of deposits (CD's) increased $76.0 million, of which $88.2 million were brokered deposits. Non interest-bearing demand deposits comprised approximately 12% of deposits at December 31, 2007, compared to 13% at December 31, 2006. The loan to deposit ratio increased to 106.60% at December 31, 2007 from 105.66% at December 31, 2006.
At December 31, 2007, approximately 60% of deposits had balances of $100,000 or more and none of our customers (excluding brokered deposits) had balances that exceeded 2% of our bank’s deposits. Brokered CD deposits were $88.2 million at December 31, 2007 and $47.2 million at December 31, 2006. We prefer core deposits as a source of funds for our loan portfolio. Consequently, we take steps to attract solid core accounts while at the same time maintaining a reasonable funding cost. The core deposit base has grown as a result of the addition of one branch in 2007, two branches in 2006, one branch in 2005, and the continued deposit increases at our seven other branches. We will continue to solicit core deposits to diminish reliance on volatile funds.
The increase in certificates of deposits is due to CD promotions during 2004, 2005, 2006, and 2007 to fund the rapid loan growth, as well as the creation of a Money Desk Department in 2005 and acquisition of brokered CD deposits in 2006 and 2007. Certificates of deposits balances in the Money Desk Department are deposits from other financial institutions. As of December 31, 2007 these deposits totaled $97.6 million. The following table is a summary of our deposits by type and their percentage of distribution:
| December 31, 2007 | December 31, 2006 | ||||||||
| Amount | Percent | Amount | Percent | ||||||
| Deposit composition: | (dollars in thousands) | ||||||||
| Non Interest-Bearing Demand | $ | 133,867 | 12% | $ | 144,525 | 13% | |||
| Money Market and NOW | 146,270 | 13% | 130,357 | 12% | |||||
| Savings | 28,059 | 2% | 29,781 | 3% | |||||
| Time Deposits, Under $100,000 | 453,272 | 39% | 367,029 | 34% | |||||
| Time Deposits, $100,000 and Over | 399,603 | 34% | 409,809 | 38% | |||||
| Total Deposits | $ | 1,161,071 | 100% | $ | 1,081,501 | 100% | |||
On November 2, 2006, the FDIC finalized a rule intended to match an institution's deposit insurance premium to the risk an institution poses to the deposit insurance fund. The final regulations adopt a new base schedule of rates that the FDIC Board could adjust up or down, depending on the revenue needs of the insurance fund. The base rates range from 2 to 4 basis points for healthy banks, based on supervisory ratings and financial ratios, and debt ratings for large banks. The new assessment rates were effective on January 1, 2007 and will vary between five and seven cents per $100 of domestic deposits.
Borrowings and Junior Subordinated Debt
We use FHLB borrowings to fund loan demand and to manage liquidity in light of deposit flows. Our borrowing capacity can be used to borrow under various FHLB loan programs, including adjustable and fixed-rate financing, for periods ranging from one day to 30 years, with a variety of interest rate structures available. The borrowing capacity has no commitment fees or cost, requires minimum levels of investment in FHLB stock (we receive dividend income on our investment in FHLB stock), can be withdrawn by the FHLB if there is any significant change in our financial or operating condition, and is conditional upon our compliance with certain agreements covering advances, collateral maintenance, eligibility, and documentation.
46
We are required to pledge a certain amount of loans with the FHLB for collateralization purposes. As of December 31, 2007, $129.8 million in loans, with an outstanding balance of $124.3 million, was pledged for an aggregate borrowing line of $81.1 million. As of December 31, 2006, $124.1 million in loans, with an outstanding balance of $112.8 million, was pledged for an aggregate borrowing line of $73.8 million. At December 31, 2006 and 2007, there were no borrowings from the FHLB. At December 31, 2005, advances from the FHLB were $30.0 million. Our borrowing capacity at the FHLB as of December 31, 2005 was $30.1 million.
Pursuant to rulings of the Federal Reserve Board, bank holding companies are permitted to issue long-term subordinated debt instruments that will, subject to certain conditions, qualify as and, therefore, augment capital for regulatory purposes. The Subordinated Debentures are subordinated to all of our existing and future borrowings. The table below summarizes the terms of each issuance of our junior subordinated debt securities as of December 31, 2007:
| Series | Amount (000's) | Date Issued | Rate Adjustor | Effective Rate | Maturity Date | |||||
| Temecula Valley Statutory Trust II | $ | 5,155 | September 2003 | 3-month LIBOR +2.95% | 8.64% | 2033 | ||||
| Temecula Valley Statutory Trust III | 8,248 | September 2004 | 3-month LIBOR +2.20% | 7.13% | 2034 | |||||
| Temecula Valley Statutory Trust IV | 8,248 | September 2005 | 3-month LIBOR +1.40% | 6.39% | 2035 | |||||
| Temecula Valley Statutory Trust V | 12,372 | September 2006 | 3-month LIBOR +1.60% | 6.43% | 2036 | |||||
| Total | $ | 34,023 | ||||||||
At our company level, trust preferred borrowings can be treated as tier one capital up to 25% of total tier one capital, with the remainder treated as tier two capital. As of December 31, 2007 we have included $33.0 million of the net junior subordinated debt in our Tier I capital for regulatory capital purposes. As of December 31, 2006 and 2005 we have included $31.1 million of the net junior subordinated debt in our Tier I capital for regulatory capital purposes. The remaining amount qualifies for Tier II capital treatment.
Capital
It is our goal to maintain capital levels within the regulatory “well capitalized” category. We update our multiple-year capital plan annually in conjunction with the preparation of the annual budget. Capital levels are always a primary concern of the federal regulatory authorities, and we submit capital plans to them when requested. It is our strategy to maintain an adequate level of capital, which by definition excludes excessive as well as inadequate capital.
Total capital was $108.0 million at December 31, 2007 and $103.3 million at December 31, 2006. For 2007, the $4.7 million, or 4.55% increase, consisted of $15.1 million of net income, $2.0 million on the exercise of stock options, $806 thousand of stock-based compensation expense, a reduction of $1.2 million for cash dividends, and a reduction of $12.1 million for the repurchase and retirement of common stock. For 2006, the $45.1 million, or 77.49% increase, consisted of $16.9 million of net income, a reduction of $172 thousand in other comprehensive income, $2.5 million on the exercise of stock options, $1.1 million of stock-based compensation expense, and $25.1 million of proceeds from a private placement stock offering. Our average equity to average assets ratio was 8.18%, 6.88%, and 6.96% at December 31, 2007, 2006, and 2005, respectively.
During 2007, our board of directors authorized three cash dividends. The first cash dividend was authorized in May 2007, a $0.04 per share cash dividend payable on July 15, 2007 to shareholders of record as of July 1, 2007. The second cash dividend was authorized in August 2007, a $0.04 per share cash dividend payable on October 15, 2007 to shareholders of record as of October 1, 2007. The third cash dividend was authorized in November 2007, a $0.04 per share cash dividend payable on January 15, 2008 to shareholders of record as of January 2, 2008. Whether or not stock dividends, or any cash dividends, will be paid in the future will be determined by our Board of Directors after consideration of various factors. Our company's and our bank's profitability and regulatory capital ratios, in addition to other financial conditions, will be key factors considered by our Board of Directors in making such determinations regarding the payment of dividends.
Total risk based capital was 10.80% and tier one leverage capital was 10.63% at December 31, 2007, compared to 11.90% and 11.42% at December 31, 2006. At December 31, 2007 and 2006 our bank was within the regulatory “well capitalized” category.
At the end of 2007 and 2006, all bank capital ratios were above all current Federal capital guidelines for a "well capitalized" bank. Our management considers capital requirements as part of our strategic planning process. The strategic plan calls for continuing increases in assets and liabilities, and the capital required may therefore be in excess of retained earnings. The ability to obtain capital is dependent upon the capital markets as well as performance of our company. Our management regularly evaluates sources of capital and the timing required to meet our strategic objectives.
47
The following tables present the regulatory standards for well capitalized institutions and the capital ratios for our company and our bank at December 31, 2007, 2006, and 2005.
| Minimum Required for Capital Adequacy Purposes | Actual Ratio December 31, | ||||||
| Temecula Valley Bancorp | 2007 | 2006 | 2005 | ||||
| Tier 1 leverage | 4.0% | 10.6% | 11.4% | 9.3% | |||
| Tier 1 risk-based capital | 4.0% | 9.7% | 10.5% | 8.9% | |||
| Total risk-based capital | 8.0% | 10.8% | 11.9% | 11.0% | |||
| Minimum Required for Capital Adequacy Purposes | To Be Well Capitalized Under Prompt Corrective Action Provisions | Actual Ratio December 31 | |||||||||
| Temecula Valley Bank | 2007 | 2006 | 2005 | ||||||||
| Tier 1 leverage | 4.0% | 5.0% | 10.5% | 11.2% | 10.2% | ||||||
| Tier 1 risk-based capital | 4.0% | 6.0% | 9.5% | 10.2% | 9.8% | ||||||
| Total risk-based capital | 8.0% | 10.0% | 10.7% | 11.2% | 10.8% | ||||||
In December 2006, the federal banking agencies issued final guidance to reinforce sound risk management practices for bank holding companies and banks in commercial real estate (“CRE”) loans. The guidance establishes CRE concentration thresholds as criteria for examiners to identify CRE concentration that may warrant further analysis. The implementation of these guidelines could result in increased reserves and capital costs for banks with “CRE concentration”. We believe that our CRE portfolio as of December 31, 2007 does not have the risks associated with high CRE concentration due to mitigating factors, including low loan-to-value ratios, adequate debt coverage ratios, and a wide variety of property types.
Liquidity Management
Our cash position is determined on a daily basis. On a monthly basis, our Board reviews our liquidity position. One analysis measures the liquidity gap. Our guidelines state a 2% positive liquidity gap position should be maintained. At December 31, 2007, the liquidity gap position was 11.76%. Another analysis measures an industry standard liquidity ratio. Our guidelines state a 10% ratio or more should be maintained. At December 31, 2007 the ratio was 19.18%.
Our primary sources of liquidity are derived from growth in customer deposits and financing activities which includes Federal Funds lines of credit at correspondent banks and Federal Home Loan Bank (“FHLB”) advances. We maintain Federal Funds lines of credit of $58.0 million for short-term liquidity. In addition, we have created a borrowing capacity at the FHLB that fluctuates with loan balances pledged as collateral. At December 31, 2007, our borrowing capacity with the FHLB was $81.1 million and at December 31, 2006 was $73.8 million. These funding sources are augmented by payments of principal and interest on loans, and sales and participations of eligible loans. Primary uses of funds include withdrawal of deposits, interest paid on deposits and borrowings, originations of loans, and payment of operating expenses. We believe our liquidity sources to be stable and adequate. At December 31, 2007, we were not aware of any information that was reasonably likely to have a material effect on our liquidity position.
Banks are in the business of managing money. Consequently, funds management is essential to the ongoing profitability of a bank. A bank must attract funds at a reasonable rate and deploy the funds at an appropriate rate of return, while taking into account risk factors, interest rates, short- and long-term liquidity positions, and profitability needs. Liquidity management involves our ability to meet cash flow requirements arising from fluctuations in deposit levels and demands of daily operations, which include providing for customers' credit needs and ongoing repayment of borrowings. Our liquidity is actively managed on a daily basis and reviewed monthly by our Board of Directors.
We experienced net cash used by operating activities of $11.3 million during the 2007, $62.4 million during 2006, and $25.6 million during 2005.
Net cash provided by investing activities of $66.2 million during 2007, compared to net cash used in investing activities of $304.7 million during 2006, and $192.8 million during 2005. The change in 2007 was primarily the result of the purchase of the unguaranteed portion of 7(a) loans and the decreased loan growth in the current year compared to strong growth in the prior year.
48
We experienced net cash provided by financing activities of $61.5 million during 2007, $349.1 million during 2006, and $246.8 million during 2005. The change in 2007 was primarily the result of the repayment of a junior subordinated debt security, repurchase and retirement of common stock, offset by a lower increase in time deposits.
The liquidity of our parent company is primarily dependent on the payment of cash dividends by our bank, subject to restrictions set forth by California Banking Law as well as other regulatory instructions. The bank paid $13.0 million in dividends to the company in 2007. For the year ended December 31, 2006 and 2005, no dividends were paid by our bank to our company.
Contractual Obligations and Commitments
At December 31, 2007, we had commitments to extend credit of $448.8 million and obligations under letters of credit of $11.4 million. Commitments to extend credit are agreements to lend to customers, provided there is no violation of any condition established in the contract. Commitments generally have fixed expiration dates or other termination clauses and may require payment of a fee. Commitments are generally variable rate, and many of these commitments are expected to expire without being drawn upon. As such, the total commitment amounts do not necessarily represent future cash requirements. We use the same credit underwriting policies in granting or accepting such commitments or contingent obligations as we do for on-balance-sheet instruments, which consist of evaluating customers' creditworthiness individually.
Standby letters of credit are conditional commitments issued by us to guarantee the financial performance of a customer to a third party. Those guarantees are primarily issued to support private borrowing arrangements. The credit risk involved in issuing letters of credit is essentially the same as that involved in extending loan facilities to customers. When deemed necessary, we hold appropriate collateral supporting those commitments. We do not anticipate any material losses as a result of these transactions.
The following tables set forth the maturities of our outstanding financial commitments as of December 31, 2007 and 2006.
| Maturities for Loan Commitments and Related Financial Instruments as of December 31, 2007 | ||||||||||||||
| Maturity by period | ||||||||||||||
| One year | More than 1 | More than 3 | More than | |||||||||||
| Total | or less | year to 3 years | years to 5 years | 5 years | ||||||||||
| (dollars in thousands) | ||||||||||||||
| Commitments to Extend Credit | $ | 448,837 | $ | 288,298 | $ | 69,721 | $ | 1,668 | $ | 89,150 | ||||
| Letters of Credit | 11,447 | 8,368 | 2,952 | - | 127 | |||||||||
| Loan Commitments Outstanding | 460,284 | 296,666 | 72,673 | 1,668 | 89,277 | |||||||||
| Junior Subordinated Debt | 34,023 | - | - | - | 34,023 | |||||||||
| Operating Lease Obligations | 4,964 | 1,839 | 2,164 | 745 | 216 | |||||||||
| Other Commitments Outstanding | 38,987 | 1,839 | 2,164 | 745 | 34,239 | |||||||||
| Total Outstanding Commitments | $ | 499,271 | $ | 298,505 | $ | 74,837 | $ | 2,413 | $ | 123,516 | ||||
| Maturities for Loan Commitments and Related Financial Instruments as of December 31, 2006 | ||||||||||||||
| Maturity by period | ||||||||||||||
| One year | More than 1 | More than 3 | More than | |||||||||||
| Total | or less | year to 3 years | years to 5 years | 5 years | ||||||||||
| (dollars in thousands) | ||||||||||||||
| Commitments to Extend Credit | $ | 398,354 | $ | 290,719 | $ | 66,311 | $ | 1,172 | $ | 40,152 | ||||
| Letters of Credit | 3,514 | 3,130 | 384 | - | - | |||||||||
| Loan Commitments Outstanding | 401,868 | 293,849 | 66,695 | 1,172 | 40,152 | |||||||||
| Junior Subordinated Debt | 41,240 | - | - | - | 41,240 | |||||||||
| Operating Lease Obligations | 5,492 | 1,831 | 2,401 | 879 | 381 | |||||||||
| Other Commitments Outstanding | 46,732 | 1,831 | 2,401 | 879 | 41,621 | |||||||||
| Total Outstanding Commitments | $ | 448,600 | $ | 295,680 | $ | 69,096 | $ | 2,051 | $ | 81,773 | ||||
49
Critical Accounting Policies and Estimates
Our accounting policies are integral to understanding the results reported. In preparing our consolidated financial statements, we are required to make judgments and estimates that may have a significant impact upon our financial results. Certain accounting policies require us to make significant estimates and assumptions, which have a material impact on the carrying value of certain assets and liabilities, and are considered critical accounting policies. The estimates and assumptions used are based on historical experiences and other factors, which are believed to be reasonable under the circumstances. Actual results could differ significantly from these estimates and assumptions, which could have a material impact on the carrying value of assets and liabilities at the balance sheet dates and results of operations for the reporting periods.
The discussion and analysis of our financial condition and results of operations are based upon our consolidated financial statements, which have been prepared in accordance with generally accepted accounting principles in the United States of America. The preparation of these financial statements requires management to make estimates and judgments that affect the reported amounts of assets and liabilities, revenues and expenses, and related disclosures of contingent assets and liabilities at the date of our financial statements. Actual results may differ from these estimates under different assumptions or conditions.
Significant accounting policies followed by our company are presented in Note A to the consolidated financial statements. These policies, along with the disclosures presented in the other financial statement notes and in this discussion, provide information on how significant assets and liabilities are valued in the financial statements and how those values are determined. Based on the valuation techniques used and the sensitivity of financial statement amounts to the methods, assumptions, and estimates underlying those amounts, management has identified the allowance for loan losses, stock based compensation expense, SBA servicing assets, and SBA I/O strips to be the accounting areas that require the most subjective or complex judgments, and as such could be most subject to revision as new information becomes available.
ITEM 7A: QUANTITATIVE AND QUALITATIVE DISCLOSURES ABOUT MARKET RISK
We do not currently engage in trading activities or use derivative instruments to control interest rate risk, even though such activities may be permitted with the approval of our Board. We are most affected by interest rate risk. Other types of market risk, such as foreign currency exchange risk, equity price risk and commodity price risk, are not significant to us in the normal course of our business activities.
Market risk is the possible chance of loss from unfavorable changes in market prices and rates. These changes may result in a reduction of current and future period net interest income, which is the favorable spread earned from the excess of interest income on interest-earning assets over interest expense on interest-bearing liabilities.
Asset/Liability Management
Interest rate risk ("IRR") and credit risk are the two greatest sources of financial exposure for insured financial institutions. IRR represents the impact that changes in absolute and relative levels of market interest rates may have upon our net interest income ("NII"). Changes in the NII are the result of changes in the net interest spread between interest-earning assets and interest-bearing liabilities (timing risk), the relationship between various rates (basis risk), and changes in the shape of the yield curve.
We realize a significant portion of our income from the differential or spread between the interest earned on loans, investments, other interest-earning assets, and the interest incurred on deposits and borrowings. The volumes and yields on loans, deposits, and borrowings are affected by market interest rates. As of December 31, 2006, approximately 95% of our loan portfolio was tied to adjustable rate indices. The majority of the adjustable rate loans are tied to the Wall Street Journal prime rate and reprice immediately. The exception is 7(a) loans, which reprice on the first day of the subsequent quarter after a change in prime. As of December 31, 2007, approximately 74% of our deposits were time deposits with a stated maturity (generally one year or less) and a fixed rate of interest. As of December 31, 2007, 100% of our junior subordinated debt was floating rate with a remaining term of 25-30 years.
Changes in the market level of interest rates directly and immediately affect our interest spread, and therefore profitability. Sharp and significant changes to market rates can cause the interest spread to shrink or expand significantly in the near term, principally because of the timing differences between the adjustable rate loans and the maturities (and therefore repricing) of the deposits and borrowings.
50
The ongoing monitoring and management of both interest rate risk and liquidity, in the short- and long-term time horizon, is an important component of our asset/liability management process, which is governed by limits established in the policies reviewed and approved annually by our Board. We do not believe it is possible to reliably predict future interest rate movements, but instead maintain an appropriate process and set of measurement tools which enable us to identify and quantify sources of interest rate risk in varying rate environments. Our primary tool in managing interest rate risk is the effect of interest rate shocks on the net interest income.
The following shows our projected net interest income sensitivity for 2008 based on asset and liability levels using the December 31, 2007 net interest income as a starting point. For purposes of this table, there is assumed to be zero growth in loans, investments, deposits, or other components of the balance sheet. At December 31, 2007, our internal prime rate was 10.00% and Wall Street Journal prime rate was 7.25%.
| Changes in | Projected Net | Change from | % Change from | ||||
| Rates | Interest Income | Base Case | base Case | ||||
| (dollars in thousands) | |||||||
| -300 | bp | $ | 45,836 | $ | (14,264) | (23.73%) | |
| -200 | bp | 50,753 | (9,347) | (15.55%) | |||
| -100 | bp | 55,445 | (4,655) | (7.75%) | |||
| 0 | bp | 60,100 | - | 0.00% | |||
| +100 | bp | 65,659 | 5,559 | 9.25% | |||
| +200 | bp | 71,657 | 11,557 | 19.23% | |||
| +300 | bp | 77,642 | 17,542 | 29.19% | |||
In the model, a rising rate environment will increase net interest income (NII) from a flat rate environment. A lower rate environment will decrease net interest income. The analysis does not represent a forecast and should not be relied upon as being indicative of expected operating results. These hypothetical estimates are based upon various assumptions. Actual results will differ from simulated results due to timing, magnitude, and frequency of interest rate changes, as well as changes in market conditions and management strategy. While the assumptions are developed upon current economic and market conditions, we cannot make any assurances as to the predictive nature of these assumptions. Furthermore, the sensitivity analysis does not reflect actions our Board might take in responding to or anticipating changes in interest rates.
ITEM 8: FINANCIAL STATEMENTS AND SUPPLEMENTARY DATA
The financial statements of our company, including the “Report of Independent Registered Public Accounting Firm” of our independent registered public accounting firm are included in this report immediately following Part IV and incorporated in this Item 8 by this reference.
ITEM 9: CHANGES IN AND DISAGREEMENTS WITH ACCOUNTANTS ON ACCOUNTING AND FINANCIAL DISCLOSURE
None
ITEM 9A: CONTROLS AND PROCEDURES
As of December 31, 2007, we carried out an evaluation under the supervision and with the participation of our management, including our company’s chief executive officer and our company’s chief financial officer of the effectiveness and design of our “disclosure controls and procedures,” pursuant to Rule 13a-15(e) and 15d-15(e) of the Securities Exchange Act of 1934, as amended. Based upon that evaluation, our chief executive officer and chief financial officer concluded that our disclosure controls and procedures are effective as of December 31, 2007. There have been no significant changes in our internal controls that occurred during the quarter ended December 31, 2007 that has materially affected, or is reasonably likely to materially affect, our internal control over financial reporting.
Management’s Annual Report On Internal Control Over Financial Reporting
Management of our company is responsible for establishing and maintaining effective internal control over financial reporting as defined in Rules 13a-15(f). Internal control over financial reporting is a process designed to provide reasonable assurance to our company’s management and board of directors regarding the preparation and fair presentation of published financial statements in accordance with generally accepted accounting principles.
51
Because of its inherent limitations, internal control over financial reporting may not prevent or detect misstatements. Also, projections of any evaluation of effectiveness to future periods are subject to the risk that controls may become inadequate because of changes in conditions, or that the degree of compliance with the policies or procedures may deteriorate. Therefore, even those systems determined to be effective can provide only reasonable assurance with respect to financial statement preparation and presentation.
Management performed an assessment of the effectiveness of our internal control over financial reporting as of December 31, 2007 based upon criteria in Internal Control — Integrated Framework issued by the Committee of Sponsoring Organizations of the Treadway Commission (“COSO”). Based on this assessment, management believes that our company’s internal control over financial reporting was effective as of December 31, 2007.
Our company’s independent registered public accounting firm has audited our company’s internal control over financial reporting as of December 31, 2007. The report by Crowe Chizek and Company LLP appears on page 55 of this Form 10-K.
ITEM 9B: OTHER INFORMATION
None
ITEM 10: DIRECTORS, EXECUTIVE OFFICERS AND CORPORATE GOVERNANCE
The information required by this Item is incorporated by reference from our definitive Proxy Statement to be filed with the SEC pursuant to Regulation 14A within 120 days after the fiscal year covered by this Annual Report ("our Proxy Statement") under the caption “Information About Officers and Directors" and "Section 16(a) Beneficial Ownership Reporting Compliance." If our proxy statement is not filed within such 120 day period, the information will be included in an amendment to this report filed with the SEC on Form 10-K/A not later than the end of such 120 day period.
With regard to Item 406, we have adopted a Code of Business Conduct and Ethics that applies to its principal executive officer, principal financial officer and controller. The policy may be viewed at our website at www.temvalbank.com. Neither our website, nor the hyperlinks within our website are incorporated into this document.
ITEM 11: EXECUTIVE COMPENSATION
The information required by this Item is incorporated by reference from our Proxy Statement for the 2008 Annual Meeting of Shareholders under the caption "Executive Officer Compensation and Analysis" and “Director Compensation”. If our proxy statement is not filed within such 120 day period, the information will be included in an amendment to this report filed with the SEC on Form 10-K/A not later than the end of such 120 day period.
ITEM 12. SECURITY OWNERSHIP OF CERTAIN BENEFICIAL OWNERS AND MANAGEMENT AND RELATED STOCKHOLDER MATTERS
The information required by this Item is incorporated by reference our Proxy Statement for the 2008 Annual Meeting of Shareholders under the caption "Beneficial Ownership" and “Securities Authorized for Issuance Under Equity Compensation Plans”. If our proxy statement is not filed within such 120 day period, the information will be included in an amendment to this report filed with the SEC on Form 10-K/A not later than the end of such 120 day period.
ITEM 13. CERTAIN RELATIONSHIPS AND RELATED TRANSACTIONS, AND DIRECTOR INDEPENDENCE
The information required by this Item is incorporated by reference from our Proxy Statement for the 2008 Annual Meeting of Shareholders under the caption "Certain Relationships and Other Transactions." If our proxy statement is not filed within such 120 day period, the information will be included in an amendment to this report filed with the SEC on Form 10-K/A not later than the end of such 120 day period.
52
ITEM 14. PRINCIPAL ACCOUNTING FEES AND SERVICES
The information required by this Item is incorporated by reference from our Proxy Statement for the 2008 Annual Meeting of Shareholders under the caption "Independent Registered Public Accounting Firm Fees and Services." If our proxy statement is not filed within such 120 day period, the information will be included in an amendment to this report filed with the SEC on Form 10-K/A not later than the end of such 120 day period.
ITEM 15: EXHIBITS AND FINANCIAL STATEMENT SCHEDULES
(a)(1), (a)(2) and (c) Financial Statements and Financial Statement Schedules
Reference is made to the financial statements beginning at page 51 of this Form 10-K. Financial Statement Schedules have been omitted because they are not applicable, not material or because the information is included in the consolidated financial statements or the notes.
(a)(3) Exhibits
The exhibit list immediately precedes the exhibits at page 79 all of which are incorporated herein by reference.
53
Pursuant to the requirements of Section 13 or 15(d) of the Securities Exchange Act of 1934, the Company has duly caused this Annual Report to be signed on its behalf by the undersigned, thereunto duly authorized.
TEMECULA VALLEY BANCORP INC.
DATE: March 17, 2008 �� BY: /s/ Stephen H. Wacknitz
__________________________
Stephen H. Wacknitz, President/CEO,
Stephen H. Wacknitz, President/CEO,
Chairman of the Board
BY: /s/ Donald A. Pitcher
________________________
Donald A. Pitcher, Executive Vice President
Chief Financial Officer
Pursuant to the requirements of the Securities Exchange Act of 1934, this Annual Report has been signed below by the following persons on behalf of the Registrant and in the capacities and on the dates indicated.
| Signature | Title | Date |
| /s/ Steven W. Aichle | ||
| Director | March 17, 2008 | |
| Dr. Steven W. Aichle | ||
| /s/ Dr. Robert P. Beck | ||
| Director | March 17, 2008 | |
| Dr. Robert P. Beck | ||
| /s/ Neil M. Cleveland | ||
| Director | March 17, 2008 | |
| Neil M. Cleveland | ||
| /s/ George Cossolias | ||
| Director | March 17, 2008 | |
| George Cossolias | ||
| /s/ Luther J. Mohr | ||
| Director | March 17, 2008 | |
| Luther J. Mohr | ||
| /s/ Stephen H. Wacknitz | ||
| Chairman | March 17, 2008 | |
| Stephen H. Wacknitz | ||
| /s/ Richard W. Wright | ||
| Richard W. Wright | Director | March 17, 2008 |
54
Board of Directors and Shareholders of
Temecula Valley Bancorp Inc. and Subsidiary
Temecula, California
We have audited the accompanying consolidated statements of financial condition of Temecula Valley Bancorp Inc. and Subsidiary (the Company) as of December 31, 2007 and 2006, and the related consolidated statements of income, changes in shareholders' equity, and cash flows for each of the years in the three-year period ended December 31, 2007. We have also audited the Company’s Internal Control Over Financial Reporting as of December 31, 2007, based on criteria established in Internal Control-Integrated Framework issued by the Committee of Sponsoring Organizations of the Treadway Commission (COSO). The Company’s management is responsible for these financial statements, for maintaining effective internal control over financial reporting and for its assessment of the effectiveness of internal control over financial reporting in the accompanying Management’s Annual Report on Internal Control Over Financial Reporting, included in Item 9A of the accompanying Form 10-K. Our responsibility is to express an opinion on these financial statements and an opinion on the effectiveness of the Company’s internal control over financial reporting based on our audits.
We conducted our audits in accordance with the standards of the Public Company Accounting Oversight Board (United States). Those standards require that we plan and perform the audit to obtain reasonable assurance about whether the financial statements are free of material misstatement and whether effective internal control over financial reporting was maintained in all material respects. Our audits of the financial statements included examining, on a test basis, evidence supporting the amounts and disclosures in the financial statements, assessing the account principles used and significant estimates made by management, and evaluating the overall financial statement presentation. Our audit of internal control over financial reporting included obtaining an understanding of internal control over financial reporting, assessing the risk a material misstatement exists, testing and evaluating the design and operating effectiveness of internal control, based on the assessed risk. Our audits also included performing such other procedures as we considered necessary in the circumstances. We believe that our audits provide a reasonable basis for our opinions.
A company’s internal control over financial reporting is a process designed to provide reasonable assurance regarding the reliability of financial reporting and the preparation of financial statements for external purposes in accordance with generally accepted accounting principles. A company’s internal control over financial reporting includes those policies and procedures that (1) pertain to the maintenance of records that, in reasonable detail, accurately and fairly reflect the transactions and dispositions of the assets of the company; (2) provide reasonable assurance that transactions are recorded as necessary to permit preparation of financial statements in accordance with generally accepted accounting principles, and that receipts and expenditures of the company are being made only in accordance with authorizations of management and directors of the company; and (3) provide reasonable assurance regarding prevention or timely detection of unauthorized acquisition, use, or disposition of the company’s assets that could have a material effect on the financial statements.
Because of its inherent limitations, internal control over financial reporting may not prevent or detect misstatements. Also, projections of any evaluation of effectiveness to future periods are subject to the risk that controls may become inadequate because of changes in conditions, or that the degree of compliance with the policies or procedures may deteriorate.
In our opinion, the consolidated financial statements referred to above present fairly, in all material respects, the financial position of Temecula Valley Bancorp Inc. and Subsidiary as of December 31, 2007 and 2006, and the results of their operations and their cash flows for the years in the three-year period ended December 31, 2007 in conformity with accounting principles generally accepted in the United States of America. Also in our opinion, the Company maintained, in all material respects, effective internal control over financial reporting as of December 31, 2007, based on criteria established in Internal Control-Integrated Framework issued by the Committee of Sponsoring Organizations of the Treadway Commission (COSO).
Crowe Chizek and Company LLP
Oak Brook, Illinois
March 17, 2008
55
| TEMECULA VALLEY BANCORP INC. AND SUBSIDIARY | |||||
| CONSOLIDATED STATEMENTS OF FINANCIAL CONDITION | |||||
| (in thousands, except share and per share data) | |||||
| December 31, | |||||
| ASSETS | 2007 | 2006 | |||
| Cash and Due from Banks | $ | 13,210 | $ | 15,190 | |
| Federal Funds Sold | 4,220 | 18,180 | |||
| TOTAL CASH AND CASH EQUIVALENTS | 17,430 | 33,370 | |||
| Interest-bearing deposits in financial institutions | 1,000 | 99 | |||
FNMA Mortgage-backed Security HTM (fair value of $3,046 at December 31, 2007 and $1,029 at December 31, 2006) | 2,981 | 1,019 | |||
| Loans Held-for-Sale | 207,391 | 173,120 | |||
| Loans: | |||||
| Commercial | 68,761 | 59,663 | |||
| Real Estate - Construction | 481,849 | 462,562 | |||
| Real Estate - Other | 229,123 | 246,095 | |||
| SBA | 248,908 | 201,105 | |||
| Consumer and other | 3,632 | 3,684 | |||
| TOTAL LOANS HELD IN PORTFOLIO | 1,032,273 | 973,109 | |||
| Net Deferred Loan Fees | (1,947) | (3,536) | |||
| Allowance for Loan Losses | (16,022) | (12,522) | |||
| TOTAL NET LOANS HELD IN PORTFOLIO | 1,014,304 | 957,051 | |||
| Federal Home Loan Bank Stock, at Cost | 2,905 | 1,996 | |||
| Premises and Equipment | 5,271 | 5,492 | |||
| Other Real Estate Owned | - | 1,255 | |||
| Cash Surrender Value of Life Insurance | 28,034 | 24,036 | |||
| Deferred Tax Assets | 12,298 | 8,480 | |||
| SBA Servicing Assets | 5,350 | 8,288 | |||
| SBA Interest-Only Strips Receivable | 6,599 | 13,216 | |||
| Accrued Interest Receivable | 6,827 | 6,155 | |||
| Other Assets | 8,135 | 4,612 | |||
| TOTAL ASSETS | $ | 1,318,525 | $ | 1,238,189 | |
| LIABILITIES AND SHAREHOLDERS' EQUITY | |||||
| Deposits: | |||||
| Non Interest-Bearing Demand | $ | 133,867 | $ | 144,525 | |
| Money Market and NOW | 146,270 | 130,357 | |||
| Savings | 28,059 | 29,781 | |||
| Time Deposits, Under $100,000 | 453,272 | 367,029 | |||
| Time Deposits, $100,000 and Over | 399,603 | 409,809 | |||
| TOTAL DEPOSITS | 1,161,071 | 1,081,501 | |||
| Accrued Interest Payable | 2,329 | 2,094 | |||
| Junior Subordinated Debt | 34,023 | 41,240 | |||
| Dividend Payable | 405 | - | |||
| Other Liabilities | 12,738 | 10,091 | |||
| TOTAL LIABILITIES | 1,210,566 | 1,134,926 | |||
| Shareholders' Equity: | |||||
| Common Stock No Par Value; 40,000,000 Shares | |||||
| Authorized; 10,147,910 and 10,586,659 Shares Issued | |||||
| and Outstanding at December 31, 2007 and December 31, 2006 | 37,178 | 46,383 | |||
| Accumulated other comprehensive (loss) | - | (172) | |||
| Retained Earnings | 70,781 | 57,052 | |||
| TOTAL SHAREHOLDERS' EQUITY | 107,959 | 103,263 | |||
| TOTAL LIABILITIES AND SHAREHOLDERS' EQUITY | $ | 1,318,525 | $ | 1,238,189 | |
See accompanying notes to the consolidated financial statements
56
| TEMECULA VALLEY BANCORP INC. AND SUBSIDIARY | ||||||||
| CONSOLIDATED STATEMENTS OF INCOME | ||||||||
| For the Years Ended December 31, 2007, 2006, and 2005 | ||||||||
| 2007 | 2006 | 2005 | ||||||
| INTEREST INCOME | (dollars in thousands except share and per share data) | |||||||
| Loans, including fees | $ | 114,190 | $ | 93,378 | $ | 57,880 | ||
| Interest-bearing deposits in financial institutions | 31 | 3 | - | |||||
| Federal Funds Sold | 1,270 | 829 | 239 | |||||
| Investment Securities | 124 | 19 | 6 | |||||
| TOTAL INTEREST INCOME | 115,615 | 94,229 | 58,125 | |||||
| INTEREST EXPENSE | ||||||||
| Money Market and NOW | 4,492 | 2,773 | 961 | |||||
| Savings Deposits | 127 | 122 | 141 | |||||
| Time Deposits | 42,373 | 28,819 | 11,848 | |||||
| Junior Subordinated Debt Securities and Other Borrowings | 2,991 | 2,735 | 1,634 | |||||
| TOTAL INTEREST EXPENSE | 49,983 | 34,449 | 14,584 | |||||
| NET INTEREST INCOME | 65,632 | 59,780 | 43,541 | |||||
| Provision for Loan Losses | 4,600 | 3,650 | 2,897 | |||||
| NET INTEREST INCOME AFTER | ||||||||
| PROVISION FOR LOAN LOSSES | 61,032 | 56,130 | 40,644 | |||||
| NON INTEREST INCOME | ||||||||
| Service Charges and Fees | 604 | 618 | 604 | |||||
| Gain on Sale of Loans | 10,124 | 13,165 | 13,391 | |||||
Gain(Loss) on Other Assets and Other Real Estate Owned | (25) | 67 | (22) | |||||
| Servicing Income (loss) | (4,305) | (2,615) | 2,638 | |||||
| Loan Broker Income | 5,104 | 4,314 | 3,391 | |||||
| Loan Related Income | 2,720 | 2,216 | 2,392 | |||||
| Other Income | 2,166 | 1,679 | 1,428 | |||||
| TOTAL NON INTEREST INCOME | 16,388 | 19,444 | 23,822 | |||||
| NON INTEREST EXPENSE | ||||||||
| Salaries and Employee Benefits | 33,557 | 31,989 | 26,971 | |||||
| Occupancy Expenses | 3,219 | 3,035 | 2,428 | |||||
| Furniture and Equipment | 1,929 | 1,719 | 1,512 | |||||
| Data Processing | 1,381 | 1,265 | 1,127 | |||||
| Marketing and Business Promotion | 1,176 | 971 | 1,122 | |||||
| Legal and Professional | 1,387 | 1,143 | 1,055 | |||||
| Regulatory Assessments | 765 | 185 | 246 | |||||
| Travel & Entertainment | 1,075 | 1,125 | 948 | |||||
| Loan Related Expense | 3,141 | 2,367 | 2,138 | |||||
| Office Expenses | 2,640 | 2,596 | 2,677 | |||||
| Other Expenses | 1,635 | 596 | 403 | |||||
| TOTAL NON INTEREST EXPENSE | 51,905 | 46,991 | 40,627 | |||||
| INCOME BEFORE INCOME TAX EXPENSE | 25,515 | 28,583 | 23,839 | |||||
| Income Tax expense | 10,377 | 11,663 | 9,886 | |||||
| NET INCOME | $ | 15,138 | $ | 16,920 | $ | 13,953 | ||
| Per Share Data : | ||||||||
| Net Income - Basic | $1.45 | $1.83 | $1.58 | |||||
| Net Income - Diluted | $1.41 | $1.73 | $1.46 | |||||
| Cash dividend declared per common share | $0.12 | N/A | N/A | |||||
See accompanying notes to the consolidated financial statements
57
| CONSOLIDATED STATEMENTS OF CHANGES IN SHAREHOLDERS’ EQUITY | |||||||||||||||
| For the Years Ended December 31, 2007, 2006, and 2005 | |||||||||||||||
| Accumulated | |||||||||||||||
| Common | Other | ||||||||||||||
| Comprehensive | Stock | Retained | Comprehensive | ||||||||||||
| Income | Shares | & Surplus | Earnings | Income (loss) | Total | ||||||||||
| in thousands, except per share data) | |||||||||||||||
| Balance at January 1, 2005 | 8,753 | $ | 16,724 | $ | 26,179 | $ | - | $ | 42,903 | ||||||
| Exercise of Stock Options, | |||||||||||||||
Including the Realization of Tax Benefits of $40 | 145 | 916 | 916 | ||||||||||||
| Net Income | 13,953 | 13,953 | 13,953 | ||||||||||||
| Other comprehensive income(loss), net | 409 | 409 | 409 | ||||||||||||
| Total comprehensive income | $ | 14,362 | |||||||||||||
| Balance at December 31, 2005 | 8,898 | $ | 17,640 | $ | 40,132 | $ | 409 | $ | 58,181 | ||||||
| Exercise of Stock Options, | |||||||||||||||
Including the Realization of Tax Benefits of $1,379 | 288 | 2,493 | 2,493 | ||||||||||||
| Private Placement Stock Offering, net | 1,401 | 25,137 | 25,137 | ||||||||||||
| Stock-based compensation | 1,113 | 1,113 | |||||||||||||
| Net Income | 16,920 | 16,920 | 16,920 | ||||||||||||
| Other comprehensive (loss), net | (581) | (581) | (581) | ||||||||||||
| Total comprehensive income | $ | 16,339 | |||||||||||||
| Balance at December 31, 2006 | 10,587 | $ | 46,383 | $ | 57,052 | $ | (172) | $ | 103,263 | ||||||
| Exercise of Stock Options, | |||||||||||||||
Including the Realization of Tax Benefits of $1,127 | 245 | 2,050 | 2,050 | ||||||||||||
| Repurchase and retirement of common stock | (684) | (12,061) | (12,061) | ||||||||||||
| Stock-based compensation | 806 | 806 | |||||||||||||
| Adjustment for adoption of FASB 155 | (172) | 172 | - | ||||||||||||
| Cash dividends | (1,237) | (1,237) | |||||||||||||
| Net Income | 15,138 | 15,138 | |||||||||||||
| Balance at December 31, 2007 | 10,148 | $ | 37,178 | $ | 70,781 | $ | - | $ | 107,959 | ||||||
See accompanying notes to the consolidated financial statements
58
| TEMECULA VALLEY BANCORP INC. AND SUBSIDIARY | |||||||||
| CONSOLIDATED STATEMENTS OF CASH FLOWS | |||||||||
| FOR THE YEARS ENDED DECEMBER 31, 2007, 2006, and 2005 | |||||||||
| 2007 | 2006 | 2005 | |||||||
| OPERATING ACTIVITIES | (dollars in thousands) | ||||||||
| Net Income | $ | 15,138 | $ | 16,920 | $ | 13,953 | |||
| Adjustments to Reconcile Net Income to Net Cash Provided by Operating Activities: | |||||||||
| Provision for loan losses | 4,600 | 3,650 | 2,897 | ||||||
| Depreciation and amortization | 1,818 | 13,139 | 8,639 | ||||||
| Fair value adjustment on servicing assets and I/O strips receivable | 11,181 | - | - | ||||||
| Amortization of debt issuance cost | 49 | 70 | 70 | ||||||
| Net amortization of securities premiums | 74 | 10 | - | ||||||
| Net change in deferred loan origination fees | (1,589) | (1,312) | (1,145) | ||||||
| Provision for deferred taxes | (1,615) | (2,314) | (1,670) | ||||||
| Gain on sale of loans | (10,124) | (13,165) | (13,391) | ||||||
| Loans originated for sale | (190,808) | (250,846) | (209,936) | ||||||
| Proceeds from loan sales | 166,661 | 173,704 | 176,919 | ||||||
| Loss (gain) on sale of other real estate owned and fixed assets | 25 | (75) | 26 | ||||||
| Share-based compensation expense | 806 | 1,113 | - | ||||||
| Earnings on cash surrender value of life Insurance | (998) | (745) | (507) | ||||||
| Federal Home Loan Bank stock dividends | (125) | (97) | (69) | ||||||
| Net change in accrued interest, other assets and other liabilities | (6,360) | (2,532) | (1,429) | ||||||
| NET CASH USED IN OPERATING ACTIVITIES | (11,267) | (62,480) | (25,643) | ||||||
| INVESTING ACTIVITIES | |||||||||
| Purchases of held-to-maturity investments | (2,636) | (2,230) | (1,194) | ||||||
| Proceeds from maturities of held-to-maturity securities | 600 | 1,201 | 1,200 | ||||||
| Purchases of Federal Reserve and Federal Home Loan Bank stock | (784) | (45) | (652) | ||||||
| Proceeds from sale of Federal Reserve Bank stock | - | 1,245 | - | ||||||
| Net decrease (increase) in loans | (42,829) | (166,790) | (183,664) | ||||||
| Purchase of loans | (77,814) | (133,336) | - | ||||||
| Proceeds from first trust deed loan sales | 58,968 | - | - | ||||||
| Purchases of premises and equipment | (1,455) | (2,271) | (1,727) | ||||||
| Proceeds from sale of premises and equipment | 92 | 131 | 129 | ||||||
| Purchase of cash surrender value life insurance | (3,000) | (5,700) | (7,490) | ||||||
| Proceeds from sale of other real estate owned | 2,675 | 3,062 | 647 | ||||||
| NET CASH USED IN INVESTING ACTIVITIES | (66,183) | (304,733) | (192,751) | ||||||
| FINANCING ACTIVITIES | |||||||||
| Net increase in demand deposits and savings accounts | 3,533 | 19,995 | 30,908 | ||||||
| Net increase in time deposits | 76,037 | 319,074 | 176,757 | ||||||
| Net change in Federal Home Loan Bank advances | - | (30,000) | 30,000 | ||||||
| Retirement of junior subordinated debt securities | (7,217) | - | - | ||||||
| Proceeds from exercise of stock options | 923 | 1,114 | 876 | ||||||
| Proceeds from issuance of junior subordinated debt | - | 12,372 | 8,248 | ||||||
| Proceeds from private placement stock offering, net | - | 25,137 | - | ||||||
| Cash dividends on common stock | (832) | - | - | ||||||
| Repurchase and retirement of common stock | (12,061) | - | - | ||||||
| Excess tax benefits from exercise of stock options | 1,127 | 1,379 | - | ||||||
| NET CASH PROVIDED BY FINANCING ACTIVITIES | 61,510 | 349,071 | 246,789 | ||||||
| INCREASE (DECREASE) IN CASH AND CASH EQUIVALENTS | (15,940) | (18,142) | 28,395 | ||||||
| Cash and cash equivalents at beginning of year | 33,370 | 51,512 | 23,117 | ||||||
| CASH AND CASH EQUIVALENTS AT END OF YEAR | $ | 17,430 | $ | 33,370 | $ | 51,512 | |||
| Supplemental Disclosures of Cash Flow Information: | |||||||||
| Interest paid | $ | 49,748 | $ | 33,312 | $ | 14,032 | |||
| Income taxes paid, net of refunds | $ | 11,500 | $ | 9,307 | $ | 13,794 | |||
| Transfer of loans to other real estate owned | $ | 1,411 | $ | 2,131 | $ | 2,482 | |||
See accompanying notes to the consolidated financial statements
59
TEMECULA VALLEY BANCORP INC.
December 31, 2007, 2006, and 2005
NOTE A - SUMMARY OF SIGNIFICANT ACCOUNTING POLICIES
Principles of Consolidation
The consolidated financial statements include the accounts of Temecula Valley Bancorp Inc. ("company" or “our company” or “our holding company”), and its wholly-owned subsidiary, Temecula Valley Bank ("bank" or “our bank”), collectively referred to herein as the “Company”. Unless the context indicates otherwise, all references in this report to “we”, “us”, and “our” refer to our company and our bank on a consolidated basis. All significant intercompany transactions have been eliminated.
Nature of Operations
We have been organized as a single operating segment and operate eleven full-service banking offices located in Carlsbad, Corona, El Cajon, Escondido, Fallbrook, Murrieta, Ontario, Solana Beach, San Marcos, Temecula, and the Rancho Bernardo area of San Diego. We also operate loan production offices throughout the United States. Those in Encinitas, Fallbrook, and Temecula, California principally generate construction and/or mortgage loans. The loan production offices located in Corona (serving Southern California) and San Rafael (serving Northern California), California focus on construction lending. As a Nationwide Preferred Lender, we have SBA loan production offices currently operating in the following states: Arizona, California, Colorado, Florida, Indiana, Nebraska, Nevada, Ohio, Oregon, Texas, and Washington.
We closed all of our loan production offices located in the northeast and southeast areas of the country, except one in Florida, in January 2007. To date, this reorganization has resulted in cost savings greater than the income generated from the closed offices. As a result of the reorganization, we place greater emphasis and resources on generating SBA loans in the mid and western United States.
Our primary sources of revenue are providing loans to customers, who are predominately small and middle-market businesses and individuals, and originating government guaranteed loans for sale to institutional investors in the secondary market. We also generate fee income by servicing the government guaranteed loans.
Use of Estimates in the Preparation of Financial Statements
We prepare our financial statements, in conformity with U.S. generally accepted accounting principles, which requires us to make estimates and assumptions that affect the reported amounts of assets and liabilities and disclosure of contingent assets and liabilities at the date of our financial statements and the reported amounts of revenues and expenses during the reporting period. Estimates associated with the allowance for loan losses, SBA servicing assets, and SBA interest-only strips receivable are particularly susceptible to change. Actual results could differ from those estimates.
Cash Flows
For purposes of reporting cash flows, cash and cash equivalents include cash, due from banks, and federal funds sold. Generally, federal funds are sold for one day periods. Net cash flows are reported for customer loan and deposit transactions, as well as Federal Home Loan Bank advances.
Cash and Due From Banks
We maintain amounts with due from banks which at times exceed federally insured limits. We have not experienced any losses in such accounts.
Investment Securities
Debt securities, for which we have the positive intent and ability to hold to maturity, are reported at cost adjusted for premiums and discounts that are recognized in interest income, using the interest method over the period to maturity. Investments not classified as trading securities nor as held-to-maturity securities are classified as available-for-sale securities and recorded at fair value. Unrealized gains or losses on available-for-sale securities are reported as a separate component of other comprehensive income included in shareholders’ equity, net of taxes. Available-for-sale and held-to-maturity securities are assessed at each reporting date to determine whether there is an other-than-temporary impairment.
60
Impairments, if any, are required to be recognized in current earnings rather than as a separate component of shareholders’ equity. In estimating other-than-temporary losses, our management considers: the length of time and extent that fair value has been less than cost, the financial condition and near term prospects of the issuer, and our ability and intent to hold the security for a period sufficient to allow for any anticipated recovery in fair value. Realized gains or losses on sales of held-to-maturity or available-for-sale securities are recorded using the specific identification method.
At December 31, 2007, we held two FNMA mortgage-backed securities, with an amortized cost and fair value of $3.0 million, and are classified as held-to-maturity. These securities were purchased in November 2006 and July 2007 and will mature in 2036 and 2037, respectively.
Loans Held-for-Sale
SBA loans, originated and intended for sale in the secondary market, are carried at the lower of cost or estimated market value in the aggregate. Net unrealized losses are recognized through a valuation allowance by charges to income.
We are a Nationwide SBA "Preferred Lender". As a Preferred Lender we can approve a loan within the authority given to us by the SBA without prior approval from the SBA. Preferred Lenders approve, package, fund, and service SBA loans within a range of authority that is not available to other SBA lenders without the "Preferred Lender" designation.
We originate loans to customers under the SBA 7(a) program that generally provides for SBA guarantees up to 85% of each loan. We generally sell the guaranteed piece as well as a part of the unguaranteed portion of each loan. Approximately 5% of the 7(a) loans are required to stay on our books. The strategy of selling both the guaranteed and unguaranteed portion of the 7(a) loans assists us in managing our capital levels and meeting our funding needs relative to local community loan demand.
We retain the servicing on the sold guaranteed portion of 7(a) loans. Upon sale in the secondary market, the purchaser of the guaranteed portion of 7(a) loans pays a par or premium to us, which generally is between 4% and 8% of the guaranteed amount, and in the case of a sale of the unguaranteed portion, the premium is usually between 1% and 4%. For servicing we receive a fee equal to 1% to 4% of the guaranteed amount sold in the secondary market.
Loans
Loans receivable, that we have the intent and ability to hold for the foreseeable future or until maturity or payoff, are reported at their outstanding unpaid principal balances reduced by any charge-offs or allowance for loan losses and net of any deferred fees or costs on originated loans, or unamortized premiums or discounts on purchased loans. Interest income is accrued on the unpaid principal balance. Loan origination fees and certain direct origination costs are capitalized and recognized as an adjustment of the yield of the related loan.
The accrual of interest on impaired loans is discontinued when, in our opinion, the borrower may be unable to meet payments as they become due or is 90 days or more past due. When interest accrual is discontinued, all unpaid accrued interest is reversed. Interest income is subsequently recognized only to the extent cash payments are received.
Purchased Loans
We have purchased participations in the unguaranteed portions of SBA 7(a) loans based upon their payment history and other selected underwriting criteria in order to further diversify our loan portfolio portfolio. At December 31, 2007 and 2006, we had $156.0 and $120.3 million in outstanding purchased participation balances. The participations are purchased from other financial institutions that are eligible to participate in the SBA 7(a) program. The participation agreements are tri-party agreements among the selling financial institution, the SBA and us.
In September 2006, we began a wholesale SBA program. The wholesale SBA program currently plans to source its loans primarily from real estate mortgage brokers. The wholesale program primarily participates in the SBA 504 program and similar products provided by the secondary market. Our primary sources of income will be construction loan fees,
61
interest income, premiums from loan sales, and loan referral fees. The wholesale SBA program does not add any new products and uses loan referral sources that are already used by our bank. However, it will use mortgage brokers as its primary source of business, whereby our current SBA business development officers use a number of different sources.
Allowance for Loan Losses
The allowance for loan losses is a valuation allowance for probable incurred credit losses established through charges to earnings in the form of a provision for loan losses. Loan losses are charged against the allowance when we believe the uncollectibility of a loan balance is confirmed. Subsequently, recoveries are credited to the allowance.
Quarterly detailed reviews are performed to identify the risks inherent in the loan portfolio, assess the overall quality of our loan portfolio and the related provision for loan losses to be charged to expense. Our analysis considers general factors such as evaluation of collateral securing the credit, changes in lending policies and procedures, economic trends, loan volume trends, changes in lending management and staff, trends in delinquencies, nonaccruals and charge-offs, changes in loan review and Board oversight, the effects of competition, legal and regulatory requirements, and factors inherent to each loan pool. Allocations of the allowance may be made for specific loans, but the entire allowance is available for any loan that, in our judgment, should be charged-off.
A loan is considered impaired when, based on current information and events, it is probable that we will be unable to collect the scheduled payments of principal or interest when due according to the contractual terms of the loan agreement. If a loan is impaired, a portion of the allowance is allocated so that the loan is reported, net, at the present value of estimated future cash flows using the loan’s existing rate or at the fair value of collateral if repayment is expected solely from the collateral. Large groups of smaller balance homogeneous loans, such as consumer and residential real estate loans, are collectively evaluated for impairment, and accordingly, they are not separately identified for impairment disclosures.
Servicing Rights and Interest-Only Strips Receivable
Servicing rights are recognized separately when they are acquired through sales of loans. For sales of loans prior to January 1, 2007, a portion of the cost of the loan was allocated to the servicing right based on relative fair values. We adopted SFAS No. 156 on January 1, 2007, and for sales of loans beginning in 2007, servicing rights are initially recorded at fair value with the income statement effect recorded in gains on sales of loans. Fair value is based on market prices for comparable servicing contracts, when available, or alternatively, is based on a valuation model that calculates the present value of estimated future net servicing income. The valuation model incorporates assumptions that market participants would use in estimating future net servicing income, such as the cost to service, the discount rate, the custodial earnings rate, an inflation rate, ancillary income, and prepayment speeds. Our company compares the valuation model inputs and results to published industry data in order to validate the model results and assumptions.
Under the fair value measurement method, we measured servicing rights at fair value at each reporting date and reports changes in fair value of servicing rights in earnings in the period in which the changes occur, and the changes in fair value are included with Servicing Income (Loss) on the income statement. The fair values of servicing rights are subject to significant fluctuations as a result of changes in estimated and actual prepayment speeds and estimated and actual discount rates.
Prior to January 1, 2007, all servicing rights were subsequently measured using the amortization method which required servicing rights to be amortized into non-interest income in proportion to, and over the period of, the estimated future net servicing income of the underlying loans. Additionally, prior to January 1, 2007, servicing rights were evaluated for impairment based upon the fair value of the rights as compared to carrying amount. Impairment was determined by stratifying rights into groupings based on predominant risk characteristics, such as interest rate, loan type and investor type. Impairment was recognized through a valuation allowance for an individual grouping, to the extent that fair value was less than the carrying amount. If we later determined that all or a portion of the impairment no longer existed for a particular grouping, a reduction of the allowance may have been recorded as an increase to income.
Servicing fee income which is reported on the income statement as Servicing Income (Loss) is recorded for fees earned for servicing loans. The fees are based on a contractual percentage of the outstanding principal; or a fixed amount per loan and are recorded as income when earned. The amortization of servicing rights was netted against loan servicing fee income for the years ended December 31, 2006 and 2005. Servicing fees totaled $7.1, $9.1 and $10.3 million for the years ended December 31, 2007, 2006 and 2005.
In February 2006, the FASB issued Statement of Financial Accounting Standards No. 155, Accounting for Certain Hybrid Financial Instruments (SFAS No. 155), which permits fair value remeasurement for hybrid financial instruments that contain an embedded derivative that otherwise would require bifurcation. Additionally, SFAS No. 155 clarifies the accounting guidance for beneficial interests in securitizations. Under SFAS No. 155, all beneficial interests in a securitization will require an assessment in accordance with SFAS No. 133 to determine if an embedded derivative exists within the instrument. In January 2007, the FASB issued Derivatives Implementation Group Issue B40, Application of Paragraph 13(b) to
62
Securitized Interests in Prepayable Financial Assets (DIG Issue B40). DIG Issue B40 provides an exemption from the embedded derivative test of paragraph 13(b) of SFAS No. 133 for instruments that would otherwise require bifurcation if the test is met solely because of a prepayment feature included within the securitized interest and prepayment is not controlled by the security holder. SFAS No. 155 and DIG Issue B40 are effective for fiscal years beginning after September 15, 2006. The adoption of SFAS No. 155 and DIG Issue B40 resulted in a cumulative-effect adjustment increasing retained earnings by $172 thousand as of January 1, 2007.
Interest-only strips are initially recorded at fair value with changes recognized as a component of servicing income (loss). Fair value is estimated by discounting estimated future cash flows from the I/O strips using assumptions similar to those used in valuing servicing rights. Prior to January 1, 2007 the interest-only strips were accounted for as available-for-sale securities and recorded at fair value with any unrealized gains or losses recorded in accumulated other comprehensive income, net of tax.
Loan Sales Recognition
To calculate the gain (loss) on sale of loans, our company’s investment in the loan is allocated among the retained portion of the loan, the servicing retained, the interest-only strip, and the sold portion of the loan, based on the relative fair market value of each portion. The gain (loss) on the sold portion of the loan is recognized at the time of sale based on the difference between the sale proceeds and the allocated investment. As a result of the relative fair value allocation, the carrying value of the retained portion is discounted, with the discount accreted to interest income over the life of the loan.
Other Real Estate Owned
Real estate properties acquired through, or in lieu of, loan foreclosure are initially recorded at the lesser of the outstanding loan balance or the fair value at the date of foreclosure minus estimated costs to sell. Any valuation adjustments required at the time of foreclosure are charged to the allowance for loan losses. After foreclosure, the properties are carried at the lower of carrying value or fair value less estimated costs to sell. Any subsequent valuation adjustments, operating expenses or income, and gains and losses on disposition of such properties are recognized in current operations.
Premises and Equipment
Land is carried at cost. Premises and equipment are carried at cost less accumulated depreciation and amortization. Depreciation is computed using the straight-line method over the estimated useful lives, which ranges from three to ten years for furniture and fixtures and ten to thirty years for buildings. Leasehold improvements are amortized using the straight-line method over the estimated useful lives of the improvements or the remaining lease term, whichever is shorter. Expenditures for betterments or major repairs are capitalized and those for ordinary repairs and maintenance are charged to operations as incurred.
Premises and equipment are reviewed for impairment when events indicate their carrying amount may not be recoverable from future undiscounted cash flows. If impaired, the assets are recorded at fair value.
Federal Home Loan Bank (FHLB) Stock
Our bank is a member of the FHLB system. Members are required to own a certain amount of stock based on the level of borrowings and other factors, and may invest in additional amounts. FHLB stock is carried at cost, classified as a restricted security, and periodically evaluated for impairment based on ultimate recovery of par value. Both cash and stock dividends are reported as income.
Cash Surrender Value of Life insurance
We have purchased life insurance policies on certain key executives. Upon adoption of EITF 06-5, which is discussed further below, Company owned life insurance is recorded at the amount that can be realized under the insurance contract at the balance sheet date, which is the cash surrender value adjusted for other charges or other amounts due that are probable at settlement. Prior to adoption of EITF 06-5, we recorded owned life insurance at its cash surrender value.
In September 2006, the FASB Emerging Issues Task Force finalized Issue No. 06-5, Accounting for Purchases of Life Insurance - Determining the Amount That Could Be Realized in Accordance with FASB Technical Bulletin No. 85-4 (Accounting for Purchases of Life Insurance). This Issue requires that a policyholder consider contractual terms of a life insurance policy in determining the amount that could be realized under the insurance contract. It also requires that if the contract provides for a greater surrender value if all individual policies in a group are surrendered at the same time, that the surrender value be determined based on the assumption that policies will be surrendered on an individual basis. Lastly, the Issue requires disclosure when there are contractual restrictions on the Company’s ability to surrender a policy. The adoption of EITF 06-5 on January 1, 2007 had no impact on our company’s financial condition or results of operation.
63
Advertising
We expense the costs of advertising in the period incurred.
Loan Commitments and Related Financial Instruments
In the ordinary course of business, we enter into off-balance sheet financial instruments consisting of commitments to extend credit, commitments under credit card arrangements, commercial letters of credit, and standby letters of credit. Such financial instruments are recorded in our financial statements when they are funded or related fees are incurred or received.
Stock-Based Compensation
Prior to January 1, 2006, we accounted for stock-based compensation using the intrinsic value method prescribed in APB Opinion No. 25 and related Interpretations. We measured the compensation cost for stock options as the excess, if any, of the quoted market price of our stock at the date of the grant over the amount an employee must pay to acquire the stock.
Effective January 1, 2006, we adopted the modified prospective methodology of Financial Accounting Standards Board (“FASB”) SFAS No. 123R, “Share-Based Payment”. Prior to January 1, 2006, employee compensation expense under stock options was reported using the intrinsic value method; therefore, no stock-based compensation cost is reflected in net income for the year ended December 31, 2005, as all options granted had an exercise price equal to or greater than the market price of the underlying common stock at date of grant.
The following table illustrates the effect on net income and earnings per share information had we accounted for share-based compensation in accordance with SFAS No. 123, “Accounting for Stock-Based Compensation”, for the year ended December 31, 2005.
| 2005 | ||
| (dollars in thousands) | ||
| Net income, as reported | $ | 13,953 |
| Deduct: Total stock-based employee compensation expense | ||
| determined under fair value based method for all awards, | ||
| net of related tax effects | (488) | |
| Pro Forma Net Income | $ | 13,465 |
| Per Share Data: | ||
| Basic income per share, as reported | $1.58 | |
| Basic income per share, proforma | $1.52 | |
| Diluted income per share, as reported | $1.46 | |
| Diluted income per share, proforma | $1.40 | |
Income Taxes
Deferred income taxes are computed using the asset and liability method, which recognizes a liability or asset representing the tax effects, based on current tax law, of future deductible or taxable amounts attributable to events that have been recognized in our consolidated financial statements. A valuation allowance is established to reduce the deferred tax asset to the level at which it is “more likely than not” that the tax asset or benefits will be realized. Realization of tax benefits of deductible temporary differences and operating loss carryforwards depend on having sufficient taxable income of an appropriate character within the carryforward periods. We recognize interest and penalties relating to income tax matters in income tax expense.
Transfers of Financial Assets
Transfers of financial assets are accounted for as sales, when control over the assets has been relinquished. Control over transferred assets is deemed to be surrendered when the assets have been isolated from our company, the transferee obtains the right (free of conditions that constrain it from taking advantage of that right) to pledge or exchange the transferred assets, and our company does not maintain effective control over the transferred assets through an agreement to repurchase them before their maturity.
64
Employee Stock Ownership Plan (“ESOP”)
The employee stock ownership plan was adopted in 2006 and is not leveraged. Compensation expense is based on the market price of shares as they are awarded to participant accounts. There are no shares committed to be purchased by our company for allocating to the ESOP. Cash contributions are made at our company's discretion.
Earnings Per Share (EPS)
Basic EPS excludes dilution and is computed by dividing income available to common stockholders by the weighted-average number of common shares outstanding for the period. Diluted EPS reflects the potential dilution that could occur if options or other contracts to issue common stock were exercised or converted into common stock or resulted in the issuance of common stock that then shared in the earnings of our company.
Comprehensive Income
Prior to 2007, comprehensive income consists of net income and other comprehensive income. Other comprehensive income includes unrealized gains and losses on SBA servicing interest-only strips, net of tax. At December 31, 2006, the unrealized loss on the interest-only strip was $296 thousand which resulted in a reduction of $581 thousand in other comprehensive income (net of $421 thousand in deferred taxes). At December 31, 2005, the unrealized gain on the interest-only strip was $706 thousand which resulted in $409 thousand of other comprehensive income (net of $297 thousand in deferred taxes).
Loss Contingencies
Loss contingencies, including claims and legal actions arising in the ordinary course of business, are recorded as liabilities when the likelihood of loss is probable and an amount or range of loss can be reasonably estimated. We do not believe there now are such matters that will have a material effect on our financial statements.
Dividend Restrictions
Banking regulations require maintaining certain capital levels that may limit the dividends paid by our bank to our holding company or by our holding company to our shareholders.
Disclosure about Fair Value of Financial Instruments
SFAS No. 107, “Disclosures about Fair Value of Financial Instruments”, specifies the disclosure of the estimated fair value of financial instruments. Our estimated fair value amounts have been determined by us using available market information and appropriate valuation methodologies as described in a separate note. Considerable judgment is required to develop the estimates of fair value. Accordingly, the estimates are not necessarily indicative of the amounts we could have realized in a current market exchange. The use of different market assumptions and/or estimation methodologies may have a material effect on the estimated fair value amounts.
Operating Segments
While the chief decision-makers monitor the revenue streams of the various products and services, operations are managed and financial performance is evaluated on a company-wide basis. Operating segments are aggregated into one as operating results for all segments are similar. Accordingly, all of our financial service operations are considered by us to be aggregated in one reportable operating segment.
Reclassifications
Certain reclassifications were made to prior year’s presentation to conform to the current year.
Adoption of New Accounting Standards
In July 2006, the FASB issued Interpretation No. 48 (“FIN 48”) “Accounting for Uncertainty in Income Taxes: an interpretation of FASB Statement No. 109.” This interpretation clarifies the accounting for uncertainty in income taxes recognized in an entity’s financial statements in accordance with SFAS No. 109, “Accounting for Income Taxes.” FIN 48 prescribes a recognition threshold and measurement attribute for a tax position taken or expected to be taken in a tax return. Under FIN 48, an income tax position will be
65
recognized if it is more likely than not that it will be sustained upon IRS examination, based upon its technical merits. Once that status is met, the amount recorded will be the largest amount of benefit that is greater than 50 percent likely of being realized upon ultimate settlement. FIN 48 also provides guidance on derecognition, classification, interest and penalties, accounting in interim periods, disclosure, and transition. FIN 48 is effective as of the beginning of fiscal years that begin after December 15, 2006.
We have adopted FIN 48 effective January 1, 2007. There was no cumulative effect of applying the provisions of FIN 48 and there was no material effect on our provision for income taxes for the year ended December 31, 2007. The adoption of FIN 48 had no effect on our financial condition or results of operations.
Effect of Newly Issued but Not Yet Effective Accounting Standards
Under Emerging Issues Task Force (“EITF”) 06-4, “Accounting for Deferred Compensation and Postretirement Benefit Aspects of Endorsement Split Dollar Life Insurance Arrangements”, the EITF reached a consensus that requires the recognition of a liability related to the postretirement benefits covered by an endorsement split-dollar life insurance arrangement. The consensus highlights that the employer who is the policy holder has a liability for the benefit it is providing to the employee. The employer has agreed to maintain the insurance policy in force for the employee's benefit during his retirement, then the liability recognized during the employee's active service period should be based on the future cost of insurance to be incurred during the employee's retirement. Also, if the employer has agreed to provide the employee with a death benefit, then the liability for the future death benefit should be recognized under SFAS 106. It is applicable for fiscal years beginning after December 15, 2007. The adoption of this EITF did not have a significant impact on our financial condition or results of operations.
In February 2007, the FASB issued SFAS No. 159, “The Fair Value Option for Financial Assets and Financial Liabilities-Including an Amendment of FASB Statement No. 115”. SFAS 159 permits an entity to choose to measure many financial instruments and certain other items at fair value. Most of the provisions of SFAS 159 are elective; however, the amendment to SFAS 115, Accounting for Certain Investments in Debt and Equity Securities, applies to all entities with available-for-sale or trading securities. For financial instruments elected to be accounted for at fair value, an entity will report the unrealized gains and losses in earnings. SFAS 159 is effective as of the beginning of an entity’s first fiscal year that begins after November 15, 2007. The adoption of this statement did not have a material impact on our financial condition or results of operations.
In September 2006, the FASB issued SFAS No. 157, “Fair Value Measurements” which clarifies the principle that fair value should be based on the assumptions market participants would use when pricing an asset or liability and establishes a fair value hierarchy that prioritizes the information used to develop those assumptions. Under the standard, fair value measurement would be separately disclosed by level within the fair value hierarchy. SFAS 157 is effective for financial statements issued for fiscal years beginning after November 15, 2007 (January 1, 2008 for us), and interim periods within those fiscal years, with early adoption permitted. We do not expect the adoption of this standard will have a significant impact on our financial condition or results of operations.
NOTE B – LOANS
Our loan portfolio consists primarily of loans to borrowers within Temecula, California, its surrounding communities, and the surrounding communities of the other business loan centers. Although we seek to avoid concentrations of loans to a single industry or based upon a single class of collateral, real estate and real estate associated businesses are among the principal industries in our market area and, as a result, our loan and collateral portfolios are, to some degree, concentrated in those industries. We have no negative amortization loans, but do have construction loans that pay interest out of interest reserve advances. The interest reserve is funded through advances on the construction loans.
We also originated mortgage and SBA loans for sale to institutional investors. A substantial portion of our revenues are from origination of loans guaranteed by the Small Business Administration under its Section 7(a) program and sale of the guaranteed portions of those loans. Funding for the Section 7(a) program depends on annual appropriations by the U.S. Congress.
Under the SBA’s 7(a) program, loans in excess of $150 thousand up to $2 million are guaranteed 75% by the SBA. Generally, this guarantee may become invalid only if the loan does not meet the SBA underwriting, documentation, and servicing guidelines. Loans under $150 thousand are guaranteed 85% by the SBA. At December 31, 2007 and 2006, $46.4 million and $46.6 million of loans and loans held-for-sale were guaranteed under these programs.
66
NOTE C – ALLOWANCE FOR LOAN LOSSES
A summary of the changes in the allowance for loan losses as of December 31 2007, 2006, and 2005 follows:
| 2007 | 2006 | 2005 | ||||||
| (dollars in thousands) | ||||||||
| Balance at Beginning of Year | $ | 12,522 | $ | 9,039 | $ | 6,362 | ||
| Additions to the Allowance Charged to Expense | 4,600 | 3,650 | 2,897 | |||||
| Recoveries on Loans Charged Off | 236 | 214 | 320 | |||||
| 17,358 | 12,903 | 9,579 | ||||||
| Loans Charged Off | (1,336) | (381) | (540) | |||||
| $ | 16,022 | $ | 12,522 | $ | 9,039 | |||
The following is a summary of the investment in impaired and nonperforming loans, the related allowance for loan losses, and income recognized thereon as of December 31, 2007, 2006, and 2005:
| 2007 | 2006 | 2005 | ||||||
| (dollars in thousands) | ||||||||
| Recorded Investment in Nonperforming Loans | $ | 30,936 | $ | 19,124 | $ | 7,951 | ||
| Guaranteed Portion of Nonperforming Loans | (10,379) | (10,335) | (6,514) | |||||
| Net Non-Performing Loans | $ | 20,557 | $ | 8,789 | $ | 1,437 | ||
| Net impaired loans with allocated allowance for loan loss | $ | 10,067 | $ | 2,436 | $ | 825 | ||
| Related Allowance for impaired Loans | $ | 1,854 | $ | 615 | $ | 176 | ||
| Restructured loans | $ | 539 | $ | - | $ | - | ||
| Average Recorded Net Investment in Nonperforming Loans | $ | 15,325 | $ | 3,509 | $ | 2,438 | ||
| Interest Income Recognized for Cash Payments | None | None | None | |||||
| Interest Income Foregone on non-accrual loans | $ | 4, 110 | $ | 1,974 | $ | 898 | ||
| Total Loans Past-Due Ninety Days | ||||||||
| or More and Still Accruing | $ | - | $ | 140 | $ | - | ||
In addition to loans disclosed above as past due, nonaccrual and restructured as of December 31, 2007, management also identified further weaknesses in $6.3 million of already classified loans. Estimated potential losses from these potential credit weaknesses have been provided for in determining the allowance for loan losses at December 31, 2007.
NOTE D – SERVICING ASSETS AND INTEREST-ONLY STRIPS RECEIVABLE
At December 31, 2007, we were servicing approximately $374.4 million of the guaranteed portion of 7(a) loans previously sold with a weighted-average servicing and I/O rate of 1.69%. At December 31, 2006, we were servicing approximately $399.9 million of the guaranteed portion of 7(a) loans previously sold with a weighted-average servicing and I/O rate of 2.01%. At December 31, 2005, we were servicing approximately $403.3 million of the guaranteed portion of 7(a) loans previously sold with a weighted-average servicing and I/O rate of 2.46%. The cash collected from servicing is used to cover the operating expenses of servicing the portfolio. Adequate servicing compensation, in accordance with industry standards, is 40 basis points of the principal balance sold. A summary of the changes in the related servicing assets and interest-only strips receivable for the years ending December 31, 2007, 2006, and 2005, are as follows:
67
| Servicing Assets | ||||||||
| December 31, 2007 | December 31, 2006 | December 31, 2005 | ||||||
| (dollars in thousands) | ||||||||
| Balance at Beginning of Period | $ | 8,288 | $ | 8,169 | $ | 7,586 | ||
| Increase from Loan Sales | 1,557 | 2,378 | 2,598 | |||||
| Amortization Charged to Income | - | (2,259) | (2,015) | |||||
| Fair Market value adjustment | (4,495) | - | - | |||||
| Balance at End of Period | $ | 5,350 | $ | 8,288 | $ | 8,169 | ||
| Interest-Only Strips Receivable | ||||||||
| December 31, 2007 | December 31, 2006 | December 31, 2005 | ||||||
| (dollars in thousands) | ||||||||
| Balance at Beginning of Period | $ | 13,215 | $ | 22,068 | $ | 24,680 | ||
| Increase from Loan Sales | 69 | 1,377 | 2,160 | |||||
| Amortization Charged to Income | - | (9,228) | (5,478) | |||||
| Fair Market value adjustment | (6,685) | (1,002) | 706 | |||||
| Balance at End of Period | $ | 6,599 | $ | 13,215 | $ | 22,068 | ||
At December 31, 2006, we had an unrealized loss of $296 thousand, which decreased the I/O strip receivable to $13.2 million. At December 31, 2005, we had an unrealized gain of $706 thousand, which increased the I/O strip receivable to $22.1 million. The change in fair value of $1.0 million for 2006 was caused primarily by changes in the prepayment speed assumptions used in the valuation. As discussed in Note A, all fair value adjustments are recognized through income in 2007.
The servicing calculations contain certain assumptions such as expected life of the loan and the discount rate used to compute the present value of future cash flows. The exposure of the loan life assumption is if loans prepay faster than expected. The exposure to the discount rate assumption is if rates adjust severely and permanently. Such exposure can
cause a decrease in servicing income. With the assistance of quarterly external appraisals, we record the I/O Strips at fair value. The term of the underlying financial assets is predominately greater than 21 years. The table below summarizes the constant prepayment rates (“CPR”) for national SBA pools for each year following the date of origination based on their maturities at December 31, 2007 and 2006.
| SBA Pools - Constant Prepayment Rates | ||||||||||||
| Variable Rate Pools | ||||||||||||
| December 31, | ||||||||||||
| 2007 | 2006 | |||||||||||
| Issue Date | < 8 Yr Life CPR | 8-10 Yr Life CPR | 10-13 Yr Life CPR | 13-16 Yr Life CPR | 16-20 Yr Life CPR | > 20 Yr Life CPR | < 8 Yr Life CPR | 8-11 Yr Life CPR | 11-16 Yr Life CPR | 16-21 Yr Life CPR | > 21 Yr Life CPR | |
| Year 1 | 8.69 | 7.79 | 7.24 | 5.20 | 7.94 | 6.76 | 8.35 | 6.01 | 5.71 | 4.29 | 4.55 | |
| Year 2 | 17.31 | 16.35 | 14.58 | 12.79 | 13.96 | 13.27 | 14.42 | 11.66 | 10.34 | 12.65 | 10.05 | |
| Year 3 | 21.53 | 20.55 | 18.99 | 17.55 | 18.25 | 18.38 | 18.53 | 16.70 | 15.68 | 16.81 | 17.62 | |
| Year 4 | 22.13 | 21.26 | 20.91 | 19.82 | 20.98 | 22.20 | 18.91 | 17.70 | 18.99 | 19.99 | 21.78 | |
| Year 5 | 19.88 | 19.44 | 20.77 | 20.02 | 22.33 | 24.83 | 16.61 | 16.17 | 18.91 | 20.00 | 21.27 | |
| Year 6 | 15.65 | 16.03 | 19.05 | 18.57 | 22.48 | 26.41 | 14.75 | 16.20 | 18.17 | 17.68 | 20.60 | |
| Year 7 | 10.69 | 12.04 | 16.20 | 15.92 | 21.61 | 27.03 | 11.98 | 14.28 | 18.08 | 18.96 | 19.02 | |
| Year 8 | 6.10 | 8.50 | 12.72 | 12.51 | 19.92 | 26.82 | 7.20 | 11.03 | 13.05 | 14.68 | 19.30 | |
| Year 9 | 0.00 | 6.33 | 9.09 | 8.80 | 17.57 | 25.88 | 3.70 | 9.13 | 12.83 | 19.47 | 19.30 | |
| Year 10 | 0.00 | 5.93 | 5.78 | 5.25 | 14.80 | 24.35 | 1.40 | 5.20 | 12.65 | 14.25 | 20.45 | |
| Year 11+ | 0.00 | 0.00 | 3.12 | 1.61 | 7.84 | 17.93 | 0.00 | 2.30 | 11.90 | 9.90 | 22.20 | |
The value of the servicing assets would decrease $725 thousand if prepayment speeds increased 10% and the value of the servicing asset would decrease $1.3 million if prepayment speeds increased 20%.
The expected overall average life of the servicing portfolio is 3.72 years. The following schedule displays the weighted-average discount rates for each SBA pool after applying the CPRs identified above and our estimated discount rates for each SBA pool at December 31, 2007 and 2006 based on assessing each component.
68
| December 31, | ||||||
| 2007 | 2006 | |||||
Original Maturity | Disc Rate | Original Maturity | Disc Rate | |||
| < 8 | Years | 13.24% | < 8 | Years | 8.94% | |
| 8-10 | Years | 13.78% | 8-11 | Years | 8.84% | |
| 10-13 | Years | 14.07% | 11-16 | Years | 8.77% | |
| 13-16 | Years | 14.07% | 16-21 | Years | 8.72% | |
| 16-20 | Years | 13.25% | > 21 | Years | 8.73% | |
| > 20 | Years | 12.98% | ||||
The servicing assets value would decrease $275 thousand if the discount rate increased 1% and the servicing asset value would decrease $538 thousand if the discount rate increased 2%. The amount of interest retained on the sold portion of the SBA 7(a) loans does not change even though most of the underlying loans are variable rate. Since the retained interest is fixed, changes in interest rates impact the value. Therefore, when rates rise, the value declines and when rates decline the value increases.
NOTE E - PREMISES AND EQUIPMENT
A summary of premises and equipment as of December 31, 2007 and 2006 follows:
| 2007 | 2006 | ||||
| (dollars in thousands) | |||||
| Land | $ | 500 | $ | 500 | |
| Buildings and Leasehold Improvements | 2,603 | 2,294 | |||
| Autos | 1,536 | 1,560 | |||
| Furniture, Fixtures, and Equipment | 6,906 | 5,960 | |||
| 11,545 | 10,314 | ||||
| Accumulated Depreciation and Amortization | (6,274) | (4,822) | |||
| $ | 5,271 | $ | 5,492 | ||
Depreciation and amortization expense for premises and equipment was $1.6 million in 2007, $1.5 million in 2006, and $1.1 million in 2005.
We have entered into several leases for our branches and loan production offices which expire at various dates through 2014. These leases include provisions for periodic rent increases as well as payment by the lessee of certain operating expenses. Rental expense relating to these leases was $2.1 million in 2007, $1.9 million in 2006, and $1.5 million in 2005. The approximate future minimum annual payments for these leases by year are as follows:
| Year | (dollars in thousands) | |
| 2008 | $ | 1,839 |
| 2009 | 1,270 | |
| 2010 | 894 | |
| 2011 | 544 | |
| 2012 | 201 | |
| Thereafter | 216 | |
| $ | 4,964 |
The minimum rental payment shown above is given for the existing lease obligations and is not a forecast of future rental expense.
69
NOTE F - DEPOSITS
At December 31, 2007 the scheduled maturities of time deposits are as follows:
| Year | (dollars in thousands) | |
| 2008 | $ | 849,639 |
| 2009 | 2,589 | |
| 2010 | 110 | |
| 2011 | 537 | |
| $ | 852,875 | |
Our five largest depositors had approximately $75.4 million and $35.5 million on deposit (excluding brokered deposits) at December 31, 2007 and 2006, respectively. Brokered deposits were $88.2 and $47.2 million at December 31, 2007 and 2006, respectively.
NOTE G - FHLB ADVANCES AND OTHER BORROWINGS
At December 31, 2007 and 2006, there were no borrowings from the Federal Home Loan Bank (“FHLB”). We are required to pledge a certain amount of loans with the FHLB for collateralization purposes. As of December 31, 2007, loans with an outstanding balance of $124.3 million were pledged for an aggregate borrowing line of $81.1 million. As of December 31, 2006, loans with outstanding balances of $112.8 million were pledged for an aggregate borrowing line of $73.8 million.
We use FHLB borrowings to fund loan demand and to manage liquidity in light of deposit flows. Our borrowing capacity can be used to borrow under various FHLB loan programs, including adjustable and fixed-rate financing, for periods ranging from one day to 30 years, with a variety of interest rate structures available. The borrowing capacity has no commitment fees or cost, requires minimum levels of investment in FHLB stock (we receive dividend income on our investment in FHLB stock), can be withdrawn by the FHLB if there is any significant change in our financial or operating condition, and is conditional upon our compliance with certain agreements covering advances, collateral maintenance, eligibility and documentation.
We maintain federal funds lines of credit with three financial institutions in the aggregate amount of $58.0 million as of December 31, 2007. As of December 31, 2007 and 2006, no amounts were outstanding under these arrangements.
NOTE H - JUNIOR SUBORDINATED DEBT
Pursuant to rulings of the Federal Reserve Board, bank holding companies are permitted to issue long-term subordinated debt instruments that will, subject to certain conditions, qualify as and, therefore, augment capital for regulatory purposes. The Subordinated Debentures are subordinated to all of our existing and future borrowings. The Company’s Subordinated Debentures can be redeemed at par value approximately five years after the date of issuance. The Company has the ability to defer interest payments on each of the subordinated debentures from time to time for a period not to exceed five consecutive years. During the period of deferral, there are restrictions on the Company’s ability to pay dividends.
The table below summarizes the terms of each issuance of our junior subordinated debt securities at December 31, 2007 and 2006.
| Series | 2007 | 2006 | Date Issued | Rate Adjustor | Effective Rate | Maturity Date | |||||||
| (dollars in thousand) | |||||||||||||
| Temecula Valley Statutory Trust I | $ | - | $ | 7,217 | June 2002 | 3-month LIBOR +3.45% | - | 2032 | |||||
| Temecula Valley Statutory Trust II | 5,155 | 5,155 | September 2003 | 3-month LIBOR +2.95% | 8.64% | 2033 | |||||||
| Temecula Valley Statutory Trust III | 8,248 | 8,248 | September 2004 | 3-month LIBOR +2.20% | 7.13% | 2034 | |||||||
| Temecula Valley Statutory Trust IV | 8,248 | 8,248 | September 2005 | 3-month LIBOR +1.40% | 6.39% | 2035 | |||||||
| Temecula Valley Statutory Trust V | 12,372 | 12,372 | September 2006 | 3-month LIBOR +1.60% | 6.43% | 2036 | |||||||
| Total | $ | 34,023 | $ | 41,240 | |||||||||
70
We also purchased a 3% minority interest in Temecula Valley Statutory Trusts II, III, IV, and V. The balance of the equity of Temecula Valley Statutory Trusts II, III, IV, and V is comprised of mandatorily redeemable preferred securities. In accordance with FASB Interpretation (“FIN”) No. 46, “Consolidation of Variable Interest Entities, an interpretation of ARB No. 51”, we do not consolidate Temecula Valley Statutory Trusts II, III, IV, and V into our financial statements. Prior to the issuance of FIN No. 46, bank holding companies typically consolidated these entities. As of December 31, 2007, 2006, and 2005 we have included the net junior subordinated debt in our capital for regulatory capital purposes.
On June 26, 2007, we redeemed $7.2 million of junior subordinated debt of Temecula Valley Statutory Trust I. Proceeds from our common stock offering in November 2006 were used to redeem the debt. The debt had a rate of 3-month LIBOR plus 3.45%.
NOTE I – EMPLOYEE BENEFITS
During 2000, we adopted a retirement savings plan for the benefit of our employees. Contributions to the plan are determined annually by our Board of Directors. The expense for this plan was $614 thousand in 2007, $486 thousand in 2006, and $395 thousand in 2005.
We have entered into retirement benefit agreements with certain officers providing for future benefits aggregating approximately $22.4 million, payable in equal annual installments, ranging from ten years to a lifetime benefit, from the retirement dates of each participating officer. The estimated future benefits to be paid are being accrued over the period from the effective date of the agreements until the end of the contractual benefit or death of the executive. The accrued expense was $1.5 million, $654 thousand, and $723 thousand, for the years ended December 31, 2007, 2006, and 2005, respectively. As of December 31, 2007 and 2006, $4.6 million and $3.3 million has been accrued in conjunction with these agreements. Amounts paid under these agreements totaled $400 thousand in 2007 and $215 thousand in 2006. We are the beneficiary under split dollar agreements of life insurance policies that have been purchased and the net tax free earnings are used as the method of financing the benefits under the agreements.
On June 28, 2006, our Board adopted the Executive Nonqualified Excess Plan ("Executive Nonqualified Plan") and related documents. The Executive Nonqualified Plan is an unfunded, nonqualified deferred compensation plan intended to comply with the requirements of Section 409A of the Internal Revenue Code and regulations promulgated thereunder, and will apply to amounts deferred after January 1, 2005 under the Executive Nonqualified Plan. The purpose of the Executive Nonqualified Plan is to encourage selected key managerial employees to maintain their employment with us by allowing them to defer compensation. The key managerial employees eligible to participate in the Executive Nonqualified Plan are determined at the sole discretion of our Board. The plan provides for discretionary matching contributions. We have not approved any contributions.
On June 28, 2006, our Board approved the adoption of the Employee Stock Ownership Plan (“ESOP”) for the benefit of eligible employees and their beneficiaries. The ESOP is intended to constitute a stock bonus employee stock ownership plan within the meaning of Sections 4975(e)(7) and 407(d)(6) of the Employee Retirement Income Security Act of 1974. The amount to be contributed to the ESOP by our bank will be determined by our Board with such contributions principally invested in our stock. Contributions will be at the discretion of our Board. The employee benefit expense will be accrued monthly and annually transferred to the ESOP upon approval of our Board. Contributions to the ESOP plan were $150 thousand for each of the years ended December 31, 2007 and 2006. Currently, the ESOP is non-leveraged. As of December 31, 2007, the ESOP owns 19,373 shares of common stock, of
which 7,038 shares were acquired in the private placement stock offering in November 2006. Following is a brief description of the plan.
| · | To be eligible, an employee must: |
| 1. be employed on December 31 of a year |
| 2. be at least 21 years old |
| 3. complete one year of continuous service with our bank (at least 1,000 hours) |
| · | Eligible employees automatically become participants in the ESOP |
| · | Eligible employees may receive distributions from the trustee of the ESOP upon termination of employment |
| · | Vesting is over 6 years as follows: |
71
| Years of Service | Vested Percentage |
| Less than 2 years | 0% |
| 2 years | 20% |
| 3 years | 40% |
| 4 years | 60% |
| 5 years | 80% |
| 6 or more years | 100% |
NOTE J - INCOME TAXES
The provision for income taxes included in the statements of income as of the years ended December 31 consist of the following:
| December 31, | ||||||||
| 2007 | 2006 | 2005 | ||||||
| Current: | (dollars in thousands) | |||||||
| Federal | $ | 11,122 | $ | 10,917 | $ | 8,686 | ||
| State | 3,198 | 3,060 | 2,870 | |||||
| 14,320 | 13,977 | 11,556 | ||||||
| Deferred | (3,943) | (2,314) | (1,670) | |||||
| $ | 10,377 | $ | 11,663 | $ | 9,886 | |||
Deferred taxes are a result of differences between income tax accounting and generally accepted accounting principles with respect to income and expense recognition. Our principal timing differences are from loan loss provision accounting, deferred compensation plans, and depreciation differences. The provision for income taxes varies from the federal statutory rate as follows for the years ended December 31 2007, 2006, and 2005:
| December 31, | ||||||||||||||
| 2007 | 2006 | 2005 | ||||||||||||
| Amount | Percent of Pretax Income | Amount | Percent of Pretax Income | Amount | Percent of Pretax Income | |||||||||
| (dollars in thousands) | ||||||||||||||
| Federal Tax Rate | $ | 8,930 | 35.0% | $ | 10,004 | 35.0% | $ | 8,344 | 35.0% | |||||
| State Income Taxes, Net of Federal Income Tax Benefit | 1,274 | 5.0% | 1,619 | 5.6% | 1,656 | 7.0% | ||||||||
| Income from Cash Surrender Value of Life Insurance | (349) | (1.4%) | (261) | (0.9%) | (177) | (0.7%) | ||||||||
| Meals & Entertainment | 67 | 0.3% | 73 | 0.3% | 53 | 0.2% | ||||||||
| Incentive Stock Option Expense | 240 | 0.9% | 265 | 0.9% | 21 | 0.1% | ||||||||
| Other Items, Net | 215 | 0.9% | (37) | (0.1%) | (11) | (0.1%) | ||||||||
| Total | $ | 10,377 | 40.7% | $ | 11,663 | 40.8% | $ | 9,886 | 41.5% | |||||
The following is a summary of the components of the net deferred tax asset accounts recognized in the accompanying statements of financial condition:
72
| December 31, | |||||
| 2007 | 2006 | ||||
| Net Deferred Tax Assets | (dollars in thousands) | ||||
| Allowance for Loan Losses | $ | 6,737 | $ | 5,175 | |
| Deferred Compensation Plans | 2,526 | 1,675 | |||
| NQ Stock Option Expense | 201 | 150 | |||
| State Taxes | 1,007 | 974 | |||
| Reserve for Undisbursed Loans | 275 | 8 | |||
| Non-accrual Interest | 1,264 | 492 | |||
| Unrealized Loss on I/O Strip Receivable | - | 125 | |||
| Depreciation | 441 | - | |||
| Other Assets | - | 205 | |||
| 12,451 | 8,804 | ||||
| Deferred Tax Liabilities: | |||||
| Depreciation Differences | - | (74) | |||
| Other Liabilities | (153) | (250) | |||
| (153) | (324) | ||||
| Net Deferred Tax Assets | $ | 12,298 | $ | 8,480 | |
At December 31, 2007 and 2006, there was no valuation allowance recorded against the net deferred tax asset.
The Company is subject to U.S federal income tax as well as income tax of twelve states, of which, the primary tax jurisdiction is the state of California. The Company is no longer subject to examination by the Internal Revenue Service for years before 2003 and for examination from the taxing authorities of the state of California for years before 2002.
NOTE K - EARNINGS PER SHARE (EPS)
The following is a reconciliation of net income and shares outstanding to the income and number of shares used to compute EPS as of the years ended December 31, 2007, 2006, and 2005:
| December 31, | |||||||||||||||||
| 2007 | 2006 | 2005 | |||||||||||||||
| Income | Shares | Per Share Amount | Income | Shares | Per Share Amount | Income | Shares | Per Share Amount | |||||||||
| (dollars and shares in thousands, except per share amount) | |||||||||||||||||
| Net Income as Reported | $ | 15,138 | $ | 16,920 | $ | 13,953 | |||||||||||
Weighted Average Shares Outstanding During the Year | 10,411 | 9,235 | 8,846 | ||||||||||||||
| Used in Basic EPS | 15,138 | 10,411 | $ | 1.45 | 16,920 | 9,235 | $ | 1.83 | 13,953 | 8,846 | $ | 1.58 | |||||
Dilutive Effect of Stock Options and Warrants | 356 | (0.04) | 563 | (0.10) | 743 | (0.12) | |||||||||||
| Used in Dilutive EPS | $ | 15,138 | 10,767 | $ | 1.41 | $ | 16,920 | 9,798 | $ | 1.73 | $ | 13,953 | 9,589 | $ | 1.46 | ||
Stock options for 175 thousand, 55 thousand, and 51 thousand shares of common stock were not considered in computing diluted earnings per common share for 2007, 2006, and 2005, respectively, because they were anitdilutive.
NOTE L - STOCK OPTION PLAN
At December 31, 2007, we have three fixed option plans under which 4,000,000 shares of our holding company’s common stock may be issued. As of December 31, 2007, there were 180,884 shares available for grant under these plans. Following is a brief description of each plan.
| · | An incentive stock option plan for officers and employees. Under this plan we may grant options for up to 1,800,000 shares of common stock at 100% of the fair market value at the date the options are granted. |
| · | A nonqualified stock option plan for directors. Under this plan, we may grant options for up to 1,500,000 shares of common stock at 85% or greater of the fair market value at the date the options are granted. |
| · | An incentive/nonqualified stock option plan for directors, officers and employees. Under this plan we may grant options for up to 700,000 shares of common stock at 100% of the fair market value for incentive stock options and 85% or greater of the fair market value for non qualified stock options as of the grant date. |
Options have a maximum ten-year life from the grant date and, with respect to incentive options, generally vest and become exercisable over three years after the date of grant. Non qualified options generally vest immediately.
73
The grant-date fair value of employee share options and similar instruments is estimated using option-pricing models adjusted for unique characteristics of those instruments (unless observable market prices for the same or similar instruments are available). If an equity award is modified after the grant date, incremental compensation cost will be recognized in an amount equal to the excess of the fair value of the modified award over the fair value of the original award immediately before the modification.
The weighted-average grant-date fair value of options granted during 2007 was $6.10. The weighted-average grant-date fair value of options granted during 2006 was $7.06. The weighted-average grant-date fair value of options granted during 2005 was $5.90. The fair value of each option granted was estimated on the date of grant using the Black-Scholes option-pricing model with the following weighted-average assumptions:
| December 31, | |||||
| 2007 | 2006 | 2005 | |||
| Expected life (years) | 4 | 4 | 5 | ||
| Risk-free interest rate | 4.76% | 4.39% | 4.36% | ||
| Weighted Average Expected Volatility | 36.72% | 29.29% | 24.30% | ||
| Expected annual dividends | none | none | none | ||
The expected life of the options represents the period of time that options granted are expected to be outstanding based primarily on the historical exercise behavior attributable to previous option grants. The risk free interest rate is based on a rate comparable with the expected life of the option. The expected volatility is determined based on the historical daily volatility of our stock price over a period equal to the expected life of the option. A summary of stock option activity as of December 31, 2007, is presented below:
| Stock Options | Weighted Average Exercise Price | Aggregate Intrinsic Value | Weighted Average Remaining Contractual Life | ||||||
| Outstanding as of 01/01/2007 | 1,415,398 | $ | 9.38 | ||||||
| Granted | 76,700 | $ | 17.09 | ||||||
| Exercised | (245,351) | $ | 3.76 | ||||||
| Forfeited, expired or cancelled | (69,334) | $ | 18.76 | ||||||
| Outstanding as of 12/31/2007 | 1,177,413 | $ | 10.49 | $ | 4,556,495 | 2.98 | |||
| Vested or expected to vest | 1,168,085 | $ | 10.45 | $ | 4,556,495 | 2.98 | |||
| Shares exercisable as of 12/31/2007 | 990,856 | $ | 8.89 | $ | 4,556,495 | 2.98 | |||
Tax benefits recognized in income tax expense relative to the vesting of nonqualified stock options were $51 thousand and $150 thousand in 2007 and 2006, respectively. No tax benefit is recognized for incentive stock options. SFAS No. 123R requires that an estimate of forfeitures be made when the awards are granted and thereafter updated if information becomes available indicating that actual forfeitures will differ. Based on historical information, the average annual forfeiture rate used for awards granted during 2007 was 3.18%. The total intrinsic value of options exercised during 2007, 2006, and 2005 was $3.5 million, $5.2 million, and $1.9 million, respectively. The intrinsic value equals the difference between the exercise price and the market price on the date of measurement. Options outstanding at December 31, 2007, that subsequently vest will result in net compensation costs of approximately $451 thousand in 2008, $208 thousand in 2009, and $88 thousand in 2010.
NOTE M – LOAN COMMITMENTS AND RELATED FINANCIAL INSTRUMENTS
In the normal course of business, we enter into financial commitments to meet the financing needs of our customers. These financial commitments include commitments to extend credit and standby letters of credit. Those instruments involve, to varying degrees, elements of credit and interest rate risk not recognized in the statement of financial condition.
Commitments to extend credit are agreements to lend to a customer as long as there is no violation of any condition established in the contract. Standby letters of credit are conditional commitments to guarantee the performance of our customer to a third party. Since many of the commitments and standby letters of credit are expected to expire without being
74
drawn upon, the total amounts do not necessarily represent future cash requirements. We evaluate each customer's credit worthiness on a case-by-case basis. The amount of collateral obtained, if deemed necessary by us, is based on our credit evaluation of the customer.
Our exposure to loan loss in the event of nonperformance on commitments to extend credit and standby letters of credit is represented by the contractual amount of those instruments. We use the same credit policies in making commitments as we do for loans reflected in our financial statements. As of December 31, 2007 and 2006, we had the following outstanding financial commitments whose contractual amount represents credit risk:
| December 31, 2007 | December 31, 2006 | ||||||||||||||||
| Fixed | Variable | Total | Fixed | Variable | Total | ||||||||||||
| (dollars in thousands) | |||||||||||||||||
| Commitments to Extend Credit | $ | 10,843 | $ | 437,994 | $ | 448,837 | $ | 3,331 | $ | 395,023 | $ | 398,354 | |||||
| Letters of Credit | - | 11,447 | 11,447 | - | 3,514 | 3,514 | |||||||||||
| Loan Commitments Outstanding | $ | 10,843 | $ | 449,441 | $ | 460,284 | $ | 3,331 | $ | 398,537 | $ | 401,868 | |||||
The fixed rate loan commitments have interest rates ranging from 3.49% to 21.00% as of December 31, 2007 and 6.12% to 11.25% as of December 31, 2006.
We are involved in various litigations which have arisen in the ordinary course of our business. In the opinion of our management, the disposition of such pending litigation will not have a material effect on our financial statements.
NOTE N - FAIR VALUE OF FINANCIAL INSTRUMENTS
The fair value of a financial instrument is the amount at which the asset or obligation could be exchanged in a current transaction between willing parties, other than in a forced or liquidation sale. Fair value estimates are made at a specific point in time based on relevant market information and information about the financial instrument. These estimates do not reflect any premium or discount that could result from offering for sale at one time the entire holdings of a particular financial instrument. Because no market value exists for a significant portion of the financial instruments, fair value estimates are based on judgments regarding future expected loss experience, current economic conditions, risk characteristics of various financial instruments, and other factors. These estimates are subjective in nature, involve uncertainties and matters of judgment and, therefore, cannot be determined with precision. Changes in assumptions could significantly affect the estimates.
Fair value estimates are based on financial instruments both on and off the balance sheet without attempting to estimate the value of anticipated future business and the value of assets and liabilities that are not considered financial instruments. Additionally, tax consequences related to the realization of the unrealized gains and losses can have a potential effect on fair value estimates and have not been considered in many of the estimates. The following methods and assumptions were used to estimate the fair value of significant financial instruments:
Financial Assets
The carrying amounts of cash, interest-bearing deposits with other financial institutions, federal funds sold, FRB and FHLB stock, and accrued interest are considered to approximate fair value. The fair value of loans are estimated using a combination of techniques, including discounting estimated future cash flows and quoted market prices of similar instruments where available. Security fair values are based on market prices or dealer quotes.
Servicing Assets and Interest-Only Strips Receivable
Fair value is based on an independent appraisal using a method that discounts estimated future cash flows from the servicing assets using discount rates that approximate current market rates over the expected lives of the loans being serviced.
Financial Liabilities
The carrying amounts of deposit liabilities payable on demand, FHLB advances, accrued interest, and junior subordinated debt securities are considered to approximate fair value. For fixed maturity deposits, fair value is estimated by discounting estimated future cash flows using currently offered rates for deposits of similar remaining maturities.
75
Off-Balance Sheet Financial Instruments
The fair value of commitments to extend credit and standby letters of credit is estimated using the fees currently charged to enter into similar agreements. The fair value of these financial instruments is not material.
The estimated fair value of financial instruments at December 31, 2007, and 2006 is summarized as follows:
| 2007 | 2006 | ||||||||||
| Financial Assets: | Carrying Value | Fair Value | Carrying Value | Fair Value | |||||||
| (dollars in thousands) | |||||||||||
| Cash and Due From Banks | $ | 13,210 | $ | 13,210 | $ | 15,190 | $ | 15,190 | |||
| Interest-bearing deposits with other Financial Institutions | 1,000 | 1,000 | 99 | 99 | |||||||
| Federal Funds Sold | 4,220 | 4,220 | 18,180 | 18,180 | |||||||
| FNMA MBS (held-to-maturity) | 2,981 | 3,046 | 1,019 | 1,029 | |||||||
| Loans Held-for-Sale | 207,391 | 207,391 | 173,120 | 173,120 | |||||||
| Loans, net | 1,014,304 | 1,013,102 | 957,051 | 952,565 | |||||||
| Federal Reserve and FHLB Stock | 2,905 | 2,905 | 1,996 | 1,996 | |||||||
| I/O Strips Receivable and Servicing Assets | 11,949 | 11,949 | 21,503 | 21,503 | |||||||
| Accrued Interest Receivable | 6,827 | 6,827 | 6,155 | 6,155 | |||||||
| Financial Liabilities: | |||||||||||
| Deposits | 1,161,071 | 1,161,175 | 1,081,501 | 1,081,598 | |||||||
| FHLB Advances | 0 | 0 | 0 | 0 | |||||||
| Junior Subordinated Debt | 34,023 | 34,023 | 41,240 | 41,240 | |||||||
| Accrued Interest Payable | 2,329 | 2,329 | 2,094 | 2,094 | |||||||
NOTE O - REGULATORY MATTERS
Our company and our bank are subject to various regulatory capital requirements administered by the federal banking agencies. Failure to meet minimum capital requirements can initiate certain mandatory and possibly additional discretionary actions by regulators that, if undertaken, could have a direct material effect on our bank's financial statements. Under capital adequacy guidelines and the regulatory framework for prompt corrective action, our bank must meet specific capital guidelines that involve quantitative measures of our bank's assets, liabilities, and certain off-balance sheet items as calculated under regulatory accounting practices. Our bank's capital amounts and classification are also subject to qualitative judgments by the regulators about components, risk weightings, and other factors. For capital adequacy purposes, our company and our bank must maintain total capital to risk-weighted assets and Tier 1 capital to risk-weighted assets of 8.0% and 4.0%, respectively.
Quantitative measures established by regulation to ensure capital adequacy require our company and our bank to maintain minimum amounts and ratios (set forth in the tables below) of total and Tier 1 capital (as defined in the regulations) to risk-weighted assets (as defined), and of Tier 1 capital (as defined) to average assets (as defined). Management believes, as of December 31, 2007, that both our company and our bank have met all capital adequacy requirements to which they are subject. The following table sets forth our company’s actual capital amounts and ratios:
| Amount of Capital Required | |||||||||
| Temecula Valley Bancorp | For Capital Adequacy Purposes | ||||||||
| Amount | Ratio | Amount | Ratio | ||||||
| As of December 31, 2007: | |||||||||
| Total Risk-Based Capital (to Risk-Weighted Assets) | $ | 157,101 | 10.80% | $ | 116,380 | 8.00% | |||
| Tier 1 Risk-Based Capital (to Risk-Weighted Assets) | $ | 140,424 | 9.65% | $ | 58,190 | 4.00% | |||
| Tier 1 Leverage Ratio (to Average Assets) | $ | 140,424 | 10.63% | $ | 52,844 | 4.00% | |||
| As of December 31, 2006: | |||||||||
| Total Risk-Based Capital (to Risk-Weighted Assets) | $ | 154,976 | 11.90% | $ | 104,195 | 8.00% | |||
| Tier 1 Risk-Based Capital (to Risk-Weighted Assets) | $ | 136,579 | 10.49% | $ | 52,097 | 4.00% | |||
| Tier 1 Leverage Ratio (to Average Assets) | $ | 136,579 | 11.42% | $ | 47,881 | 4.00% | |||
76
As of December 31, 2007, the most recent notification from the regulators categorized our bank as well capitalized under the regulatory framework for prompt corrective action (there are no conditions or events since that notification that management believes have changed our bank's category). To be categorized as well capitalized, our bank must maintain minimum ratios as set forth in the table below. The following table sets forth our bank's actual capital amounts and ratios:
| Amount of Capital Required | ||||||||||||||
| Temecula Valley Bank | For Capital Adequacy Purposes | To Be Well Capitalized Under Prompt Corrective Provisions | ||||||||||||
| Amount | Ratio | Amount | Ratio | Amount | Ratio | |||||||||
| As of December 31, 2007: | ||||||||||||||
| Total Risk-Based Capital (to Risk-Weighted Assets) | $ | 154,912 | 10.66% | $ | 116,290 | 8.00% | $ | 145,362 | 10.00% | |||||
| Tier 1 Risk-Based Capital (to Risk-Weighted Assets) | $ | 138,235 | 9.51% | $ | 58,145 | 4.00% | $ | 87,217 | 6.00% | |||||
| Tier 1 Leverage Ratio (to Average Assets) | $ | 138,235 | 10.48% | $ | 52,805 | 4.00% | $ | 66,006 | 5.00% | |||||
| As of December 31, 2006: | ||||||||||||||
| Total Risk-Based Capital (to Risk-Weighted Assets) | $ | 145,702 | 11.20% | $ | 104,090 | 8.00% | $ | 130,113 | 10.00% | |||||
| Tier 1 Risk-Based Capital (to Risk-Weighted Assets) | $ | 133,160 | 10.23% | $ | 52,045 | 4.00% | $ | 78,068 | 6.00% | |||||
| Tier 1 Leverage Ratio (to Average Assets) | $ | 133,160 | 11.16% | $ | 47,773 | 4.00% | $ | 59,716 | 5.00% | |||||
Our bank is restricted as to the amount of dividends that can be paid to our holding company. Dividends declared by banks that exceed the net income (as defined) for the current year plus retained net income for the preceding two years must be approved by the regulators. Our bank may not pay dividends that would result in its capital levels being reduced below the minimum requirements shown above. As of December 31, 2007, our bank is authorized to pay $37.5 under these requirements.
NOTE P – CONDENSED FINANCIAL INFORMATION OF PARENT COMPANY ONLY
Temecula Valley Bancorp Inc. operates Temecula Valley Bank. Temecula Valley Bancorp Inc. commenced operations during 2002. The earnings of the subsidiary are recognized on the equity method of accounting. Condensed financial statements of our parent company only are presented below:
| CONDENSED STATEMENTS OF FINANCIAL CONDITION | |||||
| Year Ended December 31, | |||||
| 2007 | 2006 | ||||
| ASSETS: | (dollars in thousands) | ||||
| Cash | $ | 2,616 | $ | 9,322 | |
| Investment in Temecula Valley Statutory Trust I | - | 217 | |||
| Investment in Temecula Valley Statutory Trust II | 155 | 155 | |||
| Investment in Temecula Valley Statutory Trust III | 248 | 248 | |||
| Investment in Temecula Valley Statutory Trust IV | 248 | 248 | |||
| Investment in Temecula Valley Statutory Trust V | 372 | 372 | |||
| Investment in Temecula Valley Bank | 138,771 | 133,989 | |||
| Other Assets | 101 | 68 | |||
| $ | 142,511 | $ | 144,619 | ||
| LIABILITIES AND SHAREHOLDERS' EQUITY: | |||||
| Other Liabilities | $ | 529 | $ | 116 | |
| Junior Subordinated Debt | 34,023 | 41,240 | |||
| Shareholders' Equity | 107,959 | 103,263 | |||
| $ | 142,511 | $ | 144,619 | ||
77
| CONDENSED STATEMENTS OF INCOME | ||||||||
| Year Ended December 31, | ||||||||
| 2007 | 2006 | 2005 | ||||||
| INCOME: | (dollars in thousands) | |||||||
| Dividends from Subsidiary Bank | $ | 13,000 | $ | - | $ | - | ||
| Cash Dividends from Statutory Trusts | 85 | 73 | 41 | |||||
| TOTAL INCOME | 13,085 | 73 | 41 | |||||
| EXPENSES: | ||||||||
| Interest on Junior Subordinated Debt | 2,847 | 2,423 | 1,450 | |||||
| Other | 407 | 288 | 513 | |||||
| Income Tax Benefit | (1,333) | (1,109) | (808) | |||||
| 1,921 | 1,602 | 1,155 | ||||||
| INCOME (LOSS) BEFORE EQUITY IN UNDISTRIBUTED INCOME OF SUBSIDIARY | 11,164 | (1,529) | (1,114) | |||||
| EQUITY IN UNDISTRIBUTED INCOME OF SUBSIDIARY | 3,974 | 18,449 | 15,067 | |||||
| NET INCOME | $ | 15,138 | $ | 16,920 | $ | 13,953 | ||
| CONDENSED STATEMENTS OF CASH FLOWS | Year Ended December 31, | |||||||
| 2007 | 2006 | 2005 | ||||||
| CASH FLOWS FROM OPERATING ACTIVITIES: | (dollars in thousands) | |||||||
| Net income | $ | 15,138 | $ | 16,920 | $ | 13,953 | ||
| Noncash items included in net income: | ||||||||
| Equity in income of Subsidiary | (3,974) | (18,449) | (15,067) | |||||
| Other | 1,317 | 871 | (8) | |||||
| NET CASH PROVIDED BY(USED) IN OPERATING ACTIVITIES | 12,481 | (658) | (1,122) | |||||
| CASH FLOWS FROM INVESTING ACTIVITIES: | ||||||||
| Investment in Subsidiaries | - | (30,700) | (7,000) | |||||
| NET CASH USED BY INVESTING ACTIVITIES | - | (30,700) | (7,000) | |||||
| CASH FLOWS FROM FINANCING ACTIVITIES: | ||||||||
| Proceeds from Junior Subordinated Debt Securities | - | 12,372 | 8,248 | |||||
| Retirement of Junior Subordinated Debt Securities | (7,217) | - | - | |||||
| Repurchase and retirement of common stock | (12,061) | - | - | |||||
| Proceeds from exercise of stock options | 923 | 1,114 | 876 | |||||
| Cash dividends on common stock | (832) | - | - | |||||
| Proceeds from private placement stock offering, net | - | 25,137 | - | |||||
| NET CASH PROVIDED BY FINANCING ACTIVITIES | (19,187) | 38,623 | 9,124 | |||||
| NET INCREASE IN CASH AND CASH EQUIVALENTS | (6,706) | 7,265 | 1,002 | |||||
| CASH AND CASH EQUIVALENTS AT BEGINNING OF YEAR | 9,322 | 2,057 | 1,055 | |||||
| CASH AND CASH EQUIVALENTS AT END OF YEAR | $ | 2,616 | $ | 9,322 | $ | 2,057 | ||
NOTE Q – SUBSEQUENT EVENT
On January 17, 2008, our bank issued 2,213,750 shares of junior subordinated debt securities in a public offering. Net proceeds of the offering were $20.9 million. The proceeds of the offering will be used to fund the growth to our bank and possibly to repurchase our common stock.
78
The following documents are included or incorporated by reference in this report on Form 10-K:
| EXHIBIT NO. | |
| 2.(i) | Temecula Valley Bank and Temecula Valley Bancorp Amended and Restated Plan of Reorganization dated as of April 2, 2002 (included as an exhibit to Temecula Valley Bancorp’s Form 8-A12G, filed on June 3, 2002 and incorporated herein by reference) |
| 2.(ii) | Agreement and Plan of Merger of Temecula Merger Corporation and Temecula Valley Bancorp (included as an exhibit to Temecula Valley Bancorp’s Definitive Proxy Statement on Schedule 14A, filed November 20, 2003 and incorporated herein by reference) |
| 3.(i) | Articles of Incorporation of Temecula Valley Bancorp (included as an exhibit to Temecula Valley Bancorp’s Definitive Proxy Statement on Schedule 14A, filed November 20, 2003 and incorporated herein by reference) |
| 3.(ii) | Amended and Restated Bylaws of Temecula Valley Bancorp (included as an exhibit to Temecula Valley Bancorp’s Form 8-K, filed on June 28, 2007 and incorporated herein by reference) |
| 4.1 | Common Stock Certificate of Temecula Valley Bancorp (included as an exhibit to Temecula Valley Bancorp’s Form 10-Q, filed on May 17, 2004 and incorporated herein by reference) |
| 4.2 | Indenture between Temecula Valley Bancorp and Wilmington Trust Company dated January 17, 2008 * |
| 4.3 | Indenture between Temecula Valley Bancorp and U S Bank National Association dated September 17, 2003 * |
| 4.4 | Indenture between Temecula Valley Bancorp and Wilmington Trust Company dated September 20, 2004 * |
| 4.5 | Indenture between Temecula Valley Bancorp and Wilmington Trust Company dated September 29, 2005 (included as an exhibit to Temecula Valley Bancorp’s Form 10-Q, filed on November 14, 2005 and incorporated herein by reference) |
| 4.6 | Indenture between Temecula Valley Bancorp and Wilmington Trust Company dated September 27, 2006 (included as an exhibit to Temecula Valley Bancorp’s Form 8-K, filed on October 3, 2006 and incorporated herein by reference) |
| 10.1 | Temecula Valley Bank, N.A. Lease Agreement for Main Office (included as an exhibit to Temecula Valley Bancorp’s Form 10-K/SB, filed on March 11, 2003 and incorporated herein by reference) |
| 10.2 | Stephen H. Wacknitz Employment Agreement effective May 1, 2007 (included as an exhibit to Temecula Valley Bancorp’s Form 10-Q , filed on August 8, 2007 and incorporated by reference) # |
| 10.4 | First Amendment dated March 10, 2008 to Donald A. Pitcher Employment Agreement * # |
| 10.5 | Description of executive officer compensation (included with Temecula Valley Bancorp’s Form 8-K, filed on December 27, 2006 and incorporated herein by reference) # |
| 10.6 | 401(k) (included with Temecula Valley Bancorp’s Form 10 K/SB, filed on April 16, 2004 and incorporated herein by reference) # |
| 10.7 | First Amendment dated March 10, 2008 to Frank Basirico, Jr. Employment Agreement * # |
| 10.8 | Amended and Restated Declaration of Trust among Wilmington Trust Company, Temecula Valley Bancorp and Administrators dated September 20, 2004 * |
| 10.9 | James W. Andrews Employment Agreement dated June 1, 2002 (included in Temecula Valley Bancorp’s Form 10-K/SB, filed on April 11, 2003 and incorporated herein by reference) # |
79
| 10.10 | 1996 Incentive and Non Qualified Stock Option Plan (Employees), as amended by that certain First Amendment effective May 15, 2001 and that certain Second Amendment effective May 15, 2002 (included in Temecula Valley Bancorp's 10-K/SB, filed on April 11, 2003 and iincorporated herein by reference)# |
| 10.11(a) | Form of ISO Stock Option Agreement for Employee Plan (included in Temecula Valley Bancorp’s Form 10-K, filed on March 31, 2005 and incorporated herein by reference) # |
| 10.11(b) | Form of ISO Stock Option Agreement for Employee Plan with Acceleration Provisions (included in Temecula Valley Bancorp’s Form 10-K, filed on March 31, 2006 and incorporated herein by reference) # |
| 10.11 | 1997 Non Qualified Stock Option Plan (Directors), as amended by that certain First Amendment effective May 15, 2001 and that certain Second Amendment effective May 15, 2002 (“Director Plan”) (included in Temecula Valley Bancorp's 10-K/SB, filed on April 11, 2003 and iincorporated herein by reference)# |
| 10.12(a) | Form of NSO Stock Option Agreement for Director Plan (included in Temecula Valley Bancorp’s Form 10-K, filed on March 31, 2005 and incorporated herein by reference) # |
| 10.12 | Amended and Restated Salary Continuation Agreement between Temecula Valley Bank and Stephen H. Wacknitz dated September 30, 2004 (included in Temecula Valley Bancorp’s Form 10-Q/A, filed on November 18, 2004 and incororated herein by reference)# |
| 10.13 | Amended and Restated Salary Continuation Agreement between Temecula Valley Bank and Luther J. Mohr dated January 28, 2004 (included in Temecula Valley Bancorp’s Form 10-Q/A, filed on November 18, 2004 and incorporated herein by reference)# |
| 10.14 | Temecula Valley Bank Employee Stock Ownership Plan effective as of January 1, 2006 (included in Temecula Valley Bancorp’s Form 10-Q, filed on August 8, 2006 and incorporated herein by reference) # |
| 10.15 | The Executive Nonqualified Plan (included in Temecula Valley Bancorp’s Form 10-Q, filed on August 8, 2006 and incorporated herein by reference) # |
| 10.16 | Amendment to the Temecula Valley Bank Executive Supplemental Compensation Agreement between Temecula Valley Bank and Martin Plourd dated December 31, 2007*# |
| 10.17 | Amendment to the Split Dollar Agreement between Temecula Valley Bank and Martin Plourd dated December 31, 2007*# |
| 10.17(a) | Temecula Valley Bancorp Inc. 2004 Stock Incentive Plan, as amended ("Stock Incentive Plan") (included in Temecula Valley Bancorp’s Form 10-Q, filed on August 20, 2004 and incorporated herein by reference) # |
| 10.17(b) | Form of NSO Stock Option Agreement for Stock Incentive Plan (included in Temecula Valley Bancorp’s Form 10-K, filed on March 31, 2005 and incorporated herein by reference) # |
| 10.17(c) | Form of ISO Stock Option Agreement for Stock Incentive Plan (included in Temecula Valley Bancorp’s Form 10-K, filed on March 31, 2005 and incorporated herein by reference) # |
| 10.17(d) | Form of ISO Stock Option Agreement for Stock Incentive Plan with Acceleration Provisions (included in Temecula Valley Bancorp’s Form 10-K, filed on March 31, 2006 and incorporated herein by reference) # |
| 10.18 | Executive Deferred Compensation Agreement between Temecula Valley Bank and Stephen H. Wacknitz dated September 30, 2004 (included in Temecula Valley Bancorp’s Form 10-Q/A, filed on November 18, 2004 and incorporated herein by reference)# |
| 10.19 | Salary Continuation Agreement between Temecula Valley Bank and Stephen H. Wacknitz dated January 28, 2004 (included in Temecula Valley Bancorp’s Form 10-Q/A, filed on November 18, 2004 and incorporated herein by reference)# |
80
| 10.20 | Amended and Restated Salary Continuation Agreement between Temecula Valley Bank and Scott J. Word entered into December 29, 2006 (included in Temecula Valley Bancorp’s Form 10-K, filed on March 14, 2007 and incorporated herein by reference)# |
| 10.21 | Amendment to the Executive Supplemental Compensation Agreement between Temecula Valley Bank and Jim Andrews dated December 31, 2007*# |
| 10.22 | Split Dollar Agreement between Temecula Valley Bank and Luther J. Mohr dated September 30, 2004 (included in Temecula Valley Bancorp’s Form 10-Q/A, filed on November 18, 2004 and incorporated herein by reference) # |
| 10.22(a) | First Amendment dated December 31, 2005 to Split Dollar Agreement between Temecula Valley Bank and Luther J. Mohr dated September 30, 2004 (included in Temecula Valley Bancorp’s Form 10-K, filed on March 31, 2006 and incorporated herein by reference)# |
| 10.23 | Split Dollar Agreement between Temecula Valley Bank and Stephen H. Wacknitz dated September 30, 2004, (included in Temecula Valley Bancorp’s Form 10-Q/A, filed on November 18, 2004 and incorporated herein by reference)# |
| 10.23(a) | Split Dollar Agreement between Temecula Valley Bank and Stephen H. Wacknitz executed November 2005 with an effective date of August 1, 2005 (included in Temecula Valley Bancorp’s Form 10-K, filed on March 31, 2006 and incorporated herein by reference)# |
| 10.23(b) | First Amendment dated December 31, 2005 of Split Dollar Agreement between Temecula Valley Bank and Stephen H. Wacknitz dated September 30, 2004 (included in Temecula Valley Bancorp’s Form 10-K, filed on March 31, 2006 and incorporated herein by reference)# |
| 10.23(c) | First Amendment dated December 31, 2005 of Split Dollar Agreement between Temecula Valley Bank and Stephen H. Wacknitz dated August 1, 2005 (included in Temecula Valley Bancorp’s Form 10-K, filed on March 31, 2006 and incorporated herein by reference)# |
| 10.24 | Amended and Restated Split Dollar Agreement between Temecula Valley Bank and Scott J. Word entered into December 29, 2006 (included in Temecula Valley Bancorp’s Form 10-K, filed on March 14, 2007 and incorporated herein by reference)# |
| 10.25 | Donald A. Pitcher Employment Agreement dated December 4, 2006 (included in Temecula Valley Bancorp’s Form 8-K, filed on December 5, 2006 and incorporated herein by reference) # |
| 10.26 | Bonus Pool Arrangement/Executive Officer Compensation and Duties Title disclosure (included in Temecula Valley Bancorp’s Form 8-K filed on July 27, 2007 and incorporated herein by reference) # |
| 10.27 | Amended and Restated Salary Continuation Agreement between Temecula Valley Bank and Thomas M. Shepherd entered into December 29, 2006 (included in Temecula Valley Bancorp’s Form 10-K, filed on March 31, 2005 and incorporated herein by reference)# |
| 10.28 | Amended and Restated Split Dollar Agreement between Temecula Valley Bank and Thomas M. Shepherd entered into December 29, 2006 (included in Temecula Valley Bancorp’s Form 10-K, filed on March 14, 2007 and incorporated herein by reference)# |
| 10.29 | Amended and Restated Salary Continuation Agreement between Temecula Valley Bank and Donald A. Pitcher entered into December 29, 2006 (included in Temecula Valley Bancorp’s Form 10-K, filed on March 14, 2007 and incorporated herein by reference)# |
| 10.30 | Amended and Restated Split Dollar Agreement between Temecula Valley Bank and Donald A. Pitcher entered into December 29, 2006 (included in Temecula Valley Bancorp’s Form 10-K, filed on March 14, 2007 and incorporated herein by reference)# |
| 10.31 | William H. McGaughey Employment Agreement dated January 4, 2005 (included in Temecula Valley Bancorp’s Form 10-K, filed on March 31, 2005 and incorporated herein by reference) # |
81
| 10.32 | Salary Continuation Agreement between William McGaughey and Temecula Valley Bank dated June 1, 2005 (included in Temecula Valley Bancorp’s Form 10-Q, filed on August 9, 2005 and incorporated herein by reference) # |
| 10.33 | Executive Officer Compensation disclosure (included in Temecula Valley Bancorp’s Form 8-K, filed on February 7, 2006 and incorporated herein by reference) # |
| 10.34 | Description of executive officer compensation and description of Bonus Pool Arrangement-Revised and Restated (included in Temecula Valley Bancorp’s Form 8-K, filed on March 7, 2006, and incorporated by reference) revising Executive Officer Compensation-Revised and Restated (originally filed as Exhibit 10.34 on February 7, 2006 to Temecula Valley Bancorp’s Form 8-K and incorporated herein by reference)# |
| 10.35 | Director compensation disclosure filed on December 27, 2006 (included in Temecula Valley Bancorp’s Form 8-K, filed on December 27, 2006, and incorporated by reference) revising Director Compensation disclosure originally filed February 2, 2006 to Temecula Valley Bancorp’s Form 8-K and incorporated herein by reference)# |
| 10.36 | Executive Officer Compensation disclosure (included in Temecula Valley Bancorp’s Form 8-K, filed on July 27, 2007 and incorporated herein by reference) # |
| 10.37 | Executive Officer Compensation disclosure (included in Temecula Valley Bancorp’s Form 8-K, filed on July 27, 2007 and incorporated herein by reference) # |
| 10.38 | David Bartram Employment Agreement effective November 19, 2007 (included as an exhibit to Temecula Valley Bancorp’s Form 8-K, filed on November 21, 2007 and incorporated herein by reference) # |
| 10.39 | Frank Basirico, Jr. Employment Agreement dated February 10, 2006 (included in Temecula Valley Bancorp’s Form 10-K, filed on March 31, 2006 and incorporated herein by reference) # |
| 10.40 | Indemnification provided to U.S. Stock Transfer dated December 8, 2005 (included in Temecula Valley Bancorp’s Form 10-K, filed on March 31, 2006 and incorporated herein by reference) |
| 10.41 | Indemnification provided by Director to Temecula Valley Bancorp dated December 8, 2005, (included in Temecula Valley Bancorp’s Form 10-K, filed on March 31, 2006 and incorporated herein by reference) |
| 10.42 | Purchase Agreement dated as of September 27, 2006 (included in Temecula Valley Bancorp’s Form 8-K, filed on October 3, 2006 and incorporated herein by reference) |
| 10.43 | Form of Registration Rights Agreement dated November 21, 2006 (included in Temecula Valley Bancorp’s Form 8-K, filed on November 22, 2006 and incorporated herein by reference) |
| 10.44 | Forms of Subscription Agreement dated November 21, 2006 (included in Temecula Valley Bancorp’s Form 8-K, filed on November 22, 2006 and incorporated herein by reference) |
| 10.45 | Executive Supplemental Compensation Agreement between Temecula Valley Bank and James W. Andrews entered into December 29, 2006 (included in Temecula Valley Bancorp’s Form 10-K, filed on March 14, 2007 and incorporated herein by reference)# |
| 10.46 | Split Dollar Agreement between Temecula Valley Bank and James W. Andrews entered into December 29, 2006 (included in Temecula Valley Bancorp’s Form 10-K, filed on March 14, 2007 and incorporated herein by reference) # |
| 10.47 | First Amendment dated December 29, 2006 to the Split Dollar Agreement between Temecula Valley Bank and William H. McGaughey dated June 1, 2006 (included in Temecula Valley Bancorp’s Form 10-K, filed on March 14, 2007 and incorporated herein by reference)# |
82
| 10.48 | Executive Supplemental Compensation Agreement between Temecula Valley Bank and Martin E. Plourd entered into December 29, 2006 (included in Temecula Valley Bancorp’s Form 10-K, filed on March 14, 2007 and incorporated herein by reference)# |
| 10.49 | Split Dollar Agreement between Temecula Valley Bank and Martin E. Plourd entered into December 29, 2006 (included in Temecula Valley Bancorp’s Form 10-K, filed on March 14, 2007 and incorporated herein by reference) # |
| 10.50 | Executive Supplemental Compensation Agreement between Temecula Valley Bank and Frank Basirico, Jr. entered into December 29, 2006 (included in Temecula Valley Bancorp’s Form 10-K, filed on March 14, 2007 and incorporated herein by reference)# |
| 10.51 | Split Dollar Agreement between Temecula Valley Bank and Frank Basirico, Jr. entered into December 29, 2006 (included in Temecula Valley Bancorp’s Form 10-K, filed on March 14, 2007 and incorporated herein by reference) # |
| 10.52 | First Amendment dated March 10, 2008 to William H. McGaughey Employment Agreement* # |
| 10.53 | Second Amendment dated March 10, 2008 to James W. Andrews Employment Agreement* # |
| 10.54 | Amended and Restated Trust Agreement among Temecula Valley Bancorp, Wilmington Trust Company and the Administrative Trustees dated January 17, 2008 * |
| 10.55 | Amended and Restated Declaration of Trust among U S Bank National Association, Temecula Valley Bancorp and Administrators dated September 17, 2003 * |
| 10.56 | Amended and Restated Declaration of Trust among Temecula Valley Bancorp, Wilmington Trust Company and the Administrators dated September 25, 2005 (included in Temecula Valley Bancorp’s Form 10-Q, filed November 4, 2005 and incorporated herein by reference) |
| 10.57 | Amendment to the Split Dollar Agreement between Temecula Valley Bank and Scott J. Word dated December 31, 2007*# |
| 10.58 | Amendment to the Salary Continuation Agreement between Temecula Valley Bank and Scott J. Word dated December 31, 2007*# |
| 10.59 | Amendment to the Salary Continuation Agreement between Temecula Valley Bank and Donald A. Pitcher dated December 31, 2007*# |
| 10.60 | Amendment to the Split Dollar Agreement between Temecula Valley Bank and Donald A. Pitcher dated December 31, 2008*# |
| 10.61 | Amendment to the Split Dollar Agreement between Temecula Valley Bank and Jim Andrews dated December 31, 2008*# |
| 10.62 | Amended and Restated Declaration of Trust among Temecula Valley Bancorp, Wilmington Trust Company and the Administrative Trustees dated September 27, 2006 (included in Temecula Valley Bancorp’s Form 8-K, filed October 3, 2006 andincorporated herein by reference) |
| 23.1 | Consent of Independent Registered Public Accountants * |
| 31.1 | Rule 13a-14(a) Certification of Chief Executive Officer * |
| 31.2 | Rule 13a-14(a) Certification of Chief Financial Officer * |
| 32.1 | Section 1350 Certifications of Chief Executive Officer and Chief Financial Officer * |
| _____ | |
| *Filed herewith | |
# Management contract or compensatory plan or arrangement |
83