Exhibit 99.1
I N V E S T O R P R E S E N T A T I O N C i n e d i g m I n v e s t o r P r e s e n t a t i o n D e c e m b e r 7 , 2 0 2 2
Forward Looking Statements Investors are cautioned that certain statements contained in this document, as well as some statements in press releases and some oral statements of Cinedigm officials during presentations about Cinedigm, along with Cinedigm's filings with the Securities and Exchange Commission, including Cinedigm's current reports on Form 8 - K, quarterly reports on Form 10 - Q and annual report on Form 10 - K, are "forward - looking'' statements within the meaning of the Private Securities Litigation Reform Act of 1995 (the "Act‘’). Forward - looking statements include statements that are predictive in nature, which depend upon or refer to future events or conditions, which include words such as "expects," "anticipates,'' "intends,'' "plans,'' "could," "might," "believes,'' "seeks," "estimates'' or similar expressions. In addition, any statements concerning future financial performance (including future revenues, earnings or growth rates), ongoing business strategies or prospects, and possible future actions, which may be provided by Cinedigm's management, are also forward - looking statements as defined by the Act. Forward - looking statements are based on current expectations and projections about future events and are subject to various risks, uncertainties and assumptions about Cinedigm, its technology, economic and market factors and the industries in which Cinedigm does business, among other things. These statements are not guarantees of future performance and Cinedigm undertakes no specific obligation or intention to update these statements after the date of this presentation. 2
Table Of Contents Investment Thesis The Streaming Opportunity Cinedigm Overview Cinedigm’s Competitive Advantage Case Studies Appendices 3

Investment Thesis Cinedigm (NASDAQ:CIDM) provides a compelling investment in high - growth streaming market without the downsides of the legacy studios or emerging streamers that have limited prospects for profitability in the near or mid term. Our differentiated approach is compelling due to: • Our focus on a “pure - play” streaming model, with limited exposure to declining legacy models • A diverse, de - risked, portfolio - centric approach to streaming with 30+ streaming channels and 50,000 hours of programming • A diversity of business models – including subscription, transactional, ad - supported, FAST, and others -- providing multiple engines for growth while insulating the company from macro and competitive changes • Following the acquisition of Tubi, Pluto TV and Xumo, CIDM provides one of the few compelling scale streaming assets on the market, with over 81M users • Our proprietary technology platform with deep competitive advantage for maximizing ROI in streaming and enables M&A as a competitive advantage • Our focus on cost control and conservative original programming approach will lead us to profitability within our next fiscal year, making us one of the rare profitable streaming companies 4
5 THE STREAMING OPPORTUNITY
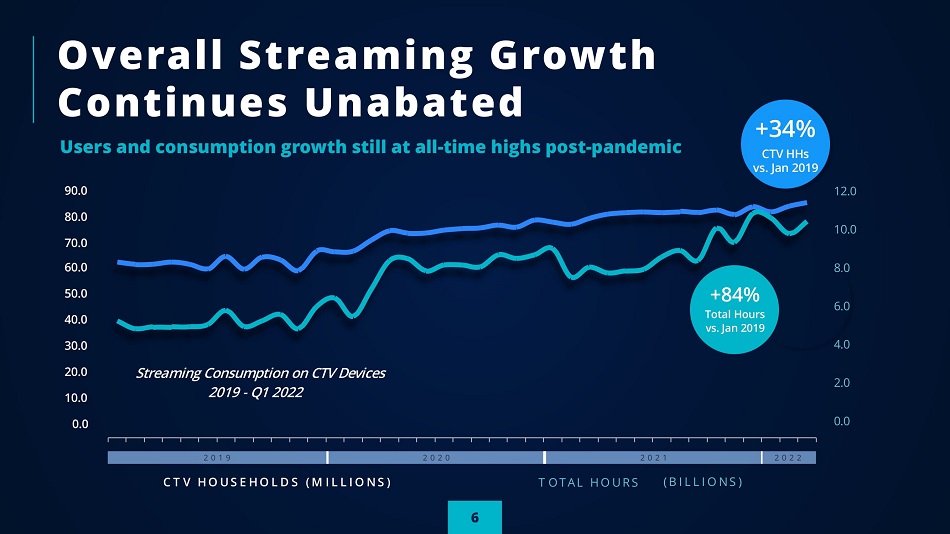
Overall Streaming Growth Continues Unabated +34% CTV HHs vs . J a n 2019 0 . 0 2 . 0 4 . 0 6 . 0 8 . 0 10 . 0 12 . 0 90.0 80.0 70.0 60.0 50.0 40.0 30.0 20.0 10.0 0 . 0 +84% T o t a l H o u r s v s . Jan 2019 Users and consumption growth still at all - time highs post - pandemic C T V H O U S E H O L D S ( M I L L I O N S ) 6 T O T A L H O U R S ( B I L L I O N S ) 2 0 1 9 2 0 2 0 2 0 2 1 2 0 2 2 S t r e a m i n g C o n s u m p t i o n o n C T V D e v i c e s 201 9 - Q 1 202 2
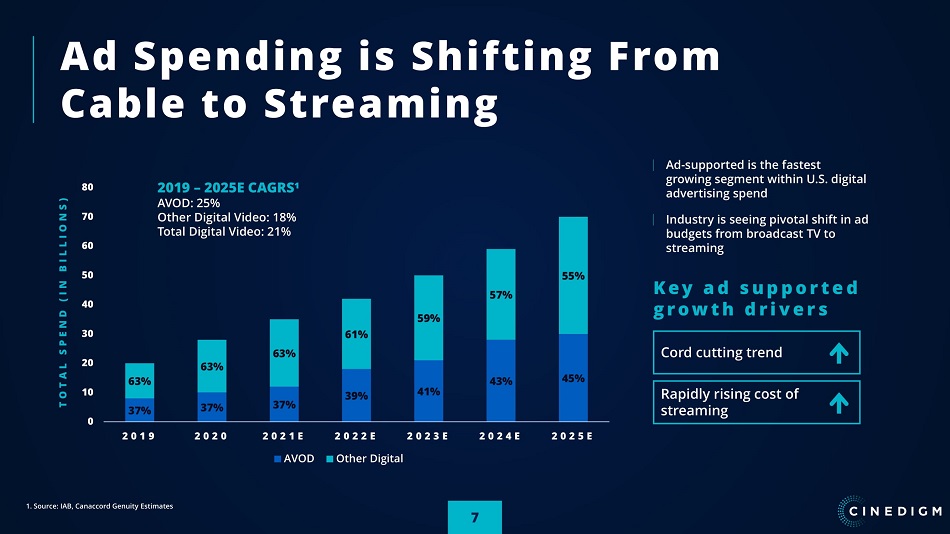
Ad Spending is Shifting From Cable to Streaming K e y a d s u p p o r t e d g r o w t h d r i v e r s Ad - supported is the fastest growing segment within U.S. digital advertising spend Industry is seeing pivotal shift in ad bu d get s f r om b r oadcast TV to streaming 37% 37% 37% 39% 41% 43% 45% 63% 63% 63% 61% 59% 57% 55% 0 10 20 30 40 50 60 70 80 2 0 1 9 2 0 2 0 2 0 2 3 E 2 0 2 4 E 2 0 2 5 E T O T A L S P E N D ( I N B I L L I O N S ) 2 0 2 1 E AV O D 2 0 2 2 E Ot h e r D igital 2019 – 2025 E C A GRS¹ A V OD : 2 5 % Other Digital Video: 18% Total Digital Video: 21% 1. Source: IAB, Canaccord Genuity Estimates Cord cutting trend Rapidly rising cost of streaming 7
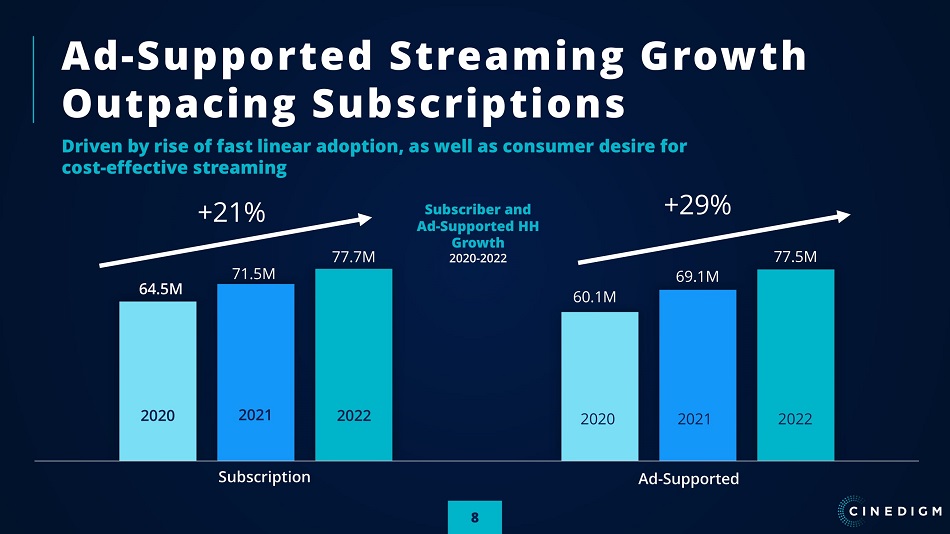
64 . 5 M 60.1M 71.5M 69.1M 77.5M Subscription Ad - S u pp o r t ed +21% +29% 2022 8 2021 2020 77.7M 2020 2021 2022 Driven by rise of fast linear adoption, as well as consumer desire for cost - effective streaming Subscriber and Ad - Supported HH Growth 2020 - 2022 Ad - Supported Streaming Growth Outpacing Subscriptions
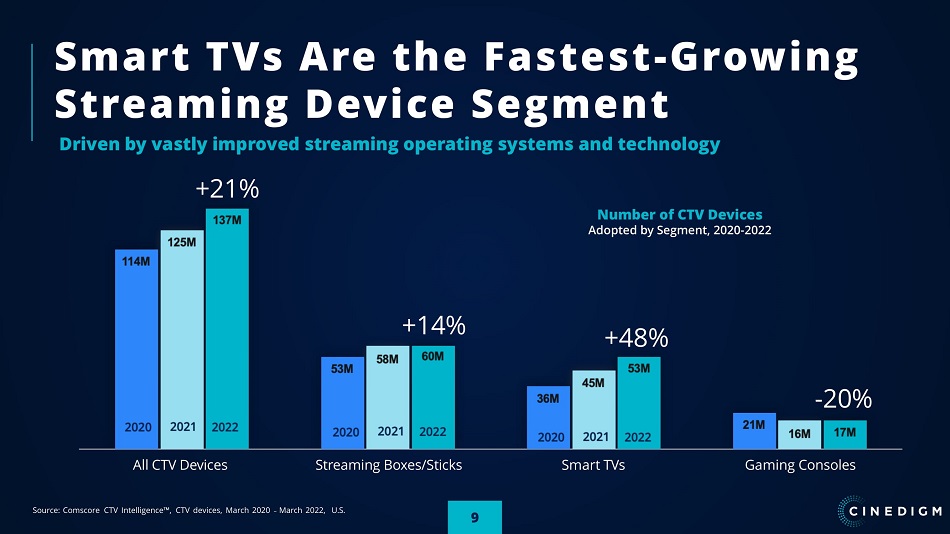
9 Smart TVs Are the Fastest - Growing Streaming Device Segment All CTV D e v i c e s Streaming Boxes/Sticks Sma r t T V s G a m ing C o n s o l e s +14% +48% - 20% Driven by vastly improved streaming operating systems and technology +21% Number of CTV Devices Adopted by Segment, 2020 - 2022 Source: Comscore CTV Intelligence Π, CTV devices, March 2020 РMarch 2022, U.S.
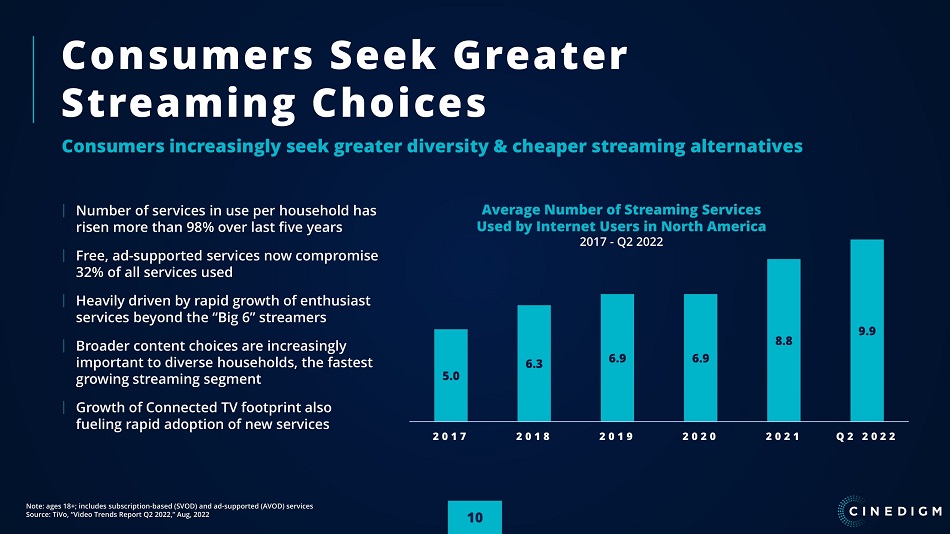
10 5.0 6.3 6.9 6.9 8.8 9.9 2 0 1 7 2 0 1 8 2 0 1 9 2 0 2 0 2 0 2 1 Q 2 2 0 2 2 Consumers Seek Greater Streaming Choices Number of services in use per household has risen more than 98% over last five years Free, ad - supported services now compromise 32% of all services used Heavily driven by rapid growth of enthusiast se r vices b e yon d th e “Big 6” st r eamers Broader content choices are increasingly important to diverse households, the fastest growing streaming segment G r o wth of Con n e c te d TV fo o tpri nt a l s o fueling rapid adoption of new services Note: ages 18+; includes subscription - based (SVOD) and ad - supported (AVOD) services Source: TiVo, “Video Trends Report Q2 2022,” Aug, 2022 Consumers increasingly seek greater diversity & cheaper streaming alternatives Average Number of Streaming Services Used by Internet Users in North America 2017 - Q2 2022
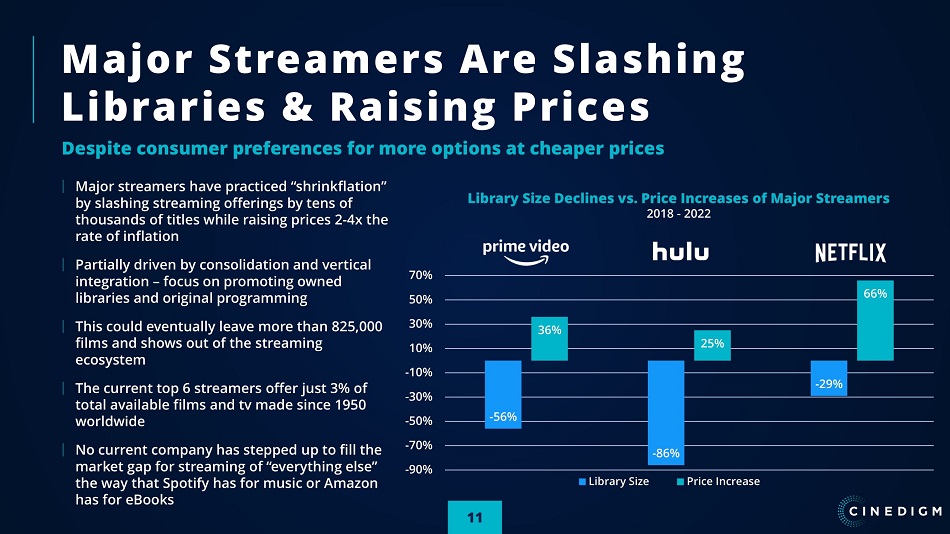
Major Streamers Are Slashing Libraries & Raising Prices Despite consumer preferences for more options at cheaper prices - 56% - 86% - 29% 36% 25% 66% 70% 50% 30% 10% - 1 0% - 3 0% - 5 0% - 7 0% - 9 0% Lib rar y S ize P r ice I ncre ase Major streamers have practiced “shrinkflation” by slashing streaming offerings by tens of thousands of titles while raising prices 2 - 4x the rate of inflation Partially driven by consolidation and vertical integration – focus on promoting owned libraries and original programming This could eventually leave more than 825,000 films and shows out of the streaming ecosystem The current top 6 streamers offer just 3 % of total available films and tv made since 1950 worldwide No current company has stepped up to fill the market gap for streaming of “everything else” the way that Spotify has for music or Amazon has for eBooks 11 Library Size Declines vs. Price Increases of Major Streamers 2018 - 2022
The Opportunity Summary Despite uncertainty about major streaming business models, new service adoption, user growth, engagement, and monetization, growth continues to show no signs of abatement at the macro level Ad spend continues to make its transition from cable television to streaming, driving continued FAST and AVOD revenue growth at a 27% faster rate than subscriptions for the foreseeable future despite macroeconomic headwinds The dynamics of smart TV adoption lead to higher take rates of diverse streaming services and FAST. This is in turn accelerating cord cutting The current wave of consolidation is leading to less content, less diversity and higher prices for consumers, which is exactly the opposite of what consumers are telling us they want Studios are trying to recreate the cable model at the expense of consumers, whether they like it or not As major streamers drop hundreds of thousands of hours of programming off their services, it is increasingly difficult for consumers to find and discover films and series other than vertically - integrated content 12 The outlook for enthusiast services & ad - supported models remains robust
13 CINEDIGM O V E R V I E W
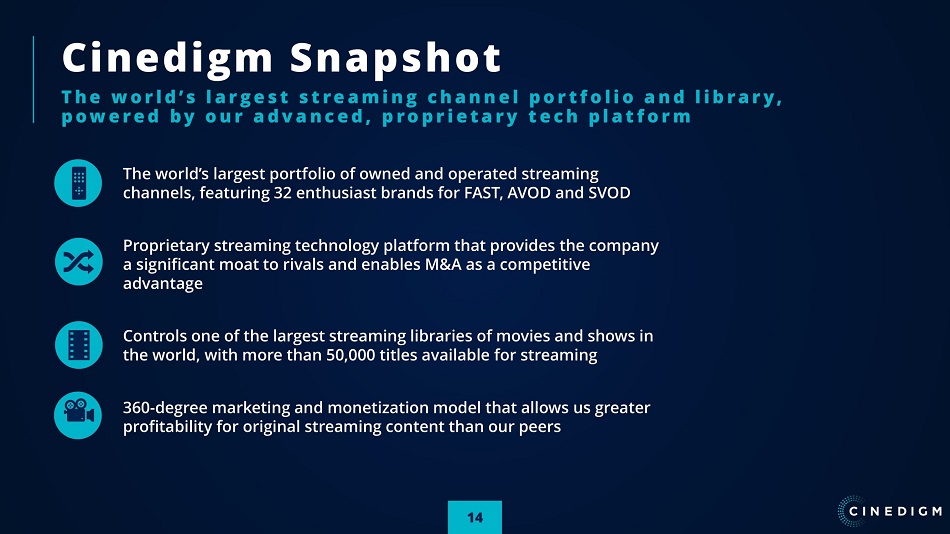
Cinedigm Snapshot T h e w o r l d ’ s l a r g e s t s t r e a m i n g c h a n n e l p o r t f o l i o a n d l i b r a r y , p o w e r e d b y o u r a d v a n c e d , p r o p r i e t a r y t e c h p l a t f o r m The world’s largest portfolio of owned and operated streaming channels, featuring 32 enthusiast brands for FAST, AVOD and SVOD Proprietary streaming technology platform that provides the company a significant moat to rivals and enables M&A as a competitive advantage Controls one of the largest streaming libraries of movies and shows in the world, with more than 50,000 titles available for streaming 360 - degree marketing and monetization model that allows us greater profitability for original streaming content than our peers 14
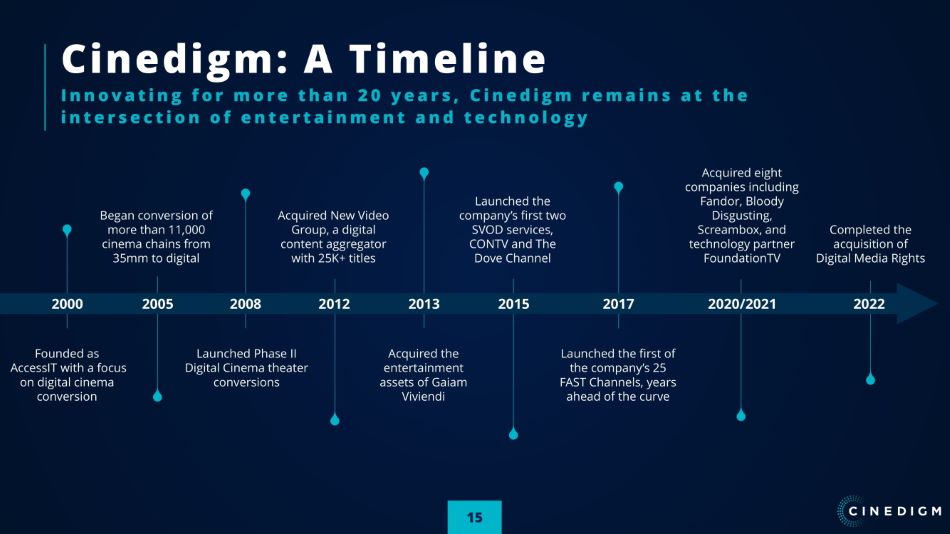
Launched Phase II Digital Cinema theater conversions Began conversion of more than 11,000 cinema chains from 35mm to digital Founded as AccessIT with a focus on digital cinema conversion Acquired New Video Group, a digital content aggregator with 25K+ titles Launched the first of the company’s 25 F AS T Channels, years ahead of the curve Completed the acquisition of Digital Media Rights Acquired eight companies including Fandor, Bloody Disgusting, Screambox, and technology partner FoundationTV Launched the company’s first two SVOD services, CONTV and The Dove Channel Acquired the entertainment assets of Gaiam Viviendi Cinedigm: A Timeline I n n o v a t i n g f o r m o r e t h a n 2 0 y e a r s , C i n e d i g m r e m a i n s a t t h e i n t e r s e c t i o n o f e n t e r t a i n m e n t a n d t e c h n o l o g y 2008 15 2005 2000 2012 2017 2022 2020/2021 2015 2013
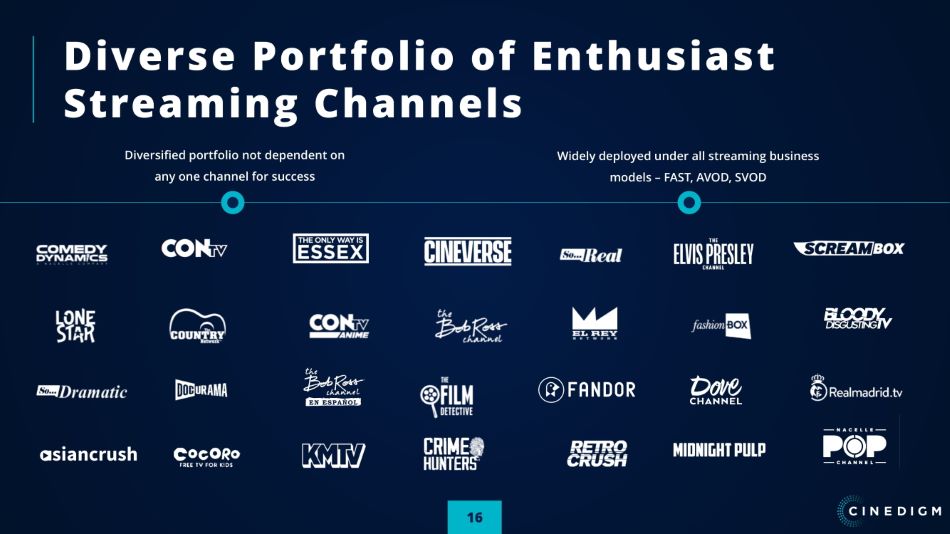
Diverse Portfolio of Enthusiast Streaming Channels Widely deployed under all streaming business model s – F AS T , A V O D , S V OD Diversified portfolio not dependent on any one channel for success 16
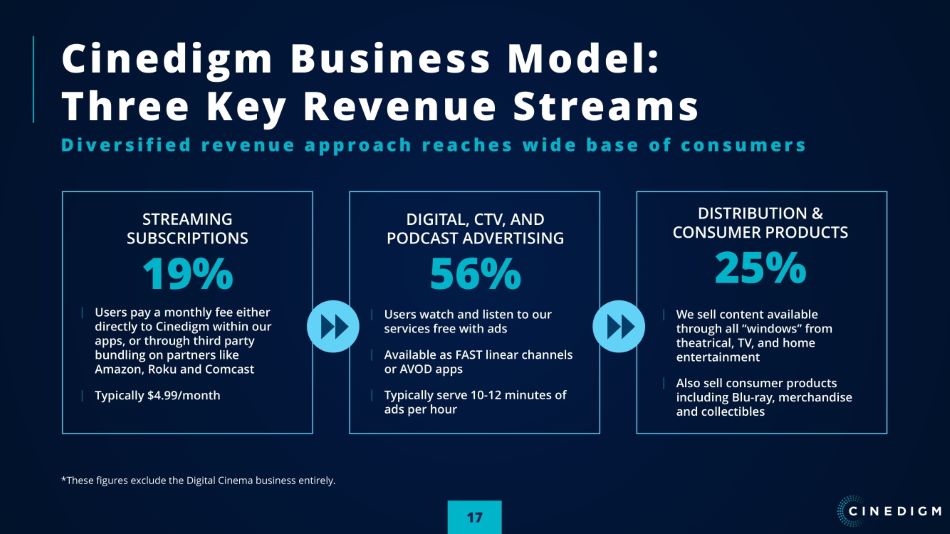
Cinedigm Business Model: Three Key Revenue Streams D i v e r s i f i e d r e v e n u e a p p r o a c h r e a c h e s w i d e b a s e o f c o n s u m e r s STREAMING SUBSCRIPTIONS 19% Users pay a monthly fee either directly to Cinedigm within our apps, or through third party bundling on partners like Amazon, Roku and Comcast Typically $4.99/month DIGI T AL , CT V , AND PODCAS T A D VERTISING 56% Users watch and listen to our services free with ads Availab l e a s F AS T linear channels or AVOD apps Typically serve 10 - 12 minutes of ads per hour DISTRIBUTION & C ONSUME R PRODUCTS 25% We sell content available through all “windows” from theatrica l , T V , an d home entertainment Also sell consumer products including Blu - ray, merchandise and collectibles 17 *These figures exclude the Digital Cinema business entirely.
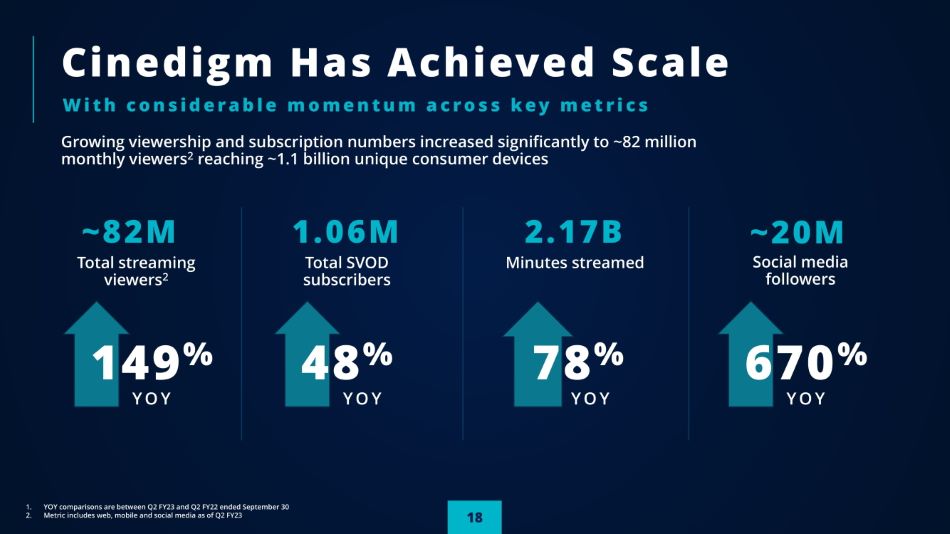
18 Cinedigm Has Achieved Scale W i t h c o n s i d e r a b l e m o m e n t u m a c r o s s k e y m e t r i c s Growing viewership and subscription numbers increased significantly to ~82 million monthly viewers 2 reaching ~1.1 billion unique consumer devices ~ 82 M Total streaming viewers 2 1. YOY co mpar i s o ns a r e betwe en Q2 FY 23 an d Q2 FY 22 end ed S e ptemb e r 30 2. Metric includes web, mobile and social media as of Q2 FY23 149 % Y O Y 1 . 06 M Total SVOD su bscri b ers 48 % Y O Y 2 . 17 B Minutes streamed 670 % Y O Y ~ 20 M Social medi a followers 78 % Y O Y
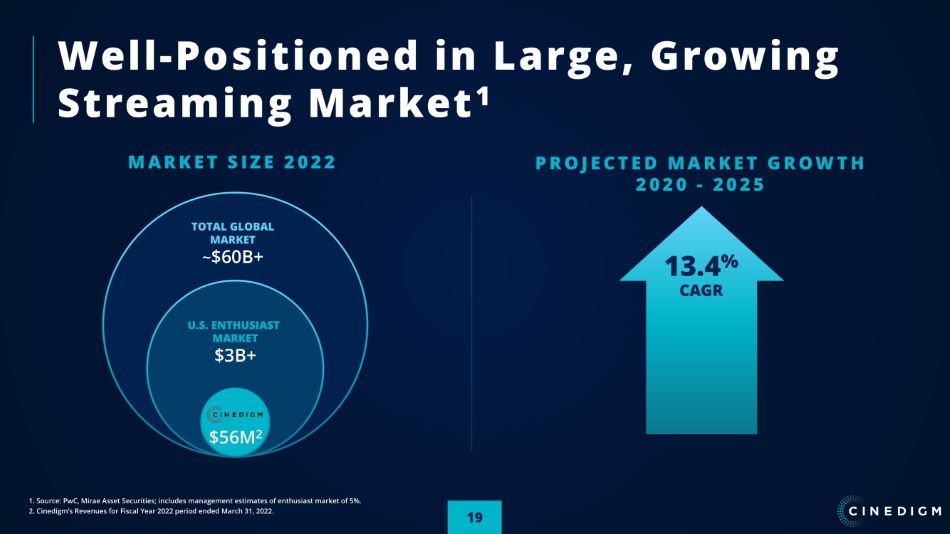
19 Well - Positioned in Large, Growing Streaming Market 1 M A R K E T S I Z E 2 0 2 2 1. Source: PwC, Mirae Asset Securities; includes management estimates of enthusiast market of 5%. 2. Cinedigm’s Revenues for Fiscal Year 2022 period ended March 31, 2022. P R O J E C T E D M A R K E T G R O W T H 2 0 2 0 - 2025 $56M 2 U. S . ENTHUSI A S T MARKET $3B+ TOTAL GLOBAL MARKET ~ $60B+ 13.4 % CAGR
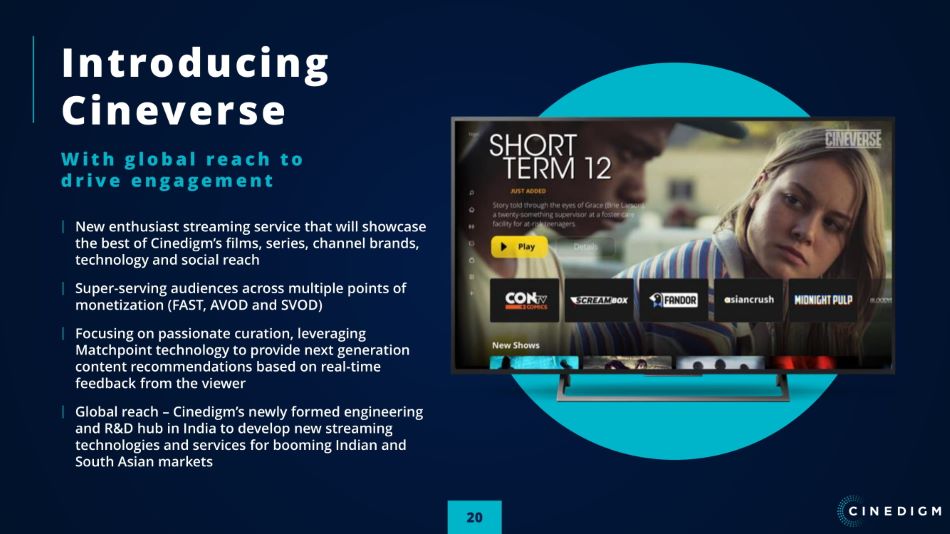
I n t r o d u c i n g Cineverse W i t h g l o b a l r e a c h t o d r i v e e n g a g e m e n t New enthusiast streaming service that will showcase the best of Cinedigm’s films, series, channel brands, technology and social reach Super - serving audiences across multiple points of monetizatio n ( F AS T , A V O D an d S V OD) Focusing on passionate curation, leveraging Matchpoint technology to provide next generation content recommendations based on real - time feedback from the viewer Global reach – Cinedigm’s newly formed engineering and R&D hub in India to develop new streaming technologies and services for booming Indian and South Asian markets 20
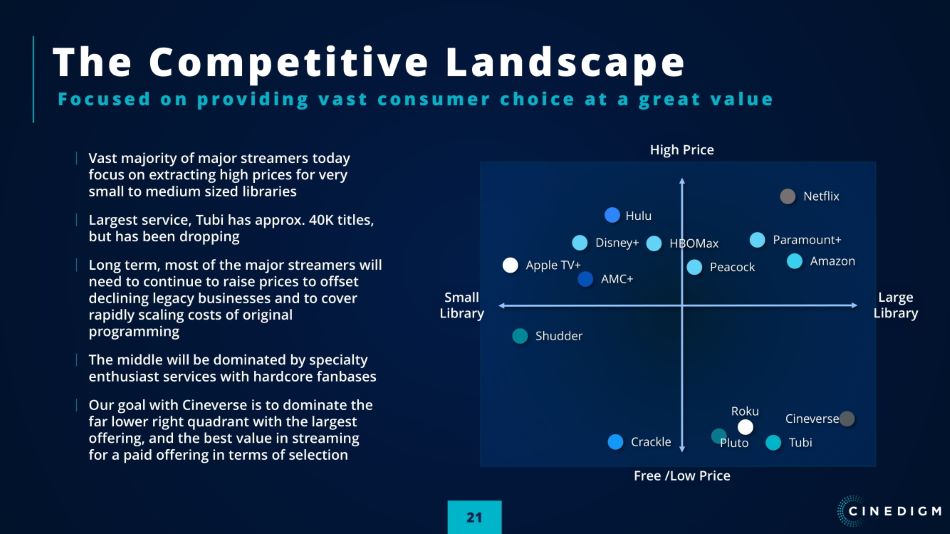
La r ge Lib r ary S m all Lib r ary High Price Plu t o AM C+ Netf lix Cineverse Tubi Apple TV+ The Competitive Landscape F o c u s e d o n p r o v i d i n g v a s t c o n s u m e r c h o i c e a t a g r e a t v a l u e Free /Low Price Hu lu Disney+ Paramount+ Amaz on HBOMax Peacock R o ku C r ackle Shu d der Vast majority of major streamers today focus on extracting high prices for very small to medium sized libraries Largest service, Tubi has approx. 40K titles, but has been dropping Long term, most of the major streamers will need to continue to raise prices to offset declining legacy businesses and to cover rapidly scaling costs of original programming The middle will be dominated by specialty enthusiast services with hardcore fanbases Our goal with Cineverse is to dominate the far lower right quadrant with the largest offering, and the best value in streaming for a paid offering in terms of selection 21
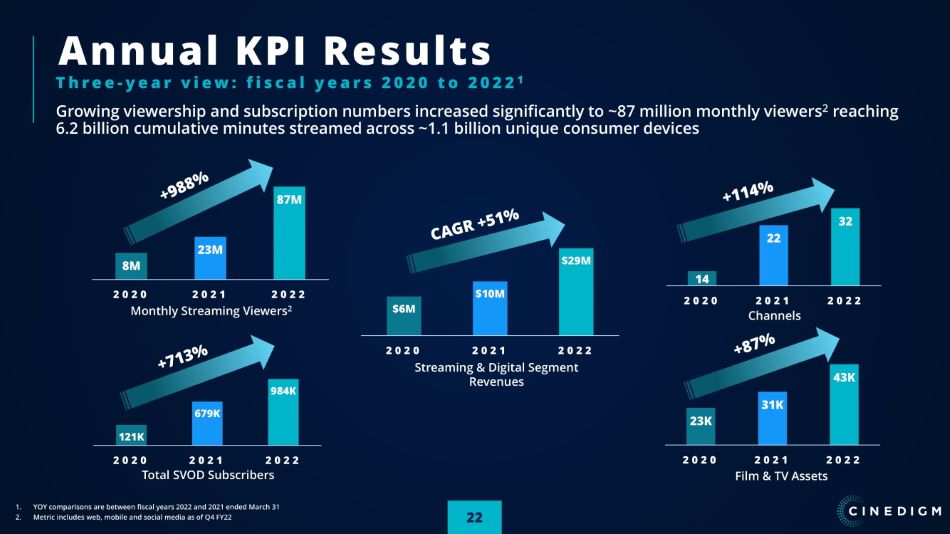
22 Annual KPI Results $6M $10M $29M 2 0 2 0 2 0 2 1 2 0 2 2 Streaming & Digital Segment Revenues 121K 679K 984K 2 0 2 0 2 0 2 1 2 0 2 2 T otal S V O D Subscribers 23K 31K 43K 2 0 2 0 2 0 2 1 2 0 2 2 Film & TV As s e ts 14 22 32 2 0 2 0 2 0 2 1 Channels 2 0 2 2 8M 23M 87M 2 0 2 0 2 0 2 1 2 0 2 2 Monthly Streaming Viewers 2 T h r e e - y e a r v i e w : f i s c a l y e a r s 2 0 2 0 t o 2 0 2 2 1 Growing viewership and subscription numbers increased significantly to ~87 million monthly viewers 2 reaching 6.2 billion cumulative minutes streamed across ~1.1 billion unique consumer devices 1. YOY comparisons are between fiscal years 2022 and 2021 ended March 31 2. Metric includes web, mobile and social media as of Q4 FY22
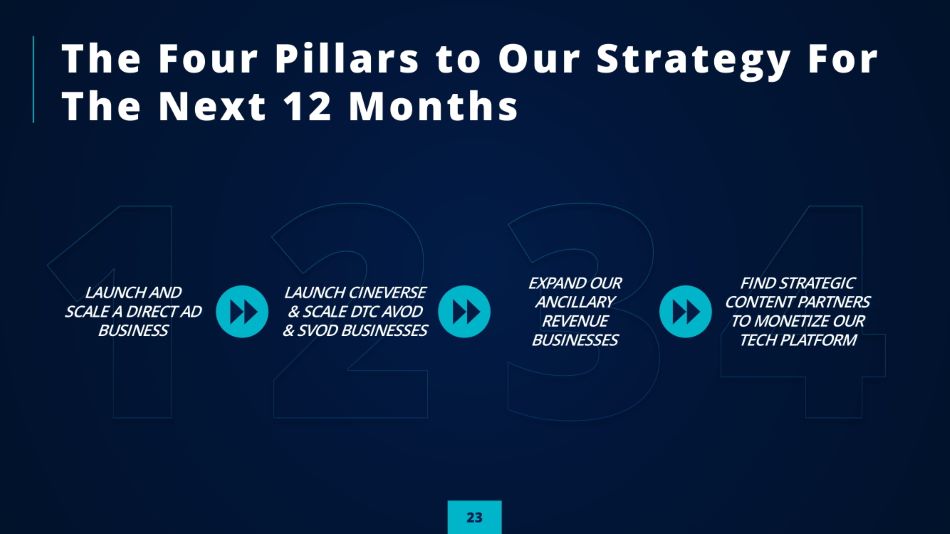
The Four Pillars to Our Strategy For The Next 12 Months L A U N C H A N D S C A L E A D I R E C T A D BUSINESS L A U N C H C I N E V E R S E & S C A L E D T C A V O D & S V O D B U S I N E SS E S E X P A N D O U R ANCILLARY REVENUE BUSINESSES F I N D S T R A T E G I C C O N T E N T P A R T N E R S T O M O N E T I Z E O U R T E C H P L A T F O R M 23
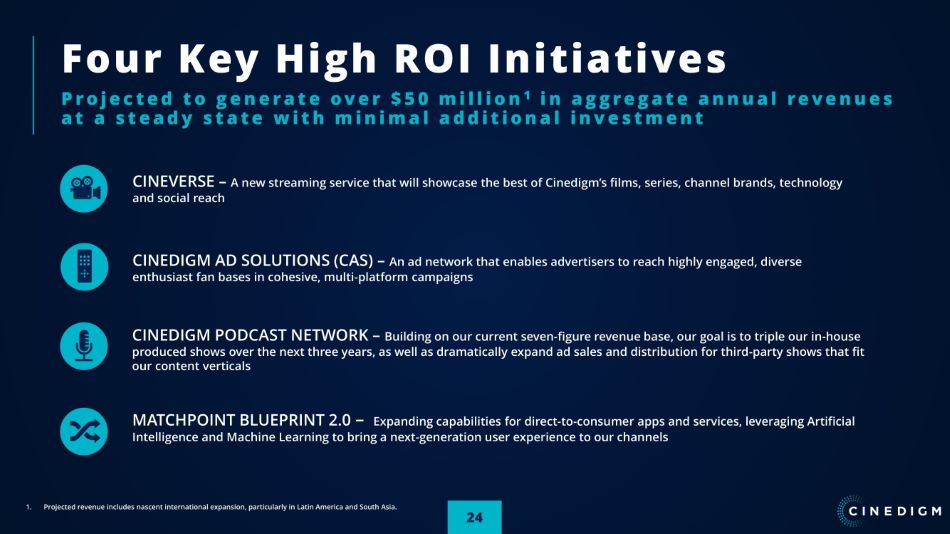
CINEVERSE – A new streaming service that will showcase the best of Cinedigm’s films, series, channel brands, technology and social reach Four Key High ROI Initiatives P r o j e c t e d t o g e n e r a t e o v e r $ 5 0 m i l l i o n 1 i n a g g r e g a t e a n n u a l r e v e n u e s a t a s t e a d y s t a t e w i t h m i n i m a l a d d i t i o n a l i n v e s t m e n t CINEDIGM AD SOLUTIONS (CAS) – An ad network that enables advertisers to reach highly engaged, diverse enthusiast fan bases in cohesive, multi - platform campaigns 24 CINEDIGM PODCAST NETWORK – Building on our current seven - figure revenue base, our goal is to triple our in - house produced shows over the next three years, as well as dramatically expand ad sales and distribution for third - party shows that fit our content verticals MATCHPOINT BLUEPRINT 2.0 – Expanding capabilities for direct - to - consumer apps and services, leveraging Artificial Intelligence and Machine Learning to bring a next - generation user experience to our channels 1. Projected revenue includes nascent international expansion, particularly in Latin America and South Asia.
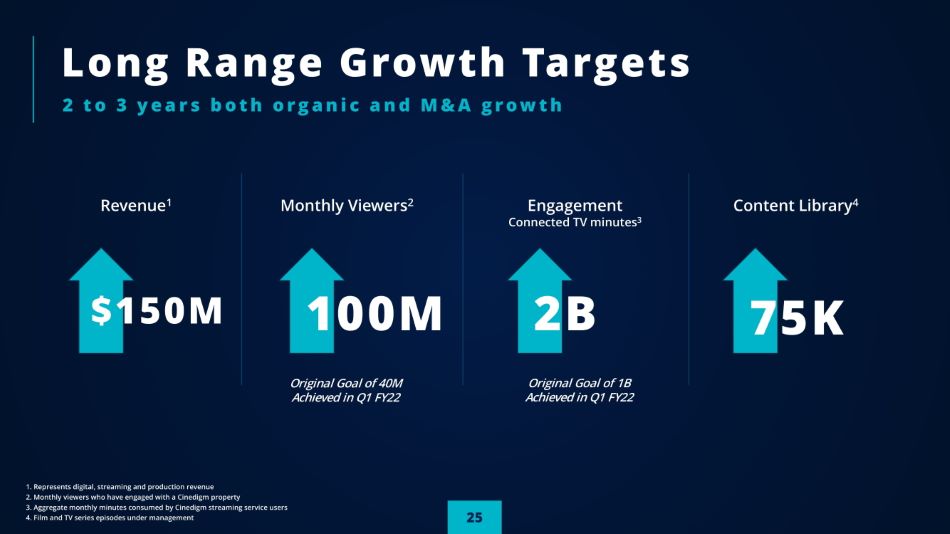
25 Long Range Growth Targets 2 t o 3 y e a r s b o t h o r g a n i c a n d M & A g r o w t h Revenue 1 1. Represents digital, streaming and production revenue 2. Monthly viewers who have engaged with a Cinedigm property 3. Aggregate monthly minutes consumed by Cinedigm streaming service users 4. Film and TV series episodes under management $ 150 M Monthly Viewers 2 Engagement Connected TV minutes 3 75K Content Library 4 100M O r i g i n a l G o a l o f 40 M A c h i e v e d i n Q 1 F Y 2 2 2B O r i g i n a l G o a l o f 1 B A c h i e v e d i n Q 1 F Y 2 2
CINEDIGM COMPETITVE ADVANTAGE
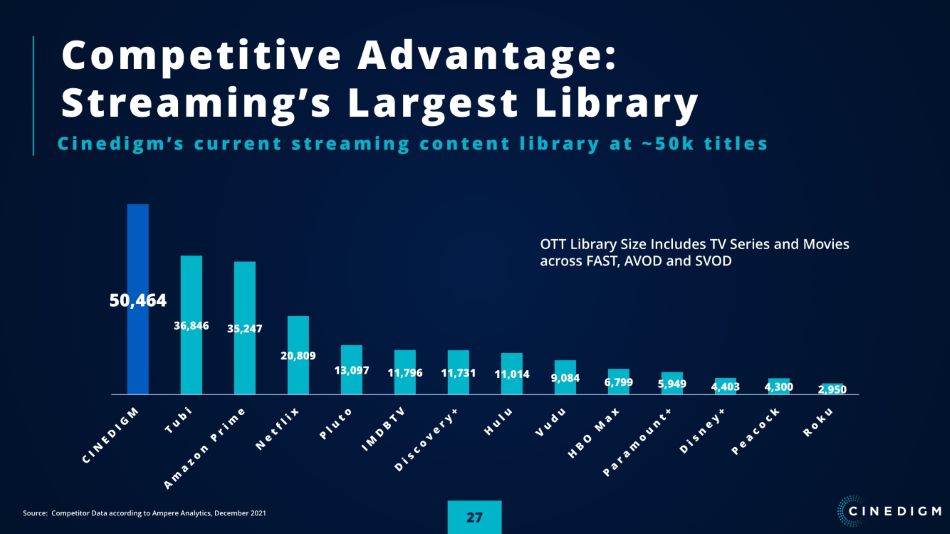
27 Competitive Advantage: Streaming’s Largest Library C i n e d i g m ’ s c u r r e n t s t r e a m i n g c o n t e n t l i b r a r y a t ~ 5 0 k t i t l e s OTT Library Size Includes TV Series and Movies ac r o s s F AS T , A V O D an d S V OD 50,464 6,846 3 5,247 3 0,809 2 3,097 1 1,796 1 1,731 1 1 1 ,014 9,084 6,799 5,949 4,403 4,300 2,950 Source: Competitor Data according to Ampere Analytics, December 2021
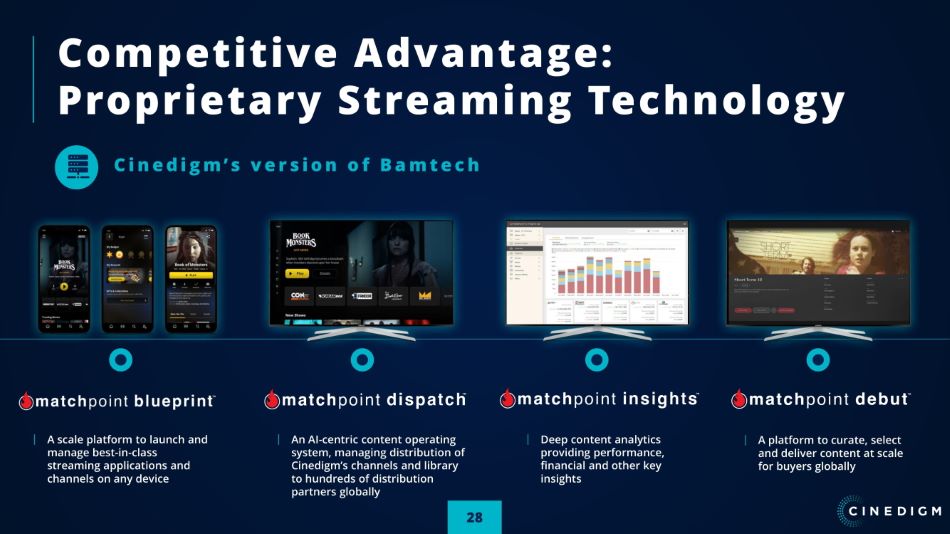
Competitive Advantage: Proprietary Streaming Technology A sc al e platf orm t o laun c h and manage best - in - class streaming applications and channels on any device Deep content analytics providing performance, financial and other key insights An AI - centric content operating system, managing distribution of Cinedigm’s channels and library to hundreds of distribution partners globally A platfor m t o curate , se l e c t and deliver content at scale for buyers globally 28 C i n e d i g m ’ s v e r s i o n o f B a m t e c h
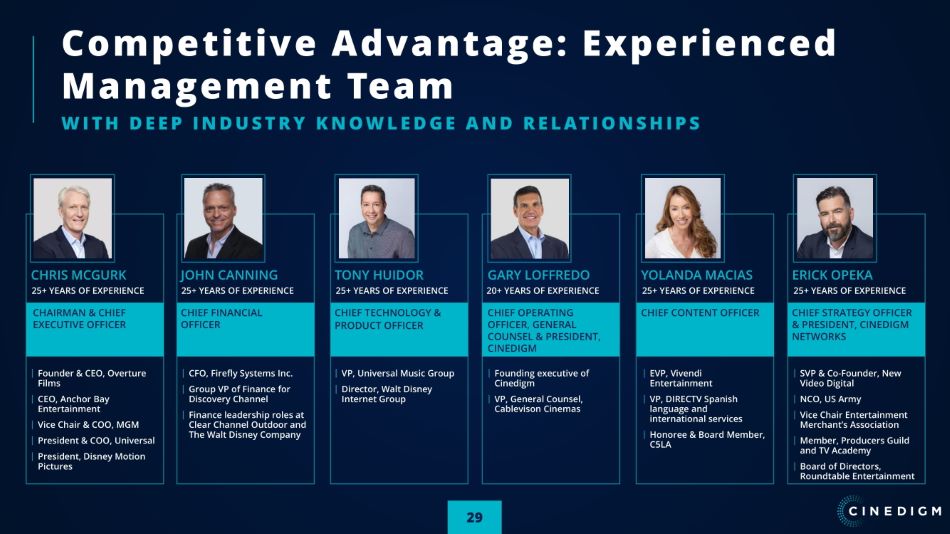
CHR I S M C GU RK 25+ YE AR S O F E XPE R I E N CE CHAIRMAN & CHIEF EXECUT I V E O FFICER F ou nde r & CEO, Overtu re Films CE O , A n c h or Bay Entertainment Vice Chair & COO, MGM President & COO, Universal President, Disney Motion Pictures ERIC K O P EKA 25+ YE AR S O F E XPE R I E N CE CHIEF S T RATEG Y OFFICER & P R ESIDE NT, CINED IGM NETWORKS SV P & Co - F ou nder , New Video Digital N C O , U S Ar m y Vice Chair Entertainment Merchant’s Association Member, Producers Guild an d TV Aca d em y Board of Directors, Roundtable Entertainment Y OLAN D A M A CIAS 25+ YE AR S O F E XPE R I E N CE CHIEF CONT EN T O FFICER EVP , V iv e n d i Entertainme nt VP , DIRE C TV Span ish language and international services Honoree & Board Member, C5LA TONY HUIDOR 25+ YE AR S O F E XPE R I E N CE CHIEF T ECHNO LOGY & PRODUCT OFFICER VP , Un iv ersa l M usic G roup Director, Walt Disney Internet Group JOHN CANNING 25+ YE AR S O F E XPE R I E N CE CHIEF F I NANCIAL OFFICER CFO, Fi r e f ly System s Inc. G roup V P of Financ e for Discovery Channel Finance leadership roles at Clear Channel Outdoor and The Walt Disney Company GAR Y L OFFRE D O 20+ YE AR S O F E XPE R I E N CE CHIEF OPERATI NG OFFICER , GENERAL COUNSEL & P R ESIDE NT, CINEDIGM Founding executive of Cinedigm VP , Genera l Co un s e l, Cablevison Cinemas C o m p e t i t i v e A d v a n t a g e : E x p e r i e n c e d Management Team W I T H D E E P I N D U S T R Y K N O W L E D G E A N D R E L A T I O N S H I P S 29
Competitive Advantage: M&A C O M P L E T E D S E V E N A C C R E T I V E A C Q U I S I T I O N S S I N C E 2 0 2 0 Focused on achieving greater audience and revenue scale and increasing technological moat vs. competitors Set the stage for significant annual revenue growth – targeting at least 50% annual revenue growth in streaming and digital Developed extensive playbooks to make M&A a competitive advantage and reap higher synergies Focus on proprietary, un - marketed deals and turn - around targets to maximize ROI Films A r oun d The World 30
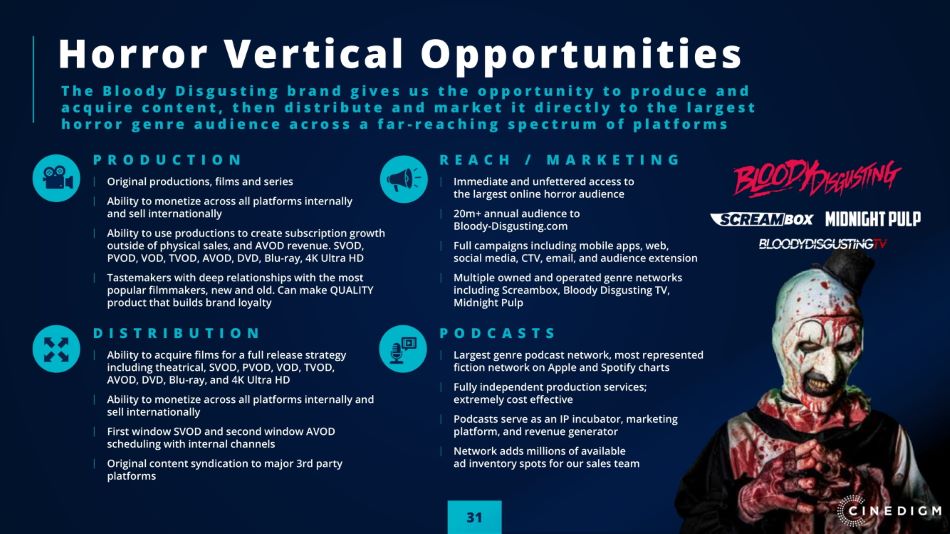
P R O D U C T I O N Original productions, films and series Ability to monetize across all platforms internally and sell internationally Ability to use productions to create subscription growth outside of physical sales, and AVOD revenue. SVOD, PVOD, VOD, TVOD, AVOD, DVD, Blu - ray, 4K Ultra HD Tastemakers with deep relationships with the most popular filmmakers, new and old. Can make QUALITY product that builds brand loyalty Horror Vertical Opportunities T h e B l o o d y D i s g u s t i n g b r a n d g i v e s u s t h e o p p o r t u n i t y t o p r o d u c e a n d a c q u i r e c o n t e n t , t h e n d i s t r i b u t e a n d m a r k e t i t d i r e c t l y t o t h e l a r g e s t h o r r o r g e n r e a u d i e n c e a c r o s s a f a r - r e a c h i n g s p e c t r u m o f p l a t f o r m s D I S T R I B U T I O N Ability to acquire films for a full release strategy including theatrical, SVOD, PVOD, VOD, TVOD, AVOD, DVD, Blu - ray, and 4K Ultra HD Ability to monetize across all platforms internally and sell internationally First window SVOD and second window AVOD scheduling with internal channels Original content syndication to major 3rd party platforms R E A C H / M A R K E T I N G Immedi a t e an d un fet t e r e d ac c es s to the largest online horror audience 20m+ annual audience to Bloody - Disgusting.com Full campaigns including mobile apps, web, social media, CTV, email, and audience extension Multiple owned and operated genre networks including Screambox, Bloody Disgusting TV, Midnight Pulp P O D C A S T S Largest genre podcast network, most represented fiction network on Apple and Spotify charts Fully independent production services; extremely cost effective Podcasts serve as an IP incubator, marketing platform, and revenue generator Network adds millions of available ad inventory spots for our sales team 31
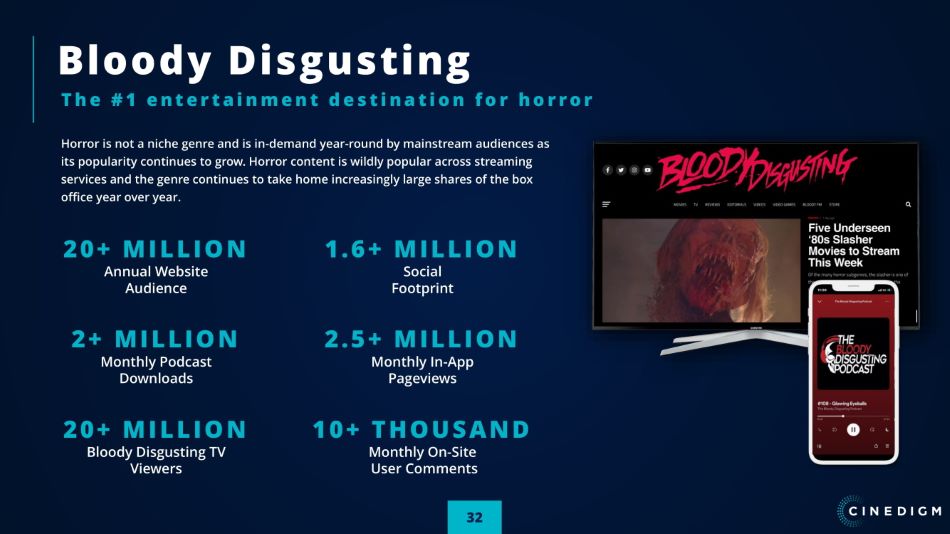
Bloody Disgusting T h e # 1 e n t e r t a i n m e n t d e s t i n a t i o n f o r h o r r o r 20 + MILLION Annual Website Audience 2 + MILLION Monthly Podcast Downloads 20 + MILLION Bloody Disgusting TV Viewers 1 . 6 + MILLION Social Footp r int 2 . 5 + MILLION Monthly In - App Pageviews 1 0 + T H O U S A N D Monthly On - Site User Comments Horror is not a niche genre and is in - demand year - round by mainstream audiences as its popularity continues to grow. Horror content is wildly popular across streaming services and the genre continues to take home increasingly large shares of the box office year over year. 32
33 C O N T E N T Extensive portfolio of 32 streaming services available under every business model One of the largest streaming libraries in the world, with more than 50,000 titles under license 360 - degree approach to monetizing content enables the company to outperform rivals O R G A N I C G R O W T H L E V E R S Focusing on high - return, low - cost initiatives using e xisting asset s – r equirin g minima l CAPEX Continuing to capture additional synergies from eight recent M&A transactions on Revenue and Opex Rapidly growing direct advertising sales capability to take advantage of massive scale inventory P R O P R I E T A R Y T E C H N O L O G Y Fully owned streaming, distribution and business intelligence platform with best - in - class capabilities to rival largest players in the industry Scale provides a competitive advantage to dramatically reduce cost structure for acquired properties, often in excess of 80%+ Opex savings 75 FTE engineering team focused on next - generation capabilities and features to drive further revenue and create additional advantages over peers F I N A N C I A L P E R F O R M A N C E / M E T R I C S Rapidly growing unit KPIs outperforming the broader mar k et , including a d s a les a t 1 2 8% Y oY G ro wth Aggressive cost cutting initiatives underway with the goal of achieving profitability at the end of the fiscal year Strong balance sheet with no long - term debt Investment Highlights P o s i t i o n e d f o r h i g h g r o w t h d r i v e n b y e n t h u s i a s t c o n t e n t a n d t e c h n o l o g i c a l i n n o v a t i o n 1. Metric includes web, mobile and social media as of Q1 FY23

34 Investment Thesis Cinedigm (NASDAQ:CIDM) provides a compelling investment in high - growth streaming market without the downsides of the legacy studios or emerging streamers that have limited prospects for profitability in the near or mid term. Our differentiated approach is compelling due to: • Our focus on a “pure - play” streaming model, with limited exposure to declining legacy models • A diverse, de - risked, portfolio - centric approach to streaming with 30+ streaming channels and 50,000 hours of programming • A diversity of business models – including subscription, transactional, ad - supported, FAST, and others -- providing multiple engines for growth while insulating the company from macro and competitive changes • Following the acquisition of Tubi, Pluto TV and Xumo, CIDM provides one of the few compelling scale streaming assets on the market, with over 81M users • Our proprietary technology platform with deep competitive advantage for maximizing ROI in streaming and enables M&A as a competitive advantage • Our focus on cost control and conservative original programming approach will lead us to profitability within our next fiscal year, making us one of the rare profitable streaming companies
35 A PP E N D I X
Financial Results F Y 2 3 Q 2 36
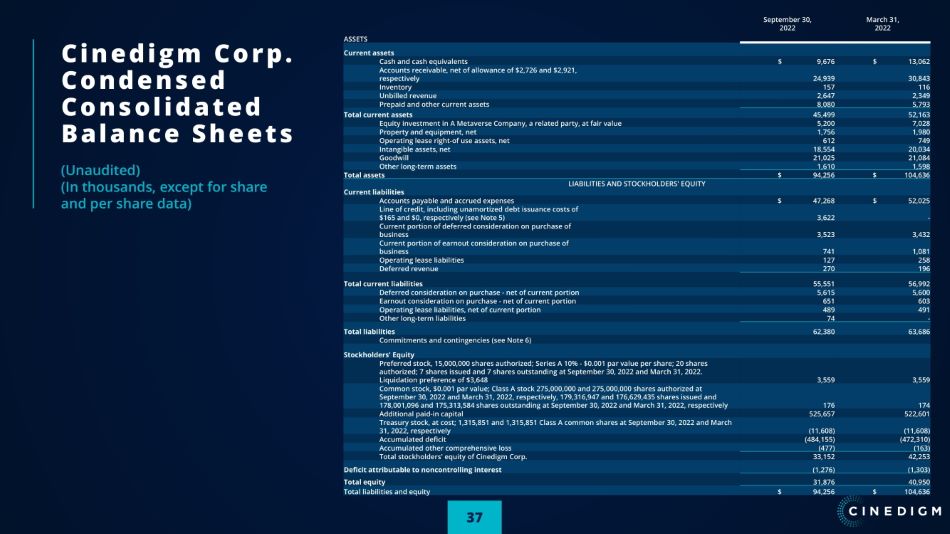
C i n e d i g m C o r p . Condensed Consolidated Balance Sheets (Unaudited) (In thousands, except for share and per share data) 37 S e ptemb e r 30, 2022 March 31, 2022 ASSETS C urren t assets Cash an d cas h e quiv a l e nts $ 9,676 $ 13,062 Accounts receivable, net of allowance of $2,726 and $2,921, respectively 24,939 30,843 Inventory 157 116 Unbilled revenue 2,647 2,349 Prepaid and other current assets 8,080 5,793 Total current assets 45,499 52,163 Equity investment in A Metaverse Company, a related party, at fair value 5,200 7,028 Property and equipment, net 1,756 1,980 Operat ing l eas e r i gh t - o f use asset s , n e t 612 749 Intangib le asset s , n e t 18,554 20,034 Goodwill 21,025 21,084 Other long - term assets 1,610 1,598 Tot al assets $ 94,256 $ 104,636 LIABILITIES AND STOCKHOLDERS' EQUITY Current liabilities Accounts payable and accrued expenses $ 47,268 $ 52,025 Line of credit, including unamortized debt issuance costs of $165 and $0, respectively (see Note 5) 3,622 - Current portion of deferred consideration on purchase of business 3,523 3,432 Current portion of earnout consideration on purchase of business 741 1,081 Operating lease liabilities 127 258 De ferre d re v e n u e 270 196 Total current liabilities 55,551 56,992 Deferred consideration on purchase - net of current portion 5,615 5,600 Earnout consideration on purchase - net of current portion 651 603 Operating lease liabilities, net of current portion 489 491 Other long - term liabilities 74 - Tot al l iabi liti es 62,380 63,686 Commitments and contingencies (see Note 6) Stockholders' Equity Preferred stock, 15,000,000 shares authorized; Series A 10% - $0.001 par value per share; 20 shares authorized; 7 shares issued and 7 shares outstanding at September 30, 2022 and March 31, 2022. Liquidation preference of $3,648 3,559 3,559 Common stock, $0.001 par value; Class A stock 275,000,000 and 275,000,000 shares authorized at September 30, 2022 and March 31, 2022, respectively, 179,316,947 and 176,629,435 shares issued and 178,001,096 and 175,313,584 shares outstanding at September 30, 2022 and March 31, 2022, respectively 176 174 Additional paid - in capital 525,657 522,601 Treasury stock, at cost; 1,315,851 and 1,315,851 Class A common shares at September 30, 2022 and March 31, 2022, respectively (11,608) (11,608) Accumulated deficit (484,155) (472,310) Accumulated other comprehensive loss (477) (163) Total stockholders' equity of Cinedigm Corp. 33,152 42,253 Deficit attributable to noncontrolling interest (1,276) (1,303) Tot al equity 31,876 40,950 Total liabilities and equity $ 94,256 $ 104,636
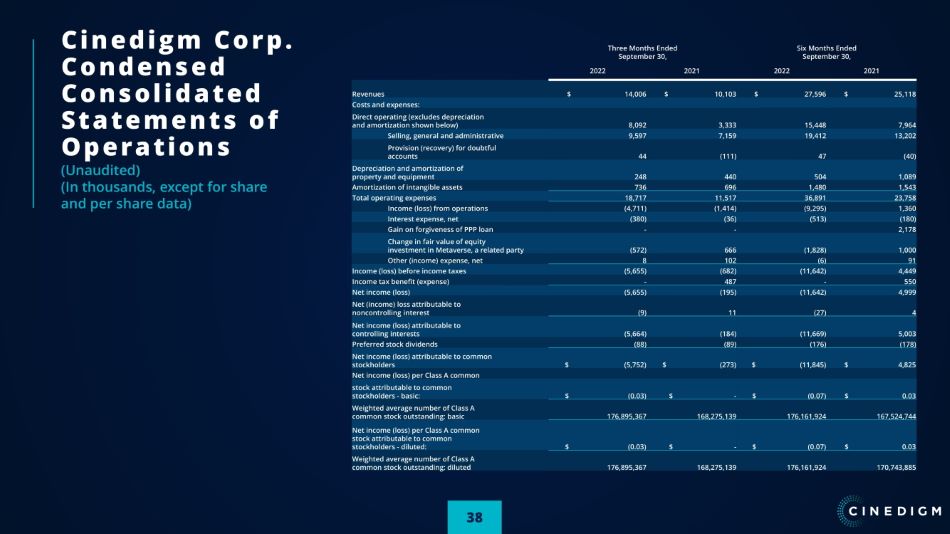
C i n e d i g m C o r p . Condensed Consolidated S t a t e m e n t s o f Operations (Unaudited) (In thousands, except for share and per share data) 38 Three Months Ended September 30, Six M o nt h s En ded September 30, 2022 2021 2022 2021 Revenues $ 14,006 $ 10,103 $ 27,596 $ 25,118 C o sts an d ex pe n s e s: Direct operating (excludes depreciation and amortization shown below) 8,092 3,333 15,448 7,964 Selling, general and administrative 9,597 7,159 19,412 13,202 Provision (recovery) for doubtful accounts 44 (111) 47 (40) Depreciation and amortization of property and equipment 248 440 504 1,089 Amortization of intangible assets 736 696 1,480 1,543 Total operating expenses 18,717 11,517 36,891 23,758 Incom e (loss) f ro m o pe rat i o ns (4,711) (1,414) (9,295) 1,360 Interest expense, net (380) (36) (513) (180) Ga in o n forgi v e n e ss o f PP P l oan - - 2,178 Change in fair value of equity investment in Metaverse, a related party (572) 666 (1,828) 1,000 Other (income) expense, net 8 102 (6) 91 Income (loss) before income taxes (5,655) (682) (11,642) 4,449 Income tax benefit (expense) - 487 - 550 Net income (loss) (5,655) (195) (11,642) 4,999 Ne t (i nco m e ) l o ss attr ibu tabl e to noncontrolling interest (9) 11 (27) 4 N e t inc om e (loss) att r ibutable to controlling interests (5,664) (184) (11,669) 5,003 Preferred stock dividends (88) (89) (176) (178) Net income (loss) attributable to common stockholders $ (5,752) $ (273) $ (11,845) $ 4,825 N e t inc om e (loss) p e r Class A common stock attributable to common stockholders - basic: $ (0.03) $ - $ (0.07) $ 0.03 Weight e d a v erag e n u mber o f Class A common stock outstanding: basic 176,895,367 168,275,139 176,161,924 167,524,744 N e t inc om e (loss) p e r Class A common stock attributable to common stockholders - diluted: $ (0.03) $ - $ (0.07) $ 0.03 Weight e d a v erag e n u mber o f Class A common stock outstanding: diluted 176,895,367 168,275,139 176,161,924 170,743,885

C i n e d i g m C o r p . Condensed Consolidated S t a t e m e n t s o f Cash Flows (Unaudited) 39 Six Months Ended S e ptemb e r 30, 2022 2021 Cash flows from operating activities: N e t (loss) inc o me $ (11,642) $ 4,999 Adjustments to reconcile net (loss) income to net cash (used in) provided by operating activities: Depreciation and amortization of property and equipment and amortization of intangible assets 1,984 2,632 Changes in fair value of equity investment in Metaverse 1,828 (1,000) Ga in fro m forgi v e n e ss o f PP P l oan - (2,178) Impairment of advances 614 399 Provision for doubtful accounts 47 (40) Amortization of debt issuance costs included in interest expense 12 - Stock - based compensation, inclusive of $551 withheld for employee payroll taxes for shares not issued 3,198 1,929 Interest expense for deferred consideration 391 - Interest expense for earnout consideration 104 - Changes in operating assets and liabilities, net of acquisitions: Accounts receivable 5,857 (2,887) Inventory (41) 44 Unbilled revenue (298) (697) Prepaids and other current assets, and other long - term assets (2,913) 961 Accounts payable, accrued expenses, and other liabilities (5,494) 5,953 De ferre d re v e n u e 74 (757) Net cash (used in) provided by operating activities (6,279) 9,358 Cash flows from investing activities: Purchases of property and equipment (274) (81) Purchase of businesses - (4,750) Sale of equity investment in Metaverse - 11 Net cash used in investing activities (274) (4,820) Cash f l o ws fro m f ina nc ing act iviti e s: Payments of notes payable (443) (7,786) Proceeds (payments) from line of credit, net of debt issuance cost 3,610 (1,956) Net cash provided by (used in) financing activities 3,167 (9,742) Net change in cash and cash equivalents (3,386) (5,204) Cash and cash equivalents at beginning of period 13,062 17,849 Cash and cash equivalents at end of period $ 9,676 $ 12,645

Cinedigm Corp. A d j u s t e d E B I T D A We present Adjusted EBITDA because we believe that Adjusted EBITDA is a useful supplement to net income (loss) from continuing operations as an indicator of operating performance. We also believe that Adjusted EBITDA is a financial measure that is useful both to management and investors when evaluating our performance and comparing our performance with that of our competitors. We also use Adjusted EBITDA for planning purposes and to evaluate our financial performance because Adjusted EBITDA excludes certain incremental expenses or non - cash items, such as stock - based compensation charges, that we believe are not indicative of our ongoing operating performance. We believe that Adjusted EBITDA is a performance measure and not a liquidity measure, and therefore a reconciliation between net loss from continuing operations and Adjusted EBITDA has been provided in the financial results. Adjusted EBITDA should not be considered as an alternative to income from operations or net loss from continuing operations as an indicator of performance or as an alternative to cash flows from operating activities as an indicator of cash flows, in each case as determined in accordance with GAAP, or as a measure of liquidity. In addition, Adjusted EBITDA does not take into account changes in certain assets and liabilities as well as interest and income taxes that can affect cash flows. We do not intend the presentation of these non - GAAP measures to be considered in isolation or as a substitute for results prepared in accordance with GAAP. These non - GAAP measures should be read only in conjunction with our consolidated financial statements prepared in accordance with GAAP. Following is the reconciliation of our consolidated net loss to Adjusted EBITDA: 40 Six Mo nt h En ded September 30, $ In Thousands 2022 2021 Net loss $ (5,655) (195) Ad d Back: Income tax expense (benefit) - (487) Depreciation and amortization of property and equipment 248 440 Amortization of intangible assets 736 696 Interest expense, net 380 36 Changes in fair value of equity investment in Metaverse 572 (666) Severance and other expense 174 2 Recovery benefit of doubtful accounts 44 (111) Stock - based compensation 2,218 946 Net income attributable to noncontrolling interest (9) 11 Adjusted EBITDA $ (1,292) $ 672 Adjustments related to the Cinema Equipment Business Depreciation and amortization of property and equipment $ (104) $ (298) Acquisition, integration and other expense 11 (60) Provision for doubtful accounts (44) - Income from operations (1,783) (2,320) Adjusted EBITDA from non - cinema equipment business $ (3,212) $ (2,006)
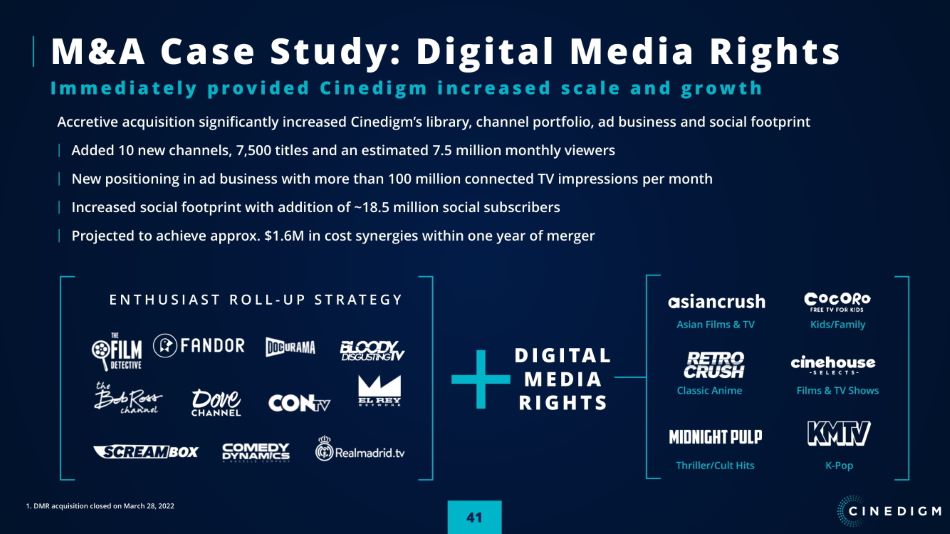
M & A C a s e S t u d y : D i g i t a l M e d i a R i g h t s I m m e d i a t e l y p r o v i d e d C i n e d i g m i n c r e a s e d s c a l e a n d g r o w t h Accretive acquisition significantly increased Cinedigm’s library, channel portfolio, ad business and social footprint Added 10 new channels, 7,500 titles and an estimated 7.5 million monthly viewers New positioning in ad business with more than 100 million connected TV impressions per month Increased social footprint with addition of ~18.5 million social subscribers Projected to achieve approx. $1.6M in cost synergies within one year of merger E N T H U S I A S T R O L L - U P S T R A T E G Y 1. DMR acquisition closed on March 28, 2022 D I G I T A L M E D I A R I G H T S As ia n F i lm s & TV Class ic Anime Thri l l e r /Cul t Hits K - Pop F i lm s & TV Sho w s K i ds/Fa m il y 41
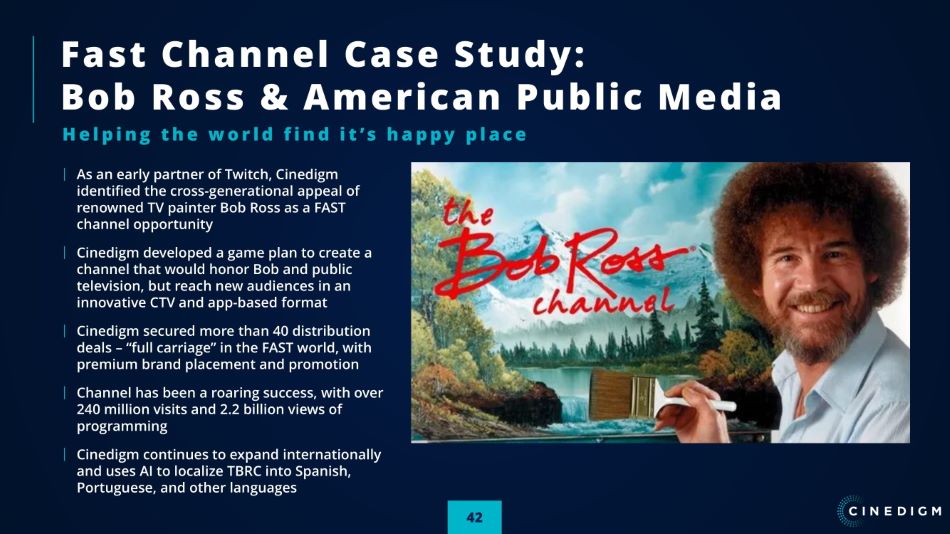
Fast Channel Case Study: B o b R o s s & A m e r i c a n P u b l i c M e d i a H e l p i n g t h e w o r l d f i n d i t ’ s h a p p y p l a c e A s a n earl y par tne r of T witch, Cinedigm identified the cross - generational appeal of r en o wned TV painte r Bo b Ros s a s a F AST channel opportunity Cinedigm developed a game plan to create a channel that would honor Bob and public television, but reach new audiences in an innovative CTV and app - based format Cinedigm secured more than 40 distribution deal s – “full c ar r iag e ” in th e F AS T w o rld, with premium brand placement and promotion Channel has been a roaring success, with over 240 million visits and 2.2 billion views of programming Cinedigm continues to expand internationally and uses AI to localize TBRC into Spanish, Portuguese, and other languages 42

C o n t e n t C a s e S t u d y : Terrifier 2 L e v e r a g i n g e n t h u s i a s t m e d i a a n d v e r t i c a l e x p e r t s t o d r i v e r e p e a t a b l e r e v e n u e g r o w t h The leadership at Bloody Disgusting recognized Terrifier, a next - generation slasher horror film, as a diamond - in - the - rough property due to intense interest within our editorial publication We were able to secure the film due to our extensive ability to promote, market, monetize and distribute the film vs. our peers Cinedigm leveraged its extensive footprint with a coordinated campaign reaching hundreds of millions of impressions across CTV, editorial, social, and more – inventory worth approx. $2 - 3M on open market Team leveraged experience to create viral awareness and engagement Net result: Anticipated $10M+ domestic Box Office, hundreds of thousands of SVOD subscribers, and best - selling ancillary products at Walmart, Best - Buy, etc. Company is already identifying additional properties to move into this model 43
A P R E M I E R S T R E A M I N G T E C H N O L O G Y & E N T E R T A I N M E N T C O M P A N Y