Exhibit 99.2
Table of Content
| | | | |
Letter to Shareholders | | | 2 | |
| |
Management’s Discussion & Analysis of Financial Conditions & Results of Operations | | | 5 | |
| |
Auditors’ Report | | | 28 | |
| |
Financial Statements | | | 29 | |
| |
Notes to Consolidated Financial Statements | | | 33 | |
| |
Corporate Information | | | 69 | |
| |
Shareholder Information | | | 70 | |
| 1 |
Dear Shareholders,
Novadaq® has remained focused on our mission to provide clinically relevant fluorescence imaging solutions to surgeons and other healthcare professionals to enable more informed point of care, clinical decisions. New peer-reviewed publications continue to demonstrate the use of our SPY® technology ultimately leads to clinical benefit for patients and economic value for healthcare providers. Over the past year, our team has achieved a number of significant clinical, product development, strategic and commercial milestones that together resulted in accelerated revenue growth in 2012 and have positioned Novadaq well for long-term growth. On behalf of the team at Novadaq, I am proud to share with you our accomplishments of the past twelve months that continue to give me confidence in the future of our company.
The combined SPY Imaging annualized run rate for procedures performed using SPY, SPYElite® andFireFly™ at the beginning of 2012, was approximately 10,000 procedures. By December 2012, the annualized run rate had doubled to an estimated 20,000 procedures. Over the same period, the combined installed base of SPY Imaging technology systems in the United States also grew from approximately 400 systems in January 2012 to 700 systems as we exited the year. Concurrently, our market penetration rate in our lead application, breast reconstruction, increased to 13% from less than 8% a year ago. As a result of these accomplishments, Novadaq total revenues grew to $23 million in 2012, with SPY Imaging revenues increasing to $19 million, which represents an increase of 85% compared to 2011. At the same time, annual gross margin increased to 63% in 2012 from 57% in 2011.
Healthcare professionals continued to validate the benefits of Novadaq’s SPY fluorescence imaging technologies and in 2012, the use of SPY in either open, minimally invasive or robotic procedures was featured in 21 peer reviewed journal publications—double the number of SPY studies published in 2011, which brings the total number of articles included in the SPY Imaging bibliography to sixty-six. Highlights of the 2012 publications included five breast reconstruction studies, one of which was a level 1 comparative study that demonstrated the use of SPY imaging is superior to clinical judgment alone. While the use of SPYElite in plastic reconstructive surgery was the subject of many published papers for Novadaq during 2012,FireFlyenjoyed substantial recognition at the Clinical Robotic Surgeons Association meeting held in Chicago last September with 19 presentations on the technology including colorectal, general and kidney cancer surgeries. Positive first reports of the use of our new PINPOINT® Endoscopic Fluorescence Imaging System in colorectal surgery and cholecystectomy were also published, as were four articles describing the use of our new LUNA™ System in the treatment of diabetic foot ulcers and other non-healing wounds. Looking forward into 2013, we expect the SPY Imaging bibliography will continue to grow at a rapid pace and that we will continue to benefit from positive reports highlighting the use of our products in both our lead and new applications.
While sales of our existing products continued to fuel our growth in 2012, our product development team did not remain idle. We completed development of the PINPOINT Endoscopic Fluorescence Imaging System, which effectively provides SPY imaging in an endoscope for surgeons performing complex minimally invasive procedures. PINPOINT, like other SPY products, allows surgeons to make more informed decisions based on the quality of blood flow and tissue perfusion; and patient anatomy where it counts—in the operating room. The PINPOINT message resonates with surgeons and their hospital administrators who have experienced serious and costly patient complications that could potentially been avoided through the use of PINPOINT. Our first PINPOINT System sale to Maimonides Medical Center in Brooklyn New York occurred in December 2012. Surgeons at Maimonides had been involved with Novadaq’s clinical development of PINPOINT and that first-hand experience with the system and the associated medical value, prompted the hospital to purchase. Although the value proposition of SPY technology is already strong, to further reinforce the PINPOINT message, Novadaq is sponsoring PILLAR, a multi-center clinical study of the use of PINPOINT in colorectal surgery, which will enroll up to 150 patients. Data from the PILLAR study will be presented in key surgical conferences during 2013 starting with the first presentation, which will occur during the Society of American Gastrointestinal Surgeons Conference in Baltimore and the American Society of Colorectal Surgeons in April 2013.
In addition, Novadaq developed the first generation LUNA Fluorescence Angiography System. LUNA will be used in the outpatient wound care clinic to assess tissue perfusion in foot ulcers and non-healing wounds caused by diseases such as diabetes, that lead to vascular deficiencies. LUNA once again demonstrates the value of Novadaq’s core SPY Imaging technology and our Company’s ability to adapt that technology into a product that meets the needs of specific healthcare professionals working in different treatment settings. LUNA is in commercial use in three United States wound care centers and to-date the feedback related to the clinical benefit it imparts has been positive. It is estimated that approximately 500,000 patients could benefit from the use of LUNA each year in the United States.
| 2 |
Originally, Novadaq had partnered with KCI to commercialize this application. However due to changes in priorities and Novadaq’s proven record of being able to commercialize new applications of SPY technology, we will commence a full direct launch of LUNA at the Diabetic Foot Conference Meeting in Los Angeles, California in March 2013.
While the main driver for the adoption of SPY imaging technology is clinical benefit, Novadaq also made progress in reimbursement, which aligns perfectly with the launch of LUNA. In April 2012, the Centers for Medicare and Medicaid Services (“CMS”) established payment for outpatient facilities performing fluorescence imaging procedures. Effective January 2013, CMS increased the amount of that payment, which will assist facilities wishing to acquire the technology and offer LUNA services.
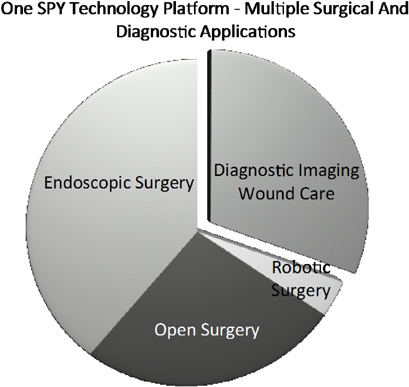
The environment for hospitals and the physicians they employ is becoming dominated by incentives for improving quality of care and penalties for poor practices, as payers increasingly recognize that less than optimal patient outcomes cost our healthcare system billions of dollars each and every year. Clinical publications repeatedly show that SPY Imaging technology supports hospitals as they drive to achieve quality care and reduced costs, which is their number one goal. Likewise, Novadaq’s corporate “ecosystem” fits our diverse customer base which includes physicians and facilities across a broad range of specialties. The figure below shows how Novadaq has adapted to its customer base, by partnering with market leaders, such as LifeCell™ Corporation for “open” surgery and Intuitive Surgical®, for robotics surgery, our first two SPY products, but “going direct” for the sale of PINPOINT and LUNA, now that medical value of our core technology is established.
Novadaq remains steadfast in our application of SPY imaging technology to complex procedures that typically cost the healthcare system $25,000 or more, and those with complication rates that exceed 10 percent. It is here, we believe, that SPY adds the most value. Leveraging our core SPY technology, we will continue to innovate by developing new devices, accessories and imaging agents, which cater to the needs of specific types of surgeries and other procedures and the physicians who performs them. The coming year will also be about introducing SPY technology into a high value outpatient diagnostic setting, wound care clinics. With chronic wounds, each patient visit costs substantially less than $25,000, but as patients require ongoing care the overall economic and personal burden is substantially higher. Numerous published studies have reported fluorescence imaging can be used to guide wound treatment, and to monitor the success of various wound therapies. Combining this clinical support, and the recently increased reimbursement for LUNA, we look forward to its launch in the second half of 2013, when we also expect PINPOINT revenues will start becoming material to our business. As we stated on our fourth quarter
| 3 |
2012 results call, Novadaq’s goal has been to create a business with a sustainable 40%-plus annual growth rate, and we think the Company is positioned to achieve this goal. In 2013, our growth will largely be derived from our partnered products, SPYElite andFireFly, then in 2014 and beyond, LUNA and PINPOINT will become major drivers of our growth.
On behalf of the management team and our Board of Directors, I thank you for your confidence in Novadaq. I look forward to updating you on our progress in the months and years to come.
Best Regards,

Arun Menawat, Ph.D, MBA
Chief Executive Officer
| 4 |
MANAGEMENT’S DISCUSSION AND ANALYSIS OF FINANCIAL CONDITION AND
RESULTS OF OPERATIONS
This Management’s Discussion and Analysis [“MD&A”] for Novadaq® Technologies Inc. [“Novadaq” or the “Company”] should be read with the audited consolidated financial statements for the year ended December 31, 2012. The consolidated financial statements for the year ended December 31, 2012 of Novadaq were prepared in accordance with International Financial Reporting Standards [“IFRS”] as issued by the International Accounting Standards Board [“IASB”]. The audited consolidated financial statements and comparative information has been prepared in United States [“U.S.”] dollars, except where another currency has been indicated.
Forward-Looking Information
This MD&A contains certain information that may constitute forward-looking information within the meaning of Canadian securities laws and forward-looking statements within the meaning of U.S. federal securities laws, both of which we refer to as forward-looking information. In some cases, forward-looking information can be identified by the use of terms such as “may”, “will”, “should”, “expect”, “plan”, “anticipate”, “believe”, “intend”, “estimate”, “predict”, “potential”, “continue” or other similar expressions concerning matters that are not statements about the present or historical facts. Forward-looking information may relate to management’s future outlook and anticipated events or results, and may include statements or information regarding the future financial position, business strategy and strategic goals, research and development activities, projected costs and capital expenditures, financial results, research and clinical testing outcomes, taxes and plans and objectives of, or involving, Novadaq®. Without limitation, information regarding future sales and marketing activities, SPY®, SPYElite®, PINPOINT®, FIREFLY™ and LUNA™ Imaging System sales, placements and utilization rates, reimbursement for SPY, SPYElite, PINPOINT, LUNA and FIREFLY procedures, future revenues arising from the sales of the Company’s products, the sales and marketing arrangements with LifeCell™ Corporation and Kinetic Concepts, Inc., the license and supply agreements with Intuitive Surgical®, Inc., the distribution agreement with MAQUET Cardiovascular and future potential partnerships, research and development activities, the Company’s plans to seek further regulatory clearances for additional indications, as well as the Company’s plans to commercialize PINPOINT®, the endoscopic version of the SPY technology, is forward-looking information.
Forward-looking information is based on certain factors and assumptions regarding, among other things, market acceptance and the rate of market penetration of Novadaq’s products, the success of Novadaq’s partnerships, the effect of reimbursement codes for procedures involving use of the SPY, SPYElite, LUNA and FIREFLY Imaging System and/or PINPOINT Endoscopic Fluorescence Imaging System and the clinical results of the use of SPY, SPY Elite, FIREFLY, LUNA and/or PINPOINT Imaging Systems or the CO2 Heart Laser™ System for Transmyocardial Revascularization. While the Company considers these assumptions to be reasonable based on information currently available to it, they may prove to be incorrect.
Forward-looking information is subject to certain factors, including risks and uncertainties, which could cause actual results to differ materially from what we currently expect. These factors include: risks relating to the transition from research and development activities to commercial activities; market acceptance and adoption of the Company’s products; the risk that a recently implemented reimbursement code will not affect acceptance or usage of the SPY System; risks related to third-party contractual performance; dependence on key suppliers for components of the Company’s products; regulatory and clinical risks; risks relating to the protection of intellectual property; risks inherent in the conduct of research and development activities, including the risk of unfavorable or inconclusive clinical trial outcomes; potential product liability, competition and the risks posed by potential technological advances; and, risks relating to fluctuations in the exchange rate between the U.S. and the Canadian dollar. We have included important factors in the cautionary statements included in this MD&A, particularly in the section entitled “Risk and Uncertainties,” that we believe could cause actual results or events to differ materially from the forward-looking statements that we make. A detailed list of the risks and uncertainties affecting us can be found in our Annual Information Form for the year ended December 31, 2011 and our Short Form Base Shelf Prospectus dated April 3, 2012, each filed on SEDAR. Prospective investors should give careful consideration to such risks and uncertainties.
Undue importance should not be placed on forward-looking information, nor should reliance be placed upon this information as of any other date. Unless required by law, Novadaq does not undertake to update this information at any particular time. Unless otherwise indicated, this MD&A was prepared by management from information available through February 6, 2013.
MD&A | 5 |
Overview and Fourth Quarter Events
Novadaq primarily develops, manufactures and markets real-time fluorescence imaging products that are designed for use by surgeons in the operating room and other clinical settings where open, minimally invasive or interventional surgical procedures are performed. The Company was founded in 2000, and initially listed on the TSX under the trading symbol NDQ in June 2005. Additionally, in March 2012, Novadaq listed on the NASDAQ Global Market under the trading symbol NVDQ.
The Company’s SPY Imaging core technology platform provides clinically relevant anatomic and physiologic images of blood flow in vessels and micro-vessels during a wide variety of complex surgical procedures performed in the operating room and outpatient surgery center without exposing the patient or the surgery staff to radiation. The SPY technology platform is flexible and can be used to develop unique imaging devices specifically designed to meet the needs of different surgeons and the specialty procedures they perform. SPY images enable surgeons treating life-threatening illnesses, such as breast, head and neck, colon, kidney and other cancers, complex hernias, diabetes and certain cardiovascular diseases, to effectively visualize blood flow in vessels, co-joined vessels and micro-vessels and to visually assess the quality of blood perfusion in tissue such as skin and organs. The ability to assess blood flow and tissue perfusion in real-time enables surgeons to repair or remove tissue that could, otherwise, lead to post-operative complications if not addressed during the surgical procedure, and which in turn increase overall treatment costs.
More than 65 peer-reviewed publications report experiences using SPY Imaging technologies in a variety of surgical procedures including open, robotic and endoscopic surgeries. Published literature supports the use of SPY Imaging which enables surgeons to make more informed decisions that lead to fewer post-operative complications which, in turn, helps reduce hospital costs. The SPY, SPYElite and LUNA Imaging System are 510(k) cleared by the U.S. Food and Drug Administration [“FDA”] and indicated for use in a variety of surgical applications including coronary artery bypass graft surgery, cardiovascular surgery, plastic, reconstructive and micro-surgery, organ transplant surgery, gastrointestinal surgery, wound care and vascular surgery and minimally invasive surgery. The SPY and SPYElite Systems are also Conformité Européenne [“CE Marked”] for sale in Europe, are licensed by Health Canada, and have regulatory authority approval for sale in Japan and certain other markets outside of the United States. The Company also markets the SPY Analysis Toolkit [“SPY-Q”], companion post-processing software designed to allow surgeons to enhance and apply objective analysis tools to SPY, SPYElite and LUNA images. SPY-Q is also 510(k) cleared by the FDA. The PINPOINT Endoscopic Fluorescence Imaging System [“PINPOINT”] is FDA 510(k) cleared for use in minimally invasive surgical procedures. PINPOINT combines the capabilities of SPY imaging with state-of-the-art high definition [“HD”] visible light visualization offered by conventional endoscopes, providing surgeons with better visualization of important information related to anatomic structures and micro-perfusion during complex minimally invasive procedures.
In addition to marketing SPY Imaging technology products, Novadaq acquired and now manufactures and markets the FDA Premarket Approval [“PMA”] approved CO2 Heart Laser™ System [“TMR Laser System”] for Transmyocardial Revascularization [“TMR”]. TMR is a procedure aimed at improving blood flow to areas of the heart that cannot be successfully treated by alternative standard revascularization techniques and is often performed adjunctively with coronary artery bypass graft [“CABG”] surgery.
Novadaq’s intellectual property consists of 46 patent families representing 130 granted or allowed patents and 89 applications in various stages of review and prosecution.
The majority of Novadaq’s current revenues comes from alliances formed with leading companies in relevant markets where SPY Imaging and the SPY technology platform have demonstrated improved clinical outcomes in open, minimally invasive and robotic surgery applications. Surgeons performing imaging procedures using SPY technologies are currently reimbursed through the use of existing Current Procedural Terminology [“CPT”] codes. Facilities where procedures are performed using SPY technology in the outpatient environment are reimbursed through the use of Ambulatory Payment Classification [“APC”] codes.
During the fourth quarter of 2012, 135 SPY Elite and FIREFLY systems were shipped to hospitals, and by quarter-end, the number of SPY technology devices installed in hospitals in the United States totaled more than 700. Efforts to increase utilization across the installed bases included sales staff and surgeon training for new applications, and
MD&A | 6 |
this was bolstered by clinical publications in the areas of cholecystectomy, partial nephrectomy, breast reconstruction and colorectal surgeries. Both the training and clinical publications had a positive impact, with shipments of open SPY kits increasing to 4,700, a 81% increase year-over-year, and a 22% increase sequentially. Concurrent with the growth of Novadaq’s partnered businesses, the Company continued to build a direct sales and marketing team for PINPOINT. Recruitment into the multi-center PILLAR™ colorectal surgery study continued at eight active sites. Also, during Q4-2012, the Company has delivered the first PINPOINT device for its order received from Maimonides Medical Center in Brooklyn, New York; however revenue will be recognized when further obligations have been satisfied.
MD&A | 7 |
Overall Performance
Selected Annual Information
The following table sets forth information regarding Novadaq’s revenues, loss from operations and other information for the year presented and should be read in conjunction with the audited consolidated financial statements for the year ended December 31, 2012 and 2011 related notes.
| | | | | | | | | | | | |
| | | Year ended December 31 | |
| | | 2012 | | | 2011 | | | 2010 | |
| | | $ | | | $ | | | $ | |
SPY revenue | | | 16,167,000 | | | | 9,214,000 | | | | 5,560,000 | |
TMR revenue | | | 2,870,000 | | | | 3,712,000 | | | | 2,794,000 | |
Royalty revenue | | | 1,850,000 | | | | 395,000 | | | | — | |
Milestone revenue | | | — | | | | — | | | | 3,959,000 | |
Partnership fee revenue | | | 1,300,000 | | | | 842,000 | | | | 267,000 | |
Service revenue | | | 802,000 | | | | 1,129,000 | | | | 1,291,000 | |
| | | | | | | | | | | | |
Total revenues | | | 22,989,000 | | | | 15,292,000 | | | | 13,871,000 | |
Cost of sales | | | 8,537,000 | | | | 6,634,000 | | | | 5,534,000 | |
| | | | | | | | | | | | |
Gross profit | | | 14,452,000 | | | | 8,658,000 | | | | 8,337,000 | |
| | | 63 | % | | | 57 | % | | | 60 | % |
Operating expenses | | | | | | | | | | | | |
Selling and distribution expenses | | | 4,926,000 | | | | 5,375,000 | | | | 7,067,000 | |
Research and development expenses | | | 5,959,000 | | | | 4,611,000 | | | | 4,916,000 | |
Administration expenses | | | 6,573,000 | | | | 4,551,000 | | | | 4,071,000 | |
Write-down of intangible assets | | | — | | | | — | | | | 4,829,000 | |
Write-down of equipment | | | 58,000 | | | | 314,000 | | | | — | |
Write-down of inventory | | | — | | | | 15,000 | | | | 427,000 | |
| | | | | | | | | | | | |
Total operating expenses | | | 17,516,000 | | | | 14,866,000 | | | | 21,310,000 | |
| | | | | | | | | | | | |
Loss from operations | | | (3,064,000 | ) | | | (6,208000 | ) | | | (12,793,000 | ) |
Interest expense | | | (274,000 | ) | | | (281,000 | ) | | | (279,000 | ) |
Imputed interest expense | | | (433,000 | ) | | | (398,000 | ) | | | (364,000 | ) |
Warrant revaluation adjustment | | | (8,558,000 | ) | | | (3,306,000 | ) | | | (462,000 | ) |
Gain (loss) on investment | | | 25,000 | | | | 25,000 | | | | (125,000 | ) |
Finance income | | | 61,000 | | | | 15,000 | | | | 16,000 | |
| | | | | | | | | | | | |
Loss from operations before income taxes | | | (12,243,000 | ) | | | (10,153,000 | ) | | | (14,187,000 | ) |
| | | | | | | | | | | | |
Income taxes | | | (101,000 | ) | | | — | | | | — | |
| | | | | | | | | | | | |
Net loss and comprehensive loss for the year | | | (12,344,000 | ) | | | (10,153,000 | ) | | | (14,187,000 | ) |
| | | | | | | | | | | | |
Basic and diluted loss and comprehensive loss per share | | | (0.32 | ) | | | (0.32 | ) | | | (0.52 | ) |
| | | |
| Balance Sheet Data | | | | | | | | | | | | |
| | | As at December 31 | |
| | | 2012 | | | 2011 | | | 2010 | |
| | | $ | | | $ | | | $ | |
Cash and cash equivalents | | | 38,954,000 | | | | 9,634,000 | | | | 5,597,000 | |
Working capital | | | 39,944,000 | | | | 9,226,000 | | | | 4,910,000 | |
Total assets | | | 57,587,000 | | | | 22,793,000 | | | | 12,320,000 | |
Total non-current liabilities | | | 21,284,000 | | | | 17,745,000 | | | | 8,292,000 | |
Total liabilities | | | 26,917,000 | | | | 22,167,000 | | | | 13,107,000 | |
Shareholders’ equity (deficiency) | | | 30,670,000 | | | | 626,000 | | | | (787,000 | ) |
MD&A | 8 |
Discussion of Operations—Annual Results
Revenues of $22,989,000 exceeded prior year revenues by $7,697,000, which represents an increase of 50%. SPY product revenues increased by $8,408,000 which included an increase in royalties of $1,455,000. Recurring SPY sales of $10,369,000 more than doubled from 2011. Offsetting were decreases in TMR products and services by $1,169,000, which were a result of the transition of the sales and marketing function of the TMR business to MAQUET.
Gross profit of $14,452,000 exceeded prior year gross profit by $5,794,000. The gross profit increase is due to our product sales growth from our agreements with both LifeCell and Intuitive Surgical, and increased international sales of SPY capital equipment with a partial offset to gross profit from the transitioning of the TMR business to MAQUET.
Selling and distribution expenses of $4,926,000 were $449,000 lower than last year due to the transitioning of sales staff and associated marketing expenditures for both LifeCell and MAQUET; lower stock option costs due to options being fully vested, which was offset by costs associated with recent hiring of sales staff and PINPOINT marketing activities. MAQUET sales staff transitioning has resulted in the reduced costs but is offset by commission expenses due to MAQUET.
Research and development expenses of $5,958,000 were $1,347,000 higher than last year. Increases in expenses mainly comprised of salaries and benefits in the amount of $784,000 to support expanded operations which reduced outsourced product design costs; non-cash stock option expense in the amount of $187,000; clinical trials in the amount of $331,000; and patent and trademark costs in the amount of $53,000 to secure new and existing patents. Offsetting these costs were a reduction in research and consultant expenses in the amount of $206,000 due to in-house staff additions. Various other costs increased by $198,000.
Administration expenses of $6,573,000 were $2,022,000 higher than same period last year. The increased expenses were mainly comprised of the NASDAQ listing fee in the amount of $337,000; increased salary and benefit costs in the amount of $309,000 due to new hires and salary increases; increased professional fees in the amount of $381,000; increased non-cash stock option costs in the amount of $554,000 due to new grants; increased foreign exchange loss in the amount of $96,000; and increased insurance expense in the amount of $238,000. Partially offsetting these costs were decreases in public relations in the amount of $111,000 and bad debt expense accrual in the amount of $57,000. Various other expenses increased by $275,000.
Combined interest expense and non-cash imputed interest expense of $707,000 is $28,000 higher than last year mainly due to increased non-cash imputed interest expense on the convertible debt.
Finance income of $61,000 increased by $46,000 due to the on-hand cash balances from the April 2012 equity offering.
Warrant revaluation non-cash expense of $8,558,000 exceeded the $3,306,000 prior year expense due to the incremental increase in market share price offset by a slight reduction of expenses for warrants exercised throughout 2012. In December 2012, the share price closed at $8.88 versus $4.91 in December 2011.
Income tax expense of $101,000 is due to income reported in the Company’s subsidiary whereas its operation in the previous year did not result in a taxable income position in the U.S.
Net loss of $12,344,000 increased from the previous year net loss by $2,191,000. The increase in net loss comprises of an increase in the non-cash warrant revaluation adjustment in the amount of $5,252,000 due to an increase in the Company’s share price and an increase in operating expenses of $2,650,000. Offsetting was an increase in gross profit in the amount of $5,794,000 resulting from an increase in revenue from our partnership agreements. The remaining value of increased loss consists primarily of income tax expense.
MD&A | 9 |
Summary of Quarterly Results
The following table sets forth information regarding Novadaq’s revenues, loss from operations and other information for the periods presented and should be read in conjunction with the corresponding unaudited interim condensed consolidated financial statements and related notes.
| | | | | | | | | | | | | | | | | | | | | | | | | | | | | | | | |
| | | Q1 | | | Q2 | | | Q3 | | | Q4 | | | Q1 | | | Q2 | | | Q3 | | | Q4 | |
| | | 2011 | | | 2011 | | | 2011 | | | 2011 | | | 2012 | | | 2012 | | | 2012 | | | 2012 | |
| | | $000’s | | | $000’s | | | $000’s | | | $000’s | | | $000’s | | | $000’s | | | $000’s | | | $000’s | |
| | | [restated] | | | [restated] | | | [restated] | | | | | | | | | | | | | | | | |
Revenues | | | | | | | | | | | | | | | | | | | | | | | | | | | | | | | | |
SPY revenue | | | 832 | | | | 2,040 | | | | 2,731 | | | | 3,611 | | | | 3,109 | | | | 3,802 | | | | 4,262 | | | | 4,994 | |
TMR revenue | | | 904 | | | | 1,005 | | | | 1,009 | | | | 794 | | | | 545 | | | | 710 | | | | 839 | | | | 776 | |
Royalty revenue | | | — | | | | 139 | | | | 140 | | | | 116 | | | | 608 | | | | 346 | | | | 350 | | | | 546 | |
Partnership fee revenue | | | 200 | | | | 200 | | | | 200 | | | | 242 | | | | 325 | | | | 325 | | | | 325 | | | | 325 | |
Service revenue | | | 405 | | | | 261 | | | | 231 | | | | 232 | | | | 180 | | | | 209 | | | | 208 | | | | 205 | |
| | | | | | | | | | | | | | | | | | | | | | | | | | | | | | | | |
Total revenues | | | 2,341 | | | | 3,645 | | | | 4,311 | | | | 4,995 | | | | 4,767 | | | | 5,392 | | | | 5,984 | | | | 6,846 | |
Cost of sales | | | 1,257 | | | | 1,449 | | | | 1,857 | | | | 2,071 | | | | 2,045 | | | | 2,088 | | | | 2,123 | | | | 2,281 | |
| | | | | | | | | | | | | | | | | | | | | | | | | | | | | | | | |
Gross profit | | | 1,084 | | | | 2,196 | | | | 2,454 | | | | 2,924 | | | | 2,722 | | | | 3,304 | | | | 3,861 | | | | 4,565 | |
Gross profit percentage | | | 46 | % | | | 60 | % | | | 57 | % | | | 59 | % | | | 57 | % | | | 61 | % | | | 65 | % | | | 67 | % |
Operating expenses | | | | | | | | | | | | | | | | | | | | | | | | | | | | | | | | |
Selling and distribution expenses | | | 1,275 | | | | 1,400 | | | | 1,353 | | | | 1,347 | | | | 1,063 | | | | 1,217 | | | | 1,289 | | | | 1,357 | |
Research and development expenses | | | 1,048 | | | | 1,270 | | | | 1,107 | | | | 1,186 | | | | 1,162 | | | | 1,378 | | | | 1,778 | | | | 1,640 | |
Administrative expenses | | | 1,113 | | | | 1,141 | | | | 1,102 | | | | 1,195 | | | | 1,471 | | | | 1,638 | | | | 1,863 | | | | 1,602 | |
Write-down of equipment | | | — | | | | — | | | | 314 | | | | — | | | | — | | | | — | | | | — | | | | — | |
Write-down of inventory | | | — | | | | — | | | | 15 | | | | — | | | | — | | | | — | | | | 58 | | | | — | |
| | | | | | | | | | | | | | | | | | | | | | | | | | | | | | | | |
Total operating expenses | | | 3,436 | | | | 3,811 | | | | 3,891 | | | | 3,728 | | | | 3,696 | | | | 4,233 | | | | 4,988 | | | | 4,599 | |
| | | | | | | | | | | | | | | | | | | | | | | | | | | | | | | | |
Loss from operations before the following | | | (2,352 | ) | | | (1,615 | ) | | | (1,437 | ) | | | (804 | ) | | | (974 | ) | | | (929 | ) | | | (1,127 | ) | | | (34 | ) |
Interest expense | | | (71 | ) | | | (72 | ) | | | (68 | ) | | | (70 | ) | | | (69 | ) | | | (69 | ) | | | (68 | ) | | | (68 | ) |
Imputed interest expense | | | (97 | ) | | | (98 | ) | | | (102 | ) | | | (101 | ) | | | (104 | ) | | | (106 | ) | | | (111 | ) | | | (112 | ) |
Finance income | | | 7 | | | | 4 | | | | 3 | | | | 1 | | | | 1 | | | | 14 | | | | 26 | | | | 20 | |
Warrant revaluation adjustment | | | 4 | | | | (2,607 | ) | | | 326 | | | | (1,029 | ) | | | (3,598 | ) | | | (311 | ) | | | (8,038 | ) | | | 3,389 | |
Gain on investment | | | 25 | | | | — | | | | — | | | | — | | | | — | | | | — | | | | 25 | | | | — | |
| | | | | | | | | | | | | | | | | | | | | | | | | | | | | | | | |
Income (loss) from operations before income taxes | | | (2,484 | ) | | | (4,388 | ) | | | (1,278 | ) | | | (2,003 | ) | | | (4,744 | ) | | | (1,401 | ) | | | (9,293 | ) | | | 3,195 | |
| | | | | | | | | | | | | | | | | | | | | | | | | | | | | | | | |
Income tax expense | | | — | | | | — | | | | — | | | | — | | | | — | | | | — | | | | — | | | | (101 | ) |
| | | | | | | | | | | | | | | | | | | | | | | | | | | | | | | | |
Net income (loss) and comprehensive income (loss) for the period | | | (2,484 | ) | | | (4,388 | ) | | | (1,278 | ) | | | (2,003 | ) | | | (4,744 | ) | | | (1,401 | ) | | | (9,293 | ) | | | 3,094 | |
| | | | | | | | | | | | | | | | | | | | | | | | | | | | | | | | |
Basic income (loss) and comprehensive income (loss) per share for the period | | | (0.09 | ) | | | (0.13 | ) | | | (0.04 | ) | | | (0.05 | ) | | | (0.15 | ) | | | (0.04 | ) | | | (0.23 | ) | | | 0.08 | |
| | | | | | | | | | | | | | | | | | | | | | | | | | | | | | | | |
Diluted loss and comprehensive loss per share for the period | | | (0.09 | ) | | | (0.13 | ) | | | (0.04 | ) | | | (0.05 | ) | | | (0.15 | ) | | | (0.04 | ) | | | (0.23 | ) | | | (0.00 | ) |
| | | | | | | | | | | | | | | | | | | | | | | | | | | | | | | | |
MD&A | 10 |
Discussion of Quarterly Results
Total Q4-2012 revenues of $6,846,000 increased by 37% from $4,995,000 in Q4-2011 due to increased revenue from all SPY products and increased partnership fees. SPY product revenues of $5,540,000 increased by 49% from $3,727,000 in Q4-2011 due to increased capital system sales, increased recurring SPY kit and rental revenues, and increased royalties. Partnership fee revenue increased by $83,000 due to the additional partnership agreement signed in Q4-2011. Q4-2012 recurring SPY revenues of $2,980,000 increased by 67% from $1,789,000 over the same period last year due to our partnership agreements. In comparison to Q3-2012, total revenues increased by $862,000 mainly due to increases in SPY products offset by lower sales of TMR products. Increased SPY product sales of $928,000 included increased recurring SPY product revenues, increased capital sales and increased royalties. TMR products and services combined revenues decreased by $66,000 due to lower CO2 laser sales offset by an increase in consumable kit sales and service work performed.
Gross profit of $4,565,000 in Q4-2012 increased from $2,924,000 for the same period last year mainly due to increased sales from alliances with LifeCell and Intuitive. Increasing SPY product sales continue to produce higher margins while TMR margins were slightly lower. In comparison to Q3-2012, gross profit, is higher by $704,000 due to increased SPY capital sales, increased recurring SPY sales and increased royalty revenue offset by lower TMR capital sales.
Selling and distribution expenses of $1,357,000 for Q4-2012 were $10,000 higher than Q4-2011. Cost for both salaries and other sales disbursements were lower due to our partnership agreements; however higher MAQUET commissions for the TMR business and higher promotional costs related to our new PINPOINT system offset the savings from these partnership agreements. Included in our costs are partial year salaries, benefits and marketing costs for new hires to support our Minimally Invasive Surgery [“MIS”] PINPOINT sales launch. Accordingly, selling and distribution expenses were $68,000 higher in Q4-2012 as compared to Q3-2012 due to increased costs of $316,000 to support the MIS PINPOINT launch partially offset by lower incentive costs.
Research and development expenses of $1,640,000 in Q4-2012 were $454,000 higher than Q4-2011 expenses of $1,186,000 due to higher salaries and fringes, in the amount of $315,000, to support expanded operations; higher non-cash stock option expense in the amount of $55,000 due to additional grants and higher fair value priced option; higher royalties due to previous year credit of $84,000; higher clinical trial costs for pre-clinical nerve imaging development in the amount of $63,000; and higher PINPOINT product design costs in the amount of $259,000. Partially offsetting these costs were lower patents and trademarks costs of $215,000; lower incentive costs in the amount of $88,000 due to increased accrual for previous periods and lower SPY registration costs of $44,000 due to the registry being completed. All other expenses increased by $25,000. In comparison to Q3-2012, research and development expenses were $138,000 lower due mainly to reduced clinical trial costs in the amount by $192,000 as previous clinical funding commitments were complete. Offsetting were cost increases for product development and research in the amount of $111,000; and for salaries, benefits and incentives for new hires in the amount of $22,000. Various other expenses resulted in a decrease of $79,000.
Administrative expenses of $1,602,000 in Q4-2012 were $407,000 higher than Q4-2011 expenses due to higher salary costs in the amount of $100,000 from administrative hiring and salary increases; higher stock option costs, in the amount of $174,000 due to new grants; higher insurance cost in the amount of $110,000 from increased coverage; and higher professional fees in the amount of $82,000 from legal fees. Public relations expenses were lower by $79,000, while all other expenses netted out for a $20,000 increase. In comparison to Q3-2012, total expenses decreased by $261,000 mainly due to lower professional fees of $294,000 and lower foreign exchange losses by $58,000. Offsetting were higher expenses related to incentives, computer and office and various other expenses totaling $91,000.
Interest expense of $68,000 and imputed interest expense of $112,000 for Q4-2012 was comparable to interest expense of $70,000 and imputed interest of $101,000 for Q4-2011. Combined interest and imputed interest expense this quarter was $1,000 higher than Q3-2012.
Finance income of $20,000 is higher than income of Q4-2011 due to on-hand cash balances but lower than Q3-2012 due to lower interest rates.
Q4-2012 warrant revaluation adjustment of $3,389,000 was favorable compared to Q4-2011 warrant revaluation expense of $1,029,000 due to a decrease in the Company’s share price. The Q4-2012 non-cash adjustment swung from a non-cash expense of $8,038,000 in Q3-2012 which also relates to a decrease in the Company’s share price
MD&A | 11 |
Income tax expense of $101,000 compared to nil in comparison to Q4-2011 and Q3-2012.
Net income of $3,094,000 in Q4-2012 increased by $5,097,000 from a loss of $2,003,000 in Q4-2011. The increase in net income was due to a non-cash warrant revaluation adjustment by $4,418,000 due to a decrease in the Company’s share price as compared an increase in the share price for the same time period last year; increased gross profit by $1,641,000 resulting from an increase in sales driven by our partnership agreements and higher finance income by $19,000. Offsetting was higher operating expenses in the amount of $871,000, higher tax expense in the amount of $101,000 and higher combined interest expenses in the amount of $9,000.
In comparison to Q3-2012, net income increased by $12,387,000 mainly due to an increase in the non-cash warrant revaluation adjustment in the amount of $11,427,000; an increase of gross profit in the amount of $704,000 and lower operating expenses in the amount of $389,000. Finance income, gain on investment, combined interest expenses and income taxes netted to an increase of $133,000.
Liquidity and Capital Resources
Novadaq’s principal capital needs are for funds to support scientific research and development activities, including system design and development and clinical trials, and funds to support sales and marketing activities, capital expenditures and working capital. Since inception, Novadaq has financed its cash requirements primarily through the issuances of securities and convertible debt, strategic alliances, licensing and development fees, investment tax credits and government funding and interest income. The Company has a history of continuing losses and has an accumulated deficit. Revenues will need to continue to increase over a sustained period. The Company will also require funding from outside sources which may include working capital financing, funds from strategic alliances or equity placements to realize its plans. However, there can be no assurance that Novadaq will be successful in securing its financing on terms favorable to the Company or at all.
Since March 24, 2011, the Company raised funds from the sources listed below:
Private Placement
On March 24, 2011, the Company closed a private placement of $14,280,000, net of transaction costs of $998,000, in exchange for 4,731,864 units at a price of CDN $3.17 per unit. Each unit consists of one common share and 0.45 of a warrant. Each warrant has a five year term and is exercisable for one common share at an exercise price of CDN $3.18.
Revolver Loan
On August 26, 2011, the Company executed a revolving credit agreement with a Canadian chartered bank entitling the Company to borrow to a maximum limit of $2,500,000, subject to a borrowing base formula, certain financial covenants and reporting requirements. The credit facility is secured by a General Security Agreement constituting a first ranking security interest in all personal property of the Company, with a conventional rate of interest. Since its inception and as at December 31, 2012, the Company has not utilized the credit facility.
Sales Distribution Alliance Agreements
On November 29, 2011, the Company and LifeCell Corporation; LifeCell Medical Resources Limited [“LifeCell MR”]; KCI USA, Inc; KCI Medical Resources Ltd [“KCI MR”] signed exclusive multi-year marketing and sales distribution alliance agreements for the commercialization of Novadaq’s SPY imaging system for additional surgical and wound care applications in North American and certain other markets. As part of the agreements, Novadaq received $3,000,000 on December 1, 2011. There was no further contract payments received in 2012.
Public Offering
On April 9, 2012, Novadaq announced that it had completed the closing of its public offering of 7,015,000 common shares at a price $5.75 per share. Gross proceeds from the offering were approximately $40.3 million resulting in cash proceeds of $36.9 million, net of transaction costs.
MD&A | 12 |
As at December 31, 2012, the Company had cash and cash equivalents of $38,954,000 to support its 2012 cash requirements. In addition to the current cash holdings of $38,954,000, the Company has existing loan availability of $2,500,000. Based on the cash on hand as at the date of this report, the capacity to borrow funds and the sales and margins the Company anticipates to generate from operations in 2013, the Company expects to have adequate resources to meet its forecasted cash requirements for the year ending December 31, 2013. In meeting the daily cash requirements, the Company invests its cash and cash equivalents in daily interest at the Company’s chartered bank in Canada.
Contractual Obligations
The Company’s long-term contractual obligations are as follows:
| | | | | | | | | | | | |
| | | 0-1 year
$ | | | 2-5 years
$ | | | After 5 years
$ | |
Long-term debt convertible debentures | | | — | | | | 5,218,000 | | | | — | |
Operating lease | | | 412,000 | | | | 164,000 | | | | — | |
Cash interest on convertible debentures | | | 261,000 | | | | 35,000 | | | | — | |
Repayable government assistance | | | 203,000 | | | | 18,000 | | | | — | |
Cash interest on repayable government assistance | | | 28,000 | | | | — | | | | — | |
Total contractual obligations | | | 904,000 | | | | 5,435,000 | | | | — | |
The long-term operating lease commitments are for premises located in: Mississauga, ON; Taunton, MA and Richmond, BC. The long-term convertible debentures require cash interest payment or Payment in Kind [“PIK”] interest payable semi-annually. Payment provision for these leases and interest expenses are part of our 2013 forecasted cash requirements. The long-term convertible debt repayment is subject to the terms of the indenture agreement and payment for this amount is expected to be fully satisfied within the terms of the agreement. There is no current year requirement for the repayment of this debt.
Critical Accounting Estimates
The preparation of the consolidated financial statements requires the use of estimates and assumptions to be made in applying the accounting policies that affect the reported amounts of assets, liabilities, revenue, expenses and the disclosure of contingent assets and liabilities. The estimates and related assumptions are based on previous experience and other factors considered reasonable under the circumstances, the results of which form the basis of making the assumptions about carrying values of assets and liabilities that are not readily apparent from other sources.
The estimates and underlying assumptions are reviewed on an ongoing basis. Revisions to accounting estimates are recognized in the period in which the estimate is revised if the revision affects only that period or in the period of the revision and future periods if the revision affects both current and future periods. Judgments made by management in the application of IFRS that have a significant effect on the consolidated financial statements relate to the following:
Impairment of non-financial assets
The Company’s impairment test is based on value-in-use calculations that use a discounted cash flow model. The cash flows are derived from the projections for the next three to five years and are sensitive to the discount rate used as well as the expected future cash inflows and the growth rate used for extrapolation purposes.
Development costs
Initial capitalization of costs is based on management’s judgment that technical and economical feasibility is confirmed, usually when a project has reached a defined milestone according to an established project management model.
MD&A | 13 |
Useful lives of key property and equipment and intangible assets
The depreciation method and useful lives reflect the pattern in which management expects the asset’s future economic benefits to be consumed by the Company.
Accounts receivable
The Company reviews its individually significant receivables at each reporting date to assess whether an impairment loss should be recorded in the consolidated statements of loss and comprehensive loss. In particular, judgment by management is required in the estimation of the amount and timing of future cash flows when determining the impairment loss. In estimating these cash flows, the Company makes judgments about the borrower’s financial situation and the net realizable value of collateral, if any. These estimates are based on assumptions about a number of factors and actual results may differ, resulting in future changes to the allowance.
Fair value of financial instruments
Where the fair value of financial assets and financial liabilities recorded in the consolidated statements of financial position cannot be derived from active markets, they are determined using valuation techniques including the discounted cash flow models. The inputs to these models are taken from observable markets. Changes in input from observable market factors could affect the reported fair value of financial instruments.
Share-based compensation
The Company measures the cost of equity-settled transactions with employees by reference to the fair value of equity instruments at the date at which they are granted. Estimating fair value for share-based compensation requires determining the most appropriate valuation model for a grant of these instruments, which is dependent on the terms and conditions of the grant. This also requires determining the most appropriate inputs to the valuation model, including the risk-free interest rate expected life of the option, volatility and dividend yield.
Shareholder warrants
In determining the fair value of the shareholder warrants, the Company used the Black-Scholes option pricing model with the following assumptions: average volatility rate; market price as at the reporting date; risk-free interest rate; the remaining expected life of the warrant; and an exchange rate as at the reporting date. The inputs used in the Black-Scholes model are taken from observable markets. In particular, changes in estimates of the fair value of the shareholder warrants can have a material impact on the reported loss and comprehensive loss for a given period.
Significant Accounting Policies
Revenue Recognition
Revenue is recognized to the extent that it is probable that the economic benefits will flow to the Company and the revenue can be reliably measured, regardless of when the payment is being made. Revenue is measured at the fair value of the consideration received or receivable, taking into account contractually defined terms of payment and excluding taxes or duty. The Company assesses its revenue arrangements with all of its customers and partners against specific criteria to determine if it is acting as principal or agent. The Company has concluded that it is acting as a principal in all of its revenue arrangements. The specific recognition criteria described below must also be met before revenue is recognized.
Product sales
Product sales to customers
Revenue from the sale of medical devices and consumables is recognized when significant risks and rewards of ownership of the products have passed or transferred to the customer, usually when the products are picked up by the shipper for delivery, collection of the related receivable is probable, persuasive evidence of an arrangement exists and the sales price is fixed or determinable.
Products sales under partnership agreements
Revenue is recognized on sale of capital devices or consumable products when they are picked up by the shipper for delivery to the partners, as at that point-of-time the Company has transferred all relevant risks of ownership [inventory risks for the delivered products, credit risk for the transaction with the end customer and price risk for the transaction with the end customer] to the partners, who maintains the business relationship with the end customer. Under the current partnership agreements, the Company shares on-going revenues from its partners’ sales to end
MD&A | 14 |
customers, net of contracted minimum pricing retained by the Company upon initial shipments to its partners, related to the SPY imaging system and the disposable products required to perform the SPY imaging procedure. The Company records any additional amounts when its partners sell to the end customer.
Rental income
Rental income arising from the rental of capital devices is recognized on a straight-line basis over the lease terms and included in product sales.
Multiple element arrangements
The Company may enter into arrangements in which it commits to provide multiple products and services to its customers occurring at different points in time. Revenue recognition for these arrangements is determined based on evaluation of the individual elements of the arrangements. If the element delivered has stand-alone value to the customer and the fair value associated with the element can be measured reliably, the amount recognized as revenue for that element is the fair value of the element in relation to the fair value of the arrangement as a whole. Otherwise, the entire arrangement is treated as one unit of accounting and revenue is deferred and recognized ratably over the remaining term of the arrangements, commencing when all elements are delivered.
Royalty revenue
The Company earns and recognizes royalties upon sale of its products to the end user by its partner.
Partnership fee revenue
Partnership fee revenue relates to upfront payments received from partners for exclusive sales and marketing rights. Upfront payments are deferred and recognized on a straight-line basis over the exclusive sales and marketing terms.
Service revenue
Service revenue primarily relates to extended warranty services agreements in connection with capital sales. Revenue from these agreements are deferred and recognized on a straight-line basis over the extended warranty services term.
Impairment of non-financial assets
The Company assesses at each reporting date whether there is an indication that an asset may be impaired. If such an indication exists, the Company estimates the asset’s recoverable amount. The recoverable amount is the higher of an asset’s or cash-generating unit’s [“CGU”] fair value less costs to sell and its value-in-use. Where the carrying amount of an asset or CGU exceeds its recoverable amount, the asset is considered impaired and is written down to its recoverable amount.
Value-in-use is determined by discounting estimated future cash flows using a pre-tax discount rate that reflects the current market assessment of the time value of money and the specific risks of the asset. In determining fair value less costs to sell, recent market transactions are taken into account, if available. If no such transactions can be identified, an appropriate valuation model has to be used. The recoverable amount of assets that do not generate independent cash flows is determined based on the CGU to which the asset belongs.
The Company bases its impairment calculation on detailed budgets and forecast calculations which are prepared separately for each of the Company’s CGUs to which the individual assets are allocated. These budgets and forecast calculations are generally cover a period of three to five years.
An impairment loss is recognized in the consolidated statements of loss and comprehensive loss if an asset’s carrying amount or that of the CGU to which it is allocated is higher than its recoverable amount. Impairment losses of CGUs are charged against the carrying value of assets in a CGU, in proportion to their carrying amount. In the consolidated statements of loss and comprehensive loss, the impairment losses are recognized in the expense categories consistent with the function of the impaired asset.
An assessment is made at each reporting date as to whether there is any indication that previously recognized impairment losses may no longer exist or may have decreased. For purposes of impairment testing, the Company determined that it has two CGUs, namely the SPY Imaging Technology business and the TMR business.
MD&A | 15 |
The calculation of value-in-use for the CGU would be most sensitive to the following assumptions:
| • | | Price development for the consumables and medical devices; and |
| • | | Market share assumptions. |
Gross margins—Gross margins are based on historical and forecasted values.
Discount rates—Discount rates reflect the current market assessment of the risks specific to each CGU. The discount rate was estimated based on the average percentage of a weighted average cost of capital for the medical device industry.
Price development for the consumables and medical devices—Estimates are obtained from published forecasts about the future development of applicable procedures in North America during the detailed forecast period, as well as management’s own judgments.
Market share assumptions—These assumptions are important because management assesses how the CGU’s position, relative to its competitors, might change over the budget period.
Intangible Assets
The Company owns intangible assets consisting of licenses, SPY software and Xillix patent rights.
Intangible assets acquired separately are measured on initial recognition at cost. The cost of intangible assets acquired in a business combination is its fair value at the date of acquisition. Following initial recognition, intangible assets are carried at cost less accumulated amortization and impairment losses, if any. The useful lives of intangible assets are assessed as either finite or indefinite.
The Company currently does not hold any intangible assets with indefinite lives.
Intangible assets with finite useful lives are amortized over the useful economic life and assessed for impairment whenever there is an indication that the intangible asset may be impaired. The amortization method and amortization period of an intangible asset with a finite useful life is reviewed at least annually. Changes in the expected useful life or the expected pattern of consumption of future economic benefits embodied in the asset is accounted for by changing the amortization period or method, as appropriate, and are treated as changes in accounting estimates. The amortization expense on intangible assets with finite lives is recognized in the consolidated statements of loss and comprehensive loss in the expense category consistent with the function of the intangible assets.
Internally generated intangible assets, such as deferred development costs, are capitalized when the product or process is technically and commercially feasible and the Company has sufficient resources to complete development. The cost of an internally generated intangible asset comprises all directly attributable costs necessary to create, produce and prepare the asset to be capable of operating in the manner intended by management. Amortization of the internally generated intangible assets begins when the development is complete and the asset is available for use. It is amortized over the period of expected future benefit. Amortization is recorded in cost of sales.
Intangible assets are amortized on a straight-line basis over the lesser of their useful lives and the life of the patents, or the term of the patent rights:
| | |
TMR manufacturing license | | 2 years |
| |
SPY software | | 2 years |
| |
Xillix patent rights | | 5-15 years |
MD&A | 16 |
Common share warrants derivatives
The Company’s common share warrants are considered to be derivative liabilities due to the warrants being exercisable in a currency (Canadian dollar) other than the functional currency of the Company (U.S. dollar). Accordingly, the warrants are measured at fair value at each reporting date, with changes in fair value included in the statement of loss and comprehensive loss for the applicable reporting period. A change in the inputs utilized to calculate the fair value such as the Company’s share price, volatility, remaining life and interest rate can have a material impact on the reported loss and comprehensive loss for the period.
Stock-based Compensation Plan
Employees [including senior executives and Board members] of the Company receive remuneration in the form of stock options. In situations where stock options are issued and some or all of the goods or services received by the entity as consideration cannot be specifically identified, the unidentified goods or services received are measured as the difference between the fair value of the share-based compensation transaction and the fair value of any identifiable goods or services received at the grant date. This is then capitalized or expensed as appropriate. The cost of equity-settled transactions with employees is measured by reference to the fair value at the date on which they are granted. The cost of stock option transactions is recognized, together with a corresponding increase in contributed surplus, over the period in which the performance and/or service conditions are fulfilled.
The cumulative expense recognized for share-based compensation transactions at each reporting date until the vesting date reflects the extent to which this vesting period has expired and the Company’s best estimate of the number of shares that will ultimately vest. The expense or credit recognized for a period represents the movement in cumulative expense recognized as at the beginning and end of that period and is recognized in the consolidated statements of loss and comprehensive loss in the respective function line. When options are exercised, the amounts previously credited to contributed surplus are reversed and credited to shareholders’ equity. The amount of cash, if any, received from participants is also credited in share capital in shareholders’ equity. Where the terms of stock options are modified, the minimum expense recognized is the expense as if the terms had not been modified, if the original terms of the award are met. An additional expense is recognized for any modification that increases the total fair value of the share-based compensation transaction, or is otherwise beneficial to the employee as measured at the date of modification. The dilutive effect, if any, of outstanding options is reflected as additional share dilution in the computation of diluted loss per share.
Financial instruments
The Company classifies its financial instruments as either [i] financial assets at fair value through profit or loss, [ii] loans and receivables or [iii] available-for-sale, and its financial liabilities as either [i] financial liabilities at fair value through profit or loss or [ii] other financial liabilities. Appropriate classification of financial assets and liabilities is determined at the time of initial recognition or when reclassified in the consolidated statements of financial position.
All financial instruments are recognized initially at fair value plus, in the case of investments and liabilities not at fair value through profit or loss, directly attributable transaction costs. Financial instruments are recognized on the trade date, which is the date on which the Company commits to purchase or sell the asset. There are currently no financial instruments classified as available-for-sale.
Financial assets at fair value through profit or loss:
Financial assets at fair value through profit or loss include financial assets held for trading and financial assets designated upon initial recognition at fair value through profit or loss. Financial assets are classified as held for trading if they are acquired for the purpose of selling or repurchasing in the near term. Financial assets at fair value through profit or loss are carried at fair value. Related realized and unrealized gains and losses are included in the consolidated statements of loss and comprehensive loss in finance income or finance costs. The Company has currently not designated any financial assets upon initial recognition as at fair value through profit or loss.
Loans and receivables:
Loans and receivables are non-derivative financial assets with fixed or determinable payments that are not quoted in an active market. Loans and receivables are initially recognized at fair value plus transaction costs. They are subsequently measured at amortized cost using the effective interest method less any impairment. The losses arising from impairment are recognized in the consolidated statements of loss and comprehensive loss in finance costs.
MD&A | 17 |
De-recognition:
A financial asset is derecognized when the rights to receive cash flows from the asset have expired or when the Company has transferred its rights to receive cash flows from the asset.
Impairment of financial assets:
The Company assesses at each reporting date whether there is any objective evidence that a financial asset or a group of financial assets is impaired. A financial asset is deemed to be impaired if, and only if, there is objective evidence of impairment as a result of one or more events that have occurred after the initial recognition of the asset [an incurred ‘loss event’] and that loss event has an impact on the estimated future cash flows of the financial asset or the group of financial assets that can be reliably estimated.
For financial assets carried at amortized cost, the Company first assesses individually whether objective evidence of impairment exists individually for financial assets that are individually significant, or collectively for financial assets that are not individually significant. If the Company determines that no objective evidence of impairment exists for an individually assessed financial asset, it includes the asset in a group of financial assets with similar credit risk characteristics and collectively assesses them for impairment. Assets that are individually assessed for impairment and for which an impairment loss is, or continues to be, recognized are not included in a collective assessment of impairment.
If there is objective evidence that an impairment loss has occurred, the amount of the loss is measured as the difference between the asset’s carrying amount and the present value of estimated future cash flows.
The carrying amount of the asset is reduced through the use of an allowance account and the amount of the loss is recognized in profit or loss. Loans and receivables together with the associated allowance are written off when there is no realistic prospect of future recovery. If, in a subsequent year, the amount of the estimated impairment loss increases or decreases because of an event occurring after the impairment was recognized, the previously recognized impairment loss is increased or reduced by adjusting the allowance account. If a write-off is later recovered, the recovery is credited to finance costs in profit or loss.
Financial liabilities at fair value through profit or loss:
Financial liabilities at fair value through profit or loss include financial liabilities held for trading and financial liabilities designated upon initial recognition at fair value through profit or loss.
Because the Company’s shareholder warrants are denominated in Canadian dollars [a currency different from the Company’s functional currency] they are recognized as a financial liability and are re-measured at fair value through profit or loss.
Other financial liabilities:
Financial liabilities are measured at amortized cost using the effective interest rate method. Financial liabilities include long-term debt issued, which is initially measured at fair value, which is the consideration received, net of transaction costs incurred. Transaction costs related to the long-term debt instruments are included in the value of the instruments and amortized using the effective interest rate method. The effective interest expense is included in finance costs in the consolidated statements of loss and comprehensive loss.
De-recognition:
A financial liability is derecognized when the obligation under the liability is discharged or cancelled or expires.
When an existing financial liability is replaced by another from the same lender on substantially different terms, or the terms of an existing liability are substantially modified, such an exchange or modification is treated as a de-recognition of the original liability and the recognition of a new liability, and the difference in the respective carrying amounts is recognized in the consolidated statements of loss and comprehensive loss.
Offsetting of financial instruments
Financial assets and financial liabilities are offset and the net amount reported in the consolidated statements of financial position if, and only if, there is a currently enforceable legal right to offset the recognized amounts and there is an intention to settle on a net basis, or to realize the assets and settle the liabilities simultaneously.
MD&A | 18 |
Fair value of financial instruments
Fair value is the estimated amount that the Company would pay or receive to dispose of the financial instrument contracts in an arm’s length transaction between knowledgeable, willing parties who are under no compulsion to act. The fair value of financial instruments that are traded in active markets at each reporting date is determined by reference to quoted market prices, without any deduction for transaction costs.
For financial instruments not traded in an active market, the fair value is determined using appropriate valuation techniques that are recognized by market participants. Such techniques may include using recent arm’s length market transactions, reference to the current fair value of another instrument that is substantially the same, discounted cash flow analysis or other valuation models.
The Company’s financial instruments are comprised of the following as at December 31, 2012: cash and cash equivalents of $38,954,000; accounts receivable of $4,057,000; accounts payable and accrued liabilities of $3,407,000; convertible debentures of $4,657,000; shareholder warrants of $13,003,000 and, repayable government assistance of $221,000. The Company invested its cash and cash equivalents in daily interest savings accounts. Accounts receivable of $4,057,000 (net of $228,000 bad debts reserves), based in the United States and Canada, are subject to minimal credit risk based on the nature of our customers. The receivables are being carried at amortized cost. Accounts payable and accrued liabilities of $3,407,000 carried at amortized cost, is comprised of short-term obligations owing to suppliers relative to the Company’s operations. The convertible debentures have a principal value of $5,068,000 and PIK debentures of $150,000. The shareholder warrants are re-valued quarterly utilizing the Black-Scholes model to determine fair value. The repayable government assistance comprises an Industrial Research and Assistance Program loan, received from the National Research Council, with principal repayment terms over 30 months, commenced in August 2011.
Changes in Accounting Policies Including Initial Adoption
Standards Issued But Not Yet Effective
Standards issued but not yet effective up to the date of issuance of the Company’s consolidated financial statements are listed below. This listing is of standards and interpretations issued, which the Company reasonably expects to be applicable at a future date. The Company intends to adopt those standards when they become effective.
IFRS 9Financial Instruments: Classification and Measurement
In November 2009, the IASB issued IFRS 9, which covers classification and measurement as the first part of its project to replace IAS 39. In October 2010, the Board of Directors also incorporated new accounting requirements for liabilities. The standard introduces new requirements for measurement and eliminates the current classification of loans and receivables, available-for-sale and held-to-maturity, currently in IAS 39. There are new requirements for the accounting of financial liabilities as well as a carryover of requirements from IAS 39. The standard is effective for annual periods beginning on or after January 1, 2015. The Company does not anticipate early adoption and will adopt the standard when it is mandated by the IASB. The Company is currently assessing the impact of the standard on the consolidated financial statements.
IFRS 13Fair Value Measurement
IFRS 13 is a comprehensive standard for fair value measurement and disclosure requirements for use across all IFRS standards. IFRS 13 defines fair value and establishes disclosures about fair value measurement. The effective date of this amendment is for annual periods beginning on or after January 1, 2013. The Company is currently assessing the impact of the standard on the consolidated financial statements.
IAS 32Offsetting Financial Assets and Financial Liabilities
IAS 32Financial Instruments: Presentationand IFRS 7Financial Instruments: Disclosures
In December 2011, the IASB publishedOffsetting Financial Assets and Financial Liabilitiesand issued new disclosure requirements in IFRS 7Financial Instruments: Disclosures. The effective date for the amendments to IAS 32Financial Instruments: Presentationis for annual periods beginning on or after January 1, 2014.
MD&A | 19 |
IFRS 7Financial Instruments: Disclosures
In October 2010, the IASB issued amendments to IFRS 7Financial Instruments: Disclosures”, which increase the disclosure requirements for transactions involving transfers of financial assets. The effective date for the amendments to IFRS 7 is for annual periods beginning on or after January 1, 2013. The Company does not expect implementation of these amendments to have a significant impact on its disclosures or presentation.
Risks and Uncertainties
The Company’s ability to generate revenue and profit from its technologies is dependent on a number of factors, and the risks identified below, if they were to occur, could have a material impact on the Company’s business, financial condition, and liquidity, results of operation or prospects. The risks and uncertainties outlined below do not constitute an exhaustive list. Additional risks and uncertainties not presently known to the Company or that the Company believes to be immaterial may also adversely affect the Company’s business.
The Company has Incurred and Continues to Incur Losses
The Company has incurred substantial losses since its inception in 2000 and continues to incur losses and experience negative cash flows. The Company cannot predict if or when it will operate profitably, generate positive cash flows or if it will be able to implement its business strategy successfully. Pursuing its strategy requires the Company to incur significant expenditures for research and product development, marketing and general administrative activities. As a result, the Company needs to continue to grow its revenues and gross margins to achieve and sustain profitability and positive operating cash flows, and it may need to raise additional capital.
Ability to Obtain Sufficient Funding
The Company does not yet generate sufficient operational cash flows to meet the Company’s planned growth and to fund development activities. The Company has forecasted cash requirements for 2013, and funding from sources currently in place will permit the Company to meet its 2013 operating requirements. However, in the long-term, the Company will require funding from outside sources to complete its business development plans; therefore, the Company is dependent on the willingness of investors or strategic partners to continue to invest in the Company or enter into strategic relationships to continue further development of the Company’s products. There is no assurance that the Company will secure additional funding sources or partnerships. Currently, the Company has no committed sources of capital other than a revolving credit agreement, dated August 26, 2011, with a Canadian chartered bank entitling the Company to borrow a maximum limit of $2,500,000, subject to certain conditions. Since its inception, the Company has not utilized its credit facility.
Shift from Research and Development to Commercialization
Having been founded in 2000, the Company has a limited operating history. Historically, the focus of its operations had been on research and development. However, in mid-2005 the Company shifted its focus towards commercialization with the commercial launch of its system for use during cardiac surgery. In 2009 through 2012, the Company formed certain alliances with four market leading companies for the broad commercialization of Novadaq’s leading products. The successful commercialization of any one of Novadaq’s products will depend on a number of financial, logistical, technical, legal, regulatory, competitive, economic and other factors, the outcome of which cannot be predicted, some of which will be out of the Company’s control. The Company has incurred losses to date and expects to incur losses in the future. In addition, despite the Company’s current focus on the commercialization of its products, the Company continues to invest in additional research and development in order to expand the applications of its imaging platform, and these activities may require significant cash commitments which may affect the profitability of the Company. There can be no assurance that the Company will be able to achieve or sustain profitability in the future.
Successful Commercialization of the Products
The Company’s future success will depend in large part on its own ability to commercialize PINPOINT and the ability of its partners to market and sell SPYElite, FIREFLY and LUNA for use in wound care, and TMR Laser System [together, the “Products”]. Successful commercialization of the Products will depend on a number of factors, including achieving widespread adoption of the Products among the targeted surgeons and hospitals,
MD&A | 20 |
maintaining the Company’s relationships with its suppliers and partners, obtaining sufficient quantities of components for the Products, including fluorescence agent, the performance of Novadaq’s partnering sales organization, the ability of the Company and its partners to successfully market the Products at projected selling prices, and the ability of the Company and its partners to commercially launch Products that are currently in development phase, in a timely manner. In addition, the Company’s success will depend on its ability to supply the key FIREFLY components of da Vinci Surgical Robotic System and the successful commercialization of that Product. There can be no assurance that the Company will be successful in these endeavors. Successful commercialization will also depend on whether any unanticipated adverse effects result from use of the Products, or unfavorable publicity develops in respect of the Products, as well as the emergence of new or existing products as competition for the Products, which are proven to be more clinically or cost-effective.
Dependence on Relationships with Strategic Partners
Execution of the Company’s current strategy is dependent on cooperation with strategic partners for sales and marketing and research and development. The Company can offer no guarantee that existing partnership agreements will be renewed or that its strategic partners will not seek to renegotiate or amend those agreements before or after a product has been commercialized. In addition, there can be no assurance of the commercial success of any joint ventures in which the Company is, or will become, involved.
Any change in the Company’s relationships with its strategic partners, whether as a result of economic or competitive pressures or otherwise, including any decision by its strategic partners to reduce their commitment to the Company’s products and technology in favor of competing products or technologies, to change or seek to change the terms of the Company’s contractual relationships with them or to bring to an end the various alliances, could have a material adverse effect on the Company’s business and financial results.
In addition, disputes regarding the rights and obligations of the parties may arise under the Company’s agreements with its strategic partners. These and other possible disagreements may lead to the renegotiation or modification of such agreements, or could lead to the termination of such agreements or delays in collaborative research, development, supply, commercialization of certain products or could require or result in litigation or arbitration. Moreover, disagreements may arise with the Company’s strategic partners over rights to intellectual property. These kinds of disagreements could result in costly and time-consuming litigation. Any such conflicts with the Company’s strategic partners could reduce its ability to obtain future collaboration agreements and could have a negative impact on the Company’s relationship with existing strategic partners.
Potential Fluctuations in the Company’s Financial Results Make Financial Forecasting Difficult
The Company expects its revenues and results of operation to continue to vary significantly from quarter to quarter. Revenues and gross margins may be lower than anticipated due to timing of orders and deliveries, unexpected delays in the Company’s supply chain, general economic and market-related factors, product quality, performance and competitive factors. The current economic environment also makes projecting financial results more difficult. In addition, due to the Company’s early stage of commercialization on some products, it cannot accurately predict its future revenues or results of operations or the timing of its current research and development programs. The Company is also subject to normal operating risks such as credit risks, foreign currency risks and global and regional economic conditions. As a result, quarter to quarter comparisons of the Company’s revenues and results of operation may not be meaningful. It is likely that in one or more future quarters the Company’s results of operation will fall below the expectations of securities analysts and investors. If this happens, the trading price of the Company’s common shares might be materially and adversely affected.
Dependence on Suppliers
The Company is dependent on its suppliers to manufacture the Products, including components such as the fluorescence agent used with certain Products, in accordance with the FDA and other regulatory requirements. The Company does not control the manufacturing processes of its suppliers. If current manufacturing processes are modified, or the source or location of its product supply is changed, voluntarily or involuntarily, the FDA and other regulatory bodies will require the Company to demonstrate that the products produced from the modified or new process or facility are equivalent to the products previously cleared or approved. Any such modifications to the manufacturing process or supply may not achieve or maintain compliance with the applicable regulatory requirements. In many cases, approval or clearance by regulatory authorities may be required prior to any changes being made, which may adversely affect the Company’s business.
MD&A | 21 |
Concentration of Accounts Receivable
The Company has partnership agreements with three separate parties that account for the majority of its product sales. The majority of the Company’s accounts receivables are concentrated with these parties and their financial ability to pay is considered stable. The collectability of the Company’s accounts receivables from these parties have not been impacted by recent economic downturns however a default by any of these parties would impact the Company’s profitability.
Status of Healthcare Reimbursement
The Company’s ability to successfully commercialize products may depend in part on the extent to which reimbursement for the cost of such products and related treatments will be available from government health administration authorities, private health coverage insurers and other organizations.
On October 1, 2007, ICD-9-CM code 88.59—Intra-operative Fluorescence Vascular Angiography, which describes the use of SPY Imaging during coronary artery bypass graft surgery, became effective. On October 1, 2010, ICD-9-CM code 17.71—Intra-operative Fluorescence Vascular Angiography in non-coronary applications became effective. The ICD-9-CM codes may not result in incremental reimbursement to customers. In August 2011, new guidelines enabled the use of a coding modifier enabling physicians to bill for each SPY (SPYElite, PINPOINT or FIREFLY) Imaging procedure performed when medically necessary. There is no guarantee that physician billing services will use the coding modifier. In March 2012, CMS assigned SPY (SPYElite, PINPOINT or FIREFLY) Imaging for payment to APC 0397 (Vascular Imaging) under the Outpatient Prospective Payment System, effective April 1, 2012.
Implementation of Business Models
The Company’s current business plan is predicated upon the successful execution of a placement, rental or capital sales model for the SPYEliteand LUNA, and a capital sales model for PINPOINT. The hospitals and clinics that are expected to be the end-users of the SPYElite and LUNA Imaging System and PINPOINT Endoscopic Imaging System may resist such models or request alternate cost models that may not maximize returns on the Company’s investment. A failure to implement these models or to achieve the anticipated pricing for procedures could adversely affect the Company’s business and financial condition.
Regulatory Matters
Products intended for diagnostic and therapeutic use for humans are governed by a wide array of regulatory agencies. For most of these products, applicable regulations require testing and government review and approval prior to marketing the product. This procedure can take a number of years and involves the expenditure of substantial resources. Any failure or delay by the Company to obtain regulatory approvals or clearances could adversely affect the marketing of any products it developed and its ability to generate product revenue. There can be no assurance that any of the Company’s planned products will be approved by any regulatory agency on a timely basis, or at all.
In the event that a regulatory authority revokes any clearances/approvals granted in respect of the Company’s products, the Company’s business and financial condition could be adversely affected. Numerous statutes and regulations govern the manufacture and sale of medical device and pharmaceutical products in Canada, the United States and other countries where the Company markets or intends to market its products. Such laws and regulations govern, among other things, the approval of manufacturing facilities, testing procedures and controlled research, non-clinical and clinical data required prior to and after marketing approval, compliance with cGMP affecting production and storage, the advertising and labeling of products, the reporting of adverse events, and special issues associated with the manufacture and use of laser products. Failure to comply with statutes and regulations could result in warning letters, fines and other civil penalties, unanticipated expenditures, withdrawal of regulatory approval, delays in approving or refusing to approve a product, product recall or seizure, interruption of production, operating restrictions, injunctions or criminal sanctions. The Company and its manufacturers and suppliers are also subject to numerous federal, state, provincial and local laws relating to such matters as safe working conditions, manufacturing practices, environmental protection, fire hazard control and disposal of hazardous or potentially hazardous substances. In addition, advertising and promotional materials relating to medical devices are, in certain
MD&A | 22 |
instances, subject to regulation by the Federal Trade Commission in the United States and equivalent regulators in other jurisdictions. Novadaq and its manufacturers and suppliers may be required to incur significant costs to comply with such laws and regulations in the future, and such laws and regulations may have an adverse effect on the Company’s business. The failure of Novadaq or its manufacturers and suppliers to comply with current or unanticipated changes in existing regulatory requirements could materially harm the Company’s business. Furthermore, there can be no assurance that Novadaq’s manufacturers and suppliers will continue to comply with regulatory requirements, including GMP. In such circumstances, the Company’s business or financial condition may be adversely affected.
The global regulatory environment is ever evolving with changes to regulations, standards and guidelines and the establishment of new Health Authorities and/or mergers of divisions within them. Novadaq’s existing or future regulatory clearances or approvals may be affected as a result of such changes or reorganization.
With the acquisition of the PMA for the Onco-Life system from Xillix and the PMA for the TMR Laser System from PLC, Novadaq is now in a position for a higher level of regulatory scrutiny from the FDA given that the product is a Class III device. In 2011, Novadaq passed an FDA inspection on its Richmond facility. Future successful review by a Health Authority inspector is not guaranteed. A negative inspection can hinder the Company’s ability to carry on business. In such circumstances, the Company’s business or financial condition may be adversely affected.
In addition, the Company must comply with federal and state health care anti-kickback laws and other health care fraud and abuse laws that affect the marketing of devices and pharmaceuticals. Failure to comply with applicable laws and regulations could subject the Company to administrative or judicial enforcement actions including, but not limited to, product seizures, recalls, injunctions, civil penalties, criminal prosecution, refusals to approve new products or withdrawal of existing approvals, as well as increased product liability exposure, any of which could have a material adverse effect on the Company’s business or financial condition.
Patent Protection and Trade Secrets
The Company’s success depends, in part, on its ability to secure and protect its patents, trade secrets, trademarks and other intellectual property [“IP”] rights and to operate without infringing on the proprietary rights of others or having third parties circumvent the rights that it owns or licenses. In particular, Company owned and licensed patents may not be valid, and the Company may not be able to successfully obtain and enforce patents and maintain trade secret protection for its technology. The extent to which it is unable to do so could materially harm its business.
Novadaq has applied for, is actively pursuing, or has been issued patents relating to the technology used in its proprietary imaging platform in jurisdictions including the United States, Europe, Japan, Canada, Brazil and India. Applications may not result in the issuance of any patents, and any patents now held or that may be issued may not provide the Company with adequate protection from competition. Furthermore, it is possible that patents issued or licensed to Novadaq may be challenged successfully by third parties in patent litigation. It is also possible for others to develop products which have the same effect as the Company’s products on an independent basis or to design around products that it has patented. In either event, if Novadaq is unable to secure or to continue to maintain a preferred position, any of the SPY or PINPOINT Imaging Systems could become subject to competition from the sale of generic or equivalent products.
Patents issued or licensed to the Company may be infringed by the products or processes of others. The cost of enforcing patent rights against infringers, if such infringement is required, could be significant, and the time demands could interfere with the Company’s normal operations. There has been substantial litigation and other proceedings regarding patent and other IP rights in the pharmaceutical, biotechnology and medical technology industries. The Company may become a party to patent litigation and other proceedings. The cost to the Company of any patent litigation, even if resolved in its favor, could be substantial. Some of the Company’s competitors may be able to sustain the costs of such litigation more effectively than Novadaq because of their substantially greater financial resources. Litigation may also absorb significant management time.
Unpatented trade secrets, technological innovation and confidential know-how are important to Novadaq’s commercial success. Although the Company seeks to protect its proprietary information through confidentiality agreements and other appropriate means, these measures may not effectively prevent disclosure of the Company’s proprietary information, and, in any event, the Company cannot provide assurances that others will not independently develop or gain access to the same or similar information.
MD&A | 23 |
Third-Party Intellectual Property Infringement Claims
Patent applications which may relate or affect the Company’s business may have been filed by other health care, medical device, biopharmaceutical companies and universities. Such patent applications or patents may conflict with the Company’s technologies or patent applications, and such conflict could reduce the scope of patent protection which the Company could otherwise obtain or lead to a refusal of a patent application of the Company. Novadaq could also become involved in interference proceedings in connection with one or more of its patents or patent applications to determine priority of invention.
It is not possible for the Company to be certain that it is the creator of inventions covered by pending patent applications or that it was the first to file patent applications for any such inventions. No assurance can be given that the Company’s patents, once issued, would not be declared by a court to be valid or enforceable, or that a competitor’s technology or product would not be found to infringe the Company’s products. In the event that a court was to find the Company to be infringing upon a valid patent of a third party, the Company might be required to pay license fees and/or damages and might be enjoined from conducting certain activities.
There is no assurance that the Company could enter into licensing arrangements at a reasonable cost, or develop or obtain alternative technology in respect of patents issued to third parties that incidentally cover the Company’s products. Any inability to secure licenses or alternative technology could result in delays in the introduction of some of the Company’s Products or even lead to prohibition of the development, manufacture or sale of certain Products.
Reliance on Key Personnel
The Company is dependent on certain members of its management and staff, and the loss of the services of one or more of these individuals could adversely affect the Company. In addition, Novadaq will need to continue to expand its management and employee base as it continues to support our partners in the commercialization of SPYElite,LUNA and FIREFLY and the direct U.S. launch of PINPOINT. The Company’s future financial performance, its ability to support commercialization of the SPYElite, LUNA, FIREFLY and PINPOINT Imaging Systems and to compete effectively will depend, in part, on its ability to manage any future growth effectively. The Company’s ability to manage growth will require it to continue to implement and improve its administrative, accounting and management systems, and to recruit, integrate and train new employees, including additional management, administrative, distribution, sales and marketing and potentially manufacturing personnel. Although the Company has done so in the past and expects to be able to do so in the future, there can be no assurance that the Company will successfully be able to attract and retain skilled and experienced personnel.
Research and Development Risk
A principal component of Novadaq’s business strategy is to expand its product offering to fully exploit its underlying imaging platform. As such, Novadaq’s organic growth and long-term success is partially dependent on its ability to successfully develop and market new products. Accordingly, Novadaq will likely incur significant research and development expenditures. However, there is no certainty that any investment in research and development will yield technically feasible or commercially viable products. Product development is subject to regulatory overview and approval at significant costs. Failure to introduce new products, or failure or delays in obtaining regulatory approval could materially and adversely affect Novadaq’s business and financial condition.
Novadaq’s Business is Predicated on Licensed Technology
Novadaq’s business is predicated on licensed technology and intellectual property [“IP”]. For example, the technology and IP rights that form the basis for the SPY System is licensed from third parties. This subjects Novadaq to certain risks that would not be present had Novadaq developed the technology and IP independently. Specifically, license agreements typically subject Novadaq to milestone obligations and royalty payments. Some of these obligations may be substantial and may obligate the Company to obtain certain regulatory approvals by a specified date or exercise diligence in bringing potential products to market. The failure to meet these obligations typically results in the termination of the license and the loss of rights to the technology. Any such termination could adversely affect the Company’s business and financial condition.
MD&A | 24 |
In addition, in many third party licenses, Novadaq has no control over the prosecution of patents and other IP rights underlying such licenses. As a result, Novadaq is dependent on the licensor to diligently pursue and prosecute these IP rights. In such a circumstance, the licensor may not have sufficient incentive to diligently pursue such protection. The failure of the licensor to diligently pursue such protection could adversely affect the Company’s business and financial condition.
Additionally, Novadaq typically only receives the benefit of IP protection under these licenses in those jurisdictions where applications for protection are filed. As a result, the failure of the licensor to file applications for protection in all jurisdictions where the Company intends to conduct business could undercut the ability of the Company to successfully carry on business in these jurisdictions. This could adversely affect the Company’s business and financial condition.
Finally, many third party licenses of technology expire when the patents underlying the technology expire or at some period of time after expiration. As a result, the ability of Novadaq to exploit and fully commercialize the technology over time may be limited. This may adversely affect the Company’s business and financial condition.
Ability to Partner, Out-license, Fund Corporate Assets
The Company has multiple assets that are not in the primary focus of commercialization, such as those assets purchased from Xillix for screening applications in gastrointestinal and lung cancers. The Company’s ability to profit from these technologies is not guaranteed, and if Novadaq is unable to locate an appropriate partner, out-license or fund these assets, the Company’s business and financial condition may be adversely affected.
Clinical Trials May be Unsuccessful and New Regulatory Approvals May Not be Obtained
The Company continues to explore the use of the Products in new applications and clinical trials and to develop new products. There is no assurance that the Company will receive additional regulatory approvals for the products in new applications or for any new products, which would limit the Company’s future sales and marketing opportunities in other markets.
Potential Product Liability
Medical products involve an inherent risk of product liability claims and associated adverse publicity. Novadaq currently maintains liability insurance coverage in the aggregate amount of $10 million. While the Company believes such insurance coverage to be adequate, there is no guarantee that future claims based on product liability will not exceed such amounts. In addition, should it prove impossible to obtain this type of insurance at reasonable rates or to otherwise protect the Company against potential liability proceedings, Novadaq could be required to cease the commercialization of products that it has developed or even be prevented from beginning the commercialization of new products. The Company’s obligation to pay indemnities or to withdraw a product following claims could adversely affect the Company’s business and financial condition.
Market Competition and Technological Advancements
Industrial technology in medical diagnostics and therapeutics is evolving rapidly and competition is intense. In addition to products currently in the market, additional products may be introduced to compete with those of the Company. Some of these products may use entirely different approaches or means to obtain diagnostic information or achieve therapeutic results and could be found to be more clinically effective or less expensive than those products being developed and/or commercialized by Novadaq. Moreover, many competitors, both current and potential, may have considerably greater resources at their disposal than Novadaq in terms of technology, manufacturing, product development, marketing, distribution, sales, capital and human resources. Many competitors may also have more experience in conducting clinical trials and in obtaining domestic and foreign regulatory approvals. Therefore, there can be no assurance that the Company can successfully compete with present or potential competitors or that such intense competition will not have a materially adverse effect on Novadaq’s business and financial condition.
Additionally, since the Company’s products are designed to diagnose and treat specific medical conditions, it is possible that medical or scientific advances with respect to the treatment of these conditions could render the Company’s products obsolete.
MD&A | 25 |
Foreign Exchange Fluctuations
The Company generates its sales in U.S. dollars and reports its operations in U.S. dollars, but a portion of the Company’s expenses are denominated in Canadian dollars. As such, the Company is exposed to fluctuations in the exchange rate between the U.S. dollar and the Canadian dollar as a result of the translation into U.S. dollars of its expenses denominated in Canadian dollars.
A significant part of the Company’s manufacturing and home office operations are located in Canada which result in purchases of approximately CDN$15,280,000 annually. As the exchange rate between Canada and the United States becomes volatile, a strengthening in the Canadian currency can expose the Company to an exchange loss while a strengthening in the U.S. currency can result in an exchange gain. For the twelve month reporting period ending December 31, 2012 the exchange rate commenced at $0.99 favoring U.S. currency and $1.01 closed favoring Canadian. Throughout the year the exchange rates varied from $0.96 in favor of the U.S. currency to $1.03 favoring the Canadian currency. The Company monitors the exchange rates and manages its cash holdings to address the Company’s Canadian currency spending requirements which are mainly period related.
Disclosure Controls and Procedures
The Chief Executive Officer and Chief Financial Officer designed such disclosure controls and procedures, or caused them to be designed under their supervision, to provide reasonable assurance that material information relating to the Company, including its consolidated subsidiaries, is made known to them by others within those entities, particularly during the period in which the disclosures are being prepared and in accordance with rules of the Securities Act (Ontario) and the Canadian Securities Administrators [“CSA”] as at December 31, 2012. Due to inherent limitations in control systems and procedures no matter how well conceived or operated, their evaluation can provide only reasonable, not absolute, assurance that such disclosure controls and procedures are operating effectively.
The Chief Executive Officer and Chief Financial Officer have evaluated the effectiveness of the Company’s disclosure controls and procedures as defined in the rules of the Securities Act (Ontario) and the CSA as at December 31, 2012 and have concluded that such disclosure controls and procedures are effective to ensure that information required to be disclosed by the Company in reports that it files or submits under Securities Act (Ontario) and Canadian Securities laws is: (i) recorded, processed, summarized and reported within the time periods specified in Securities Act (Ontario) rules and forms and Canadian Securities laws; and (ii) accumulated and communicated to the Company’s management, including its Chief Executive Officer and Chief Financial Officer.
Internal Control over Financial Reporting
In accordance with the United States Jumpstart Our Business Startup Act [“JOBS Act”] enacted on April 5, 2012, the Company qualifies as an “emerging growth company” [“EGC”], which entitles the Company to take advantage of certain exemptions from various reporting requirements that are applicable to other public companies that are not EGCs. Specifically, the JOBS Act defers the requirement to have the Company’s independent auditor assess the Company’s internal controls over financial reporting [“ICFR”] under Section 404(b) of the Sarbanes-Oxley Act. The JOBS Act does not defer compliance with, and Novadaq currently complies with, the requirement of Section 404(a) of the Sarbanes Oxley Act that management assess its ICFR. The Company will remain an “emerging growth company” until the earliest of (a) the last day of the first fiscal year in which its annual gross revenues exceed $1.0 billion, (b) the date that it become a “large accelerated filer” as defined in Rule 12b-2 under the United States Securities Exchange Act of 1934, as amended, which would occur if the market value of the Company’s common shares that are held by non-affiliates exceeds $700 million as of the last business day of its most recently completed second fiscal quarter, (c) the date on which the Company has issued more than $1.0 billion in nonconvertible debt during the preceding three-year period or (d) the last day of the Company’s fiscal year containing the fifth anniversary of the date on which its shares become publicly traded in the United States (currently December 31, 2017).
The Chief Executive Officer and the Chief Financial Officer have designed such internal control over financial reporting, or caused it to be designed under their supervision, to provide reasonable assurance regarding the reliability of financial reporting and the preparation of financial statements for external purposes in accordance with IFRS, rules of the Securities Act (Ontario) and the CSA as at December 31, 2012.
MD&A | 26 |
The Company, under the supervision of the Chief Executive Officer and Chief Financial Officer, has performed control self-assessments as of December 31, 2012 to evaluate the effectiveness of the Company’s internal control reporting.
As at December 31, 2012, the Chief Executive Officer and Chief Financial Officer assessed the effectiveness of the Company’s internal control over financial reporting and concluded that such internal control over financial reporting is effective and that there are no materials weaknesses in the Company’s internal control over financial reporting that have been identified by management.
Changes in Internal Control over Financial Reporting
There have been no material changes in the Company’s internal control over financial reporting that occurred during the quarter ended December 31, 2012 that have materially affected, or are reasonable likely to affect, the Company’s internal control over financial reporting.
Outstanding Share Data and Other Information
The Company is authorized to issue an unlimited number of common shares and an unlimited number of preferred shares, issuable in series.
The Company is authorized to issue an unlimited number of common shares and an unlimited number of preferred shares, issuable in series. As at the date of this MD&A, there are a total of 40,236,736 common shares, 3,165,802 stock options, $5,218,015 of convertible debentures upon exercising represent approximately 2,777,886 shares, 2,164,277 shareholder warrants and 19,210 broker warrants. Both common shareholder warrants and broker warrants are exercisable into one share.
Additional information concerning the Company, including the Company’s Annual Information Form, is available on SEDAR at www.sedar.com.
MD&A | 27 |
INDEPENDENT AUDITORS’ REPORT
To the Shareholders of
Novadaq Technologies Inc.,
We have audited the accompanying consolidated financial statements ofNovadaq Technologies Inc. (the “Company”), which comprise the consolidated statements of financial position as at December 31, 2012 and 2011 and the consolidated statements of loss and comprehensive loss, changes in shareholders’ equity and cash flows for the years ended December 31, 2012 and 2011, and a summary of significant accounting policies and other explanatory information.
Management’s responsibility for the consolidated financial statements
Management is responsible for the preparation and fair presentation of these consolidated financial statements in accordance with International Financial Reporting Standards as issued by the International Accounting Standards Board, and for such internal control as management determines is necessary to enable the preparation of consolidated financial statements that are free from material misstatement, whether due to fraud or error.
Auditors’ responsibility
Our responsibility is to express an opinion on these consolidated financial statements based on our audits. We conducted our audits in accordance with Canadian generally accepted auditing standards. Those standards require that we comply with ethical requirements and plan and perform the audit to obtain reasonable assurance about whether the consolidated financial statements are free from material misstatement. We were not engaged to perform an audit of the Company’s internal control over financial reporting. Our audits included consideration of internal control over financial reporting as a basis for designing audit procedures that are appropriate in the circumstances, but not for the purpose of expressing an opinion on the effectiveness of the Company’s internal control over financial reporting. Accordingly, we express no such opinion.
An audit involves performing procedures to obtain audit evidence about the amounts and disclosures in the consolidated financial statements. The procedures selected depend on the auditors’ judgment, including the assessment of the risks of material misstatement of the consolidated financial statements, whether due to fraud or error. An audit also includes examining, on a test basis, evidence supporting the amounts and disclosures in the consolidated financial statements, evaluating the appropriateness of accounting policies used and the reasonableness of accounting estimates made by management, as well as evaluating the overall presentation of the consolidated financial statements.
We believe that the audit evidence we have obtained in our audits is sufficient and appropriate to provide a basis for our audit opinion.
Opinion
In our opinion, the consolidated financial statements present fairly, in all material respects, the consolidated financial position ofNovadaq Technologies Inc. as at December 31, 2012 and 2011 and the consolidated statements of loss and comprehensive loss, changes in shareholders’ equity and cash flows for the years ended December 31, 2012 and 2011 in accordance with International Financial Reporting Standards as issued by the International Accounting Standards Board.
| | | | |
| | | | /s/ Ernst & Young LLP |
| Toronto, Canada | | | | Chartered Accountants |
| February 6, 2013 | | | | Licenses Public Accountants |
Auditors’ Report | 28 |
Novadaq Technologies Inc.
CONSOLIDATED STATEMENTS OF FINANCIAL POSITION
(expressed in U.S. dollars, except common shares outstanding)
| | | | | | | | | | | | |
| | | Notes | | | As at December 31,
2012 | | | As at December 31,
2011 | |
ASSETS | | | | | | | | | | | | |
Current assets | | | | | | | | | | | | |
Cash and cash equivalents | | | 19 | | | $ | 38,954,181 | | | $ | 9,633,608 | |
Accounts receivable | | | 19 | | | | 4,056,954 | | | | 2,018,782 | |
Prepaid expenses and other assets | | | | | | | 852,674 | | | | 829,625 | |
Inventories | | | 6 | | | | 1,713,577 | | | | 1,166,417 | |
Non-current assets | | | | | | | | | | | | |
Property and equipment, net | | | 8 | | | | 10,717,661 | | | | 6,623,986 | |
Deferred tax assets | | | 15 | | | | 170,442 | | | | 248,640 | |
Intangible assets, net | | | 9 | | | | 1,121,808 | | | | 2,272,434 | |
| | | | | | | | | | | | |
Total Assets | | | | | | $ | 57,587,297 | | | $ | 22,793,492 | |
| | | | | | | | | | | | |
LIABILITIES AND SHAREHOLDERS’ EQUITY | | | | | | | | | | | | |
Current liabilities | | | | | | | | | | | | |
Accounts payable and accrued liabilities | | | | | | $ | 3,407,329 | | | $ | 2,485,994 | |
Provisions | | | 13 | | | | 85,260 | | | | 41,300 | |
Deferred revenue | | | | | | | 637,864 | | | | 396,859 | |
Deferred partnership fee revenue | | | 16 | | | | 1,300,000 | | | | 1,300,000 | |
Repayable government assistance | | | 12, 14 | | | | 203,148 | | | | 197,760 | |
Non-current liabilities | | | | | | | | | | | | |
Deferred tax liabilities | | | 15 | | | | 170,442 | | | | 248,640 | |
Convertible debentures | | | 12 | | | | 4,656,746 | | | | 4,223,454 | |
Deferred revenue | | | | | | | 144,204 | | | | 188,883 | |
Deferred partnership revenue | | | 16 | | | | 3,291,666 | | | | 4,591,666 | |
Repayable government assistance | | | 12, 14 | | | | 17,946 | | | | 214,402 | |
Shareholder warrants | | | 11 | | | | 13,002,930 | | | | 8,278,105 | |
| | | | | | | | | | | | |
Total Liabilities | | | | | | $ | 26,917,535 | | | $ | 22,167,063 | |
| | | | | | | | | | | | |
Shareholders’ Equity | | | | | | | | | | | | |
Share capital | | | 21 | | | $ | 139,946,563 | | | $ | 98,695,023 | |
Contributed surplus | | | | | | | 7,908,224 | | | | 6,772,298 | |
Equity component of convertible debentures | | | 12 | | | | 1,454,353 | | | | 1,454,353 | |
Deficit | | | | | | | (118,639,378 | ) | | | (106,295,245 | ) |
| | | | | | | | | | | | |
Total Shareholders’ Equity | | | | | | $ | 30,669,762 | | | $ | 626,429 | |
| | | | | | | | | | | | |
Total Liabilities and Shareholders’ Equity | | | | | | $ | 57,587,297 | | | $ | 22,793,492 | |
| | | | | | | | | | | | |
Total number of common shares outstanding | | | 21 | | | | 40,226,243 | | | | 32,769,462 | |
| | | | | | | | | | | | |
Commitments and contingencies | | | 23 | | | | | | | | | |
These consolidated financial statements are authorized for issue by the Board of Directors on February 6, 2012. They are signed on the Company’s behalf by:
| | | | |
| On behalf of the Board: | | | | |
| /s/ Anthony Griffiths, Director | | | | /s/ William Mackinnon, Director |
See accompanying notes to the consolidated financial statements
Financials | 29 |
Novadaq Technologies Inc.
CONSOLIDATED STATEMENTS OF LOSS AND COMPREHENSIVE LOSS
FOR THE YEARS ENDED
(expressed in U.S. dollars, except per share amounts)
| | | | | | | | | | | | |
| | | Notes | | | December 31,
2012 | | | December 31,
2011 | |
Product sales | | | | | | $ | 19,037,096 | | | $ | 12,925,953 | |
Royalty revenue | | | 7 | | | | 1,849,668 | | | | 395,398 | |
Partnership fee revenue | | | 16 | | | | 1,300,000 | | | | 841,667 | |
Service revenue | | | | | | | 802,296 | | | | 1,129,423 | |
| | | | | | | | | | | | |
Total revenues | | | 24 | | | | 22,989,060 | | | | 15,292,441 | |
Cost of sales | | | | | | | 8,537,408 | | | | 6,634,206 | |
| | | | | | | | | | | | |
Gross profit | | | | | | | 14,451,652 | | | | 8,658,235 | |
| | | | | | | | | | | | |
Selling and distribution expenses | | | | | | | 4,926,376 | | | | 5,375,612 | |
Research and development expenses | | | | | | | 5,958,499 | | | | 4,610,694 | |
Administrative expenses | | | | | | | 6,573,484 | | | | 4,550,971 | |
Write-down of equipment | | | | | | | — | | | | 314,213 | |
Write-down of inventory | | | 6 | | | | 57,540 | | | | 15,287 | |
| | | | | | | | | | | | |
Total operating expenses | | | | | | | 17,515,899 | | | | 14,866,777 | |
| | | | | | | | | | | | |
Loss from operations | | | | | | | (3,064,247 | ) | | | (6,208,542 | ) |
Finance costs | | | 17 | | | | (707,500 | ) | | | (679,079 | ) |
Finance income | | | | | | | 61,798 | | | | 15,421 | |
Warrants revaluation adjustment | | | 11 | | | | (8,558,323 | ) | | | (3,306,128 | ) |
Gain on investment | | | 19 | | | | 25,000 | | | | 25,000 | |
| | | | | | | | | | | | |
Loss from operations before income taxes | | | | | | | (12,243,272 | ) | | | (10,153,328 | ) |
Income tax expense | | | | | | | (100,861 | ) | | | — | |
| | | | | | | | | | | | |
Net loss and comprehensive loss for the year | | | 22 | | | ($ | 12,344,133 | ) | | ($ | 10,153,328 | ) |
| | | | | | | | | | | | |
Basic and diluted loss and comprehensive loss per share for the year | | | 22 | | | ($ | 0.32 | ) | | ($ | 0.32 | ) |
| | | | | | | | | | | | |
See accompanying notes to the consolidated financial statements
Financials | 30 |
Novadaq Technologies Inc.
CONSOLIDATED STATEMENTS OF CHANGES IN SHAREHOLDERS’ EQUITY
(expressed in U.S. dollars)
| | | | | | | | | | | | | | | | | | | | |
| | | Share capital | | | Contributed
surplus | | | Equity component
of convertible
debentures | | | Deficit | | | Total | |
As at December 31, 2011 | | $ | 98,695,023 | | | $ | 6,772,298 | | | $ | 1,454,353 | | | ($ | 106,295,245 | ) | | $ | 626,429 | |
Net loss and comprehensive loss for the year | | | — | | | | — | | | | — | | | | (12,344,133 | ) | | | (12,344,133 | ) |
Public offering, net | | | 40,336,250 | | | | — | | | | — | | | | — | | | | 40,336,250 | |
Transaction costs | | | (3,389,352 | ) | | | — | | | | — | | | | — | | | | (3,389,352 | ) |
Exercise of options | | | 137,622 | | | | (50,130 | ) | | | — | | | | — | | | | 87,492 | |
Exercise of warrants | | | 4,167,020 | | | | (130,627 | ) | | | — | | | | — | | | | 4,036,393 | |
Share-based compensation | | | — | | | | 1,316,683 | | | | — | | | | — | | | | 1,316,683 | |
| | | | | | | | | | | | | | | | | | | | |
As at December 31, 2012 | | $ | 139,946,563 | | | $ | 7,908,224 | | | $ | 1,454,353 | | | ($ | 118,639,378 | ) | | $ | 30,669,762 | |
| | | | | | | | | | | | | | | | | | | | |
| | | | | |
| | | Share capital | | | Contributed
surplus | | | Equity component
of convertible
debentures | | | Deficit | | | Total | |
As at December 31, 2010 | | $ | 87,897,555 | | | $ | 5,985,190 | | | $ | 1,968,395 | | | ($ | 96,638,219 | ) | | ($ | 787,079 | ) |
Net loss and comprehensive loss for the year | | | — | | | | — | | | | — | | | | (10,153,328 | ) | | | (10,153,328 | ) |
Issue of common shares | | | 11,319,477 | | | | — | | | | — | | | | — | | | | 11,319,477 | |
Transaction costs | | | (739,795 | ) | | | — | | | | — | | | | — | | | | (739,795 | ) |
Exercise of options | | | 132,323 | | | | (89,659 | ) | | | — | | | | — | | | | 42,664 | |
Reclassification | | | — | | | | — | | | | (496,302 | ) | | | 496,302 | | | | — | |
Debt conversion | | | 85,463 | | | | — | | | | (17,740 | ) | | | — | | | | 67,723 | |
Share-based compensation | | | — | | | | 876,767 | | | | — | | | | — | | | | 876,767 | |
| | | | | | | | | | | | | | | | | | | | |
As at December 31, 2011 | | $ | 98,695,023 | | | $ | 6,772,298 | | | $ | 1,454,353 | | | ($ | 106,295,245 | ) | | $ | 626,429 | |
| | | | | | | | | | | | | | | | | | | | |
See accompanying notes to the consolidated financial statements
Financials | 31 |
Novadaq Technologies Inc.
CONSOLIDATED STATEMENTS OF CASH FLOWS
FOR THE YEARS ENDED
(expressed in U.S dollars)
| | | | | | | | | | | | |
| | | Notes | | | December 31,
2012 | | | December 31,
2011 | |
OPERATING ACTIVITIES | | | | | | | | | | | | |
Loss and comprehensive loss for the year | | | | | | ($ | 12,344,133 | ) | | ($ | 10,153,328 | ) |
Items not affecting cash | | | | | | | | | | | | |
Depreciation of property and equipment | | | 8,17 | | | | 2,142,633 | | | | 1,050,929 | |
Amortization of intangible assets | | | 9 | | | | 1,150,626 | | | | 1,119,691 | |
Stock-based compensation | | | 18 | | | | 1,316,683 | | | | 876,767 | |
Imputed interest on convertible debentures | | | | | | | 433,292 | | | | 398,448 | |
Warrants revaluation adjustment | | | 11 | | | | 8,558,323 | | | | 3,306,128 | |
Write-down of equipment | | | 8 | | | | — | | | | 314,213 | |
Write-down of inventory | | | 6 | | | | 57,540 | | | | 15,287 | |
Gain on investment | | | 19 | | | | (25,000 | ) | | | (25,000 | ) |
| | | | | | | | | | | | |
| | | | | | | 1,289,964 | | | | (3,096,865 | ) |
| | | | | | | | | | | | |
Changes in non-cash working capital | | | | | | | | | | | | |
Increase in accounts receivable | | | | | | | (2,038,172 | ) | | | (583,818 | ) |
Increase in inventories | | | 6 | | | | (604,700 | ) | | | (857,810 | ) |
Decrease in prepaid expenses and other assets | | | | | | | 55,149 | | | | 259,614 | |
Increase (decrease) in accounts payable | | | | | | | 839,696 | | | | (588,099 | ) |
Increase in deferred revenue | | | | | | | 263,336 | | | | 346,994 | |
| | | | | | | | | | | | |
Net change in non-cash working capital balances related to operations | | | | | | | (1,484,691 | ) | | | (1,423,119 | ) |
(Decrease) increase in long-term deferred revenue | | | | | | | (1,325,602 | ) | | | 1,656,607 | |
| | | | | | | | | | | | |
Cash used in operating activities | | | | | | | (1,520,329 | ) | | | (2,863,377 | ) |
| | | | | | | | | | | | |
INVESTING ACTIVITIES | | | | | | | | | | | | |
Purchase of property and equipment | | | 8 | | | | (6,511,829 | ) | | | (6,545,062 | ) |
Disposal of property and equipment | | | 8 | | | | 275,521 | | | | 213,492 | |
Purchase of Transmyocardial Revascularization (“TMR”) business | | | 10 | | | | — | | | | (1,000,000 | ) |
Redemption of long-term investment | | | 19 | | | | 25,000 | | | | 25,000 | |
| | | | | | | | | | | | |
Cash used in investing activities | | | | | | | (6,211,308 | ) | | | (7,306,570 | ) |
| | | | | | | | | | | | |
FINANCING ACTIVITIES | | | | | | | | | | | | |
Proceeds from issuance of common shares and warrants | | | 21 | | | | 40,336,250 | | | | 15,273,401 | |
Transaction costs paid relating to issuance of common shares and warrants | | | 21 | | | | (3,389,352 | ) | | | (998,207 | ) |
Repayable government assistance | | | | | | | (191,068 | ) | | | (95,513 | ) |
Proceeds from exercise of options | | | | | | | 87,492 | | | | 42,664 | |
Proceeds from exercise of warrants | | | | | | | 202,895 | | | | — | |
| | | | | | | | | | | | |
Cash provided by financing activities | | | | | | | 37,046,217 | | | | 14,222,345 | |
| | | | | | | | | | | | |
Net increase in cash and cash equivalents | | | | | | | 29,314,580 | | | | 4,052,398 | |
Net foreign exchange difference | | | | | | | 5,993 | | | | (16,197 | ) |
Cash and cash equivalents at beginning of year | | | | | | | 9,633,608 | | | | 5,597,407 | |
| | | | | | | | | | | | |
Cash and cash equivalents at end of year | | | | | | $ | 38,954,181 | | | $ | 9,633,608 | |
| | | | | | | | | | | | |
See accompanying notes to the consolidated financial statements
Financials | 32 |
Novadaq Technologies Inc.
NOTES TO THE CONSOLIDATED FINANCIAL STATEMENTS
FOR THE YEARS ENDED DECEMBER 31, 2012 AND 2011
(expressed in U.S dollars except as otherwise indicated)
1. ORGANIZATION
The consolidated financial statements of Novadaq Technologies Inc. [the “Company”] for the year ended December 31, 2012 were authorized for issuance in accordance with a resolution of the directors on February 6, 2013. The Company is a listed company incorporated and domiciled in Canada whose shares are publicly traded on the Toronto Stock Exchange (“TSX”) and NASDAQ. The registered office is located at 2585 Skymark Avenue, Suite 306, Mississauga, Ontario, Canada.
2. OPERATIONS
The Company was incorporated under the Canada Business Corporations Act on April 14, 2000. Novadaq Corp. was incorporated in the State of Delaware in June 2005 as a wholly owned subsidiary of the Company. The consolidated financial statements include the accounts of the Company and its subsidiary. The Company develops and commercializes medical imaging and therapeutic devices for use in the operating room. The Company’s proprietary imaging platform can be used to visualize blood vessels, nerves and the lymphatic system during surgical procedures.
3. SUMMARY OF SIGNIFICANT ACCOUNTING POLICIES
These consolidated financial statements have been prepared in accordance with International Financial Reporting Standards [“IFRS”] as issued by the International Accounting Standards Board [“IASB”].
The consolidated financial statements are presented in the currency of United States dollars [“U.S. dollars”]. They are prepared on the historical cost basis except for derivative financial instruments and available-for-sale financial instruments, which are measured at fair value. The accounting policies set out below have been applied consistently to all periods presented in these consolidated financial statements.
| | [b] | Statement of compliance |
The consolidated financial statements have been prepared in accordance with IFRS as issued by the IASB.
| | [c] | Basis of consolidation |
The consolidated financial statements include the accounts of the Company and its directly owned subsidiary Novadaq Corp. as at December 31, 2012. The subsidiary is fully consolidated from the date of acquisition, being the date on which the Company obtains control, and continues to be consolidated until the date that such control ceases. The financial statements of the subsidiary are prepared for the same reporting period as the Company, using consistent accounting policies. All intra-company balances, income and expenses and unrealized gains and losses resulting from intra-company transactions are eliminated in full.
Financials | 33 |
Novadaq Technologies Inc.
NOTES TO THE CONSOLIDATED FINANCIAL STATEMENTS
FOR THE YEARS ENDED DECEMBER 31, 2012 AND 2011
(expressed in U.S dollars except as otherwise indicated)
| | [d] | Business combinations and goodwill |
Business combinations are accounted for using the purchase method. The cost of an acquisition is measured as the fair value of the assets given, equity instruments and liabilities incurred or assumed at the date of exchange. Acquisition costs for business combinations incurred subsequent to January 1, 2010 are expensed and included in administrative expenses. Identifiable assets acquired and liabilities assumed in a business combination are measured initially at fair value at the date of acquisition.
Goodwill is initially measured at cost, being the excess of the cost of the business combination over the Company’s share in the net fair value of the acquiree’s identifiable assets, liabilities and contingent liabilities. Any negative difference is recognized directly in the consolidated statements of loss and comprehensive loss. If the fair values of the assets, liabilities and contingent liabilities can only be calculated on a provisional basis, the business combination is recognized using provisional values. Any adjustments resulting from the completion of the measurement process are recognized within 12 months of the date of acquisition.
| | [e] | Cash and cash equivalents |
Cash and cash equivalents comprise cash on hand and highly liquid investments that are readily convertible to cash with maturities of less than 90 days at the time of purchase. For the purpose of the consolidated statements of cash flows, cash and cash equivalents consist of cash and highly liquid investments as defined above, net of outstanding bank overdrafts, if any.
Inventories are valued at the lower of cost and net realizable value. Net realizable value is the estimated selling price in the ordinary course of business less the estimated costs of completion and the estimated costs necessary to make the sale. Cost is determined on a first-in, first-out basis.
| | [g] | Property and equipment |
Property and equipment are stated at cost, net of accumulated depreciation and any impairment losses determined. Cost includes the purchase price, any costs directly attributable to bringing the asset to the location and condition necessary and, where relevant, the present value of all dismantling and removal costs. All repair and maintenance costs are recognized in the consolidated statements of loss and comprehensive loss as an expense when incurred. Depreciation is provided over the estimated useful lives of the assets as follows:
| | |
Medical devices | | 2 to 5 years |
Furniture and fixtures | | 3 years |
Computer equipment | | 2 years |
Leasehold improvements | | Over the term of the lease |
Financials | 34 |
Novadaq Technologies Inc.
NOTES TO THE CONSOLIDATED FINANCIAL STATEMENTS
FOR THE YEARS ENDED DECEMBER 31, 2012 AND 2011
(expressed in U.S dollars except as otherwise indicated)
An item of property and equipment and any significant part initially recognized is derecognized upon disposal or when no future economic benefits are expected from its use or disposal. Any gain or loss arising on derecognition of the asset is included in the consolidated statements of loss and comprehensive loss when the asset is derecognized.
The assets’ useful lives and methods of depreciation are reviewed at each financial year end, and adjusted prospectively, if appropriate. No depreciation is taken on construction in progress until the asset is ready for management’s intended use.
The Company owns intangible assets consisting of licenses, SPY software and Xillix patent rights.
Intangible assets acquired separately are measured on initial recognition at cost. The cost of intangible assets acquired in a business combination is its fair value at the date of acquisition. Following initial recognition, intangible assets are carried at cost less accumulated amortization and impairment losses, if any. The useful lives of intangible assets are assessed as either finite or indefinite.
The Company currently does not hold any intangible assets with indefinite lives.
Intangible assets with finite useful lives are amortized over the useful economic life and assessed for impairment whenever there is an indication that the intangible asset may be impaired. The amortization method and amortization period of an intangible asset with a finite useful life is reviewed at least annually. Changes in the expected useful life or the expected pattern of consumption of future economic benefits embodied in the asset is accounted for by changing the amortization period or method, as appropriate, and are treated as changes in accounting estimates. The amortization expense on intangible assets with finite lives is recognized in the consolidated statements of loss and comprehensive loss in the expense category consistent with the function of the intangible assets.
Internally generated intangible assets, such as deferred development costs, are capitalized when the product or process is technically and commercially feasible and the Company has sufficient resources to complete development. The cost of an internally generated intangible asset comprises all directly attributable costs necessary to create, produce and prepare the asset to be capable of operating in the manner intended by management. Amortization of the internally generated intangible assets begins when the development is complete and the asset is available for use. It is amortized over the period of expected future benefit. Amortization is recorded in cost of sales.
Intangible assets are amortized on a straight-line basis over the lesser of their useful lives and the life of the patents, or the term of the patent rights:
| | |
TMR manufacturing license | | 2 years |
SPY software | | 2 years |
Xillix patent rights | | 5 to 15 years |
Financials | 35 |
Novadaq Technologies Inc.
NOTES TO THE CONSOLIDATED FINANCIAL STATEMENTS
FOR THE YEARS ENDED DECEMBER 31, 2012 AND 2011
(expressed in U.S dollars except as otherwise indicated)
| | [i] | Impairment of non-financial assets |
The Company assesses at each reporting date whether there is an indication that an asset may be impaired. If such an indication exists, the Company estimates the asset’s recoverable amount. The recoverable amount is the higher of an asset’s or cash-generating unit’s [“CGU”] fair value less costs to sell and its value-in-use. Where the carrying amount of an asset or CGU exceeds its recoverable amount, the asset is considered impaired and is written down to its recoverable amount.
Value-in-use is determined by discounting estimated future cash flows using a pre-tax discount rate that reflects the current market assessment of the time value of money and the specific risks of the asset. In determining fair value less costs to sell, recent market transactions are taken into account, if available. If no such transactions can be identified, an appropriate valuation model has to be used. The recoverable amount of assets that do not generate independent cash flows is determined based on the CGU to which the asset belongs.
The Company bases its impairment calculation on detailed budgets and forecast calculations which are prepared separately for each of the Company’s CGUs to which the individual assets are allocated. These budgets and forecast calculations are generally cover a period of three to five years.
An impairment loss is recognized in the consolidated statements of loss and comprehensive loss if an asset’s carrying amount or that of the CGU to which it is allocated is higher than its recoverable amount. Impairment losses of CGUs are charged against the carrying value of assets in a CGU, in proportion to their carrying amount. In the consolidated statements of loss and comprehensive loss, the impairment losses are recognized in the expense categories consistent with the function of the impaired asset.
An assessment is made at each reporting date as to whether there is any indication that previously recognized impairment losses may no longer exist or may have decreased. For purposes of impairment testing, the Company determined that it has two CGUs, namely the SPY Imaging Technology business and the TMR business.
The calculation of value-in-use for the CGU would be most sensitive to the following assumptions:
| | • | | Price development for the consumables and medical devices; and |
| | • | | Market share assumptions. |
Gross margins—Gross margins are based on historical and forecasted values.
Discount rates—Discount rates reflect the current market assessment of the risks specific to each CGU. The discount rate was estimated based on the average percentage of a weighted average cost of capital for the medical device industry.
Financials | 36 |
Novadaq Technologies Inc.
NOTES TO THE CONSOLIDATED FINANCIAL STATEMENTS
FOR THE YEARS ENDED DECEMBER 31, 2012 AND 2011
(expressed in U.S dollars except as otherwise indicated)
Price development for the consumables and medical devices—Estimates are obtained from published forecasts about the future development of applicable procedures in North America during the detailed forecast period, as well as management’s own judgments.
Market share assumptions—These assumptions are important because management assesses how the CGU’s position, relative to its competitors, might change over the budget period.
Leased assets are depreciated over the useful life of the asset. However, if there is no reasonable certainty that the Company will obtain ownership by the end of the lease term, the asset is depreciated over the shorter of the estimated useful life of the asset and the lease term.
Operating lease payments are recognized as an expense in the consolidated statements of loss and comprehensive loss on a straight-line basis over the lease term.
The Company classifies its financial instruments as either [i] financial assets at fair value through profit or loss, [ii] loans and receivables or [iii] available-for-sale, and its financial liabilities as either [i] financial liabilities at fair value through profit or loss or [ii] other financial liabilities. Appropriate classification of financial assets and liabilities is determined at the time of initial recognition or when reclassified in the consolidated statements of financial position.
All financial instruments are recognized initially at fair value plus, in the case of investments and liabilities not at fair value through profit or loss, directly attributable transaction costs. Financial instruments are recognized on the trade date, which is the date on which the Company commits to purchase or sell the asset.
There are currently no financial instruments classified as available-for-sale.
Financial assets at fair value through profit or loss:
Financial assets at fair value through profit or loss include financial assets held for trading and financial assets designated upon initial recognition at fair value through profit or loss. Financial assets are classified as held for trading if they are acquired for the purpose of selling or repurchasing in the near term.
Financial assets at fair value through profit or loss are carried at fair value. Related realized and unrealized gains and losses are included in the consolidated statements of loss and comprehensive loss in finance income or finance costs.
The Company has currently not designated any financial assets upon initial recognition as at fair value through profit or loss.
Financials | 37 |
Novadaq Technologies Inc.
NOTES TO THE CONSOLIDATED FINANCIAL STATEMENTS
FOR THE YEARS ENDED DECEMBER 31, 2012 AND 2011
(expressed in U.S dollars except as otherwise indicated)
Loans and receivables:
Loans and receivables are non-derivative financial assets with fixed or determinable payments that are not quoted in an active market. Loans and receivables are initially recognized at fair value plus transaction costs. They are subsequently measured at amortized cost using the effective interest method less any impairment. The losses arising from impairment are recognized in the consolidated statements of loss and comprehensive loss in finance costs.
Derecognition:
A financial asset is derecognized when the rights to receive cash flows from the asset have expired or when the Company has transferred its rights to receive cash flows from the asset.
Impairment of financial assets:
The Company assesses at each reporting date whether there is any objective evidence that a financial asset or a group of financial assets is impaired. A financial asset is deemed to be impaired if, and only if, there is objective evidence of impairment as a result of one or more events that have occurred after the initial recognition of the asset [an incurred ‘loss event’] and that loss event has an impact on the estimated future cash flows of the financial asset or the group of financial assets that can be reliably estimated.
For financial assets carried at amortized cost, the Company first assesses individually whether objective evidence of impairment exists individually for financial assets that are individually significant, or collectively for financial assets that are not individually significant. If the Company determines that no objective evidence of impairment exists for an individually assessed financial asset, it includes the asset in a group of financial assets with similar credit risk characteristics and collectively assesses them for impairment. Assets that are individually assessed for impairment and for which an impairment loss is, or continues to be, recognized are not included in a collective assessment of impairment.
If there is objective evidence that an impairment loss has occurred, the amount of the loss is measured as the difference between the asset’s carrying amount and the present value of estimated future cash flows.
The carrying amount of the asset is reduced through the use of an allowance account and the amount of the loss is recognized in profit or loss.
Loans and receivables together with the associated allowance are written off when there is no realistic prospect of future recovery. If, in a subsequent year, the amount of the estimated impairment loss increases or decreases because of an event occurring after the impairment was recognized, the previously recognized impairment loss is increased or reduced by adjusting the allowance account. If a write-off is later recovered, the recovery is credited to finance costs in profit or loss.
Financial liabilities at fair value through profit or loss:
Financial liabilities at fair value through profit or loss include financial liabilities held for trading and financial liabilities designated upon initial recognition at fair value through profit or loss.
Because the Company’s shareholder warrants are denominated in Canadian dollars [a currency different from the Company’s functional currency] they are recognized as a financial liability and are remeasured at fair value through profit or loss.
Financials | 38 |
Novadaq Technologies Inc.
NOTES TO THE CONSOLIDATED FINANCIAL STATEMENTS
FOR THE YEARS ENDED DECEMBER 31, 2012 AND 2011
(expressed in U.S dollars except as otherwise indicated)
Other financial liabilities:
Financial liabilities are measured at amortized cost using the effective interest rate method. Financial liabilities include long-term debt issued, which is initially measured at fair value, which is the consideration received, net of transaction costs incurred. Transaction costs related to the long-term debt instruments are included in the value of the instruments and amortized using the effective interest rate method. The effective interest expense is included in finance costs in the consolidated statements of loss and comprehensive loss.
Derecognition:
A financial liability is derecognized when the obligation under the liability is discharged or cancelled or expires.
When an existing financial liability is replaced by another from the same lender on substantially different terms, or the terms of an existing liability are substantially modified, such an exchange or modification is treated as a derecognition of the original liability and the recognition of a new liability, and the difference in the respective carrying amounts is recognized in the consolidated statements of loss and comprehensive loss.
| | [l] | Offsetting of financial instruments |
Financial assets and financial liabilities are offset and the net amount reported in the consolidated statements of financial position if, and only if, there is a currently enforceable legal right to offset the recognized amounts and there is an intention to settle on a net basis, or to realize the assets and settle the liabilities simultaneously.
| | [m] | Fair value of financial instruments |
Fair value is the estimated amount that the Company would pay or receive to dispose of the financial instrument contracts in an arm’s length transaction between knowledgeable, willing parties who are under no compulsion to act. The fair value of financial instruments that are traded in active markets at each reporting date is determined by reference to quoted market prices, without any deduction for transaction costs.
For financial instruments not traded in an active market, the fair value is determined using appropriate valuation techniques that are recognized by market participants. Such techniques may include using recent arm’s length market transactions, reference to the current fair value of another instrument that is substantially the same, discounted cash flow analysis or other valuation models.
| | [n] | Common share warrants derivatives |
The Company’s common share warrants are considered to be derivative liabilities due to the warrants being exercisable in a currency (Canadian dollar) other than the functional currency of the Company (U.S. dollar). Accordingly, the warrants are measured at fair value at each reporting date, with changes in fair value included in the statement of loss and comprehensive loss for the applicable reporting period.
Financials | 39 |
Novadaq Technologies Inc.
NOTES TO THE CONSOLIDATED FINANCIAL STATEMENTS
FOR THE YEARS ENDED DECEMBER 31, 2012 AND 2011
(expressed in U.S dollars except as otherwise indicated)
Revenue is recognized to the extent that it is probable that the economic benefits will flow to the Company and the revenue can be reliably measured, regardless of when the payment is being made. Revenue is measured at the fair value of the consideration received or receivable, taking into account contractually defined terms of payment and excluding taxes or duty. The Company assesses its revenue arrangements with all of its customers and partners against specific criteria to determine if it is acting as principal or agent. The Company has concluded that it is acting as a principal in all of its revenue arrangements. The specific recognition criteria described below must also be met before revenue is recognized.
Product sales
Product sales to customers
Revenue from the sale of medical devices and consumables is recognized when significant risks and rewards of ownership of the products have passed or transferred to the customer, usually when the products are picked up by the shipper for delivery, collection of the related receivable is probable, persuasive evidence of an arrangement exists and the sales price is fixed or determinable.
Products sales under partnership agreements
Revenue is recognized on sale of capital devices or consumable products when they are picked up by the shipper for delivery to the partners, as at that point-of-time the Company has transferred all relevant risks of ownership [inventory risks for the delivered products, credit risk for the transaction with the end customer and price risk for the transaction with the end customer] to the partners, who maintains the business relationship with the end customer. Under the current partnership agreements, the Company shares on-going revenues from its partners’ sales to end customers, net of contracted minimum pricing retained by the Company upon initial shipments to its partners, related to the SPY imaging system and the disposable products required to perform the SPY imaging procedure. The Company records any additional amounts when its partners sell to the end customer.
Rental income
Rental income arising from the rental of capital devices is recognized on a straight-line basis over the lease terms and included in product sales.
Multiple element arrangements
The Company may enter into arrangements in which it commits to provide multiple products and services to its customers occurring at different points in time. Revenue recognition for these arrangements is determined based on evaluation of the individual elements of the arrangements. If the element delivered has stand-alone value to the customer and the fair value associated with the element can be measured reliably, the amount recognized as revenue for that element is the fair value of the element in relation to the fair value of the arrangement as a whole. Otherwise, the entire arrangement is treated as one unit of accounting and revenue is deferred and recognized ratably over the remaining term of the arrangements, commencing when all elements are delivered.
Financials | 40 |
Novadaq Technologies Inc.
NOTES TO THE CONSOLIDATED FINANCIAL STATEMENTS
FOR THE YEARS ENDED DECEMBER 31, 2012 AND 2011
(expressed in U.S dollars except as otherwise indicated)
Royalty revenue
The Company earns and recognizes royalties upon sale of its products to the end user by its partner.
Partnership fee revenue
Partnership fee revenue relates to upfront payments received from partners for exclusive sales and marketing rights. Upfront payments are deferred and recognized on a straight-line basis over the exclusive sales and marketing terms.
Service revenue
Service revenue primarily relates to extended warranty services agreements in connection with capital sales. Revenue from these agreements are deferred and recognized on a straight-line basis over the extended warranty services term.
| | [p] | Foreign currency translation |
The Company’s functional currency is the U.S. dollar.
Transactions in foreign currencies are initially recorded by the Company at their respective functional currency rates prevailing at the date of the transaction.
Monetary items are translated at the functional currency spot rate as of the reporting date. Exchange differences from monetary items are recognized in profit or loss. Non-monetary items that are not carried at fair value are translated using the exchange rates as at the dates of the initial transaction. Non-monetary items measured at fair value in a foreign currency are translated using the exchange rates at the date when the fair value is determined.
The computation of basic loss per share is based on the weighted average number of common shares outstanding during the year. Diluted loss per share is calculated in a similar way to basic loss per share except that the weighted average number of common shares outstanding are increased to include additional shares assuming the exercise of stock options, warrants and convertible debenture options, if dilutive.
| | [r] | Share-based compensation plan |
Employees [including senior executives and Board members] of the Company receive remuneration in the form of stock options.
In situations where stock options are issued and some or all of the goods or services received by the entity as consideration cannot be specifically identified, the unidentified goods or services received are measured as the difference between the fair value of the share-based compensation transaction and the fair value of any identifiable goods or services received at the grant date. This is then capitalized or expensed as appropriate.
Financials | 41 |
Novadaq Technologies Inc.
NOTES TO THE CONSOLIDATED FINANCIAL STATEMENTS
FOR THE YEARS ENDED DECEMBER 31, 2012 AND 2011
(expressed in U.S dollars except as otherwise indicated)
The cost of equity-settled transactions with employees is measured by reference to the fair value at the date on which they are granted. The cost of stock option transactions is recognized, together with a corresponding increase in contributed surplus, over the period in which the performance and/or service conditions are fulfilled.
The cumulative expense recognized for share-based compensation transactions at each reporting date until the vesting date reflects the extent to which this vesting period has expired and the Company’s best estimate of the number of shares that will ultimately vest. The expense or credit recognized for a period represents the movement in cumulative expense recognized as at the beginning and end of that period and is recognized in the consolidated statements of loss and comprehensive loss in the respective function line.
When options are exercised, the amounts previously credited to contributed surplus are reversed and credited to shareholders’ equity. The amount of cash, if any, received from participants is also credited in share capital in shareholders’ equity.
Where the terms of stock options are modified, the minimum expense recognized is the expense as if the terms had not been modified, if the original terms of the award are met. An additional expense is recognized for any modification that increases the total fair value of the share-based compensation transaction, or is otherwise beneficial to the employee as measured at the date of modification.
The dilutive effect, if any, of outstanding options is reflected as additional share dilution in the computation of diluted loss per share.
| | [s] | Government contributions and grants |
Government grants are recognized where there is reasonable assurance that the grant will be received and all attached conditions will be complied with. When the grant relates to an expense item, it is recognized as income over the period necessary to match the grant on a systemic basis to the costs that it is intended to compensate. When the grant relates to an asset, it is recognized as deferred revenue and released to income in equal amounts over the expected useful life of the related asset.
Government contributions relating to research and development are recorded as a reduction of expenses when the related expenditures are incurred.
Where forgivable loans are provided by governments depending on meeting certain criteria by the Company, the forgivable loan is recorded as other operating income when there is reasonable assurance that the Company will meet the terms for forgiveness of the loan.
The Company is a taxable entity under the Income Tax Act (Canada). Current income tax assets and liabilities for the current period are measured at the amount expected to be recovered from or paid to the taxation authorities. The tax rates and tax laws used to compute the amount are those that are enacted or substantively enacted at the reporting date in the countries where the Company operates and generates taxable income. Current income tax relating to items recognized directly in equity is recognized in equity and not in the consolidated statements of loss and comprehensive loss. Management periodically evaluates positions taken in the tax returns with respect to situations in which applicable tax regulations are subject to interpretation and establishes provisions, where appropriate.
Financials | 42 |
Novadaq Technologies Inc.
NOTES TO THE CONSOLIDATED FINANCIAL STATEMENTS
FOR THE YEARS ENDED DECEMBER 31, 2012 AND 2011
(expressed in U.S dollars except as otherwise indicated)
Provisions are recognized when the Company has a present obligation, legal or constructive, as a result of a past event, it is probable that an outflow of resources embodying economic benefits will be required to settle the obligation and a reliable estimate can be made of the amount of the obligation. The expense relating to any provision is presented in the consolidated statements of loss and comprehensive loss.
Provisions for warranty-related costs for the standard one year manufacturer’s warranty are recognized when the product is sold. Initial recognition is based on historical experience and future expected costs. The initial estimate of warranty-related costs is revised annually. The time value of money is not material.
4. SIGNIFICANT ACCOUNTING ESTIMATES AND ASSUMPTIONS
The preparation of the consolidated financial statements requires the use of estimates and assumptions to be made in applying the accounting policies that affect the reported amounts of assets, liabilities, revenue, expenses and the disclosure of contingent assets and liabilities. The estimates and related assumptions are based on previous experience and other factors considered reasonable under the circumstances, the results of which form the basis of making the assumptions about carrying values of assets and liabilities that are not readily apparent from other sources.
The estimates and underlying assumptions are reviewed on an ongoing basis. Revisions to accounting estimates are recognized in the period in which the estimate is revised if the revision affects only that period or in the period of the revision and future periods if the revision affects both current and future periods. Judgments made by management in the application of IFRS that have a significant effect on the consolidated financial statements relate to the following:
Impairment of non-financial assets
The Company’s impairment test is based on value-in-use calculations that use a discounted cash flow model. The cash flows are derived from the projections for the next three to five years and are sensitive to the discount rate used as well as the expected future cash inflows and the growth rate used for extrapolation purposes.
Development costs
Initial capitalization of costs is based on management’s judgment that technical and economical feasibility is confirmed, usually when a project has reached a defined milestone according to an established project management model.
Financials | 43 |
Novadaq Technologies Inc.
NOTES TO THE CONSOLIDATED FINANCIAL STATEMENTS
FOR THE YEARS ENDED DECEMBER 31, 2012 AND 2011
(expressed in U.S dollars except as otherwise indicated)
Useful lives of key property and equipment and intangible assets
The depreciation method and useful lives reflect the pattern in which management expects the asset’s future economic benefits to be consumed by the Company.
Accounts receivable
The Company reviews its individually significant receivables at each reporting date to assess whether an impairment loss should be recorded in the consolidated statements of loss and comprehensive loss. In particular, judgment by management is required in the estimation of the amount and timing of future cash flows when determining the impairment loss. In estimating these cash flows, the Company makes judgments about the borrower’s financial situation and the net realizable value of collateral, if any. These estimates are based on assumptions about a number of factors and actual results may differ, resulting in future changes to the allowance.
Fair value of financial instruments
Where the fair value of financial assets and financial liabilities recorded in the consolidated statements of financial position cannot be derived from active markets, they are determined using valuation techniques including the discounted cash flow models. The inputs to these models are taken from observable markets. Changes in input from observable market factors could affect the reported fair value of financial instruments.
Share-based compensation
The Company measures the cost of equity-settled transactions with employees by reference to the fair value of equity instruments at the date at which they are granted. Estimating fair value for share-based compensation requires determining the most appropriate valuation model for a grant of these instruments, which is dependent on the terms and conditions of the grant. This also requires determining the most appropriate inputs to the valuation model, including the risk-free interest rate expected life of the option, volatility and dividend yield.
Shareholder warrants
In determining the fair value of the shareholder warrants, the Company used the Black-Scholes option pricing model with the following assumptions: average volatility rate; market price as at the reporting date; risk-free interest rate; the remaining expected life of the warrant; and an exchange rate as at the reporting date. The inputs used in the Black-Scholes model are taken from observable markets. In particular, changes in estimates of the fair value of the shareholder warrants can have a material impact on the reported loss and comprehensive loss for a given period.
5. STANDARDS ISSUED BUT NOT YET EFFECTIVE
Standards issued but not yet effective up to the date of issuance of the Company’s consolidated financial statements are listed below. This listing is of standards and interpretations issued, which the Company reasonably expects to be applicable at a future date. The Company intends to adopt those standards when they become effective.
Financials | 44 |
Novadaq Technologies Inc.
NOTES TO THE CONSOLIDATED FINANCIAL STATEMENTS
FOR THE YEARS ENDED DECEMBER 31, 2012 AND 2011
(expressed in U.S dollars except as otherwise indicated)
IFRS 9Financial Instruments: Classification and Measurement
In November 2009, the IASB issued IFRS 9, which covers classification and measurement as the first part of its project to replace IAS 39. In October 2010, the Board of Directors also incorporated new accounting requirements for liabilities. The standard introduces new requirements for measurement and eliminates the current classification of loans and receivables, available-for-sale and held-to-maturity, currently in IAS 39. There are new requirements for the accounting of financial liabilities as well as a carryover of requirements from IAS 39. The standard is effective for annual periods beginning on or after January 1, 2015. The Company does not anticipate early adoption and will adopt the standard when it is mandated by the IASB. The Company is currently assessing the impact of the standard on the consolidated financial statements.
IFRS 13Fair Value Measurement
IFRS 13 is a comprehensive standard for fair value measurement and disclosure requirements for use across all IFRS standards. IFRS 13 defines fair value and establishes disclosures about fair value measurement. The effective date of this amendment is for annual periods beginning on or after January 1, 2013. The Company is currently assessing the impact of the standard on the consolidated financial statements.
IAS 32Offsetting Financial Assets and Financial Liabilities
IAS 32Financial Instruments: Presentationand IFRS 7Financial Instruments: Disclosures
In December 2011, the IASB publishedOffsetting Financial Assets and Financial Liabilitiesand issued new disclosure requirements in IFRS 7Financial Instruments: Disclosures. The effective date for the amendments to IAS 32Financial Instruments: Presentationis for annual periods beginning on or after January 1, 2014.
IFRS 7Financial Instruments: Disclosures
In October 2010, the IASB issued amendments to IFRS 7Financial Instruments: Disclosures, which increase the disclosure requirements for transactions involving transfers of financial assets. The effective date for the amendments to IFRS 7 is for annual periods beginning on or after January 1, 2013. The Company does not expect implementation of these amendments to have a significant impact on its disclosures or presentation.
6. INVENTORIES
Inventories by category are as follows:
| | | | | | | | |
| | | December 31,
2012 | | | December 31,
2011 | |
| | | $ | | | $ | |
Raw materials | | | 1,168,045 | | | | 877,895 | |
Medical devices, software and parts | | | 499,502 | | | | 165,345 | |
TMR kits | | | 46,030 | | | | 123,177 | |
| | | | | | | | |
| | | 1,713,577 | | | | 1,166,417 | |
| | | | | | | | |
For the year ended December 31, 2012, the Company wrote down $57,540 of inventory to its net realizable value [2011—$15,287] and wrote up inventory of nil [2011—nil]. Inventory is valued at the lower of cost and net realizable value. Cost is determined on a first-in, first-out basis for finished goods and weighted average for raw materials.
For the year ended December 31, 2012, $1,521,412 [2011—$1,438,080] of inventory has been recognized in cost of sales.
Financials | 45 |
Novadaq Technologies Inc.
NOTES TO THE CONSOLIDATED FINANCIAL STATEMENTS
FOR THE YEARS ENDED DECEMBER 31, 2012 AND 2011
(expressed in U.S dollars except as otherwise indicated)
7. TECHNOLOGY
On January 13, 2009, the Company entered into two agreements with Intuitive Surgical® Inc. [“Intuitive”], a License and Development Agreement and a Supply Agreement. Under the License and Development Agreement, the Company and Intuitive integrated the Company’s SPY imaging technology into Intuitive’s da Vinci® robot surgical system. The Company received an initial $2,000,000 license payment upon execution of the agreements and received additional amounts totalling $3,000,000 based upon achieving certain predefined development milestones. In August 2010, the Company received the final milestone payment representing the final design review and acceptance of the integrated technology. The total receipt of $5,000,000 has been recorded as a sale of which $3,958,737 of revenue was recognized in 2010 and $1,041,263 was recognized earlier based on the cost recovery method of revenue recognition. The associated costs were recognized in the same periods.
Under the Supply Agreement, the Company is also appointed as the exclusive long-term supplier for key components of the Integrated Product and for the imaging agent used to perform each imaging procedure with the Integrated Product. Supply commenced under this agreement in February 2011, following Intuitive’s receipt of the U.S. Food and Drug Administration’s 510(k) clearance for the Integrated Product and commercialization activities were initiated.
Additionally, the Company received royalty payments for each surgical robot system sold that included the Company’s SPY imaging technology [the “Integrated Product”]. The Company has also been paid royalties for systems that have been previously sold and installed in hospitals that were field upgraded to include the Integrated Product. The royalty period commenced in February 2011 based on the first commercial sale of the Integrated Product and is renewable subject to certain terms and conditions. For the year ended December 31, 2012, the Company earned royalties of $1,849,668 [2011—$395,398] through the sales of the Integrated Product.
Financials | 46 |
Novadaq Technologies Inc.
NOTES TO THE CONSOLIDATED FINANCIAL STATEMENTS
FOR THE YEARS ENDED DECEMBER 31, 2012 AND 2011
(expressed in U.S dollars except as otherwise indicated)
8. PROPERTY AND EQUIPMENT
| | | | | | | | | | | | | | | | | | | | |
| | | Medical
devices | | | Furniture
and fixtures | | | Computer
equipment | | | Leasehold
improvements | | | Total | |
| | | $ | | | $ | | | $ | | | $ | | | $ | |
Cost: | | | | | | | | | | | | | | | | | | | | |
Balance at January 1, 2012 | | | 8,971,551 | | | | 392,190 | | | | 1,161,916 | | | | 185,902 | | | | 10,711,559 | |
Additions | | | 6,350,607 | | | | 18,223 | | | | 92,273 | | | | 50,726 | | | | 6,511,829 | |
Disposals | | | (332,443 | ) | | | — | | | | — | | | | — | | | | (332,443 | ) |
| | | | | | | | | | | | | | | | | | | | |
Balance at December 31, 2012 | | | 14,989,715 | | | | 410,413 | | | | 1,254,189 | | | | 236,628 | | | | 16,890,945 | |
| | | | | | | | | | | | | | | | | | | | |
Depreciation: | | | | | | | | | | | | | | | | | | | | |
Balance at January 1, 2012 | | | (2,488,182 | ) | | | (386,898 | ) | | | (1,121,429 | ) | | | (91,064 | ) | | | (4,087,573 | ) |
Depreciation | | | (2,039,898 | ) | | | (4,083 | ) | | | (59,346 | ) | | | (39,306 | ) | | | (2,142,633 | ) |
Disposals | | | 56,922 | | | | — | | | | — | | | | — | | | | 56,922 | |
| | | | | | | | | | | | | | | | | | | | |
Balance at December 31, 2012 | | | (4,471,158 | ) | | | (390,981 | ) | | | (1,180,775 | ) | | | (130,370 | ) | | | (6,173,284 | ) |
| | | | | | | | | | | | | | | | | | | | |
Net book value at December 31, 2012 | | | 10,518,557 | | | | 19,432 | | | | 73,414 | | | | 106,258 | | | | 10,717,661 | |
| | | | | | | | | | | | | | | | | | | | |
| | | | | |
| | | Medical
devices | | | Furniture
and fixtures | | | Computer
equipment | | | Leasehold
improvements | | | Total | |
| | | $ | | | $ | | | $ | | | $ | | | $ | |
Cost: | | | | | | | | | | | | | | | | | | | | |
Balance at January 1, 2011 | | | 5,011,226 | | | | 389,190 | | | | 1,126,622 | | | | 184,282 | | | | 6,711,320 | |
Additions | | | 6,505,148 | | | | 3,000 | | | | 35,294 | | | | 1,620 | | | | 6,545,062 | |
Write-down of equipment | | | (2,177,308 | ) | | | — | | | | — | | | | — | | | | (2,177,308 | ) |
Disposals | | | (367,515 | ) | | | — | | | | — | | | | — | | | | (367,515 | ) |
| | | | | | | | | | | | | | | | | | | | |
Balance at December 31, 2011 | | | 8,971,551 | | | | 392,190 | | | | 1,161,916 | | | | 185,902 | | | | 10,711,559 | |
| | | | | | | | | | | | | | | | | | | | |
Depreciation: | | | | | | | | | | | | | | | | | | | | |
Balance at January 1, 2011 | | | (3,573,226 | ) | | | (377,061 | ) | | | (1,048,587 | ) | | | (54,888 | ) | | | (5,053,762 | ) |
Depreciation | | | (932,074 | ) | | | (9,837 | ) | | | (72,842 | ) | | | (36,176 | ) | | | (1,050,929 | ) |
Write-down of equipment | | | 1,863,095 | | | | — | | | | — | | | | — | | | | 1,863,095 | |
Disposals | | | 154,023 | | | | — | | | | — | | | | — | | | | 154,023 | |
| | | | | | | | | | | | | | | | | | | | |
Balance at December 31, 2011 | | | (2,488,182 | ) | | | (386,898 | ) | | | (1,121,429 | ) | | | (91,064 | ) | | | (4,087,573 | ) |
| | | | | | | | | | | | | | | | | | | | |
Net book value at December 31, 2011 | | | 6,483,369 | | | | 5,292 | | | | 40,487 | | | | 94,838 | | | | 6,623,986 | |
| | | | | | | | | | | | | | | | | | | | |
During the year, write-down of equipment was nil [2011—$314,213] and recognized a loss of disposal of medical devices of $275,521 [2011—$213,492].
As at December 31, 2012, medical devices includes construction-in-progress of $1,188,369 [2011—$589,312], which are not being depreciated. Depreciation will commence when the devices are placed at medical institutions.
For the year ended December 31, 2012, additions included expenditures of $5,173,349 [2011—$5,478,835] on SPYElite placed at medical institutions to generate revenue.
Financials | 47 |
Novadaq Technologies Inc.
NOTES TO THE CONSOLIDATED FINANCIAL STATEMENTS
FOR THE YEARS ENDED DECEMBER 31, 2012 AND 2011
(expressed in U.S dollars except as otherwise indicated)
9. INTANGIBLE ASSETS
Intangible assets include licenses, SPY software and Xillix patent rights as summarized below:
| | | | | | | | | | | | | | | | |
| | | Licenses | | | SPY
software | | | Xillix patent
rights | | | Total | |
| | | $ | | | $ | | | $ | | | $ | |
Cost: | | | | | | | | | | | | | | | | |
Balance at January 1 and December 31, 2012 | | | 5,913,642 | | | | 405,195 | | | | 2,534,836 | | | | 8,853,673 | |
| | | | | | | | | | | | | | | | |
Amortization: | | | | | | | | | | | | | | | | |
Balance at January 1, 2012 | | | (5,142,503 | ) | | | (202,597 | ) | | | (1,236,139 | ) | | | (6,581,239 | ) |
Amortization | | | (711,821 | ) | | | (202,598 | ) | | | (236,207 | ) | | | (1,150,626 | ) |
| | | | | | | | | | | | | | | | |
Balance at December 31, 2012 | | | (5,854,324 | ) | | | (405,195 | ) | | | (1,472,346 | ) | | | (7,731,865 | ) |
| | | | | | | | | | | | | | | | |
Net book value at December 31, 2012 | | | 59,318 | | | | — | | | | 1,062,490 | | | | 1,121,808 | |
| | | | | | | | | | | | | | | | |
| | | | |
| | | Licenses | | | SPY
software | | | Xillix patent
rights | | | Total | |
| | | $ | | | $ | | | $ | | | $ | |
Cost: | | | | | | | | | | | | | | | | |
Opening balance at January 1, 2011 | | | 4,490,000 | | | | 405,195 | | | | 2,534,836 | | | | 7,430,031 | |
Additions | | | 1,423,642 | | | | — | | | | — | | | | 1,423,642 | |
| | | | | | | | | | | | | | | | |
Balance at December 31, 2011 | | | 5,913,642 | | | | 405,195 | | | | 2,534,836 | | | | 8,853,673 | |
| | | | | | | | | | | | | | | | |
Amortization: | | | | | | | | | | | | | | | | |
Opening balance at January 1, 2011 | | | (4,490,000 | ) | | | — | | | | (971,548 | ) | | | (5,461,548 | ) |
Amortization | | | (652,503 | ) | | | (202,597 | ) | | | (264,591 | ) | | | (1,119,691 | ) |
| | | | | | | | | | | | | | | | |
Balance at December 31, 2011 | | | (5,142,503 | ) | | | (202,597 | ) | | | (1,236,139 | ) | | | (6,581,239 | ) |
| | | | | | | | | | | | | | | | |
Net book value at December 31, 2011 | | | 771,139 | | | | 202,598 | | | | 1,298,697 | | | | 2,272,434 | |
| | | | | | | | | | | | | | | | |
The Xillix patent rights include a portfolio of owned and licensed patents which are being amortized over the term of the patents ranging from 5 to 15 years.
10. ACQUISITION OF PLC SYSTEMS INC.
Effective February 1, 2011, and based on the asset purchase agreement from November 8, 2010, the Company acquired Laser System Business for TMR from PLC Systems Inc. [“PLC”]. Under the terms of the agreement, the Company has acquired all assets employed by PLC in the TMR business including manufacturing rights, product inventories, equipment, intellectual property, regulatory approvals, clinical data and all documentation related to TMR.
Financials | 48 |
Novadaq Technologies Inc.
NOTES TO THE CONSOLIDATED FINANCIAL STATEMENTS
FOR THE YEARS ENDED DECEMBER 31, 2012 AND 2011
(expressed in U.S dollars except as otherwise indicated)
The acquisition has been accounted for by the purchase method with the results of the TMR operations included in the Company’s consolidated statements of loss and comprehensive loss from the date of acquisition. The assets and liabilities of the TMR business as at the date of acquisition were:
| | | | |
| | | $ | |
Inventories | | | 146,003 | |
Property and equipment | | | 17,095 | |
TMR manufacturing license [note 9] | | | 1,423,642 | |
| | | | |
Purchase consideration | | | 1,586,740 | |
| | | | |
The purchase consideration consisted of $1,000,000 cash paid and the settlement of the Company’s prepaid asset of $586,740 stemming from the pre-existing relationship with PLC. The allocation of the purchase price to acquired assets and liabilities is based on the fair value assessed for each of the individual acquired assets and liabilities.
From the date of acquisition (February 1, 2011) to December 31, 2011, the TMR business had contributed $4,065,000 of revenue and $621,000 to the net profit of the Company. If the combination had taken place at the beginning of that year, revenue would have increased by $4,289,000 and the profit would have been $665,000. Transaction costs of $136,644 were expensed and included in administrative expenses.
11. WARRANTS
| | | | | | | | | | | | | | | | | | | | | | | | | | | | |
| | | Broker | | | Shareholder | | | Shareholder | | | | |
| | | Warrants | | | Amount | | | Warrants | | | Amount | | | Warrants | | | Amount | | | Total | |
| | | # | | | $ | | | # | | | $ | | | # | | | $ | | | $ | |
January 1, 2011 | | | 128,066 | | | | 153,679 | | | | 609,838 | | | | 1,276,464 | | | | — | | | | — | | | | 1,430,143 | |
Issued | | | — | | | | — | | | | — | | | | — | | | | 2,129,339 | | | | 3,695,513 | | | | 3,695,513 | |
Exercised | | | (50,000 | ) | | | (60,000 | ) | | | — | | | | — | | | | — | | | | — | | | | (60,000 | ) |
Revaluation | | | — | | | | — | | | | — | | | | 491,975 | | | | — | | | | 2,814,153 | | | | 3,306,128 | |
| | | | | | | | | | | | | | | | | | | | | | | | | | | | |
Balance at December 31, 2011 | | | 78,066 | | | | 93,679 | | | | 609,838 | | | | 1,768,439 | | | | 2,129,339 | | | | 6,509,666 | | | | 8,371,784 | |
Exercised | | | (58,856 | ) | | | (70,627 | ) | | | (67,407 | ) | | | (437,889 | ) | | | (507,493 | ) | | | (3,395,609 | ) | | | (3,904,125 | ) |
Revaluation | | | — | | | | — | | | | — | | | | 1,924,278 | | | | — | | | | 6,634,045 | | | | 8,558,323 | |
| | | | | | | | | | | | | | | | | | | | | | | | | | | | |
Balance at December 31, 2012 | | | 19,210 | | | | 23,052 | | | | 542,431 | | | | 3,254,828 | | | | 1,621,846 | | | | 9,748,102 | | | | 13,025,982 | |
| | | | | | | | | | | | | | | | | | | | | | | | | | | | |
On March 24, 2011, the Company closed a private placement of U.S. $14,280,240, net of transaction costs of $998,207, in exchange for 4,731,864 units at a price of CDN $3.17 per unit. Each unit consists of one common share and 0.45 of a warrant, representing 2,129,339 warrants. Each warrant has a five-year term and is exercisable for one common share at an exercise price of CDN $3.18 per share. Because such warrants were denominated in Canadian dollars [a currency different from the Company’s functional currency] they are recognized as a financial liability at fair value through profit or loss. In determining the fair value of the warrants, the Company used the Black-Scholes option pricing model with the following assumptions: average volatility rate of 66%; risk-free interest rate of 1.98%; expected life of five years; and an exchange rate of 1.026. The value of $3,695,513, net of transaction costs, was established on March 24, 2011 and subsequently revalued on December 31, 2011 utilizing the Black-Scholes option pricing model with the
Financials | 49 |
Novadaq Technologies Inc.
NOTES TO THE CONSOLIDATED FINANCIAL STATEMENTS
FOR THE YEARS ENDED DECEMBER 31, 2012 AND 2011
(expressed in U.S dollars except as otherwise indicated)
following assumptions: average volatility rate of 64%; risk-free interest rate of 1.85%; expected life of 4.23 years; and exchange rate of 0.980. The fair value of the warrants before transaction costs were initially U.S. $1.86 per warrant at issuance and at December 31, 2011 were valued at U.S. $3.06 per warrant.
As at December 31, 2012, the warrants were revalued at U.S. $6.01 per warrant utilizing the following assumptions: volatility rate of 47%; risk-free interest rate of 1.80%; expected life of 3.23 years; and an exchange rate of 1.0051.
In February 2010, the Company closed a private placement of U.S. $6,610,157, net of cash transaction costs of $511,180 in which 3,049,205 units at CDN $2.43 per unit were issued. Each unit is comprised of one common share and one-fifth warrant. Each warrant has a five-year term and is exercisable for one common share at an exercise price of CDN $3.00. Because such warrants were denominated in Canadian dollars [a currency different from the Company’s functional currency] they are recognized as a financial liability at fair value through profit or loss. Broker cashless warrants of 128,066 were also issued as part of broker compensation which are exercisable for one common share at CDN $2.82 over a three-year term. Such broker warrants represented compensation provided to the brokers in connection with the private placement and were accounted for as non-cash transaction costs. The fair value of broker compensation for the services provided approximated the fair value of those warrants. In determining the fair value of the warrants, the Company used the Black-Scholes option pricing model with the following assumptions: average volatility rate of 69%; risk-free interest rate of 1.88%; and expected life of five years for shareholder warrants and three years for broker warrants. Shareholder warrants were initially established at U.S. $1.47 and closed on December 31, 2010 at U.S. $2.09.
As at December 31, 2012, the warrants were revalued at U.S. $6.00 per warrant utilizing the following assumptions: volatility rate of 46%; risk-free interest rate of 1.80%; expected life of 2.14 years; and an exchange rate of 1.0051.
12. INTEREST-BEARING LOANS AND BORROWINGS
| | | | | | | | | | | | |
| | | Maturity | | | December 31,
2012
$ | | | December 31,
2011
$ | |
Interest-bearing loans and borrowings | | | | | | | | | | | | |
Repayable government assistance | | | 31/01/2014 | | | | 221,094 | | | | 412,162 | |
Non-current interest-bearing loans and borrowings | | | | | | | | | | | | |
Convertible debentures | | | 18/02/2014 | | | | 4,656,746 | | | | 4,223,454 | |
| | | | | | | | | | | | |
Total interest-bearing loans and borrowings | | | | | | | 4,877,840 | | | | 4,635,616 | |
| | | | | | | | | | | | |
On February 18, 2009, the Company completed a private placement in the amount of $5,150,000 of senior, unsecured, convertible debentures maturing on February 18, 2014 [the “Debentures”]. Fairfax Financial Holdings Limited and certain of its subsidiaries subscribed for $5,000,000 and certain members of management of the Company subscribed for $150,000. The Debentures are convertible, at the option of the holder, at any time prior to maturity, into common shares of the Company at a conversion price of CDN $2.33 [U.S. $1.87] per share, subject to anti-dilution adjustments.
Financials | 50 |
Novadaq Technologies Inc.
NOTES TO THE CONSOLIDATED FINANCIAL STATEMENTS
FOR THE YEARS ENDED DECEMBER 31, 2012 AND 2011
(expressed in U.S dollars except as otherwise indicated)
The Debentures bear an interest rate of 5% per annum on the full amount, payable in arrears, in equal, semi-annual instalments, in cash, or at the option of the Company, in additional debentures. The effective interest rate is 9.9%. On maturity of the Debentures, the Company has the option of repaying the principal in cash or in common shares at a conversion rate equal to 95% of the weighted average trading price of the common shares on the Toronto Stock Exchange for the 20 trading days preceding the maturity date. In the event a Fundamental Change occurs [defined as the occurrence of a “Change of Control” or a “Termination of Trading”] following the original issuance of the Debentures, it may result in the Company repurchasing the Debentures at 110% of the Debenture amount, plus accrued and unpaid interest, subject to repurchasing terms in the Debenture Agreement.
On December 31, 2009, the Company and debenture holders executed the First Amending Agreement to the original Debenture Agreement permitting flexible interest rate revisions. The Company exercised its right to issue payment-in-kind [“PIK”] debentures for $153,478 in lieu of six months’ cash interest payment due on December 31, 2009. The PIK debentures are convertible into common shares of the Company with a conversion price of CDN $2.62 [U.S. $2.23] per share. All other terms are subject to the terms of the original Debenture Agreement. The effective interest rate is 6.6%.
The Debentures are required to be classified in their liability and equity components as determined by their fair values. The Company determined the liability component by discounting the Debentures of February 18, 2009 using a rate of 16.5% based on an assessment of similar companies in the marketplace. Similarly, the PIK debentures of December 31, 2009 were discounted utilizing a rate of 13.1%.
As at December 31, 2012, the principal value of the Debentures was $5,218,015 [2011—$5,218,015] and the interest expense paid for the year ended December 31, 2012 was $260,952 [2011—$264,120].
13. PROVISIONS
Provisions are recognized for extended warranty claims on products sold during the last 12 months based on past experience of the level of repairs and returns. It is expected that all of these warranty claims will be incurred in the next financial year. Assumptions used to calculate the provision for warranties were based on current sales levels and current information available about warranty costs.
| | | | | | | | |
| | | December 31,
2012
$ | | | December 31,
2011
$ | |
Balance at January 1 | | | 41,300 | | | | 19,520 | |
Arising during the period | | | 115,200 | | | | 45,760 | |
Utilization of accrual | | | (71,240 | ) | | | (23,980 | ) |
| | | | | | | | |
Balance at December 31 | | | 85,260 | | | | 41,300 | |
| | | | | | | | |
Financials | 51 |
Novadaq Technologies Inc.
NOTES TO THE CONSOLIDATED FINANCIAL STATEMENTS
FOR THE YEARS ENDED DECEMBER 31, 2012 AND 2011
(expressed in U.S dollars except as otherwise indicated)
14. GOVERNMENT GRANTS AND CREDITS
Repayable government assistance
The Company has received contributions totalling CDN $985,050 from the National Research Council of Canada [“NRC”] Industrial Research Assistance Program. The NRC contributed to two separate projects. This contribution was conditionally repayable commencing in 2004 for one project, and commencing in 2005 for the other project. For each project, the Company is obligated to pay the NRC 1% of its gross revenue. The Company’s obligation ceases if 150% of the contribution is repaid within the first three years of the repayment period. The Company is expected to repay its obligation in full by earlier of February 2014 based on the repayment schedule agreed upon with NRC or by March 2015.
Because the Company has repaid a material portion of the contributions from the NRC and is expecting to repay the remaining amount, it is not reasonably assured that the Company will meet the terms for forgiveness of the loan. Therefore, the Company has recorded such contribution from the NRC as a liability at the time when such contributions were made. As at December 31, 2012, the Company has a repayable government assistance totalling $221,094 [2011—$412,162] representing the outstanding principal balance, repayable in equal monthly instalments of $17,007 over the next 13 months.
Investment tax credits
The Company is eligible to receive refundable Ontario Innovation Tax Credits and non-refundable Federal Investment Tax Credits as a result of incurring eligible expenditures for Scientific Research and Experimental Development. Such investment tax credits are deducted from the research and development expenses.
15. INCOME TAXES
The Company offsets tax assets and liabilities if and only if it has a legally enforceable right to offset the current tax assets and current tax liabilities or deferred tax assets and deferred tax liabilities and they relate to taxes levied by the same tax authority.
The tax benefits of the following unused tax losses and deductible temporary differences have not been recognized for financial statement purposes:
| | | | | | | | |
| | | 2012 | | | 2011 | |
Deductible temporary differences | | $ | | | $ | |
Non-capital losses | | | 93,181,000 | | | | 81,055,000 | |
Investment Tax Credits (“ITC”) | | | 809,000 | | | | 794,000 | |
Scientific research and experimental development expenses | | | 2,773,000 | | | | 2,722,000 | |
Accrued warranty and reserves, and accrued inter-company royalty | | | 3,564,000 | | | | 1,332,000 | |
Share issue costs | | | 3,522,000 | | | | 1,281,000 | |
Warrants and other | | | 7,636,000 | | | | 3,225,000 | |
Property and equipment and licenses | | | 16,986,000 | | | | 25,962,000 | |
Net unrecognized deductible temporary differences | | | (128,471,000 | ) | | | (116,371,000 | ) |
| | | | | | | | |
| | | — | | | | — | |
| | | | | | | | |
Financials | 52 |
Novadaq Technologies Inc.
NOTES TO THE CONSOLIDATED FINANCIAL STATEMENTS
FOR THE YEARS ENDED DECEMBER 31, 2012 AND 2011
(expressed in U.S dollars except as otherwise indicated)
A reconciliation between the Company’s statutory and effective tax rates is presented below:
| | | | | | | | |
| | | December 31,
2012 | | | December 31,
2011 | |
| | | % | | | % | |
Statutory rate | | | 25.3 | | | | 27.0 | |
Permanent differences | | | (3.9 | ) | | | (3.7 | ) |
Impact of foreign income tax rate differential | | | (1.2 | ) | | | — | |
Change in enacted rates and true up | | | 2.4 | | | | — | |
Unrecognized benefit of current year’s tax loss and other | | | (22.6 | ) | | | (23.3 | ) |
US alternative minimum tax and state tax | | | (0.8 | ) | | | — | |
| | | | | | | | |
Effective tax rate | | | (0.8 | ) | | | — | |
| | | | | | | | |
The Company has available research and development expenditures for income tax purposes, which may be carried forward indefinitely to reduce future years’ taxable income. The potential income tax benefits associated with these expenditures have not been recorded in the consolidated financial statements. The total of such expenditures accumulated to December 31, 2012 is approximately $2,773,000 [2011—$2,714,000].
At December 31, 2012, the Company has $66,430,000 of Canadian non-capital loss carryfowards [2011—$61,267,000] that will expire from 2014 to 2032, and $26,751,000 of US non-capital losses [2011—$26,733,000) that will expire from 2014 to 2032.
The Company has unclaimed Canadian scientific research investment tax credits of $807,000 [2011—$791,000] that will expire from 2020 to 2028.
16. MARKETING AND DISTRIBUTION AGREEMENTS
LifeCell™ Corporation and Kinetics Concepts Inc.
On November 29, 2011, the Company, LifeCell™ Corporation [“LifeCell”] and LifeCell’s parent company, Kinetics Concepts Inc. [“KCI”], signed exclusive multi-year marketing and sales distribution alliance agreements for the commercialization of the Company’s SPY imaging system for additional surgical and wound care applications in North American and certain other markets. As part of the agreements the Company received $3,000,000 upon executing the agreement and will receive further unrelated milestone payments. These unrelated milestone payments will consist of $1,000,000 for delivery of a newly designed wound care device for KCI to use in clinical studies and a further $1,000,000 upon delivery of the first commercial sale or rental of a wound care device. Additionally, KCI or its affiliates, including LifeCell, will pay the Company $1,000,000 upon the first commercial sale or rental of a SPY device in Japan and will also pay the Company $1,000,000 for the first commercial sale or rental of a SPY device in the Middle East, Europe or Africa. Under the agreements, the Company will equally share on-going revenues from LifeCell’s and KCI’s sales to end customers related to the SPY imaging system and the disposable products required to perform the SPY imaging procedure, net of contracted minimum pricing retained by the Company upon initial shipments to LifeCell or KCI. LifeCell and KCI will provide sales and marketing and distribution activities to the end customer. The Company will continue to be responsible for research and development, manufacturing and field service.
Financials | 53 |
Novadaq Technologies Inc.
NOTES TO THE CONSOLIDATED FINANCIAL STATEMENTS
FOR THE YEARS ENDED DECEMBER 31, 2012 AND 2011
(expressed in U.S dollars except as otherwise indicated)
On September 1, 2010, the Company entered into a five-year agreement with LifeCell, providing exclusive rights to market and distribute the Company’s SPY imaging system in the fields of plastic reconstructive, gastrointestinal and head and neck surgery in North America. Under the terms of the agreement, the Company received $5,000,000 including $1,000,000 from KCI, for which KCI received 281,653 shares of the Company’s common stock at a price of CDN $3.75 per share. Under the agreement, the Company shares on-going revenues from LifeCell’s sales to end customers related to the SPY imaging system and the disposable products required to perform the SPY imaging procedure, net of contracted minimum pricing retained by the Company upon initial shipments to LifeCell. LifeCell will provide market development and commercialization activities, including professional education, clinical support, reimbursement and sales distribution for the SPY imaging system. The Company will continue to be responsible for research and development, manufacturing and field service.
As at December 31, 2012, the Company’s deferred partnership fee revenues of $4,591,666 [2011—$5,891,666] represents the current and long-term portions of deferred partnership fee revenues for both the LifeCell and the LifeCell/KCI agreements.
MAQUET Cardiovascular, LLC
On January 3, 2012, the Company entered into an agreement with MAQUET Cardiovascular, LLC [“MAQUET”], naming MAQUET as the exclusive United States distributor of the Company’s CO2 Heart Laser™ System TMR and the procedure kits required to perform the TMR procedure. The agreement provides for a revenue sharing formula with respect to the sales and marketing services being provided by MAQUET and the Company supplying and supporting the products.
Financials | 54 |
Novadaq Technologies Inc.
NOTES TO THE CONSOLIDATED FINANCIAL STATEMENTS
FOR THE YEARS ENDED DECEMBER 31, 2012 AND 2011
(expressed in U.S dollars except as otherwise indicated)
17. FINANCE COSTS AND OPERATING EXPENSES
[a] Finance costs
| | | | | | | | |
| | | December 31,
2012 | | | December 31,
2011 | |
| | | $ | | | $ | |
Cash paid interest on repayable government assistance | | | 13,256 | | | | 16,511 | |
Cash paid interest on convertible debentures | | | 260,952 | | | | 264,120 | |
Imputed interest on convertible debentures | | | 433,292 | | | | 398,448 | |
| | | | | | | | |
| | | 707,500 | | | | 679,079 | |
| | | | | | | | |
[b] Depreciation and cost of inventories included in the consolidated statements of loss and comprehensive loss
| | | | | | | | |
| | | December 31,
2012 | | | December 31,
2011 | |
| | | $ | | | $ | |
Included in cost of sales | | | | | | | | |
Depreciation | | | 1,938,294 | | | | 922,065 | |
Cost of inventories recognized as an expense | | | 1,521,412 | | | | 1,438,080 | |
Included in administrative expenses | | | | | | | | |
Depreciation | | | 62,687 | | | | 128,864 | |
Included in research and development expenses | | | | | | | | |
Depreciation | | | 141,652 | | | | — | |
| | | | | | | | |
[c] Employee and benefits expense
| | | | | | | | |
| | | December 31,
2012 | | | December 31,
2011 | |
| | | $ | | | $ | |
Wages and salaries | | | 6,007,884 | | | | 5,189,089 | |
Benefit and bonus expense | | | 1,423,972 | | | | 1,315,060 | |
Social security costs/benefits | | | 176,209 | | | | 134,977 | |
| | | | | | | | |
| | | 7,608,065 | | | | 6,639,126 | |
| | | | | | | | |
[d] Lease payment expense
The Company has recognized $400,513 in lease expense for the year ended December 31, 2012 [2011—$194,539].
Financials | 55 |
Novadaq Technologies Inc.
NOTES TO THE CONSOLIDATED FINANCIAL STATEMENTS
FOR THE YEARS ENDED DECEMBER 31, 2012 AND 2011
(expressed in U.S dollars except as otherwise indicated)
18. SHARE-BASED COMPENSATION PLAN
On March 29, 2005, the Company established an amended stock option plan [the “Plan”] for the employees, directors, senior officers and consultants of the Company and any affiliate of the Company which governs all options issued under its previously existing stock option plans and future option grants made under the Plan. On May 15, 2008, the shareholders at the annual and special meeting approved the “Second Amended and Restated Stock Option Plan”, which was an amendment to the Plan.
Under the Plan, options to purchase common shares of the Company may be granted by the Board of Directors. Options granted under the Plan will have an exercise price of not less than the volume-weighted average trading price of the common shares for the five trading days preceding the date on which the options are granted. The maximum aggregate number of common shares which may be subject to options under the Plan is 10% of the common shares of the Company outstanding from time to time.
Options granted under the Plan will generally vest over a three-year period and may be exercised in whole or in part at any time as follows: 33% on or after the first anniversary of the grant date, 67% on or after the second anniversary of the grant date and 100% on or after the third anniversary of the grant date. Options expire on the tenth anniversary of the grant date. Any options not exercised prior to the expiry date will become null and void. In connection with certain change of control transactions, including a take-over bid, merger or other structured acquisition, the Board of Directors may accelerate the vesting date of all unvested options such that all optionees will be entitled to exercise their full allocation of options and in certain circumstances, where such optionee’s employment is terminated in connection with such transaction, such accelerated vesting will be automatic. Options granted under the Plan will terminate on the earlier of the expiration of the option or 180 days following the death of the optionee or termination of the optionee’s employment because of permanent disability, as a result of termination of the optionee’s employment because of retirement of an optionee or as a result of such optionee ceasing to be a director, or 30 days following termination of an optionee.
The share-based compensation cost that has been recognized for the year ended December 31, 2012 and included in the respective function line in the consolidated statements of loss and comprehensive loss is $1,316,684 [2011—$876,767] with a corresponding increase to contributed surplus.
Financials | 56 |
Novadaq Technologies Inc.
NOTES TO THE CONSOLIDATED FINANCIAL STATEMENTS
FOR THE YEARS ENDED DECEMBER 31, 2012 AND 2011
(expressed in U.S dollars except as otherwise indicated)
A summary of the options outstanding as at December 31, 2012 and 2011 under the Plan are presented below:
| | | | | | | | | | | | | | | | |
| | | December 31, 2012 | | | December 31, 2011 | |
| | | Number
outstanding | | | Weighted
average
exercise price | | | Number
outstanding | | | Weighted
average
exercise price | |
| | | # | | | $ | | | # | | | $ | |
Options outstanding, beginning of year | | | 2,589,211 | | | | 3.18 | | | | 2,339,556 | | | | 2.93 | |
Options granted | | | 518,250 | | | | 6.77 | | | | 370,500 | | | | 4.27 | |
Options exercised | | | (24,363 | ) | | | 2.79 | | | | (72,589 | ) | | | 1.53 | |
Options forfeited | | | (16,803 | ) | | | 4.00 | | | | (48,256 | ) | | | 2.10 | |
| | | | | | | | | | | | | | | | |
Options outstanding, end of year | | | 3,066,295 | | | | 3.98 | | | | 2,589,211 | | | | 3.18 | |
| | | | | | | | | | | | | | | | |
Options exercisable, end of year | | | 2,192,098 | | | | 3.35 | | | | 1,767,267 | | | | 3.09 | |
| | | | | | | | | | | | | | | | |
The following table lists the inputs to the Black-Scholes option pricing model used for the Plan for the year ended December 31, 2012 and 2011.
| | | | | | | | |
| | | December 31,
2012 | | | December 31,
2011 | |
Dividend yield | | | — | | | | — | |
Expected volatility rate | | | 63 | % | | | 66 | % |
Risk-free interest rate | | | 1.80 | % | | | 1.98 | % |
Expected life of share options for employees | | | 4.0 years | | | | 8.6 years | |
Weighted average share price | | $ | 6.77 | | | $ | 4.27 | |
| | | | | | | | |
The expected life of the stock options is based on historical data and current expectations and is not necessarily indicative of exercise patterns that may occur. The expected volatility reflects the assumption that the historical volatility over a period similar to the options is indicative of future trends, which may also not necessarily be the actual outcome.
There have been no modifications to the Plan during the years presented in the consolidated financial statements.
Financials | 57 |
Novadaq Technologies Inc.
NOTES TO THE CONSOLIDATED FINANCIAL STATEMENTS
FOR THE YEARS ENDED DECEMBER 31, 2012 AND 2011
(expressed in U.S dollars except as otherwise indicated)
19. FINANCIAL INSTRUMENTS AND FINANCIAL RISK MANAGEMENT
[a] Fair value
Set out below is a comparison by class of the carrying amounts and fair value of the Company’s financial instruments that are carried in the consolidated financial statements:
| | | | | | | | | | | | | | | | |
| | | December 31, 2012 | | | December 31, 2011 | |
| | | Carrying
amount | | | Fair value | | | Carrying
amount | | | Fair value | |
| | | $ | | | $ | | | $ | | | $ | |
Financial assets | | | | | | | | | | | | | | | | |
Held-for-trading | | | | | | | | | | | | | | | | |
Cash and cash equivalents | | | 38,954,181 | | | | 38,954,181 | | | | 9,633,608 | | | | 9,633,608 | |
Loans and receivables | | | | | | | | | | | | | | | | |
Accounts receivable | | | 4,056,954 | | | | 4,056,954 | | | | 2,018,782 | | | | 2,018,782 | |
| | | | | | | | | | | | | | | | |
| | | 43,011,135 | | | | 43,011,135 | | | | 11,652,390 | | | | 11,652,390 | |
| | | | | | | | | | | | | | | | |
Financial liabilities | | | | | | | | | | | | | | | | |
Derivative financial liabilities at fair value through profit or loss | | | | | | | | | | | | | | | | |
Shareholder warrants | | | 13,002,930 | | | | 13,002,930 | | | | 8,278,105 | | | | 8,278,105 | |
Other financial liabilities | | | | | | | | | | | | | | | | |
Convertible debentures | | | 4,656,746 | | | | 4,656,746 | | | | 4,223,454 | | | | 4,223,454 | |
Repayable government assistance | | | 221,094 | | | | 221,094 | | | | 412,162 | | | | 412,162 | |
Accounts payable and accrued liabilities and provisions | | | 3,492,589 | | | | 3,492,589 | | | | 2,527,294 | | | | 2,527,294 | |
| | | | | | | | | | | | | | | | |
| | | 21,373,359 | | | | 21,373,359 | | | | 15,441,015 | | | | 15,441,015 | |
| | | | | | | | | | | | | | | | |
The fair values of the financial assets and liabilities are shown at the amount at which the instrument could be exchanged in a current transaction between willing parties, other than in a forced or liquidation sale.
The following methods and assumptions were used to estimate the fair values:
| | • | | Cash and cash equivalents, accounts receivable, repayable government assistance, accounts payable and accrued liabilities and provisions approximate their carrying amounts largely due to the short-term maturities of these instruments. |
| | • | | Convertible debentures are evaluated by the Company based on parameters such as interest rates and the risk characteristics of the instrument. |
| | • | | The fair value of the warrants is estimated using the Black-Scholes option pricing model incorporating various inputs including the underlying price volatility and discount rate. |
Financials | 58 |
Novadaq Technologies Inc.
NOTES TO THE CONSOLIDATED FINANCIAL STATEMENTS
FOR THE YEARS ENDED DECEMBER 31, 2012 AND 2011
(expressed in U.S dollars except as otherwise indicated)
[b] Fair value hierarchy
The Company uses the following hierarchy for determining and disclosing the fair value of financial instruments by valuation technique:
| | • | | Level 1—Inputs to the valuation methodology are quoted prices [unadjusted] for identical assets or liabilities in active markets. |
| | • | | Level 2—Inputs to valuation methodology include quoted prices for similar assets and liabilities in active markets, and inputs that are observable for the asset or liability, either directly or indirectly, for substantially the full term of the financial instrument. |
| | • | | Level 3—Inputs to the valuation methodology are unobservable and significant to the fair value measurement. |
The fair value hierarchy of financial instruments measured at fair value on the consolidated statements of financial position is as follows:
| | | | | | | | | | | | | | | | | | | | | | | | |
| | | December 31, 2012 | | | December 31, 2011 | |
| | | Level 1 | | | Level 2 | | | Level 3 | | | Level 1 | | | Level 2 | | | Level 3 | |
| | | $ | | | $ | | | $ | | | $ | | | $ | | | $ | |
Financial assets | | | | | | | | | | | | | | | | | | | | | | | | |
Cash and cash equivalents | | | 38,954,181 | | | | — | | | | — | | | | 9,633,608 | | | | — | | | | — | |
Financial liabilities | | | | | | | | | | | | | | | | | | | | | | | | |
Shareholder warrants | | | — | | | | 13,002,930 | | | | — | | | | — | | | | 8,278,105 | | | | — | |
| | | | | | | | | | | | | | | | | | | | | | | | |
During the reporting periods, there were no transfers between Level 1 and Level 2 fair value measurements.
The Company has non-current investments that are classified as available-for-sale, which are measured at fair value using Level 3 inputs as of December 31, 2012.
In April 2010, the brokerage firm administering the Company’s investments reported a decrease in the value of this investment based on a market devaluation of the Auction Rate Securities [“ARS”] by reputable financial rating firms. In recognition of this market devaluation, the Company wrote down the fair value of the ARS to nil in the first quarter of 2010. During the year, the Company received $25,000 as a recovery on ARS. As at December 31, 2012, the principal value of the ARS is $100,000 [2011—$125,000] with a fair value of nil [2011—nil].
[c] Management of risks arising from financial instruments
The Company’s principal financial liabilities, other than warrants, comprise loans and borrowings and trade and other payables. The main purpose of these financial liabilities is to finance the Company’s operations and to provide guarantees to support its operations. The Company has trade and other receivables and cash that are derived directly from its operations. The Company also holds available-for-sale financial instruments and enters into derivative transactions.
Financials | 59 |
Novadaq Technologies Inc.
NOTES TO THE CONSOLIDATED FINANCIAL STATEMENTS
FOR THE YEARS ENDED DECEMBER 31, 2012 AND 2011
(expressed in U.S dollars except as otherwise indicated)
The Company’s activities expose it to a variety of financial risks: market risk [including foreign currency and interest rate risk], credit risk and liquidity risk. The Company’s overall risk management program focuses on the unpredictability of financial markets and seeks to minimize potential adverse effects on the Company’s financial performance. The Company uses to a limited extent derivative financial instruments to mitigate certain risk exposures. The Company does not purchase any derivative financial instruments for speculative purposes. Risk management is the responsibility of the corporate finance function, which has the appropriate skills, experience and supervision. The Company’s domestic and foreign operations, along with the corporate finance function, identify, evaluate and, where appropriate, mitigate financial risks. Material risks are monitored and are regularly discussed with the Audit Committee of the Board of Directors. The Audit Committee provides assurance to the Company’s senior management that the Company’s financial risk-taking activities are governed by appropriate policies and procedures and that financial risks are identified, measured and managed in accordance with Company’s policies and risk appetite.
The risks associated with the Company’s financial instruments are as follows:
[i] Market risk
Market risk is the risk that the fair value of future cash flows of a financial instrument will fluctuate because of changes in market prices. Components of market risk to which the Company is exposed are discussed below. Financial instruments affected by market risk include trade accounts receivable and payable, available-for-sale financial instruments and derivative financial instruments.
The sensitivity analyses in the following sections relate to the financial position as at December 31, 2012.
The sensitivity analyses have been prepared on the basis that the amount of net debt, the ratio of fixed to floating interest rates of the debt and derivatives and the proportion of financial instruments in foreign currencies are all constant. The analyses exclude the impact of movements in market variables on the carrying value of provisions and on the non-financial assets and liabilities of foreign operations.
The following assumptions have been made in calculating the sensitivity analyses:
| | • | | The consolidated statements of financial position sensitivity relates to warrants. |
| | • | | The sensitivity of the relevant consolidated statements of loss and comprehensive loss items is the effect of the assumed changes in respective market risks. This is based on the financial assets and financial liabilities held at December 31, 2012. |
Foreign currency risk
Foreign currency risk arises due to fluctuations in the fair value or cash flows of financial instruments due to changes in foreign exchange rates and exposure.
Since a significant part of the Company’s purchases are transacted in Canadian dollars and the Company has repayable government assistance denominated in Canadian dollars, the Company may experience transaction exposures because of volatility in the exchange rate between the Canadian and U.S. dollar. Based on the Company’s Canadian dollar denominated net inflows and outflows for the year ended December 31, 2012, a weakening (strengthening) of the U.S. dollar of 10% would, everything else being equal, have a positive
Financials | 60 |
Novadaq Technologies Inc.
NOTES TO THE CONSOLIDATED FINANCIAL STATEMENTS
FOR THE YEARS ENDED DECEMBER 31, 2012 AND 2011
(expressed in U.S dollars except as otherwise indicated)
(negative) effect on net income before income taxes [due to changes in the fair value of monetary assets and liabilities including non-designated foreign currency derivatives] of $158,456 [2011—($73,198)]. The Company’s exposure to foreign currency changes for all other currencies is not material.
Interest rate risk
Interest rate risk is the risk that the fair value or future cash flows of a financial instrument will fluctuate because of changes in market interest rates. The Company does not have exposure to interest rate risk as interest rates for its convertible debentures and repayable government assistance loan are fixed.
[ii] Credit risk
Credit risk is the risk that one party to a financial instrument fails to discharge an obligation and causes financial loss to another party. The Company is exposed to credit risk from its operating activities [primarily for trade accounts receivable] and from financing activities, including cash deposits with banks and financial institutions.
Accounts receivable are subject to credit risk exposure and the carrying values reflect management’s assessment of the associated maximum exposure to such credit risk. The maximum exposure to credit risk is equal to the carrying value of the financial assets. The objective of managing counterparty credit risk is to prevent losses in financial assets. The Company assesses the credit quality of the counterparties, taking into account their financial position, past experience and other factors. Credit risk is mitigated by entering into sales contracts with only stable, creditworthy parties and through frequent reviews of exposures to individual entities. The Company has not experienced any direct material impacts to date of the economic downturn; however, the indirect impact could impact future profitability.
Approximately $3,617,173 or 84% [2011—$1,957,796 or 75%] of the outstanding accounts receivable, before provisions at December 31, 2012, is due from three customers [2011—nine customers]. As at December 31, 2012, one customer accounts for $1,939,810 of accounts receivable, before provisions [2011—$822,075].
The Company assesses the credit risk of accounts receivable by evaluating the aging of accounts receivable based on the invoice date. The carrying amount of accounts receivable is reduced through the use of an allowance account and the amount of the loss is recognized in the consolidated statements of loss and comprehensive loss. When a receivable balance is considered uncollectible, it is written off against the allowance for doubtful accounts. Subsequent recoveries of amounts previously written off are credited against operating expenses in the consolidated statements of loss and comprehensive loss. As at December 31, 2012, the Company has made a provision of $228,454 [2011—$583,477] in respect of accounts which it believes may not be collectible. As at December 31, 2012, the Company’s accounts receivable, before provision, were 95% concentrated in the United States and Canada and 5% were concentrated in Europe and Asia [2011—United States and Canada—81%, Europe and Asia—19%].
The carrying amount of accounts receivable is reduced through the use of an allowance account and the amount of the loss is recognized in the consolidated statements of loss and comprehensive loss within operating expenses. When a receivable balance is considered uncollectible, it is written off against the allowance for accounts receivable. Subsequent recoveries of amounts previously written off are credited against other operating expenses in the consolidated statements of loss and comprehensive loss.
Financials | 61 |
Novadaq Technologies Inc.
NOTES TO THE CONSOLIDATED FINANCIAL STATEMENTS
FOR THE YEARS ENDED DECEMBER 31, 2012 AND 2011
(expressed in U.S dollars except as otherwise indicated)
The following table sets forth details of the aging of trade accounts receivable that are not overdue, as well as an analysis of overdue amounts and related allowance for doubtful accounts:
| | | | | | | | |
| | | December 31,
2012 | | | December 31,
2011 | |
| | | $ | | | $ | |
Total accounts receivable | | | 4,285,408 | | | | 2,602,259 | |
Less allowance for doubtful accounts | | | (228,454 | ) | | | (583,477 | ) |
| | | | | | | | |
Total accounts receivable, net | | | 4,056,954 | | | | 2,018,782 | |
| | | | | | | | |
Of which | | | | | | | | |
Current | | | 3,505,582 | | | | 1,884,480 | |
31 - 60 days | | | 351,024 | | | | 129,939 | |
61 - 90 days | | | — | | | | 33,448 | |
Over 90 days | | | 428,802 | | | | 554,392 | |
Less allowance for doubtful accounts | | | (228,454 | ) | | | (583,477 | ) |
| | | | | | | | |
Total accounts receivable, net | | | 4,056,954 | | | | 2,018,782 | |
| | | | | | | | |
The movement in the Company’s allowance for doubtful accounts for the years ended December 31, 2012 and 2011 were as follows:
| | | | | | | | |
| | | December 31,
2012 | | | December 31,
2011 | |
| | | $ | | | $ | |
Balance, beginning of year | | | 583,477 | | | | 588,746 | |
Additional provision recognized | | | 2,598 | | | | 68,256 | |
Amounts recovered during the year | | | (65,060 | ) | | | (73,525 | ) |
Amounts written off during the year | | | (292,561 | ) | | | — | |
| | | | | | | | |
Balance, end of year | | | 228,454 | | | | 583,477 | |
| | | | | | | | |
Credit risk from balances with banks and financial institutions is managed by the Company’s treasury, responsible in accordance with the Company’s policy. Investments of surplus funds are made only with approved counterparties and within credit limits assigned to each counterparty. Counterparty credit limits are reviewed by the Company’s Board of Directors on an annual basis and may be updated throughout the year, subject to approval of the Company’s Finance Committee. The limits are set to minimize the concentration of risks and therefore mitigate financial loss through the counterparty’s potential failure. The Company’s maximum exposure to credit risk for the components of the consolidated statements of financial position is the carrying amount of cash and cash equivalents and other current financial assets.
Financials | 62 |
Novadaq Technologies Inc.
NOTES TO THE CONSOLIDATED FINANCIAL STATEMENTS
FOR THE YEARS ENDED DECEMBER 31, 2012 AND 2011
(expressed in U.S dollars except as otherwise indicated)
[iii] Liquidity risk
Liquidity risk is the potential inability to meet financial obligations as they fall due. The Company manages this risk by monitoring detailed quarterly cash forecasts for the next 12 months, and annual forecasts for the following one-year period to ensure adequate and efficient use of cash resources. The Company has accounts payable and accrued liabilities and repayable government assistance that have contractual cash flows approximating their fair value and have maturities of less than one year. The Company attempts to achieve this obligation through managing cash from operations and through the availability of funding from strategic alliances or equity placements.
The tables below summarize the maturity profile of the Company’s financial liabilities as at December 31, 2012 and 2011 based on contractual undiscounted payments:
December 31, 2012:
| | | | | | | | | | | | | | | | | | | | |
| | | Total | | | Less than 1 year | | | 1 to 3 years | | | 4 to 5 years | | | Thereafter | |
| | | $ | | | $ | | | $ | | | $ | | | $ | |
Convertible debentures | | | 5,218,015 | | | | — | | | | 5,218,015 | | | | — | | | | — | |
Convertible debentures interest payable | | | 295,926 | | | | 260,901 | | | | 35,025 | | | | — | | | | — | |
Repayable government assistance | | | 221,094 | | | | 203,148 | | | | 17,946 | | | | — | | | | — | |
Repayable government assistance interest payable | | | 28,035 | | | | 27,833 | | | | 202 | | | | — | | | | — | |
Accounts payable and accrued liabilities | | | 3,407,329 | | | | 3,407,329 | | | | — | | | | — | | | | — | |
| | | | | | | | | | | | | | | | | | | | |
Total financial liability payments | | | 9,170,399 | | | | 3,899,211 | | | | 5,271,188 | | | | — | | | | — | |
| | | | | | | | | | | | | | | | | | | | |
December 31, 2011:
| | | | | | | | | | | | | | | | | | | | |
| | | Total | | | Less than 1 year | | | 1 to 3 years | | | 4 to 5
years | | | Thereafter | |
| | | $ | | | $ | | | $ | | | $ | | | $ | |
Convertible debentures | | | 5,218,015 | | | | — | | | | 5,218,015 | | | | — | | | | — | |
Convertible debentures interest payable | | | 556,827 | | | | 260,901 | | | | 295,926 | | | | — | | | | — | |
Repayable government assistance | | | 412,162 | | | | 197,760 | | | | 214,402 | | | | — | | | | — | |
Repayable government assistance interest payable | | | 80,053 | | | | 52,262 | | | | 27,791 | | | | — | | | | — | |
Accounts payable and accrued liabilities | | | 2,485,994 | | | | 2,485,994 | | | | — | | | | — | | | | — | |
| | | | | | | | | | | | | | | | | | | | |
Total financial liability payments | | | 8,753,051 | | | | 2,996,917 | | | | 5,756,134 | | | | — | | | | — | |
| | | | | | | | | | | | | | | | | | | | |
Financials | 63 |
Novadaq Technologies Inc.
NOTES TO THE CONSOLIDATED FINANCIAL STATEMENTS
FOR THE YEARS ENDED DECEMBER 31, 2012 AND 2011
(expressed in U.S dollars except as otherwise indicated)
Capital management
The primary objective of the Company is to ensure receipt of sufficient funds from sales, equity offerings, partnership fees and debt instruments to support the cash requirements for ongoing operations.
20. RELATED PARTY DISCLOSURES
A director of the Company is also a director of Fairfax Financial Holdings Limited.
As at December 31, 2012 and 2011, the Company has no receivable or payable values with key management personnel or directors.
The key management personnel include the President and Chief Executive Officer; Chief Financial Officer; Senior Vice President and General Manager; Senior Vice President, Marketing and Business Development, Open Surgery; Vice President, Operations; and Vice President, Investor Relations and Corporate Development.
Compensation of key management personnel of the Company
| | | | | | | | |
| | | December 31,
2012 | | | December 31,
2011 | |
| | | $ | | | $ | |
Wages and salaries | | | 1,256,144 | | | | 1,123,871 | |
Benefits and bonus expense | | | 624,152 | | | | 587,997 | |
Social security costs | | | 16,496 | | | | 15,559 | |
| | | | | | | | |
Total key management compensation | | | 1,896,792 | | | | 1,727,427 | |
| | | | | | | | |
Financials | 64 |
Novadaq Technologies Inc.
NOTES TO THE CONSOLIDATED FINANCIAL STATEMENTS
FOR THE YEARS ENDED DECEMBER 31, 2012 AND 2011
(expressed in U.S dollars except as otherwise indicated)
Key management interests in an employee incentive plan
Stock options held by key management personnel and members of the Board of Directors to purchase common shares have the following expiry dates and exercise prices:
Key management personnel
| | | | | | | | | | | | |
| | | | | | | December 31,
2012 | | | December 31,
2011 | |
Issue date | | Expiry date | | Exercise price | | Number
outstanding | | | Number
outstanding | |
13-Apr-03 | | 13-Apr-13 | | U.S. $1.07 | | | 199,535 | | | | 199,535 | |
16-Feb-04 | | 16-Feb-14 | | U.S. $1.07 | | | 93,271 | | | | 93,271 | |
29-Mar-05 | | 29-Mar-15 | | U.S. $1.07 | | | 270,486 | | | | 270,486 | |
13-Dec-05 | | 13-Dec-15 | | CDN $9.50 | | | 35,000 | | | | 35,000 | |
17-Aug-07 | | 17-Aug-17 | | CDN $6.50 | | | 125,000 | | | | 125,000 | |
15-May-08 | | 15-May-18 | | CDN $4.01 | | | 7,500 | | | | 7,500 | |
1-Aug-08 | | 1-Aug-18 | | CDN $1.76 | | | 12,500 | | | | 12,500 | |
19-Mar-09 | | 19-Mar-19 | | CDN $2.50 | | | 270,000 | | | | 270,000 | |
2-Apr-10 | | 2-Apr-20 | | CDN $2.75 | | | 170,000 | | | | 170,000 | |
20-May-11 | | 20-May-21 | | CDN $4.15 | | | 175,000 | | | | 175,000 | |
23-May-12 | | 23-May-22 | | CDN $6.47 | | | 355,000 | | | | — | |
| | | | | | | | | | | | |
| | | | | | | 1,713,292 | | | | 1,358,292 | |
| | | | | | | | | | | | |
Board of Directors
| | | | | | | | | | | | |
| | | | | | | December 31,
2012 | | | December 31,
2011 | |
Issue date | | Expiry date | | Exercise price | | Number
outstanding | | | Number
outstanding | |
30-Sep-03 | | 30-Sep-13 | | U.S. $1.07 | | | 27,981 | | | | 27,981 | |
5-Sep-06 | | 5-Sep-16 | | CDN $8.07 | | | 7,500 | | | | 7,500 | |
24-May-07 | | 24-May-17 | | CDN $7.74 | | | 15,000 | | | | 15,000 | |
17-Aug-07 | | 17-Aug-17 | | CDN $6.50 | | | 16,450 | | | | 16,450 | |
15-May-08 | | 15-May-18 | | CDN $4.01 | | | 20,400 | | | | 20,400 | |
1-Aug-08 | | 1-Aug-18 | | CDN $1.76 | | | 15,000 | | | | 15,000 | |
21-May-09 | | 21-May-19 | | CDN $3.09 | | | 42,500 | | | | 42,500 | |
20-May-10 | | 20-May-20 | | CDN $4.26 | | | 45,000 | | | | 45,000 | |
31-Aug-10 | | 31-Aug-20 | | CDN $3.82 | | | 15,000 | | | | 15,000 | |
20-May-11 | | 20-May-21 | | CDN $4.15 | | | 67,500 | | | | 67,500 | |
23-May-12 | | 23-May-22 | | CDN $6.47 | | | 68,000 | | | | — | |
| | | | | | | | | | | | |
| | | | | | | 340,331 | | | | 272,331 | |
| | | | | | | | | | | | |
Financials | 65 |
Novadaq Technologies Inc.
NOTES TO THE CONSOLIDATED FINANCIAL STATEMENTS
FOR THE YEARS ENDED DECEMBER 31, 2012 AND 2011
(expressed in U.S dollars except as otherwise indicated)
21. SHARE CAPITAL
Issued and outstanding
| | | | | | | | |
| | | Common shares | |
| | | # | | | $ | |
Balance at December 31, 2010 | | | 27,897,147 | | | | 87,897,555 | |
Private placement | | | 4,731,864 | | | | 10,579,682 | |
Debt conversion | | | 45,488 | | | | 85,463 | |
Exercise of stock options | | | 72,589 | | | | 132,323 | |
Exercise of broker warrants | | | 22,374 | | | | — | |
| | | | | | | | |
Balance at December 31, 2011 | | | 32,769,462 | | | | 98,695,023 | |
| | | | | | | | |
Public offering | | | 7,015,000 | | | | 36,946,898 | |
Exercise of broker warrants pursuant to private placement | | | 25,299 | | | | 130,627 | |
Exercise of stock options | | | 24,363 | | | | 137,622 | |
Exercise of warrants | | | 392,119 | | | | 4,036,393 | |
| | | | | | | | |
Balance at December 31, 2012 | | | 40,226,243 | | | | 139,946,563 | |
| | | | | | | | |
On April 9, 2012, the Company announced that it had completed the closing of its public offering of 7,015,000 common shares at a price of $5.75 per share. Gross proceeds from the offering were approximately $40,336,250 resulting in cash proceeds of $36,946,898, net of transaction costs. The shares of the Company are registered with the Securities and Exchange Commission and listed on the NASDAQ in addition to the TSX.
22. LOSS PER SHARE
The Company has authorized share capital as follows: common shares—unlimited, no par value; preference shares – unlimited, no par value, issuable in one or more series.
Basic loss per share amounts are calculated by dividing net loss for the period attributable to ordinary equity holders of the parent by the weighted average number of ordinary shares outstanding during the period. Diluted earnings per share amounts are calculated by dividing the net income attributable to ordinary equity holders of the parent by the weighted average number of ordinary shares outstanding during the period plus the weighted average number of ordinary shares that would be issued on conversion of all the dilutive potential ordinary shares into ordinary shares.
The following reflects the loss and share data used in the basic and diluted loss per share computations:
| | | | | | | | |
| | | December 31,
2012 | | | December 31,
2011 | |
| | | $ | | | $ | |
Net loss and comprehensive loss for the year attributable to shareholders for basic and diluted loss per share | | | 12,344,133 | | | | 10,153,328 | |
| | | | | | | | |
Weighted average number of common shares for basic and diluted loss per share | | | 38,006,691 | | | | 31,612,834 | |
| | | | | | | | |
Financials | 66 |
Novadaq Technologies Inc.
NOTES TO THE CONSOLIDATED FINANCIAL STATEMENTS
FOR THE YEARS ENDED DECEMBER 31, 2012 AND 2011
(expressed in U.S dollars except as otherwise indicated)
There have been no other transactions involving ordinary shares or potential ordinary shares between the reporting date and the date of completion of these consolidated financial statements.
The conversion of outstanding stock options, warrants and convertible notes has not been included in the determination of basic and diluted loss per share as to do so would have been anti-dilutive.
23. COMMITMENTS AND CONTINGENCIES
Lease commitments
The Company has entered into lease commitments for office premises located in Mississauga, Ontario, Richmond, British Columbia and Taunton, Massachusetts. The total future minimum annual lease payments, including four months free base rent in Richmond, British Columbia and proportionate operating expenses for three locations, are as follows:
| | | | |
| | | $ | |
Within one year | | | 412,126 | |
After one year but not more than five years | | | 163,501 | |
More than five years | | | — | |
| | | | |
| | | 575,627 | |
| | | | |
Sales and marketing agreement
On September 1, 2010, the Company entered into a five-year agreement with LifeCell, providing exclusive rights to market and distribute the SPY Imaging Technology in the fields of plastic reconstructive, gastrointestinal and head and neck surgery in North America. Pursuant to the agreement, the Company has a three-year annual commitment to spend a minimum amount on research and development which is within normal business operating expenses.
Loan agreement
On August 26, 2011, the Company executed a revolving credit agreement with a Canadian chartered bank entitling the Company to borrow to a maximum limit of $2,500,000, subject to a borrowing base formula, certain financial covenants and reporting requirements. The credit facility is secured by a General Security Agreement constituting a first ranking security interest in all personal property of the Company, with a conventional rate of interest. Since its inception and as at December 31, 2012, the Company has not utilized the credit facility. The Company is in compliance with the financial covenants and reporting requirements at December 31, 2012.
Financials | 67 |
Novadaq Technologies Inc.
NOTES TO THE CONSOLIDATED FINANCIAL STATEMENTS
FOR THE YEARS ENDED DECEMBER 31, 2012 AND 2011
(expressed in U.S dollars except as otherwise indicated)
Contingent liabilities
On September 2, 2011, a former employee commenced litigation against the Company in Ontario, seeking damages for wrongful dismissal. The Company has refuted an offer to settle as the Company believes the former employee’s claim is without merit and is vigorously defending against the claim.
On June 29, 2011, a customer commenced a claim for breach of contract against the Company seeking damages for an undetermined amount. On June 12, 2012, the two parties resolved the lawsuit with no financial settlement and the plaintiff has filed for dismissal of the litigation.
24. SEGMENTED INFORMATION
Revenue by region is as follows:
| | | | | | | | |
| | | December 31,
2012 | | | December 31,
2011 | |
| | | $ | | | $ | |
United States | | | 22,229,246 | | | | 15,078,580 | |
Japan | | | 708,600 | | | | 187,000 | |
Other | | | 51,214 | | | | 26,861 | |
| | | | | | | | |
Total | | | 22,989,060 | | | | 15,292,441 | |
| | | | | | | | |
Property and Equipment net is as follows
| | | | | | | | |
| | | December 31,
2012 | | | December 31,
2011 | |
| | | $ | | | $ | |
Canada | | | 2,419,062 | | | | 1,142,180 | |
United States | | | 8,298,599 | | | | 5,481,806 | |
| | | | | | | | |
Total | | | 10,717,661 | | | | 6,623,986 | |
| | | | | | | | |
25. COMPARATIVE FINANCIAL STATEMENTS
Certain of the comparative figures have been reclassified where necessary, to conform to the current year’s presentation.
Financials | 68 |
Corporate Information
| | |
| DIRECTORS | | OFFICERS |
| Arun Menawat Ph.D., MBA | | Arun Menawat Ph.D., MBA |
| President and Chief Executive Officer | | President and Chief Executive Officer |
| |
| G. Steven Burrill1 | | Stephen Purcell |
| CEO, Burrill & Company | | Chief Financial Officer |
| |
| Aaron Davidson, MBA1,3* | | Mary Kay Baggs |
| Managing Director, H I G Ventures | | Sr Vice President Business Development,Surgical Systems |
| |
| Anthony F. Griffiths1* | | Roger Deck |
| Chairman, Director | | Vice President, Operations |
| |
| Harold O. Koch, Jr., BSc2 | | |
| Executive Vice President & Chief Scientific Officer | | |
| Pamlab, Inc. | | |
| |
| Julia Levy, Ph.D.3 | | CORPORATE OFFICES |
| Corporate Director | | Novadaq Technologies Inc |
| | 2585 Skymark Avenue, Suite 306 |
| William A. Mackinnon, FCA2* | | Mississauga, Ontario |
| Corporate Director | | L4W 4L5 |
| |
| Joel I. Shalowitz, M.D., MBA, FACP2 | | T 905.629.3822 |
| Professor, Kellogg School of Management | | T 1.888.PATIENT (724.4368) |
| | F 905.629.0282 |
| |
| Joseph T. Sobota, M.D.3 | | www.novadaq.com |
| Managing Director, Apjohn Group, LLC | | |
| |
| 1 Governance Committee | | |
| 2 Audit Committee | | |
| 3 Compensation Committee | | |
| * Denotes committee chair | | |
| 69 |
Shareholder Information
| | |
| AUDITORS | | MARKETS |
| Ernst & Young LLP | | The Company’s common shares are listed on the Toronto |
| Toronto-Dominion Centre | | Stock Exchange (“TSX”) under the symbol “NDQ” and |
| 222 Bay Street | | Nasdaq (“NASDAQ”) under the symbol “NVDQ”. |
Toronto, Ontario M5K 1J7 | | |
| |
| | ANNUAL MEETING |
| | Novadaq will hold its Annual Meeting on May 22, 2013 |
| |
| LEGAL COUNSEL | | at 9:30 a.m. |
| Stikeman Elliott LLP | | Stikeman Elliott LLP |
| 5300 Commerce Court West | | 5300 Commerce Court West |
| 199 Bay Street | | 199 Bay Street |
| Toronto, Ontario | | Toronto, Ontario |
| M5L 1B9 | | M5L 1B9 |
| |
| TRANSFER AGENT | | ON THE INTERNET |
| Computershare Trust Company of Canada | | Interested investors may browse Novadaq’s corporate |
| 100 University Avenue | | website at wwwnovadaq.com to obtain regularly |
| Toronto, Ontario | | updated information, including press releases, |
| M5J 2Y1 | | webcasts, share trading data, regulatory filings and |
| | financial statements |
| |
| INVESTOR RELATIONS | | |
| Please direct inquiries and shareholder requests to: | | TRADEMARKS |
David C Martin, Ph D, MBA Vice President Corporate Development & Investor Relations Office: 905-629-3822, ext 218 | | NOVADAQ®, SPY®, PINPOINT®, VICTORIA® and SPY PAQ® and are trademarks of Novadaq Technologies Inc |
| Fax: 905-629-0282 | | |
| email: dmartin@novadaq com | | |
| | |
| 70 |