
Exhibit 99 Q3 2022 QUARTERLY INVESTOR PRESENTATION
Safe Harbor Statement & Disclosure This presentation includes forward-looking comments subject to important risks and uncertainties. It may also contain financial measures that are not in conformance with accounting principles generally accepted in the United States of America (GAAP). Refer to Hyster-Yale’s reports filed on Forms 8-K (current), 10-Q (quarterly), and 10-K (annual) for information on factors that could cause actual results to differ materially from information in this presentation and for information reconciling financial measures to GAAP. Past performance may not be representative of future results. Forward-looking information noted in the following slides was effective as of the Company’s most recent earnings release and conference call (November 2, 2022). Nothing in this presentation should be construed as reaffirming or disaffirming the outlook provided as of that date. This presentation is not an offer to sell or a solicitation of offers to buy any of Hyster-Yale’s securities. 2
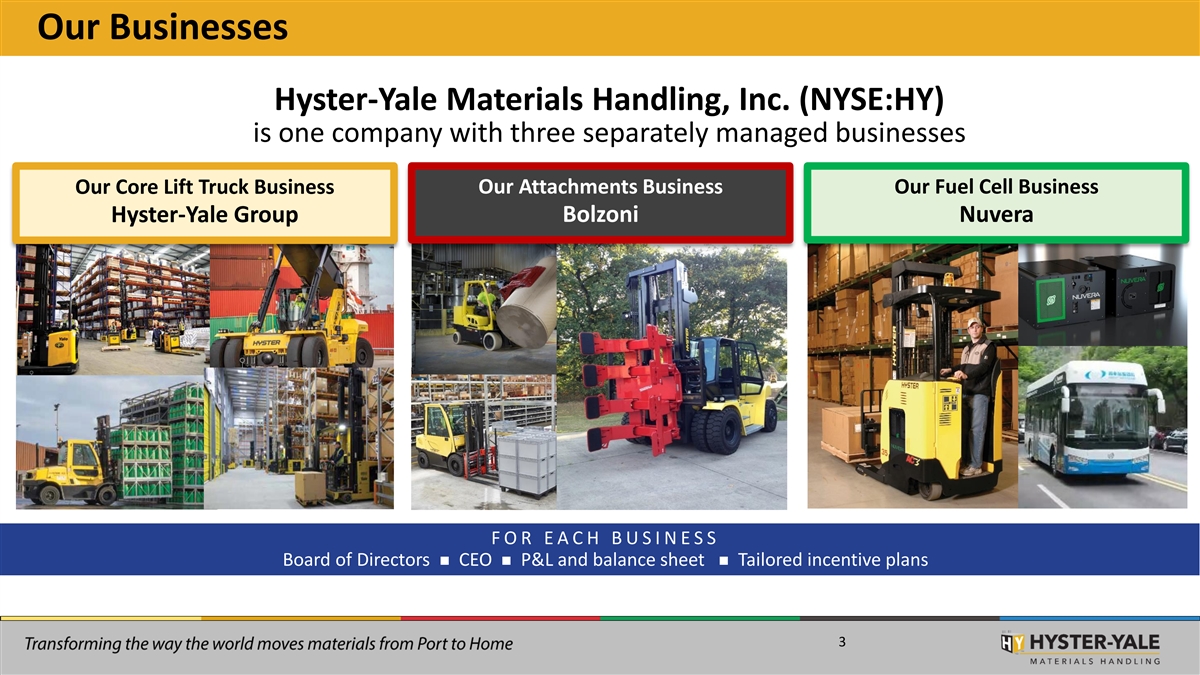
Our Businesses Hyster-Yale Materials Handling, Inc. (NYSE:HY) is one company with three separately managed businesses Our Core Lift Truck Business Our Attachments Business Our Fuel Cell Business Hyster-Yale Group Bolzoni Nuvera F O R E A C H B U S I N E S S Board of Directors n CEO n P&L and balance sheet n Tailored incentive plans 3

Hyster-Yale at a Glance Hyster-Yale Materials Handling, Inc. (NYSE:HY) is a leading globally integrated, full-line lift Key Metrics truck manufacturer offering a In millions (except employee data) broad array of solutions aimed at Lift Truck Bolzoni Nuvera LTM 9/30/2022 meeting the specific materials Revenue $3,205.1 $357.2 $2.3 handling needs of its customers. Operating Profit (Loss) ($130.8) $2.0 ($36.0) Bolzoni Nuvera (1) Adjusted EBITDA ($38.2) $14.6 ($35.1) 5.5% 0.1% JAPIC Net Debt at end of period ($456.7) ($19.7) N/A 6.9% Approximate # of Employees (globally) 6,650 1,300 150 EMEA 20.4% Americas 67.1% LTM 9/30/2022 Sales by Segment _____________________ (1) Adjusted EBITDA is a non-GAAP measures and should not be considered in isolation or as a substitute for GAAP measures. See non-GAAP explanations and the related reconciliations to GAAP measures in the Appendix starting on page 14. 4
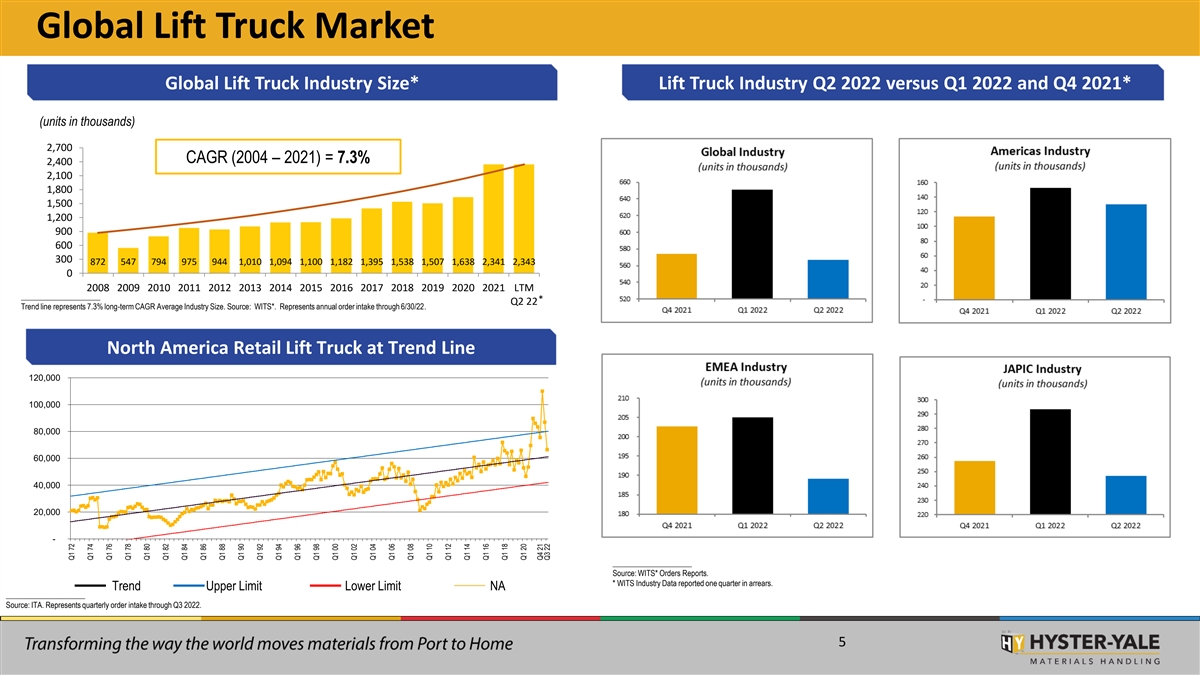
Global Lift Truck Market Global Lift Truck Industry Size* Lift Truck Industry Q2 2022 versus Q1 2022 and Q4 2021* (units in thousands) 2,700 CAGR (2004 – 2021) = 7.3% 2,400 2,100 1,800 1,500 1,200 900 600 300 872 547 794 975 944 1,010 1,094 1,100 1,182 1,395 1,538 1,507 1,638 2,341 2,343 0 2008 2009 2010 2011 2012 2013 2014 2015 2016 2017 2018 2019 2020 2021 LTM _____________________ * Q2 22 Trend line represents 7.3% long-term CAGR Average Industry Size. Source: WITS*. Represents annual order intake through 6/30/22. North America Retail Lift Truck at Trend Line 120,000 100,000 80,000 60,000 40,000 20,000 - _____________________ Source: WITS* Orders Reports. * WITS Industry Data reported one quarter in arrears. Trend Upper Limit Lower Limit NA _____________________ Source: ITA. Represents quarterly order intake through Q3 2022. 5 Q1 72 Q1 74 Q1 76 Q1 78 Q1 80 Q1 82 Q1 84 Q1 86 Q1 88 Q1 90 Q1 92 Q1 94 Q1 96 Q1 98 Q1 00 Q1 02 Q1 04 Q1 06 Q1 08 Q1 10 Q1 12 Q1 14 Q1 16 Q1 18 Q1 20 Q4 21 Q3 22

Lift Truck Unit Class Shipments as of 6/30/22 (Industry / HY) Industry Units by Geography HY Lift Truck Units Sold by Geography Middle East Asia-Pacific Asia- & Africa 7% Pacific/ 3% Japan China Japan 4% 7% 6% HY sales mix more Europe 30% EMEA heavily weighted Americas China 29% 58% 34% toward the Americas Americas 22% _____________________ _____________________ Source: WITS*. LTM 6/30/22 Orders Reports. Source: Company: LTM 6/30/22 Units Shipped * WITS Industry Data reported one quarter in arrears. Note: Units sold direct by SN JV are not included Industry Unit Revenue by Class HY Lift Truck Unit Revenue by Class Estimated Industry Revenue Mix Class 1 HY revenue mix Electric Class 1 Electric 22% 26% Class 5 ICE Class 5 ICE toward higher-priced 43% Class 2 48% Electric Class 2 Electric 13% 14% Class 4 & 5 ICE units Class 4 Class 4 ICE ICE 5% 9% Class 3 Electric Class 3 Electric 8% _____________________ _____________________ 12% Source: Company: LTM 6/30/22 Unit Revenues Source: Internal Company estimates through 6/30/22 6

Impact of Headwinds on HY are Moderating 2021 2022 Q1 2023 Supplier component volume shortages Freight costs and constraints Component cost inflation Timing of price increases to match cost increases Economic Potential Recessionary Headwinds Trends Russia/Ukraine conflict expansion 7

Results for Q3 2022 Consolidated vs. Q3 2021 Comments CONSOLIDATED HY HY ($ in millions) Q3 2022 Q3 2021 Variance ▪ Consolidated revenues increased 12.3% over Q3 ‘21 primarily Shipments 24,500 23,200 1,300 due to increased lift truck prices and parts volumes across all geographic segments. Revenues $840.1 $748.2 $91.9 ▪ Lift truck shipments increased in each geographic segment Gross Profit (Loss) $86.9 $65.1 $21.8 versus Q3 ‘21, due to moderating component shortages and Operating Expenses ($111.8) ($119.4) $7.6 supply chain constraints. Some critical components remain in short supply. Operating Profit (Loss) ($24.9) ($54.3) $29.4 ▪ Consolidated operating loss improved by nearly $30 million Net Income (Loss) ($37.3) ($77.2) $39.9 versus Q3 ‘21, which included $24.8 million of non-cash (2) Adjusted EBITDA ($14.2) ($30.9) $16.7 charges at Nuvera. HY HY ▪ Lift Truck results improved versus Q3 ’21, and were ahead of SEGMENTS Q3 2022 Q3 2022 Q3 2022 (1) (1) (1) Company expectations, despite significant unfavorable ($ in millions) Lift Truck Bolzoni Nuvera currency effects. Revenues $796.2 $82.2 $1.2 ▪ Bolzoni’s results decreased from Q3 ’21. Benefits from price Gross Profit (Loss) $74.6 $13.7 ($2.0) increases and favorable sales mix did not offset the effect of Operating Expenses ($89.8) ($15.0) ($7.0) lower sales volumes, higher manufacturing costs and unfavorable currency movements. Operating Profit (Loss) ($15.2) ($1.3) ($9.0) (2) ▪ Nuvera’s loss decreased over Q3 ’21, primarily driven by a Adjusted EBITDA ($7.9) $2.0 ($8.9) prior year charge. ________ (1) These entities are presented on a stand-alone basis, and as such, do not sum to the Consolidated financial information. (2) Adjusted EBITDA is a non-GAAP measure and should not be considered in isolation or as a substitute for GAAP measures. See non-GAAP explanations and the related reconciliations to GAAP measures in the Appendix starting on page 14. 8
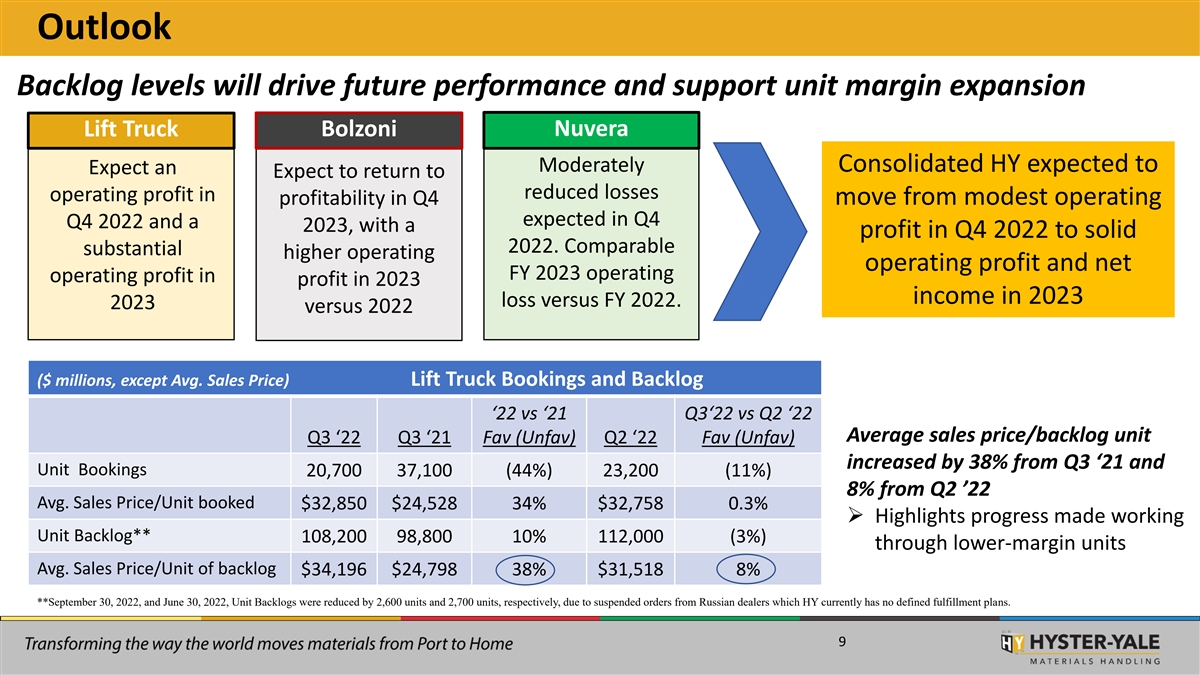
Outlook Backlog levels will drive future performance and support unit margin expansion Lift Truck Bolzoni Nuvera Moderately Consolidated HY expected to Expect an Expect to return to reduced losses operating profit in profitability in Q4 move from modest operating expected in Q4 Q4 2022 and a 2023, with a profit in Q4 2022 to solid 2022. Comparable substantial higher operating operating profit and net FY 2023 operating operating profit in profit in 2023 income in 2023 loss versus FY 2022. 2023 versus 2022 ($ millions, except Avg. Sales Price) Lift Truck Bookings and Backlog ‘22 vs ‘21 Q3‘22 vs Q2 ‘22 Average sales price/backlog unit Q3 ‘22 Q3 ‘21 Fav (Unfav) Q2 ‘22 Fav (Unfav) increased by 38% from Q3 ‘21 and Unit Bookings 20,700 37,100 (44%) 23,200 (11%) 8% from Q2 ’22 Avg. Sales Price/Unit booked $32,850 $24,528 34% $32,758 0.3% ➢ Highlights progress made working Unit Backlog** 108,200 98,800 10% 112,000 (3%) through lower-margin units Avg. Sales Price/Unit of backlog $34,196 $24,798 38% $31,518 8% **September 30, 2022, and June 30, 2022, Unit Backlogs were reduced by 2,600 units and 2,700 units, respectively, due to suspended orders from Russian dealers which HY currently has no defined fulfillment plans. 9
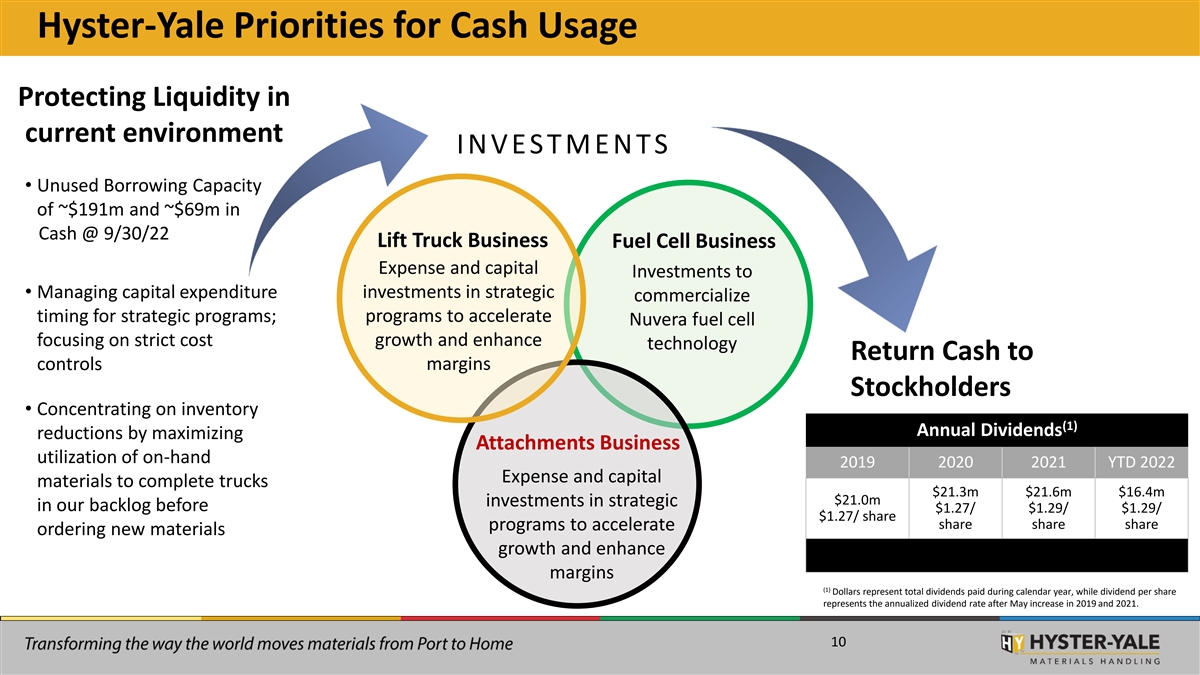
Hyster-Yale Priorities for Cash Usage Protecting Liquidity in current environment I N V E S T M E N T S • Unused Borrowing Capacity of ~$191m and ~$69m in Cash @ 9/30/22 Lift Truck Business Fuel Cell Business Expense and capital Investments to investments in strategic • Managing capital expenditure commercialize timing for strategic programs; programs to accelerate Nuvera fuel cell focusing on strict cost growth and enhance technology Return Cash to controls margins Stockholders • Concentrating on inventory (1) Annual Dividends reductions by maximizing Attachments Business utilization of on-hand 2019 2020 2021 YTD 2022 Expense and capital materials to complete trucks $21.3m $21.6m $16.4m $21.0m investments in strategic in our backlog before $1.27/ $1.29/ $1.29/ $1.27/ share share share share programs to accelerate ordering new materials growth and enhance margins (1) Dollars represent total dividends paid during calendar year, while dividend per share represents the annualized dividend rate after May increase in 2019 and 2021. 10
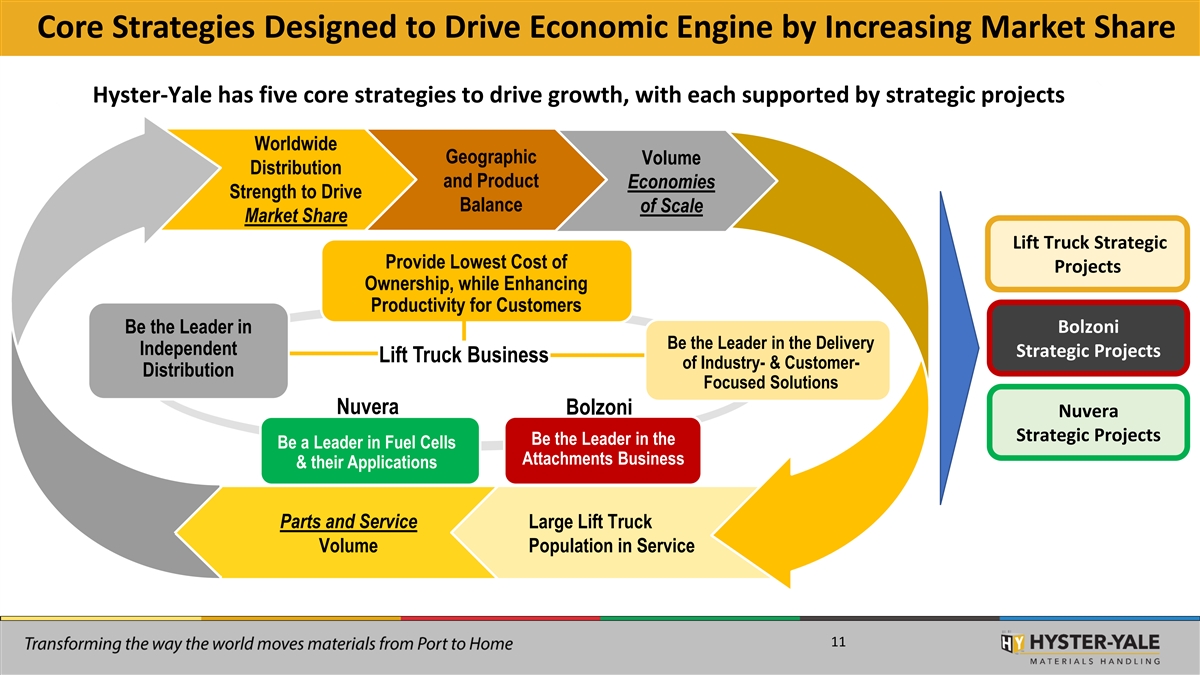
Core Strategies Designed to Drive Economic Engine by Increasing Market Share Hyster-Yale has five core strategies to drive growth, with each supported by strategic projects Worldwide Geographic Volume Distribution and Product Economies Strength to Drive Balance of Scale Market Share Lift Truck Strategic Provide Lowest Cost of Projects Ownership, while Enhancing Productivity for Customers Bolzoni Be Be t the he Lea Leade der r in in Be the Leader in the Delivery Ind Indep epen ende den nt t Strategic Projects Lift Truck Business of Industry- & Customer- Distr Distribu ibuti tion on Focused Solutions Nuvera Bolzoni Nuvera Strategic Projects Be the Leader in the Be a Leader in Fuel Cells Attachments Business & their Applications Parts and Service Large Lift Truck Volume Population in Service 11

HY Transformational Projects Lead to a Strong Long-Term Investment Option Through key strategic projects, HY is transforming its business using an Industry Approach to achieve financial targets Lift Truck Transformation Bolzoni Transformation Nuvera Transformation Transformative Products Transformation of Global Business • Commercialization of E-45 / E-60 engines Structure • Modular & Scalable (1, 2) globally • Low Intensity (1, 2) • One Company / 3 Brands • Development of larger E125 engine Technological Accelerators • Commercial Partnerships • Growth Projects for Americas • Electrification, Fuel Cell, Telemetry, (locally-produced products), EMEA Automation & Web Presence (1, 2) (Smart Products) & JAPIC (Silver Transformation of Sales Approach Line) • AsOne, HY Impact + HY Flow programs (3) • Industry approach • Industry approach (2) Legend – Core Strategies 1 - Provide Lowest Cost of Ownership, while Enhancing Productivity for Customers 2 - Be the Leader in the Delivery of Industry- & Customer-Focused Solutions 3 - Be the Leader in Independent Distribution Long-term Focused, not Short-term Oriented 12

APPENDIX

Non-GAAP Disclosure Adjusted EBITDA is not a measurement under U.S. GAAP, should not be considered in isolation or as a substitute for GAAP measures, and is not necessarily comparable with similarly titled measures of other companies. Hyster-Yale defines Adjusted EBITDA as the following: n Adjusted EBITDA is defined as income (loss) before Goodwill and fixed asset impairment charges, income taxes and noncontrolling interest income (loss) plus net interest expense and depreciation and amortization expense; For reconciliations from GAAP measurements to non-GAAP measurements, see the following pages. 14
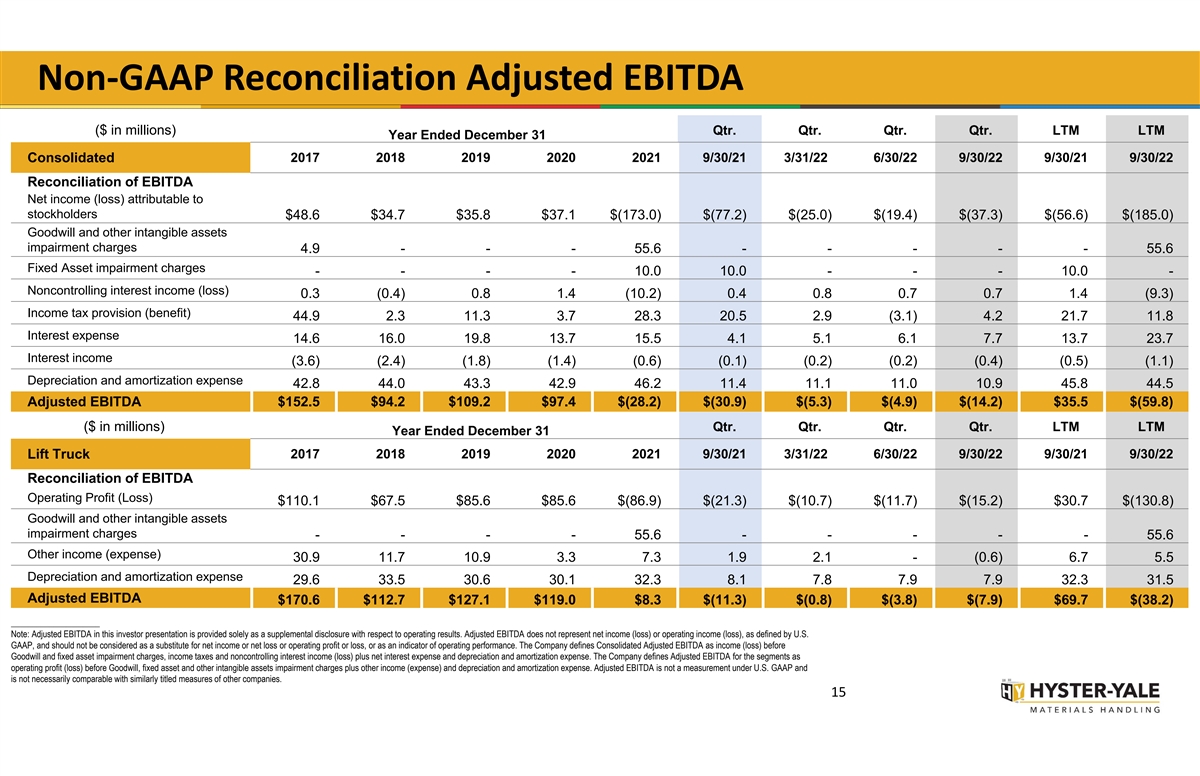
Non‐GAAP Reconciliation Adjusted EBITDA ($ in millions) Qtr. Qtr. Qtr. Qtr. LTM LTM Year Ended December 31 2017 2018 2019 2020 2021 9/30/21 3/31/22 6/30/22 9/30/22 9/30/21 9/30/22 Consolidated Reconciliation of EBITDA Net income (loss) attributable to stockholders $48.6 $34.7 $35.8 $37.1 $(173.0) $(77.2) $(25.0) $(19.4) $(37.3) $(56.6) $(185.0) Goodwill and other intangible assets impairment charges 4.9 --- 55.6----- 55.6 Fixed Asset impairment charges ---- 10.0 10.0--- 10.0- Noncontrolling interest income (loss) 0.3 (0.4) 0.8 1.4 (10.2) 0.4 0.8 0.7 0.7 1.4 (9.3) Income tax provision (benefit) 44.9 2.3 11.3 3.7 28.3 20.5 2.9 (3.1) 4.2 21.7 11.8 Interest expense 14.6 16.0 19.8 13.7 15.5 4.1 5.1 6.1 7.7 13.7 23.7 Interest income (3.6) (2.4) (1.8) (1.4) (0.6) (0.1) (0.2) (0.2) (0.4) (0.5) (1.1) Depreciation and amortization expense 42.8 44.0 43.3 42.9 46.2 11.4 11.1 11.0 10.9 45.8 44.5 Adjusted EBITDA $152.5 $94.2 $109.2 $97.4 $(28.2) $(30.9) $(5.3) $(4.9) $(14.2) $35.5 $(59.8) ($ in millions) Qtr. Qtr. Qtr. Qtr. LTM LTM Year Ended December 31 Lift Truck 2017 2018 2019 2020 2021 9/30/21 3/31/22 6/30/22 9/30/22 9/30/21 9/30/22 Reconciliation of EBITDA Operating Profit (Loss) $110.1 $67.5 $85.6 $85.6 $(86.9) $(21.3) $(10.7) $(11.7) $(15.2) $30.7 $(130.8) Goodwill and other intangible assets impairment charges ---- 55.6---- - 55.6 Other income (expense) 30.9 11.7 10.9 3.3 7.3 1.9 2.1 - (0.6) 6.7 5.5 Depreciation and amortization expense 29.6 33.5 30.6 30.1 32.3 8.1 7.8 7.9 7.9 32.3 31.5 Adjusted EBITDA $170.6 $112.7 $127.1 $119.0 $8.3 $(11.3) $(0.8) $(3.8) $(7.9) $69.7 $(38.2) _____________________ Note: Adjusted EBITDA in this investor presentation is provided solely as a supplemental disclosure with respect to operating results. Adjusted EBITDA does not represent net income (loss) or operating income (loss), as defined by U.S. GAAP, and should not be considered as a substitute for net income or net loss or operating profit or loss, or as an indicator of operating performance. The Company defines Consolidated Adjusted EBITDA as income (loss) before Goodwill and fixed asset impairment charges, income taxes and noncontrolling interest income (loss) plus net interest expense and depreciation and amortization expense. The Company defines Adjusted EBITDA for the segments as operating profit (loss) before Goodwill, fixed asset and other intangible assets impairment charges plus other income (expense) and depreciation and amortization expense. Adjusted EBITDA is not a measurement under U.S. GAAP and is not necessarily comparable with similarly titled measures of other companies. 15
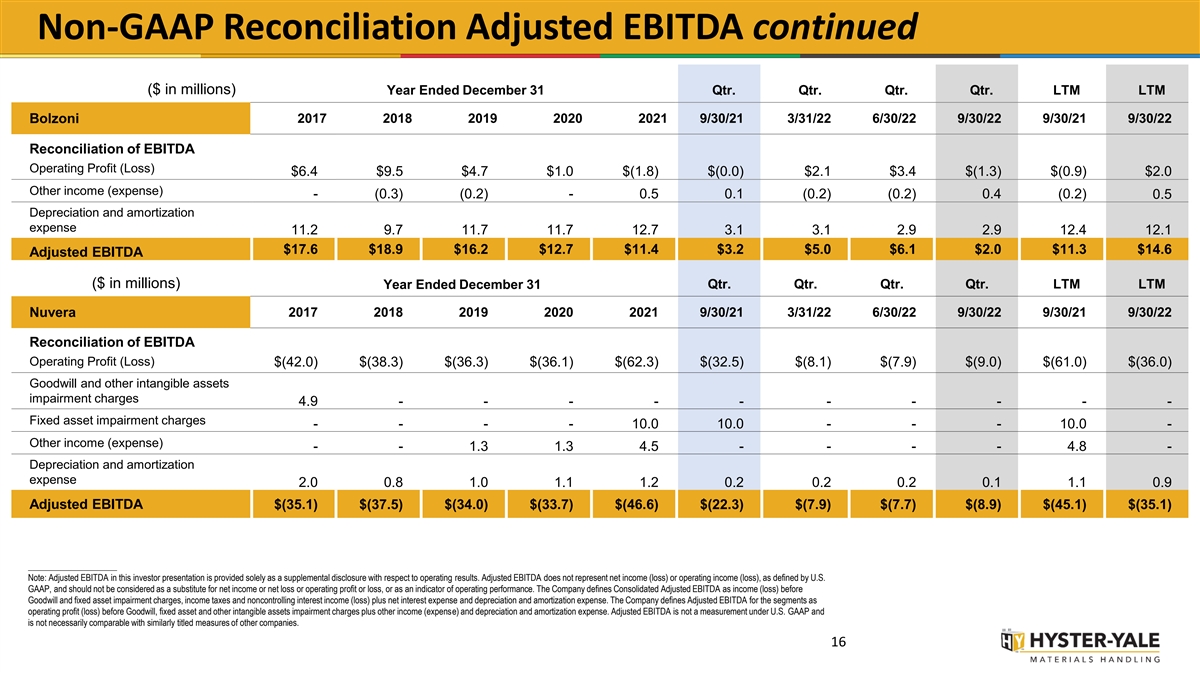
Non-GAAP Reconciliation Adjusted EBITDA continued ($ in millions) Year Ended December 31 Qtr. Qtr. Qtr. Qtr. LTM LTM 2017 2018 2019 2020 2021 9/30/21 3/31/22 6/30/22 9/30/22 9/30/21 9/30/22 Bolzoni Reconciliation of EBITDA Operating Profit (Loss) $6.4 $9.5 $4.7 $1.0 $(1.8) $(0.0) $2.1 $3.4 $(1.3) $(0.9) $2.0 Other income (expense) - (0.3) (0.2) - 0.5 0.1 (0.2) (0.2) 0.4 (0.2) 0.5 Depreciation and amortization expense 11.2 9.7 11.7 11.7 12.7 3.1 3.1 2.9 2.9 12.4 12.1 $17.6 $18.9 $16.2 $12.7 $11.4 $3.2 $5.0 $6.1 $2.0 $11.3 $14.6 Adjusted EBITDA ($ in millions) Year Ended December 31 Qtr. Qtr. Qtr. Qtr. LTM LTM Nuvera 2017 2018 2019 2020 2021 9/30/21 3/31/22 6/30/22 9/30/22 9/30/21 9/30/22 Reconciliation of EBITDA Operating Profit (Loss) $(42.0) $(38.3) $(36.3) $(36.1) $(62.3) $(32.5) $(8.1) $(7.9) $(9.0) $(61.0) $(36.0) Goodwill and other intangible assets impairment charges 4.9 - - - - - - - - - - Fixed asset impairment charges - - - - 10.0 10.0 - - - 10.0 - Other income (expense) - - 1.3 1.3 4.5 - - - - 4.8 - Depreciation and amortization expense 2.0 0.8 1.0 1.1 1.2 0.2 0.2 0.2 0.1 1.1 0.9 Adjusted EBITDA $(35.1) $(37.5) $(34.0) $(33.7) $(46.6) $(22.3) $(7.9) $(7.7) $(8.9) $(45.1) $(35.1) _____________________ Note: Adjusted EBITDA in this investor presentation is provided solely as a supplemental disclosure with respect to operating results. Adjusted EBITDA does not represent net income (loss) or operating income (loss), as defined by U.S. GAAP, and should not be considered as a substitute for net income or net loss or operating profit or loss, or as an indicator of operating performance. The Company defines Consolidated Adjusted EBITDA as income (loss) before Goodwill and fixed asset impairment charges, income taxes and noncontrolling interest income (loss) plus net interest expense and depreciation and amortization expense. The Company defines Adjusted EBITDA for the segments as operating profit (loss) before Goodwill, fixed asset and other intangible assets impairment charges plus other income (expense) and depreciation and amortization expense. Adjusted EBITDA is not a measurement under U.S. GAAP and is not necessarily comparable with similarly titled measures of other companies. 16

Valuation Approach Should Vary by Business Fuel Cell Lift Truck & Attachments Fuel Cell Business Businesses Business • Mature Cyclical Industry • Venture / Technology Industry • Market Leading Products and Position • Distinct Technology / Patents in Fuel Cell • Operating Cash Generation • Operating Cash Invested in New • Value Using Traditional Valuation Model of EBITDA Product Commercialization / Multiple on a Net Debt Basis Ramp Up Multiple should reflect ROIC levels due to Hyster-Yale’s • Value as Venture Business with distribution strategy Developed Technology 17

SUPPLEMENTAL

Overview
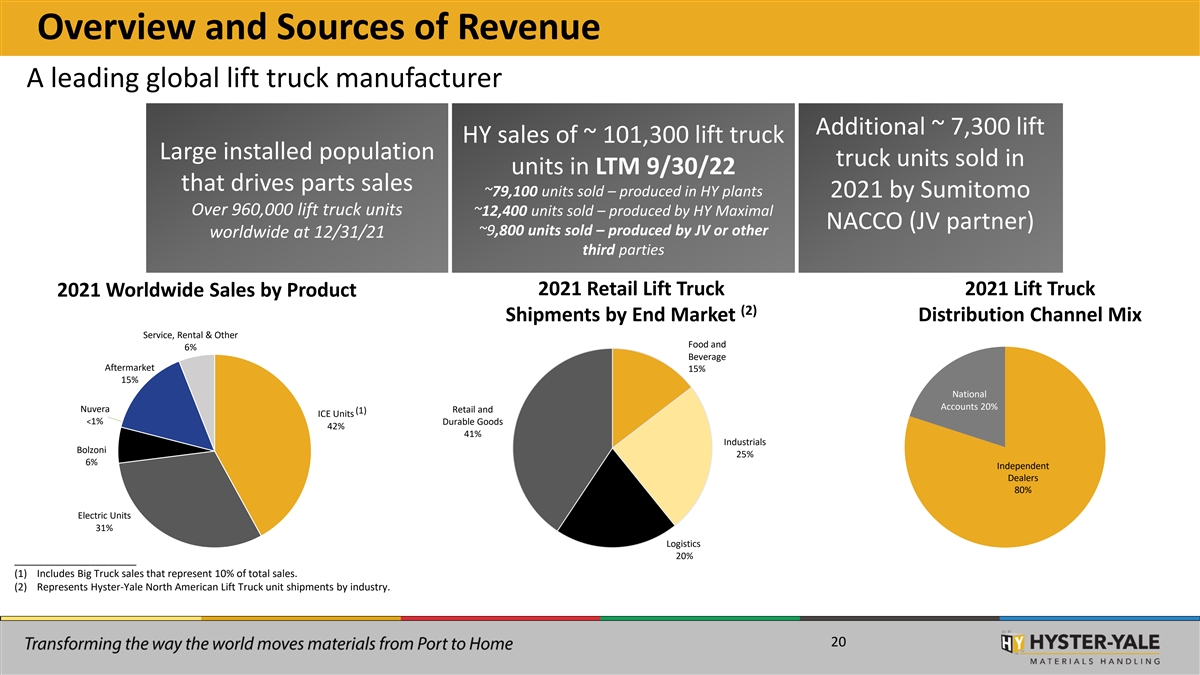
Overview and Sources of Revenue A leading global lift truck manufacturer Additional ~ 7,300 lift HY sales of ~ 101,300 lift truck Large installed population truck units sold in units in LTM 9/30/22 that drives parts sales ~79,100 units sold – produced in HY plants 2021 by Sumitomo Over 960,000 lift truck units ~12,400 units sold – produced by HY Maximal NACCO (JV partner) ~9,800 units sold – produced by JV or other worldwide at 12/31/21 third parties 2021 Retail Lift Truck 2021 Lift Truck 2021 Worldwide Sales by Product (2) Shipments by End Market Distribution Channel Mix Service, Rental & Other Food and 6% Beverage Aftermarket 15% 15% National Accounts 20% Nuvera Retail and (1) ICE Units <1% Durable Goods 42% 41% Industrials Bolzoni 25% 6% Independent Dealers 80% Electric Units 31% Logistics 20% _____________________ (1) Includes Big Truck sales that represent 10% of total sales. (2) Represents Hyster-Yale North American Lift Truck unit shipments by industry. 20

Full Lift Truck Product Line - Over 600 Different Truck Models Available Electric Counterbalanced Electric Narrow ICE Internal Combustion Engine (ICE) Electric Hand Trucks (cushion tire) Rider Trucks Aisle Trucks (pneumatic tire) CLASS 1 CLASS 2 CLASS 3 CLASS 5 CLASS 4 1.5T to 6.0T 1.5T to 8.0T 1.5T to 8.0T 1.5T to 7.0T 1.5T to 52.0T Electric CB Warehouse Big Trucks Counterbalance Equipment Reach Stackers 3-wheel Electric Internal Reach Internal Combustion Engine End Rider Trucks Container Combustion Handlers Engine Order Pickers Very Narrow Aisle Lithium-Ion Stackers Laden / Empty Trucks 4-wheel Electric CLASS 1 CLASS 2 CLASS 3 CLASS 5 OTHER 1.5T to 5.0T 1.0T to 2.0T 1.0T to 2.0T 1.5T to 45.0T Electric Warehouse Equipment ICE Port Machinery Empty Stacker Gas & LPG Reach Container Forklift Stacker Handler Rough Side Terrain Diesel Very Narrow Reach Truck 3-wheel Loader 4-wheel Forklift Pallet Truck Forklift Aisle Truck Note: Approximate model count is as of 9/30/2022 21 Hyster® & Yale® ~ 370 models HY Maximal ~ 240 models
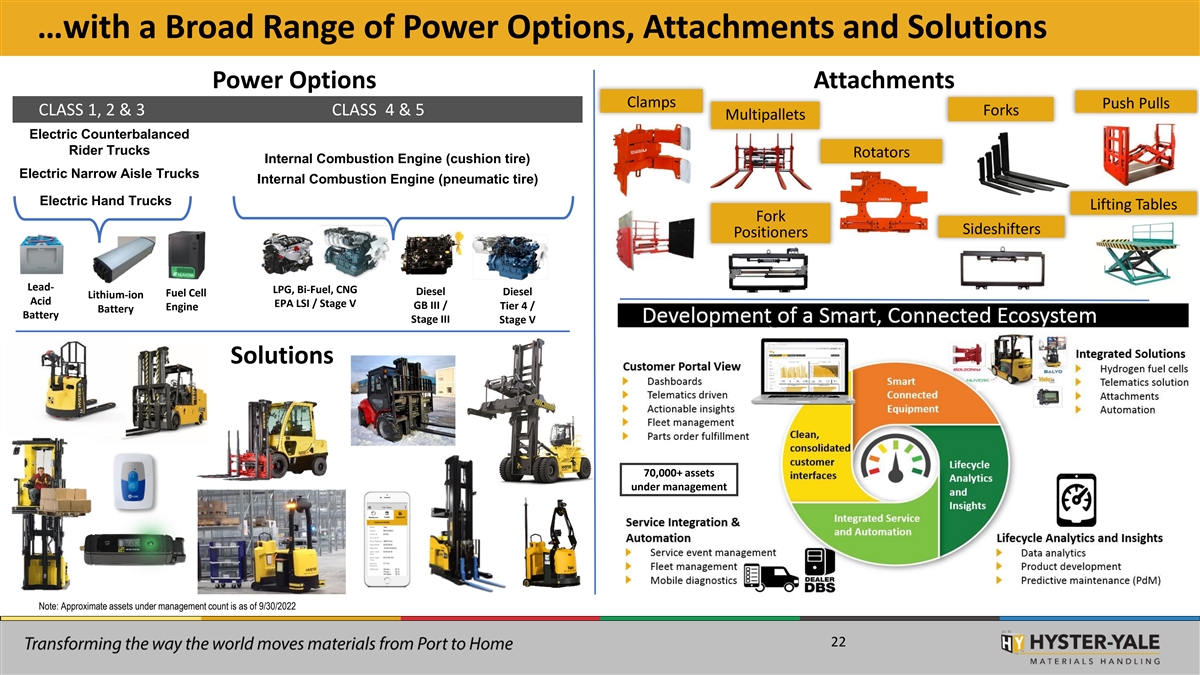
…with a Broad Range of Power Options, Attachments and Solutions Power Options Attachments Clamps Push Pulls CLASS 1, 2 & 3 CLASS 4 & 5 Forks Multipallets Electric Counterbalanced Rider Trucks Rotators Internal Combustion Engine (cushion tire) Electric Narrow Aisle Trucks Internal Combustion Engine (pneumatic tire) Electric Hand Trucks Lifting Tables Fork Sideshifters Positioners Lead- LPG, Bi-Fuel, CNG Diesel Diesel Fuel Cell Lithium-ion Acid EPA LSI / Stage V GB III / Tier 4 / Engine Battery Battery Stage III Stage V Solutions 70,000+ assets under management Note: Approximate assets under management count is as of 9/30/2022 22
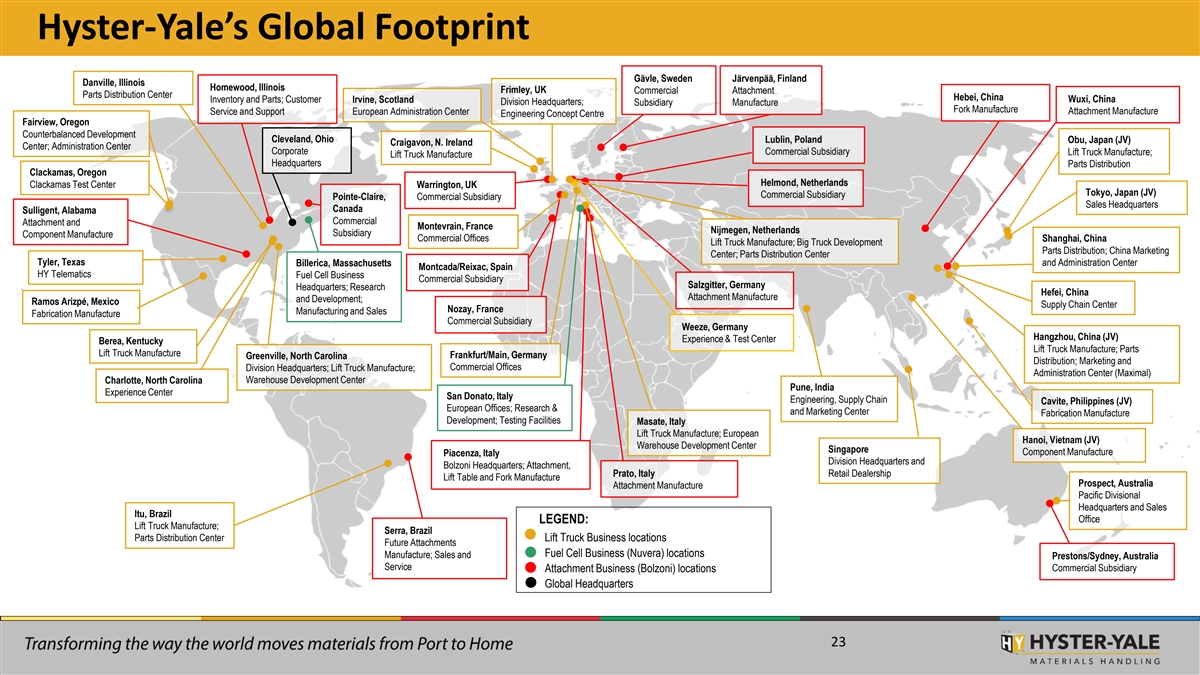
Hyster-Yale’s Global Footprint Gävle, Sweden Järvenpää, Finland Danville, Illinois Homewood, Illinois Frimley, UK Commercial Attachment Parts Distribution Center Hebei, China Inventory and Parts; Customer Wuxi, China Irvine, Scotland Division Headquarters; Subsidiary Manufacture Fork Manufacture Service and Support European Administration Center Attachment Manufacture Engineering Concept Centre Fairview, Oregon Counterbalanced Development Cleveland, Ohio Lublin, Poland Obu, Japan (JV) Craigavon, N. Ireland Center; Administration Center Corporate Commercial Subsidiary Lift Truck Manufacture; Lift Truck Manufacture Headquarters Parts Distribution Clackamas, Oregon Helmond, Netherlands Clackamas Test Center Warrington, UK Tokyo, Japan (JV) Commercial Subsidiary Pointe-Claire, Commercial Subsidiary Sales Headquarters Canada Sulligent, Alabama Commercial Attachment and Montevrain, France Nijmegen, Netherlands Subsidiary Component Manufacture Commercial Offices Shanghai, China Lift Truck Manufacture; Big Truck Development Parts Distribution; China Marketing Center; Parts Distribution Center Tyler, Texas Billerica, Massachusetts and Administration Center Montcada/Reixac, Spain HY Telematics Fuel Cell Business Commercial Subsidiary Salzgitter, Germany Headquarters; Research Hefei, China Attachment Manufacture and Development; Ramos Arizpé, Mexico Supply Chain Center Nozay, France Manufacturing and Sales Fabrication Manufacture Commercial Subsidiary Weeze, Germany Hangzhou, China (JV) Experience & Test Center Berea, Kentucky Lift Truck Manufacture; Parts Lift Truck Manufacture Frankfurt/Main, Germany Greenville, North Carolina Distribution; Marketing and Commercial Offices Division Headquarters; Lift Truck Manufacture; Administration Center (Maximal) Charlotte, North Carolina Warehouse Development Center Pune, India Experience Center San Donato, Italy Engineering, Supply Chain Cavite, Philippines (JV) European Offices; Research & and Marketing Center Fabrication Manufacture Development; Testing Facilities Masate, Italy Lift Truck Manufacture; European Hanoi, Vietnam (JV) Warehouse Development Center Singapore Component Manufacture Piacenza, Italy Division Headquarters and Bolzoni Headquarters; Attachment, Prato, Italy Retail Dealership Lift Table and Fork Manufacture Prospect, Australia Attachment Manufacture Pacific Divisional Headquarters and Sales Itu, Brazil Office LEGEND: Lift Truck Manufacture; Serra, Brazil Parts Distribution Center Lift Truck Business locations Future Attachments Fuel Cell Business (Nuvera) locations Manufacture; Sales and Prestons/Sydney, Australia Service Commercial Subsidiary Attachment Business (Bolzoni) locations Global Headquarters 23
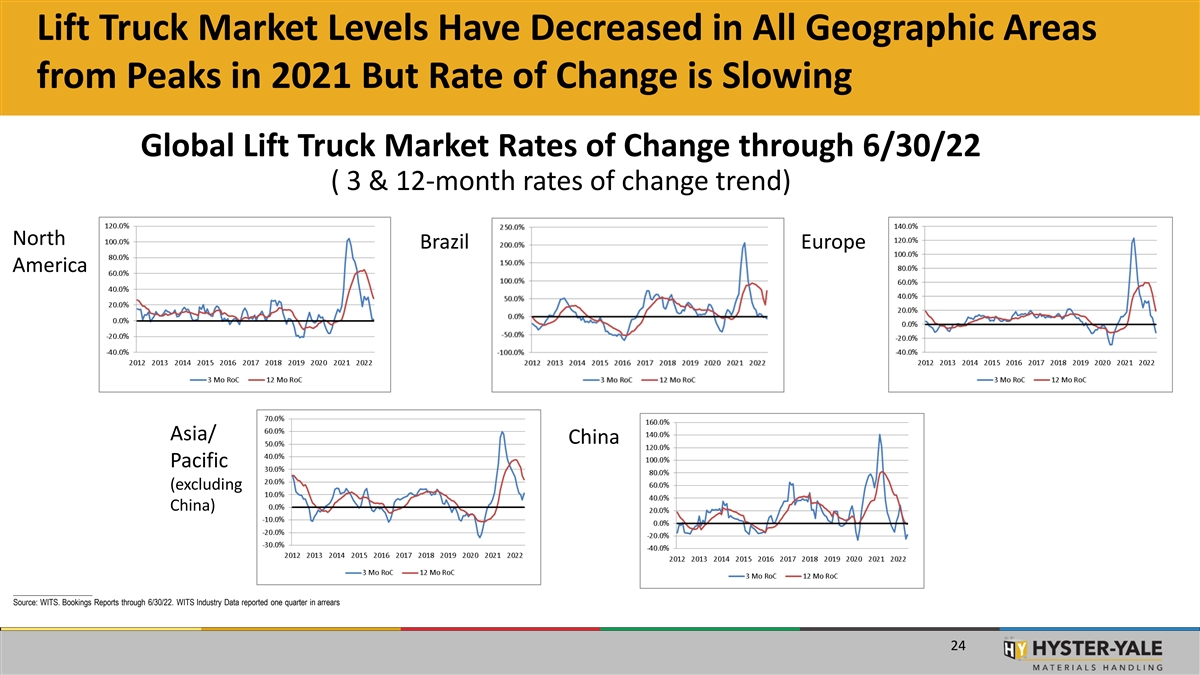
Lift Truck Market Levels Have Decreased in All Geographic Areas from Peaks in 2021 But Rate of Change is Slowing Global Lift Truck Market Rates of Change through 6/30/22 ( 3 & 12-month rates of change trend) North Brazil Europe America Asia/ China Pacific (excluding China) _____________________ Source: WITS. Bookings Reports through 6/30/22. WITS Industry Data reported one quarter in arrears 24

Industry Lift Truck Market Size Data Lift Truck Market Size Data WITS Orders Basis (1) 2002 2003 2004 2005 2006 2007 2008 2009 2010 2011 265,896 278,024 312,455 327,173 380,557 445,583 411,107 222,883 299,387 368,286 Europe 147,322 155,191 186,192 198,058 212,953 191,384 159,279 98,338 136,050 169,589 North America 158,388 168,471 206,225 221,155 242,186 234,353 200,178 118,835 180,903 224,501 Total Americas 138,452 155,094 185,530 201,062 232,438 271,018 260,246 205,114 314,162 381,795 A/P, China and Japan (1a) Global Market 562,736 601,589 704,210 749,390 855,181 950,954 871,531 546,832 794,452 974,582 2012 2013 2014 2015 2016 2017 2018 2019 2020 2021 2022E* Europe 351,441 357,452 387,905 412,642 457,333 509,157 563,573 528,859 502,013 770,751 693,100 North America 181,191 200,939 219,444 235,128 240,836 266,543 276,904 255,241 285,347 458,082 395,600 Total Americas 229,565 252,930 267,546 277,315 280,827 315,395 328,349 306,214 305,748 491,329 422,000 A/P, China and Japan (1a) 363,399 399,395 438,510 409,923 443,938 570,443 646,057 671,803 829,853 1,078,507 952,900 Global Market 944,405 1,009,777 1,093,961 1,099,880 1,182,098 1,394,995 1,537,979 1,506,876 1,637,614 2,340,587 2,068,000 (1) In 2009, Hyster-Yale switched to tracking Industry data on a World Industrial Truck Statistics ( WITS ) Orders Basis. WITS statistics began in 2002. (1a) Beginning in 2014 includes India local production Industry forecast (light blue columns) – source: Derived from DRI-WEFA and Oxford Economic Forecasts 1992 1993 1994 1995 1996 1997 1998 1999 2000 2001 Europe (FEM/JIVA) (3) 150,250 121,922 135,318 152,667 174,953 176,294 187,902 219,615 227,697 274,681 North America (2) (3) 106,590 120,679 154,167 162,725 152,763 178,456 192,192 197,436 205,033 145,967 Total Americas (2) (3) 114,411 127,308 162,261 171,682 168,170 193,413 207,018 209,843 223,499 161,316 A/P, China and Japan (3) 134,635 123,913 119,733 135,050 148,135 148,441 111,848 104,781 122,354 123,780 2002 2003 2004 2005 2006 2007 2008 2009 Europe (FEM/JIVA) (3) 256,717 263,972 286,546 302,158 337,326 382,047 376,945 201,352 Industry Units by Class North America (2) (3) 144,529 151,911 182,450 194,475 207,919 185,726 149,863 95,562 Total Americas (2) (3) 156,702 166,328 203,552 218,908 238,141 229,509 192,134 115,752 Class 1 A/P, China and Japan (3) 129,333 146,334 171,000 195,386 222,074 250,684 257,604 199,159 Class 2 Electric Class 5 Electric 18% Non-WITS Prior Year Information: ICE 8% Lift truck market size history – source: Industrial Truck Association, Japan Industrials Vehicle Association ( JIVA ), European Federation of 27% Materials Handling ( FEM ), World Industrial Truck Association (2) Total Americas numbers for 1992-2008 include North America Commercial, Government and Latin America. Prior years are North America Commercial only. (3) Industry information is based upon the reporting basis of each individual region, which varies according to the industry trade Class 4 Class 3 groups in that region: ICE Electric Americas - North America & Government - Retail bookings 2% 45% Americas - Latin America - Factory bookings Europe & Japan - Factory shipments A/P & China - Factory bookings _____________________ *Note: 2022E based on WITS information through 6/30/22. WITS Industry Data reported one quarter in arrears. Source: WITS*. LTM 6/30/22 Orders Reports ICE = Internal Combustion Engine 25
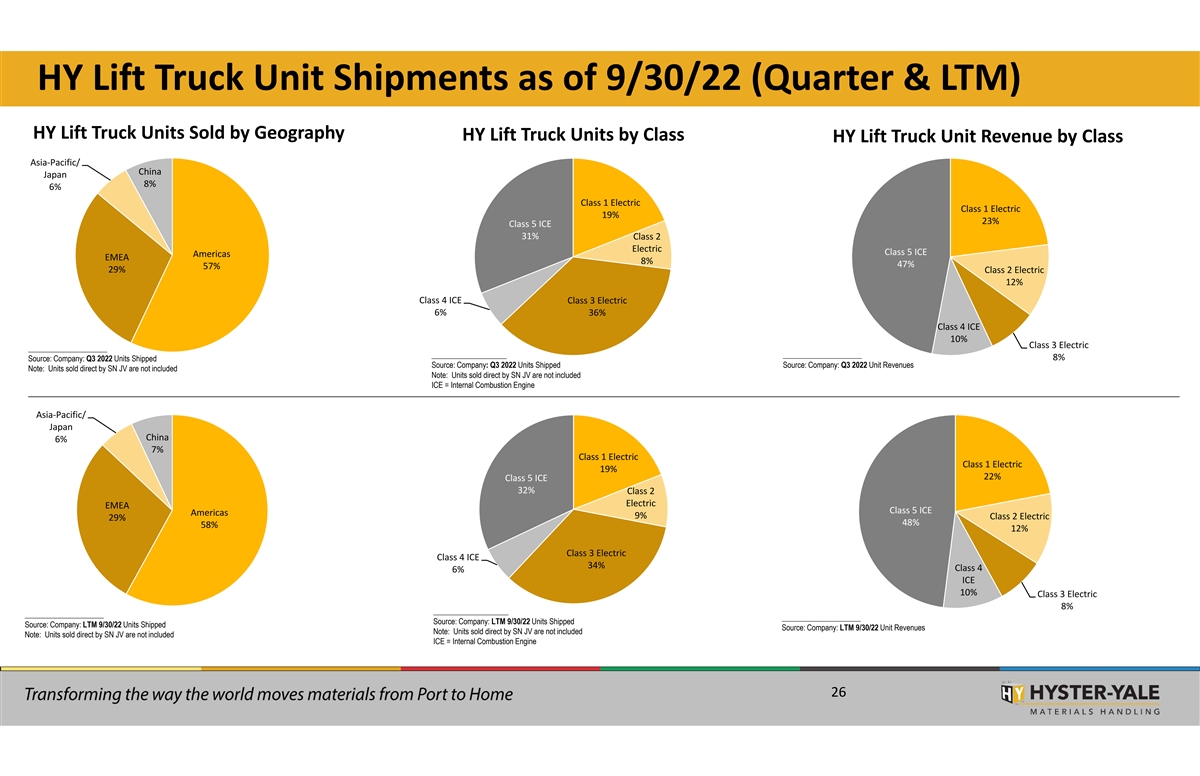
HY Lift Truck Unit Shipments as of 9/30/22 (Quarter & LTM) HY Lift Truck Units Sold by Geography HY Lift Truck Units by Class HY Lift Truck Unit Revenue by Class Asia‐Pacific/ China Japan 8% 6% Class 1 Electric Class 1 Electric 19% 23% Class 5 ICE 31% Class 2 Electric Class 5 ICE Americas EMEA 8% 47% 57% 29% Class 2 Electric 12% Class 4 ICE Class 3 Electric 6% 36% Class 4 ICE 10% Class 3 Electric _____________________ ____________________ _____________________ 8% Source: Company: Q3 2022 Units Shipped Source: Company: Q3 2022 Units Shipped Source: Company: Q3 2022 Unit Revenues Note: Units sold direct by SN JV are not included Note: Units sold direct by SN JV are not included ICE = Internal Combustion Engine Asia‐Pacific/ Japan China 6% 7% Class 1 Electric Class 1 Electric 19% 22% Class 5 ICE 32% Class 2 Electric EMEA Class 5 ICE Americas 9% Class 2 Electric 29% 48% 58% 12% Class 3 Electric Class 4 ICE 34% Class 4 6% ICE 10% Class 3 Electric 8% ____________________ _____________________ _____________________ Source: Company: LTM 9/30/22 Units Shipped Source: Company: LTM 9/30/22 Units Shipped Source: Company: LTM 9/30/22 Unit Revenues Note: Units sold direct by SN JV are not included Note: Units sold direct by SN JV are not included ICE = Internal Combustion Engine 26

Hyster-Yale is Committed to Achieving Its Financial Targets Each of the three businesses has long-term financial objectives HY’s Strategic Initiatives and Related Projects Expected to Drive Results to Targets Lift Truck Bolzoni NUVERA • Focus on increasing Operating Profit sales near term Operating Profit 7% 7% • Focus on reducing ROTCE losses and moving to >20% profitability over time 27

Lift Truck Business Gap to Target Economics Q3 2022 LTM 9/30/22 Actual Lift Truck Operating Profit Margin % (1.9)% (4.1)% Margin % Variances 4.6% 7.6% As HY works through low-margin backlog, Volume % Variances* Gap to Target Manufacturing variances/other 4.8% 2.0% Economics is Operating Expenses (0.5)% 1.5% improving but still below Target Total Volume Variances* 4.3% 3.5% Lift Truck Operating Profit Margin % Gap 8.9% 11.1% Lift Truck Operating Profit Margin % Target 7.0% 7.0% Achieve 7% operating profit margin target over the medium term Achieve ROTCE > 20% *Expected to achieve with annual sales of 140,000 HY-produced lift truck units (mix dependent). 28

Capital and R&D Expenditures R & D E X P E N D I T U R E S C A P I TA L E X P E N D I T U R E S 60 140 120 50 100 40 80 30 60 20 40 10 20 0 0 2018 2019 2020 2021 Estimate 2018 2019 2020 2021 Estimate 2022 2022 Core Forklift Nuvera Bolzoni Core Forklift Investments IT Systems Nuvera Bolzoni Estimated R&D in 2022 comparable to 2021. Cap Ex spend in 2022 estimated to be lower than reduced 2021 spend Note: Estimates are as of 9/30/22 29 (total $ in millions) (total $ in millions)

Lift Truck
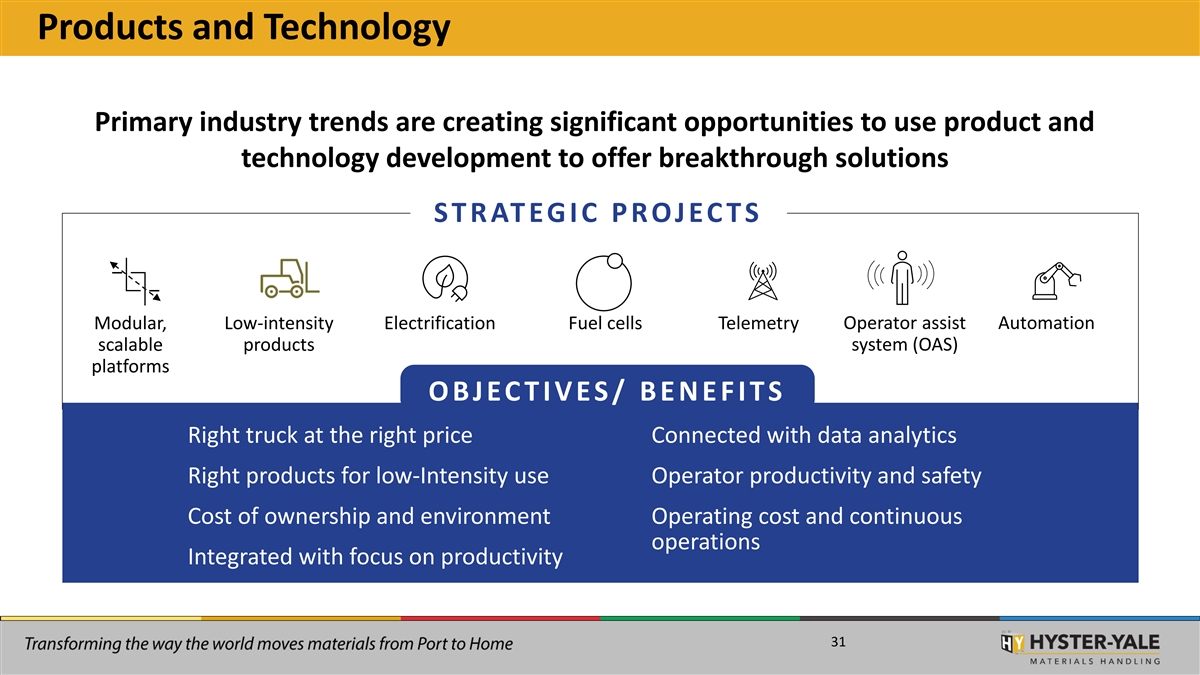
Products and Technology Primary industry trends are creating significant opportunities to use product and technology development to offer breakthrough solutions S T R AT EG I C P R OJ EC T S Operator assist Automation Modular, Low-intensity Electrification Fuel cells Telemetry scalable products system (OAS) platforms O B J EC T I V E S / B E N E F I T S Right truck at the right price Connected with data analytics Right products for low-Intensity use Operator productivity and safety Cost of ownership and environment Operating cost and continuous operations Integrated with focus on productivity 31
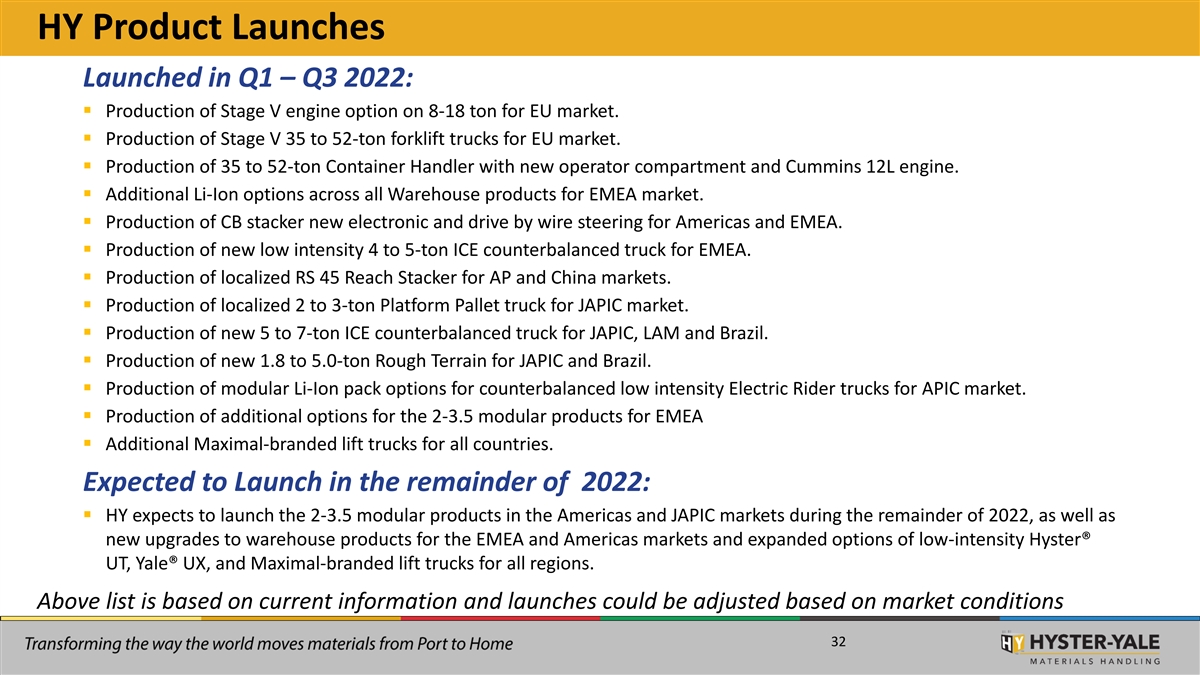
HY Product Launches Launched in Q1 – Q3 2022: ▪ Production of Stage V engine option on 8-18 ton for EU market. ▪ Production of Stage V 35 to 52-ton forklift trucks for EU market. ▪ Production of 35 to 52-ton Container Handler with new operator compartment and Cummins 12L engine. ▪ Additional Li-Ion options across all Warehouse products for EMEA market. ▪ Production of CB stacker new electronic and drive by wire steering for Americas and EMEA. ▪ Production of new low intensity 4 to 5-ton ICE counterbalanced truck for EMEA. ▪ Production of localized RS 45 Reach Stacker for AP and China markets. ▪ Production of localized 2 to 3-ton Platform Pallet truck for JAPIC market. ▪ Production of new 5 to 7-ton ICE counterbalanced truck for JAPIC, LAM and Brazil. ▪ Production of new 1.8 to 5.0-ton Rough Terrain for JAPIC and Brazil. ▪ Production of modular Li-Ion pack options for counterbalanced low intensity Electric Rider trucks for APIC market. ▪ Production of additional options for the 2-3.5 modular products for EMEA ▪ Additional Maximal-branded lift trucks for all countries. Expected to Launch in the remainder of 2022: ▪ HY expects to launch the 2-3.5 modular products in the Americas and JAPIC markets during the remainder of 2022, as well as new upgrades to warehouse products for the EMEA and Americas markets and expanded options of low-intensity Hyster® UT, Yale® UX, and Maximal-branded lift trucks for all regions. Above list is based on current information and launches could be adjusted based on market conditions 32

Factors Impacting Low Cost of Ownership Typical Truck Cost/Hour* Life Cycle Costs Productivity Ergonomics/ fatigue Operator Auto functions 69% Automated trucks Energy usage Alternative powertrains Fuel Internal Combustion Engine to Electric Rider Mode control 11% Cost/hour Fleet management Service & repair Extended warranty Telematics 11% Fleet optimization Price management Finance Cost control Residuals 9% *Typical truck cost/hour for 5,000lb North American applications 33

Lift Truck Modular and Scalable Platforms Customers seek efficiency in their Launching as the Hyster® A Series and the Yale® Series N operations. Scalable configurations provide optimal solutions. 34

Lift Truck Telemetry and Operator Assist System Solutions Operator Assist Systems: Technologically advanced features designed to help reinforce safe and productive Telemetry: Data and analysis is becoming truck operation increasingly important to operations that help customers Telemetry can provide a complete wireless asset management solution meet operational • Total cost of operation visibility challenges • Productivity and utilization • Operator performance 35
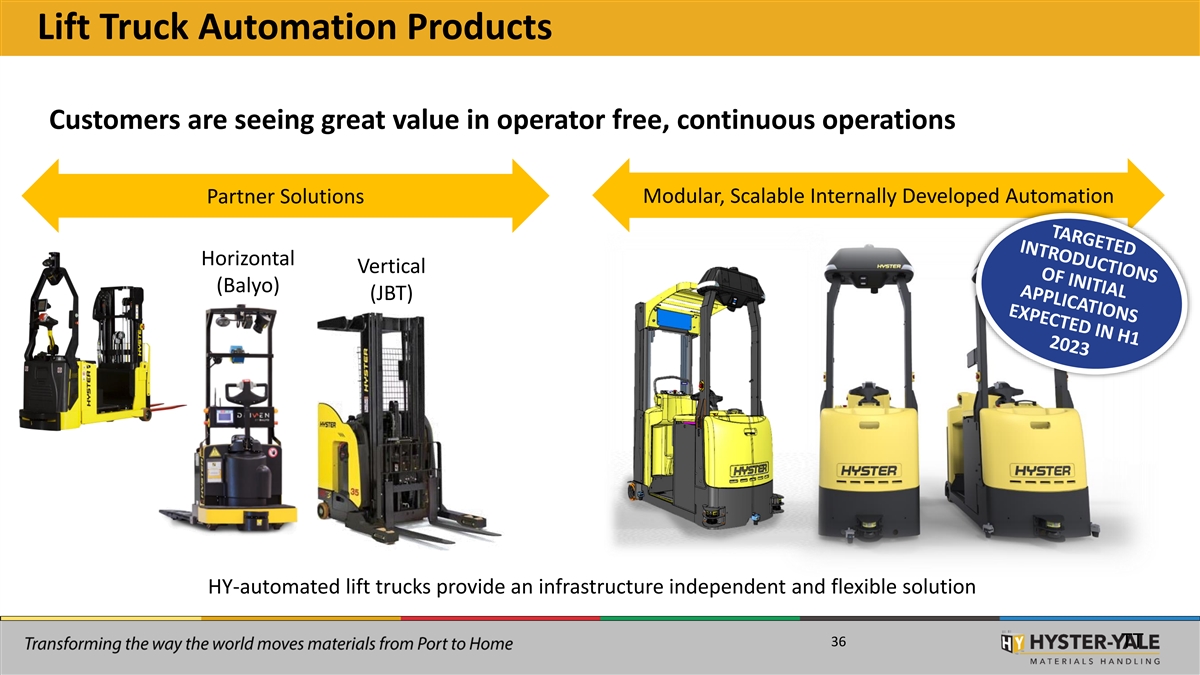
Lift Truck Automation Products Customers are seeing great value in operator free, continuous operations Modular, Scalable Internally Developed Automation Partner Solutions Horizontal Vertical (Balyo) (JBT) HY-automated lift trucks provide an infrastructure independent and flexible solution 36 TT
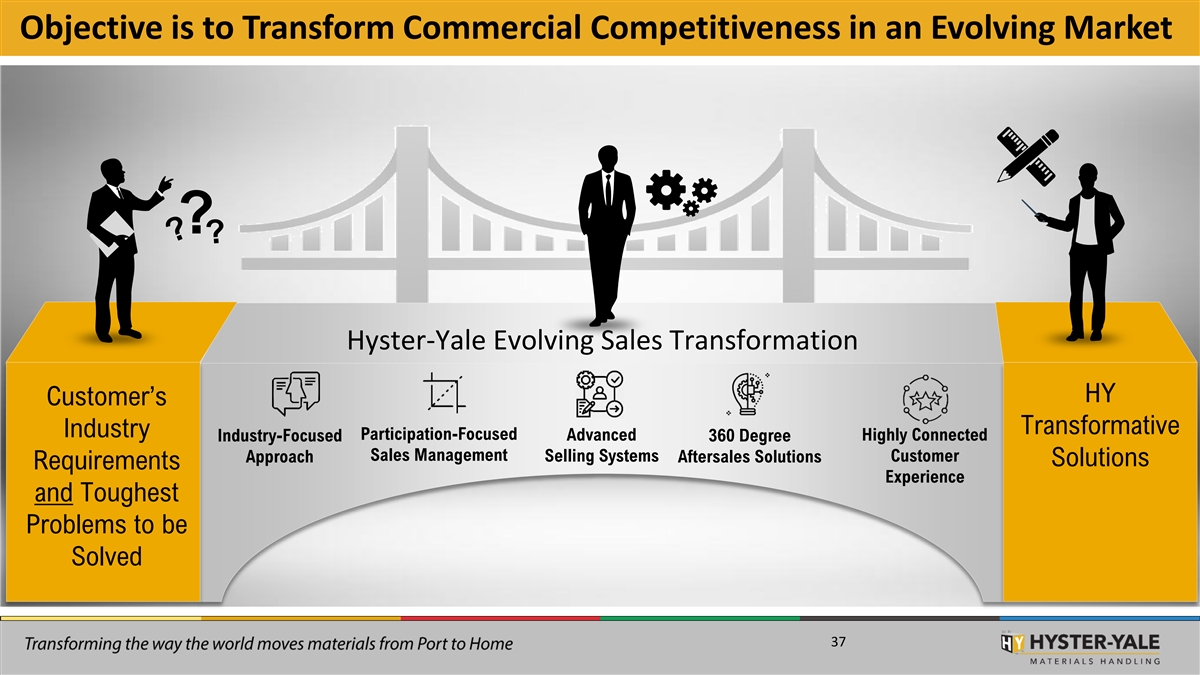
Objective is to Transform Commercial Competitiveness in an Evolving Market Hyster-Yale Evolving Sales Transformation HY Customer’s Transformative Industry Participation-Focused Industry-Focused Advanced 360 Degree Highly Connected Sales Management Selling Systems Customer Approach Aftersales Solutions Solutions Requirements Experience and Toughest Problems to be Solved 37

Enhanced Distribution Capabilities Intended to Increase Competitive Advantage Independent Dealer Network Drives Competitive Value Scaling Global Distribution to Achieve HY Strategies Increasing HY engagement in the distribution process to deliver an “As One” customer experience with HY Augmented Sales Efforts Expands our dealer partners Market Participation 38

Distribution Engagement Independent n Exclusiven Entrepreneurialn Profitablen Committed partnern Dual-line or single Strengthening the distribution footprint Enhancing performance Industry-focused sales support Dealer Excellence programs Competitor acquisitions Dealer alignment In-territory acquisitions Term-based contracts ~800 ~2,800 ~11,000 Enhanced digital customer experience systems Hyster-Yale providing additional global dealer application service Dealership succession planning support locations consultants technicians 39

Bolzoni
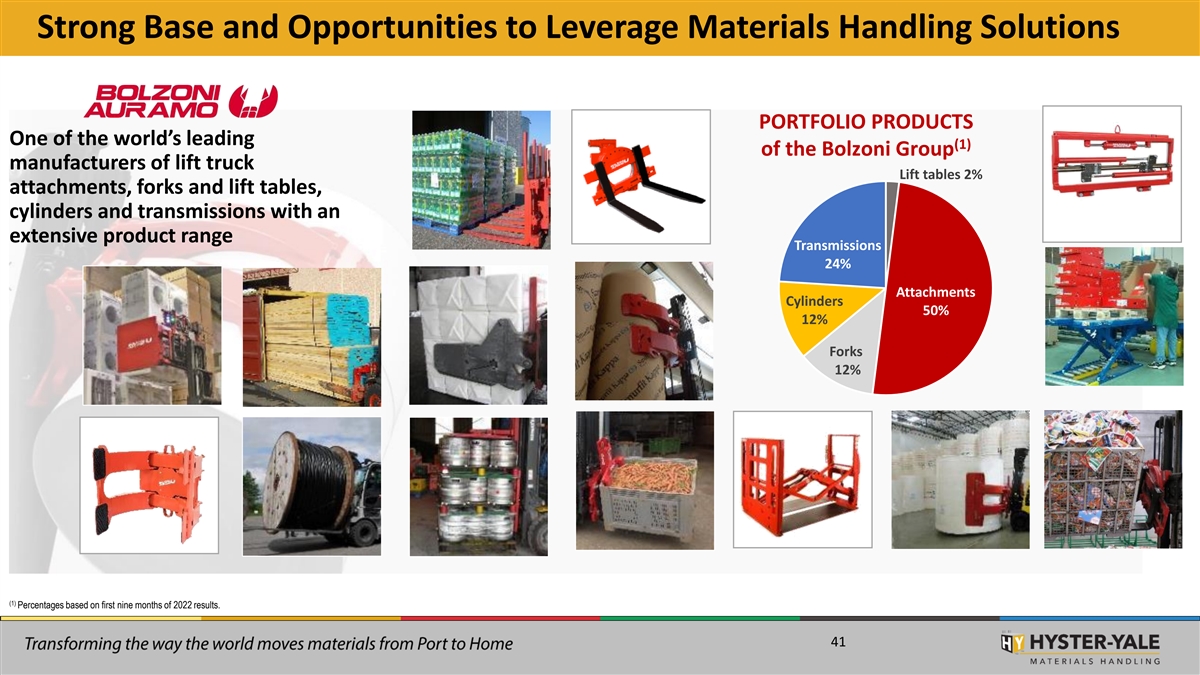
Strong Base and Opportunities to Leverage Materials Handling Solutions PORTFOLIO PRODUCTS One of the world’s leading (1) of the Bolzoni Group manufacturers of lift truck Lift tables 2% attachments, forks and lift tables, cylinders and transmissions with an extensive product range Transmissions 24% Attachments Cylinders 50% 12% Forks 12% (1) Percentages based on first nine months of 2022 results. 41
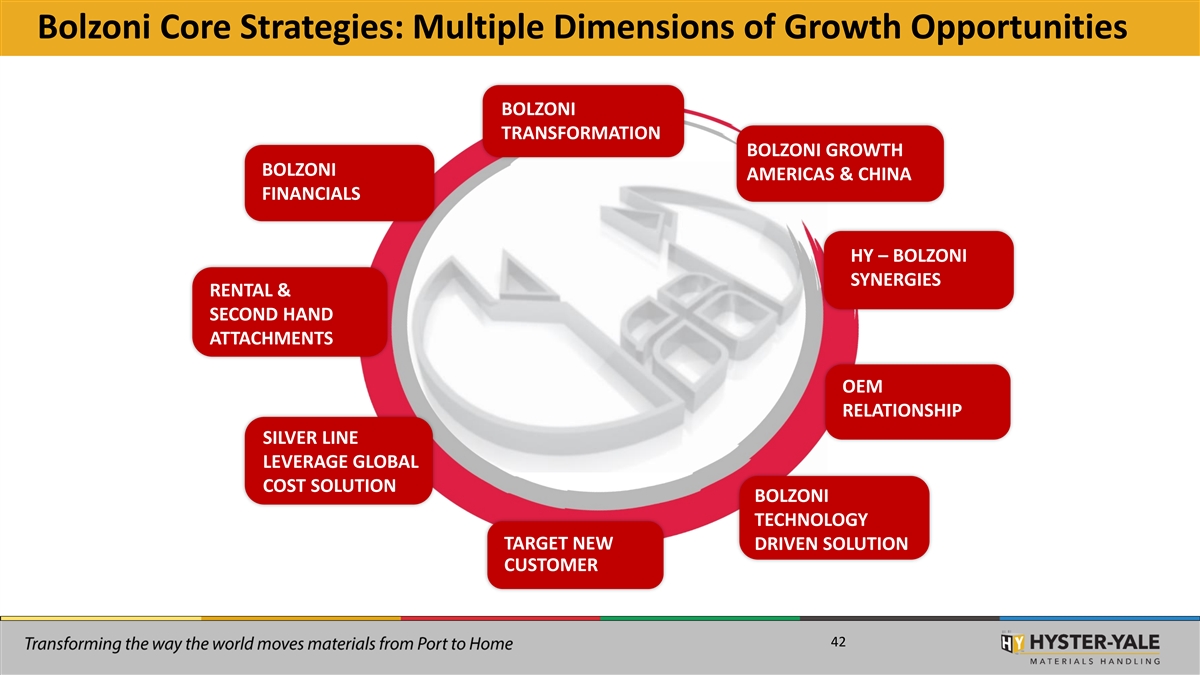
Bolzoni Core Strategies: Multiple Dimensions of Growth Opportunities BOLZONI TRANSFORMATION BOLZONI GROWTH BOLZONI AMERICAS & CHINA FINANCIALS BOLZONI Transformation HY – BOLZONI SYNERGIES RENTAL & SECOND HAND ATTACHMENTS OEM RELATIONSHIP SILVER LINE LEVERAGE GLOBAL COST SOLUTION BOLZONI TECHNOLOGY TARGET NEW DRIVEN SOLUTION CUSTOMER 42
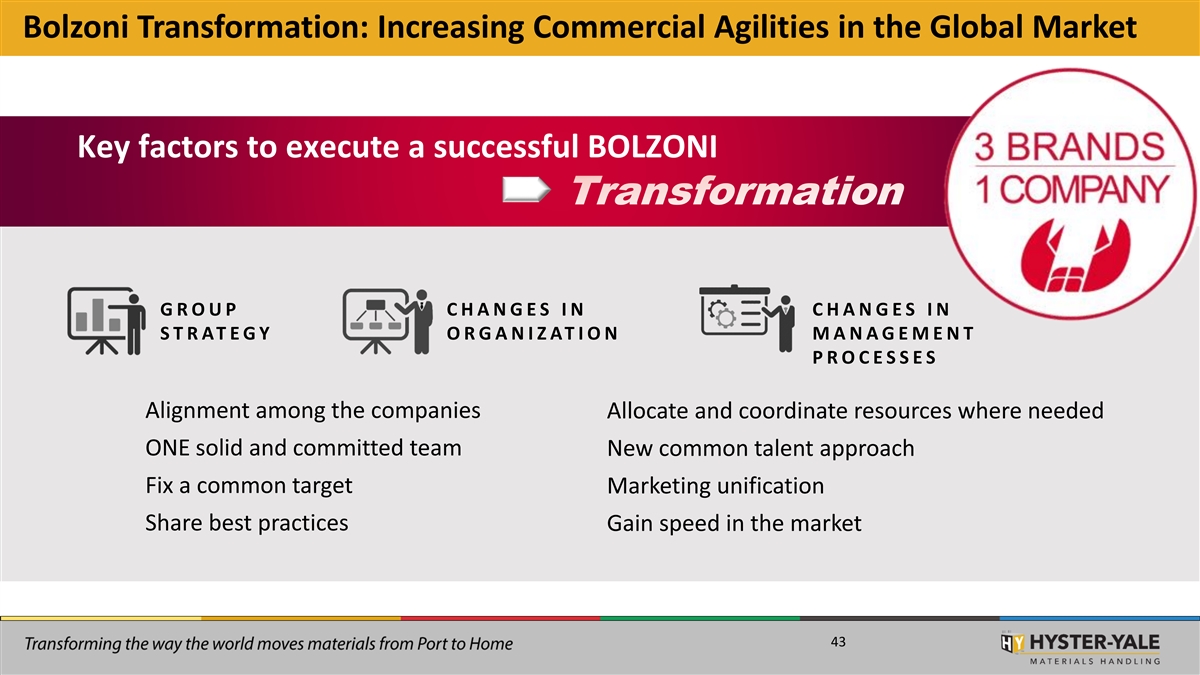
Bolzoni Transformation: Increasing Commercial Agilities in the Global Market Key factors to execute a successful BOLZONI G R O U P C H A N G E S I N C H A N G E S I N S T R A T E G Y O R G A N I Z A T I O N M A N A G E M E N T P R O C E S S E S Alignment among the companies Allocate and coordinate resources where needed ONE solid and committed team New common talent approach Fix a common target Marketing unification Share best practices Gain speed in the market 43

Bolzoni Auramo Inc – Sulligent, AL - Growth Drivers in Place A plant to serve the Americas market • Product localization focused on specific local market requirements • Wide-handling attachments range, as well as forks • North America and Latin America market coverage • Expanded manufacturing of cylinders provides opportunity for Americas market 44

Bolzoni China: Growth Drivers in Place Competitively positions Bolzoni on cost in emerging markets Wuxi (Attachments) Hebei (Forks) • Product localization focused on specific local • Manufactures a complete range of forks for lift and global market requirements trucks, construction and agricultural material • Competitive pricing and quick delivery time handling machines • Improved productivity and efficiency from • Fork range includes reach forks and smart-fork production process improvements solutions • Silver Line range manufacturing addressed to • Range developed to meet global market needs all markets • Continuously improving production processes 45
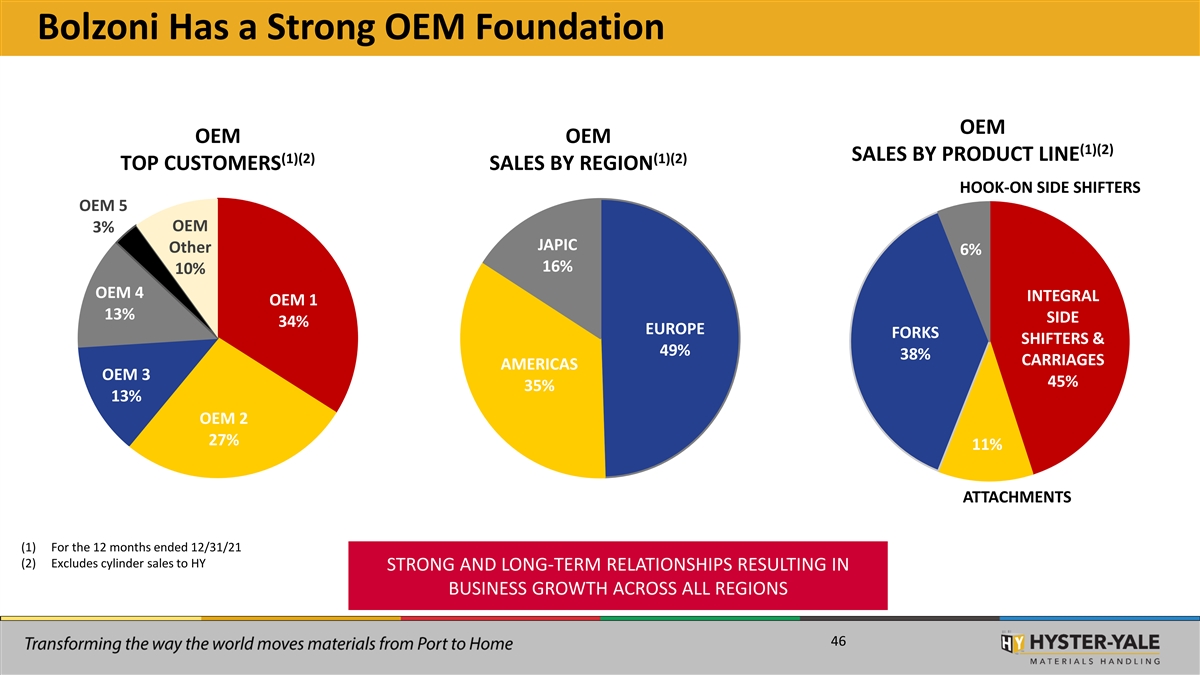
Bolzoni Has a Strong OEM Foundation OEM OEM OEM (1)(2) SALES BY PRODUCT LINE (1)(2) (1)(2) TOP CUSTOMERS SALES BY REGION HOOK-ON SIDE SHIFTERS OEM 5 OEM 3% JAPIC Other 6% 16% 10% OEM 4 INTEGRAL OEM 1 13% SIDE 34% EUROPE FORKS SHIFTERS & 49% 38% CARRIAGES AMERICAS OEM 3 45% 35% 13% OEM 2 27% 11% ATTACHMENTS (1) For the 12 months ended 12/31/21 (2) Excludes cylinder sales to HY STRONG AND LONG-TERM RELATIONSHIPS RESULTING IN BUSINESS GROWTH ACROSS ALL REGIONS 46

Nuvera

Nuvera Is a Transformational Opportunity At a Glance: Application Portfolio • E-45kW as well as E-60kW Fuel Cell engines SMVIC- Leading, Patented Technology Technology certified Experience • First bus with E-series • 75+ engineers engine MIIT certified Demand Tapered in Short-term th • 8 generation of Fuel • High-efficiency Fuel Cell Cell technology stacks • 20+ years of Fuel Cell Automated Fuel Cell Stack Assembly vehicle integration Lines for Series Production Separate Business Unit Intellectual Successful Early-Stage Adoption • Focus on core product (Fuel Property Cell Stacks and Engines) • Leveraging Hyster-Yale • 425+ active patents Expected Transformational Impact • Fuel Cell core strengths technology • Ramping up for growth on Hyster-Yale Future Profitability 48

Nuvera Has a Distinctive Place Within Hyster-Yale • Venture business, with strong commercialized products, Growing focusing on gaining sales hydrogen fuel cell market • Important supplier fit as part of HY’s focus on a broad range of alternative power systems for lift trucks, with a provides significant market opportunity outside the lift truck opportunities market for Nuvera to • Key sales and profitability milestones established but add significant timing cannot be predicted with precision value to HY • Despite losses, HY believes Nuvera is creating significant value for HY shareholders 49
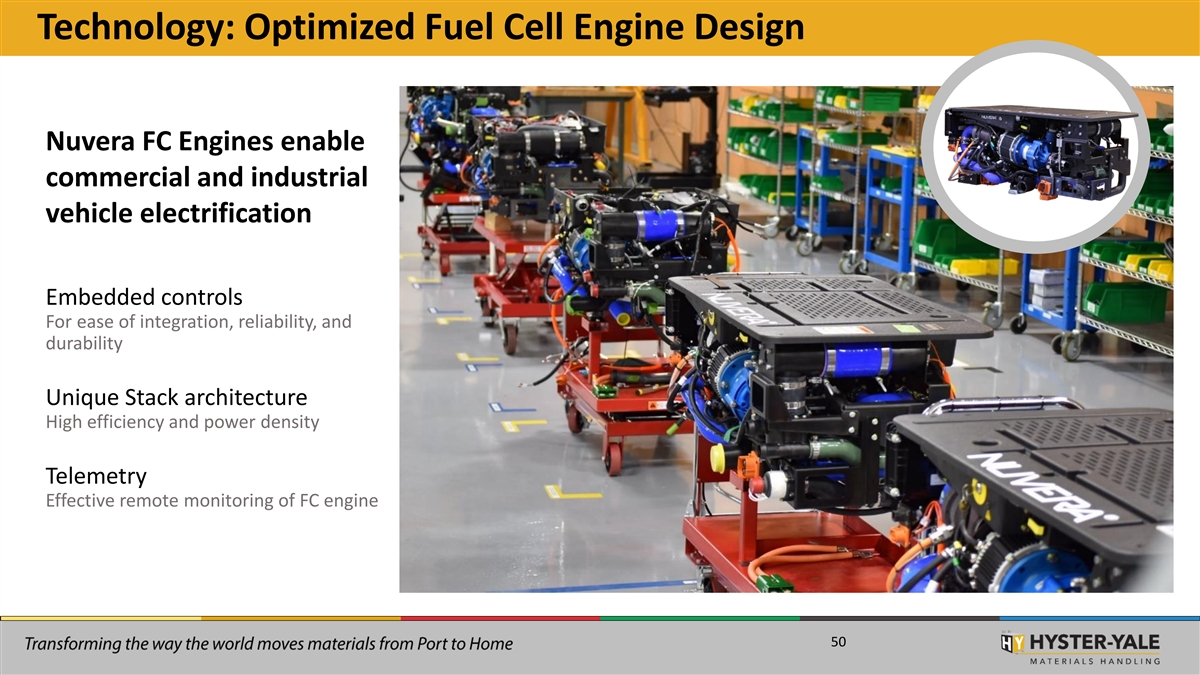
Technology: Optimized Fuel Cell Engine Design Nuvera FC Engines enable commercial and industrial vehicle electrification Embedded controls For ease of integration, reliability, and durability Unique Stack architecture High efficiency and power density Telemetry Effective remote monitoring of FC engine 50

Nuvera Product Platforms: Comprehensive approach to hydrogen mobility market Nuvera makes FC technology WORK for customers E-Series Fuel Cell Engines: Stacks / E-45 and E-60 Subsystems Easily integrated fuel cell module For OEMs that understand For medium- and heavy- stack deployment duty equipment and vehicles Broadly applicable: scalable and modular EN-125 In development 51
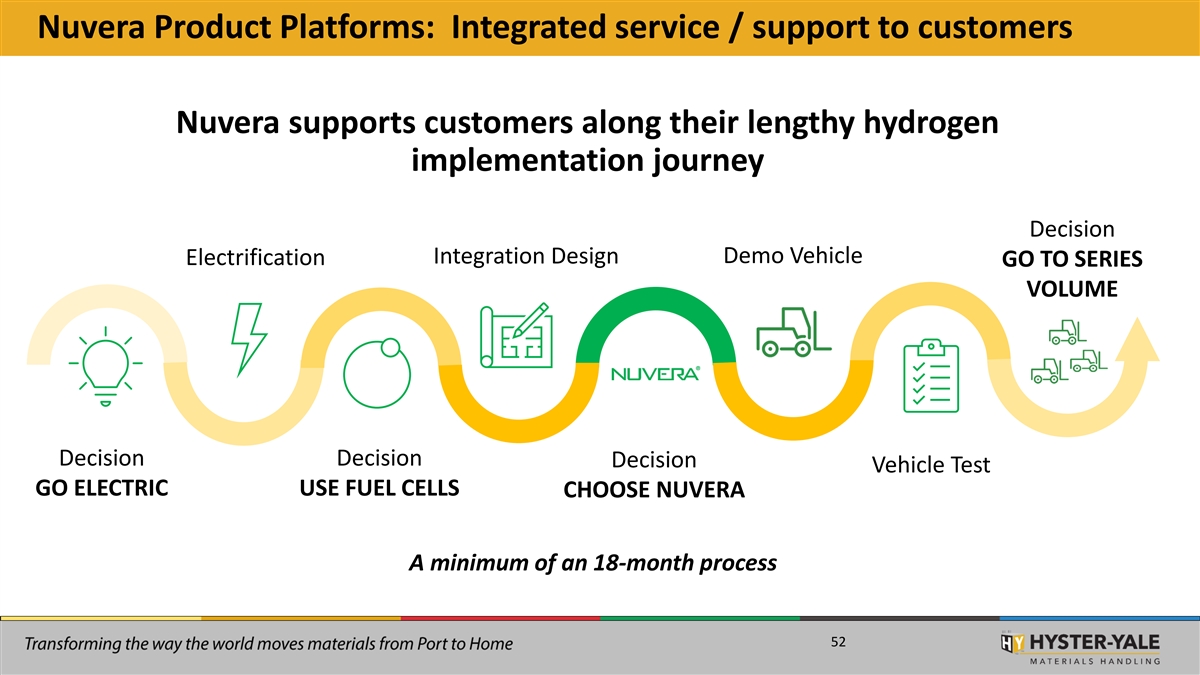
Nuvera Product Platforms: Integrated service / support to customers Nuvera supports customers along their lengthy hydrogen implementation journey Decision Integration Design Demo Vehicle Electrification GO TO SERIES VOLUME Decision Decision Decision Vehicle Test GO ELECTRIC USE FUEL CELLS CHOOSE NUVERA A minimum of an 18-month process 52
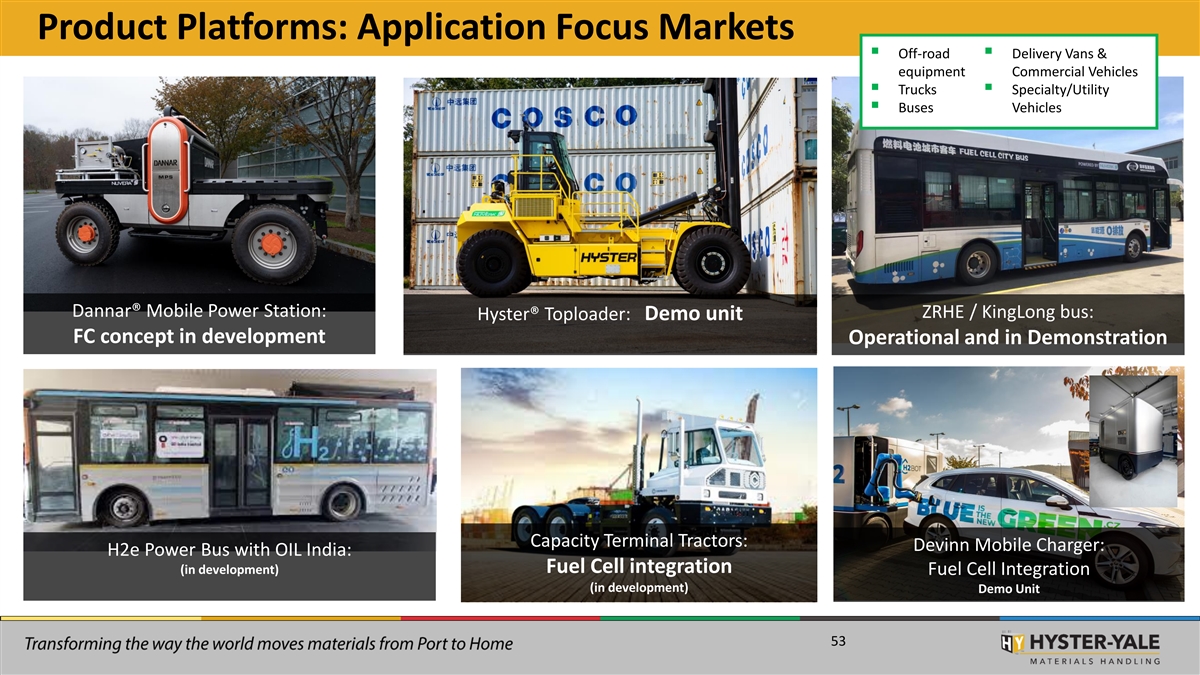
Product Platforms: Application Focus Markets ▪ Off-road ▪ Delivery Vans & equipment Commercial Vehicles ▪ Trucks ▪ Specialty/Utility ▪ Buses Vehicles Dannar® Mobile Power Station: ZRHE / KingLong bus: Hyster® Toploader: Demo unit FC concept in development Operational and in Demonstration Capacity Terminal Tractors: Devinn Mobile Charger: H2e Power Bus with OIL India: (in development) Fuel Cell integration Fuel Cell Integration (in development) Demo Unit 53