UNITED STATES
SECURITIES AND EXCHANGE COMMISSION
Washington, D.C. 20549
FORM N-CSR
CERTIFIED SHAREHOLDER REPORT OF REGISTERED
MANAGEMENT INVESTMENT COMPANIES
Investment Company Act file number | 811-21098 |
|
LMP Real Estate Income Fund Inc. |
(Exact name of registrant as specified in charter) |
|
55 Water Street, New York, NY | | 10041 |
(Address of principal executive offices) | | (Zip code) |
|
Robert I. Frenkel, Esq. Legg Mason & Co., LLC 100 First Stamford Place Stamford, CT 06902 |
(Name and address of agent for service) |
|
Registrant’s telephone number, including area code: | (888)777-0102 | |
|
Date of fiscal year end: | December 31 | |
|
Date of reporting period: | December 31, 2010 | |
| | | | | | | | |
ITEM 1. REPORT TO STOCKHOLDERS.
The Annual Report to Stockholders is filed herewith.
December 31, 2010 | 
|
Annual Report
LMP Real Estate Income Fund Inc.
(RIT)
| |
| INVESTMENT PRODUCTS: NOT FDIC INSURED · NO BANK GUARANTEE · MAY LOSE VALUE |
| |
II | | LMP Real Estate Income Fund Inc. | | |
Fund objectives
The Fund’s primary investment objective is high current income and the Fund’s secondary investment objective is capital appreciation.
What’s inside
Letter from the chairman | | II |
| | |
Investment commentary | | III |
| | |
Fund overview | | 1 |
| | |
Fund at a glance | | 5 |
| | |
Schedule of investments | | 6 |
| | |
Statement of assets and liabilities | | 10 |
| | |
Statement of operations | | 11 |
| | |
Statements of changes in net assets | | 12 |
| | |
Statement of cash flows | | 13 |
| | |
Financial highlights | | 14 |
| | |
Notes to financial statements | | 15 |
| | |
Report of independent registered public accounting firm | | 26 |
| | |
Board approval of management and subadvisory agreements | | 27 |
| | |
Additional information | | 33 |
| | |
Annual chief executive officer and chief financial officer certifications | | 39 |
| | |
Dividend reinvestment plan | | 40 |
| | |
Important tax information | | 42 |
Letter from the chairman | 
|
Dear Shareholder,
We are pleased to provide the annual report of LMP Real Estate Income Fund Inc. for the twelve-month reporting period ended December 31, 2010. Please read on for a detailed look at prevailing economic and market conditions during the Fund’s reporting period and to learn how those conditions have affected Fund performance.
As always, we remain committed to providing you with excellent service and a full spectrum of investment choices. We also remain committed to supplementing the support you receive from your financial advisor. One way we accomplish this is through our website, www.leggmason.com/cef. Here you can gain immediate access to market and investment information, including:
· Fund prices and performance,
· Market insights and commentaries from our portfolio managers, and
· A host of educational resources.
We look forward to helping you meet your financial goals.
Sincerely,

R. Jay Gerken, CFA
Chairman, President and Chief Executive Officer
February 9, 2011
| | LMP Real Estate Income Fund Inc. | | III |
Investment commentary
Economic review
Despite continued headwinds from high unemployment and issues in the housing market, the U.S. economy continued to expand over the twelve months ended December 31, 2010. Toward the end of the reporting period, fears regarding moderating economic growth were replaced with optimism for a strengthening economy in 2011. With investor sentiment improving, U.S. equities moved sharply higher in the fourth quarter, while rising interest rates negatively impacted some sectors of the fixed-income market. All told, during 2010, investors who took on additional risk in their portfolios were generally rewarded.
In September 2010, the National Bureau of Economic Research (“NBER”), the organization charged with determining when recessions start and end, announced that the recession that began in December 2007 had concluded in June 2009. However, the NBER said, “In determining that a trough occurred in June 2009, the committee did not conclude that economic conditions since that month have been favorable or that the economy has returned to operating at normal capacity.” The NBER’s point is well-taken given continued areas of weakness in the U.S. economy.
Although the U.S. Department of Commerce continued to report positive U.S. gross domestic product (“GDP”)i growth, the expansion has moderated since peaking at 5.0% in the fourth quarter of 2009. A slower drawdown in business inventories and renewed consumer spending were contributing factors spurring the economy’s solid growth at the end of 2009. However, the economy grew at a more modest pace in 2010. According to the Commerce Department, GDP growth was 3.7%, 1.7% and 2.6% during the first, second and third quarters of 2010, respectively. The initial estimate for fourth quarter GDP was a 3.2% expansion.
Turning to the job market, while the unemployment rate moved lower in December 2010, it remained elevated throughout the reporting period. While 384,000 new jobs were created during the fourth quarter and the unemployment rate fell from 9.8% in November to 9.4% in December 2010, there continued to be some disturbing trends in the labor market. The unemployment rate has now exceeded 9.0% for twenty consecutive months, the longest period since the government began tracking this data in 1949. In addition, the U.S. Department of Labor reported in December that a total of 14.5 million Americans looking for work have yet to find a job, and 44% of these individuals have been out of work for more than six months.
There was mixed news in the housing market during the period. According to the National Association of Realtors (“NAR”), existing-home sales increased 7.0% and 8.0% in March and April, respectively, after sales had fallen for the period from December 2009 through February 2010. The rebound was largely attributed to people rushing to take advantage of the government’s $8,000 tax credit for first-time home buyers that expired at the end of April. However, with the end of the tax credit, existing-home sales then declined from May through July. Sales then generally rose from August through the end of the year. In total, existing-home sales volume in 2010 was 4.9 million, the lowest
IV | | LMP Real Estate Income Fund Inc. | | |
Investment commentary (cont’d)
amount since 1997. Looking at home prices, the NAR reported that the median existing-home price for all housing types rose a tepid 0.3% in 2010. The inventory of unsold homes was an 8.1 month supply in December at the current sales level, versus a 9.5 month supply in November.
The manufacturing sector was one area of the economy that remained relatively strong during 2010. Based on the Institute for Supply Management’s PMIii, the manufacturing sector has grown seventeen consecutive months since it began expanding in August 2009. After reaching a six-year peak of 60.4 in April 2010 (a reading below 50 indicates a contraction, whereas a reading above 50 indicates an expansion), PMI data indicated somewhat more modest growth through the remainder of the year. However, in December, the manufacturing sector expanded at its fastest pace in seven months, with a reading of 57.0 versus 56.6 in November.
Financial market overview
The financial markets experienced several periods of volatility during the reporting period that tested the resolve of novice and experienced investors alike. During most of the first four months of the reporting period, the financial markets were largely characterized by healthy investor risk appetite and solid results by stocks and lower-quality bonds. The market then experienced sharp sell-offs in late April and in May, and again beginning in mid-November. During those periods, investors tended to favor the relative safety of U.S. Treasury securities. However, these setbacks proved to be only temporary and, in each case, risk aversion was replaced with solid demand for riskier assets.
Due to signs that certain areas of the economy were moderating in the second half of the reporting period, the Federal Reserve Board (“Fed”)iii took further actions to spur the economy. At its August 10th meeting, the Fed announced an ongoing program that calls for using the proceeds from expiring agency debt and agency mortgage-backed securities to purchase longer-dated Treasury securities.
In addition, the Fed remained cautious throughout the reporting period given pockets of weakness in the economy. At its meeting in September 2010, the Fed said, “The Committee will continue to monitor the economic outlook and financial developments and is prepared to provide additional accommodation if needed to support the economic recovery. . . .” This led to speculation that the Fed may again move to purchase large amounts of agency and Treasury securities in an attempt to avoid a double-dip recession and ward off deflation.
The Fed then took additional action in early November. Citing that “the pace of recovery in output and employment continues to be slow,” the Fed announced another round of quantitative easing to help stimulate the economy, entailing the purchase of $600 billion of long-term U.S. Treasury securities by the end of the second quarter of 2011. This, coupled with the Fed’s previously announced program to use the proceeds of expiring securities to purchase Treasuries, means it could buy a total of $850 billion to $900 billion of Treasury securities by the end of June 2011. At its final meeting of the year in December, the Fed said it “will regularly review the pace of its securities purchases and the overall size of the asset-purchase
| | LMP Real Estate Income Fund Inc. | | V |
program in light of incoming information and will adjust the program as needed to best foster maximum employment and price stability.”
Equity market review
U.S. stock prices, as measured by the S&P 500 Indexiv (the “Index”), moved higher during the twelve months ended December 31, 2010. The reporting period got off to a solid start, with the Index moving higher during three of the first four months covered by this report. The market’s ascent was the result of a number of factors, including optimism regarding the economy, better-than-expected corporate profits and increased investor risk appetite. However, robust investor appetite was replaced with heightened risk aversion in May and June. This was due to the escalating sovereign debt crisis in Europe, uncertainties regarding new financial reforms in the U.S. and some worse-than-expected economic data.
After reaching a nineteen-month high on April 23, 2010, the market, as measured by the Index, fell into “correction territory” in May and declined more than 10%. Despite continued disappointing economic data, strong second quarter corporate profits helped the market to rally in July. The market then declined again in August, given some disappointing economic data. With the Fed indicating the possibility of another round of quantitative easing, stock prices then moved sharply higher in September and October. After posting solid results in early November, the market weakened later in the month as financial troubles in Ireland resulted in a re-emergence of the European sovereign debt crisis. However, investor sentiment was buoyed in December by a two-year extension of the Bush-era tax cuts and the Index gained 6.68% during the month. This represented its strongest month of December&nb sp;since 1991. All told, the Index returned 15.06% over the twelve months ended December 31, 2010.
Looking at the U.S. stock market more closely, small- and mid-cap stocks generated the best returns during the twelve months ended December 31, 2010, with the small-cap Russell 2000 Indexv and the Russell Midcap Indexvi gaining 26.85% and 25.48%, respectively. In contrast, the large-cap Russell 1000 Indexvii rose 16.10%. From an investment style perspective, growth and value stocks, as measured by the Russell 3000 Growthviii and Russell 3000 Valueix Indices, returned 17.64% and 16.23%, respectively.
As always, thank you for your confidence in our stewardship of your assets.
Sincerely,

R. Jay Gerken, CFA
Chairman, President and
Chief Executive Officer
January 28, 2011
All investments are subject to risk including the possible loss of principal. Past performance is no guarantee of future results. All index performance reflects no deduction for fees, expenses or taxes. Please note that an investor cannot invest directly in an index.
VI | | LMP Real Estate Income Fund Inc. | | |
Investment commentary (cont’d)
i Gross domestic product (“GDP”) is the market value of all final goods and services produced within a country in a given period of time.
ii The Institute for Supply Management’s PMI is based on a survey of purchasing executives who buy the raw materials for manufacturing at more than 350 companies. It offers an early reading on the health of the manufacturing sector.
iii The Federal Reserve Board (“Fed”) is responsible for the formulation of policies designed to promote economic growth, full employment, stable prices and a sustainable pattern of international trade and payments.
iv The S&P 500 Index is an unmanaged index of 500 stocks and is generally representative of the performance of larger companies in the U.S.
v The Russell 2000 Index measures the performance of the 2,000 smallest companies in the Russell 3000 Index, which represents approximately 8% of the total market capitalization of the Russell 3000 Index. The Russell 3000 Index measures the performance of the 3,000 largest U.S. companies based on total market capitalization, which represents approximately 98% of the U.S. equity market.
vi The Russell Midcap Index measures the performance of the 800 smallest companies in the Russell 1000 Index, which represents approximately 25% of the total market capitalization of the Russell 1000 Index.
vii The Russell 1000 Index measures the performance of the 1,000 largest companies in the Russell 3000 Index, which represents approximately 92% of the total market capitalization of the Russell 3000 Index.
viii The Russell 3000 Growth Index measures the performance of those Russell 3000 Index companies with higher price-to-book ratios and higher forecasted growth values. (A price-to-book ratio is the price of a stock compared to the difference between a company’s assets and liabilities.)
ix The Russell 3000 Value Index measures the performance of those Russell 3000 Index companies with lower price-to-book ratios and lower forecasted growth values.
| | LMP Real Estate Income Fund Inc. 2010 Annual Report | | 1 |
Fund overview
Q. What is the Fund’s investment strategy?
A. The Fund’s primary investment objective is high current income with capital appreciation as a secondary investment objective. At AEW Capital Management, L.P., the Fund’s subadviser, we employ a value-oriented investment strategy designed to identify securities that are priced below what we believe is their intrinsic value. We believe that the performance of real estate securities is ultimately dependent upon the performance of the underlying real estate assets and company management, as well as the overall influence of capital markets. Consequently, when selecting securities for the Fund, we draw upon the combined expertise of our real estate, research and securities professionals.
Under normal market conditions, the Fund invests at least 90% of its total assets in income-producing common shares, preferred shares, convertible preferred shares (preferred shares that, upon the passage of time or the happening of certain events, automatically convert into common shares) and debt securities issued by real estate companies, including real estate investment trusts (“REITs”)i. It is the Fund’s intention to invest approximately 60% to 80% of its total assets in common shares issued by real estate companies and 20% to 40% of its total assets in preferred shares, including convertible preferred shares, issued by real estate companies. The actual percentage of common, preferred and convertible preferred shares and debt securities in the Fund’s portfolio may vary over time based on our assessment of market conditions.
Q. What were the overall market conditions during the Fund’s reporting period?
A. The U.S. stock market performed solidly in 2010 with the major equity indices posting double-digit gains as performance was bolstered by a number of factors including improving investor sentiment regarding the prospects for a global economic recovery, increasing confidence that a double-dip recession would be avoided, improving corporate earnings results, and assurances from the Federal Reserve Board (“Fed”)ii that it would keep short-term interest rates low for the near term. Against this backdrop, the S&P 500 Indexiii rose 15.06% while the Dow Jones Industrial Average (“DJIA”)iv was up 14.06%. The U.S. REIT sector also continued to push higher as the year began, benefiting from the continued signs of an improving economic landscape, as well as positive cash flows into the sector. REITs were also aided early in the period by the fact that a number of REITs were able to successfully recapitalize, which eased fears that some companies would be forced into bankruptcy. As the year progressed, REITs continued their impressive performance run as continuing signs of stabilizing commercial real estate market fundamentals, a low interest rate environment and demand for higher-yield securities, including REITs, coalesced with the broader equity market gains to drive prices higher. The U.S. REIT market, as measured by the MSCI U.S. REIT Indexv, finished the year up 28.48%.
Q. How did we respond to these changing market conditions?
A. Our bottom-up value-oriented investment approach remained the same during 2010. We continued to focus on security selection within each property sector, with the goal of constructing a diversified portfolio of income-producing real estate securities that we believe will provide the best risk-adjusted returns for the Fund.
2 | | LMP Real Estate Income Fund Inc. 2010 Annual Report | | |
Fund overview (cont’d)
The Fund continued to maintain its exposure to interest rate swaps during the reporting period. These positions were used to manage the Fund’s exposure to interest rate fluctuations. Overall, these derivative positions detracted from performance during the period.
Performance review
For the twelve months ended December 31, 2010, LMP Real Estate Income Fund Inc. returned 33.49% based on its net asset value (“NAV”)vi and 35.86% based on its New York Stock Exchange (“NYSE”) market price per share. The Fund’s unmanaged benchmark, the MSCI U.S. REIT Index, returned 28.48% for the same period. The Lipper Real Estate Closed-End Funds Category Averagevii returned 26.33% over the same time frame. Please note that Lipper performance returns are based on each fund’s NAV.
During the twelve-month period, the Fund made distributions to shareholders totaling $0.72 per share, which included a return of capital of $0.43 per share. The performance table shows the Fund’s twelve-month total return based on its NAV and market price as of December 31, 2010. Past performance is no guarantee of future results.
Performance Snapshot as of December 31, 2010
Price Per Share | | 12-Month
Total Return* | |
$11.07 (NAV) | | 33.49% | |
$10.10 (Market Price) | | 35.86% | |
All figures represent past performance and are not a guarantee of future results.
* Total returns are based on changes in NAV or market price, respectively. Total returns assume the reinvestment of all distributions in additional shares in accordance with the Fund’s Dividend Reinvestment Plan.
Q. What were the leading contributors to performance?
A. On an individual stock basis, top contributors to the Fund’s performance during the year included Getty Realty Corp. which owns and leases gas stations, convenience stores and petroleum distribution terminals, and Industrial REIT First Potomac Realty Trust. Getty had been precluded from issuing equity due to an open issue with the Securities and Exchange Commission (“SEC”) related to its request for financial information on its largest tenant. In early 2010, the issue was resolved which allowed the company to be able to raise equity to help fund external growth and provided the catalyst for the company’s strong performance. First Potomac’s performance benefited from strong leasing activity during the year as well as accretive acquisitions which were well received by investors. From a sector perspect ive, the Fund’s overweight to the outperforming Retail — Free Standing sector and underweights to the underperforming Office and Diversified sectors contributed positively to performance. In light of the continued strong performance of common stock during the year, the performance of the Fund’s preferred stock portfolio generally underperformed its common share segment.
Q. What were the leading detractors from performance?
A. Among the top individual detractors from the Fund’s results during 2010 were Office REIT Mack-Cali Realty Corp. and Industrial REIT Liberty Property Trust. Shares of Mack-Cali, which owns suburban office properties throughout the Northeast and Mid-Atlantic regions, underperformed during the year due in large part to investor concern over the challenging
| | LMP Real Estate Income Fund Inc. 2010 Annual Report | | 3 |
leasing environment in the company’s markets and to the company’s mid-year announcement of lower-than-expected funds from operations (“FFO”) guidance for 2010. There were no material company-specific developments that negatively impacted Liberty’s performance. The company is considered more defensive from having a balance sheet in good shape and a stable business model. These characteristics have been less favored by investors in recent quarters. We continue to believe both companies represent solid relative values within their sectors and maintain both positions. On a sector basis, the Fund’s underweight to the outperforming Apartments sector and overweight to the underperforming Industrial sector also detracted from performance.
Q. Were there any significant changes to the Fund during the reporting period?
A. There were no significant changes made to the Fund’s portfolio during the twelve months ended December 31, 2010. We made marginal changes to the Fund’s holdings based on our ongoing assessment of the relative value of each company in the Fund’s investment universe consistent with the Fund’s investment objective of high current income. At the end of December 2010, the Fund’s REIT common stock exposure was approximately 62% of its total investments, with 37% in preferred shares. This compares to approximately 59% and 41%, respectively, as of year end 2009.
Looking for additional information?
The Fund is traded under the symbol “RIT” and its closing market price is available in most newspapers under the NYSE listings. The daily NAV is available on-line under the symbol “XRITX” on most financial websites. Barron’s and the Wall Street Journal’s Monday edition both carry closed-end fund tables that provide additional information. In addition, the Fund issues a quarterly press release that can be found on most major financial websites as well as www.leggmason.com/cef.
In a continuing effort to provide information concerning the Fund, shareholders may call 1-888-777-0102 (toll free), Monday through Friday from 8:00 a.m. to 5:30 p.m. Eastern Time, for the Fund’s current NAV, market price and other information.
Thank you for your investment in LMP Real Estate Income Fund Inc. As always, we appreciate that you have chosen us to manage your assets and we remain focused on achieving the Fund’s investment goals.
Sincerely,
Portfolio Management
AEW Capital Management, L.P.
January 18, 2011
RISKS: Funds that invest in securities related to the real estate industry are subject to the risks of real estate markets, including fluctuating property values, changes in interest rates and other mortgage-related risks. In addition, investment in funds that concentrate their investments in one sector or industry may involve greater risk than more broadly diversified funds. Leverage may result in greater volatility of NAV and the market price of common shares and increases a shareholder’s risk of loss. The Fund may make significant investments in derivative instruments. Derivative instruments can be illiquid, may disproportionately increase losses, and have a potentially large impact on Fund performance.
4 | | LMP Real Estate Income Fund Inc. 2010 Annual Report | | |
Fund overview (cont’d)
Portfolio holdings and breakdowns are as of December 31, 2010 and are subject to change and may not be representative of the portfolio managers’ current or future investments. The Fund’s top ten holdings (as a percentage of total investments) as of this date were: First Potomac Realty Trust (4.0%), Macerich Co. (3.9%), Urstadt Biddle Properties Inc., Cumulative, Series C, 8.500% (3.9%), Camden Property Trust (3.7%), HCP Inc. (3.7%), Entertainment Properties Trust (3.5%), National Retail Properties Inc. (3.4%), OMEGA Healthcare Investors Inc. (3.3%), Kimco Realty Corp., Series G, 7.750% (3.2%) and Getty Realty Corp. (3.2%). Please refer to pages 6 through 9 for a list and percentage breakdown of the Fund’s holdings.
The mention of sector breakdowns is for informational purposes only and should not be construed as a recommendation to purchase or sell any securities. The information provided regarding such sectors is not a sufficient basis upon which to make an investment decision. Investors seeking financial advice regarding the appropriateness of investing in any securities or investment strategies discussed should consult their financial professional. The Fund’s top five sector holdings (as a percentage of total investments) as of December 31, 2010 were: Shopping Centers (16.0%), Office (13.0%), Health Care (12.7%), Apartments (11.1%) and Retail — Free Standing (10.8%). The Fund’s portfolio composition is subject to change at any time.
All investments are subject to risk including the possible loss of principal. Past performance is no guarantee of future results. All index performance reflects no deduction for fees, expenses or taxes. Please note that an investor cannot invest directly in an index.
The information provided is not intended to be a forecast of future events, a guarantee of future results or investment advice. Views expressed may differ from those of the firm as a whole.
i Real estate investment trusts (“REITs”) invest in real estate or loans secured by real estate and issue shares in such investments, which can be illiquid.
ii The Federal Reserve Board (“Fed”) is responsible for the formulation of policies designed to promote economic growth, full employment, stable prices and a sustainable pattern of international trade and payments.
iii The S&P 500 Index is an unmanaged index of 500 stocks and is generally representative of the performance of larger companies in the U.S.
iv The Dow Jones Industrial Average (“DJIA”) is a widely followed measurement of the stock market. The average is comprised of thirty stocks that represent leading companies in major industries. These stocks, widely held by both individual and institutional investors, are considered to be all blue-chip companies.
v The MSCI U.S. REIT Index is a free float-adjusted market capitalization weighted index that is comprised of equity REITs that are included in the MSCI U.S. Investable Market 2500 Index, with the exception of specialty equity REITs that do not generate a majority of their revenue and income from real estate rental and leasing operations. The Index represents approximately 85% of the U.S. REIT universe.
vi Net asset value (“NAV”) is calculated by subtracting total liabilities and outstanding preferred stock (if any) from the closing value of all securities held by the Fund (plus all other assets) and dividing the result (total net assets) by the total number of the common shares outstanding. The NAV fluctuates with changes in the market prices of securities in which the Fund has invested. However, the price at which an investor may buy or sell shares of the Fund is the Fund’s market price as determined by supply of and demand for the Fund’s shares.
vii Lipper, Inc., a wholly-owned subsidiary of Reuters, provides independent insight on global collective investments. Returns are based on the twelve-month period ended December 31, 2010, including the reinvestment of all distributions, including returns of capital, if any, calculated among the 14 funds in the Fund’s Lipper category.
| | LMP Real Estate Income Fund Inc. 2010 Annual Report | | 5 |
Fund at a glance† (unaudited)
Investment breakdown (%) as a percent of total investments
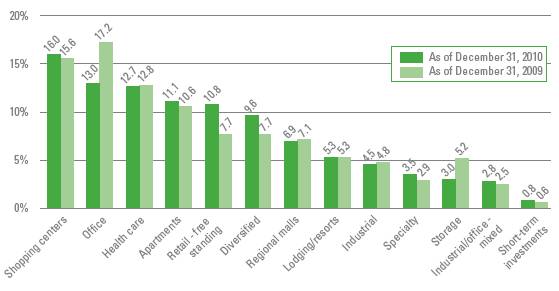
† The bar graph above represents the composition of the Fund’s investments as of December 31, 2010 and December 31, 2009 and does not include derivatives, such as interest rate swaps. The Fund is actively managed. As a result, the composition of the Fund’s investments is subject to change at any time.
6 | | LMP Real Estate Income Fund Inc. 2010 Annual Report | | |
Schedule of investments
December 31, 2010
LMP Real Estate Income Fund Inc.
Security | | Shares | | Value | |
Common Stocks — 62.2% | | | | | |
Apartments — 8.2% | | | | | |
American Campus Communities Inc. | | 165,000 | | $ 5,240,400 | (a) |
Camden Property Trust | | 117,300 | | 6,331,854 | (a) |
Equity Residential | | 45,000 | | 2,337,750 | (a) |
Total Apartments | | | | 13,910,004 | |
Diversified — 2.1% | | | | | |
Dundee Real Estate Investment Trust | | 120,000 | | 3,644,775 | |
Health Care — 10.4% | | | | | |
HCP Inc. | | 170,000 | | 6,254,300 | (a) |
Nationwide Health Properties Inc. | | 105,000 | | 3,819,900 | (a) |
OMEGA Healthcare Investors Inc. | | 250,000 | | 5,610,000 | (a) |
Senior Housing Properties Trust | | 90,000 | | 1,974,600 | (a) |
Total Health Care | | | | 17,658,800 | |
Industrial — 4.5% | | | | | |
DCT Industrial Trust Inc. | | 135,300 | | 718,443 | (a) |
First Potomac Realty Trust | | 410,000 | | 6,896,200 | (a) |
Total Industrial | | | | 7,614,643 | |
Industrial/Office - Mixed — 2.8% | | | | | |
Liberty Property Trust | | 150,000 | | 4,788,000 | (a) |
Lodging/Resorts — 0.9% | | | | | |
Hospitality Properties Trust | | 70,000 | | 1,612,800 | (a) |
Office — 9.8% | | | | | |
BioMed Realty Trust Inc. | | 130,000 | | 2,424,500 | (a) |
CommonWealth REIT | | 100,000 | | 2,551,000 | (a) |
Highwoods Properties Inc. | | 60,400 | | 1,923,740 | (a) |
Kilroy Realty Corp. | | 150,000 | | 5,470,500 | (a) |
Mack-Cali Realty Corp. | | 130,000 | | 4,297,800 | (a) |
Total Office | | | | 16,667,540 | |
Regional Malls — 4.7% | | | | | |
CBL & Associates Properties Inc. | | 60,000 | | 1,417,200 | |
Macerich Co. | | 140,000 | | 6,631,800 | (a) |
Total Regional Malls | | | | 8,049,000 | |
Retail - Free Standing — 8.5% | | | | | |
Getty Realty Corp. | | 175,000 | | 5,474,000 | (a) |
National Retail Properties Inc. | | 220,000 | | 5,830,000 | (a) |
Realty Income Corp. | | 95,000 | | 3,249,000 | (a) |
Total Retail - Free Standing | | | | 14,553,000 | |
See Notes to Financial Statements.
| | LMP Real Estate Income Fund Inc. 2010 Annual Report | | 7 |
LMP Real Estate Income Fund Inc.
Security | | | | | | Shares | | Value | |
Shopping Centers — 6.8% | | | | | | | | | |
Kite Realty Group Trust | | | | | | 364,800 | | $ 1,973,568 | (a) |
Primaris Retail Real Estate Investment Trust | | | | | | 239,500 | | 4,706,658 | |
Ramco-Gershenson Properties Trust | | | | | | 125,700 | | 1,564,965 | (a) |
Regency Centers Corp. | | | | | | 80,000 | | 3,379,200 | (a) |
Total Shopping Centers | | | | | | | | 11,624,391 | |
Specialty — 3.5% | | | | | | | | | |
Entertainment Properties Trust | | | | | | 130,800 | | 6,049,500 | (a) |
Total Common Stocks (Cost — $80,276,628) | | | | | | | | 106,172,453 | |
| | | | | | | | | |
| | Rate | | | | | | | |
Preferred Stocks — 37.0% | | | | | | | | | |
Apartments — 2.9% | | | | | | | | | |
Apartment Investment & Management Co., Cumulative, Series Y | | 7.875 | % | | | 70,000 | | 1,768,200 | |
Apartment Investment & Management Co., Cumulative, Series U | | 7.750 | % | | | 64,900 | | 1,628,990 | |
BRE Properties Inc., Series C | | 6.750 | % | | | 60,000 | | 1,464,600 | (a) |
Total Apartments | | | | | | | | 4,861,790 | |
Diversified — 7.5% | | | | | | | | | |
Duke Realty Corp., Series M | | 6.950 | % | | | 169,800 | | 4,054,824 | (a) |
LBA Realty Fund LP, Cumulative Redeemable | | 8.750 | % | | | 90,000 | | 3,487,500 | (b) |
PS Business Parks Inc., Series M | | 7.200 | % | | | 75,000 | | 1,859,250 | (a) |
PS Business Parks Inc., Cumulative Redeemable, Series O | | 7.375 | % | | | 45,000 | | 1,134,900 | (a) |
Vornado Realty Trust, Cumulative Redeemable, Series G | | 6.625 | % | | | 100,000 | | 2,320,000 | (a) |
Total Diversified | | | | | | | | 12,856,474 | |
Health Care — 2.3% | | | | | | | | | |
HCP Inc., Series F | | 7.100 | % | | | 100,000 | | 2,460,000 | |
OMEGA Healthcare Investors Inc., Cumulative Redeemable, Series D | | 8.375 | % | | | 55,000 | | 1,432,200 | |
Total Health Care | | | | | | | | 3,892,200 | |
Lodging/Resorts — 4.4% | | | | | | | | | |
Hospitality Properties Trust, Cumulative Redeemable, Series B | | 8.875 | % | | | 64,800 | | 1,676,376 | (a) |
LaSalle Hotel Properties, Cumulative Redeemable, Series G | | 7.250 | % | | | 52,900 | | 1,259,681 | |
Strategic Hotels Capital Inc., Series B | | 8.250 | % | | | 94,300 | | 2,218,078 | * |
Sunstone Hotel Investors Inc., Cumulative Redeemable, Series A | | 8.000 | % | | | 100,100 | | 2,424,302 | |
Total Lodging/Resorts | | | | | | | | 7,578,437 | |
See Notes to Financial Statements.
8 | | LMP Real Estate Income Fund Inc. 2010 Annual Report | | |
Schedule of investments (cont’d)
December 31, 2010
LMP Real Estate Income Fund Inc.
Security | | Rate | | | | Shares | | Value | |
Office — 3.2% | | | | | | | | | |
BioMed Realty Trust Inc., Series A | | 7.375 | % | | | 130,000 | | $ 3,251,300 | |
Brandywine Realty Trust, Series D | | 7.375 | % | | | 46,400 | | 1,153,968 | |
Corporate Office Properties Trust, Cumulative Redeemable, Series J | | 7.625 | % | | | 40,000 | | 1,016,400 | (a) |
Total Office | | | | | | | | 5,421,668 | |
Regional Malls — 2.2% | | | | | | | | | |
Glimcher Realty Trust, Cumulative Redeemable, Series F | | 8.750 | % | | | 85,000 | | 2,142,000 | |
Taubman Centers Inc., Cumulative Redeemable, Series H | | 7.625 | % | | | 66,000 | | 1,683,000 | |
Total Regional Malls | | | | | | | | 3,825,000 | |
Retail - Free Standing — 2.3% | | | | | | | | | |
National Retail Properties Inc., Cumulative Redeemable, Series C | | 7.375 | % | | | 85,000 | | 2,123,512 | (a) |
Realty Income Corp., Cumulative Redeemable, Series E | | 6.750 | % | | | 70,000 | | 1,716,400 | (a) |
Total Retail - Free Standing | | | | | | | | 3,839,912 | |
Shopping Centers — 9.2% | | | | | | | | | |
Cedar Shopping Centers Inc., Cumulative Redeemable, Series A | | 8.875 | % | | | 50,000 | | 1,256,500 | |
Developers Diversified Realty Corp., Cumulative Redeemable, Class G | | 8.000 | % | | | 13,300 | | 331,303 | |
Kimco Realty Corp., Series G | | 7.750 | % | | | 209,100 | | 5,520,240 | |
Kite Realty Group Trust | | 8.250 | % | | | 80,000 | | 2,002,000 | * |
Urstadt Biddle Properties Inc., Cumulative, Series C | | 8.500 | % | | | 63,800 | | 6,619,569 | |
Total Shopping Centers | | | | | | | | 15,729,612 | |
Storage — 3.0% | | | | | | | | | |
Public Storage Inc., Cumulative Redeemable, Series L | | 6.750 | % | | | 200,000 | | 5,054,000 | |
Total Preferred Stocks (Cost — $63,171,971) | | | | | | | | 63,059,093 | |
Total Investments before Short-Term Investments (Cost — $143,448,599) | | | | | | | | 169,231,546 | |
See Notes to Financial Statements.
| | LMP Real Estate Income Fund Inc. 2010 Annual Report | | 9 |
LMP Real Estate Income Fund Inc.
Security | | Rate | | Maturity
Date | | | Face
Amount | | Value | |
Short-Term Investments — 0.8% | | | | | | | | | |
Repurchase Agreements — 0.8% | | | | | | | | | |
Interest in $150,000,000 joint tri-party repurchase agreement dated 12/31/10 with Deutsche Bank Securities Inc.; Proceeds at maturity — $1,321,024; (Fully collateralized by various U.S. government agency obligations, 4.125% to 4.750% due 2/24/11 to 11/19/12; Market value — $1,347,429) (Cost — $1,321,000) | | 0.220 | % | 1/3/11 | | $1,321,000 | | $ 1,321,000 | |
Total Investments — 100.0% (Cost — $144,769,599#) | | | | | | | | $170,552,546 | |
* Non-income producing security.
(a) All or a portion of these securities are held as collateral pursuant to a loan agreement.
(b) Security is exempt from registration under Rule 144A of the Securities Act of 1933. This security may be resold in transactions that are exempt from registration, normally to qualified institutional buyers. This security has been deemed liquid pursuant to guidelines approved by the Board of Directors, unless otherwise noted.
# Aggregate cost for federal income tax purposes is $145,148,885.
Abbreviation used in this schedule:
REIT — Real Estate Investment Trust
See Notes to Financial Statements.
10 | | LMP Real Estate Income Fund Inc. 2010 Annual Report | | |
Statement of assets and liabilities
December 31, 2010
Assets: | | | |
Investments, at value (Cost — $144,769,599) | | $170,552,546 | |
Cash | | 105 | |
Cash deposits with brokers for swap contracts | | 983,345 | |
Dividends and interest receivable | | 946,454 | |
Swaps, at value | | 16,446 | |
Prepaid expenses | | 1,733 | |
Total Assets | | 172,500,629 | |
| | | |
Liabilities: | | | |
Loan payable (Note 5) | | 45,000,000 | |
Swaps, at value | | 619,270 | |
Investment management fee payable | | 127,745 | |
Payable for securities purchased | | 70,356 | |
Payable for open swap contracts | | 28,795 | |
Directors’ fees payable | | 6,209 | |
Interest payable (Note 5) | | 2,382 | |
Accrued expenses | | 129,571 | |
Total Liabilities | | 45,984,328 | |
Total Net Assets | | $126,516,301 | |
| | | |
Net Assets: | | | |
Par value ($0.001 par value; 11,431,201 shares issued and outstanding; 100,000,000 shares authorized) | | $ 11,431 | |
Paid-in capital in excess of par value | | 135,061,512 | |
Undistributed net investment income | | 632,905 | |
Accumulated net realized loss on investments, swap contracts and foreign currency transactions | | (34,369,375) | |
Net unrealized appreciation on investments, swap contracts and foreign currencies | | 25,179,828 | |
Total Net Assets | | $126,516,301 | |
| | | |
Shares Outstanding | | 11,431,201 | |
| | | |
Net Asset Value | | $11.07 | |
See Notes to Financial Statements.
| | LMP Real Estate Income Fund Inc. 2010 Annual Report | | 11 |
Statement of operations
For the Year Ended December 31, 2010
Investment Income: | | | |
Dividends | | $ 6,501,746 | |
Interest | | 1,415 | |
Less: Foreign taxes withheld | | (61,049) | |
Total Investment Income | | 6,442,112 | |
Expenses: | | | |
Investment management fee (Note 2) | | 1,375,581 | |
Interest expense (Note 5) | | 590,147 | |
Transfer agent fees | | 113,172 | |
Commitment fees (Note 5) | | 64,975 | |
Legal fees | | 63,435 | |
Audit and tax | | 56,000 | |
Shareholder reports | | 37,985 | |
Directors’ fees | | 26,396 | |
Stock exchange listing fees | | 21,753 | |
Custody fees | | 10,866 | |
Insurance | | 3,455 | |
Miscellaneous expenses | | 6,916 | |
Total Expenses | | 2,370,681 | |
Net Investment Income | | 4,071,431 | |
Realized and Unrealized Gain (Loss) on Investments, Swap Contracts and Foreign Currency Transactions (Notes 1, 3 and 4): | | | |
Net Realized Gain (Loss) From: | | | |
Investment transactions | | (736,379) | |
REIT distributions | | 695,230 | |
Swap contracts | | (641,954) | |
Foreign currency transactions | | (2,928) | |
Net Realized Loss | | (686,031) | |
Change in Net Unrealized Appreciation (Depreciation) From: | | | |
Investments | | 28,990,674 | |
Swap contracts | | (314,182) | |
Foreign currencies | | (226) | |
Change in Net Unrealized Appreciation (Depreciation) | | 28,676,266 | |
Net Gain on Investments, Swap Contracts and Foreign Currency Transactions | | 27,990,235 | |
Increase in Net Assets from Operations | | $32,061,666 | |
See Notes to Financial Statements.
12 | | LMP Real Estate Income Fund Inc. 2010 Annual Report | | |
Statements of changes in net assets
For the Years Ended December 31, | | 2010 | | 2009 | |
| | | | | |
Operations: | | | | | |
Net investment income | | $ 4,071,431 | | $ 5,131,764 | |
Net realized loss | | (686,031) | | (23,289,796) | |
Change in net unrealized appreciation (depreciation) | | 28,676,266 | | 57,568,950 | |
Increase in Net Assets From Operations | | 32,061,666 | | 39,410,918 | |
| | | | | |
Distributions to Shareholders From (Note 1): | | | | | |
Net investment income | | (3,312,084) | | (5,005,137) | |
Return of capital | | (4,918,381) | | (5,686,906) | |
Decrease in Net Assets From Distributions to Shareholders | | (8,230,465) | | (10,692,043) | |
| | | | | |
Fund Share Transactions: | | | | | |
Proceeds from shares issued on reinvestment of distributions (0 and 85,193 shares issued, respectively) | | — | | 628,877 | |
Increase in Net Assets From Fund Share Transactions | | — | | 628,877 | |
Increase in Net Assets | | 23,831,201 | | 29,347,752 | |
| | | | | |
Net Assets: | | | | | |
Beginning of year | | 102,685,100 | | 73,337,348 | |
End of year* | | $126,516,301 | | $102,685,100 | |
* Includes undistributed net investment income of: | | $632,905 | | $518,440 | |
See Notes to Financial Statements.
| | LMP Real Estate Income Fund Inc. 2010 Annual Report | | 13 |
Statement of cash flows
For the Year Ended December 31, 2010
Cash Flows Provided (Used) by Operating Activities: | | | |
Dividends and interest received | | $ 9,721,826 | |
Operating expenses paid | | (1,759,302) | |
Interest paid | | (691,939) | |
Net purchases of short-term investments | | (511,000) | |
Realized loss on swap contracts | | (641,954) | |
Realized loss on foreign currency transactions | | (2,928) | |
Net change in unrealized depreciation on foreign currencies | | (226) | |
Purchases of long-term investments | | (26,976,104) | |
Proceeds from disposition of long-term investments | | 18,246,763 | |
Change in interest payable on swap contracts | | 5,262 | |
Cash deposits with brokers for swap contracts | | (160,000) | |
Net Cash Used By Operating Activities | | (2,769,602) | |
| | | |
Cash Flows Provided (Used) by Financing Activities: | | | |
Cash distributions paid on Common Stock | | (8,230,465) | |
Proceeds from loan | | 11,000,000 | |
Net Cash Provided By Financing Activities | | 2,769,535 | |
Net Decrease in Cash | | (67) | |
Cash, Beginning of year | | 172 | |
Cash, End of year | | $ 105 | |
| | | |
Reconciliation of Increase in Net Assets From Operations to Net Cash Flows Provided (Used) by Operating Activities: | | | |
Increase in Net Assets From Operations | | $ 32,061,666 | |
Increase in investments, at value | | (34,940,072) | |
Decrease in swaps, at value | | 314,182 | |
Increase in payable for securities purchased | | 70,356 | |
Increase in dividends and interest receivable | | (40,436) | |
Increase in swap contracts interest payable | | 5,262 | |
Decrease in deposits with brokers for swap contracts | | (160,000) | |
Increase in prepaid expenses | | (3) | |
Decrease in interest payable | | (101,792) | |
Increase in accrued expenses | | 21,235 | |
Total Adjustments | | (34,831,268) | |
Net Cash Flows Used by Operating Activities | | $ (2,769,602) | |
See Notes to Financial Statements.
14 | | LMP Real Estate Income Fund Inc. 2010 Annual Report | | |
Financial highlights
For a share of capital stock outstanding throughout each year ended December 31, unless otherwise noted:
| | 2010 | | 2009 | | 2008 | | 2007 | | 2006 | |
| | | | | | | | | | | |
Net asset value, beginning of year1 | | $8.98 | | $6.46 | | $16.04 | | $24.53 | | $20.58 | |
Income (loss) from operations: | | | | | | | | | | | |
Net investment income | | 0.36 | | 0.45 | | 0.90 | | 1.13 | | 0.99 | |
Net realized and unrealized gain (loss) | | 2.45 | | 3.01 | | (8.10) | | (7.04) | | 5.92 | |
Distributions paid to taxable auction rate preferred stockholders | | — | | — | | (0.21) | | (0.46) | | (0.42) | |
Total income (loss) from operations | | 2.81 | | 3.46 | | (7.41) | | (6.37) | | 6.49 | |
Less distributions paid to common stock shareholders from: | | | | | | | | | | | |
Net investment income | | (0.29) | | (0.44) | | (0.71) | | (0.97) | | (0.92) | |
Net realized gains | | — | | — | | (0.48) | | (1.15) | | (1.62) | |
Return of capital | | (0.43) | | (0.50) | | (0.98) | | — | | — | |
Total distributions | | (0.72) | | (0.94) | | (2.17) | | (2.12) | | (2.54) | |
| | | | | | | | | | | |
Net asset value, end of year | | $11.07 | | $8.98 | | $6.46 | | $16.04 | | $24.53 | |
| | | | | | | | | | | |
Market price, end of year | | $10.10 | | $8.05 | | $4.79 | | $14.52 | | $21.64 | |
Total return, based on NAV2,3 | | 33.49 | % | 63.57 | % | (49.80) | % | (27.44) | % | 34.39 | % |
Total return, based on Market Price3 | | 35.86 | % | 97.75 | % | (58.88) | % | (25.54) | % | 31.04 | % |
| | | | | | | | | | | |
Net assets, end of year (millions) | | $127 | | $103 | | $73 | | $180 | | $272 | |
| | | | | | | | | | | |
Ratios to average net assets4: | | | | | | | | | | | |
Gross expenses | | 2.08 | % | 2.48 | % | 2.27 | % | 1.55 | % | 1.57 | %5 |
Gross expenses, excluding interest expense | | 1.56 | 6 | 1.99 | 6 | 1.89 | 6 | 1.55 | | 1.57 | 5 |
Net expenses7 | | 2.08 | | 2.42 | 8,9 | 2.01 | 8,9 | 1.17 | 8,9 | 1.09 | 5,8,9 |
Net expenses, excluding interest expense | | 1.56 | 6 | 1.92 | 6,8,9 | 1.63 | 6,8,9 | 1.17 | 8,9 | 1.09 | 5,8,9 |
Net investment income | | 3.57 | | 6.76 | | 6.83 | | 5.18 | | 4.31 | |
| | | | | | | | | | | |
Portfolio turnover rate | | 12 | % | 19 | % | 14 | % | 13 | % | 18 | % |
| | | | | | | | | | | |
Taxable Auction Rate Preferred Stock10: | | | | | | | | | | | |
Total Amount Outstanding (000s) | | — | | — | | — | | $95,000 | | $95,000 | |
Asset Coverage | | — | | — | | — | | 72,306 | | 96,459 | |
Involuntary Liquidating Preference Per Share11 | | — | | — | | — | | 25,000 | | 25,000 | |
| | | | | | | | | | | |
Supplemental data: | | | | | | | | | | | |
Loans Outstanding, End of Year (000s) | | $45,000 | | $34,000 | | $27,600 | | — | | — | |
Asset Coverage for Loan Outstanding | | 381 | % | 402 | % | 366 | % | — | | — | |
Weighted Average Loan (000s) | | $38,690 | | $27,499 | | $46,502 | 12 | — | | — | |
Weighted Average Interest Rate on Loans | | 1.53 | % | 1.38 | % | 3.43 | % | — | | — | |
1 | | Per share amounts have been calculated using the average shares method. |
2 | | Performance figures may reflect compensating balance arrangements, fee waivers and/or expense reimbursements. In the absence of compensating balance arrangements, fee waivers and/or expense reimbursements, the total return would have been lower. Past performance is no guarantee of future results. |
3 | | The total return calculation assumes that distributions are reinvested in accordance with the Fund’s dividend reinvestment plan. Past performance is no guarantee of future results. |
4 | | Calculated on the basis of average net assets of common stock shareholders. Ratios do not reflect the effect of dividend payments to preferred stockholders. |
5 | | Included in the expense ratios are certain non-recurring restructuring (and reorganization, if applicable) fees that were incurred by the Fund during the period. Without these fees, the gross and net expense ratios would have been 1.49% and 1.05%, respectively. |
6 | | Ratio includes commitment fees incurred on the line of credit. |
7 | | The impact of compensating balance arrangements, if any, was less than 0.01%. |
8 | | Reflects fee waivers and/or expense reimbursements. |
9 | | LMPFA has contractually agreed to waive a portion of its management fee in the amount of 0.32% of the Fund’s average daily managed assets from inception through July 31, 2007, 0.20% of the Fund’s average daily Managed Assets for the 12-month period ended July 31, 2008, and 0.10% of the Fund’s average daily Managed Assets for the 12-month period ended July 31, 2009. The waiver was eliminated August 1, 2009. |
10 | | On September 30, 2002 and July 18, 2005, the Fund issued 2,600 and 1,200 shares, respectively, of Taxable Auction Rate Cumulative Preferred Stock at $25,000 per share. On August 26, 2008, the Fund fully redeemed the 3,800 shares of Taxable Auction Rate Cumulative Preferred Stock. |
11 | | Excludes accrued interest or accumulated undeclared distributions. |
12 | | For the period August 26 through December 31, 2008. |
See Notes to Financial Statements.
| | LMP Real Estate Income Fund Inc. 2010 Annual Report | | 15 |
Notes to financial statements
1. Organization and significant accounting policies
LMP Real Estate Income Fund Inc. (the “Fund”) was incorporated in Maryland and is registered as a non-diversified, closed-end management investment company under the Investment Company Act of 1940, as amended (the “1940 Act”). The Fund’s primary investment objective is high current income and the Fund’s secondary objective is capital appreciation.
The following are significant accounting policies consistently followed by the Fund and are in conformity with U.S. generally accepted accounting principles (“GAAP”). Estimates and assumptions are required to be made regarding assets, liabilities and changes in net assets resulting from operations when financial statements are prepared. Changes in the economic environment, financial markets and any other parameters used in determining these estimates could cause actual results to differ. Subsequent events have been evaluated through the date the financial statements were issued.
(a) Investment valuation. Equity securities for which market quotations are available are valued at the last reported sales price or official closing price on the primary market or exchange on which they trade. Debt securities are valued at the mean between the last quoted bid and asked prices provided by an independent pricing service, which are based on transactions in debt obligations, quotations from bond dealers, market transactions in comparable securities and various other relationships between securities. When reliable prices are not readily available, such as when the value of a security has been significantly affected by events after the close of the exchange or market on which the security is principally traded, but before the Fund calculates its net asset value, the Fund values these securities as determined in accordance w ith procedures approved by the Fund’s Board of Directors. Short-term obligations with maturities of 60 days or less are valued at amortized cost, which approximates fair value.
The Fund has adopted Financial Accounting Standards Board Codification Topic 820 (“ASC Topic 820”). ASC Topic 820 establishes a single definition of fair value, creates a three-tier hierarchy as a framework for measuring fair value based on inputs used to value the Fund’s investments, and requires additional disclosure about fair value. The hierarchy of inputs is summarized below.
· | | Level 1 — quoted prices in active markets for identical investments |
| | |
· | | Level 2 — other significant observable inputs (including quoted prices for similar investments, interest rates, prepayment speeds, credit risk, etc.) |
| | |
· | | Level 3 — significant unobservable inputs (including the Fund’s own assumptions in determining the fair value of investments) |
The inputs or methodology used for valuing securities are not necessarily an indication of the risk associated with investing in those securities.
16 | | LMP Real Estate Income Fund Inc. 2010 Annual Report | | |
Notes to financial statements (cont’d)
The Fund uses valuation techniques to measure fair value that are consistent with the market approach and/or income approach, depending on the type of security and the particular circumstance. The market approach uses prices and other relevant information generated by market transactions involving identical or comparable securities. The income approach uses valuation techniques to discount estimated future cash flows to present value.
The following is a summary of the inputs used in valuing the Fund’s assets and liabilities carried at fair value:
ASSETS
Description | | Quoted Prices
(Level 1) | | Other Significant
Observable Inputs
(Level 2) | | Significant
Unobservable
Inputs
(Level 3) | | Total | |
Long-term investments†: | | | | | | | | | |
Common stocks | | $106,172,453 | | — | | — | | $106,172,453 | |
Preferred stocks: | | | | | | | | | |
Diversified | | 9,368,974 | | $3,487,500 | | — | | 12,856,474 | |
Lodging/resorts | | 1,676,376 | | 5,902,061 | | — | | 7,578,437 | |
Regional malls | | 2,142,000 | | 1,683,000 | | — | | 3,825,000 | |
Retail-free standing | | 1,716,400 | | 2,123,512 | | — | | 3,839,912 | |
Other preferred stocks | | 34,959,270 | | — | | — | | 34,959,270 | |
Total long-term investments | | $156,035,473 | | $13,196,073 | | — | | $169,231,546 | |
Short-term investments† | | — | | 1,321,000 | | — | | 1,321,000 | |
Total investments | | $156,035,473 | | $14,517,073 | | — | | $170,552,546 | |
Other financial instruments: | | | | | | | | | |
Interest rate swaps | | — | | 16,446 | | — | | 16,446 | |
Total | | $156,035,473 | | $14,533,519 | | — | | $170,568,992 | |
LIABILITIES
Description | | Quoted Prices
(Level 1) | | Other Significant
Observable Inputs
(Level 2) | | Significant
Unobservable
Inputs
(Level 3) | | Total | |
Other financial instruments: | | | | | | | | | |
Interest rate swaps | | — | | $619,270 | | — | | $619,270 | |
† See Schedule of Investments for additional detailed categorizations.
(b) Repurchase agreements. The Fund may enter into repurchase agreements with institutions that its investment adviser has determined are creditworthy. Each repurchase agreement is recorded at cost. Under the terms of a typical repurchase agreement, the Fund acquires a debt security subject to an obligation of the seller to repurchase, and of the Fund to resell, the security at an agreed-upon price and time, thereby determining the yield during the Fund’s holding period. When entering into repurchase agreements, it is the Fund’s policy that its custodian or a third party custodian, acting on the Fund’s behalf, take possession of the underlying collateral securities, the market value of which, at all times, at least equals the principal amount of the repurchase transaction, including accrued interest. To the extent that a ny
| | LMP Real Estate Income Fund Inc. 2010 Annual Report | | 17 |
repurchase transaction maturity exceeds one business day, the value of the collateral is marked-to-market and measured against the value of the agreement in an effort to ensure the adequacy of the collateral. If the counterparty defaults, the Fund generally has the right to use the collateral to satisfy the terms of the repurchase transaction. However, if the market value of the collateral declines during the period in which the Fund seeks to assert its rights or if bankruptcy proceedings are commenced with respect to the seller of the security, realization of the collateral by the Fund may be delayed or limited.
(c) Swap agreements. The Fund invests in swaps for the purpose of managing its exposure to interest rate, credit or market risk, or for other purposes. The use of swaps involves risks that are different from those associated with ordinary portfolio transactions.
Swap contracts are marked-to-market daily and changes in value are recorded as unrealized appreciation (depreciation). Gains or losses are realized upon termination of the swap agreement. Collateral, in the form of restricted cash or securities, may be required to be held in segregated accounts with the Fund’s custodian in compliance with the terms of the swap contracts. Securities posted as collateral for swap contracts are identified in the Schedule of Investments and restricted cash, if any, is identified on the Statement of Assets and Liabilities. Risks may exceed amounts recorded in the Statement of Assets and Liabilities. These risks include changes in the returns of the underlying instruments, failure of the counterparties to perform under the contracts’ terms, and the possible lack of liquidity with respect to the swap agreements.
Payments received or made at the beginning of the measurement period are reflected as a premium or deposit, respectively, on the Statement of Assets and Liabilities. These upfront payments are amortized over the life of the swap and are recognized as realized gain or loss in the Statement of Operations. Net periodic payments received or paid by the Fund as well as liquidation payments received or made at the termination of the swap are recognized as realized gains or losses in the Statement of Operations.
Interest rate swaps
The Fund may enter into interest rate swap contracts. Interest rate swaps are agreements between two parties to exchange cash flows based on a notional principal amount. The Fund may elect to pay a fixed rate and receive a floating rate, or, receive a fixed rate and pay a floating rate on a notional principal amount. Interest rate swaps are marked-to-market daily based upon quotations from market makers and the change, if any, is recorded as an unrealized gain or loss in the Statement of Operations. When a swap contract is terminated early, the Fund records a realized gain or loss equal to the difference between the original cost and the settlement amount of the closing transaction.
18 | | LMP Real Estate Income Fund Inc. 2010 Annual Report | | |
Notes to financial statements (cont’d)
The risks of interest rate swaps include changes in market conditions that will affect the value of the contract or changes in the present value of the future cash flow streams and the possible inability of the counterparty to fulfill its obligations under the agreement. The Fund’s maximum risk of loss from counterparty credit risk is the discounted net value of the cash flows to be received from the counterparty over the contract’s remaining life, to the extent that that amount is positive. This risk is mitigated by the posting of collateral by the counterparty to the Fund to cover the Fund’s exposure to the counterparty.
(d) Foreign currency translation. Investment securities and other assets and liabilities denominated in foreign currencies are translated into U.S. dollar amounts based upon prevailing exchange rates on the date of valuation. Purchases and sales of investment securities and income and expense items denominated in foreign currencies are translated into U.S. dollar amounts based upon prevailing exchange rates on the respective dates of such transactions.
The Fund does not isolate that portion of the results of operations resulting from fluctuations in foreign exchange rates on investments from the fluctuations arising from changes in market prices of securities held. Such fluctuations are included with the net realized and unrealized gain or loss on investments.
Net realized foreign exchange gains or losses arise from sales of foreign currencies, including gains and losses on forward foreign currency contracts, currency gains or losses realized between the trade and settlement dates on securities transactions, and the difference between the amounts of dividends, interest, and foreign withholding taxes recorded on the Fund’s books and the U.S. dollar equivalent of the amounts actually received or paid. Net unrealized foreign exchange gains and losses arise from changes in the values of assets and liabilities, other than investments in securities, on the date of valuation, resulting from changes in exchange rates.
Foreign security and currency transactions may involve certain considerations and risks not typically associated with those of U.S. dollar denominated transactions as a result of, among other factors, the possibility of lower levels of governmental supervision and regulation of foreign securities markets and the possibility of political or economic instability.
(e) Concentration risk. The Fund invests in securities related to the real estate industry and is subject to the risks of real estate markets, including fluctuating property values, changes in interest rates and other mortgage-related risks.
(f) Security transactions and investment income. Security transactions are accounted for on a trade date basis. Interest income, adjusted for amortization of premium and accretion of discount, is recorded on the accrual basis. Dividend income is recorded on the ex-dividend date. Foreign dividend income is recorded on the ex-dividend date or as soon as practicable after
| | LMP Real Estate Income Fund Inc. 2010 Annual Report | | 19 |
the Fund determines the existence of a dividend declaration after exercising reasonable due diligence. The cost of investments sold is determined by use of the specific identification method. To the extent any issuer defaults or a credit event occurs that impacts the issuer, the Fund may halt any additional interest income accruals and consider the realizability of interest accrued up to the date of default or credit event.
(g) Distributions to shareholders. Dividends and distributions to shareholders are recorded monthly by the Fund on the ex-dividend date for the shareholders of common stock. The Fund’s policy is to pass through to its shareholders substantially all Real Estate Investment Trust (“REIT”) distributions and other income it receives, less operating expenses. The character of REIT distributions received from portfolio securities held by the Fund is generally comprised of investment income, long-term capital gains, and return of capital. The Fund reclassifies amounts within the Statement of Operations primarily based on information provided by REITs after the Fund’s fiscal year end. In those instances where such information is not available, the Fund estimates the amounts based on amounts reported by the REITs in the prior year . After all remaining REITs report the actual character of distributions paid during the year, the Fund adjusts estimates previously recorded to actual. The character of distributions paid to shareholders disclosed within the Statements of Changes in Net Assets is based on these reclassifications.
Pursuant to its Managed Distribution Policy, the Fund intends to make regular monthly distributions to shareholders at a fixed rate per common share, which rate may be adjusted from time to time by the Fund’s Board of Directors. Under Fund’s Managed Distribution Policy, if, for any monthly distribution, net investment income and net realized capital gain is less than the amount of the distribution, the difference will be distributed from the Fund’s assets (and constitute a “return of capital”). The Board of Directors may terminate the Managed Distribution Policy at any time, including when certain events would make part of the return of capital taxable to shareholders. Any such termination could have an adverse effect on the market price for Fund’s shares.
(h) Cash flow information. The Fund invests in securities and distributes dividends from net investment income, net realized gains and return of capital, if any, which are paid in cash and may be reinvested at the discretion of shareholders. These activities are reported in the Statement of Changes in Net Assets and additional information on cash receipts and cash payments are presented in the Statement of Cash Flows.
(i) Compensating balance arrangements. The Fund has an arrangement with its custodian bank whereby a portion of the custodian’s fees is paid indirectly by credits earned on the Fund’s cash on deposit with the bank.
(j) Federal and other taxes. It is the Fund’s policy to comply with the federal income and excise tax requirements of the Internal Revenue Code of 1986 (the “Code”), as amended, applicable to regulated investment companies.
20 | | LMP Real Estate Income Fund Inc. 2010 Annual Report | | |
Notes to financial statements (cont’d)
Accordingly, the Fund intends to distribute its taxable income and net realized gains, if any, to shareholders in accordance with timing requirements imposed by the Code. Therefore, no federal or state income tax provision is required in the Fund’s financial statements.
Management has analyzed the Fund’s tax positions taken on income tax returns for all open tax years and has concluded that as of December 31, 2010, no provision for income tax is required in the Fund’s financial statements. The Fund’s federal and state income and federal excise tax returns for tax years for which the applicable statutes of limitations have not expired are subject to examination by Internal Revenue Service and state departments of revenue.
Under the applicable foreign tax laws, a withholding tax may be imposed on interest, dividends and capital gains at various rates.
(k) Reclassification. GAAP requires that certain components of net assets be reclassified to reflect permanent differences between financial and tax reporting. These reclassifications have no effect on net assets or net asset values per share. During the current year, the following reclassifications have been made:
| | Undistributed Net
Investment Income | | Accumulated Net
Realized Loss | |
(a) | | $(644,882) | | $644,882 | |
(a) | Reclassifications are primarily due to foreign currency transactions treated as ordinary income for tax purposes and book/tax differences in the treatment of swap contracts. |
(l) Counterparty risk and credit-risk-related contingent features of derivative instruments. The Fund may invest in certain securities or engage in other transactions, where the Fund is exposed to counterparty credit risk in addition to broader market risks. The Fund may invest in securities of issuers, which may also be considered counterparties as trading partners in other transactions. This may increase the risk of loss in the event of default or bankruptcy by the counterparty or if the counterparty otherwise fails to meet its contractual obligations. The Fund’s investment manager attempts to mitigate counterparty risk by (i) periodically assessing the creditworthiness of its trading partners, (ii) monitoring and/or limiting the amount of its net exposure to each individual counterparty based on its assessment and (iii) requiring co llateral from the counterparty for certain transactions. Market events and changes in overall economic conditions may impact the assessment of such counterparty risk by the investment manager. In addition, declines in the values of underlying collateral received may expose the Fund to increased risk of loss.
The Fund has entered into master agreements with certain of its derivative counterparties that provide for general obligations, representations, agreements, collateral, events of default or termination and credit related contingent features. The credit related contingent features include, but are not
| | LMP Real Estate Income Fund Inc. 2010 Annual Report | | 21 |
limited to, a percentage decrease in the Fund’s net assets or NAV over a specified period of time. If these credit related contingent features were triggered, the derivatives counterparty could terminate the positions and demand payment or require additional collateral.
As of December 31, 2010, the Fund held interest rate swaps with credit related contingent features which had a liability position of $619,270. If a contingent feature in the Master Agreements would have been triggered, the Fund would have been required to pay this amount to its derivatives counterparty. As of December 31, 2010, the Fund had posted with its counterparty cash as collateral to cover the net liability of all derivatives amounting to $983,345, which could be used to reduce the required payment.
2. Investment management agreement and other transactions with affiliates
Legg Mason Partners Fund Advisor, LLC (“LMPFA”) is the Fund’s investment manager and AEW Capital Management, L.P. (“AEW”) is the Fund’s subadviser. LMPFA is a wholly-owned subsidiary of Legg Mason, Inc. (“Legg Mason”).
LMPFA provides administrative and certain oversight services to the Fund. The Fund pays LMPFA an investment management fee, calculated daily and paid monthly, at an annual rate of 0.90% of the Fund’s average daily net assets plus assets attributable to any borrowings used for leverage (“Managed Assets”).
LMPFA delegates to AEW the day-to-day portfolio management of the Fund, except for the management of cash and short-term instruments. For its services, LMPFA pays AEW a fee at an annual rate equal to 50% of the management fee paid by the Fund to LMPFA, net of waivers.
During periods in which the Fund is utilizing leverage, the fees which are payable to LMPFA as a percentage of the Fund’s net assets will be higher then if the Fund did not utilize leverage because the fees are calculated as a percentage of the Fund’s managed assets.
All officers and one Director of the Fund are employees of Legg Mason or its affiliates and do not receive compensation from the Fund.
3. Investments
During the year ended December 31, 2010, the aggregate cost of purchases and proceeds from sales of investments (excluding short-term investments) were as follows:
Purchases | $27,046,460 | | | |
Sales | 18,246,763 | | | |
22 | | LMP Real Estate Income Fund Inc. 2010 Annual Report | | |
Notes to financial statements (cont’d)
At December 31, 2010, the aggregate gross unrealized appreciation and depreciation of investments for federal income tax purposes were as follows:
Gross unrealized appreciation | | $29,101,905 | |
Gross unrealized depreciation | | (3,698,244 | ) |
Net unrealized appreciation | | $25,403,661 | |
At December 31, 2010, the Fund held the following open swap contracts:
INTEREST RATE SWAPS
Swap Counterparty | | Notional
Amount | | Termination
Date | | Payments
Made
by the
Fund‡ | | Payments
Received
by the
Fund‡ | | Upfront
Premiums
Paid/
(Received) | | Unrealized
Appreciation
(Depreciation) | |
Wells Fargo Bank, N.A. | | $ 5,000,000 | | 7/22/12 | | 4.500% | | 1-Month
LIBOR | | — | | $(313,510) | |
Wells Fargo Bank, N.A. | | 5,000,000 | | 11/25/14 | | 2.395% | | 1-Month
LIBOR | | — | | (155,364) | |
Wells Fargo Bank, N.A. | | 5,000,000 | | 12/5/15 | | 2.003% | | 1-Month
LIBOR | | — | | 8,183 | |
Wells Fargo Bank, N.A. | | 5,000,000 | | 11/25/16 | | 2.915% | | 1-Month
LIBOR | | — | | (150,396) | |
Wells Fargo Bank, N.A. | | 10,000,000 | | 12/5/17 | | 2.668% | | 1-Month
LIBOR | | — | | 8,263 | |
Total | | $30,000,000 | | | | | | | | — | | $(602,824) | |
‡ Percentage shown is an annual percentage rate.
4. Derivative instruments and hedging activities
Financial Accounting Standards Board Codification Topic 815 requires enhanced disclosure about an entity’s derivative and hedging activities.
Below is a table, grouped by derivative type that provides information about the fair value and the location of derivatives within the Statement of Assets and Liabilities at December 31, 2010.
ASSET DERIVATIVES1
| | Interest Rate
Contracts Risk | |
Swap contracts2 | | $16,446 | |
LIABILITY DERIVATIVES1
| | Interest Rate
Contracts Risk | |
Swap contracts2 | | $619,270 | |
1 | | Generally, the balance sheet location for asset derivatives is receivables/net unrealized appreciation (depreciation) and for liability derivatives is payables/net unrealized appreciation (depreciation). |
2 | | Values include premiums paid (received), if any, on swap contracts which are shown separately in the Statement of Assets and Liabilities. |
| | LMP Real Estate Income Fund Inc. 2010 Annual Report | | 23 |
The following tables provide information about the effect of derivatives and hedging activities on the Fund’s Statement of Operations for the year ended December 31, 2010. The first table provides additional detail about the amounts and sources of gains (losses) realized on derivatives during the period. The second table provides additional information about the change in unrealized appreciation (depreciation) resulting from the Fund’s derivatives and hedging activities during the period.
AMOUNT OF REALIZED GAIN (LOSS) ON DERIVATIVES RECOGNIZED
| | Interest Rate
Contracts Risk | |
Swap contracts | | $(641,954) | |
CHANGE IN UNREALIZED APPRECIATION (DEPRECIATION) ON DERIVATIVES RECOGNIZED
| | Interest Rate
Contracts Risk | |
Swap contracts | | $(314,182) | |
During the year ended December 31, 2010, the volume of derivative activity for the Fund was as follows:
| | Average
Notional Balance | |
Interest rate swaps | | $20,769,231 | |
The Fund’s contracts with derivative counterparties contain several credit related contingent features that if triggered would allow its derivatives counterparties to close out and demand payment or additional collateral to cover their exposure from the Fund. Credit related contingent features are established between the Fund and its derivatives counterparties to reduce the risk that the Fund will not fulfill its payment obligations to its counterparties. These triggering features include, but are not limited to, a percentage decrease in the Fund’s net assets and/or a percentage decrease in the Fund’s Net Asset Value or NAV. The contingent features are established within the Fund’s International Swap and Derivatives Association, Inc. master agreements which govern positions in swaps, over-the-counter options, and forward currency exchange contracts for each individual counterparty.
As of December 31, 2010, the total value of swap positions with credit related contingent features in a net liability position was $619,270. If a contingent feature would have been triggered as of December 31, 2010, the Fund would have been required to pay this amount in cash to its counterparties. The Fund posted collateral for its swap transactions in the amount of $983,345.
5. Line of credit
The Fund has a revolving credit agreement with a financial institution, which allows the Fund to borrow up to an aggregate amount of $75,000,000. The agreement has a six-month term but will renew everyday for a six-month
24 | | LMP Real Estate Income Fund Inc. 2010 Annual Report | | |
Notes to financial statements (cont’d)
term unless notice to the contrary is given to the Fund. The Fund currently pays a commitment fee at an annual rate of 0.50% on the unutilized portion of the loan. For the period January 1, 2010 through August 16, 2010, the Fund paid a commitment fee at an annual rate of 0.20% on the unutilized portion of the loan. For the period August 17, 2010 to December 15, 2010, the Fund paid a commitment fee at an annual rate of 0.15% on the unutilized portion of the loan. The interest on the loan is calculated at a variable rate based on the LIBOR plus any applicable margin. Interest expense related to the loan for the year ended December 31, 2010 was $590,147. For the year ended December 31, 2010, the Fund incurred a commitment fee in the amount of $64,975. For the year ended December 31, 2010, the Fund had an average daily loan balance outstanding of $38.7 million and the weighted ave rage interest rate was 1.53%. At December 31, 2010, the Fund had $45,000,000 of borrowings outstanding per this credit agreement.
6. Distributions subsequent to December 31, 2010
On November 15, 2010, the Board of Directors (the “Board”) of the Fund declared three distributions, each in the amount of $0.06 per share, payable on January 28, 2011, February 25, 2011 and March 25, 2011 to shareholders of record on January 21, 2011, February 18, 2011 and March 18, 2011, respectively.
On February 14, 2011, the Board declared three distributions, each in the amount of $0.06 per share, payable on April 29, 2011, May 27, 2011 and June 24, 2011 to shareholders of record on April 21, 2011, May 20, 2011 and June 17, 2011, respectively.
7. Income tax information and distributions to shareholders
The tax character of distributions paid during the fiscal years ended December 31, were as follows:
| | 2010 | | 2009 | |
Distributions Paid From: | | | | | |
Ordinary income | | $3,312,084 | | $ 5,005,137 | |
Tax return of capital | | 4,918,381 | | 5,686,906 | |
Total distributions paid | | $8,230,465 | | $10,692,043 | |
| | LMP Real Estate Income Fund Inc. 2010 Annual Report | | 25 |
As of December 31, 2010, the components of accumulated earnings on a tax basis were as follows:
Capital loss carryforward * | | $(33,990,089 | ) |
Other book/tax temporary differences(a) | | 632,905 | |
Unrealized appreciation (depreciation)(b) | | 24,800,542 | |
Total accumulated earnings (losses) — net | | $ (8,556,642 | ) |
* As of December 31, 2010, the Fund had the following net capital loss carryforwards remaining:
Year of Expiration | | Amount | |
12/31/2017 | | $(33,863,688 | ) |
12/31/2018 | | (126,401 | ) |
| | $(33,990,089 | ) |
These amounts will be available to offset future taxable capital gains. Under the recently enacted Regulated Investment Company Modernization Act of 2010, the Fund will be permitted to carry forward capital losses incurred in taxable years beginning after December 22, 2010 for an unlimited period. However, any losses incurred during those future years will be required to be utilized prior to the losses incurred in pre-enactment taxable years. As a result of this ordering rule, pre-enactment capital loss carryforwards may be more likely to expire unused. Additionally, post-enactment capital losses that are carried forward will retain their character as either short-term or long-term capital losses rather than being considered all short-term as under previous law.
(a) | | Other book/tax temporary differences are attributable primarily to book/tax differences in the treatment of distributions from real estate investment trusts and differences in the book/tax treatment of various items. |
(b) | | The difference between book-basis and tax-basis unrealized appreciation (depreciation) is attributable primarily to the tax deferral of losses on wash sales. |
8. Other tax information
On December 22, 2010, President Obama signed into law the Regulated Investment Company Modernization Act of 2010 (the “Act”). The Act updates certain tax rules applicable to regulated investment companies (“RICs”). The various provisions of the Act will generally be effective for RICs with taxable years beginning after December 22, 2010. Additional information regarding the impact of the Act on the Fund, if any, will be contained within the relevant sections of the notes to the financial statements for the fiscal year ending December 31, 2011.
26 | | LMP Real Estate Income Fund Inc. 2010 Annual Report | | |
Report of independent registered public accounting firm
The Board of Directors and Shareholders
LMP Real Estate Income Fund Inc.:
We have audited the accompanying statement of assets and liabilities of LMP Real Estate Income Fund Inc., including the schedule of investments, as of December 31, 2010, and the related statement of operations for the year then ended, the statements of changes in net assets for each of the years in the two-year period then ended, the statement of cash flows for the year then ended, and the financial highlights for each of the years in the five-year period then ended. These financial statements and financial highlights are the responsibility of the Fund’s management. Our responsibility is to express an opinion on these financial statements and financial highlights based on our audits.
We conducted our audits in accordance with the standards of the Public Company Accounting Oversight Board (United States). Those standards require that we plan and perform the audit to obtain reasonable assurance about whether the financial statements and financial highlights are free of material misstatement. An audit includes examining, on a test basis, evidence supporting the amounts and disclosures in the financial statements. Our procedures included confirmation of securities owned as of December 31, 2010, by correspondence with the custodian and brokers or by other appropriate auditing procedures. An audit also includes assessing the accounting principles used and significant estimates made by management, as well as evaluating the overall financial statement presentation. We believe that our audits provide a reasonable basis for our opinion.
In our opinion, the financial statements and financial highlights referred to above present fairly, in all material respects, the financial position of LMP Real Estate Income Fund Inc. as of December 31, 2010, the results of its operations for the year then ended, the changes in its net assets for each of the years in the two-year period then ended, its cash flows for the year then ended, and the financial highlights for each of the years in the five-year period then ended, in conformity with U.S. generally accepted accounting principles.

New York, New York
February 18, 2011
| | LMP Real Estate Income Fund Inc. | | 27 |
Board approval of management and subadvisory agreements (unaudited)
Background
The Investment Company Act of 1940, as amended (the “1940 Act”) requires that the Board of Directors (the “Board”) of LMP Real Estate Income Fund Inc. (the “Fund”), including a majority of its members that are not considered to be “interested persons” under the 1940 Act (the “Independent Directors”) voting separately, approve on an annual basis the continuation of the investment management contract (the “Management Agreement”) with the Fund’s manager, Legg Mason Partners Fund Advisor, LLC (the “Manager”), and the sub-advisory agreement (the “Sub-Advisory Agreement”) between the Manager and AEW Capital Management, L.P. (the “Sub-Adviser”). At a meeting (the “Contract Renewal Meeting”) held in-person on November 10 and 11, 2010, the Board, including the Independent Directors, considered and approved conti nuation of each of the Management Agreement and Sub-Advisory Agreement for an additional one-year term. To assist in its consideration of the renewals of the Management Agreement and the Sub-Advisory Agreement, the Board received and considered a variety of information (together with the information provided at the Contract Renewal Meeting, the “Contract Renewal Information”) about the Manager and the Sub-Adviser, as well as the management and sub-advisory arrangements for the Fund and the other closed-end funds in the same complex under the Board’s supervision (collectively, the “Legg Mason Closed-end Funds”), certain portions of which are discussed below. A presentation made by the Manager to the Board at the Contract Renewal Meeting in connection with its evaluations of the Management Agreement and the Sub-Advisory Agreement encompassed the Fund and other Legg Mason Closed-end Funds. The Sub-Adviser also made a presentation to the Board at the Contract Renewal Meeting regarding it s sub-advisory services to the Fund. In addition to the Contract Renewal Information, the Board received performance and other information throughout the year related to the respective services rendered by the Manager and the Sub-Adviser to the Fund. The Board’s evaluation took into account the information received throughout the year and also reflected the knowledge and familiarity gained as members of the Board of the Fund and the other Legg Mason Closed-end Funds with respect to the services provided to the Fund by the Manager.
The Manager provides the Fund with investment advisory and administrative services pursuant to the Management Agreement and the Sub-Adviser provides the Fund with certain investment sub-advisory services pursuant to the Sub-Advisory Agreement. The discussion below covers the advisory and administrative functions being rendered by the Manager, each such function being encompassed by the Management Agreement, and the investment sub-advisory functions being rendered by the Sub-Adviser.
28 | | LMP Real Estate Income Fund Inc. | | |
Board approval of management and subadvisory agreements (unaudited) (cont’d)
Board approval of management agreement and sub-advisory agreement
In its deliberations regarding renewal of the Management Agreement and the Sub-Advisory Agreement, the Board, including the Independent Directors, considered the factors below.
Nature, extent and quality of the services under the management agreement and sub-advisory agreement
The Board received and considered Contract Renewal Information regarding the nature, extent and quality of services provided to the Fund by the Manager and the Sub-Adviser under the Management Agreement and the Sub-Advisory Agreement, respectively, during the past year. The Board also reviewed Contract Renewal Information regarding the Fund’s compliance policies and procedures established pursuant to the 1940 Act.
The Board reviewed the qualifications, backgrounds and responsibilities of the Fund’s senior personnel and the portfolio management team primarily responsible for the day-to-day portfolio management of the Fund. The Board also considered, based on its knowledge of the Manager and its affiliates, the Contract Renewal Information and the Board’s discussions with the Manager at the Contract Renewal Meeting, the financial resources available to the corporate parent of the Manager, Legg Mason, Inc. (“Legg Mason”), to support its activities in respect of the Fund and the other Legg Mason Closed-end Funds.
The Board considered the responsibilities of the Manager and the Sub-Adviser under the Management Agreement and the Sub-Advisory Agreement, respectively, including the Manager’s coordination and oversight of services provided to the Fund by the Sub-Adviser and others. The Management Agreement permits the Manager to delegate certain of its responsibilities, including its advisory duties thereunder, provided that the Manager, in each case, will supervise the activities of the delegee. Pursuant to this provision of the Management Agreement, the Manager does not provide day-to-day portfolio management services to the Fund. Rather, portfolio management services for the Fund are provided by the Sub-Adviser pursuant to the Sub-Advisory Agreement.
In reaching its determinations regarding continuation of the Management Agreement and Sub-Advisory Agreement, the Board took into account that Fund shareholders, in pursuing their investment goals and objectives, likely purchased their shares based upon the reputation and the investment style, philosophy and strategy of the Manager, as well as the resources available to the Manager.
The Board concluded that, overall, the nature, extent and quality of the investment advisory and other services provided to the Fund under the
| | LMP Real Estate Income Fund Inc. | | 29 |
Management Agreement and the Sub-Advisory Agreement have been satisfactory under the circumstances.
Fund performance
The Board received and considered performance information and analyses (the “Lipper Performance Information”) for the Fund, as well as for a group of funds (the “Performance Universe”) selected by Lipper, Inc. (“Lipper”), an independent provider of investment company data. The Board was provided with a description of the methodology Lipper used to determine the similarity of the Fund with the funds included in the Performance Universe. The Performance Universe consisted of the Fund and all leveraged real estate closed-end funds, as classified by Lipper, regardless of asset size. The Performance Universe consisted of nine funds, including the Fund, for the 1- and 3-year periods ended June 30, 2010 and of eight funds, including the Fund, for the 5-year period ended June 30, 2010. The Board noted that it had received and discussed with the Manager and Sub-Adviser inform ation throughout the year at periodic intervals comparing the Fund’s performance against its benchmark(s) and its peer funds as selected by Lipper.
The Lipper Performance Information comparing the Fund’s performance to that of the Performance Universe based on net asset value per share showed, among other things, that the Fund’s performance for the 1-year period ended June 30, 2010 was ranked fifth among the funds in the Performance Universe for that period but that its performance for each of the 3- and 5- year periods ended June 30, 2010 was ranked third among the funds in the Performance Universe for that period. The Fund’s performance was at or better than the Performance Universe median for each period. The Board considered the volatile market conditions during 2008 and the Fund’s performance in relation to its benchmark(s) and in absolute terms.
Based on its review, which included consideration of all of the factors noted above, the Board concluded that the Fund’s performance supported a continuation of the Management Agreement and the Sub-Advisory Agreement for an additional one-year period.
Management fees and expense ratios
The Board reviewed and considered the management fee (the “Management Fee”) payable by the Fund to the Manager under the Management Agreement and the sub-advisory fee (the “Sub-Advisory Fee”) payable to the Sub-Adviser under the Sub-Advisory Agreement in light of the nature, extent and quality of the management, sub-advisory and other services provided by the Manager and the Sub-Adviser. The Board noted that the Sub-Advisory Fee is paid by the Manager, not the Fund, and, accordingly, that the retention of the Sub-Adviser does not increase the fees or expenses otherwise incurred by the Fund’s shareholders.
30 | | LMP Real Estate Income Fund Inc. | | |
Board approval of management and subadvisory agreements (unaudited) (cont’d)
Additionally, the Board received and considered information and analyses prepared by Lipper (the “Lipper Expense Information”) comparing the Management Fee and the Fund’s overall expenses with those of funds in an expense group (the “Expense Group”) selected and provided by Lipper. The comparison was based upon the constituent funds’ latest fiscal years. The Expense Group consisted of the Fund and five other leveraged real estate closed-end funds, as classified by Lipper, with average net assets ranging from the Fund’s $75.9 million to $626.8 million.
The Lipper Expense Information comparing the Management Fee as well as the Fund’s actual total expenses to the Fund’s Expense Group showed, among other things, that the Fund’s contractual Management Fee was ranked fourth among the funds in the Expense Group and was worse than the Expense Group median. The Fund’s actual Management Fee (i.e., giving effect to any voluntary fee waivers implemented by the Manager with respect to the Fund and by the managers of the other Expense Group funds) whether compared on the basis of common share assets only or on the basis of common share and leveraged assets was ranked fifth among the Expense Group funds and was worse than the Expense Group median. The Fund’s actual total expenses were ranked fourth among the funds in the Expense Group, whether compared on the basis of common share assets or on the basis of both common share and leveraged assets, an d were worse than the Expense Group median. The Manager noted that the small number of funds in the Expense Group and the Fund’s small size in relation to the other Expense Group funds made meaningful comparisons difficult.
At the Contract Renewal Meeting, the Board considered and approved a request (the “Cost Allocation Request”) from the Manager to allocate to the Fund certain fund accounting and financial reporting costs, previously paid by the Manager on a voluntary basis, in line with industry practice and the terms of the Management Agreement. In doing so, the Board reviewed supporting information and analyses provided by the Manager, including information and analyses as to the impact of the Cost Allocation Request on Fund expenses.
The Board also reviewed Contract Renewal Information regarding fees charged by the Manager to other U.S. clients investing primarily in an asset class similar to that of the Fund, including, where applicable, separate accounts. The Board was advised that the fees paid by such other clients generally are lower, and may be significantly lower, than the Management Fee. The Contract Renewal Information discussed the significant differences in scope of services provided to the Fund and to these other clients, noting that the Fund is provided with administrative services, office facilities, Fund officers (including the Fund’s chief executive, chief financial and chief compliance officers), and that the Manager coordinates and oversees the provision of services to the Fund by other fund service providers. The Contract
| | LMP Real Estate Income Fund Inc. | | 31 |
Renewal Information included an analysis of complex-wide management fees provided by the Manager. At the Contract Renewal Meeting, the Board noted that the Contract Renewal Information included information regarding management fees paid by open-end mutual funds in the same complex (the “Legg Mason Open-end Funds”) and that such information indicated that the management fees paid by the Legg Mason Closed-end Funds generally were higher than those paid by the Legg Mason Open-end Funds. The Manager, in response, discussed differences between the services provided to the Fund and the other Legg Mason Closed-end Funds and services provided to the Legg Mason Open-end Funds. The Board considered the fee comparisons in light of the different services provided in managing these other types of clients and funds.
Taking all of the above into consideration, the Board determined that the Management Fee and the Sub-Advisory Fee were reasonable in light of the nature, extent and overall quality of the investment advisory and other services provided to the Fund under the Management Agreement and the Sub-Advisory Agreement.
Manager profitability
The Board, as part of the Contract Renewal Information, received an analysis of the profitability to the Manager and its affiliates in providing services to the Fund for the Manager’s fiscal years ended March 31, 2010 and March 31, 2009. The Board also received profitability information with respect to the Legg Mason fund complex as a whole. In addition, the Board received Contract Renewal Information with respect to the Manager’s revenue and cost allocation methodologies used in preparing such profitability data. In 2007, the Board received a report from an outside consultant that had reviewed the Manager’s methodologies and the Board was assured by the Manager at the Contract Renewal Meeting that there had been no significant changes in those methodologies since the report was rendered. The profitability to the Sub-Adviser was not considered to be a material factor in the Board’s considerations since the Sub-Advisory Fee is paid by the Manager. The profitability analysis presented to the Board as part of the Contract Renewal Information indicated that profitability to the Manager in providing services to the Fund had decreased by 6 percent over the period covered by the analysis. The Manager presented information to the Board showing that the Cost Allocation Request would increase profitability slightly. The Board concluded that profitability remained at a level which was not excessive in light of the nature, extent and overall quality of the services provided to the Fund.
Economies of scale
The Board received and discussed Contract Renewal Information concerning whether the Manager realizes economies of scale if the Fund’s assets grow. The Board noted that because the Fund is a closed-end fund with no current
32 | | LMP Real Estate Income Fund Inc. | | |
Board approval of management and subadvisory agreements (unaudited) (cont’d)
plans to seek additional assets beyond maintaining its dividend reinvestment plan, any significant growth in its assets generally will occur through appreciation in the value of the Fund’s investment portfolio, rather than sales of additional shares in the Fund. The Board determined that the Management Fee structure was appropriate under present circumstances.
Other benefits to the manager and the sub-adviser
The Board considered other benefits received by the Manager, the Sub-Adviser and their affiliates as a result of their relationship with the Fund and did not regard such benefits as excessive.
* * *
In light of all of the foregoing and other relevant factors, the Board determined that, under the circumstances, continuation of the Management and the Sub-Advisory Agreements would be in the interests of the Fund and its shareholders and unanimously voted to continue each Agreement for a period of one additional year.
No single factor reviewed by the Board was identified by the Board as the principal factor in determining whether to approve continuation of the Management Agreement and the Sub-Advisory Agreement, and each Board member attributed different weights to the various factors. The Independent Directors were advised by separate independent legal counsel throughout the process. Prior to the Contract Renewal Meeting, the Board received a memorandum prepared by the Manager discussing its responsibilities in connection with the proposed continuation of the Management Agreement and the Sub-Advisory Agreement as part of the Contract Renewal Information and the Independent Directors separately received a memorandum discussing such responsibilities from their independent counsel. Prior to voting, the Independent Directors also discussed the proposed continuation of the Management Agreement and the Sub-Advisory Agreement in p rivate sessions with their independent legal counsel at which no representatives of the Manager were present.
| | LMP Real Estate Income Fund Inc. | | 33 |
Additional information (unaudited)
Information about Directors and Officers
The business and affairs of LMP Real Estate Income Fund Inc. (the “Fund”) are conducted by management under the supervision and subject to the direction of its Board of Directors. The business address of each Director is c/o R. Jay Gerken, 620 Eighth Avenue, New York, New York 10018. Information pertaining to the Directors and officers of the Fund is set forth below.
Independent Directors†:
Carol L. Colman | | |
| | |
Year of birth | | 1946 |
| | |
Position(s) held with Fund1 | | Director and Member of the Nominating and Audit Committees, Class I |
| | |
Term of office1 and length of time served | | Since 2007 |
| | |
Principal occupation(s) during past five years | | President, Colman Consulting Company (consulting) |
| | |
Number of portfolios in fund complex overseen by Director (including the Fund) | | 24 |
| | |
Other board memberships held by Director | | None |
| | |
Daniel P. Cronin | | |
| | |
Year of birth | | 1946 |
| | |
Position(s) held with Fund1 | | Director and Member of the Nominating and Audit Committees, Class II |
| | |
Term of office1 and length of time served | | Since 2007 |
| | |
Principal occupation(s) during past five years | | Retired; formerly, Associate General Counsel, Pfizer Inc. (prior to and including 2004) |
| | |
Number of portfolios in fund complex overseen by Director (including the Fund) | | 24 |
| | |
Other board memberships held by Director | | None |
| | |
Paolo M. Cucchi | | |
| | |
Year of birth | | 1941 |
| | |
Position(s) held with Fund1 | | Director and Member of the Nominating and Audit Committees, Class II |
| | |
Term of office1 and length of time served | | Since 2002 |
| | |
Principal occupation(s) during past five years | | Professor of French and Italian at Drew University; formerly, Vice President and Dean of College of Liberal Arts at Drew University (1984 to 2009) |
| | |
Number of portfolios in fund complex overseen by Director (including the Fund) | | 24 |
| | |
Other board memberships held by Director | | None |
34 | | LMP Real Estate Income Fund Inc. | | |
Additional information (unaudited) (cont’d)
Information about Directors and Officers
Independent Directors cont’d
Leslie H. Gelb | | |
| | |
Year of birth | | 1937 |
| | |
Position(s) held with Fund1 | | Director and Member of the Nominating and Audit Committees, Class I |
| | |
Term of office1 and length of time served | | Since 2007 |
| | |
Principal occupation(s) during past five years | | President Emeritus and Senior Board Fellow (since 2003), The Council on Foreign Relations; formerly, President, (prior to 2003), the Council on Foreign Relations; formerly, Columnist, Deputy Editorial Page Editor and Editor, Op-Ed Page, The New York Times |
| | |
Number of portfolios in fund complex overseen by Director (including the Fund) | | 24 |
| | |
Other board memberships held by Director | | Director of two registered investment companies advised by Blackstone Asia Advisors LLC: India Fund, Inc. and Asia Tigers Fund, Inc. (since 1994) |
| | |
William R. Hutchinson | | |
| | |
Year of birth | | 1942 |
| | |
Position(s) held with Fund1 | | Director and Member of the Nominating and Audit Committees, Class III |
| | |
Term of office1 and length of time served | | Since 2002 |
| | |
Principal occupation(s) during past five years | | President, W.R. Hutchinson & Associates Inc. (Consulting) (since 2001) |
| | |
Number of portfolios in fund complex overseen by Director (including the Fund) | | 24 |
| | |
Other board memberships held by Director | | Director (Non-Executive Chairman of the Board (since December 1, 2009)), Associated Banc Corp. (banking) (since 1994) |
| | |
Riordan Roett | | |
| | |
Year of birth | | 1938 |
| | |
Position(s) held with Fund1 | | Director and Member of the Nominating and Audit Committees, Class II |
| | |
Term of office1 and length of time served | | Since 2007 |
| | |
Principal occupation(s) during past five years | | The Sarita and Don Johnston Professor of Political Science and Director of Western Hemisphere Studies, Paul H. Nitze School of Advanced International Studies, The John Hopkins University (since 1973) |
| | |
Number of portfolios in fund complex overseen by Director (including the Fund) | | 24 |
| | |
Other board memberships held by Director | | None |
| | LMP Real Estate Income Fund Inc. | | 35 |
Independent Directors cont’d
Jeswald W. Salacuse | | |
| | |
Year of birth | | 1938 |
| | |
Position(s) held with Fund1 | | Director and Member of the Nominating and Audit Committees, Class III |
| | |
Term of office1 and length of time served | | Since 2007 |
| | |
Principal occupation(s) during past five years | | Henry J. Braker Professor of Commercial Law, The Fletcher School of Law and Diplomacy, Tufts University (since 1986); President and Member, Arbitration Tribunal, World Bank/ICSID (since 2004) |
| | |
Number of portfolios in fund complex overseen by Director (including the Fund) | | 24 |
| | |
Other board memberships held by Director | | Director of two registered investment companies advised by Blackstone Asia Advisors LLC; India Fund, Inc. and Asia Tigers Fund, Inc. (since 1993) |
Interested Director and Officer:
R. Jay Gerken, CFA2 | | |
| | |
Year of birth | | 1951 |
| | |
Position(s) held with Fund1 | | Director, Chairman, President and Chief Executive Officer, Class II |
| | |
Term of office1 and length of time served | | Since 2002 |
| | |
Principal occupation(s) during past five years | | Managing Director of Legg Mason & Co., LLC (“Legg Mason & Co.”) (since 2005); Officer and Trustee/Director of 149 funds associated with Legg Mason Partners Fund Advisor, LLC (“LMPFA”) or its affiliates (since 2006) and Legg Mason & Co. predecessors (prior to 2006); President and Chief Executive Officer (“CEO”) of LMPFA (since 2006); President and CEO of Smith Barney Fund Management LLC (“SBFM”) and Citi Fund Management Inc. (“CFM”) (formerly registered investment advisers) (since 2002); formerly, Chairman, President and CEO, Travelers Investment Adviser Inc. (prior to 2005) |
| | |
Number of portfolios in fund complex overseen by Director (including the Fund) | | 136 |
| | |
Other board memberships held by Director | | Former Trustee, Consulting Group Capital Markets Funds (11 funds) (prior to 2006) |
36 | | LMP Real Estate Income Fund Inc. | | |
Additional information (unaudited) (cont’d)
Information about Directors and Officers
Additional Officers:
Ted P. Becker | | |
| | |
Legg Mason | | |
| | |
620 Eighth Avenue, New York, NY 10018 | | |
| | |
Year of birth | | 1951 |
| | |
Position(s) held with Fund1 | | Chief Compliance Officer |
| | |
Term of office1 and length of time served | | Since 2006 |
| | |
Principal occupation(s) during past five years | | Director of Global Compliance at Legg Mason (since 2006); Chief Compliance Officer of LMPFA (since 2006); Managing Director of Compliance of Legg Mason & Co. (since 2005); Chief Compliance Officer of certain mutual funds associated with Legg Mason & Co. or its affiliates (since 2006) and Legg Mason & Co. predecessors (prior to 2006) |
| | |
John Chiota | | |
| | |
Legg Mason | | |
| | |
100 First Stamford Place, Stamford, CT 06902 | | |
| | |
Year of birth | | 1968 |
| | |
Position(s) with Fund1 | | Identity Theft Prevention Officer |
| | |
Term of office1 and length of time served | | Since 2008 |
| | |
Principal occupation(s) during past five years | | Identity Theft Prevention Officer of certain mutual funds associated with Legg Mason & Co. or its affiliates (since 2008); Chief Anti-Money Laundering Compliance Officer of certain mutual funds associated with Legg Mason & Co. or its affiliates (since 2006); Vice President of Legg Mason & Co. (since 2006) and Legg Mason & Co. predecessors (prior to 2006); formerly, Chief Anti-Money Laundering Compliance Officer of TD Waterhouse (prior to 2004) |
| | |
Robert I. Frenkel | | |
| | |
Legg Mason | | |
| | |
100 First Stamford Place, Stamford, CT 06902 | | |
| | |
Year of birth | | 1954 |
| | |
Position(s) held with Fund1 | | Secretary and Chief Legal Officer |
| | |
Term of office1 and length of time served | | Since 2003 |
| | |
Principal occupation(s) during past five years | | Vice President and Deputy General Counsel of Legg Mason (since 2006); Managing Director and General Counsel of Global Mutual Funds for Legg Mason & Co. (since 2006) and Legg Mason & Co. predecessors (since 1994); Secretary and Chief Legal Officer of certain mutual funds associated with Legg Mason & Co. or its affiliates (since 2006) and Legg Mason & Co. predecessors (prior to 2006) |
| | LMP Real Estate Income Fund Inc. | | 37 |
Additional Officers cont’d
Thomas C. Mandia | | |
| | |
Legg Mason | | |
| | |
100 First Stamford Place, Stamford, CT 06902 | | |
| | |
Year of birth | | 1962 |
| | |
Position(s) held with Fund1 | | Assistant Secretary |
| | |
Term of office1 and length of time served | | Since 2006 |
| | |
Principal occupation(s) during past five years | | Managing Director and Deputy General Counsel of Legg Mason & Co. (since 2005) and Legg Mason & Co. predecessors (prior to 2005); Secretary of LMPFA (since 2006); Assistant Secretary of certain mutual funds associated with Legg Mason & Co. or its affiliates (since 2006) and Legg Mason & Co. predecessors (prior to 2006); Secretary of SBFM and CFM (since 2002) |
| | |
Kaprel Ozsolak | | |
| | |
Legg Mason | | |
| | |
55 Water Street, New York, NY 10041 | | |
| | |
Year of birth | | 1965 |
| | |
Position(s) held with Fund1 | | Chief Financial Officer |
| | |
Term of office1 and length of time served | | Since 2007 |
| | |
Principal occupation(s) during past five years | | Director of Legg Mason & Co. (since 2005); Chief Financial Officer of certain mutual funds associated with Legg Mason & Co. or its affiliates (since 2007) and Legg Mason & Co. predecessors (prior to 2007); formerly, Treasurer of certain mutual funds associated with Legg Mason & Co. or its affiliates (prior to 2010) and Legg Mason & Co. predecessors (prior to 2005); formerly, Controller of certain mutual funds associated with Legg Mason & Co. predecessors (prior to 2004) |
| | |
Steven Frank | | |
| | |
Legg Mason | | |
| | |
55 Water Street, New York, NY 10041 | | |
| | |
Year of birth | | 1967 |
| | |
Position(s) held with Fund1 | | Treasurer |
| | |
Term of office1 and length of time served | | Since 2010 |
| | |
Principal occupation(s) during past five years | | Vice President of Legg Mason & Co. and Legg Mason & Co. predecessors (since 2002); Treasurer of certain mutual funds associated with Legg Mason & Co. or its affiliates (since 2010); formerly, Controller of certain mutual funds associated with Legg Mason & Co. or its affiliates (prior to 2010); formerly, Assistant Controller of certain mutual funds associated with Legg Mason & Co. predecessors (prior to 2005) |
38 | | LMP Real Estate Income Fund Inc. | | |
Additional information (unaudited) (cont’d)
Information about Directors and Officers
Additional Officers cont’d
Jeanne M. Kelly | | |
| | |
Legg Mason | | |
| | |
620 Eighth Avenue, New York, NY 10018 | | |
| | |
Year of birth | | 1951 |
| | |
Position(s) with Fund1 | | Senior Vice President |
| | |
Term of office1 and length of time served | | Since 2007 |
| | |
Principal occupation(s) during past five years | | Senior Vice President of certain mutual funds associated with Legg Mason & Co. or its affiliates (since 2007); Senior Vice President of LMPFA (since 2006); Managing Director of Legg Mason & Co. (since 2005) and Legg Mason & Co. predecessors (prior to 2005) |
† | | Directors who are not “interested persons” of the Fund within the meaning of Section 2(a)(19) of the 1940 Act. |
1 | | The Fund’s Board of Directors is divided into three classes: Class I, Class II and Class III. The terms of office of the Class I, II and III Directors expire at the Annual Meetings of Stockholders in the year 2013, year 2011 and year 2012, respectively, or thereafter in each case when their respective successors are duly elected and qualified. The Fund’s executive officers are chosen each year at the first meeting of the Fund’s Board of Directors following the Annual Meeting of Stockholders, to hold office until the meeting of the Board following the next Annual Meeting of Stockholders and until their successors are duly elected and qualified. |
2 | | Mr. Gerken is an “interested person” of the Fund as defined in the 1940 Act because Mr. Gerken is an officer of LMPFA and certain of its affiliates. |
| | |
| | LMP Real Estate Income Fund Inc. | | 39 |
Annual chief executive officer and chief financial officer certifications (unaudited)
The Fund’s Chief Executive Officer (“CEO”) has submitted to the NYSE the required annual certification and the Fund also has included the Certifications of the Fund’s CEO and Chief Financial Officer required by Section 302 of the Sarbanes-Oxley Act in the Fund’s Form N-CSR filed with the SEC for the period of this report.
40 | | LMP Real Estate Income Fund Inc. | | |
Dividend reinvestment plan (unaudited)
Under the Fund’s Dividend Reinvestment Plan (“Plan”), a shareholder whose shares of Common Stock are registered in his own name will have all distributions from the Fund reinvested automatically by American Stock Transfer & Trust Company (“AST”), as agent under the Plan, unless the shareholder elects to receive cash. Distributions with respect to shares registered in the name of a broker-dealer or other nominee (that is, in “street name”) will be reinvested by the broker or nominee in additional shares under the Plan, unless the service is not provided by the broker or nominee or the shareholder elects to receive distributions in cash. Investors who own Common Stock registered in street name should consult their broker-dealers for details regarding reinvestment. All distributions to Fund shareholders who do not participate in the Plan will be paid by check mailed dire ctly to the record holder by or under the direction of AST as dividend-paying agent.
If the Fund declares a dividend or capital gains distribution payable either in Common Shares or in cash, shareholders who are not Plan participants will receive cash, and Plan participants will receive the equivalent amount in Common Shares. When the market price of the Common Shares is equal to or exceeds 98% of the net asset value per share of the Common Shares on the Determination Date (as defined below), Plan participants will be issued Common Shares valued at a price equal to the greater of (a) 98% of the net asset value per share at the close of trading on the Determination Date or (b) 95% of the market price per share of the common stock on the Determination Date. The Determination Date is the dividend or capital gains distribution record date or, if that date is not a New York Stock Exchange (“NYSE”) trading day, the immediately preceding trading day.
If 98% of the net asset value per share of the Common Shares exceeds the market price of the Common Shares on the Determination Date, the Plan Agent will receive the dividend or distribution in cash and will buy Common Shares in the open market, on the Exchange or elsewhere, for your account as soon as practicable commencing on the trading day following the Determination Date and terminating no later than the earlier of (a) 30 days after the dividend or distribution payment date, or (b) the record date for the next succeeding dividend or distribution to be made to the Common Shareholders, except when necessary to comply with applicable provisions of the federal securities laws. If during this period: (i) the market price rises so that it equals or exceeds 98% of the net asset value per share of the Common Shares at the close of trading on the Exchange on the Determination date before the Plan Age nt has completed the open market purchases or (ii) if the Plan Agent is unable to invest the full amount eligible to be reinvested in open market purchases, the Plan agent will cease purchasing Common Shares in the open market and the Fund shall issue the remaining Common Shares at a price per share equal to the greater of (a) 98% of the net asset value per share at the close of trading on the Exchange on the Determination date or (b) 95% of the then current market price per share. You may withdraw
| | LMP Real Estate Income Fund Inc. | | 41 |
from the Plan by notifying the Plan Agent in writing at 59 Maiden Lane, New York, New York 10038, by logging onto your account and following the directions at www.Investpower.com or by calling the Plan Agent at 1-877-366-6441. Such withdrawal will be effective immediately if notice is received by the Plan Agent not less than ten business days prior to any dividend or distribution record date; otherwise such withdrawal will be effective as soon as practicable after the Plan Agent’s investment of the most recently declared dividend or distribution on the Common Shares.
AST will maintain all shareholder accounts in the Plan and will furnish written confirmations of all transactions in each account, including information needed by a shareholder for personal and tax records. The automatic reinvestment of dividends and capital gains distributions will not relieve Plan participants of any income tax that may be payable on the dividends or capital gains distributions. Common Shares in the account of each Plan participant will be held by AST on behalf of the Plan participant, and each shareholder’s proxy will include those shares purchased pursuant to the Plan.
Plan participants are subject to no charge for reinvesting dividends and capital gains distributions. AST’s fees for handling the reinvestment of dividends and capital gains distributions will be paid by the Fund. No brokerage charges apply with respect to Common Shares issued directly by the Fund as a result of dividends or capital gains distributions payable either in Common Shares or in cash. Each Plan participant will, however, bear a proportionate share of brokerage commissions incurred with respect to open market purchases made in connection with the reinvestment of dividends or capital gains distributions.
Experience under the Plan may indicate that changes to it are desirable. The Fund reserves the right to amend or terminate the Plan as applied to any dividend or capital gains distribution paid subsequent to written notice of the change sent to participants at least 30 days before the record date for the dividend or capital gains distribution. The Plan also may be amended or terminated by AST, with the Fund’s prior written consent, on at least 30 days’ written notice to Plan participants. Upon any termination, you will be sent a certificate or certificates for the full Common Shares held for you under the Plan and cash for any fractional Common Shares. You may elect to notify the Plan Agent in advance of such termination to have the Plan Agent sell part or all of your shares on your behalf. The Plan Agent is authorized to deduct brokerage commissions actually incurred for this transaction from the pro ceeds. All correspondence concerning the Plan should be directed by mail to American Stock Transfer & Trust Company, 59 Maiden Lane, New York, New York 10038, by logging onto your account and following the directions at www.Investpower.com or by telephone at 1-888-888-0151.
42 | | LMP Real Estate Income Fund Inc. | | |
Important tax information (unaudited)
The following information is provided with respect to the distributions paid monthly by the Fund to common shareholders during the taxable year ended December 31, 2010:
Paid | | Ordinary
Income | | Tax Return
of Capital | | Qualified Dividend
Income for Individuals
Expressed as a % of
Ordinary Income
(Maximum 15% Rate) | |
January 2010-December 2010 | | 40.24% | | 59.76% | | 1.42% | |
You should consult with your tax adviser regarding the appropriate tax treatment of distributions paid.
Please retain this information for your records.
LMP Real Estate Income Fund Inc.
Directors | | LMP Real Estate Income Fund Inc. | | Independent registered public accounting firm |
Carol L. Colman | | 55 Water Street | | KPMG LLP |
Daniel P. Cronin | | New York, NY 10041 | | 345 Park Avenue |
Paolo M. Cucchi | | | | New York, NY 10154 |
Leslie H. Gelb | | Investment manager | | |
R. Jay Gerken, CFA | | Legg Mason Partners Fund | | Legal counsel |
Chairman | | Advisor, LLC | | Simpson Thacher & Bartlett LLP |
William R. Hutchinson | | | | 425 Lexington Avenue |
Riordan Roett | | Subadviser | | New York, NY 10017 |
Jeswald W. Salacuse | | AEW Capital Management, L.P. | | |
| | | | New York Stock Exchange Symbol |
Officers | | Custodian | | RIT |
R. Jay Gerken, CFA | | State Street Bank and | | |
President and Chief Executive Officer | | Trust Company | | |
| | 1 Lincoln Street | | |
Kaprel Ozsolak | | Boston, MA 02111 | | |
Chief Financial Officer | | | | |
| | Transfer agent | | |
Ted P. Becker | | American Stock Transfer & Trust | | |
Chief Compliance Officer | | Company | | |
| | 59 Maiden Lane | | |
John Chiota | | New York, NY 10038 | | |
Identity Theft Protection Officer | | | | |
| | | | |
Robert I. Frenkel | | | | |
Secretary and Chief Legal Officer | | | | |
| | | | |
Thomas C. Mandia | | | | |
Assistant Secretary | | | | |
| | | | |
Steven Frank | | | | |
Treasurer | | | | |
| | | | |
Jeann M. Kelly | | | | |
Senior Vice President | | | | |
Privacy policy
We are committed to keeping nonpublic personal information about you secure and confidential. This notice is intended to help you understand how we fulfill this commitment. From time to time, we may collect a variety of personal information about you, including:
· | | Information we receive from you on applications and forms, via the telephone, and through our websites; |
| | |
· | | Information about your transactions with us, our affiliates, or others (such as your purchases, sales, or account balances); and |
| | |
· | | Information we receive from consumer reporting agencies. |
We do not disclose nonpublic personal information about our customers or former customers, except to our affiliates (such as broker-dealers or investment advisers with the Legg Mason family of companies) or as is otherwise permitted by applicable law or regulation. For example, we may share this information with others in order to process your transactions or service an account. We may also provide this information to companies that perform marketing services on our behalf, such as printing and mailing, or to other financial institutions with whom we have joint marketing agreements. When we enter into such agreements, we will require these companies to protect the confidentiality of this information and to use it only to perform the services for which we hired them.
With respect to our internal security procedures, we maintain physical, electronic, and procedural safeguards to protect your nonpublic personal information, and we restrict access to this information.
If you decide at some point either to close your account(s) or become an inactive customer, we will continue to adhere to our privacy policies and practices with respect to your nonpublic personal information.
| NOT PART OF THE ANNUAL REPORT | |
LMP Real Estate Income Fund Inc.
LMP Real Estate Income Fund Inc.
55 Water Street
New York, NY 10041
Notice is hereby given in accordance with Section 23(c) of the Investment Company Act of 1940, as amended, that from time to time the Fund may purchase at market prices, shares of its common stock in the open market.
The Fund files its complete schedule of portfolio holdings with the Securities and Exchange Commission (“SEC”) for the first and third quarters of each fiscal year on Form N-Q. The Fund’s Forms N-Q are available on the SEC’s website at www.sec.gov. The Fund’s Forms N-Q may be reviewed and copied at the SEC’s Public Reference Room in Washington, D.C., and information on the operation of the Public Reference Room may be obtained by calling 1-800-SEC-0330. To obtain information on Form N-Q from the Fund, shareholders can call 1-888-777-0102.
Information on how the Fund voted proxies relating to portfolio securities during the prior 12-month period ended June 30th of each year and a description of the policies and procedures that the Fund uses to determine how to vote proxies relating to portfolio transactions are available (1) without charge, upon request, by calling 1-888-777-0102, (2) on the Fund’s website at www.leggmason.com/cef and (3) on the SEC’s website at www.sec.gov.
This report is transmitted to the shareholders of LMP Real Estate Income Fund Inc. for their information. This is not a prospectus, circular or representation intended for use in the purchase of shares of the Fund or any securities mentioned in this report.
American Stock
Transfer & Trust Company
59 Maiden Lane
New York, NY 10038
FD02709 2/11 SR11-1291
ITEM 2. CODE OF ETHICS.
The registrant has adopted a code of ethics that applies to the registrant’s principal executive officer, principal financial officer, principal accounting officer or controller.
ITEM 3. AUDIT COMMITTEE FINANCIAL EXPERT.
The Board of Directors of the registrant has determined that William R. Hutchinson possesses the technical attributes identified in Instruction 2(b) of Item 3 to Form N-CSR to qualify as an “audit committee financial expert,” and has designated Mr. Hutchinson as the Audit Committee’s financial expert. Mr. Hutchinson is an “independent” Director pursuant to paragraph (a)(2) of Item 3 to Form N-CSR.
ITEM 4. PRINCIPAL ACCOUNTANT FEES AND SERVICES.
a) Audit Fees. The aggregate fees billed in the last two fiscal years ending December 31, 2009 and December 31, 2010 (the “Reporting Periods”) for professional services rendered by the Registrant’s principal accountant (the “Auditor”) for the audit of the Registrant’s annual financial statements, or services that are normally provided by the Auditor in connection with the statutory and regulatory filings or engagements for the Reporting Periods, were $49,500 in 2009 and $49,800 in 2010.
b) Audit-Related Fees. The aggregate fees billed in the Reporting period for assurance and related services by the Auditor that are reasonably related to the performance of the Registrant’s financial statements were $2 in 2009 and $0 in 2010. These services consisted of procedures performed in connection with agreed upon procedures for the calculations pursuant to the fund’s articles supplementary creating and fixing the rights of Series M Taxable Auction Rate Preferred shares for LMP Real Estate Income Fund Inc.
In addition, there were no Audit-Related Fees billed in the Reporting Period for assurance and related services by the Auditor to the Registrant’s investment adviser (not including any sub-adviser whose role is primarily portfolio management and is subcontracted with or overseen by another investment adviser), and any entity controlling, controlled by or under common control with the investment adviser that provides ongoing services to the LMP Real Estate Income Fund Inc. (“service affiliates”), that were reasonably related to the performance of the annual audit of the service affiliates. Accordingly, there were no such fees that required pre-approval by the Audit Committee for the Reporting Periods.
(c) Tax Fees. The aggregate fees billed in the Reporting Periods for professional services rendered by the Auditor for tax compliance, tax advice and tax planning (“Tax Services”) were $3,700 in 2009 and $3,700 in 2010. These services consisted of (i) review or preparation of U.S. federal, state, local and excise tax returns; (ii) U.S. federal, state and local tax planning, advice and assistance regarding statutory, regulatory or administrative developments, and (iii) tax advice regarding tax qualification matters and/or treatment of various financial instruments held or proposed to be acquired or held.
There were no fees billed for tax services by the Auditors to service affiliates during the Reporting Periods that required pre-approval by the Audit Committee.
d) All Other Fees. There were no other fees billed in the Reporting Periods for products and services provided by the Auditor, other than the services reported in paragraphs (a) through (c) of this Item 4 for the LMP Real Estate Income Fund Inc.
All Other Fees. There were no other non-audit services rendered by the Auditor to Legg Mason Partners Fund Advisors, LLC (“LMPFA”) and any entity controlling, controlled by or under common control with LMPFA that provided ongoing services to LMP Real Estate Income Fund Inc. requiring pre-approval by the Audit Committee in the Reporting Period.
(e) Audit Committee’s pre—approval policies and procedures described in paragraph (c) (7) of Rule 2-01 of Regulation S-X.
(1) The Charter for the Audit Committee (the “Committee”) of the Board of each registered investment company (the “Fund”) advised by LMPFA or one of their affiliates (each, an “Adviser”) requires that the Committee shall approve (a) all audit and permissible non-audit services to be provided to the Fund and (b) all permissible non-audit services to be provided by the Fund’s independent auditors to the Adviser and any Covered Service Providers if the engagement relates directly to the operations and financial reporting of the Fund. The Committee may implement policies and procedures by which such services are approved other than by the full Committee.
The Committee shall not approve non-audit services that the Committee believes may impair the independence of the auditors. As of the date of the approval of this Audit Committee Charter, permissible non-audit services include any professional services (including tax services), that are not prohibited services as described below, provided to the Fund by the independent auditors, other than those provided to the Fund in connection with an audit or a review of the financial statements of the Fund. Permissible non-audit services may not include: (i) bookkeeping or other services related to the accounting records or financial statements of the Fund; (ii) financial information systems design and implementation; (iii) appraisal or valuation services, fairness opinions or contribution-in-kind reports; (iv) actuarial services; (v) internal audit outsourcing services; (vi) ;management functions or human resources; (vii) broker or dealer, investment adviser or investment banking services; (viii) legal services and expert services unrelated to the audit; and (ix) any other service the Public Company Accounting Oversight Board determines, by regulation, is impermissible.
Pre-approval by the Committee of any permissible non-audit services is not required so long as: (i) the aggregate amount of all such permissible non-audit services provided to the Fund, the Adviser and any service providers controlling, controlled by or under common control with the Adviser that provide ongoing services to the Fund (“Covered Service Providers”) constitutes not more than 5% of the total amount of revenues paid to the independent auditors during the fiscal year in which the permissible non-audit services are provided to (a) the Fund, (b) the Adviser and (c) any entity controlling, controlled by or under common control with the Adviser that provides ongoing services to the Fund during the fiscal year in which the services are provided that would have to be approved by the Committee; (ii) the permissible non-audit services were not recognized by the Fund at the time of the engagement to be non-audit services; and (iii) such services are promptly brought to the attention of the Committee and approved by the Committee (or its delegate(s)) prior to the completion of the audit.
(2) For the LMP Real Estate Income Fund Inc., the percentage of fees that were approved by the audit committee, with respect to: Audit-Related Fees were 100% and 100% for 2009 and 2010; Tax Fees were 100% and 100% for 2009 and 2010; and Other Fees were 100% and 100% for 2009 and 2010.
(f) N/A
(g) Non-audit fees billed by the Auditor for services rendered to LMP Real Estate Income Fund Inc., LMPFA and any entity controlling, controlled by, or under common control with LMPFA that provides ongoing services to LMP Real Estate Income Fund Inc. during the reporting period were $0 in 2010.
(h) Yes. LMP Real Estate Income Fund Inc.’s Audit Committee has considered whether the provision of non-audit services that were rendered to Service Affiliates, which were not pre-approved
(not requiring pre-approval), is compatible with maintaining the Accountant’s independence. All services provided by the Auditor to the LMP Real Estate Income Fund Inc. or to Service Affiliates, which were required to be pre-approved, were pre-approved as required.
ITEM 5. AUDIT COMMITTEE OF LISTED REGISTRANTS.
a) Registrant has a separately-designated standing Audit Committee established in accordance with Section 3(a) 58(A) of the Exchange Act. The Audit Committee consists of the following Board members:
William R. Hutchinson
Paolo Cucchi
Carol Colman
Daniel Cronin
Leslie Gelb
Riordan Roett
Jeswald Salacuse
(b) Not applicable
ITEM 6. SCHEDULE OF INVESTMENTS.
Included herein under Item 1.
ITEM 7. DISCLOSURE OF PROXY VOTING POLICIES AND PROCEDURES FOR CLOSED-END MANAGEMENT INVESTMENT COMPANIES.
Proxy Voting Guidelines and Procedures
Legg Mason Partners Fund Advisor, LLC (“LMPFA”) delegates the responsibility for voting proxies for the fund to the subadviser through its contracts with the subadviser. The subadviser will use its own proxy voting policies and procedures to vote proxies. Accordingly, LMPFA does not expect to have proxy-voting responsibility for the fund. Should LMPFA become responsible for voting proxies for any reason, such as the inability of the subadviser to provide investment advisory services, LMPFA shall utilize the proxy voting guidelines established by the most recent subadviser to vote proxies until a new subadviser is retained.
The subadviser’s Proxy Voting Policies and Procedures govern in determining how proxies relating to the fund’s portfolio securities are voted and are provided below. Information regarding how each fund voted proxies (if any) relating to portfolio securities during the most recent 12-month period ended June 30 is available without charge (1) by calling 888-425-6432, (2) on the fund’s website at http://www.leggmason.com/individualinvestors and (3) on the SEC’s website at http://www.sec.gov.
PROXY VOTING AND RELATED MATTERS
The goal of AEW Capital Management, L.P. (“AEW”) Proxy Voting Policies and Procedures is to provide guidance in voting proxies and responding to other shareholder solicitations. These guidelines are not exhaustive and do not include all potential voting issues. Moreover, the Department of Labor (the “DOL”) has made it clear that, under ERISA a proxy voting policy should be in place for recurring issues and that non-routine issues should be addressed by consistent criteria. This means that company-specific analysis should be performed and that automatic voting procedures are not generally appropriate or acceptable. Proxy voting decisions should be handled on a case-by-case basis.
Proxy Voting.
The following policies and procedures should generally be followed when voting proxies:
· There should be a clear delineation of voting responsibilities between AEW and the client. For each account, the applicable investment management agreement should specify whether, and in what instances, voting is the responsibility of the client or AEW.
· AEW should take reasonable steps under the circumstances to assure that AEW has actually received all of the proxies for which it has voting authority.
· When voting proxies AEW should act prudently, solely in the best interest of its clients, and for the exclusive purpose of maximizing value to its clients. AEW should consider those factors that would affect the value of its clients’ investments and should not, unless specifically directed to do so by a client, consider unrelated objectives, such as social considerations. If AEW believes that the company’s management and board have interests sufficiently aligned with those of the clients, AEW may vote in favor of proposals recommended by the company’s board.
· AEW subscribes for services from Institutional Shareholder Services (“ISS”). ISS provides research, analysis and voting recommendations as well as reporting relating to proxy voting. To the extent not inconsistent with the general principles set forth above or the specific matters identified below, AEW will generally vote in accordance with the ISS proxy voting guidelines.
· Finally, if a client has specific proxy voting guidelines, AEW will, at the written request of the client, vote in accordance with the client’s guidelines; provided that such guidelines are not inconsistent with AEW’s obligations under ERISA or other applicable laws.
Voting Guidelines — Specific Matters Submitted to Shareholders
· Corporate Governance and Structure
Board of Directors/Trustees
AEW seeks to ensure that the board of directors of a company is sufficiently aligned with security holders’ interests and provides proper oversight of the company’s management. In many cases, this may be best accomplished by having a majority of independent board members. Although we will examine board member elections on a case-by-case basis, we will generally vote for the election of directors that would result in a board compromised of a majority of independent directors. In addition, key board committees should generally be comprised of at least a majority of independent board members. For all other votes regarding boards of directors, we will vote on a case-by-case basis.
Merger Acquisitions, Reincorporation and Other Transactions
Companies may ask their shareholders to vote on a variety of different types of transactions, including mergers, acquisitions, re-incorporations and reorganizations involving business combinations, liquidations and the sale of all or substantially all of a company’s assets. Voting on such proposals involves considerations unique to each transaction. Therefore, our vote on proposals to effect these types of transactions will be determined on a case-by-case basis.
Anti-Takeover Measures and Shareholder Voting Rights
Certain proxy proposals seek to hinder the ability of an outside party to take control or buy a certain percentage of the stock of a company without the approval of management or the board. Such proposals include the adoption of a shareholder rights plan, requiring supermajority voting on particular issues, adoption of fair price provisions, issuance of blank-check preferred stock, or the creation of a separate class of stock with unequal voting rights. However, some of the proposals may benefit shareholders in
certain circumstances. Because of the variety of such proposals and their varied effects on security holders, our vote on anti-takeover measures will be determined on a case-by-case basis.
Capital Structure
Shareholders of companies may be presented with proposals seeking to change the company’s capital structure by authorizing additional stock, repurchasing stock or approving a stock split. As with mergers and acquisitions, there are a variety of transactions that may be presented to shareholders. Accordingly, we will vote on a case-by-case basis involving changes to a company’s capital structure.
· Executive Compensation and Option Plans
The interests of a company’s management and board of directors should be aligned with the long-term interests of the company’s shareholders. Accordingly, proxy votes should be used to encourage the use of reasonably designed compensation plans that promote such alignment by providing officers and employees with an incentive to increase shareholder value. The decision to favor or oppose compensation plans can be fact-intensive and unique. Accordingly, we will vote on a case-by-case basis.
· Other Business Matters
Proxy statements generally involve the approval of routine business matters and procedural matters relating to shareholders meetings. Generally these routine matters do not materially affect shareholder interests adversely and are best left to the board of directors and senior management of the company. Thus, we will generally vote for board-approved proposals regarding such matters.
Conflicts of Interest.
Occasions may arise where a person or organization involved in the proxy voting process may have a potential conflict of interest. A potential conflict of interest may exist, for example, if AEW has a business relationship with either the company soliciting the proxy or a third party that has a material interest in the outcome of a proxy vote or that is actively lobbying for a particular outcome of a proxy vote. Any individual with knowledge of a potential conflict of interest relating to a particular proposal should disclose the potential conflict to AEW’s Compliance Officer. The Compliance Officer will review the potential conflict of interest to determine if a conflict of interest in fact exists. Where a conflict is determined to exist, appropriate steps will be taken to ensure that the action taken was made solely on the investment merits and without regard to any other con sideration.
In the event of a conflict of interest involving any proxy vote, AEW will generally vote in accordance with recommendations provided by ISS or another independent party proxy service provider.
Record Retention and Disclosure
AEW maintains a Proxy Voting binder which memorializes shareholder action with respect to securities held on behalf of AEW clients. On each occasion when votes are cast (or not cast) by AEW with respect to the securities of a particular issuer, a record of such vote should be maintained in the Proxy Voting binder. The Proxy Voting binder should include, as appropriate: (i) the name of the shareholder whose proxy is being voted; (ii) the name of the company; (iii) the exchange ticker symbol of the company; (iv) the CUSIP number; (v) a brief identification of the matter voted on; (vi) whether the matter was proposed by the company or by a security holder; (vii) whether a vote was cast on the matter; (viii) how the vote was cast (e.g., for or against proposal, or abstained, for or withheld
regarding election of directors); (ix) whether the vote was cast for or against management; (x) the signature of the portfolio manager authorizing the vote; and (xi) any other relevant information. The above information should be maintained for a period of not less than six years from the end of the fiscal year in which the information was created, with the first two years in an appropriate location on-site at AEW.
ITEM 8. PORTFOLIO MANAGERS OF CLOSED-END MANAGEMENT INVESTMENT COMPANIES.
(a)(1):
NAME AND ADDRESS | | LENGTH OF | | PRINCIPAL OCCUPATION(S) DURING |
ADDRESS | | TIME SERVED | | PAST 5 YEARS |
| | | | |
Matthew A. Troxell AEW Management and Advisors L.P. 2 Seaport Lane, 16th Floor Boston, MA 02210 | | Since 2002 | | Principal and Portfolio Manager of AEW Capital Management, L.P. |
(a)(2): DATA TO BE PROVIDED BY FINANCIAL CONTROL
The following tables set forth certain additional information with respect to the fund’s portfolio manager for the fund. Unless noted otherwise, all information is provided as of December 31, 2010.
Other Accounts Managed by Portfolio Managers
The table below identifies the number of accounts (other than the fund) for which the fund’s portfolio managers have day-to-day management responsibilities and the total assets in such accounts, within each of the following categories: registered investment companies, other pooled investment vehicles, and other accounts. For each category, the number of accounts and total assets in the accounts where fees are based on performance is also indicated.
| | Other Registered | | Other Pooled | | |
Portfolio | | Investment | | Investment | | Other |
Manager(s) | | Companies | | Vehicles | | Accounts |
| | | | | | |
Matthew A. Troxell | | 5 registered investment companies with $658.6 million in total assets under management | | 7 Other pooled investment vehicles with $1.4 billion in assets under management* | | 35 Other account with $3.9 billion in total assets under management** |
* Includes 1 pooled investment vehicle, totaling $0.1 billion, for which advisory fee is performance based.
** Includes 7 accounts, totaling $1.5 billion, for which advisory fee is performance based.
(a)(3): Portfolio Manager Compensation
Standard compensation includes competitive base salaries, generous employee benefits, and a retirement plan.
In addition, employees are eligible for bonuses. These are structured to closely align the interests of employees with those of the Adviser, and are determined by the professional’s job function and performance as measured by a formal review process. All bonuses are completely discretionary. One of the principal factors considered is a portfolio manager’s investment performance versus appropriate peer groups and benchmarks. Because portfolio managers are generally responsible for multiple accounts (including the Portfolio) with similar investment strategies, they are compensated on the performance of the aggregate group of similar accounts, rather than a specific account. A smaller portion of a bonus payment is derived from factors that include client service, business development, length of service to the Adviser, management or supervisory responsibilities, contributions to developing business strategy and overall contributions to the Adviser’s business.
Potential Conflicts of Interest
Potential conflicts of interest may arise in connection with the management of multiple accounts (including accounts managed in a personal capacity). These could include potential conflicts of interest related to the knowledge and timing of a Portfolio’s trades, investment opportunities and broker selection. Portfolio managers may be privy to the size, timing and possible market impact of a Portfolio’s trades.
It is possible that an investment opportunity may be suitable for both a Portfolio and other accounts managed by a portfolio manager, but may not be available in sufficient quantities for both the Portfolio and the other accounts to participate fully. Similarly, there may be limited opportunity to sell an investment held by a Portfolio and another account. A conflict may arise where the portfolio manager may have an incentive to treat an account preferentially as compared to a Portfolio because the account pays a performance-based fee or the portfolio manager, the Adviser or an affiliate has an interest in the account. The Adviser has adopted procedures for allocation of portfolio transactions and investment opportunities across multiple client accounts on a fair and equitable basis over time. All eligible accounts that can participate in a trade share the same price on a pro-rata alloca tion basis in an attempt to mitigate any conflict of interest. Trades are allocated among similarly managed accounts to maintain consistency of portfolio strategy applicable to each account, taking into account cash availability, investment restrictions and guidelines, and portfolio composition versus strategy.
The management of multiple Portfolios and/or other accounts may result in a portfolio manager devoting unequal time and attention to the management of each Portfolio and/or other account.
A portfolio manager may also face other potential conflicts of interest in managing a Portfolio, and the description above is not a complete description of every conflict of interest that could be deemed to exist in managing both a Portfolio and the other accounts listed above.
(a)(4): Portfolio Manager Securities Ownership
The table below identifies the dollar range of securities beneficially owned by the portfolio manager as of December 31, 2010.
Portfolio Manager | | Dollar Range of
Portfolio Securities Beneficially Owned |
Matthew A. Troxell | | None |
ITEM 9. PURCHASES OF EQUITY SECURITIES BY CLOSED-END MANAGEMENT INVESTMENT COMPANY AND AFFILIATED PURCHASERS.
Not Applicable.
ITEM 10. SUBMISSION OF MATTERS TO A VOTE OF SECURITY HOLDERS.
Not Applicable.
ITEM 11. CONTROLS AND PROCEDURES.
(a) The registrant’s principal executive officer and principal financial officer have concluded that the registrant’s disclosure controls and procedures (as defined in Rule 30a- 3(c) under the Investment Company Act of 1940, as amended (the “1940 Act”)) are effective as of a date within 90 days of the filing date of this report that includes the disclosure required by this paragraph, based on their evaluation of the disclosure controls and procedures required by Rule 30a-3(b) under the 1940 Act and 15d-15(b) under the Securities Exchange Act of 1934.
(b) There were no changes in the registrant’s internal control over financial reporting (as defined in Rule 30a-3(d) under the 1940 Act) that occurred during the registrant’s last fiscal half-year (the registrant’s second fiscal half-year in the case of an annual report) that have materially affected, or are likely to materially affect the registrant’s internal control over financial reporting.
ITEM 12. EXHIBITS.
(a) (1) Code of Ethics attached hereto.
Exhibit 99.CODE ETH
(a) (2) Certifications pursuant to section 302 of the Sarbanes-Oxley Act of 2002 attached hereto.
Exhibit 99.CERT
(b) Certifications pursuant to Section 906 of the Sarbanes-Oxley Act of 2002 attached hereto.
Exhibit 99.906CERT
SIGNATURES
Pursuant to the requirements of the Securities Exchange Act of 1934 and the Investment Company Act of 1940, the registrant has duly caused this Report to be signed on its behalf by the undersigned, there unto duly authorized.
LMP Real Estate Income Fund Inc.
By: | /s/ R. Jay Gerken | |
| (R. Jay Gerken) | |
| Chief Executive Officer of | |
| LMP Real Estate Income Fund Inc. | |
| | |
Date: | February 28, 2011 | |
Pursuant to the requirements of the Securities Exchange Act of 1934 and the Investment Company Act of 1940, this report has been signed below by the following persons on behalf of the registrant and in the capacities and on the dates indicated.
By: | /s/ R. Jay Gerken | |
| (R. Jay Gerken) | |
| Chief Executive Officer of | |
| LMP Real Estate Income Fund Inc. | |
| | |
| | |
Date: | February 28, 2011 | |
By: | /s/ Kaprel Ozsolak | |
| (Kaprel Ozsolak) | |
| Chief Financial Officer of | |
| LMP Real Estate Income Fund Inc. | |
| | |
Date: | February 28, 2011 | |