Exhibit 99.2

TRX GOLD CORPORATION
MANAGEMENT’S DISCUSSION AND ANALYSIS
For the three month period ended November 30, 2024
| | Management’s Discussion and Analysis November 30, 2024 |
The following Management’s Discussion and Analysis (“MD&A”) of the financial condition and results of operations for TRX Gold Corporation (“TRX Gold” or the “Company”) should be read in conjunction with the Company’s unaudited interim consolidated financial statements for the three months ended November 30, 2024, as well as the Company’s audited consolidated financial statements included in the Company’s Annual Report on Form 40-F and Annual Information Form for the year ended August 31, 2024. The financial statements and related notes of TRX Gold have been prepared in accordance with International Financial Reporting Standards (“IFRS”). Additional information, including our press releases, has been filed electronically on SEDAR+ and is available online under the Company’s profile at www.sedarplus.ca and on our website at www.TRXGold.com.
This MD&A reports our activities through January 14, 2025, unless otherwise indicated. References to the 1st quarter of 2025 or Q1 2025, and references to the 1st quarter of 2024 or Q1 2024 mean the three months ended November 30, 2024, and November 30, 2023, respectively. Unless otherwise noted, all references to currency in this MD&A refer to US dollars. Unless clearly otherwise referenced to a specific table, numbers referenced refer to numbered Endnotes on page 43.
Disclosure and Cautionary Statement Regarding Forward Looking Information
This MD&A contains certain forward-looking statements and forward-looking information, including without limitation statements about TRX Gold’s future business, operations and production capabilities. All statements, other than statements of historical fact, included herein are forward-looking statements and forward-looking information that involve various risks and uncertainties. There can be no assurance that such statements will prove to be accurate, and actual results and future events could differ materially from those anticipated in such statements. Although TRX Gold believes the expectations expressed in such forward-looking statements are based on reasonable assumptions, such statements are not guarantees of future performance. The actual achievements of TRX Gold or other future events or conditions may differ materially from those reflected in the forward-looking statements due to a variety of risks, uncertainties and other factors. These risks, uncertainties and factors include general business, legal, economic, competitive, political, regulatory and social uncertainties; actual results of exploration activities and economic evaluations; fluctuations in currency exchange rates; changes in costs; future prices of gold and other minerals; mining method, production profile and mine plan; delays in exploration, development and construction activities; changes in government legislation and regulation; the ability to obtain financing on acceptable terms and in a timely manner or at all; contests over title to properties; employee relations and shortages of skilled personnel and contractors; and the speculative nature of, and the risks involved in, the exploration, development and mining business.
Mr. William van Breugel, P.Eng, BASc (Hons), technical advisor to TRX Gold Corporation, is the Company’s Qualified Person under National Instrument 43-101 “Standards of Disclosure for Mineral Projects” (“NI 43-101”) and has reviewed and assumes responsibility for the scientific and technical content in this MD&A.
| | Management’s Discussion and Analysis November 30, 2024 |
The disclosure contained in this MD&A of a scientific or technical nature relating to the Company’s Buckreef Project has been summarized or extracted from the technical report entitled “The National Instrument 43-101 Independent Technical Report, Updated Mineral Resource Estimate for the Buckreef Gold Mine Project, Tanzania, East Africa for TRX Gold” with an effective date (the “Effective Date”) of May 15, 2020 (the “2020 Technical Report”). The 2020 Technical Report was prepared by or under the supervision Mr. Wenceslaus Kutekwatekwa (Mining Engineer, Mining and Project Management Consultant) BSc Hons (Mining Eng.), MBA, FSAIMM, of Virimai Projects, and, Dr Frank Crundwell, MBA, PhD, a Consulting Engineer, each of whom is an independent Qualified Person as such term is defined in NI 43-101. The information contained herein is subject to all of the assumptions, qualifications and procedures set out in the 2020 Technical Report and reference should be made to the full details of the 2020 Technical Report which has been filed with the applicable regulatory authorities and is available on the Company’s profile at www.sedarplus.ca. The Company did not complete any new work that would warrant reporting material changes in the previously reported Mineral Resource (“MRE”) and Mineral Reserve statements during the period ended November 30, 2024. The 2020 Technical Report follows the CIM Definition Standards on Mineral Resources and Mineral Reserves (“CIM Definition Standards”) and the CIM Estimation of Mineral Resources & Mineral Reserves Best Practice Guidelines (“CIM Guidelines”).
Certain information presented in this MD&A may constitute “forward-looking statements” and “forward looking information” within the meaning of the U.S. Private Securities Litigation Reform Act of 1995 and under securities legislation applicable in Canada, respectively. Such forward-looking statements and information are based on numerous assumptions, and involve known and unknown risks, uncertainties, and other factors, including risks inherent in mineral exploration and development, which may cause the actual results, performance, or achievements of the Company to be materially different from any projected future results, performance, or achievements expressed or implied by such forward-looking statements and information. Investors are referred to our description of the risk factors affecting the Company, as contained in our U.S. Securities and Exchange Commission (“SEC”) filings, including our Annual Report on Form 40-F and Report of Foreign Private Issuer on Form 6-K, and our Annual Information Form also posted on SEDAR+, for more information concerning these risks, uncertainties, and other factors.
TRX Gold Corporation
TRX Gold is rapidly advancing the Buckreef Gold Project. Anchored by a Mineral Resource published in May 2020[1], the project currently hosts a Measured and Indicated Mineral Resource (“M&I Resource”) of 35.88 million tonnes (“MT”) at 1.77 grams per tonne (“g/t”) gold containing 2,036,280 ounces (“oz”) of gold and an Inferred Mineral Resource of 17.8 MT at 1.11 g/t gold for 635,540 oz of gold. The leadership team is focused on creating both near-term and long-term shareholder value by increasing gold production to generate positive cash flow. The positive cash flow will be utilized for exploratory drilling with the goal of increasing the current mineral resource base and advancing the larger project development which represents 90% of current mineral resources. TRX Gold’s actions are led by the highest environmental, social and corporate governance (“ESG”) standards, evidenced by the relationships and programs that the Company has developed during its nearly two decades of presence in the Geita Region, Tanzania. Please refer to the Company’s Updated Mineral Resources Estimate for Buckreef Gold Project, dated May 15, 20201 and filed under the Company’s profile on SEDAR+ and with the SEC on June 23, 2020 (the “2020 Technical Report”) for more information.
1 See Cautionary Statement
| | Management’s Discussion and Analysis November 30, 2024 |
Highlights – First Quarter 2025
During Q1 2025 the Company continued to use cash flow generated from mining operations to fund additional growth at Buckreef Gold. During Q1 2025, the Company recorded production of 4,841 ounces of gold and continued to benefit from record gold spot prices, resulting in (i) revenue of $12.5 million, (ii) gross profit of $4.8 million, (iii) operating cashflow of $2.4 million, and (iv) Adjusted EBITDA1 of $4.4 million. The Company continued to execute on its business model of using cash flow generated from mining operations to fund additional growth and successful exploration at Buckreef Gold. The Company announced its two best drill results ever, which led to the discovery of a promising new gold mineralization shear zone named the Stamford Bridge Zone, which is highly prospective and may become a bridge between the Buckreef Main Zone, Eastern Porphyry and Anfield Zones. The Company also announced completion of the ongoing metallurgical variability study at Buckreef Gold, with results confirming excellent gold recovery rates for the processing of sulphide ore. The Company is in the process of developing finer grinding initiatives to increase gold recoveries, which is positive for both near term production potential and future Mineral Resource development. These positive results continue to demonstrate the growth potential at Buckreef Gold and reflect successful execution of the Company’s sustainable business plan where cash flow from operations funds value creating activities.
Key highlights for Q1 2025 include:
| · | During Q1 2025, the Company sold 4,813 ounces of gold, recognizing revenue of $12.5 million, gross profit of $4.8 million (39%), operating cashflow of $2.4 million and Adjusted EBITDA[1] of $4.4 million. The increase in revenue, gross profit and Adjusted EBITDA1 compared to the prior year comparative period is mainly related to a higher average gold price realized during Q1 2025. During the period, the Company sold 4,813 ounces of gold (Q1 2024: 4,895 ounces) at an average realized price (net)1 of $2,653 per ounce (Q1 2024: $1,942 per ounce). |
| · | The Company continues to expect gold production for F2025 to be higher than F2024 levels, reflecting a full year of operations from the expanded 2,000 tpd processing plant, partially offset by a waste stripping campaign required to access high grade ore blocks to deliver consistent higher grade ore feed to the mill. The Company continues to expect cash cost per ounce to be in line with F2024 levels, mainly due to the impact of higher expected gold production and significantly lower mining and processing costs per tonne, offset by a lower average grade profile, in line with the scheduled mine sequence. |
| · | During Q1 2025, the company announced the appointment of Richard Boffey as Chief Operating Officer of TRX Gold Corporation. Mr. Boffey is a seasoned executive, bringing more than 35 years of operational experience to the TRX Gold team and will be instrumental in the continued growth and development of Buckreef Gold. |
| · | During Q1 2025, the Company announced the discovery of a promising new gold mineralization shear zone, named the “Stamford Bridge Zone”, where results are beginning to form what may become a potential 1-kilometer “bridge” between the Buckreef Gold Main Zone, where current operations are ongoing, with links to the parallel, high-priority, gold mineralization zone known as the Eastern Porphyry, and the prospective Anfield Zone to the southeast. |
| · | During Q1 2025, the Company announced its two best drill results ever, on a gram x tonne x meters (“gtm”) basis, intersecting 37 meters (“m”) @ 6.86 g/t Au (253.82 gtm) from 130 m (hole BMDD315) and 35.5 m @ 5.48 g/t Au (194.54 gtm) from 64 m, located along the Stamford Bridge Zone. |
Numerical annotations throughout the text of the remainder of this document refer to the endnotes found on page 43.
| | Management’s Discussion and Analysis November 30, 2024 |
| · | Subsequent to Q1 2025, the Company announced three additional drill hole results (BMDD319-321) providing further evidence of gold mineralization along the Stamford Bridge Zone. |
| · | During Q1 2025, the Company announced completion of the ongoing metallurgical variability study at Buckreef Gold, with results confirming excellent gold recovery rates for the processing of sulphide ore. Results demonstrate that a finer grind size leads to higher recovery rates, and the Company is currently in the process of developing finer grinding initiatives to achieve higher gold recoveries. This is positive for both near term production potential and future Mineral Resource development as the Company continues to focus on development of other high-priority gold zones, such as Stamford Bridge, Anfield and Eastern Porphyry. |
| · | The Company achieved zero lost time injuries (“LTI”) and there were no reportable environmental or community related incidents during Q1 2025. |
Newly Expanded 2,000 TPD Mill is Fully Commissioned and Operational
| · | During Q4 2024 the Company announced completion of the expanded processing plant to 2,000 tpd of nameplate processing capacity, which is expected to benefit plant throughput and gold production over F2025. |
| · | The newly expanded processing plant was fully commissioned in early Q1 2025 (September 2024) following installation of the 4-way cyclone cluster and achieved, on average, 1,703 tpd of mill throughput in Q1 2025, a 108% increase over the prior year comparative period (Q1 2024), reaching a maximum of 2,073 tpd. |
| · | As part of an initial phase of the plant expansion project to 2,000 tpd, during Q3 2024 the Company completed construction of the new crushing circuit. The expanded crushing system is fully commissioned and achieved an average of 1,610 tpd of crushed material over Q1 2025, including scheduled maintenance downtime, reaching a maximum of 2,674 tpd. The new crushing plant, combined with the old crushing circuit, is rated to process 3,600 to 4,800 tpd of ore at full capacity with new equipment comprising: run-of-mine (“ROM”) bin, apron feeder, conveyors, vibrating grizzly, primary jaw crusher and secondary and tertiary cone crushers. The crushing plant configuration is designed to produce a finely crushed ore ‘product’ suitable for the existing and future ball mills to improve grind size for a more efficient, cost-effective processing of sulphide ore. This new circuit is also expected to help drive increased throughput and recovery percentages and it continues to demonstrate the Company’s overall design philosophy of simplicity, redundancy, and durability making it a key component to support future growth. To assist in optimizing the crushing circuit, the Company has engaged an external consulting firm that specializes in comminution to help study and analyze the processing circuit configuration to identify gaps and optimization potential. The study expects to improve grindability and gold recovery. |
| · | The total capital cost of the full mill expansion was budgeted to be approximately $6.0 million, which was completed on time and on budget. This marks Buckreef Gold’s third successful expansion project aimed at increasing annual gold production in a de-risked, self-funded and phased approach. Moreover, through this latest expansion, the project is expected to benefit from greater economies of scale, resulting from higher processing plant throughput and higher overhead cost absorption. |
Best Drill Hole Results in History of Buckreef Gold – Announcement of Stamford Bridge Zone
| · | During Q1 2025, the Company announced its best drill result ever, on a gtm basis with hole BMDD315 intersecting 37 m @ 6.86 g/t Au (253.82 gtm) from 130 m. This drill hole result is approximately 250 m east of the Buckreef Main Zone, host to Buckreef Gold’s 2M+ ounce Au Mineral Resource1 and where current operations are ongoing in the Main Pit. This drill hole result comes following the previous best drill result, with hole BMDD310 intersecting 35.5 m @ 5.48 g/t Au (194.54 gtm) from 64 m. This drill hole result is approximately 200 m east of the Buckreef Main Zone. |
| | Management’s Discussion and Analysis November 30, 2024 |
| · | The Company also announced the discovery of a promising new gold mineralization shear zone, named the “Stamford Bridge Zone” at which current drill results are revealing geological characteristics and mineral alterations similar to that at Buckreef’s Main Zone. Holes BMDD315 and BMDD310, mentioned above, are located along the Stamford Bridge Zone. |
| · | Subsequent to Q1 2025, the Company announced three additional drill hole results (BMDD319-321) providing further evidence of gold mineralization along the Stamford Bridge Zone as follows: |
| · | Hole BMDD319 intersected 21.0 m @ 8.63 g/t Au from 81.0 m (181.23 gtm). |
| · | Hole BMDD320 intersected 20.5 m @ 5.14 g/t Au from 125.5 m (105.37 gtm). |
| · | Hole BMDD321 intersected 5.0 m @ 2.74 g/t Au from 157.0 m (13.7 gtm). |
| · | Thus far, drilling has covered 150 m of this newly identified mineralized structure and geological logging confirms the continuity of the structure. These results are beginning to form what can become a potential 1-kilometer “bridge” between the Buckreef Gold Main Zone, where current operations are ongoing, and the parallel, high-priority, gold mineralization zone known as the Eastern Porphyry. The latter also links to the Anfield Zone to the southeast, discovered in 2022. |
| · | The Stamford Bridge shear zone has quickly become the Company’s exploration priority. An exploration program is underway to uncover the area’s true gold mineralization potential. The Company is preparing a geophysical survey campaign, which will focus on the Stamford Bridge trend line, as well as an area covering up to 500 meters to both the North and South sides of the trend line. Following the results of this campaign, a strategic drill campaign will resume on newly defined, high-priority targets. |
Metallurgical Study Results – Higher Gold Recoveries Attainable at Buckreef Gold
| · | During Q1 2025, the Company announced completion of the ongoing metallurgical variability study3 at Buckreef Gold, with results confirming excellent gold recovery rates for the processing of sulphide ore. Metallurgical testing began at the Buckreef Main Zone in June of 2021, whereby a straightforward flowsheet comprising of crush, grind, flotation, regrind and CIL was developed by SGS Canada. In a laboratory, bulk sample testing returned gold recoveries between 85.3% to 95.4%. In June 2023, a 6,500-tonne bulk sample of sulphide ore was tested on site at Buckreef Gold’s existing milling facility. This successful test reported gold recoveries from sulphide ore of 88.7%. The recent and much larger metallurgical variability study reported in Q3 2024, reiterates results from past test work and is now of greater importance as Buckreef Gold is processing a higher proportion of sulphide ore (approximately 80% sulphides to 20% oxides) at its newly expanded milling facility. |
| · | Highlights from the results demonstrate that (i) a finer grind size leads to a higher gold recovery as gold recovery rates increased from 81.2% to 92.5% as the grind became finer from 80% - 53 μm to 80% - 5 μm; (ii) recovery results were in line with current operational performance as composites tested showed recovery rates ranging from 79.9% to 87.0% in a gravity + floatation + leaching test at a grind size of 80% - 75 μm, which is consistent with what is being experienced in current operations; (iii) Buckreef Gold is experiencing a relatively consistent tailings grade, regardless of head grade, at a grind size of 80% - 75 μm, further supporting the fact that increased grinding will lead to higher recovery rates; and (iv) gold is finely disseminated in the pyrite and improved recoveries can be achieved by grinding finer below 25µm through rougher flotation and subsequent regrinding of the flotation concentrate, by using the regrind ball mill, with minimum energy consumption. The Company is currently in the process of developing finer grinding initiatives to achieve higher gold recoveries. |
| · | These metallurgical study results are positive for future potential Mineral Resource development as the Company continues to focus on development of other high-priority gold zones, such as Stamford Bridge, Anfield and Eastern Porphyry, where brownfield exploration programs returned very similar geologic and mineralization characteristics as the Main Zone, to which similar milling processes could apply. |
| | Management’s Discussion and Analysis November 30, 2024 |
Operational and Financial Details – First Quarter 2025
Mining and Processing
| · | During the three months ended November 30, 2024, Buckreef Gold reported zero LTI at site and recorded a safety incident frequency rate of 0 (per million hours), including contractors. The Company’s two main contractors, FEMA Builders Limited (“FEMA”) and STAMICO, recorded a safety incident frequency rate of 0 (per million hours). |
| · | During Q1 2025, Buckreef Gold poured 4,841 ounces of gold (Q1 2024: 4,927 ounces) and sold 4,813 ounces of gold (Q1 2024: 4,895 ounces). Gold production in Q1 2025 was mainly in line with the prior year comparative period and reflects higher mill throughput of 1,703 tpd (Q1 2024: 817 tpd) following completion of the 2,000 tpd processing plant in Q4 2024, offset by a lower average recovery of 72% (Q1 2024: 81%) and lower average head grade of 1.29 g/t (Q1 2024: 2.57 g/t). The lower average head grade was due to mine sequencing where the scheduled mine plan is accessing lower grade ore blocks during Q1 2025 (in line with mine plan), concurrent with a scheduled stripping campaign to access higher grade ore blocks in the second half of F2025. The lower average recovery in Q1 2025 was mainly due to a higher proportion of blended material processed in Q1 2025 (24% oxide / 76% sulphide) compared to the prior year period where the mill processed oxide material at a higher average recovery. To assist in optimizing recovery for 2025, the Company has engaged an external consulting firm that specializes in comminution to help analyze the processing circuit configuration to identify gaps and optimization potential. The study expects to improve grindability (finer grind) and gold recovery, consistent with the results announced upon completion of the metallurgical variability study. |
| · | Total ore tonnes mined of 103 kt in Q1 2025 were in line with the prior year period (Q1 2024: 102 kt) and waste tonnes mined increased to 821 kt in Q1 2025 (Q1 2024: 454 kt) as stripping activities focused on accelerating the pit expansion to the north end of the main zone in the second layback to expose ore for H2 2025. As a result of the increased stripping activity, the higher proportion of waste to ore tonnes contributed to a higher strip ratio of 8.0 (waste:ore tonnes) compared to the prior year period (4.5 waste:ore tonnes). |
| · | Total ore tonnes processed of 1,703 tpd in Q1 2025 was 108% higher than the prior year comparative period (Q1 2024: 817 tpd), reaching a maximum of 2,073 tpd, following commissioning of the newly expanded processing plant in early Q1 2025 (September 2024). |
| · | During Q4 2024, the Company entered into a finance lease agreement for fifteen pieces of heavy equipment, including six excavators, one dozer, one motor grader, one backhoe, one compactor, and three loaders. Half of this fleet will replace rented equipment currently operating in the plant, while the remaining equipment will be utilized in site development projects, roadway construction, and maintenance. Additionally, this equipment is capable of supporting and supplementing, when necessary, the contract mining fleet at the site. During Q1 2025, the Company also entered into a purchase agreement to procure a fleet of eight haul trucks to expand haulage capability and capacity. During Q1 2025, the Company received 13 pieces of equipment (of the 15 ordered), along with the delivery of 8 trucks in December 2024. Each piece has been successfully commissioned and is currently being utilized in various capacities across the site. The arrival of this equipment has significantly improved the cost profile in the areas where it has been deployed. To date, the Company has observed notable cost reductions in our site development work (river training and TSF 2.2 phase II raise) as well as plant feed operations, and we anticipate further benefits as the operators gain more experience. The remaining two pieces of equipment, a telehandler and a skid steer, are expected on-site in January 2025. Their arrival will complete the initial equipment purchase and is expected to benefit operating costs and strengthen site development capabilities over the remainder of F2025. |
| | Management’s Discussion and Analysis November 30, 2024 |
F2025 Outlook
| · | The Company continues to expect F2025 gold production to be higher than F2024 levels, reflecting a full year of operations from the expanded 2,000 tpd processing plant, partially offset by a waste stripping campaign required to access high grade ore blocks to deliver consistent higher grade ore feed to the mill. To maintain prudent capital management and an ability to fund the plant expansion to 2,000 tpd, the Company proactively deferred a portion of waste stripping originally scheduled for F2024, which limited access to certain high grade ore blocks as scheduled in the initial mine sequence. Following commissioning of the 2,000 tpd plant in Q4 2024, the Company has scheduled a waste stripping campaign in F2025 to access the originally scheduled ore blocks. It is expected that the updated mine sequence will begin to access these high grade ore blocks in the second half of F2025 benefiting production starting in Q3 and Q4 2025. As a result, gold production is expected to be lower in H1 2025 and higher production is expected in H2 2025. The Company continues to expect cash cost per ounce to be in line with F2024 levels, mainly due to the impact of higher expected gold production and significantly lower mining and processing costs per tonne, offset by a lower average grade profile, in line with the scheduled mine sequence. Cash cost per ounce is expected to be slightly higher in H1 2025 and lower in H2 2025 as the mine sequence begins to access higher grade ore blocks in H2 2025. |
| · | Operating cash flow will be predominantly reinvested in the Company with a focus on value enhancing activities, including: (i) exploration and drilling with a focus on potential mineral resource expansion at Stamford Bridge, Buckreef Main (northeast and south), Buckreef West, Anfield, Eastern Porphyry extension; (ii) additional capital programs focused on plant optimizations, recovery improvements and production growth; and (iii) enhanced CSR/ESG programs. |
| · | The Company continues to expect sustaining capital, excluding waste rock stripping, to be consistent with F2024 levels, and includes certain infrastructure investments at Buckreef Gold, including finalizing construction of a significantly expanded TSF (TSF 2.2 Lift 2), procurement of heavy equipment, including 6 excavators, 1 dozer, 1 motor grader, 1 backhoe, 1 compactor, 3 loaders and a fleet of haul trucks to support and supplement, when necessary, the contract mining fleet at site. |
| · | Capitalized waste rock stripping will be expensed or capitalized based on the actual quarterly stripping ratio versus the expected life of mine stripping ratio and may be variable quarter over quarter and year over year. In F2025, the Company continues to expect capitalized stripping to be highest in H1 and then incurred evenly over Q3 and Q4 based on the expected mine plan. |
| · | The Company continues to expect growth capital to be consistent with F2024 levels and includes expansion initiatives related to the long-term growth of Buckreef Gold, including plant optimizations aimed at increasing recovery, throughput and production and study costs aimed at expanding Buckreef Gold and developing the larger project. |
| · | The Company continues to expect exploration spending to increase in F2025 and includes diamond drill and reverse circulation drilling services provided by the State Mining Corporation (“STAMICO”) for a program which includes brownfields drilling at Buckreef Main Zone (NE and SW), Buckreef West, Eastern Porphyry, and greenfield drilling at Stamford Bridge and Anfield. |
| | Management’s Discussion and Analysis November 30, 2024 |
Inventory
| · | As at November 30, 2024, the ROM pad stockpile contained 248,002 tonnes at an average grade of 0.89 g/t with an estimated 7,080 ounces of contained gold. A further stockpile of crushed mill feed of 15,874 tonnes at 1.44 g/t containing an estimated 733 ounces of gold has been accumulated between the crusher and mill. The fair market value of the ounces of gold on the ROM pad stockpile and crushed ore stockpile is approximately $20.7 million using the London PM Fix gold price of $2,651 per ounce as at November 30, 2024. Since year-end August 31, 2024, the Company drew down on the ROM pad stockpile (2,469 ounces) and crushed ore stockpile (123 ounces) to support mill feed. These fluctuations in ROM pad inventory are anticipated throughout the course of the year and are designed to ensure steady state processing. During the three months ended November 30, 2024, the Company processed stockpiled and mined material through the expanded 2,000 tpd processing plant and consequently reported gold in circuit, reflecting a buildup of metal inventory in the CIL tanks. The Company reported 942 ounces of gold in circuit at November 30, 2024, which reflected a decrease of 217 ounces from August 31, 2024, following gold elution and smelting activity during the year. |
Tailings Storage (TSF 2.2)
| · | During Q1 2025, the Company finished a river training (relocation) project required to be completed prior to the start of the TSF 2.2 Phase II work. The remaining work on phase II construction involves clearing, box cutting, excavation & compaction of the berm, slope finishing, HDPE liner installation, erosion control, and all-weather roadway installation. To date, clearing, box cutting, compacting, and fill placement in the box cut are complete, with berm embankment ongoing. This phase is expected to finish by early 2025, providing storage until early Q1 2026. Meanwhile, the site for TSF 3.0 was identified, and work began on the necessary requirements for construction of this long-term storage solution. Additionally, the company continues to explore the potential for using thickened tails (dry stacking) with co-disposal of pit waste |
Larger Buckreef Project
| · | The Company is currently working with geological and mine engineering consultants to analyze the options for a larger scale, expanded Buckreef operation, with the goal of exceeding the metrics outlined in the 2020 Technical Report, including annual production, IRR, NPV and key financial metrics. This analysis includes evaluating potential mill expansions to increase annual throughput capacity, flowsheet optimizations to improve mill efficiency, metallurgical engineering to improve ore recovery, open pit mine design to enhance production scheduling, underground mine design to efficiently access deeper ore blocks, and exploration drilling with the goal of expanding current Mineral Resources and extending the life of mine. |
| · | The Company is advancing studies on the larger project, and to date, has completed advanced metallurgical testing across the deposit and geotechnical studies for a deeper pit. During Q3 2023, the Company completed field work in determining the ultimate pit slopes of the 2-kilometer-long open pit in conjunction with consultants Terrane Geoscience Inc. During October 2024, the Company announced completion of the ongoing metallurgical variability study3 at Buckreef Gold, with results confirming excellent gold recovery rates for the processing of sulphide ore. The positive grade results confirm the amenability of sulphide material to be processed through the existing processing plant, using its relatively simple flowsheet. The study results also have positive implications for potential plant expansions and a straightforward flow sheet similar to the existing processing plant. The study results also bode well for future Mineral Resource development, as the Company continues to focus on development of other high-priority gold zones, such as Stamford Bridge, Anfield and Eastern Porphyry, where brownfield exploration programs returned very similar geologic and mineralization characteristics as the Main Zone, to which similar milling processes could apply. |
| | Management’s Discussion and Analysis November 30, 2024 |
Environmental, Social and Corporate Governance (“ESG”)
| · | The Company is committed to working to high ESG standards and is implementing several community programs, while continuing to develop a broader framework and policies. There were no reportable environmental or community related incidents during the three months ended November 30, 2024. |
| · | Buckreef Gold worked with Geita District Council and local wards to collaboratively identify programs that focus on short to long term educational needs, which in turn is aligned with Buckreef Gold’s local hiring practices and includes Science, Technology, Engineering and Mathematics and gender goals. |
| · | An updated Memorandum of Understanding (“MoU”) was signed in March 2024 between Buckreef Gold and the Geita District Council to provide support around education in the wards of Lwamgasa, Kaseme, Busanda and Bugulula, being the host wards for the mine site. During Q1 2025, the Company completed two construction projects on upgrades to the primary schools, secondary schools and health centers in the Busanda and Kaseme districts, and expects to complete the remaining construction projects in the Lwamgasa district in early Q2 2025, in line with the signed MoU. |
| · | During Q1 2025, a new CSR plan for F2025 was submitted to the Geita District Council for review and approval. Buckreef Gold and the Geita District Council are partnering to provide further support around education and health assistance in the wards of Lwamgasa, Kaseme and Busanda. A total of 420 million Tanzania Shillings (approximately $180,000) was budgeted by Buckreef Gold for F2025 to support priority areas in agreement with the Geita District Council. |
| · | Buckreef Gold’s operations: (i) are connected to the Tanzanian national electricity grid and utilize grid power which is significantly and increasingly sourced from hydroelectric facilities (in Tanzania); (ii) recycle all water used in its operations; (iii) employ a workforce that comprises 100% Tanzanian citizens (145 full-time employees, 358 contract miners and project contractors, 175 part-time/casual employees); (iv) include development and building activities that are focused on maximizing local content; and (v) exhibit a ‘100 mile diet’ by procuring all food locally. In addition, the Company is evaluating utilization of dry stack tailings for the larger project. |
| · | The Company supports local procurement in its activities by first sourcing within the immediate wards, then out to district, region and nation. Only those items or services not available in Tanzania are purchased externally, first prioritizing East Africa, Africa, then globally. |
| · | The Company will continue to develop a broader ESG program, including reporting aligned with definitions from the World Economic Forum, and identifying its contributions to the United Nations Sustainable Development Goals over F2025. |
Financial
| · | During Q1 2025, Buckreef Gold poured 4,841 ounces of gold (Q1 2024: 4,927) and sold 4,813 ounces of gold (Q1 2024: 4,895) at an average realized price1 of $2,653 per ounce (Q1 2024: $1,942) excluding the revenue and gold ounces sold related to the prepaid gold purchase agreement with OCIM Metals & Mining SA (“OCIM”) (“average realized price (net)1”). |
| · | During Q1 2025, the Company recognized revenue of $12.5 million (Q1 2024: $9.4 million), cost of sales of $7.7 million (Q1 2024: $5.7 million), and cash cost1 of $1,410 per ounce (Q1 2024: $1,063). The Company generated gross profit of $4.8 million (39% gross profit margin) (Q1 2024: $3.7 million), operating cashflow of $2.4 million (Q1 2024: $5.1 million), and Adjusted EBITDA1 of $4.4 million (Q1 2024: $2.6 million). The increase in revenue, gross profit and Adjusted EBITDA1 is mainly related to a higher average realized price of $2,653 per ounce (Q1 2024: $1,942) compared to the prior comparative period. |
| | Management’s Discussion and Analysis November 30, 2024 |
| · | The increase in cash cost compared to the prior year comparative period was mainly due to a decrease in head grade (Q1 2025: 1.29 g/t, 1 2024: 2.57 g/t) and recovery rates (Q1 2025: 72%, Q1 2024: 81%), partially offset by a decrease in mining cost per tonne and processing cost per tonne. Mining costs per tonne of $4.00 in Q1 2025 was lower than the prior year comparative period (Q1 2024: $4.25) primarily due to the impact of higher tonnes mined on the fixed portion of the mining contractor management fee. The Company expects mining costs per tonne to improve over time as owner operated equipment will be utilized to provide cost effective support for site development projects as well as plant feed operations. Processing costs per tonne of $12.60 in Q1 2025 were significantly lower than the prior year comparative period (Q1 2024: $ 26.56 per tonne) predominantly due to greater economies of scale following final commissioning of the expanded 2,000 tpd processing facility. The higher processing plant throughput of 1,703 tpd in Q1 2025 (Q1 2024: 817) provided a higher proportion of overhead cost absorption, thus benefiting processing cost per tonne in Q1 2025. |
| · | As at November 30, 2024, the Company had cash of $6.8 million and negative working capital of $0.8 million after adjusting for derivative liabilities which will only be settled by issuing equity of the Company and for the current portion of deferred revenue related to the OCIM prepaid gold purchase agreement. Working capital in Q1 2025 was impacted by a scheduled stripping campaign focused on accelerating the pit expansion to the north end of the main zone in the second layback to expose ore for H2 2025. As a result of the increased stripping activity, the Company mined a higher proportion of waste tonnes, which is expected to provide access to higher grade ore blocks in the second half of F2025, benefiting production starting in Q3 and Q4 2025. As a result, working capital is expected to improve in H2 2025. |
| · | During Q4 2022 the Company entered into a $5.0 million prepaid Gold Doré Purchase Agreement with OCIM. The Agreement required that funds to be made available to the Company in two tranches. After fully settling $2.5 million drawn on the first tranche of the Agreement, on September 26, 2023, the Company drew an additional $0.5 million from the second tranche of the Agreement in exchange for delivering 23.5 ounces of gold per month, commencing December 2023, for a total of 305.4 ounces of gold over 13 months. On November 29, 2023, the Company drew an additional $1.0 million from the second tranche of the Agreement in exchange for delivering 44.1 ounces of gold per month, commencing February 2024, for a total of 573.2 ounces of gold over 13 months. On May 6, 2024, the Company amended the terms of the Agreement to allow for additional prepayments and drew $1.0 million in exchange for delivering 40.85 ounces of gold per month, commencing June 2024, for a total of 490.2 ounces of gold over 12 months. During Q1 2025, the Company drew an additional $0.5 million in exchange for delivering 17.0 ounces of gold per month, commencing November 2024, for a total of 204.1 ounces of gold over 12 months. The $0.5 million drawdown in Q1 2025 was used to help finance the procurement of heavy equipment and haul trucks to supplement the contractor-owned fleet with an owner’s operated fleet for Buckreef’s mining operations. |
| · | As at November 30, 2024, the Company recognized $5.7 million of sales tax receivable on the Consolidated Statements of Financial Position. Sales tax receivables consist of harmonized services tax and value added tax (“VAT”) due from Canadian and Tanzanian tax authorities, respectively. Tanzanian tax regulations allow for VAT receivable to be refunded or set-off against other taxes due to the Tanzania Revenue Authority ("TRA"). During the three months ended November 30, 2024, the Company recovered VAT refunds from the TRA of $0.9 million. Subsequent to Q1, 2025, the Company recovered VAT refunds from the TRA of $0.6 million. |
| | Management’s Discussion and Analysis November 30, 2024 |
Other
| · | On December 6, 2024, the Company announced the appointment of Richard Boffey as Chief Operating Officer (“COO”). Mr. Boffey is a seasoned executive, bringing more than 35 years of operational experience to the TRX Gold team and will be instrumental in the continued growth and development of Buckreef Gold. Mr. Boffey joins TRX Gold, having previously held senior executive positions with other multi-national mining companies. Most recently, he held the position of General / Country Manager at the Tara Resources Brskovo Mine Project in Montenegro, where he led the technical studies, engineering design, resource drilling, project financing, and site preparation activities for the construction and development of a mining operation. Prior to this, he was the Chief Operating Officer at the Matilda Gold Mine for Blackham Resources in Western Australia, where he recommenced open pit and underground mining for a 2 million tonne per annum operation, including process plant commissioning, establishment of technical and operating teams, and development of policies, systems and processes to optimize operations. Mr. Boffey also held the roles of General Manager at the Khoemacau Copper Mine in Botswana for Cupric Canyon Capital and General Manager of the Efemcukuru Gold Mine in Turkey for Eldorado Gold Corporation. Mr. Boffey previously spent 5.5 years at Barrick Gold Corporation, serving 4.5 years as Regional Mining Manager for the Barrick Africa Regional Business Unit, overseeing 3 operations and 1 development project in Tanzania, and 1 development project in South Africa. Prior to that, Mr. Boffey spent 10 years at Placer Dome Inc. Mr. Boffey holds a Bachelor of Mining Engineering (Hons) from the University of Auckland and is a Member of AusIMM, Competent Person (Reserves) under JORC, NI 43-101. |
| | Management’s Discussion and Analysis November 30, 2024 |
Operational Overview
The Buckreef Gold Project
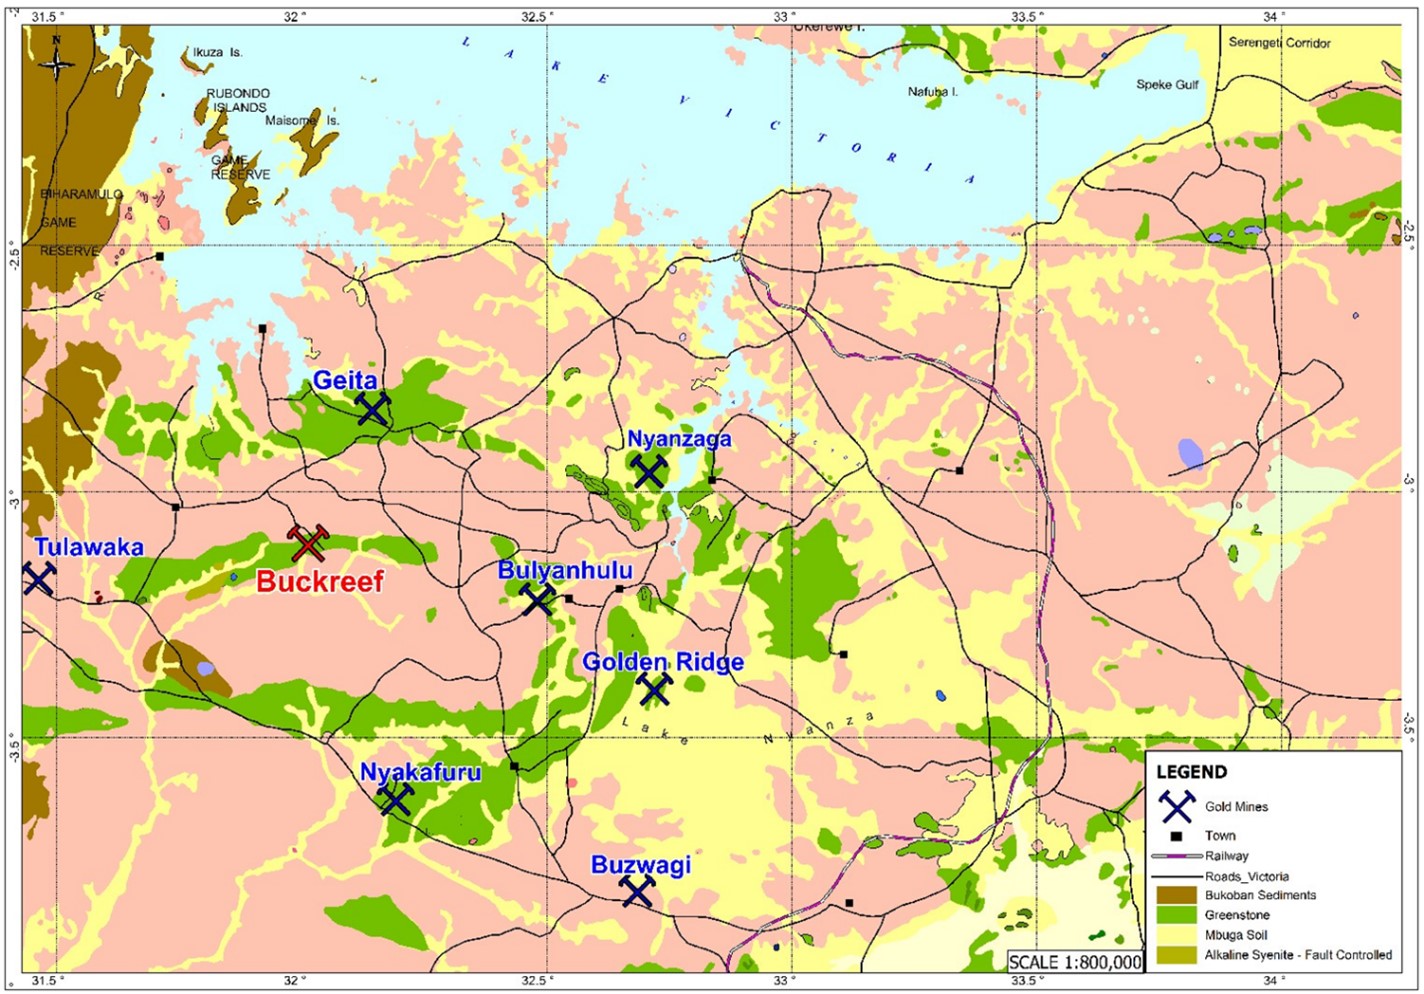
The Company is focused on the Buckreef Gold Project located in the Geita District of the Geita Region south of Lake Victoria, approximately 110 km southwest of the City of Mwanza, Tanzania (Figure 1). The Buckreef Gold Project area can be accessed by ferry across Smiths Sound, via a paved national road and, thereafter, via well maintained unpaved regional roads. The Buckreef Gold Project comprises several prospects, namely Buckreef, Eastern Porphyry, Anfield and the newly discovered Stamford Bridge. The Buckreef Gold Project itself encompasses three main mineralized zones: Buckreef South, Buckreef Main and Buckreef North. The Buckreef Gold Project is fully licensed for mining and the extraction of gold.
The Buckreef Gold Project Mineral Resources as of May 15, 2020, are as follows:
| | | | Measured | | | | Indicated | | | | Inferred | | | | Total (Measured + Indicated) | |
| | | | Tonnes | | | | Grade | | | | Au | | | | Tonnes | | | | Grade | | | | Au | | | | Tonnes | | | | Grade | | | | Au | | | | Tonnes | | | | Grade | | | | Au | |
| Area | | | MT | | | | g/t | | | | Oz | | | | MT | | | | g/t | | | | Oz | | | | MT | | | | g/t | | | | Oz | | | | MT | | | | g/t | | | | Oz | |
| Buckreef | | | 19.98 | | | | 1.99 | | | | 1,281,160 | | | | 15.89 | | | | 1.48 | | | | 755,120 | | | | 17.82 | | | | 1.11 | | | | 635,540 | | | | 35.88 | | | | 1.77 | | | | 2,036,280 | |
| Eastern Porphyry | | | 0.09 | | | | 1.20 | | | | 3,366 | | | | 1.02 | | | | 1.17 | | | | 38,339 | | | | 1.24 | | | | 1.39 | | | | 55,380 | | | | 1.10 | | | | 1.18 | | | | 41,705 | |
| Tembo | | | 0.02 | | | | 0.99 | | | | 531 | | | | 0.19 | | | | 1.77 | | | | 10,518 | | | | 0.27 | | | | 1.92 | | | | 16,461 | | | | 0.20 | | | | 1.70 | | | | 11,048 | |
| Bingwa | | | 0.90 | | | | 2.84 | | | | 82,145 | | | | 0.49 | | | | 1.48 | | | | 23,331 | | | | 0.22 | | | | 1.49 | | | | 10,541 | | | | 1.39 | | | | 2.36 | | | | 105,477 | |
| Total | | | 20.99 | | | | 2.03 | | | | 1,367,202 | | | | 17.59 | | | | 1.46 | | | | 827,308 | | | | 19.55 | | | | 1.14 | | | | 717,922 | | | | 38.57 | | | | 1.77 | | | | 2,194,510 | |
Note: Main Zone at 0.4 g/t cut-off, and Eastern Porphyry, Bingwa and Tembo at 0.5 g/t cut-off
Mineral Resources inclusive of Mineral Reserves
Mineral Resources that are not Mineral Reserves do not have demonstrated economic viability
All resources below 540 mRL are classified as inferred
Estimates over variable widths of 2 to 40 meters
Bulk Density ranges 2.0 g/cm3 to 2.8 g/cm3
55% attributable to the Company
Effective Date: May 15, 2020
The Buckreef Gold Project Mineral Reserves remained as of the May 15, 2020 Technical Report and are tabulated below.
| Buckreef Reserves | | Tonnes | | | Grade | | | In Situ Gold Content | |
| | (Mt) | | | Au (g/t) | | | Kg | | | oz | |
| Proven-Stockpile | | | 119,726 | | | | 1.86 | | | | 223 | | | | 7,160 | |
| Proven | | | 9,352,183 | | | | 1.72 | | | | 16,092 | | | | 517,358 | |
| Probable | | | 9,730,764 | | | | 1.36 | | | | 13,265 | | | | 426,492 | |
| Mineral Reserves | | | 19,202,673 | | | | 1.54 | | | | 29,580 | | | | 951,010 | |
| 1) | Mineral Reserves is inclusive of Mineral Reserve shapes, mining recovery, mining dilution and open pit preproduction development costs. Mineral Reserve estimate includes dilution. |
| 2) | Mineral Reserves were estimated in accordance with the CIM Definition Standards and CIM Guidelines. |
| 3) | Contained metal may differ due to rounding. |
Mineral Resource and Reserve Statements
The Company did not complete any new work that would warrant reporting material changes in the previously reported Mineral Resource (“MRE”) and Mineral Reserve statements during the period ended August 31, 2024. The 2020 Technical Report follows the CIM Definition Standards on Mineral Resources and Mineral Reserves (“CIM Definition Standards”) and the CIM Estimation of Mineral Resources & Mineral Reserves Best Practice Guidelines (“CIM Guidelines”).
| | Management’s Discussion and Analysis November 30, 2024 |
Figure 1: Location of Buckreef Gold Project Licences in the Lake Victoria Greenstone Belt
| | Management’s Discussion and Analysis November 30, 2024 |
Processing Plant and Operations
Select operating, financial and stockpile information from the operation for the three months ended November 30, 2024, follows below:
| Select Operating and Financial Data | | | | | | |
| | | | | | | | | |
| | | Unit | | Three months ended November 30, 2024 | | | Three months ended November 30, 2023 | |
| Operating Data | | | | | | | | | | |
| Ore Mined | | k tonnes | | | 103 | | | | 102 | |
| Waste Mined | | k tonnes | | | 821 | | | | 454 | |
| Total Mined | | k tonnes | | | 924 | | | | 556 | |
| Strip Ratio | | w:o | | | 8.0 | | | | 4.5 | |
| Mining Rate | | tpd | | | 10,154 | | | | 6,112 | |
| Mining Cost | | US$/t | | $ | 4.00 | | | $ | 4.25 | |
| Plant Ore Milled | | k tonnes | | | 155 | | | | 74 | |
| Head Grade | | g/t | | | 1.29 | | | | 2.57 | |
| Plant Utilization | | % | | | 88 | | | | 93 | |
| Plant Recovery Rate | | % | | | 72 | | | | 81 | |
| Processing Cost | | US$/t | | $ | 12.60 | | | $ | 26.56 | |
| Plant Mill Throughput | | tpd | | | 1,703 | | | | 817 | |
| Gold Ounces Poured | | oz | | | 4,841 | | | | 4,927 | |
| Gold Ounces Sold | | oz | | | 4,813 | | | | 4,895 | |
| Financial Data | | | | | | | | | | |
| Revenue1 | | $('000s) | | | 12,528 | | | | 9,404 | |
| Gross Profit | | $('000s) | | | 4,834 | | | | 3,717 | |
| Net income | | $('000s) | | | 2,137 | | | | (39 | ) |
| Adjusted EBITDA2 | | $('000s) | | | 4,394 | | | | 2,587 | |
| Operating Cash Flow | | $('000s) | | | 2,381 | | | | 5,139 | |
| Average Realized Price (gross)2 | | $/oz | | | 2,603 | | | | 1,921 | |
| Average Realized Price (net)2,3 | | $/oz | | | 2,653 | | | | 1,942 | |
| Cash Cost2 | | $/oz | | | 1,410 | | | | 1,063 | |
1 Revenue includes immaterial amounts from the sale of by-product silver and copper.
2 Refer to the "Non-IFRS Performance Measures" section.
3 Net of revenue and ounces of gold sold related to OCIM gold prepaid purchase agreement.
| | Management’s Discussion and Analysis November 30, 2024 |
Gold Production and Sales
During Q1 2025, Buckreef Gold poured 4,841 ounces of gold (Q1 2024: 4,927 ounces) and sold 4,813 ounces of gold (Q1 2024: 4,895 ounces). Gold production in Q1 2025 was mainly in line with the prior year comparative period and reflects higher mill throughput of 1,703 tpd (Q1 2024: 817 tpd) following completion of the 2,000 tpd processing plant in Q4 2024, offset by a lower average recovery of 72% (Q1 2024: 81%) and lower average head grade of 1.29 g/t (Q1 2024: 2.57 g/t). The lower average head grade was due to mine sequencing where the scheduled mine plan is accessing lower grade ore blocks during Q1 2025 (in line with mine plan), concurrent with a scheduled stripping campaign to access higher grade ore blocks in the second half of F2025. The lower average recovery in Q1 2025 was mainly due to a higher proportion of blended material processed in Q1 2025 (24% oxide / 76% sulphide) compared to the prior year period where the mill processed oxide material at a higher average recovery. To assist in optimizing recovery for 2025, the Company has engaged an external consulting firm that specializes in comminution to help analyze the processing circuit configuration to identify gaps and optimization potential. The study expects to improve grindability (finer grind) and gold recovery, consistent with the results announced upon completion of the metallurgical variability study.
Mining
Total ore tonnes mined of 103 kt in Q1 2025 were in line with the prior year period (Q1 2024: 102 kt) and waste tonnes mined increased to 821 kt in Q1 2025 (Q1 2024: 454 kt) as stripping activities focused on accelerating the pit expansion to the north end of the main zone in the second layback to expose ore for H2 2025. As a result of the increased stripping activity, the higher proportion of waste to ore tonnes contributed to a higher strip ratio of 8.0 (waste:ore tonnes) compared to the prior year period (4.5 waste:ore tonnes).
Mining costs per tonne primarily reflect contractor mining costs following the hiring of FEMA on a contract basis to mine ore, waste, and to construct the TSF at Buckreef Gold. Mining costs per tonne of $4.00 in Q1 2025 was lower than the prior year comparative period ($4.25) primarily due to the impact of higher tonnes mined on the fixed portion of the mining contractor management fee. The Company expects mining cost per tonne to improve over time as owner operated equipment will be utilized to provide cost effective support for site development projects as well as plant feed operations.
During Q4 2024, the Company entered into a finance lease agreement for fifteen pieces of heavy equipment, including six excavators, one dozer, one motor grader, one backhoe, one compactor, and three loaders. Half of this fleet will replace rented equipment currently operating in the plant, while the remaining equipment will be utilized in site development projects, roadway construction, and maintenance. Additionally, this equipment is capable of supporting and supplementing, when necessary, the contract mining fleet at the site. During Q1 2025, the Company also entered into a purchase agreement to procure a fleet of eight haul trucks to expand haulage capability and capacity. During Q1 2025, the Company received 13 pieces of equipment (of the 15 ordered), along with the delivery of 8 trucks. Each piece has been successfully commissioned and is currently being utilized in various capacities across the site. The arrival of this equipment has significantly improved the cost profile in the areas where it has been deployed. To date, the Company has observed notable cost reductions in our site development work (river training and TSF 2.2 phase II raise) as well as plant feed operations, and we anticipate further benefits as the operators gain more experience. The remaining two pieces of equipment, a telehandler and a skid steer, are expected on-site in January 2025. Their arrival will complete the initial equipment purchase and is expected to benefit operating costs and strengthen site development capabilities over the remainder of F2025.
| | Management’s Discussion and Analysis November 30, 2024 |
Processing
During Q4 2024 the Company announced completion of the expanded processing plant to 2,000 tpd of nameplate processing capacity, which is expected to benefit plant throughput, gold recovery and gold production over F2025. The newly expanded processing plant was fully commissioned in early Q1 2025 (September 2024) following installation of the 4-way cyclone cluster and achieved, on average, 1,703 tpd of mill throughput in Q1 2025, a 108% increase over the prior year comparative period (Q1 2024), reaching a maximum of 2,073 tpd. During Q1 2025 the processing plant achieved the following statistics: (i) average throughput of 1,703 tpd (Q1 2024: 817 tpd); (ii) plant availability of 88% (Q1 2024: 93%); and (iii) an average recovery rate of 72% (Q1 2024: 81%). While the Company benefitted from an increase in average throughput following completion of the expanded 2,000 tpd processing plant, the mill processed a higher proportion of blended material (24% oxide / 76% sulphide) in Q1 2025, compared to mainly oxide material processed in Q1 2024, which impacted average recoveries. The Company is currently developing finer grinding initiatives to achieve higher gold recoveries, consistent with the results announced upon completion of the metallurgical variability study.
For the three months ended November 30, 2024, processing costs per tonne of $12.60 were significantly lower than the prior year comparative period (Q1 2024: $ 26.56 per tonne) predominantly due to greater economies of scale following final commissioning of the expanded 2,000 tpd processing facility. The higher processing plant throughput of 1,703 tpd in Q1 2025 (Q1 2024: 817) provided a higher proportion of overhead cost absorption, thus benefiting processing cost per tonne in Q1 2025.
Stockpile, Gold in Circuit (GIC) and Finished Goods Inventory
As at November 30, 2024, the ROM pad stockpile contained 248,002 tonnes at an average grade of 0.89 g/t with an estimated 7,080 ounces of contained gold. A further stockpile of crushed mill feed of 15,874 tonnes at 1.44 g/t containing an estimated 733 ounces of gold has been accumulated between the crusher and mill. The fair market value of the ounces of gold on the ROM pad stockpile and crushed ore stockpile is approximately $20.7 million using the London PM Fix gold price of $2,651 per ounce as at November 30, 2024. Since year-end August 31, 2024, the Company drew down on the ROM pad stockpile (2,469 ounces) and crushed ore stockpile (123 ounces) to support mill feed. These fluctuations in ROM pad inventory are anticipated throughout the course of the year and are designed to ensure steady state processing. During the three months ended November 30, 2024, the Company processed stockpiled and mined material through the expanded 2,000 tpd processing plant and consequently reported gold in circuit, reflecting a buildup of metal inventory in the CIL tanks. The Company reported 942 ounces of gold in circuit at November 30, 2024, which reflected a decrease of 217 ounces from August 31, 2024, following gold elution and smelting activity during the year. A summary of the ROM pad and crushed ore stockpile statistics are contained in the table below:
| Table: RoM Stockpile Summary (as at 30 November, 2024) |
| Summary RoM Stockpile | | | Volume (m3) | | | | Tonnes | | | | Grade (g/t Au) | | | | Metal (oz) | |
| Feed Grade Ore | | | 45,195 | | | | 46,918 | | | | 1.34 | | | | 2,014 | |
| Low Grade | | | 120,973 | | | | 201,084 | | | | 0.78 | | | | 5,066 | |
| Total (RoM) | | | 166,168 | | | | 248,002 | | | | 0.89 | | | | 7,080 | |
| Crushed Ore (COS) | | | 8,962 | | | | 15,874 | | | | 1.44 | | | | 733 | |
| Total | | | 175,130 | | | | 263,876 | | | | 0.92 | | | | 7,813 | |
| | Management’s Discussion and Analysis November 30, 2024 |
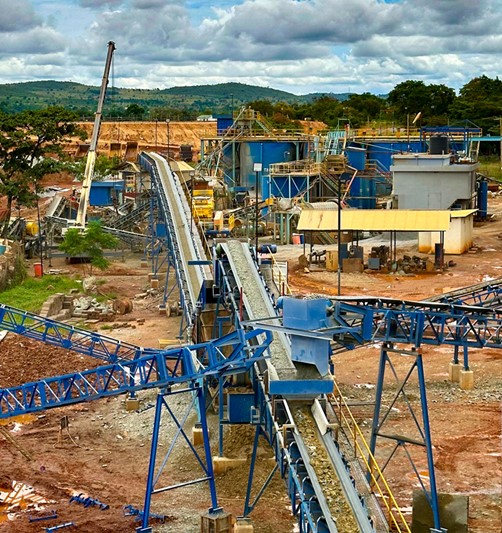
Figure 2: 1,000+ tpd Processing Plant at Buckreef Gold, showing CIL tanks and conveyor feed to the ball mills (Q1 2024)

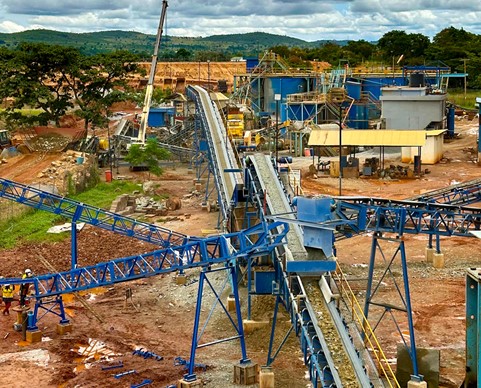
Figure 3a: Buckeef Gold new and expanded crushing circuit (Q2 2024)
| | Management’s Discussion and Analysis November 30, 2024 |
Figure 3b: Buckeef Gold ore moving through new crushing circuit (Q3 2024)

Figure 3c: Buckeef Gold’s new 1,000 tpd ball mill (Q3 2024)

| | Management’s Discussion and Analysis November 30, 2024 |
Figure 4: Buckreef Gold Tailings Storage Facility Expansion at TSF 2.2 (Q2 2024 – first lift completed and TSF is now fully operational)

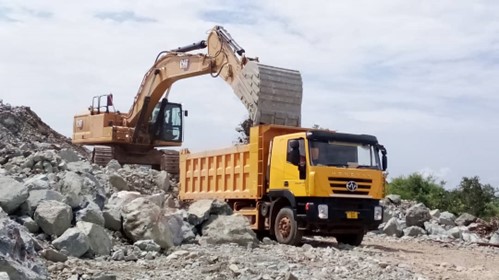
Figure 5: Buckeef Gold’s Open Pit Mining Operations (Q4 2024)

| | Management’s Discussion and Analysis November 30, 2024 |
Figure 6: Google Earth Satellite Image of Buckreef Gold Infrastructure (as of May 13, 2024)

Note: Google Earth image retrieved on 13 May 2024. Image can be retrieved by entering “Buckreef Gold” into the search engine on Google Earth.
Figure 8: New 350 Excavator and Haul Truck (as of December 20, 2024)
| | Management’s Discussion and Analysis November 30, 2024 |
Exploration & Mineral Resources
The Company continues to evaluate the full potential of the Buckreef Gold property and identify opportunities for the discovery of additional mineral resources and their conversion to mineral reserves. Successful exploration will also provide greater production flexibility and growth. To achieve this goal the Company, in conjunction with Buckreef Gold, has:
| · | Announced in F2025 its best drill results ever, on a gtm basis with hole BMDD315 intersecting 37 m @ 6.86 g/t Au (253.82 gtm) from 130 m. This drill hole result is approximately 250 m east of the Buckreef Main Zone, host to Buckreef Gold’s 2M+ ounce Au Mineral Resource1 and where current operations are ongoing in the Main Pit. This drill hole result comes following the Company’s previous best drill hole result, with hole BMDD310 intersecting 35.5 m @ 5.48 g/t Au (194.54 gtm) from 64 m. This drill hole result is approximately 200 m east of the Buckreef Main Zone. These drill holes led to the discovery of a promising new gold mineralization shear zone, named the “Stamford Bridge Zone” at which current drill results are revealing geological characteristics and mineral alterations similar to that at Buckreef’s Main Zone. Holes BMDD315 and BMDD310, mentioned above, are located along the Stamford Bridge Zone. During Q1 2025, the Company drilled 2,420 meters along the Stamford Bridge Zone on newly defined, high-priority targets. Thus far, drilling has covered 150 m of this newly identified mineralized structure and geological logging confirms the continuity of the structure. These results are beginning to form what can become a potential 1-kilometer “bridge” between the Buckreef Gold Main Zone, where current operations are ongoing, and the parallel, high-priority, gold mineralization zone known as the Eastern Porphyry. The latter also links to the Anfield Zone to the southeast, discovered in 2022. The Company has planned a geophysical survey campaign, which will focus on the Stamford Bridge trend line, as well as an area covering up to 500 meters to both the North and South sides of the trend line. Following the results of this campaign, a strategic drill campaign will resume on newly defined, high-priority targets. |
| · | Announced in F2023 near surface drilling results from the Anfield and Eastern Porphyry Zones, with highlights of 14 m @ 3.5 g/t including 3.0 m @ 10.9 g/t from 47 m from the Eastern Porphyry, and 2.94 m grading at 13.74 g/t, from 43.00 m in the Anfield zone (full results provided in Table 3). The zones are located at the northern end of a 3-kilometer-long zone of identified gold mineralization that is subparallel to the east of Buckreef Main Zone (Figure 7). The intercepts confirm multiple zones of strong mineralization towards the south-west of the known Eastern Porphyry deposit and the first diamond drill hole intersections on the Anfield Zone. Both mineralized zones are in close proximity to the Buckreef Main Zone and present an opportunity (assuming exploration success) to host future mineral resources outside of the Buckreef Main Zone. |
| · | Re-evaluated the Buckreef Main Zone for strike extensions, off-shoot splays, and at depth potential. The deposit is open in all directions (See Figure 7). To date, the Company has tested the NE Extension and successfully identified gold mineralization over an additional 300 meters. The deposit remains open along strike to the NE and future infill drilling is warranted. The SW extension has also been tested with wide-spaced drilling and the exploration program has returned encouraging results. The deposit now remains open along strike to the SW. |
| · | Collectively, between the NE extension and SW drilling the known strike extent of gold mineralization on the deposit structure has been expanded approximately 500 meters, or by nearly 30% since exploration recommenced. The Company will continue to identify areas offering the best opportunity to add gold ounces to the mineral resource inventory and commence an infill drilling program. |
| | Management’s Discussion and Analysis November 30, 2024 |
Best Drill Hole Results in History of Buckreef Gold – Announcement of Stamford Bridge Zone
During Q1 2025, the Company announced its best drill results ever, on a gtm basis with hole BMDD315 intersecting 37 m @ 6.86 g/t Au (253.82 gtm) from 130 m. This drill hole result is approximately 250 m east of the Buckreef Main Zone, host to Buckreef Gold’s 2M+ ounce Au Mineral Resource1 and where current operations are ongoing in the Main Pit. This drill hole result comes following the previous best drill result, with hole BMDD310 intersecting 35.5 m @ 5.48 g/t Au (194.54 gtm) from 64 m. This drill hole result is approximately 200 m east of the Buckreef Main Zone.
The Company also announced the discovery of a promising new gold mineralization shear zone, named the “Stamford Bridge Zone” at which current drill results are revealing geological characteristics and mineral alterations similar to that at Buckreef’s Main Zone. Holes BMDD315 and BMDD310, mentioned above, are located along the Stamford Bridge Zone.
Stamford Bridge Shear Zone Highlights:
| 1. | Hole BMDD315 intersected 37 m @ 6.86 g/t Au from 130 m; including 23 m @ 9.31 g/t Au from 139 m. |
| 2. | Hole BMDD310 intersected 35.5 m @ 5.48 g/t Au from 64 m; including 13m @8.06g/t Au. |
| 3. | Hole BMDD312 intersected 17.2 m @ 3.14 g/t Au from 164.6 m. |
| 4. | Geotechnical hole BMGT001 intersected 11.39 m @ 2.80 g/t Au from 104.0 m, and 22.0 m @ 2.36 g/t Au from 186.6 m. Both results are interpreted to be part of the Stamford Bridge Zone trend. |
| 5. | BMGT001 intersected the Buckreef Main Zone of 32.80 m @ 1.70 g/t Au (ending in mineralization) from 393.0 m. |
Subsequent to Q1 2025, the Company announced three additional drill hole results (BMDD319-321) providing further evidence of gold mineralization along the Stamford Bridge Zone as follows:
| 6. | Hole BMDD319 intersected 21.0 m @ 8.63 g/t Au from 81.0 m. |
| 7. | Hole BMDD320 intersected 20.5 m @ 5.14 g/t Au from 125.5 m. |
| 8. | Hole BMDD321 intersected 5.0 m @ 2.74 g/t Au from 157.0 m. |
The Stamford Bridge Zone was discovered through detailed geological mapping of the Main Pit floor that identified a trend of high-grade mineralization on the eastern side of the Main Pit trending 070 East (Figure 7). This is an exceptional discovery at the Buckreef Gold Project, resulting in the most significant mineralization identified within Buckreef Gold’s drill history.
The exploration team then identified that geotechnical hole BMGT001 (one of geotechnical holes drilled as part of the Buckreef Main Zone geotechnical study completed by Terrane Geoscience Inc.) located 160 m east of the Main Pit, drilled across the Stamford Bridge (Figure 7), and was subsequently relogged (Table 1). The logging confirmed the presence of three mineralization zones, including the Stamford Bridge Zone. The zones were sampled, and the assay results are summarized below (Table 1). To date, the new Stamford Bridge Zone has shown evidence of a sheared mineralized zone with similar geological characteristics to that found in the Main Zone, i.e., zones are measured as being near vertical with strong alteration.
Thus far, drilling has covered more than 150 m of this newly identified mineralized structure and geological logging confirms the continuity of the structure. These results are beginning to form what can become a potential 1-kilometer “bridge” between the Buckreef Gold Main Zone, where current operations are ongoing, and the parallel, high-priority, gold mineralization zone known as the Eastern Porphyry (see Figure 7). The latter also links to the Anfield Zone to the southeast, discovered in 2022.
| | Management’s Discussion and Analysis November 30, 2024 |
The Company has planned an expanded diamond drill program to test for further mineralization along this newly developing trend. Although these are early-stage results, and only two sections along the newly identified trend have been drilled, key interpretations include:
| 1. | The Stamford Bridge Zone is potentially a significant shear zone and geologically similar to the Buckreef Main Zone. It bridges the gap between Buckreef Main Zone and the Eastern Porphyry deposit to the Southeast. |
| 2. | Pinching and swelling of the Stamford Bridge Zone has been observed in the first section drilled; 4m wide in the first drillhole and over 17 m wide on the second drillhole down dip; and |
| 3. | The second section has intercepted a significant shear zone, over 35 m wide with distorted shear fabric by alteration overprint. Therefore, a minimal number of follow-up drillholes will be required to understand geometry of this new discovery. |
Figure 7: Buckreef Gold Showing Location of Stamford Bridge Zone and Drill Hole Results

| | Management’s Discussion and Analysis November 30, 2024 |
Figure 8. Drill sections - Stamford Bridge Zone (Drill Holes BMDD 310 – 312)

Figure 9: Cross-section results for drill hole BMDD315 - Stamford Bridge Zone

| | Management’s Discussion and Analysis November 30, 2024 |
Table 1: Summary of Results – Stamford Bridge
| Stamford Bridge Assay Results |
| Hole ID | Hole Type | Drill Holes Location | Sample Depth | Width (m) | Assay Grade (gpt) | Lithology | Comment |
| Easting (m) | Northing (m) | RL (m) | Azimuth | Dip | From (m) | To (m) |
| BMGT001 | DD | 391,780 | 9,658,453 | 1,218 | 270 | -50 | 105.0 | 115.4 | 10.4 | 3.03 | Msh | Stamford Bridge Mineralised shear zone with strong alteration |
| | | | | | | | 186.6 | 208.0 | 21.4 | 2.42 | Msh | |
| | | | | | | | 393.0 | 425.8 | 32.8 | 1.70 | Msh | Buckreef main shearzone |
| | | | | | | | | | | | | |
| BMDD309 | DD | 391,676 | 9,658,400 | 1,217 | 334 | -60 | 101.8 | 104.5 | 2.7 | 1.65 | Msh | |
| | | | | | | | | | | | | Mineralised shear zone with strong alteration |
| BMDD310 | DD | 391,723 | 9,658,418 | 1,217 | 334 | -60 | 64.5 | 100.0 | 35.5 | 5.48 | Msh | |
| | | | | | | | | | | | | |
| BMDD312 | DD | 391,685 | 9,658,382 | 1,216 | 335 | -60 | 164.6 | 180.8 | 16.2 | 3.14 | Msh | Mineralised shear zone with strong alteration |
| | | | | | | | | | | | | |
| BMDD315 | DD | 391,770 | 9,658,435 | 1,217 | 335 | -60 | 130.0 | 166.0 | 36.0 | 7.04 | Msh | Mineralised shear zone with strong alteration |
| | | | | | | | | | | | | |
| BMDD319 | DD | 391,729 | 9,658,404 | 1,217 | 335 | -60 | 76.0 | 79.0 | 3.0 | 1.21 | Msh | Mineralised shear zone with strong alteration |
| | | | | | | | | | | | | |
| BMDD319 | DD | 391,729 | 9,658,404 | 1,217 | 335 | -60 | 81.0 | 102.0 | 21.0 | 8.63 | Msh | Mineralised shear zone with strong alteration |
| | | | | | | | | | | | | |
| BMDD320 | DD | 391,765 | 9,658,447 | 1,218 | 335 | -60 | 125.5 | 146.0 | 20.5 | 5.14 | Msh | Mineralised shear zone with strong alteration |
| | | | | | | | | | | | | |
| BMDD321 | DD | 391,790 | 9,658,441 | 1,218 | 335 | -60 | 157.0 | 162.0 | 5.0 | 2.74 | Msh | Mineralised shear zone with strong alteration |
Notes: Sample Protocol QA/QC – see endnote 2. Sampled widths are not true widths.
Buckreef Gold Main Zone Drilling Results and Interpretation
The significant mineralized intercepts of the Buckreef Main Zone are as shown in Figure 10. It is evident that the deposit remains open on trend to the NE and SW. As previously noted, the Company had initiated a drill program, specifically to explore potential mineralization extensions to the NE and SW.
During F2023, the Company received assay results from its exploration program which has provided another extension of known mineralization on the Buckreef Gold Main Zone to the south.
The results are positive and significant for the Company as they continue to demonstrate: (i) continuity of gold mineralization along strike to the southwest of the Main Zone deposit; and (ii) continued gold mineralization under the (historical) South Pit. The deposit, therefore, remains ‘open at depth and on strike,’ and in combination with the 300 meter extension of the NE (announced previously) represents approximately a 30% increase in the Main Zone deposit strike length to over 2.0 kms.
Highlights include:
| | · | Hole BMDD250 intersected 34.8 m grading @ 1.26 g/t Au from 87.2 m, including 10.0 m grading @ 3.08 g/t from 89.9 m; and |
| | · | Hole BMDD275 intersected 16.5 m grading @ 2.01 g/t Au from 53.7 m, including 7.0 m grading @ 3.28 g/t from 56.0 m. |
Notes: Sample Protocol QA/QC – see endnotes. Sampled widths are not true widths.
Extension of Buckreef Main Zone South by a further 200 meters: Expansion of the gold deposit mineralization by 300 meters in the NE and 200 meters in the southwest (increases in the strike length of the Buckreef Main Zone deposit, or known gold mineralization, to over 2.0 kms) on the Buckreef Gold deposit which contains over 2.0 million ounces of gold in the Measured and Indicated Mineral Resources in the Buckreef Main Zone. The Company has drilled a total of 24 drill holes representing 4,255 meters in the southwest area, with full results provided in Table 2. The Buckreef Main Zone continues to be open further to the NE and extending to the Buckreef Special Mining License boundary and to the SW (see Figure 11). In the latter the trend is aligned to several historical artisanal scale miner pits.
| | Management’s Discussion and Analysis November 30, 2024 |
Table 2: Buckreef Main Zone South Drill Hole Sample Results Summary
| | | | | | | | | | | | | |
| Buckreef South Assay Results |
| Hole ID | Hole Type | Drill Holes Location | Sample Depth | Width (m) | Assay Grade (gpt) | Lithology | Comment |
| Easting (m) | Northing (m) | RL (m) | Azimuth | Dip | From (m) | To (m) |
| BMDD248 | DD | 391,071.5 | 9,657,427.0 | 1,214.5 | 306 | -58 | 143.0 | 148.0 | 5.0 | 0.45 | Msz | Shear zone with Mild alteration |
| | | | | | | | 192.5 | 198.0 | 5.5 | 0.38 | Msz | Shear zone with mild alteration |
| | | | | | | | | | | | | |
| BMDD249 | DD | 391,042.0 | 9,657,447.3 | 1,215.5 | 306 | -54 | 120.4 | 128.0 | 7.6 | 0.41 | Msz | Shear zone with mild alteration |
| | | | | | | | | | | | | |
| | | | | | | | | | | | | |
| BMDD250 | DD | 391,114.5 | 9,658,259.0 | 1,227.8 | 306 | -60 | 30.0 | 33.0 | 3.0 | 0.42 | Msz | Shear zone with mild alteration |
| | | | | | | | 87.2 | 122.0 | 34.8 | 1.26 | Msz | Mineralised shear zone with mild to strong alteration |
| | | | | | | | 89.0 | 99.0 | 10.0 | 3.08 | Msz | Shear zone with strong alteration |
| | | | | | | | | | | | | |
| BMDD252 | DD | 391,061.7 | 9,657,528.7 | 1,216.3 | 306 | -48 | 34.0 | 38.7 | 4.7 | 0.32 | Msz | Shear zone with mild alteration |
| | | | | | | | 79.5 | 99.0 | 19.5 | 0.74 | Msz | Mineralised Shear zone with mild alteration |
| | | | | | | | | | | | | |
| | | | | | | | | | | | | |
| BMDD253 | DD | 390,927.6 | 9,657,500.0 | 1,218.1 | 126 | -51 | 82.1 | 85.5 | 3.4 | 0.96 | Msz | Mineralised shear zone with mild alteration |
| | | | | | | | | | | | | |
| BMDD254 | DD | 391,137.4 | 9,657,821.0 | 1,220.2 | 306 | -57 | 56.0 | 59.8 | 3.8 | 1.3 | Msz | Mineralised shear zone with mild alteration |
| | | | | | | | | | | | | |
| BMDD256 | DD | 391,122.7 | 9,657,787.0 | 1,219.6 | 306 | -57 | 27.9 | 30.0 | 2.1 | 1.21 | Msz | Mineralised shear zone with mild to strong alteration |
| | | | | | | | 43.3 | 45.0 | 1.7 | 0.56 | | |
| | | | | | | | 54.0 | 57.7 | 3.7 | 1.73 | | |
| | | | | | | | 77.0 | 81.0 | 4.0 | 0.5 | | |
| | | | | | | | | | | | | |
| BMDD258 | DD | 391,078.9 | 9,657,620.0 | 1,217.3 | 306 | -50 | 23.0 | 25.0 | 2.0 | 1.76 | Msz | Mineralised shear zone with mild alteration |
| | | | | | | | 41.0 | 44.0 | 3.0 | 0.47 | | |
| | | | | | | | | | | | | |
| BMDD259 | DD | 391,156.0 | 9,657,714.0 | 1,217.7 | 306 | -53 | 82.0 | 83.5 | 1.5 | 0.82 | | |
| | | | | | | | 108.0 | 110.0 | 2.0 | 0.71 | Msz | Mineralised shear zone with mild alteration |
| | | | | | | | 131.0 | 136.0 | 5.0 | 0.52 | | |
| | | | | | | | | | | | | |
| BMDD267 | DD | 390,966.4 | 9,657,379.9 | 1,213.7 | 305 | -62 | 165.0 | 167.0 | 2.0 | 1.41 | Msz | Shear zone with mild alteration |
| | | | | | | | | | | | | |
| BMDD273 | DD | 390,969.4 | 9,657,256.9 | 1,210.3 | 306 | -57 | 36.1 | 37.7 | 1.6 | 0.49 | Msz | Shear zone with mild alteration |
| | | | | | | | | | | | | |
| BMDD274 | DD | 390,918.3 | 9,657,289.7 | 1,212.0 | 306 | -57 | 39.4 | 41.0 | 1.7 | 0.78 | Msz | Shear zone with mild alteration |
| | | | | | | | | | | | | |
| BMDD275 | DD | 390,940.4 | 9,657,216.0 | 1,210.0 | 306 | -57 | 27.5 | 29.2 | 1.8 | 0.51 | | |
| | | | | | | | 43.0 | 52.1 | 9.1 | 0.58 | | |
| | | | | | | | 53.7 | 70.2 | 16.5 | 2.01 | Msz | Mineralised shear zone with mild to strong alteration |
| | | | | | | | 56.0 | 63.0 | 7.0 | 3.27 | | |
| | | | | | | | 80.3 | 84.6 | 4.3 | 0.96 | | |
| | | | | | | | | | | | | |
| BMDD278 | DD | 390,967.1 | 9,657,195.1 | 1,209.2 | 306 | -57 | 63.6 | 71.6 | 8.1 | 0.65 | | |
| | | | | | | | 83.0 | 89.3 | 6.3 | 1.00 | Msz | Mineralised shear zone with mild alteration |
| | | | | | | | 128.0 | 131.0 | 3.0 | 0.74 | | |
| | | | | | | | | | | | | |
| BMDD279 | DD | 390,996.1 | 9,657,175.3 | 1,208.9 | 306 | -57 | 41.0 | 46.0 | 5.0 | 1.13 | | |
| | | | | | | | 48.0 | 51.0 | 3.0 | 0.63 | | |
| | | | | | | | 140.6 | 142.0 | 1.4 | 2.72 | Msz | Mineralised shear zone with mild to strong alteration |
| | | | | | | | 148.9 | 159.4 | 10.5 | 0.96 | | |
| | | | | | | | | | | | | |
| | | | | | | | | | | | | |
Notes: Sample Protocol QA/QC – see endnote 2. Sampled widths are not true widths.
| | Management’s Discussion and Analysis November 30, 2024 |
Table 3: Buckreef Eastern Porphyry and Anfield Zone Sample Results Summary
| Eastern Porphyry Significant Assay Results |
| Hole ID | Hole Type | Drill Holes Location | Sample Depth | Width (m) | Assay Grade (gpt) | Lithology | Comment |
| Easting (m) | Northing (m) | RL (m) | Azimuth | Dip | From (m) | To (m) |
| | | | | | | | | | | | | |
| BMDD297 | DD | 391955 | 9657841 | 1223 | 126 | 55 | 12.90 | 19.00 | 6.10 | 1.41 | FP | Oxidised Felsic pophyry with preserved shear fabric hosting quartz veins |
| | | | | | | | 61.40 | 64.00 | 2.60 | 2.08 | FP | Slightly sheared felsic porphyry with Quartz, Carbonate pyrite alterations. |
| | | | | | | | 70.00 | 73.82 | 3.82 | 3.10 | FP |
| | | | | | | | 98.80 | 113.50 | 14.70 | 1.22 | FP | Sheared unit of Felsic intrussive interfingering with mafic volanics. Quartz carbonate and pyrite altered. |
| | | | | | | | | | | | |
| | | | | | | | | | | | | |
| BMDD298 | DD | 391997 | 9657844 | 1223 | 124 | 60 | 27.00 | 41.00 | 14.00 | 3.48 | FP | Oxidised Felsic porphyry with preserved shear fabric hosting quartz veins |
| | | | | Including | 27.00 | 30.00 | 3.00 | 10.96 | |
| | | | | | | | 47.00 | 72.23 | 25.23 | 1.62 | FP | Weakly sheared felsic porphyry with moderate to strong Quatrz, Carbonate pyrite alterations. |
| | | | | | | | 84.00 | 89.00 | 5.00 | 1.07 | FP |
| | | | | | | | | | | | | |
| BMDD299 | DD | 391901 | 9657813 | 1223 | 126 | 60 | 21.61 | 28.00 | 6.39 | 1.04 | FP | Moderate to weakly oxidised Felsic pophyry with preserved shear fabric |
| | | | | | | | | | | | |
| | | | | | | | | | | | | |
| BMDD300 | DD | 391989 | 9657821 | 1191 | 126 | 55 | 33.65 | 37.26 | 3.61 | 6.80 | FP | Moderately oxidised Felsic pophyry with preserved shear fabric and hosting quartz vein |
| Anfield Prospect Significant Intercept Assay Results |
| Hole ID | Hole Type | Drill Holes Location | Sample Depth | Width (m) | Assay Grade (gpt) | Lithology | Comment |
| Easting (m) | Northing (m) | RL (m) | Azimuth | Dip | From (m) | To (m) |
| AFDD001 | DD | 391180.90 | 9657185.00 | 1210.275 | 135 | -60 | 43 | 45.94 | 2.94 | 13.74 | MB | Sheared mafic volcanic rock hosting quartz vein |
| | | | | | | | | | | | | |
| AFDD002 | DD | 391164.50 | 9657169.00 | 1210.136 | 135 | -60 | 42.71 | 44.54 | 1.83 | 1.17 | MB | Sheared mafic volcanic rock |
| | | | | | | | 83.42 | 88.34 | 4.92 | 0.9 | | |
| | | | | | | | | | | | | |
| AFDD004 | DD | 391209.40 | 9657173.00 | 1209.381 | 315 | -60 | 32.45 | 38.54 | 6.09 | 1.41 | MB | Sheared mafic volcanic rock |
| | | | | | | | | | | | | |
| AFDD005 | DD | 391191.90 | 9657155.00 | 1209.368 | 315 | -60 | 17.09 | 21.35 | 4.26 | 1.01 | MB | Sheared mafic volcanic rock hosting quartz vein |
| | | | | | | | 42.8 | 44.8 | 2.00 | 2.53 | | Sheared mafic volcanic rock |
| | | | | | | | 47.09 | 51.15 | 4.06 | 1.27 | | |
| | | | | | | | | | | | | |
| AFDD007 | DD | 391108.36 | 9657186.36 | 1210.026 | 126 | -55 | 137.5 | 138.5 | 1.00 | 5.71 | MB | Sheared mafic volcanic rock with strong quartz carbonate pyrite alteration |
Notes: Sample Protocol QA/QC – see endnote 2. Sampled widths are not true widths.
| | Management’s Discussion and Analysis November 30, 2024 |
Figure 10: NE Buckreef Main Zone and location of the Eastern Porphyry - Anfield Zone trend

| | Management’s Discussion and Analysis November 30, 2024 |
Figure 11: Map Showing Mineralization Extension and Location of Drill Results at Buckreef Main Zone Southwest Extension

| | Management’s Discussion and Analysis November 30, 2024 |
Larger Project – Metallurgical Results, Ongoing Test Work and Results of Metallurgical Variability Study
The Company continues to work on its mid-to-long-term larger project and has received assay results from its 19-hole metallurgical variability sampling program on the Buckreef Main Zone. The samples were dispatched to SGS South Africa for the metallurgical test work.
The results are positive and significant for the Company because they continue to demonstrate: (i) continuity of mineralization down dip and along strike of the deposit; and (ii) excellent width and grade of mineralization.
Highlights include:
| · | Hole BMMT015 intersected 28.0 m grading @ 10.68 g/t Au from 0 m; |
| · | Hole BMMT020 intersected 123.0 m grading @ 2.69 g/t Au from 3 m; |
| · | Hole BMMT009 intersected 121.0 m grading @ 2.96 g/t Au from 3 m; |
| · | Hole BMMT022 intersected 106.0 m grading @ 4.19 g/t Au from 85 m, 77 m grading @ 3.09 g/t from 241 m; and |
| · | Hole BMMT021 intersected 90.0 m grading @ 1.56 g/t Au from 139 m. |
Detailed results are shown in Table 4 and locations are shown in Figure 12.
Figure 12: Map Showing Location of Metallurgical Drill Holes and Their Result Highlights

| | Management’s Discussion and Analysis November 30, 2024 |
Table 4: Metallurgy Drill Hole Sample Results Summary
| Metallurgy Samples Assay Results |
| Hole ID | Hole Type | Drill Holes Location | Sample Depth | Width (m) | Assay Grade (gpt) | Lithology | Comment |
| Easting (m) | Northing (m) | RL (m) | Azimuth | Dip | From (m) | To (m) |
| BMMT004 | DD | 391,096.8 | 9,657,894.8 | 1,217.7 | 127 | -72 | 4.0 | 22.0 | 17.0 | 2.17 | Msz | Oxidised and Mineralised shear zone |
| | | | | | | | | | | | | |
| BMMT005 | DD | 391,134.7 | 9,657,947.9 | 1,217.6 | 119 | -88 | 0.0 | 21.0 | 21.0 | 0.52 | Msz | Oxidised and Mineralised Shear zone |
| | | | | | | | | | | | | |
| BMMT006 | DD | 391,184.0 | 9,658,008.0 | 1,217.7 | 303 | -77 | 4.0 | 15.6 | 11.6 | 0.68 | Msz | Oxidised and Mineralised Shear zone |
| | | | | | | | | | | | | |
| BMMT007 | DD | 391,223.8 | 9,658,080.1 | 1,214.7 | 304 | -81 | 0.0 | 8.0 | 8.0 | 0.39 | Msz | Oxidised and Mineralised Shear zone |
| | | | | | | | | | | | | |
| BMMT008 | DD | 391,292.3 | 9,658,148.7 | 1,220.1 | 306 | -77 | 2.0 | 94.0 | 89.0 | 1.72 | Msz | Mineralised shear zone with Quartz Veining |
| | | | | | | | | | | | | |
| BMMT009 | DD | 391,337.4 | 9,658,225.5 | 1,222.1 | 303 | -82 | 3.0 | 124.0 | 121.0 | 2.96 | Msz | Oxidised and Mineralised shear zone |
| | | | | | | | 127.0 | 148.0 | 21.0 | 0.79 | Msz | Shear zone with mild alteration |
| | | | | | | | 152.0 | 157.0 | 5.0 | 0.2 | Msz | Shear zone with mild alteration |
| | | | | | | | | | | | | |
| BMMT010 | DD | 391,194.4 | 9,658,008.3 | 1,217.5 | 329 | -87 | 69.0 | 86.0 | 17.0 | 3.82 | Msz | Mineralised shear zone with strong alteration |
| | | | | | | | 87.0 | 97.0 | 10.0 | 0.82 | Msz | Shear zone with mild alteration |
| | | | | | | | 100.0 | 129.0 | 29.0 | 3.28 | Msz | Mineralised shear zone with strong alteration |
| | | | | | | | 144.0 | 170.0 | 26.0 | 3.59 | Msz | Mineralised shear zone with strong alteration |
| | | | | | | | | | | | | |
| BMMT011 | DD | 391,112.2 | 9,657,940.2 | 1,217.5 | 136 | -67 | 20.0 | 84.0 | 64.0 | 1.17 | Msz | Mineralised shear zone with strong alteration |
| | | | | | | | 85.0 | 114.0 | 29.0 | 0.37 | Msz | Shear zone with mild alteration |
| | | | | | | | 127.0 | 137.0 | 10.0 | 2.08 | Msz | Mineralised shear zone with strong alteration |
| | | | | | | | | | | | | |
| BMMT012 | DD | 391,253.7 | 9,658,097.7 | 1,215.1 | 242 | -75 | 4.0 | 28.0 | 24.0 | 2.28 | Msz | Mineralised shear zone with Quartz Veining |
| | | | | | | | | | | | | |
| BMMT014 | DD | 391,055.0 | 9,657,666.9 | 1,218.3 | 90 | -78 | 27.0 | 42.0 | 15.0 | 0.59 | Msz | Mineralised shear zone with mild alteration |
| | | | | | | | | | | | | |
| BMMT015 | DD | 391,231.1 | 9,658,072.9 | 1,215.3 | 310 | -80 | 0.0 | 28.0 | 28.0 | 10.68 | Msz | Mineralised shear zone with Quartz Veining |
| | | | | | | | | | | | | |
| BMMT016 | DD | 391,353.7 | 9,658,331.9 | 1,223.4 | 306 | -81 | 7.0 | 41.0 | 34.0 | 2.03 | Msz | Mineralised shear zone with strong alteration |
| | | | | | | | 49.0 | 76.0 | 27.0 | 1.45 | | Mineralised shear zone with strong alteration |
| | | | | | | | 96.0 | 101.0 | 5.0 | 0.37 | Msz | Shear zone with mild alteration |
| | | | | | | | | | | | | |
| BMMT017 | DD | 391,469.3 | 9,658,387.0 | 1,219.9 | 142 | -80 | 4.0 | 26.0 | 22.0 | 3.30 | Msz | Oxidised and Mineralised shear zone |
| | | | | | | | | | | | | |
| BMMT018 | DD | 391,521.8 | 9,658,681.8 | 1,218.6 | 126 | -82 | 4.0 | 33.0 | 29.0 | 2.97 | Msz | Mineralised shear zone with Quartz Veining |
| | | | | | | | 43.0 | 53.0 | 10.0 | 0.34 | Msz | Mineralised shear zone with mild alteration |
| | | | | | | | 57.0 | 141.8 | 84.8 | 0.64 | Msz | Mineralised shear zone with mild alteration |
| | | | | | | | 143.0 | 169.0 | 26.0 | 0.63 | Msz | Mineralised shear zone with mild alteration |
| | | | | | | | | | | | | |
| BMMT019 | DD | 391,464.1 | 9,658,771.4 | 1,220.0 | 130 | -67 | 50.0 | 78.0 | 28.0 | 2.33 | Msz | Mineralised shear zone with strong alteration |
| | | | | | | | 86.0 | 91.0 | 5.0 | 0.43 | Msz | Mineralised shear zone with mild alteration |
| | | | | | | | 100.0 | 111.0 | 11.0 | 0.55 | Msz | Mineralised shear zone with mild alteration |
| | | | | | | | 135.0 | 142.0 | 7.0 | 0.77 | Msz | Mineralised shear zone with mild alteration |
| | | | | | | | 161.0 | 167.0 | 6.0 | 0.55 | Msz | Mineralised shear zone with mild alteration |
| | | | | | | | 200.0 | 212.0 | 12.0 | 0.75 | Msz | Mineralised shear zone with mild alteration |
| | | | | | | | 214.0 | 218.0 | 4.0 | 0.32 | Msz | Mineralised shear zone with mild alteration |
| | | | | | | | 222.0 | 229.8 | 7.8 | 0.55 | Msz | Mineralised shear zone with mild alteration |
| | | | | | | | | | | | | |
| BMMT020 | DD | 391,519.4 | 9,658,607.6 | 1,219.9 | 126 | -80 | 3.0 | 126.0 | 123.0 | 2.69 | Msz | Mineralised shear zone with strong alteration |
| | | | | | | | 128.0 | 130.0 | 2.0 | 1.55 | Msz | Mineralised shear zone with strong alteration |
| | | | | | | | 152.0 | 154.0 | 2.0 | 2.00 | Msz | Mineralised shear zone with strong alteration |
| | | | | | | | 202.0 | 208.0 | 6.0 | 2.82 | Msz | Mineralised shear zone with strong alteration |
| | | | | | | | | | | | | |
| BMMT021 | DD | 391,493.7 | 9,658,549.5 | 1,220.9 | 134 | -85 | 2.0 | 80.0 | 78.0 | 0.58 | Msz | Mineralised shear zone with quartz veining |
| | | | | | | | 88.0 | 91.0 | 3.0 | 0.33 | Msz | Mineralised shear zone with quartz veining |
| | | | | | | | 118.0 | 126.0 | 8.0 | 0.54 | Msz | Mineralised shear zone with mild alteration |
| | | | | | | | 139.0 | 229.0 | 90.0 | 1.56 | Msz | Mineralised shear zone with strong alteration |
| | | | | | | | 238.0 | 245.0 | 7.0 | 0.95 | Msz | Mineralised shear zone with mild alteration |
| | | | | | | | | | | | | |
| BMMT022 | DD | 391,467.7 | 9,658,451.6 | 1,221.0 | 127 | -82 | 42.0 | 54.0 | 12.0 | 0.3 | Msz | Mineralised shear zone with mild alteration |
| | | | | | | | 58.0 | 72.0 | 14.0 | 0.76 | Msz | Mineralised shear zone with mild alteration |
| | | | | | | | 85.0 | 191.0 | 106.0 | 4.19 | Msz | Mineralised shear zone with strong alteration |
| | | | | | | | 194.0 | 211.0 | 17.0 | 1.16 | Msz | |
| | | | | | | | 213.0 | 240.0 | 27.0 | 1.78 | Msz | Mineralised shear zone with strong alteration |
| | | | | | | | 241.0 | 318.0 | 77.0 | 3.09 | Msz | Mineralised shear zone with strong alteration |
| | | | | | | | 321.0 | 338.0 | 17.0 | 2.95 | Msz | Mineralised shear zone with strong alteration |
Notes: Sample Protocol QA/QC – see endnote 2. Sampled widths are not true widths. Of 19 holes drilled, 18 are reported, with the remaining hole unreported due to an incomplete intersection of the Main Zone.
| | Management’s Discussion and Analysis November 30, 2024 |
During Q1 2025, the Company announced completion of the ongoing metallurgical variability study3 at the Buckreef Gold Project, with results confirming the potential for excellent gold recovery rates for the processing of sulphide ore. Metallurgical test work on the sulphide ore portion of the project, which encompasses approximately 90% of the Buckreef Main Zone’s 2M+ ounce Au Measured and Indicated Mineral Resources1, has been an important area of focus for the Company, as it continues to grow the project in a low-risk, low-cost, value accretive manner. As a key value driver for the Company, metallurgical testing began at the Buckreef Main Zone in June of 2021, whereby a straightforward flowsheet comprising of crush, grind, flotation, regrind and CIL was developed by SGS Canada. In a laboratory, bulk sample testing returned gold recoveries between 85.3% to 95.4%. In June 2023, a 6,500-tonne bulk sample of sulphide ore was tested on site at Buckreef Gold’s existing milling facility. This successful test reported gold recoveries from sulphide ore of 88.7%. The recent and much larger metallurgical variability study reported on in October 2024, reiterates results from past test work and is now of greater importance as Buckreef Gold is processing a higher proportion of sulphide ore (80% sulphides to 20% oxides) at its newly expanded milling facility. As part of this recent phase of test work, drill core from a total of 18 metallurgical holes (2,367 meters) along the entire strike of the Buckreef Main deposit, were blended into samples that were then processed and tested against variable benchmarks within a processing flowsheet. Highlights from the results demonstrate:
| · | A finer grind size leads to a higher gold recovery: Batch samples were each milled at a specific grind size, incrementally finer in nature, resulting in incrementally improved gold recovery grades. The gold recovery rate increased from 81.2% to 92.5% as the grind became finer from 80% - 53 μm to 80% - 5 μm. |
| · | Results in line with current operational performance: For the 15 composites tested in the most recent study, recovery rates ranged from 79.9% to 87.0% in a gravity + floatation + leaching test at a grind size of 80% - 75 μm, which is consistent with what is being experienced in current operations. Buckreef Gold is also experiencing a relatively consistent tailings grade, regardless of head grade, at a grind size of 80% - 75 μm, further supporting the fact that increased grinding will lead to higher recovery rates. |
| · | Increasing gold recovery in current operations: Test results showed that the gold is finely disseminated in the pyrite and improved recoveries can be achieved by grinding finer below 25µm. An upgrade of the existing Buckreef Process Plant flowsheet to include rougher flotation and subsequent regrinding of the flotation concentrate, by using the regrind ball mill, is expected to achieve the targeted grind size (gold liberation) with minimum energy consumption. The Company is currently developing finer grinding initiatives to achieve higher gold recoveries. |
| · | Low cost expansion opportunities can continue: The positive grade recovery results and increased understanding of the metallurgy of the Buckreef Gold Project provide the Company with the optionality for near term mine planning of the sulphide ore. The results also speak to the robust project economics of the Buckreef Gold Project. The Company is currently in the process of evaluating ways to expedite potential future plant expansions and optimizations. |
| · | Positive outlook for additional Mineral Resources: This also bodes well for future Mineral Resource development, as the Company continues to focus on development of other high-priority gold zones, such as Stamford Bridge, Anfield and Eastern Porphyry, where brownfield exploration programs returned very similar geologic and mineralization characteristics as the Main Zone, to which similar milling processes could apply. |
| | Management’s Discussion and Analysis November 30, 2024 |
Geotechnical Analysis Field Work
SGSC – Terrane Geoscience completed the geotechnical analysis work for the deeper pit design. Field work included a drilling program that constituted 5 holes for 1,571 meters in 2023. Associated detailed field work involving packer tests, downhole televiewer, co-axial rock strength testing and standard geotechnical logging of the footwall and hanging wall lithologies has been completed and analysis of results continues. Selected samples have been sent to a geomechanical laboratory in Canada for further analysis. The results of this work will be instrumental in determining pit slope angles for the ultimate pit. This work is now complete, and results are being incorporated into long term mine plans for optimal and safe open pit ore extraction.
Financial Highlights – First Quarter 2025
For the three months ended November 30, 2024, Buckreef Gold poured 4,841 ounces of gold and sold 4,813 ounces of gold at an average realized price (net)1 of $2,653 per ounce. The Company recognized revenue of $12.5 million for the three months ended November 30, 2024.
Cost of sales, which includes production costs, royalties and depreciation, was $7.7 million generating a gross profit of $4.8 million or 39% during Q1 2025. After general and administrative expenses, revaluation of derivative financial instruments, foreign exchange, interest and other expenses, and income taxes, the Company recorded net income of $2.1 million for Q1 2025.
Mining costs per tonne of $4.00 in Q1 2025 was lower than the prior year comparative period (Q1 2024: $4.25) primarily due to the impact of higher tonnes mined on the fixed portion of the mining contractor management fee. The Company expects mining costs per tonne to improve over time as owner operated equipment will be utilized to provide cost effective support for site development projects as well as plant feed operations. Processing costs per tonne of $12.60 in Q1 2025 were significantly lower than the prior year comparative period (Q1 2024: $ 26.56 per tonne) predominantly due to greater economies of scale following final commissioning of the expanded 2,000 tpd processing facility. The higher processing plant throughput of 1,703 tpd in Q1 2025 (Q1 2024: 817) provided a higher proportion of overhead cost absorption, thus benefiting processing cost per tonne in Q1 2025.
Q1 2025 ounces sold (4,813 ounces) generated positive operating cash flow of $2.4 million. Positive operating cash flow is being used to fund value creating activities, including plant expansions, exploration, and advancing the larger project.
As at November 30, 2024, the Company had a cash balance of $6.8 million and negative working capital of $0.8 million after adjusting for derivative liabilities which will only be settled by issuing equity of the Company and for the current portion of deferred revenue related to the OCIM prepaid gold purchase agreement (non-cash). Working capital in Q1 2025 was impacted by a scheduled stripping campaign focused on accelerating the pit expansion to the north end of the main zone in the second layback to expose ore for H2 2025. As a result of the increased stripping activity, the Company mined a higher proportion of waste tonnes, which is expected to provide access to higher grade ore blocks in the second half of F2025, benefiting production starting in Q3 and Q4 2025. As a result, working capital is expected to improve in H2 2025.
Capital Expenditures
During the three months ended November 30, 2024, the Company incurred a total of $3.7 million in cash capital expenditures (including value added tax). Net additions increased as the Company continued to invest in infrastructure and development for the Buckreef Gold property during the quarter, including expenditures related to finalizing the plant expansion to 2,000 tpd, equipment leases for mobile equipment to supplement the contractor-owned fleet with an owner’s operated fleet for Buckreef’s mining operations, processing plant security system upgrades, dewatering pumps to support mining activity during the wet season and construction of a significantly expanded TSF to provide storage until early Q1 2026.
| | Management’s Discussion and Analysis November 30, 2024 |
Selected Financial Information
The following information has been extracted from the Company’s interim condensed consolidated financial statements for the three months ended November 30, 2024, prepared in accordance with IFRS.
| $(000's) | | | As at and for the
three months ended November 30, 2024 | | | | As at and for the three months ended November 30, 2023 | |
| Net income (loss) and comprehensive income (loss) attributable to shareholders | | | 981 | | | | (966 | ) |
| Basic income (loss) per share | | | 0.00 | | | | 0.00 | |
| Total assets | | | 102,632 | | | | 87,063 | |
| Total long term financial liabilities | | | 13,874 | | | | 6,382 | |
Financial Results
Three months ended November 30, 2024
| | | Three months ended November 30, | |
| | | 2024 | | | 2023 | |
| Revenue | | $ | 12,528 | | | $ | 9,404 | |
| Cost of sales | | | (7,694 | ) | | | (5,687 | ) |
| Gross profit | | | 4,834 | | | | 3,717 | |
| General and administrative expense | | | (1,425 | ) | | | (2,211 | ) |
| Change in fair value of derivative financial instruments | | | 819 | | | | 199 | |
| Foreign exchange | | | (77 | ) | | | (80 | ) |
| Interest, net and other expense | | | (321 | ) | | | (473 | ) |
| Income tax expense | | | (1,693 | ) | | | (1,191 | ) |
| Net income and comprehensive income | | $ | 2,137 | | | $ | (39 | ) |
| Net income and comprehensive income | | | | | | | | |
| attributable to non-controlling interests | | | 1,156 | | | | 927 | |
| Net (loss) income and comprehensive (loss) income | | | | | | | | |
| attributable to shareholders | | | 981 | | | | (966 | ) |
Revenue
For the three months ended November 30, 2024, the Company recognized revenue of $12.5 million (Q1 2024: $9.4 million). The increase in revenue is primarily related to a higher average realized gold price compared to the prior year comparative period. During the period, the Company sold 4,813 ounces of gold (Q1 2024: 4,895 ounces) at an average realized price (net)1 of $2,653 per ounce (Q1 2024: $1,942 per ounce).
Cost of sales
Cost of sales for the three months ended November 30, 2024, was $7.7 million (Q1 2024: $5.7 million) and is comprised of production costs, (including mining, processing and site general and administrative costs), royalties and depreciation. Assets are depreciated on a straight-line basis over their useful life or depleted on a units-of-production basis over the reserves to which they relate.
| | Management’s Discussion and Analysis November 30, 2024 |
For the three months ended November 30, 2024, the Company recorded production costs of $5.8 million (Q1 2024: $4.5 million) and royalties of $0.9 million (Q1 2024: $0.7 million) based on a 7.3% statutory royalty rate in Tanzania.
Cash cost1 which includes production costs and royalties were $1,410 per ounce (Q1 2024: $1,063 per ounce). The increase in cost of sales and cash cost1 compared to the prior year comparative period is primarily related to a decrease in head grade (Q1 2025: 1.29 g/t, 1 2024: 2.57 g/t) and recovery rates (Q1 2025: 72%, Q1 2024: 81%), partially offset by a decrease in mining cost per tonne (Q1 2025: $4.00, Q1 2024: $4.25) and processing cost per tonne (Q1 2025: $12.60, Q1 2024: $26.56). Royalties were higher due to the impact of the 7.3% statutory royalty rate on higher quarterly revenue as a result of a higher average realized price (net)1 of $2,653 per ounce (Q1 2024: $1,942 per ounce). While cost of sales increased relative to the prior year comparative period, gross profit increased to $4.8 million (Q1 2024: $3.7 million) as the Company benefitted from a higher average realized gold price.
On November 1, 2022, the Company declared commercial production for the processing plant at Buckreef after successful construction, commissioning and ramp-up of processing to a steady state throughput at nameplate capacity. Upon declaration of commercial production, capitalization of mine development costs ceases, and depreciation of capitalized mine development costs commences. For the three months ended November 30, 2024, the Company recorded depreciation of $0.9 million (Q1 2024: $0.5 million).
General and administrative expenses
During the three months ended November 30, 2024, the Company recorded general and administrative expenses of $1.4 million compared to $2.2 million for the prior year period. The variance compared to the prior year period was mainly due to a decrease in share based expense as a result of timing of vesting of equity based compensation for certain key management personnel in connection with their employment contracts.
Change in fair value of derivative financial instruments
During the three months ended November 30, 2024, the Company recorded a gain on change in fair value of derivative financial instruments of $0.8 million compared to a gain of $0.2 million in the prior year period. The gain on revaluation of derivative financial instruments is mainly related to revaluation of derivative warrant liabilities and was principally due to a quarterly decrease in the Company’s share price (Q1 2025: $0.36, Q4 2024: $0.39), a reduction in the remaining term of the warrants (due to the passage of time), and a decrease in the expected volatility assumption under the Black Scholes option pricing model.
Interest and other expense
During the three months ended November 30, 2024, the Company recorded interest and other expense of $0.3 million compared to $0.5 million in the prior year period. This is primarily due to accretion of deferred revenue related to the OCIM prepaid gold purchase agreement and accretion for the provision for reclamation recorded during Q4 2024.
Income tax expense
Income tax expense is recognized based on management’s estimate of the weighted average annual income tax rate expected for the full financial year. During the three months ended November 30, 2024, the Company recorded income tax expense of $1.7 million (Q1 2024: $1.2 million), comprised of a current income tax expense of $0.4 million (Q1 2024: $0.3 million) and deferred income tax expense of $1.3 million (Q1 2024: $0.9 million) based on current Tanzanian statutory tax rates.
| | Management’s Discussion and Analysis November 30, 2024 |
Net income and comprehensive income
The Company reported net income for the three month period ended November 30, 2024, of $2.1 million ($1.0 million net income attributable to shareholders, basic and diluted earnings per share of $0.00) compared to a net loss of $nil in the prior year period ($1.0 million net loss attributable to shareholders, basic and diluted loss per share of $0.00). The increase in net income compared to the prior year comparative period is primarily due to an increase in gross profit of $4.8 million (Q1 2024: $3.7 million) resulting from an increase in average realized price (Q1 2025: $2,653, Q1 2024: $1,942 per ounce). This, combined with lower general and administrative expenses and an increased gain on change in fair value of derivative financial instruments, was partially offset by an increase in income tax expense following an increase in net income realized during Q1 2025.
Summary of Quarterly Results
| ($(000's), except per share amounts) | | | | | | | | | | | | | | | | | | | | | | | | |
| US$ unless otherwise stated | | 2025 Q1 | | | 2024 Q4 | | | 2024 Q3 | | | 2024 Q2 | | | 2024 Q1 | | | 2023 Q4 | | | 2023 Q3 | | | 2023 Q2 | |
| | | | | | | | | | | | | | | | | | | | | | | | | |
| Net income (loss) and comprehensive income (loss) | | | 2,137 | | | | 3,284 | | | | (1,656 | ) | | | 1,921 | | | | (39 | ) | | | 2,309 | | | | (374 | ) | | | (50 | ) |
| Net income (loss) and comprehensive income (loss) attributable to: | | | | | | | | | | | | | | | | | | | | | | | | | | | | | | | | |
| Non-controlling interests | | | 1,156 | | | | 1,229 | | | | 983 | | | | 841 | | | | 927 | | | | 908 | | | | 890 | | | | 1,349 | |
| Common shareholders | | | 981 | | | | 2,055 | | | | (2,639 | ) | | | 1,080 | | | | (966 | ) | | | 1,401 | | | | (1,264 | ) | | | (1,399 | ) |
| Net income (loss) and comprehensive income (loss) | | | 2,137 | | | | 3,284 | | | | (1,656 | ) | | | 1,921 | | | | (39 | ) | | | 2,309 | | | | (374 | ) | | | (50 | ) |
During the three months ended November 30, 2024, the Company reported net income of $2.1 million ($1.0 million net income attributable to shareholders), compared to net income of $3.3 million ($2.1 million net income attributable to shareholders) in the prior quarter (Q4 2024). The decrease in net income compared to the prior quarter is primarily due to a decrease in gross profit following lower ounces of gold sold (Q1 2025: 4,813, Q4 2024: 5,715), partially offset by an increase in average realized price (Q1 2025: $2,653, Q4 2024: $2,412), combined with a lower gain on change in fair value of derivative financial instruments of $0.8 million (Q4 2024: $1.9 million) due to a decrease in the Company’s share price from Q4 2024 to Q1 2025 (Q1 2025: $0.36, Q4 2024: $0.39).
Liquidity and Capital Resources
At November 30, 2024, the Company had $6.8 million of cash (August 31, 2024: $8.3 million) and negative working capital of $0.8 million after adjusting for derivative liabilities which will only be settled by issuing equity of the Company and for the current portion of deferred revenue related to the OCIM prepaid gold purchase agreement (non-cash) (August 31, 2024: $0.4 million). Working capital in Q1 2025 was impacted by a scheduled stripping campaign focused on accelerating the pit expansion to the north end of the main zone in the second layback to expose ore for H2 2025. As a result of the increased stripping activity, the Company mined a higher proportion of waste tonnes, which is expected to provide access to higher grade ore blocks in the second half of F2025, benefiting production starting in Q3 and Q4 2025. As a result, working capital is expected to improve in H2 2025.
The decrease in cash of $1.5 million over August 31, 2024, was primarily due to an increase in operating cash flow (Q1 2024: $2.4 million), offset by an increase in capital investment for infrastructure and development at Buckreef Gold (three months ended November 30, 2024: $3.7 million). During the three months ended November 30, 2024, the Company poured 4,841 ounces of gold and sold 4,813 ounces of gold which contributed to positive operating cash flow of $2.4 million. The increase in operating cash flow was more than offset by an increase in capital expenditures during Q1 2025. For the three months ended November 30, 2024, the Company incurred a total of $3.7 million in cash capital expenditures, mainly related to expenditures in finalizing the plant expansion to 2,000 tpd, equipment leases for mobile equipment to supplement the contractor-owned fleet with an owner’s operated fleet for Buckreef’s mining operations, processing plant security system upgrades, dewatering pumps to support mining activity during the wet season and construction of a significantly expanded TSF to provide storage until early Q1 2026.
| | Management’s Discussion and Analysis November 30, 2024 |
To help supplement the Company’s liquidity and to fund productivity enhancing purchases, during Q4 2022 the Company entered into a $5.0 million prepaid Gold Doré Purchase Agreement with OCIM. The Agreement required that funds to be made available to the Company in two tranches. After fully settling $2.5 million drawn on the first tranche of the Agreement, on September 26, 2023, the Company drew an additional $0.5 million from the second tranche of the Agreement in exchange for delivering 23.5 ounces of gold per month, commencing December 2023, for a total of 305.4 ounces of gold over 13 months. On November 29, 2023, the Company drew an additional $1.0 million from the second tranche of the Agreement in exchange for delivering 44.1 ounces of gold per month, commencing February 2024, for a total of 573.2 ounces of gold over 13 months. On May 6, 2024, the Company amended the terms of the Agreement to allow for additional prepayments and drew $1.0 million in exchange for delivering 40.85 ounces of gold per month, commencing June 2024, for a total of 490.2 ounces of gold over 12 months. During Q1 2025, the Company drew an additional $0.5 million in exchange for delivering 17.0 ounces of gold per month, commencing November 2024, for a total of 204.1 ounces of gold over 12 months. The $0.5 million drawdown in Q1 2025 was used to help finance the procurement of heavy equipment and haul trucks to supplement the contractor-owned fleet with an owner’s operated fleet for Buckreef’s mining operations.
To provide the Company with access to additional liquidity, during Q3 2023, the Company announced that it entered into an At The Market Offering Agreement (“ATM”) with H.C. Wainwright & Co., LLC as Lead Agent and Roth Capital Partners, LLC as Co-Agent, pursuant to which the Company, at its discretion, may offer and sell, from time to time, common shares having an aggregate offering price of up to $10 million. If the Company chooses to sell shares under the ATM Offering, the Company intends to use the net proceeds of this offering for working capital and for other general corporate purposes. To date, no shares have been sold under the ATM agreement.
In addition, to provide the Company with access to supplementary liquidity, during Q2 2022, TRX Gold entered into a purchase agreement with Lincoln Park Capital Fund, LLC (“Lincoln Park”). This agreement provides TRX Gold with the right to sell up to $10 million of its shares to Lincoln Park over a 36-month period at its sole discretion. TRX Gold has control over the timing and amount of any sales to Lincoln Park and will use the proceeds as needed to develop the Buckreef Gold asset. In mid-January 2025, the purchase agreement with Lincoln Park terminated pursuant to its terms
As of November 30, 2024, the Company has accumulated losses of $120.9 million since inception (August 31, 2024: $121.9 million).
Commitments
In order to maintain existing site mining and exploration licenses, the Company is required to pay annual license fees. As at November 30, 2024, these licenses remained in good standing and the Company is up to date on license payments.
Contingencies
The Company is involved in litigation and disputes arising in the normal course of operations. Management is of the opinion that the outcome of any potential litigation will not have a material adverse impact on the Company’s financial position or results of operations. Accordingly, no provisions for the settlement of outstanding litigation and potential claims have been accrued.
Off-Balance Sheet Arrangements
The Company has no off-balance sheet arrangements.
Transactions with Related Parties
The Company may enter into related party transactions that are in the normal course of business. Transactions with Related Parties disclosure can be found in Note 16 of the Unaudited Interim Consolidated Financial Statements for the three months ended November 30, 2024.
| | Management’s Discussion and Analysis November 30, 2024 |
Omnibus Equity Incentive Plan
Effective June 26, 2019, the Company adopted the Omnibus Equity Incentive Plan dated June 26, 2019 (the “Omnibus Plan”), which Omnibus Plan was approved by the shareholders on August 16, 2019, subsequently updated and approved by the shareholders on February 25, 2022.
The purposes of the Omnibus Plan are: (a) to advance the interests of the Company by enhancing the ability of the Company and its subsidiaries to attract, motivate and retain employees, officers, directors, and consultants, which either of directors or officers may be consultants or employees; (b) to reward such persons for their sustained contributions; and (c) to encourage such persons to consider the long-term corporate performance of the Company.
The Omnibus Plan provides for the grant of options, restricted share units (“RSUs”), deferred share units (“DSUs”) and performance share units (“PSUs”) (collectively, the “Omnibus Plan Awards”), all of which are described in detail in the Form 40-F Annual Report for the year ended August 31, 2022, and the Information Circular dated January 21, 2022, filed on SEDAR+ on January 27, 2022.
The Omnibus Plan provides for the grant of other share-based awards to participants (“Other Share-Based Awards”), which awards would include the grant of common shares. All Other Share-Based Awards will be granted by an agreement evidencing the Other Share-Based Awards granted under the Omnibus Plan.
Subject to adjustments as provided for under the Omnibus Plan, the maximum number of shares issuable pursuant to Omnibus Plan Awards outstanding at any time under the Omnibus Plan shall not exceed 10% of the aggregate number of common shares outstanding from time to time on a non-diluted basis; provided that the acquisition of common shares by the Company for cancellation shall not constitute non-compliance with the Omnibus Plan for any Omnibus Plan Awards outstanding prior to such purchase of common shares for cancellation.
For more particulars about the Omnibus Plan, we refer you to the copy of the Omnibus Plan previously filed as an exhibit with the SEC and on SEDAR+. The Omnibus Plan replaces all previous equity compensation plans of the Company, including the Restricted Stock Unit Plan and Stock Option Plan.
Changes in Accounting Polices and Critical Accounting Estimates and Judgements
Material accounting policies as well as any changes in accounting policies are discussed in Note 3 “Material Accounting Policies” of the Company’s Unaudited Interim Consolidated Financial Statements for the three months ended November 30, 2024.
| | Management’s Discussion and Analysis November 30, 2024 |
Non-IFRS Performance Measures
Average realized price per ounce of gold sold
Average realized price per ounce of gold sold is a non-IFRS measure and does not constitute a measure recognized by IFRS and does not have a standardized meaning defined by IFRS. Average realized price per ounce of gold sold is calculated by dividing revenue by ounces of gold sold. It may not be comparable to information in other gold producers’ reports and filings.
| | | | Three Months Ended | | | | Three Months Ended | |
| | | | November 30, 2024 | | | | November 30, 2023 | |
| Revenue per financial statements | | $ | 12,528 | | | $ | 9,404 | |
| Revenue recognized from OCIM prepaid gold purchase agreement | | | (915 | ) | | | (922 | ) |
| Revenue from gold spot sales | | | 11,613 | | | | 8,482 | |
| Ounces of gold sold | | | 4,813 | | | | 4,895 | |
| Ounces of gold sold from OCIM prepaid gold purchase agreement | | | (435 | ) | | | (527 | ) |
| Ounces from gold spot sales | | | 4,378 | | | | 4,368 | |
| Average realized price (gross) | | $ | 2,603 | | | $ | 1,921 | |
| Average realized price net OCIM prepaid gold purchase agreement | | $ | 2,653 | | | $ | 1,942 | |
Cash cost per ounce of gold sold
Cash cost per ounce of gold sold is a non-IFRS performance measure and does not constitute a measure recognized by IFRS and does not have a standardized meaning defined by IFRS. Cash cost per ounce may not be comparable to information in other gold producers’ reports and filings. The following table provides a reconciliation of total cash cost per ounce of gold sold to cost of goods sold per the financial statements for the three months ended November 30, 2024.
| | | Three Months Ended | | | Three Months Ended | |
| | | November 30, 2024 | | | November 30, 2023 | |
| Cost of sales per financial statements | | $ | 7,694 | | | $ | 5,687 | |
| Less: Depreciation | | $ | (906 | ) | | $ | (484 | ) |
| Total cash cost | | $ | 6,788 | | | $ | 5,203 | |
| Ounces of gold sold | | | 4,813 | | | | 4,895 | |
| Cash cost per ounce of gold sold | | $ | 1,410 | | | $ | 1,063 | |
Adjusted EBITDA
Adjusted EBITDA is a non-IFRS performance measure and does not constitute a measure recognized by IFRS and does not have a standardized meaning defined by IFRS. Adjusted EBITDA may not be comparable to information in other gold producers’ reports and filings. Adjusted EBITDA is presented as a supplemental measure of the Company’s performance and ability to service its obligations. Adjusted EBITDA is frequently used by securities analysts, investors and other interested parties in the evaluation of companies in the industry, many of which present Adjusted EBITDA when reporting their results. Issuers present Adjusted EBITDA because investors, analysts and rating agencies consider it useful in measuring the ability of those issuers to meet their obligations. Adjusted EBITDA represents net income (loss) before interest, income taxes, and depreciation and also eliminates the impact of a number of items that are not considered indicative of ongoing operating performance.
| | Management’s Discussion and Analysis November 30, 2024 |
Certain items of expense are added, and certain items of income are deducted from net income that are not likely to recur or are not indicative of the Company’s underlying operating results for the reporting periods presented or for future operating performance and consist of:
| · | Change in fair value of derivative financial instruments; |
| · | Accretion related to the provision for reclamation; and |
| · | Share-based compensation expense. |
The following table provides a reconciliation of net income and comprehensive income to Adjusted EBITDA per the financial statements for the three months ended November 30, 2024.
| | | Three Months Ended | | | Three Months Ended | |
| | | November 30, 2024 | | | November 30, 2023 | |
| Net income and comprehensive income per financial statements | | | 2,137 | | | | (39 | ) |
| Add: | | | | | | | | |
| Depreciation | | | 906 | | | | 484 | |
| Interest and other non-recurring expenses | | | 321 | | | | 340 | |
| Income tax expense | | | 1,693 | | | | 1,191 | |
| Change in fair value of derivative financial instruments | | | (819 | ) | | | (199 | ) |
| Share-based payment expense | | | 156 | | | | 810 | |
| Adjusted EBITDA | | | 4,394 | | | | 2,587 | |
The Company has included “average realized price per ounce of gold sold”, “cash cost per ounce of gold sold” and “Adjusted EBITDA” as non-IFRS performance measures throughout this MD&A as TRX Gold believes that these generally accepted industry performance measures provide a useful indication of the Company’s operational performance. The Company believes that certain investors use this information to evaluate the Company’s performance and ability to generate cash flow. Accordingly, they are intended to provide additional information and should not be considered in isolation or as a substitute for measures of performance prepared in accordance with IFRS.
Disclosure of Outstanding Share Data
As at November 30, 2024, there were 280,709,951 common shares outstanding, 36,190,769 share purchase warrants outstanding, 1,498,385 RSUs outstanding, nil PSUs/DSUs outstanding, and 14,874,000 stock options outstanding.
Risks Factors
The Company is subject to a number of extraneous risk factors over which it has no control. These factors are common to most mineral exploration and development companies and include, among others: project ownership, exploration and development risk, depressed equity markets and related financing risk, commodity price risk, fluctuating exchange rates, environmental risk, insurance risk, sovereign risk. For further details on the risk factors affecting the Company, please see the Company’s Form 40-F Annual Report for the year ended August 31, 2024, filed with the SEC on November 29, 2024, and on SEDAR+ as the Company’s Annual Information Form on November 29, 2024.
| | Management’s Discussion and Analysis November 30, 2024 |
Internal Control Over Financial Reporting (“ICFR”)
Management of the Company is responsible for establishing and maintaining adequate internal controls over financial reporting (“ICFR”) for the Company as defined in Rule 13a-15(f) under the Securities and Exchange Act of 1934. The Company’s management, including the Company’s Chief Executive Officer (“CEO”) and Chief Financial Officer (“CFO”) have conducted an evaluation of the design and effectiveness of the Company’s ICFR as of August 31, 2023. In making this assessment, the Company’s management used the criteria established in Internal Control – Integrated Framework, issued by the Committee of Sponsoring Organizations of the Treadway Commission (“COSO 2013”). This evaluation included review of the documentation of controls, evaluation of the design and operating effectiveness of controls, and a conclusion on this evaluation. Based on this evaluation, management concluded that ICFR were not effective for the year ended August 31, 2024, due to a material weakness relating to its information technology general controls (“ITGC”). The Company relies on a third-party service provider that manages its enterprise resource planning (“ERP”) software. As at August 31, 2024, the vendor did not have an assurance audit report to confirm the appropriate ITGCs were in place. As a result, the Company was unable to assess the internal controls related to security, availability, processing integrity and confidentiality surrounding the ERP. The Company did not have appropriate controls to monitor the vendor’s control environment and ITGCs as per the criteria established in the COSO 2013 Framework.
Remediation of Material Weaknesses
The control deficiency described immediately above was concluded on by management during the year ended August 31, 2024. The Company has prioritized the remediation of the material weakness and is working with its vendor to resolve the issue.
During the year ended August 31, 2024, the Company continued to strengthen its internal controls and is committed to ensuring that such controls are designed and operating effectively. The Company is implementing process and control improvements, and management made the following changes during the year to improve the internal control framework, including the following:
| · | Continued working with a third-party service provider to implement and test the design and operating effectiveness of key controls developed in the prior year period. Based on this work, the Company concluded that the majority of internal control deficiencies previously identified have been substantially remediated, except for the material weakness described above. |
| · | Continued to build an experienced team at Buckreef Gold Company Limited, the Company’s operating subsidiary, including hiring a new site Supply Chain Superintendent and adding additional headcount to enhance controls over the procurement process, document management, segregation of duties and optimization of the Company’s financial reporting close process. |
It is the Company’s intention to remediate the material weakness by working closely with its vendor and, if required, designing and implementing additional compensating controls over ITGCs over the course of fiscal 2025.
| | Management’s Discussion and Analysis November 30, 2024 |
Additional Information
The Company is a Canadian public company listed on the Toronto Stock Exchange trading under the symbol “TRX” and also listed on the NYSE American trading under the symbol “TRX”. Additional information about the Company and its business activities is available on SEDAR+ at www.sedarplus.ca; with the SEC at sec.gov; and the Company’s website at www.TRXgold.com.
Approval
The Board of Directors of TRX Gold Corporation has approved the disclosure contained in this Q1 2025 MD&A. A copy of this Q1 2025 MD&A will be provided to anyone who requests it. It is also available on the SEDAR+ website at www.sedarplus.ca.
| | Management’s Discussion and Analysis November 30, 2024 |
Endnotes
1 Refer to “Non-IFRS Performance Measures” section.
2 Notes Regarding Sample Protocol QA/QC: The sample chain of custody is managed by the Buckreef Gold geology team on site. Reported results are from diamond drilled core samples. Intervals of core to be analyzed are split into half using a mechanized core cutter, with one half sent to the Laboratory for geochemical analysis and the remaining half kept in storage for future reference and uses. Diamond drilled core has been HQ size and recoveries are consistently 100% across all drill holes intercept reported.
Sampling and analytical procedures are subject to a comprehensive quality assurance and quality control program. The QA/QC program involves insertion of duplicate samples, blanks and certified reference materials in the sample stream. Gold analyses are performed by standard fire assaying protocols using a 50-gram charge with atomic absorption (AAS) finish and a gravimetric finish performed for assays greater than 10 grams per tonne.
Sample Preparation and analysis are performed by independent SGS Laboratory in Mwanza, Tanzania. SGS Laboratory is ISO17025 accredited and employs a Laboratory Information Management System for sample tracking, quality control and reporting.
The results summarized in this MD&A from the “Buckreef Main Zone NEE” prospect is an extension of the known Buckreef Main Zone. The intercepts confirm a continuity of over 200 m of known Buckreef main deposit to the Northeast. The intersections reported here are a down-hole length and may not represent true width, however the true width is estimated to be between 50% - 60% of the length.
The results summarized in this MD&A from the “Stamford Bridge” target show intercepts that confirm an interpreted mineralized shear zone trending 070 degrees (ENE) that is over a km long. The intersections reported only covers the first 100 m strike length, they are a down-hole length and may not represent true width, however the true width is estimated to be between 50% - 60% of the length.
3 Notes Regarding Sample Protocol from Metallurgical Variability Test Results: A 1 kg aliquot of each of Composite 3 to Composite 14 at a crush size of 100% - 1.18 mm were blended to form the master composite. The master composite was split into 1 kg aliquots using a rotary splitter. Three 1 kg aliquots from the master composite were milled in a rod mill to target grinds of 80% - 53 µm, 80% - 38 µm and 80% -25 µm. A 200 g aliquot was split from the 80% - 53 µm and wet milled in a ceramic charged ball mill to a target grind of 80% - 5 µm. The grinds were checked by screening the milled material on the specific screens and weighing the oversize material. A 20 g aliquot of the 80% - 5 µm was submitted to an external laboratory for particle size distribution. One 500 g aliquot of the milled sample was submitted for the head chemical analysis.
43