 | NI43-101 ITR - Updated Mineral Resource Estimate for Buckreef Gold Project |
NATIONAL INSTRUMENT 43-101 Independent Technical Report
Updated Mineral Resource Estimate for the Buckreef Gold Mine
Project, Tanzania, East Africa
For Tanzanian Gold Corporation (TSX: TNX)
(NYSE American: TRX)

Compiled by:
Wenceslaus Kutekwatekwa
BSc Hons (Mining Eng.), MBA, FSAIMM, FIoDZ, PRINCE 2®, MAMMZ, MPMIZ
(Mining Consultant)
Dr. Frank K Crundwell
BSc (Eng.) Chem BSc (Financial Maths) MSc (Eng.) PhD FSAIMM, FIChemE
(Metallurgical Consultant)
 Reference No: VPTRX002-2020 Effective Date:May 15, 2020 | 30 Tunsgate Road, P.O. Box 1022, Mount www.virimaiprojects.co.zw |
 | Page 1 |
| | NI43-101 ITR - Updated Mineral Resource Estimate for Buckreef Gold Project |
DATE AND SIGNATURES
This Report titled “NATIONAL INSTRUMENT 43-101 Independent Technical Report - Updated Mineral Resource Estimate for the Buckreef Gold Mine Project, Tanzania, East Africa” prepared for Tanzanian Gold Corporation has an effective date ofMay 15, 2020, and has been prepared and signed onJune 8, 2020by the following author, as shown in the Appendices:
QUALIFIED PERSONS:
Wenceslaus Kutekwatekwa (Mining Engineer, Mining and Project Management Consultant)
BSc Hons (Mining Eng.), MBA, FSAIMM, FIoDZ, PRINCE 2®, MAMMZ, MPMIZ

Dr. Frank K Crundwell (Metallurgical Consultant, Director CP Solutions Private Limited)
BSc (Eng.) Chem BSc (Financial Maths) MSc (Eng.) PhD Pr Eng. FSAIMM, FIChemE

| | Page 2 |
| | NI43-101 ITR - Updated Mineral Resource Estimate for Buckreef Gold Project |
CONTENTS
| 1. | SUMMARY | 14 |
| 1.1 | Introduction | 14 |
| 1.2 | Location, Property Description and Ownership | 14 |
| 1.3 | Geology and Mineralization | 15 |
| 1.4 | Exploration, Drilling, Sampling and QA/QC | 16 |
| 1.5 | Mineral Processing and Metallurgical Testing | 16 |
| 1.6 | Mineral Resource Estimation | 16 |
| 1.6.1 | Exploration Targets | 17 |
| 1.7 | Mineral Reserves | 18 |
| 1.8 | Interpretations and Conclusions | 19 |
| 1.9 | Recommendations | 20 |
| 2. | INTRODUCTION | 22 |
| 2.1 | Scope of Study | 22 |
| 2.2 | Qualified Person and List of Consultants | 22 |
| 2.3 | Effective Dates and Declaration | 23 |
| 2.4 | Sources of Information | 23 |
| 2.5 | Site Visit | 24 |
| 2.6 | Acknowledgement | 24 |
| 3. | RELIANCE ON OTHER EXPERTS | 25 |
| 4. | PROPERTY DESCRIPTION AND LOCATION | 26 |
| 4.1 | Mineral Tenure | 26 |
| 4.2 | Mining Rights in Tanzania | 27 |
| i. | Basis for Mineral Title | 27 |
| ii. | Exploration Permits (Rights and Obligation) | 27 |
| iii. | Project Mining Permits | 28 |
| 4.3 | Underlying Agreements | 29 |
| i. | Environmental Considerations | 30 |
| 5. | ACCESSIBILITY, CLIMATE, LOCAL RESOURCES, INFRASTRUCTURE AND PHYSIOGRAPHY | 31 |
| 5.1 | Accessibility | 31 |
| | Page 3 |
| | NI43-101 ITR - Updated Mineral Resource Estimate for Buckreef Gold Project |
| 5.2 | Climate | 31 |
| 5.3 | Physiography | 31 |
| 5.4 | Local Resources | 32 |
| 6. | HISTORY | 34 |
| 6.1 | Previous Exploration Work | 34 |
| 7. | GEOLOGICAL SETTING AND MINERALIZATION | 36 |
| 7.1 | REGIONAL GEOLOGICAL SETTING | 36 |
| 7.3 | DEPOSIT GEOLOGY | 41 |
| 7.3.1 | Buckreef Deposit | 41 |
| 7.3.2 | Bingwa Deposit | 44 |
| 7.3.3 | Eastern Porphyry Deposit | 46 |
| 7.3.4 | Tembo Deposit | 47 |
| 7.4 | STRUCTURAL SETTING AND MINERALIZATION | 47 |
| 8 | DEPOSIT TYPES | 51 |
| 8.1 | Regional | 51 |
| 8.2 | Buckreef Gold Deposits | 51 |
| 8.3 | Buckreef Deposit Model | 54 |
| 8.4 | Conclusion | 58 |
| 9 | EXPLORATION | 59 |
| 9.1 | Buckreef Gold Project | 60 |
| 10. | DRILLING | 64 |
| 11. | SAMPLE PREPARATION, ANALYSES AND SECURITY | 71 |
| 11.1 | Core Sampling Methods | 71 |
| 11.2 | RC/RAB Sampling Methods | 72 |
| 11.3 | Sample preparation and Analysis | 73 |
| 11.4 | QUALITY ASSURANCE & QUALITY CONTROL (QA/QC) PROCEDURE 2019 DRILLING PROGRAMME | 74 |
| i. | Blanks | 74 |
| ii. | Field Duplicates and Pulp duplicates | 75 |
| iii. | Certified Reference Materials (CRM) | 76 |
| iv. | Umpire samples | 81 |
| | Page 4 |
| | NI43-101 ITR - Updated Mineral Resource Estimate for Buckreef Gold Project |
| 12. | DATA VERIFICATION | 83 |
| 12.1 | Drill Data Review | 83 |
| 12.2 | Collar Location Checks | 83 |
| 12.3 | Drill hole and Assays Checks | 84 |
| 12.4 | Geology Checks | 84 |
| 12.5 | Core Assay Checks | 84 |
| 12.6 | Verifications by QPs | 85 |
| 13. | MINERAL PROCESSING AND METALLURGICAL TESTING | 87 |
| 13.1 | Introduction | 87 |
| 13.2 | Previous test work | 87 |
| 13.3 | Metallurgical Testwork on Buckreef Samples – Geita Gold Mining Ltd | 87 |
| 13.4 | Scoping and diagnostic test work – Gallery Gold | 88 |
| 13.5 | Phase 2 Metallurgical test work – IAMGOLD | 88 |
| i. | Grinding test work | 88 |
| ii. | Process selection test work | 88 |
| 13.6 | Heap leaching test work | 89 |
| i. | Simulated heap tests – SGS 2009 | 89 |
| ii. | Heap leaching amenability test work – SGS 2016 | 89 |
| iii. | Conclusions concerning heap leaching | 89 |
| 13.7 | Conclusions from the test work initiated prior to this study | 90 |
| 13.8 | Documentation | 90 |
| 13.9 | Metallurgical test work. | 90 |
| i. | Purpose of the test work | 90 |
| ii. | Sample origin | 90 |
| 13.10 | Grade and deportment | 91 |
| i. | Head grade | 91 |
| ii. | Gold deportment in the milled material | 92 |
| 13.11 | Milling | 93 |
| i. | Bond milling index | 93 |
| ii. | Pilot milling | 94 |
| | Page 5 |
| | NI43-101 ITR - Updated Mineral Resource Estimate for Buckreef Gold Project |
| 13.12 | Gravity concentration | 96 |
| 13.13 | Cyanidation | 97 |
| 13.14 | Conclusions | 98 |
| 13.15 | Recommendations | 99 |
| 13.16 | Concluding Remarks | 99 |
| 14. | MINERAL RESOURCE ESTIMATE | 100 |
| 14.1 | Introduction | 100 |
| 14.2 | Mineral Resource Modelling | 100 |
| 14.2.1 | Sample Distribution and Statistics | 104 |
| 14.2.1 | Outlier Analysis | 104 |
| 14.3 | Mineral Resource Estimation Models | 105 |
| 14.3.1 | Density | 108 |
| 14.4 | Mineral Resource Estimation Checks | 108 |
| 14.5 | Mineral Resource Classification and Reporting | 110 |
| 14.6 | Exploration Targets | 112 |
| 14.7 | Mineral Resources and Conclusions | 113 |
| 15. | MINERAL RESERVE ESTIMATE | 114 |
| 15.1 | Introduction | 114 |
| 15.2 | Open Pit Mining | 115 |
| 15.3 | Resource Block Model | 115 |
| 15.4 | Open Pit Optimization | 116 |
| 15.4.1 | Buckreef Pit | 117 |
| 15.4.2 | Bingwa Pit | 118 |
| 15.4.3 | Eastern Porphyry Pit | 119 |
| 15.4.4 | Tembo Pit | 120 |
| 15.5 | Detailed Mine Design | 121 |
| 15.6 | In-Pit Dilution and Mining Recovery | 123 |
| 15.7 | Cut-Off Grade Criteria | 124 |
| 15.8 | Open Pit Material Inventory | 124 |
| 15.1 | Concluding Remarks | 125 |
| | Page 6 |
| | NI43-101 ITR - Updated Mineral Resource Estimate for Buckreef Gold Project |
| 16. | MINING METHOD | 126 |
| 17. | RECOVERY METHODS | 136 |
| 17.1 | Introduction | 136 |
| 17.2 | Description of the ore | 136 |
| 17.2.1 | Ore types | 136 |
| 17.2.2 | Head grade | 136 |
| 17.3 | Processing strategy | 136 |
| 17.4 | Overall Design Criteria | 137 |
| 17.5 | Mass balance | 137 |
| 17.6 | Process Description and Design Criteria | 137 |
| 17.6.1 | Ore receipt and scrubbing | 139 |
| 17.6.2 | Crushing and milling | 140 |
| 17.6.3 | Gravity concentration | 141 |
| 17.6.4 | Thickening plant | 141 |
| 17.6.5 | Carbon-in-leach plant | 142 |
| 17.6.6 | Carbon Acid wash and Elution | 143 |
| 17.6.7 | Carbon regeneration | 143 |
| 17.7 | Tailings treatment | 144 |
| i. | Reagents | 144 |
| 17.8 | Utilities | 144 |
| 17.9 | Equipment | 145 |
| 17.9.1 | General equipment selection | 145 |
| 17.9.2 | EDS Mill | 145 |
| 17.10 | Power consumption | 147 |
| 17.11 | Summary and Conclusions | 147 |
| 17.1 | Concluding Remarks | 147 |
| 18. | PROJECT INFRASTRUCTURE | 148 |
| 18.1 | Introduction | 148 |
| 18.2 | Site Layout | 148 |
| 19. | MARKET STUDIES AND CONTRACTS | 150 |
| | Page 7 |
| | NI43-101 ITR - Updated Mineral Resource Estimate for Buckreef Gold Project |
| 19.1 | Market Studies | 150 |
| 19.2 | Contracts | 150 |
| 20. | ENVIRONMENTAL AND SOCIAL IMPACT STUDIES PERMITTING AND SOCIAL AND COMMUNITY IMPACT | 151 |
| 20.1 | General Approach | 151 |
| 20.2 | Environmental Studies | 151 |
| 20.3 | Community and Government Communications | 151 |
| 20.4 | Overview | 152 |
| i. | Climate, Air Quality and Sound | 152 |
| ii. | Physiography, Soils and Geology | 152 |
| iii. | Surface Water and Sediment | 153 |
| 20.5 | Groundwater Quality | 153 |
| 20.6 | Biological Environment | 153 |
| 20.6.1 | Vegetation | 153 |
| 20.6.2 | Wildlife | 154 |
| 20.6.3 | Human Environment | 154 |
| 20.6.4 | Population | 154 |
| 20.6.5 | Health | 155 |
| 20.6.6 | Farming | 155 |
| 20.6.7 | Livestock | 155 |
| 20.6.8 | Commerce | 155 |
| 20.6.9 | Gold Mining | 156 |
| 20.7 | Seismicity | 156 |
| 20.8 | Environmental Sensitivities | 157 |
| 20.9 | Regulatory Context | 157 |
| 21. | CAPITAL AND OPERATING COSTS ESTIMATES | 158 |
| 22. | ECONOMIC ANALYSIS | 168 |
| 22.1 | Cash-flow Model | 168 |
| 22.2 | Discount Rate | 168 |
| 22.3 | Tax | 168 |
| 22.4 | Inflation | 169 |
| | Page 8 |
| | NI43-101 ITR - Updated Mineral Resource Estimate for Buckreef Gold Project |
| 22.5 | Revenue | 169 |
| 22.6 | Royalty | 169 |
| 22.7 | Selling Costs | 170 |
| 22.8 | Summary of the Parameters Used in the Financial Model | 170 |
| 22.9 | Financial Analysis | 171 |
| 22.10 | Financial Analysis Summary | 173 |
| 22.11 | Financial Model Sensitivity Analysis | 173 |
| 23. | ADJACENT PROPERTIES | 175 |
| 24. | OTHER RELEVANT DATA AND INFORMATION | 177 |
| 25. | INTERPRETATION AND CONCLUSIONS | 178 |
| 26. | RECOMMENDATIONS | 180 |
| 27. | REFERENCE | 181 |
| 28. | ABBREVIATIONS GENERAL | 182 |
| 29. | MEASURES OF QUANTITY | 183 |
| 30. | ORGANISATIONS | 184 |
| 31. | GLOSSARY | 185 |
| 32. | APPENDICES | 191 |
| 32.1 | Certificate of Qualified Persons | 191 |
| 32.2 | Consent to publish | 195 |
| 32.3 | ESIA CERTIFICATION | 197 |
| 32.4 | LABORATORIES ACCREDITATION CERTIFICATES | 198 |
| 32.5 | PROCESS FLOW DIAGRAMS | 201 |
| 32.6 | PROCESSING PLANT MECHANICAL ITEMS | 214 |
| 32.7 | TABLES APPENDICES | 218 |
| | Page 9 |
| | NI43-101 ITR - Updated Mineral Resource Estimate for Buckreef Gold Project |
| List of Tables | |
| Table 1.1: Buckreef Project March 2020 Mineral Resource | 17 |
| Table 1.2 Exploration targets at the Buckreef Shear Zone | 17 |
| Table 1.3: Buckreef Project Pit-Design Optimized Mineral & ROM stockpile Reserves as at 26 June 2018 | 19 |
| Table 1.4: Buckreef Mineral Reserve Statement as at 26 June 2018 | 19 |
| Table 2.2 Qualified Person and Contributors Site Visits | 24 |
| Table 7.1: Summary of Rock names and mineralogy typical at Buckreef Gold Mine | 43 |
| Table 9.1 Summary of Buckreef Project, Historical Exploration Work, Geita District, Tanzania | 59 |
| Table 9.2: Mineral Resource Upgrade drilling program statistics, Buckreef Gold Deposit | 62 |
| Table 11.1 Range of CRM Used during the 2019 sampling Programme | 77 |
| Table 11.2 Pass rate of CRMs used during the 2019 sampling Programme | 77 |
| Table 11.2: Comparison of the Nesch Mintech Lab and SGS. | 81 |
| Table 13.1. Key results from Gieta Gold test work. | 87 |
| Table 13.2. Key results from Gallery Gold test work. | 88 |
| Table 13.3. Milling characteristics. | 88 |
| Table 13.4. Recoveries for different processing options. | 89 |
| Table 13.5. Recommended recovery assumptions for project evaluation. | 89 |
| Table 13.6. Head analysis for gold | 91 |
| Table 13.7 Bond mill indices for oxide and sulphide ore materials. | 93 |
| Table 13.8. Cyanidation results for the oxide and sulphide ores. | 97 |
| Table 13.9. Cyanide and lime consumption summary. | 98 |
| Table 14.1: Statistics of 1m samples and composites within the resource wireframes | 104 |
| Table 14.2 Buckreef Summary Semi-Variogram Parameters | 106 |
| Table 14.3: Summary of Buckreef search parameters | 107 |
| Table 14.4 Buckreef Project Resource models, Geita District, Tanzania | 107 |
| Table 14.5 Buckreef Project Updated Resource Model Density | 108 |
| Table 14.6 Buckreef Project Resource models, Geita District, Tanzania | 110 |
| Table 14.7: Buckreef Shear Zone March 2020 Mineral Resource Updated Estimates at 0.4g/t Block Cut off | 111 |
| Table 14.8: Buckreef Project March 2020 Mineral Resource | 111 |
| Table 14.9: Buckreef Project 2020 vs 2018 reconciliation | 112 |
| Table 14.10 Exploration targets at the Buckreef Shear Zone | 112 |
| Table 15.1: Key Economic Parameters | 116 |
| Table 15.2: Main Operating Constraints | 116 |
| Table 15.3: Geotechnical Parameters | 116 |
| Table 15.4: Processing Parameters | 116 |
| Table 15-6 Mine Design Parameters | 122 |
| Table 15.7 Open Pit Reserves Summary | 124 |
| Table 16.4 Summary of Scheduled Milled Tonnages and Waste Tonnages (Refer Appendix 16.1) | 130 |
| Table 16.5 Summary of Scheduled Tonnages by Pit Tonnages | 131 |
| Table 16.5 Summary of Waste Dump Volumes at each of the Pits | 133 |
| Table 17.1 Design head grade for oxide and sulphide ores | 136 |
| | Page 10 |
| | NI43-101 ITR - Updated Mineral Resource Estimate for Buckreef Gold Project |
| Table 17.2 Overall design criteria | 137 |
| Table 17.3 Design criteria for the scrubber/screen. | 140 |
| Table 17.4 Design criteria for the jaw crusher. | 140 |
| Table 17.5 Design criteria for the EDS mill and classification circuit. | 140 |
| Table 17.6 Design criteria for gravity concentrators. | 141 |
| Table 17.7 Design criteria for the shaking table. | 141 |
| Table 17.8 Design criteria for the dewatering cyclone. | 142 |
| Table 17.9 Design criteria for the thickener. | 142 |
| Table 17.10 Design criteria for the carbon-in-leach section. | 142 |
| Table 17.11 Design criteria for the tails screening. | 143 |
| Table 17.12 Design criteria for carbon elution. | 143 |
| Table 17.13 Design criteria for tailings detoxification. | 144 |
| Table 17.14 Industrial applications of the EDS mill. | 146 |
| Table 17.15 Status of Buckreef design. | 147 |
| Table 21.1 Summary of the Capital Costs estimates | 159 |
| Table 21.1 Summary of the Mining Operating Costs | 163 |
| Table 21.2: Mining rates for the Buckreef | 164 |
| Table 21.3: Processing Chemical Consumption & Cost estimation | 165 |
| Table 21.4: Annual TSF Management Costs | 165 |
| Table 21.5: Summary of Processing Costs estimates | 165 |
| Table 21.6: Labour and General Costs Summary | 166 |
| Table 21.7: Operating Costs Summary | 167 |
| Table 22.1 Summary of Government taxes and levies used in costing and the Financial Model | 169 |
| Table 22.2 Summary of the inputs into the Financial Model | 170 |
| Table 22.3: Financial Analysis of the Buckreef Gold Project | 171 |
| Table 22.4: Results of the After-Tax Financial Analysis of the Buckreef Gold Project | 173 |
| Table 25.1 Comparison of Buckreef June 2018 and May 2020 Mineral Resources: | 178 |
| Table 32.1: Buckreef Project Full Schedule of Mined Tonnages | 218 |
| Table 32.1: Buckreef Project Full Schedule of Mined Tonnages | 220 |
| Table 32.2 Buckreef Project Summary of Schedule of Milled Tonnages | 221 |
| Table 32.3: Full Schedule of Staffing Requirements of the Buckreef Project | 222 |
| Table 32.4: Summary of Capital Costs Estimates | 225 |
| Table 32.50: Equipment Operating Costs\ | 227 |
| Table 32.7: Buckreef Cash Flow Analysis | 229 |
| Figure 32.14. Expert Opinion on Buckreef Gold Project After-Tax Cashflow, NPV & IRR | 230 |
| Table 32.1: Buckreef Project Full Schedule of Mined Tonnages | 231 |
| Table 32.2 Buckreef Project Summary of Schedule of Milled Tonnages | 232 |
| Table 32.3: Full Schedule of Staffing Requirements of the Buckreef Project | 233 |
| Table 32.4: Summary of Capital Costs Estimates | 236 |
| Table 32.50: Equipment Operating Costs\ | 238 |
| Table 32.7: Buckreef Cash Flow Analysis | 240 |
| | Page 11 |
| | NI43-101 ITR - Updated Mineral Resource Estimate for Buckreef Gold Project |
| LIST OF FIGURES | |
| Figure 1.2.1. Location Map | 15 |
| Figure 4.1: Location of the Buckreef Gold Project, Gieta District Tanzania | 26 |
| Figure 4.2: Buckreef Gold Project, TRX License Holdings, Geita District, Tanzania | 27 |
| Figure 4.3 Buckreef Project: Deposit Locality within Special Mining License Boundaries, Geita District | 29 |
| Figure 5.1 Buckreef Project: Physiographic Map of North western districts of Tanzania | 32 |
| Figure 7.2 Regional Structural Geology Setting, Buckreef Project, Rwamgaza Greenstone Belt, Geita District, Tanzania | 38 |
| Figure 7.3 Local Geological Setting, Buckreef Project, Rwamagaza Greenstone Belt, Geita District, Tanzania | 40 |
| Source: TRX 2020 | 42 |
| Figure 7.3 Local Geological Setting, Buckreef Deposit, Geita District, Tanzania | 42 |
| Figure 7.4 Local Geological Setting, Bingwa Deposit, Geita District, Tanzania | 45 |
| Figure 7.5 Local Geological Setting, Eastern Porphyry Deposit, Geita District, Tanzania | 46 |
| Figure 7.6 Local Geological Setting, Tembo Deposit, Geita District, Tanzania | 47 |
| Figure 7.7 Structural Setting, Buckreef Deposit, Geita District, Tanzania | 48 |
| Figure 7.8 Structural Setting of the Main Buckreef Prospect, Rwamagaza Greenstone Belt, Geita District, Tanzania | 49 |
| Figure 8.1: Buckreef deposit (yellow areas represent projection of mineralized orebodies to surface). | 54 |
| Figure 8.2: Inversion of the basin Buckreef structure reactivates as a strike slip transfer fault while original normal faults are now reverse faults. | 55 |
| Figure 8.3: Intrusion of Felsic Porphyries controlled by basinal structures. | 55 |
| Figure 8.4: Inversion of basin-Buckreef structure reactivates as a strike slip transfer fault while original normal fault are now reverse faults. | 55 |
| Figure 8.5: Brecciation of the previously altered zones (Early Stages of Au Mineralisation). | 56 |
| Figure 8.7: Continued Cyclic rupturing of the Buckreef fault zone under high fluid pressure conditions resulting in extensive alteration a series of printing brecciation events. | 56 |
| Figure 8.8: Illustrates the classic plunge possibilities for classic fault orientations. As Buckreef appears to have been dominantly strike slip we would expect a steep to sub vertical shoot geometry controlled by the 2 direction | 57 |
| Figure 9.1: Spatial location of the Mineral Resource Upgrade drill-holes, Buckreef Gold Deposit 2019/2020 | 63 |
| Figure 10.1 Location of Historical RC/DD exploration and Resource drill-holes, Buckreef Deposit, Geita District, Tanzania | 65 |
| Figure 10.2 Location of Historical RC/DD exploration and Resource drill-holes, Bingwa Deposit, Geita District, Tanzania | 66 |
| Figure 10.3 Location of Historical RC/DD exploration and Resource drill-holes, Eastern Porphyry Deposit, Geita District, Tanzania | 67 |
| Figure 10.4 Location of Historical RC/DD exploration and Resource drill-holes, Tembo Deposit, Geita District, Tanzania | 68 |
| Figure 11.1: Drillholes used in 2019 Resource update | 73 |
| Figure 11.2: Coarse blanks assessment graph | 74 |
| | Page 12 |
| | NI43-101 ITR - Updated Mineral Resource Estimate for Buckreef Gold Project |
| Figure 11.3: Scatter plots for Field duplicates (left) and Pulp duplicates (right) | 75 |
| Figure 11.4: QQ plots for Field duplicates (left) and Pulp duplicates (right) | 76 |
| Figures 11.5 CRM ST100302 Nesch Mintech Mwanza Laboratory | 77 |
| Figures 11.5 CRM AUOM-3 Nesch Mintech Mwanza Laboratory | 78 |
| Figures 11.6 CRM AUOH-5 Nesch Mintech Mwanza Laboratory | 78 |
| Figures 11.7 CRM ST37/5340 Nesch Mintech Mwanza Laboratory | 78 |
| Figures 11.8 CRM OXE74 Nesch Mintech Mwanza Laboratory | 79 |
| Figures 11.9 CRM OXE56 Nesch Mintech Mwanza Laboratory | 79 |
| Figures 11.9 CRM AMIS0211-Nesch Mintech Mwanza Laboratory | 79 |
| Figures 11.10 CRM AMIS0234-Nesch Mintech Mwanza Laboratory | 80 |
| Figures 11.11 CRM OxC72-Nesch Mintech Mwanza Laboratory | 80 |
| Figures 11.12 CRM ST07/9258-Nesch Mintech Mwanza Laboratory | 80 |
| Figures 11.13 CRM ST07095344-Nesch Mintech Mwanza Laboratory | 81 |
| Figure 11.14: Scatter plot and QQ plot for umpire samples | 82 |
| Figure 12.1: Virimai Projects Team on Site | 84 |
| Figure 12.2: Virimai Team Checking on the Drilling on Site | 85 |
| Figure 13.1: Oxide ore before milling and after a single pass of milling in the multi-shaft EDS mill. | 91 |
| Figure 13.2: Sulphide ore before milling and after a single pass of milling in the multi-shaft EDS mill. | 91 |
| Figure 13.3: Gold grade and deportment by size fraction for the oxide ore, indicating that the gold deportment is higher in the fine fraction, bearing in mind that there is a high fines content of this ore. | 92 |
| Figure 13.4. Gold grade and deportment by size fraction for the sulphide ore, indicating that the gold is not concentrated in any one size fraction. | 93 |
| Figure 13.5. Principle of the EDS multi-shaft mill. | 94 |
| Figure 13.6. Particle-size distribution of the milled (product) oxide ore. (Source: MMSA Report No 15/059 r1) | 95 |
| Figure 13.7. Particle-size distribution of the milled (product) sulphide ore. (Source: MMSA Report No 15/059 r1) | 95 |
| Figure 13.8. Grade and recovery curves against mass pull for the oxide ore using the Falcon L40 concentrator | 96 |
| Figure 13.9. Grade and recovery curves against mass pull for the sulphide ore using the Falcon L40 concentrator. | 97 |
| Figure 14.1: Hard boundary illustrations | 102 |
| Figure 14.2: Plan View of the Buckreef Main Zone mineralised bodies | 103 |
| Figure 14.5: Virimai Projects block grade checks | 109 |
| Figure 14.6: Virimai Projects average sample grade compared to average estimated block grade checks | 109 |
| | Page 13 |
| | NI43-101 ITR - Updated Mineral Resource Estimate for Buckreef Gold Project |
| 1. | SUMMARY |
| 1.1 | Introduction |
This report has been prepared by Virimai Projects (“Virimai”) for Tanzanian Gold Corporation (TRX) for the Update of the Mineral Resources Estimates of the Buckreef Gold Mine Project. The Mineral Resources Estimate of the Buckreef discussed in this “Independent Technical Report” has been prepared by Virimai Projects of Harare Zimbabwe at the request of TRX.
A press release confirming the definition of an update of the Mineral Resource Estimates for the Buckreef Gold Project was published in 17th March 2020 by TRX and that triggered this Independent Technical Report (ITR) to provide the details of the estimation methodology and results.
The contents of this report is based on exploration and drilling data collected by TRX and the results of estimation performed by Virimai Projects utilizing exploration and analytical data as of 28 February 2020. This Technical report was prepared in accordance with the guidelines set out in the National Instrument 43 -101 Standards of Disclosure for Mineral Projects (NI43 -101). The main intent of this study is to provide an update on the mineral resources of the Buckreef Gold Project based on Buckreef’s most recent data on the exploration of the Buckreef prospect. The Update Mineral Resource Estimates detailed in this report is based on drilling data collected by TRX during the period January 2019 to February 2020 period.
| 1.2 | Location, Property Description and Ownership |
The Buckreef Gold Project is a description of four gold prospects which are namely Buckreef, Eastern Porphyry Tembo and Bingwa located in the Mnekezi Village in Geita District in north-central Tanzania. The project area is located 40km south west of the town of Geita, which in turn is approximately 110km south-west of the second largest city Mwanza.
The Buckreef Gold Project is a gold exploration project comprises, a single Special Mining License covering an area of 16.04km2 and 12 Prospecting Licenses covering 98.19km2. The current Mineral Resources and Mineral Reserves for the Buckreef Gold project are declared over Special Mining License block SML04/1992. In March 2017, the Buckreef gold special mining license (SML04/92) which covers an area of 16.04km2, was successfully renewed for a further 10 years to 16th June 2027. The licenses are operated by Buckreef Gold Company Limited, the Tanzam2000 (a subsidiary company of Tanzanian Gold Corporation).
| | Page 14 |
| | NI43-101 ITR - Updated Mineral Resource Estimate for Buckreef Gold Project |

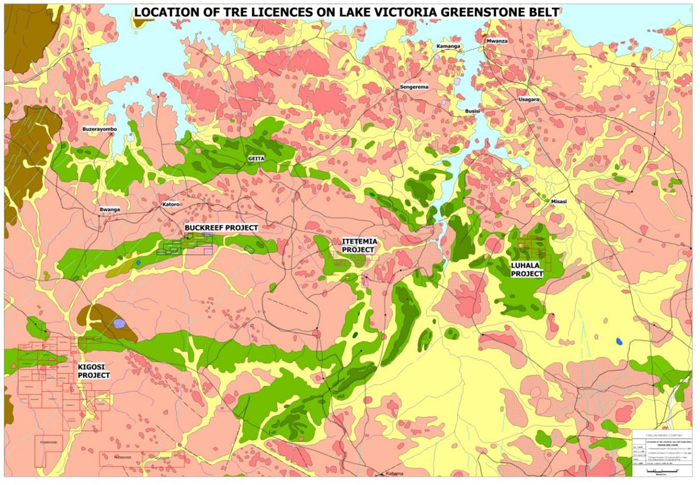
Figure 1.2.1. Location Map
| 1.3 | Geology and Mineralization |
The Buckreef Project is situated within the Lake Victoria Greenstone (LVG) belt of northern Tanzania which consists of several east-west trending, linear, Archaean greenstone belts. The LVG is the third largest gold producing region of Africa, surpassed only by the Witwatersrand Basin in South Africa and the Tarkwa region of Ghana. The Buckreef Project is in the regionally east-west trending Rwamagaza greenstone belt and this belt is considered a segment of the larger Sukumaland greenstone belt and is one of the larger greenstone belts in northern Tanzania.
Buckreef Gold Company Limited has defined four mineral deposits on the Buckreef Property. As estimated in this technical report, from largest to smallest based on ounces of gold, these include the Buckreef mineralized corridor, Bingwa, Eastern Porphyry and Tembo Deposits. The Buckreef Prospect is a shear zone hosted gold deposit within a sequence of mafic basalts and dolerites, near basement granite. The host rocks at the Buckreef deposit comprise primarily pillowed, amygdaloidal and massive mafic meta-volcanic rocks which have been intruded by medium to coarse grained dolerite sills and dykes. The gold mineralization at Buckreef Prospect is non-refractory in both fresh and oxide material. Gold mineralization at Bingwa is associated with quartz veining in strongly foliated and altered greenstone in a shear zone adjacent to the granitoid contact. The shear zone strikes northeast and dips steeply to the northwest. The Eastern Porphyry mineralization is associated with silicified and weakly pyritised shears, quartz veins and veinlets, and within quartz-feldspar porphyry. The Tembo deposit locates approximately 3km southwest of Buckreef Mine, adjacent to the main Rwamagaza Shear
| | Page 15 |
| | NI43-101 ITR - Updated Mineral Resource Estimate for Buckreef Gold Project |
Zone. The mineralized zones at Tembo are confined to the east – west trending shears within met-basaltic volcanic package. Gold mineralization is associated with grey quartz thin veins, stringers and boudins parallel to the shear fabric.
| 1.4 | Exploration, Drilling, Sampling and QA/QC |
Historical exploration activities include geochemical and geophysical surveys, geologic mapping, and drilling by various operators in the period 2004 to 2020. The most recent drilling programme undertaken by TRX is that from January 2019 to February 2020 in which a total of 17650m of drilling was carried. This brings the total meterage drilled on the project to about 125,750m to date for the project. The recent drilling included reverse circulation holes and diamond core holes.
The majority of the assays used for the estimate were fire assay at accredited Nesch Mintech Laboratories in Mwanza. The sample preparation, analyses and security procedures implemented by TRX, Nesch Mintech meet standard practices and were monitored using control samples, blanks, certified reference materials duplicates. On the basis of the quality assurances procedures and the quality control put in place at Buckreef it is the opinion of Wenceslaus Kutekwatekwa that the sampling preparation security and analytical procedures used by TRX are consistent with generally accepted industry best practise and are therefore adequate for use in mineral resource estimation and classification of Mineral Resources in accordance with generally accepted CIM standards.
| 1.5 | Mineral Processing and Metallurgical Testing |
No detailed Metallurgical test works have been completed as part of this current mineral resource update study. Virimai’s assumptions on economic recoveries are based on the several previous test work carried out and reported in previous filling by “SEDAR”. The test work conducted by MPC and SGS has shown that more than 90% of the gold can be recovered by a combination of gravity concentration and leaching of the tails. The MMSA test work established that 93% of the gold from the oxide ore can be recovered without gravity concentration by carbon-in-pulp leaching. The work established that 85% of the gold from the sulphide can be recovered in a similar manner.
| 1.6 | Mineral Resource Estimation |
The mineral Resource model presented herein represents an update resource evaluation prepared by Virimai Projects following on the drilling programme of 2019 on the Buckreef Prospect. The Mineral Resources of the other three areas, namely Eastern Porphyry, Tembo and Bingwa, were adopted as reported in the 2018 NI-43-101 report as there was no additional drilling on the three deposits. The resources estimates of these three deposits are presented in this mineral resource update report without amendments. The Mineral Resource estimate was informed by both the diamond drilling and reverse circulation drilling results using only samples confined within the Mineral Resource wireframes constructed by Virimai Projects in Datamine™ Studio 3 (version 3.21.7164).
| | Page 16 |
| | NI43-101 ITR - Updated Mineral Resource Estimate for Buckreef Gold Project |
In the Resource classification Virimai Projects considered that blocks estimated during the first estimation run considering full variogram ranges can be classified in the Measured category and the second estimation run (at one and half times the search volume) can be classified in the Indicated category. In both cases the classification also took into account kriging efficiency through the slope of regression. For these blocks, Virimai Projects considers that the level of confidence is sufficient to allow appropriate application of technical and economic parameters to support mine planning and to allow evaluation of the economic viability of the deposit. Blocks estimated during the third pass considering search neighbourhoods set at twice or more the variogram ranges were appropriately classified in the Inferred category because the confidence in the estimate is insufficient to allow for the meaningful application of technical and economic parameters or to enable an evaluation of economic viability.
The NI-43101 compliant Mineral Resource estimate as revised by Virimai Projects is shown Table 1.1.
Table 1.1: Buckreef Project March 2020 Mineral Resource
| Prospect | Measured | Indicated | Inferred | Total Measured + Indicated | ||||||||
| Tonnes | Grade | In Situ Content | Tonnes | Grade | In Situ Content | Tonnes | Grade | In Situ Content | Tonnes | Grade | In Situ Content | |
| (Mt) | Au (g/t) | Au (Oz) | (Mt) | Au (g/t) | Au (Oz) | (Mt) | Au (g/t) | Au (Oz) | (Mt) | Au (g/t) | Au (Oz) | |
| Buckreef | 19.98 | 1.99 | 1,281,160 | 15.89 | 1.48 | 755,120 | 17.82 | 1.11 | 635,540 | 35.88 | 1.77 | 2,036,280 |
| Eastern Porphyry | 0.09 | 1.20 | 3,366 | 1.02 | 1.17 | 38,339 | 1.24 | 1.39 | 55,380 | 1.10 | 1.18 | 41,705 |
| Tembo | 0.02 | 0.99 | 531 | 0.19 | 1.77 | 10,518 | 0.27 | 1.92 | 16,461 | 0.20 | 1.70 | 11,048 |
| Bingwa | 0.90 | 2.84 | 82,145 | 0.49 | 1.48 | 23,331 | 0.22 | 1.49 | 10,541 | 1.39 | 2.36 | 105,477 |
| Total | 20.99 | 2.03 | 1,367,202 | 17.59 | 1.46 | 827,308 | 19.55 | 1.14 | 717,922 | 38.57 | 1.77 | 2,194,510 |
# Buckreef has been updated and reported at 0.40 g/t Au block cut-off
# Eastern Porphyry, Bingwa and Tembo Mineral Resources are quoted at 0.50 g/t Au block cut-off as per last update
| 1.6.1 | Exploration Targets |
Besides the estimated resources tabulated herein, there are exploration targets within and extending beyond these Mineral Resources. Significant potential lies within the Buckreef Shear Zone that is summarised in Table 1.2. These targets are as such due to the openness of depth and the north eastern strike as well as the consistence of the results from some deep hole drilled to date.
Table 1.2 Exploration targets at the Buckreef Shear Zone
| Target Area | Tonnage Range | Grade Range Au (g/t) | Ounces Range | |||
| Minimum | Maximum | Minimum | Maximum | Minimum | Maximum | |
| Northeast Extension | 4,000,000 | 6,000,000 | 1.40 | 2.50 | 180,000 | 482,300 |
| Main Zone | 25,000,000 | 35,000,000 | 1.30 | 1.50 | 1,045,000 | 1,688,000 |
In should be noted that the potential quantity and grade of these exploration targets is conceptual in nature, that there has been insufficient exploration to define a mineral resource and that it is uncertain if further exploration will result in the target being delineated as a mineral resource as per the NI 43-101 reporting standards. The exploration targets include five isolated drill holes and assume projections of mineralized
| | Page 17 |
| | NI43-101 ITR - Updated Mineral Resource Estimate for Buckreef Gold Project |
structures to deep levels as well as an extension of the Northeast Zone, and are based a continuation of favourable geological conditions that host mineralized structures that have been encountered in shallower drilling of Phase 2 to deep levels below the limits of the current wireframes used in the estimation of the new resources described herein. The exploration targets assume that the extension of the Northeast Zone along strike will be confirmed by additional drilling.
The Phase 3 drilling program is currently underway to further test the continuity of these mineralized structures. Current information from drill holes show high grade intersections including drill-hole BMRCD298 with an intercept average 2.45 g/t from 650 m to 681 m down the hole (NE Extension) and drill-hole BMRCD309 with an intercept average 3.4 g/t from 617 m to 630 m down the hole (Main North).
| 1.7 | Mineral Reserves |
The last Mineral Reserves estimate for the Buckreef Gold Project are as reported in the last published ITR titled “Amended NATIONAL INSTRUMENT 43-101 Independent Technical Report Mineral Reserves Estimate and Pre-Feasibility Study on the Buckreef Gold Mine Project, Tanzania, East Africa” (Virimai 2018). No update Mineral Reserves have been estimated for the Buckreef Gold Project in this current report for Mineral Resources. A new pit optimisation taking into account of the current Mineral Resources update in the Buckreef prospect and the current prevailing economic factors is still to be completed. The mining philosophy for the development of the Buckreef Gold Project still remains that of initial open pit on the Buckreef deposit and possible transitioning into underground mining at depth while it will be purely open pit for the other three smaller deposits as outlined in the ITR (Virimai 2018).
The mineral reserves reported in this update report are those in the report titled “Amended NATIONAL INSTRUMENT 43-101 Independent Technical Report Mineral Reserves Estimate and Pre-Feasibility Study on the Buckreef Gold Mine Project, Tanzania, East Africa.” June 2018:
From the published 2014 Venymn Deloitte NI-43-101 compliant Mineral Resource estimate technical report, Virimai Projects essentially overhauled and improved on the original overall mining philosophy have produced a NI-43-101 compliant Mineral Reserve estimate for Buckreef Gold Project based on the original resource block models, achievable mining shapes, mining recovery, mining dilution and open-pit pre-production development cost considerations.
The Buckreef Project Mineral Reserve estimate is based on a gold cut-off grade of 0.37 grams per tonne) which has been calculated from the following parameters:
| a) | Gold Price (pit shell): US$ 1,300 per oz |
| b) | Mining Cost: US$19.00 per ton of ore |
| c) | Process Cost: US$10.24 per ton of ore |
| d) | G & A Cost: US$1.98 per ton of ore |
| e) | Recovery: 92.3% for oxides |
| f) | Recovery 85.0% for sulphides |
The Mineral Reserve estimate for the Project is tabulated in Table 1.4.
| | Page 18 |
| | NI43-101 ITR - Updated Mineral Resource Estimate for Buckreef Gold Project |
Table 1.3: Buckreef Project Pit-Design Optimized Mineral & ROM stockpile Reserves as at 26 June 2018
| Pits Design Reserves Summary | COG: Oxide & Trans = 0.38, Fresh = 0.41 | ||||
| Virimai 26th June 2018 Pit Design Reserves Summary | |||||
| Prospect | Reserves | Tonnes | Grade | In Situ Gold Content | |
| Name | Category | (Mt) | Au (g/t) | Kg | oz |
| Buckreef | Proven | 8,174,415 | 1.64 | 13,374.06 | 429,985.66 |
| Probable | 8,174,147 | 1.40 | 11,435.72 | 367,666.58 | |
| Waste | 160,217,840 | ||||
| Total (Proven + Probable) | 16,348,562 | 1.52 | 24,809.78 | 797,652.24 | |
| Eastern Porphyry | Proven | 79,385 | 1.17 | 93 | 2,982 |
| Probable | 976,281 | 1.03 | 1,003 | 32,242 | |
| Waste | 9,823,917 | 0.02 | |||
| Total (Proven + Probable) | 1,055,666 | 1.04 | 1,096 | 35,224 | |
| Tembo | Proven | - | - | - | - |
| Probable | 70,183 | 2 | 165 | 5,312 | |
| Waste | 1,354,468 | - | |||
| Total (Proven + Probable) | 70,183 | 2.35 | 111 | 3,582 | |
| Bingwa | Proven | 1,098,383 | 2.39 | 2,366 | 76,074 |
| Probable | 510,154 | 1.30 | 377 | 12,108 | |
| Waste | 10,311,734 | ||||
| Total (Proven + Probable) | 1,608,536 | 2.04 | 2,743 | 88,182 | |
| Grand Total | Proven | 9,352,183 | 1.72 | 16,092 | 517,358 |
| Probable | 9,730,764 | 1.36 | 13,265 | 426,492 | |
| Proven +Probable | 19,082,947 | 1.54 | 16,749 | 943,851 | |
Source: Virimai Projects 2018
(1) Mineral Resource is inclusive of Mineral Reserve shapes, mining recovery, mining dilution and open-pit preproduction development costs. Mineral Reserve estimate includes dilution.
(2) Mineral Reserve was estimated using NI43-101F compliant Standards on Mineral Resources and Reserves, Definitions.
(3) Ccontained metal may differ due to rounding.
The reserve statement for the Buckreef Gold Project is as summarised in table 1.5
Table 1.4: Buckreef Mineral Reserve Statement as at 26 June 2018
| Tonnes | Grade | In Situ Gold Content | |||
| (Mt) | Au (g/t) | Kg | oz | ||
| Buckreef Project | Proven -Stockpile | 119,726 | 1.86 | 223 | 7,160 |
| Proven | 9,352,183 | 1.72 | 16,092 | 517,358 | |
| Probable | 9,730,764 | 1.36 | 13,265 | 426,492 | |
| Mineral Reserves | 19,202,673 | 1.54 | 29,580 | 951,010 | |
(1) Mineral Resource is inclusive of Mineral Reserve shapes, mining recovery, mining dilution and open-pit preproduction development costs. Mineral Reserve estimate includes dilution.
(2) Mineral Reserve was estimated using NI43-101F compliant Standards on Mineral Resources and Reserves, Definitions.
(3) Ccontained metal may differ due to rounding.
Reserves were calculated from pit design. Full Grade Ore cut-off grade (FGO) calculations rely on inputs from this study and other sections of the Buckreef Prefeasibility study. Reserves are based on a gold price of $1300/oz for pit design, and cut-off grade 0.38g/t. Inferred Mineral Resources are considered geologically speculative and are not used in project economics, nor are they considered for mining plans. The study is only restricted to open pit mining at this stage with.
| 1.8 | Interpretations and Conclusions |
TRX has undertaken detailed exploration diamond core drilling and sampling of the Buckreef deposit during the period January 2019 to February 2020 with the aim of upgrading the inferred resources within the pit shell
| | Page 19 |
| | NI43-101 ITR - Updated Mineral Resource Estimate for Buckreef Gold Project |
generated by Virimai Projects in 2018 and to test for the mineralisation continuity down dip below the pit shells. These activities have been undertaken by applying industry best standard methods and practices.
Sample collection and preparation has been done using industry best practices and analysis have been undertaken by certified laboratory resulting in results that support the Mineral Resource estimates as fully outlined in Chapter 14 of this update report. In light of the results of this resource update Mr W Kutekwatekwa recommend the advancement of the project to a full feasibility study.
The project has positive attributes that justify the advancement of the project to the next stage. Some of positive attributes of the project which were fully outlined in the Amended ITR of 2018 (Virimai Projects 2018) include the following:
| ● | Increased inventory of mineral resources in the Buckreef prospect. |
| ● | Metallurgical test work provides favourable indications that optimal gold recoveries can be achieved through cyanidation leaching of both oxides and fresh rock mineralization. Test work of samples of the both oxides and sulphides indicates that recoveries in the order of 92% for oxides and 90% for fresh rock can be achieved. |
| ● | The project can be developed in stages utilizing cash flows from free dig oxides mineralization to capitalize future fresh rock mining and processing of the deposit. |
| ● | The potential for transitioning from open pit to underground exists as indicated from the down dip mineral resources at depth which cannot be accessed through open pit mining. |
| ● | The objective of Virimai’s mandate was to prepare an updated mineral resource estimate for the Buckreef Project and prepare a supporting Independent Technical Report (ITR) in compliance with NI43-101 and CIM Definition Standards. After conducting a detailed review of all pertinent information and completing the mandate Mr W Kutekwatekwa concludes as follows: |
| ● | The data base supporting the 2020 Mineral Resource Estimate for the Buckreef Gold Project is complete, valid, and up to date (including historical drilling and current drilling 2019 program) |
| ● | The geological and grade continuity of gold mineralization in the Buckreef deposit has been demonstrated and is supported by surface drilling carried out in the area. |
| ● | The mineral resource estimate is considered to be reliable, thorough and based on quality data and reasonable assumptions in accordance with NI43-101 requirements and CIM Definitions Standards. |
| 1.9 | Recommendations |
The project appears to have positive attributes that justify the advancement of the project and in that vein, Mr Wenceslaus Kutekwatekwa would recommend the following follow:
| 1. | To continue with the ultra-deep drilling programme to increased inventory of mineral resources down dip and the north east strike mineralization’s extend in the Buckreef Main in the identified explorations targets. |
| 2. | Complete the metallurgical testing of the fresh rock samples to identify the low costs alternative processing of the ores of the Buckreef Project. |
| | Page 20 |
| | NI43-101 ITR - Updated Mineral Resource Estimate for Buckreef Gold Project |
| 3. | To carry out rock geo-technical studies to see their impact on the pit slope stability and possible underground mining options. |
| 4. | To carry out additional detailed metallurgical test work, on all significant lithological domains, to inform the gold recovery methods and the development of the processing flow sheet. |
| 5. | To recomputed the Mineral Reserves on the updated Mineral Resources in this report. |
| 6. | To proceed to the project full Feasibility Study. |
| 7. | To maintain a strict local legal compliance checklist for the project, in order to close any unreasonable political machinations. |
| | Page 21 |
| | NI43-101 ITR - Updated Mineral Resource Estimate for Buckreef Gold Project |
| 2. | INTRODUCTION |
Buckreef Gold Project (“Buckreef”) is an advanced exploration gold project which comprise of four gold deposits namely Buckreef, Eastern Porphyry, Tembo and Bwinga all within 4km of each other. Buckreef deposit is the largest of the four deposits of the area. The gold project is located in the Geita District in Tanzania East Africa. Tanzanian Royalty Exploration Corporation (TRX) a Canadian Listed company owns 55% interest in the Buckreef Project with the other remaining 45% held by State Mining Corporation of Tanzania (Stamico).
The Update Independent Technical Report Mineral Resources Estimate of the Buckreef discussed in this “Technical Report” has been prepared by Virimai Projects at the request of TRX. The study was prepared and compiled by Virimai Projects of Harare Zimbabwe as fully defined in this report.
A press release confirming the definition of an update of the Mineral Resource Estimates for the Buckreef Gold Project was published in March 2020 by TRX and this Independent Technical Report (ITR) is the supporting technical report providing the details of the estimation methodology and results.
The content of this report is based on exploration and drilling data collected by TRX and the results of estimation performed by Virimai Projects utilizing exploration and analytical data as of 28th February 2020. This Technical report was prepared in accordance with the guidelines set out in the National Instruments 43 - 101 Standards of Disclosure for Mineral Projects (NI43 -101). The main intent of this study is to provide an update on the mineral resources of the Buckreef Gold Project based on Buckreef’s most recent data on the exploration of the Buckreef prospect. Technical information including locations, mapping analytical data has been provided by TRX staff with supervision of Mr Kutekwatekwa of Virimai Projects during the exploration period.
The report draws some of its information from the previous reports filed with SEDAR (list). Where there has been no change most of the chapters have been reproduced as in the previous or latest filing.
| 2.1 | Scope of Study |
Virimai Projects was mandated to compile a technical report regarding the update of the mineral resources of the Buckreef Gold Project located in the Geita District in Tanzania East Africa, based on additional information and data generated during the exploration programme of January 2019 to February 2020. This technical report was prepared to comply with the disclosure and reporting requirements of National Instrument 43-101 (NI 43-101) and form 43-101F1. The mineral resources estimation is based on the CIM standards.
| 2.2 | Qualified Person and List of Consultants |
This study was prepared at the request of Mr James Sinclair, President and Chairman of TRX. TRX is a Canadian publicly traded company listed on the Toronto Stock Exchange (TSX) under the trading symbol TRX with its head office situated at:
Tanzanian Gold Corporation
82 Richmond Street West
Suite 208
Toronto ON
Canada N5C 1P1
| | Page 22 |
| | NI43-101 ITR - Updated Mineral Resource Estimate for Buckreef Gold Project |
This report titled “NATIONAL INSTRUMENT 43-101 Independent Technical Report - Updated Mineral Resource Estimate for the Buckreef Gold Mine Project, Tanzania, East Africa” was prepared by Mr Wenceslaus Kutekwatekwa a mining consultant with Virimai Projects for all Items except 13 and 17 for which Dr Frank Crundwell a metallurgical consultant with CP Solutions is responsible for.
The QPs acknowledges the contribution of the following personnel in the compilation of the update report.
| ● | Arimon Ngilazi BSc (Geology & Physics), BSC Hons Geology, CFSG (Mining Geostatistics) MBA, MSAIMM, MAusIMM, MGASA, MGSZ |
| ● | Wonder Mutematsaka BSc (Mining Engineer), ARSM, MBL(Unisa) Pr Eng. MASME, MZIE, MSAIMM |
| ● | Clarence Ndunguru (Mining Engineer) BSc (Mining Eng.), MSAIMM, MAusIMM |
| ● | Peter Zizhou (General Manager / Geologist) MSc (Geology), BSc Hons (Geology), Pri. Sci. Nat |
| 2.3 | Effective Dates and Declaration |
This Technical Report titled “NATIONAL INSTRUMENT 43-101 Independent Technical Report - Updated Mineral Resource Estimate for the Buckreef Gold Mine Project, Tanzania, East Africa” is considered effective as on the 15th of May, 2020. The QP opinion contained herein is based on information collected by Virimai Projects and TRX throughout the course of their investigations, which in turn reflects various technical and economic conditions at the time of writing. Given the nature of the mining business, these conditions can change significantly over relatively short periods of time. Consequently, actual results may be significantly more or less favourable.
This Report may include technical information which requires subsequent calculations to derive subtotals, totals and weighted averages. Such calculations inherently involve some degree of rounding and, consequently, introduce some margin of error. Where this occurs, the QP does not consider it to be material.
| 2.4 | Sources of Information |
The “NATIONAL INSTRUMENT 43-101 Independent Technical Report - Updated Mineral Resource Estimate for the Buckreef Gold Mine Project, Tanzania, East Africa” report is based on information supplied by TRX to Virimai Projects as summarized below and referenced in the text, and included in the reference Section 27 of this Technical Report: -
| ● | Historic exploration information from previous holders of the exploration rights, IAMGOLD Corporation (IAMGOLD), which surrendered the rights and exploration information to the Tanzanian government in 2009. The historic information is in the possession of TRX by virtue of the joint venture with Stamico; |
| ● | In-house exploration results from surveys undertaken by IAMGOLD in the course of its tenure; |
| ● | Published Venmyn independent technical reviews undertaken during the 2014 Mineral Resource update. |
| ● | Published Virimai Projects, “Amended Independent Technical Mining Reserve Estimate Pre- Feasibility Study on the Buckreef Gold Mine Project, Tanzania, East Africa” of June 26,2018. |
| | Page 23 |
| | NI43-101 ITR - Updated Mineral Resource Estimate for Buckreef Gold Project |
| ● | In-house exploration results from exploration surveys undertaken by TRX during the period January 2019 to February 2020. |
This report titled, “NATIONAL INSTRUMENT 43-101 Independent Technical Report - Updated Mineral Resource Estimate for the Buckreef Gold Mine Project, Tanzania, East Africa” (the “Technical Report”) was prepared to provide an update on the mineral resources of Buckreef Gold Mine based on the drilling and analytical results of the 2019-2020 drilling programme.
| 2.5 | Site Visit |
Virimai Projects representatives conducted site visit to the Buckreef Gold Project as indicated in the Table 2.2 herein. The intention of the visits to carry out observations of the drilling operations, drill core, collar locations and orientations, drill samples and assessment of the laboratory facilities in Tanzania.
Table 2.2 Qualified Person and Contributors Site Visits
| Company | Contributor | Status | Site Visit |
| Virimai Projects | Wenceslaus Kutekwatekwa | Qualified Person Independent | 18-21 April 2018 21-28 February 2019 19 to 22 February 2020 |
| Virimai Projects | Arimon Ngilazi | Contributor Independent | 18-21 April 2018 21-28 February 2019 21 to 26 Sep 2019. 19 to 22 February 2020 |
| Virimai Projects | Wonder Mutematsaka | Contributor Independent | 18-21 April 2018, 19 to 22 February 2020 |
| Virimai Projects | Clarence Ndunguru | Contributor Independent | 5 May 2018 |
Dr. Frank Crundwell an independent Metallurgical consultant was contracted to TRX in 2018 to carry out metallurgical test work of the Buckreef ore samples in Johannesburg South Africa for the prefeasibility study is responsible for the preparation of Item 13 and Item 17 included in this update technical report for mineral resource estimate. Dr Crundwell did no visit the project as part of this update report on mineral resource estimates but is the co-author with Mr W Kutekwatekwa of the ITR titled “Amended Independent Technical Mining Reserve Estimate Pre-Feasibility Study on the Buckreef Gold Mine Project, Tanzania, East Africa” of June 26, 2018.
| 2.6 | Acknowledgement |
The QPs would like to extend their gratitude and acknowledge the support provided by Buckreef staff during their various visits to the project. The contributions of these team members are gratefully acknowledged. The Qualified Persons takes full responsibility of any of the contributions that made it into this report.
| | Page 24 |
| | NI43-101 ITR - Updated Mineral Resource Estimate for Buckreef Gold Project |
| 3. | RELIANCE ON OTHER EXPERTS |
This Update Technical Report on the Mineral Resources Estimate of the Buck Reef has been prepared at the request of TRX. The QPs assigned to the current mandate is Wenceslaus Kutekwatekwa BSc Hons (Mining Eng.), MBA, FSAIMM for Items 1 to 12 and 14 to 27, and Dr Frank K Crundwell BSc (Eng.) Chem BSc (Financial Maths) MSc (Eng.) PhD of CP Solutions for Items 13 and 17of this update report. The QPs relied on the following the people or sources of information during the preparation of the technical update report:
| ● | Environmental Social Impact Assessment (ESIA) February 2014 carried out by Messrs Beatus J Mboya and J Nyaronyo of ENATA Private Limited for the Item 20 which was the basis of the certification of the project in 2014 (see EISA Certificate Appendix 32.3). |
| ● | Review of after tax NPV Model computations in Item 22 was carried out by Mr John Shimbala a Tanzanian Tax Consultant of ARK Associates July 2018. |
| ● | QP relied on information supplied by TRX on the legal opinion presented herein with respect to property titles, current ownership or possible litigation for Item 4.0 |
| | Page 25 |
| | NI43-101 ITR - Updated Mineral Resource Estimate for Buckreef Gold Project |
| 4. | PROPERTY DESCRIPTION AND LOCATION |
The Buckreef Gold Project is a description of four gold prospects which are namely Buckreef, Eastern Porphyry Tembo and Bingwa located in the Mnekezi Village in Geita District in north-central Tanzania. The project area is located 40km south west of the town of Geita, which in turn is approximately 110km south-west of the second largest city Mwanza (Figure 4.1).
The area is fully located by the following Geographical co-ordinates:
| ● | Latitude 03ᵒ 5′ 27.69″ S Longitude 032o 1′ 20.65″ E (ARC 1960 UTM Zone 36m: Latitude 391,367.93mE; Longitude 9,658,326.9mN) |
 |
| Figure 4.1: Location of the Buckreef Gold Project, Gieta District Tanzania |
| 4.1 | Mineral Tenure |
The Buckreef Gold Project is a gold exploration project comprises, a single Special Mining License covering an area of 16.04km2 and 12 Prospecting Licenses covering 98.19km2 (Figure 4.2).
| | Page 26 |
| | NI43-101 ITR - Updated Mineral Resource Estimate for Buckreef Gold Project |
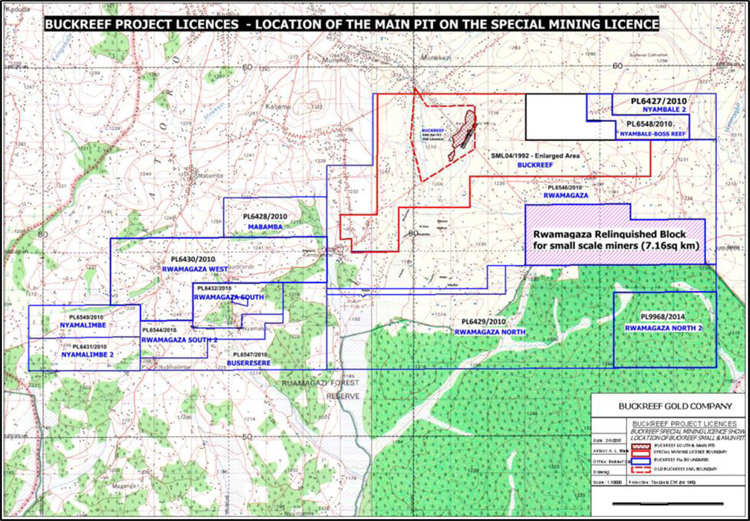
Figure 4.2: Buckreef Gold Project, TRX License Holdings, Geita District, Tanzania
The current Mineral Resources and Mineral Reserves for the Buckreef Gold project are declared over Special Mining License block SML04/1992.
In March 2017, the Buckreef gold special mining license (SML04/92) which covers an area of 16.04km2, was successfully renewed for a further 10 years to 16th June 2027. The licenses are operated by Buckreef Gold Company Limited, the Tanzam2000 (a subsidiary company of Tanzanian Gold Corporation).
| 4.2 | Mining Rights in Tanzania |
| i. | Basis for Mineral Title |
The state owns title to all mineral resources in The Republic of Tanzania. All permits conferring rights to explore and extract mineral resources are granted by the Minister of Energy and Minerals, (“MEM”) in terms of the Tanzania 2010 Mining Act. The Mining Act serves as the legal framework governing mining in the Tanzania.
| ii. | Exploration Permits (Rights and Obligation) |
The Ministry of Energy and Minerals (MEM) is responsible for guiding the development of the mining industry in Tanzania through the Mineral Division. The Tanzanian Mining Act, 2010, the Explosives Act, 1963, and the Mining (Mineral Rights) Regulations, 2010, regulate the law relating to prospecting and exploiting minerals, including granting, renewals, royalties, fees and other charges.
| | Page 27 |
| | NI43-101 ITR - Updated Mineral Resource Estimate for Buckreef Gold Project |
Mineral property and control over minerals is vested in The United Republic of Tanzania. Only companies incorporated in Tanzania may hold mineral rights in Tanzania; however, exploration and mining is open to foreign concerns. Royalties are charged on gross value which for precious metals is 6% and district council where a gold mine is located is entitled to collect a 0.3% on the revenues from gold production as service levy. There is no mandatory participation by the State although joint ventures with local companies are encouraged
Mineral rights under the Mining Act include Prospecting Licenses (PL), Retention Licenses (RL), Special Mining Licenses (SML), Mining Licenses (ML), Processing Licenses, Smelting Licenses and Refining Licenses. The prospecting license is granted for an initial period of 4 years. Upon 1st renewal, if the area is greater than 20 sq. km then 50% must be relinquished and the license is then valid for a further 3 years. Upon second renewal, if the license is greater than 20sq km then 50% must be relinquished and the license is then valid for a further 2 years. Mining Licenses are granted for an initial period of 10 years for medium scale mining operations with a capital investment between US$100,000 and US$100 million and are renewable. An Environmental Certificate issued by the National Environment Management Council (NEMC) is a prerequisite to the granting of a Mining License.
Special Mining Licenses (SML) are granted for large scale mining operations with a capital investment of more than US$100 million and are valid for the estimated mine life determined in the Bankable Feasibility Study (BFS). Holders of special mining licenses may enter into a Mining Development Agreement (MDA) with the Government which is subject to review every five years and at the renewal of the mineral right.
MDAs can guarantee fiscal stability for a long-term mining project, cover environmental matters which are project specific and not covered by the Mining Regulations, requirements for the procurement of goods and services available in Tanzania and the employment and training of citizens of Tanzania and the terms of State participation in long-term mining projects.
| iii. | Project Mining Permits |
The Buckreef Project comprises four gold deposits, namely Buckreef (North, Main & South), Bingwa, Eastern Porphyry and Tembo all located within a single Special Mining License, SML04/1992 (Figure 4.2). Geographical co-ordinates for each respective deposit are:
| ● | Buckreef North: Latitude 03ᵒ 5′ 27.69″ S Longitude 032o 1′ 20.65″ E (ARC 1960 UTM Zone 36m: Latitude 391,367.93mE; Longitude 9,658,326.9mN) |
| ● | Buckreef Main: Latitude 03ᵒ 5′ 27.69″ S Longitude 032o 1′ 20.65″ E (ARC 1960 UTM Zone 36m: Latitude 391,367.93mE; Longitude 9,658,326.9mN) |
| ● | Buckreef South: Latitude 03ᵒ 5′ 27.69″ S Longitude 032o 1′ 20.65″ E (ARC 1960 UTM Zone 36m: Latitude 391,367.93mE; Longitude 9,658,326.9mN) |
| ● | Bingwa: Latitude 03ᵒ 5′ 27.69″ S Longitude 032o 1′ 20.65″ E (ARC 1960 UTM Zone 36m: Latitude 391,367.93mE; Longitude 9,658,326.9mN) |
| ● | Eastern Porphyry: Latitude 03ᵒ 5′ 27.69″ S Longitude 032o 1′ 20.65″ E (ARC 1960 UTM Zone 36m: Latitude 391,367.93mE; Longitude 9,658,326.9mN) & |
| | Page 28 |
| | NI43-101 ITR - Updated Mineral Resource Estimate for Buckreef Gold Project |
| ● | Tembo: Latitude 03ᵒ 5′ 27.69″ S Longitude 032o 1′ 20.65″ E (ARC 1960 UTM Zone 36m: Latitude 391,367.93mE; Longitude 9,658,326.9mN). |
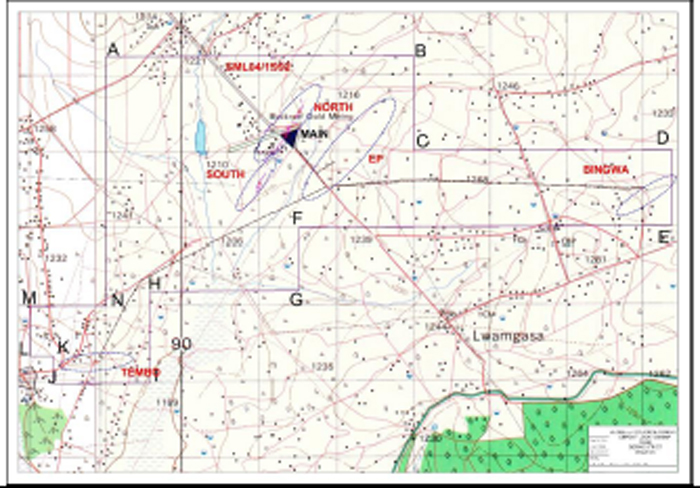 |
| Figure 4.3 Buckreef Project: Deposit Locality within Special Mining License Boundaries, Geita District |
The boundaries of the mining lease (SML04/1992) have been surveyed, whereas the boundaries of other, un-surveyed prospecting licenses are sourced from the Tanzanian Ministry of Energy and Minerals license maps.
| 4.3 | Underlying Agreements |
The Buckreef Gold Project is a gold exploration project which was originally held by IAMGOLD prior to July 2009. The “Agreement to Redevelop the Buckreef Gold Mine (ARBGM) between IAMGOLD and the Ministry for Energy and Minerals included at that point, a single Special Mining License and 12 Prospecting Licenses covering 98.19km2.
In July 2010, IAMGOLD applied to surrender all licenses relating to the ARBGM, effective 25 October 2009, and the Commissioner for Minerals withdrew all license applications relating to the ARBGM. In 2010, TRX was invited by STAMICO on behalf of the Ministry of Energy and Minerals, to tender for the opportunity to negotiate a joint venture agreement with respect to the Buckreef Gold Project.
TRX was awarded the tender, as confirmed in a letter from the Director General of STAMICO dated 16 December 2010. In October 2011, TANZAM2000, a 100% owned subsidiary of TRX signed a joint venture
| | Page 29 |
| | NI43-101 ITR - Updated Mineral Resource Estimate for Buckreef Gold Project |
agreement with STAMICO with regards to the Buckreef Gold Project. Through this JV agreement, a Tanzanian registered JV company, Buckreef Gold Company Limited, was formed with an equity holding of 55% Tanzam2000 and 45% STAMICO. In terms of the agreement, TRX through its subsidiary, Tanzam2000 will manage the Buckreef Project and is responsible for providing exploration and mine development financing. TRX expects that the project to be financed through debt or a combination of debt and equity. Net profits will be divided in accordance with the parties’ ownership interests after payment of all project expenses including debt service.
| i. | Environmental Considerations |
TRX initiated an environmental study of the Buckreef project area in 2012 by commissioning ENATA to undertake a preliminary socio-environmental study. As a result of the socio-environmental studies that were undertaken during the period 2004 to 2014 Buckreef was issued with an EIA certificate in terms of the Environmental Management Act No 20 of 2004 in May 2014 which is valid for the life of the mining project. The EIA certificate was issued with four main conditions which included the following:
| 1) | Installation of deep and shallow groundwater monitoring borehole around the waste rock dumps and the tailings storage facilities. |
| 2) | Installation of wall monitoring systems for the tailings dam facility to check for any likely movement of the walls. |
| 3) | Maintain a data base of the current and previous data on air, dust and noise levels in the Buckreef area. |
| 4) | Install water quality monitoring systems for the Nyamanzou River and Dam. |
| 5) | Carry out annual environmental audits of the mining area for submission to the EMA. |
| | Page 30 |
| | NI43-101 ITR - Updated Mineral Resource Estimate for Buckreef Gold Project |
| 5. | ACCESSIBILITY, CLIMATE, LOCAL RESOURCES, INFRASTRUCTURE AND PHYSIOGRAPHY |
| 5.1 | Accessibility |
Mwanza is the nearest major population center to the project, the centre is approximately 60km northeast of Buckreef, and is the second largest city in Tanzania with a population of 1million people.
Access to the project area is via ferry from Mwanza across Smith’s Sound across Lake Victoria, then via sealed road through the township of Geita. Alternative access is via sealed road through Shinyanga and Kahama, and subsequently via gravel road north to Bulyanhulu and then west to Nyarugusu.
The project can also be accessed by scheduled light aircraft flights (Coastal Air Services) from Mwanza to the airstrips located at Bulyanhulu or Geita Gold Mines, or more directly by charter to the bush airstrips located at Buckreef Mine or Nyarugusu Village. Access to the project area can be hampered in the rainy season due to the poor state of the grave road.
The project site itself lies 15 km south-east of Katoro Township on a series of unpaved roads. Within the project area, access is via local tracks and paths which are suitable for two-wheel drive vehicles in the dry season and four-wheel drive vehicles in the wet season.
| 5.2 | Climate |
The project experiences a temperate climate, with sub-humid moderate temperatures all year round. The mean annual rainfall is 1,264 millimeters (mm) (Veiga, 2004) and the Geita District has a bi-modal summer rainfall distribution, with two main rainy seasons: one from November to December and the other from February to May.
The period from June to August is usually dry. The rain occurs as localized storms rather than in a generalized downpour and runoff from the upland ridge and hardpan ferricrete areas on the mine site and its surroundings is very high. The run-off generates rapid response stream-flow and sheet-flow. The water table varies markedly from season to season which can influence drilling conditions. Consequently, the dry season, occurring between May and September is preferable for drilling programs and field operations. During the wet seasons, access is limited across black cotton soils. River drainages are impassable in the wet season without suitable bridge construction.
The annual minimum and maximum temperatures for Geita range between 14°C and 30°C. September is the warmest month with an average temperature of 29.2°C at noon, while July is coldest with an average temperature of 14.6°C at night. The area has no distinct temperature seasons and the temperature is relatively constant during the year. July is on average the month with most sunshine (Henning, 2011). The proposed project area is regarded as humid and the climate is classified as a tropical savannah (winter dry season), with a subtropical moist forest bio-zone (Henning, 2011).
| 5.3 | Physiography |
The average attitude of the Geita district ranges between 1,300 to 1,100 meters above sea level (m.a.s.l). The Geita district is characterized by hilly topography in the north, west and parts of the south west, with a gentle slope towards the south and southeast (Figure 5.1).
| | Page 31 |
| | NI43-101 ITR - Updated Mineral Resource Estimate for Buckreef Gold Project |
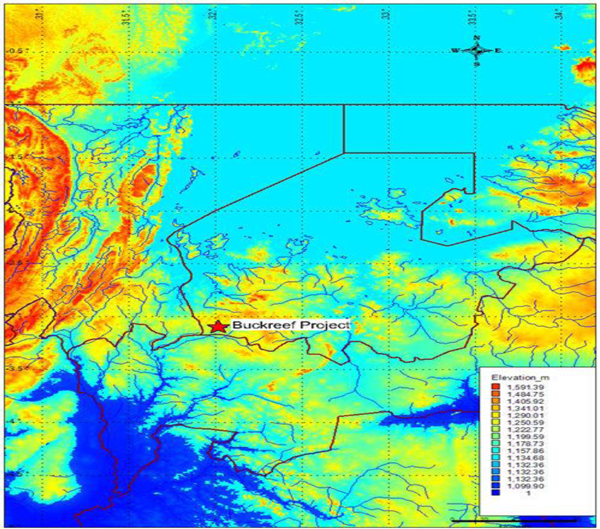 |
| Figure 5.1 Buckreef Project: Physiographic Map of North western districts of Tanzania |
There are pediments that are gently sloping towards the drainage depressions which are vulnerable to erosion, particularly where vegetation cover has been removed through cultivation, mining or overgrazing.
The Buckreef Project is dominated by very subdued terrain. Low rolling plateaus are cut by incised rivers on north, south and west sides. Major features are long ridges capped by hard iron-rich laterite (“cuirasse”). Where indigenous vegetation has not been cleared is dominated by miombo woodland.
There is one dam and one borehole at the Buckreef site at present. Water is relatively enough in supply for the current requirements and will need to be upgraded to meet mine requirement. The current supply is enough for drilling purposes, domestic use at the camp etc.
| 5.4 | Local Resources |
Geita town is an established mining community, located 40 km northeast of the Buckreef Project, with a fluctuating population of approximately 2,500 people. The town was established to service AngloGold’s Geita Gold Mine that has been in existence since the early 1930s.
Mining supplies, equipment, and services and a skilled mining and mineral exploration workforce are readily available in Mwanza and the mining communities in the Lake Victoria Gold belt (LVG) that has a long history of mining, which helps to attract employees and contractors from throughout Africa.
| | Page 32 |
| | NI43-101 ITR - Updated Mineral Resource Estimate for Buckreef Gold Project |
The project area is densely populated with individual and/or agglomerations of dwellings related to transient artisanal gold mining activities and pastoral farming. Local small pastoral villages are poor sources of logistical support though communication in the area is provided by a modern cell phone network, which has coverage in virtually all sectors of the LVG.
Tanzania National Electricity Supply Company (TANESCO) provides electrical power to site via a single transmission line. Power and water availability are adequate for current requirements and will be upgraded to meet future mining requirements.
Fuel is trucked in from the town of Mwanza and the district is well serviced by access roads to various operating large and medium scale mines in the district. The infrastructure surrounding the Buckreef Project area is generally poor and unpaved roads are poorly maintained rendering access during the rainy season difficult but passable.
The surface rights and area covered by the Special Mining License are sufficient for future mining operations, processing plant, waste sites and TSF sites. The process plant will be constructed and licensed to operate at up to 2,500t per day. The Company will construct sufficient accommodation on-site for all personnel and provides cafeteria services for employees housed in the Project’s current onsite camp accommodation.
| | Page 33 |
| | NI43-101 ITR - Updated Mineral Resource Estimate for Buckreef Gold Project |
| 6. | HISTORY |
The Lake Victoria Goldfield was discovered in 1894 by German explorers and significant exploitation began in the 1930s at the Geita Gold Mine. Several small gold mines exploiting near surface reefs, operated throughout the Rwamagaza Greenstone Belt, particularly near the village of Rwamagaza. By 1940, Tanzania was producing 4.5tpa of gold (Au).
Gold bearing quartz veins were reported from the current Buckreef Mine area in 1945 and reports from the 1950s attest to ongoing production at several localities near Rwamagaza, including the Buckreef area. The extent of the small-scale local and colonial mining activities is evident from the numerous pits and adits covering the entire Buckreef tenement, however no production figures are available.
The Buckreef Mine was an underground mine exploited in the name of the Buckreef Gold Mining Company owned by the Tanzanian State Mining Company (STAMICO) in 1972. A brief summary of the more significant exploration and mining activities covering the Buckreef project area is discussed below.
| 6.1 | Previous Exploration Work |
i. State Mining Corporation (STAMICO) ERA (1960-1990)
Following some artisanal mining activities in the 1960s, a United Nations Development funded 13-hole core drilling program for the government owned Tanzania Mineral Resources Department and this defined 107m long by 8m wide mineralized zone down to a depth of 122m. In 1968, the parastatal, Tanzania Mineral Resources department conducted another 13-hole core drilling program whose results were not made public.
The first attempt at underground development was undertaken by Williamson Diamonds Ltd in 1970, when the Buckreef Main shaft was sunk to 75m and lateral developments were done at 30m and 60m depths respectively. The mining results failed to meet expectations and no production records were availed and the mine closed down and the projected reverted back to the Tanzania Mineral Resources department.
ii. Comprehensive Exploration ERA (1992-2010)
From 1992 to 1994, East Africa Mines Ltd. entered into an exploration agreement with the Tanzania Mineral Resources Department, now renamed STAMICO and commenced regional and project scale reverse air blast (RAB), reverse circulation (RC) and diamond core (DC) drilling centred on the Buckreef main shear structure. The results of their exploration program culminated in the signing of the first Buckreef Redevelopment Agreement (“BRDA”) with Stamico.
In 1996, Spinifex Gold, an Australian registered junior exploration company acquired East Africa Mines Ltd and took over responsibility on the BRDA. In 2003, Spinifex Gold was acquired by Gallery Gold, another Australian registered mining and exploration company. In 2006, Gallery Gold was subsequently acquired by IAMGOLD, a Canadian registered mining and exploration company who then entered into the second BRDA with STAMICO.
IAMGOLD undertook a 4-year exploration program that included regional airborne geophysical surveys, project scale soil surveys and trenching, exploration and metallurgical and hydrogeological drilling.
| | Page 34 |
| | NI43-101 ITR - Updated Mineral Resource Estimate for Buckreef Gold Project |
In early 2010, IAMGOLD then surrendered the project back to STAMICO as part of a corporate decision to relocate and concentrate on projects in Mali.
| | Page 35 |
| | NI43-101 ITR - Updated Mineral Resource Estimate for Buckreef Gold Project |
| 7. | GEOLOGICAL SETTING AND MINERALIZATION |
| 7.1 | REGIONAL GEOLOGICAL SETTING |
The Buckreef Project is situated within the Lake Victoria Greenstone (LVG) belt of northern Tanzania which consists of several east-west trending, linear, Archaean greenstone belts. The LVG is the third largest gold producing region of Africa, surpassed only by the Witwatersrand Basin in South Africa and the Tarkwa region of Ghana. Numerous gold occurrences have been identified in the LVG and new discoveries continue to be made. Since 1998, when the first mine, Golden Pride was commissioned, four additional large scale mines namely, Geita, Bulyanhulu, North Mara, and Tulawaka have come into commercial production. Geita and Bulyhanulu are considered world-class deposits, together representing in excess of 35Moz of gold resources.
The Sukumaland Greenstone belt is one of eight Achaean greenstone belts that occur within the Lake Victoria Goldfield of northern Tanzania. The stratigraphy of Lake Victoria Goldfield (LVG) can be divided into three major groups; the Lower Nyanzian, Upper Nyanzian and Kavirondian. The Sukumaland Greenstone Belt has an outer arc (Upper Nyanzian) and inner arc (Lower Nyanzian) stratigraphy cored by granitic rocks (Figure 7.1).
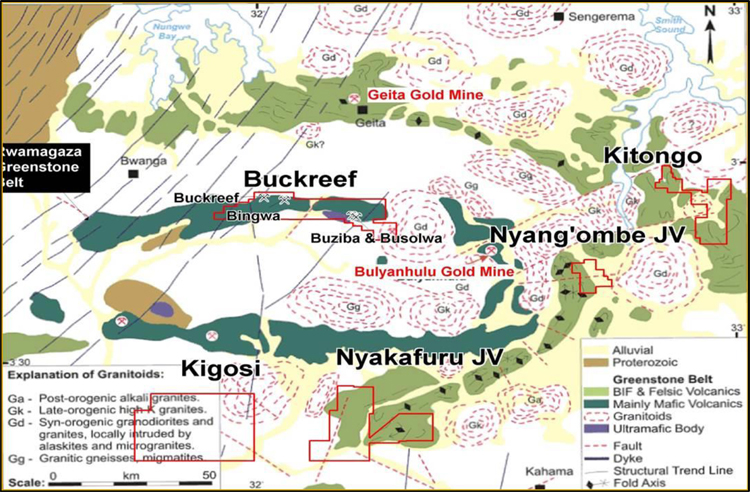
Figure 7.1 Regional Geology Map, Buckreef Gold Project, Lake Victoria Greenstone Belt, Tanzania
The Rwamagaza greenstone Belt, host to the Buckreef Project, forms the inner arc of Sukumaland Greenstone Belt that comprises dominantly mafic volcanic stratigraphy with minor felsic feldspar porphyry and quartz-
| | Page 36 |
| | NI43-101 ITR - Updated Mineral Resource Estimate for Buckreef Gold Project |
feldspar porphyritic, flow-banded rhyolite units. Ultramafic rocks occur in isolated locations in the area to the west of the Busolwa-Buziba prospects.
The top of the Lower and upper Nyanzian system is overlain by Kavirondian age rocks. Apart from occurrences in North Mara, Nikonga and BulangaMurwa, the Kavirondian is not widely distributed in the LVG. The Kavirondian rocks are generally coarse clastic molasses that include polymictic conglomerate, gritstones, quartzites, shales and siltstones, metatuffs and intermediate to acidic volcanics and while no clear tectonic setting has been put forward for these rocks, it is speculated that they were deposited in small pull apart basins.
The regional metamorphic grade of the Nyanzian is largely low grade, greenschist facies though areas of amphibolite facies are recorded, for example at Msasa and Tulawaka Mine. Local contact metamorphism caused by granite intrusions is also developed, but in general higher grade metamorphic complexes are rare.
The greenstone belts are set in a terrain of syntectonic granite, granite gneisses, late kinematic granites and associated felsic intrusives. There is a general lack of detailed regional mapping and standardization of lithological names in the LVG and consequently there is no officially recognized division of this terrain. Quennel (1960) has proposed a fivefold classification for the intrusions (G1 – G5), however subsequent authors, notably Barth (1990) and the UNDP (1986b) adopted a simpler two-fold classification dividing the intrusions into synorogenic and late kinematic cycles.
The synorogenic cycle (G1, G2 and G3 granites) is comprised of migmatites, foliated and porphyroblastic granites, biotite – hornblende granite, tronhjenite, granodiorite, tonalite, adamelite, monzanite and quartz diorite. These lithologies include all those formed by interaction with the greenstone belts and the theoretical pre Nyanzian age granitoid basement. It is probable that some of these early units are synvolcanic intrusives that fed the felsic volcanism of the Nyanzian greenstones.
The late kinematic granites (G4 and G5) are probably post Nyanzian age and possibly post Kavirondian age intrusive events. Typically, these intrusive include biotite granites, porphyritic biotite granites, microgranite, feldspar porphyries and felsophyric dykes and where mixing with the greenstone belt lithologies occurs the rocks become locally gneissose in texture and granodioritic in chemistry. These late intrusions often appear circular and there is evidence of slight banding suggesting a diapiric origin. However, some are less regular in shape and in the Nzega, Geita and eastern Iramba Sekenke Greenstone belt appear to have an alignment along the 1100 and 0700 or have contacts affected by these directions.
Numerous dolerite, gabbro and ultramafic bodies have been intruded in to the Lake Victoria Goldfields. Possibly the most significant phase is related to a system of north south, west southwest trending magnetic dolerite dykes. While they rarely crop out they are often identifiable from magnetic surveys.
The trends of the north south dykes maybe divided into two sub sets, 3500 and 0100 (Halls et al, 1984). The 3500 subset is largely confined to the Tanzanian craton area and where they intersect the Proterozoic age Ubendian or Usagaran belts they are highly altered hence have an age pre 2100Ma. In contrast the 0100 subset is largely unaltered and is observed cross cutting the Lower Proterozoic Ubendian belt indicating an age
| | Page 37 |
| | NI43-101 ITR - Updated Mineral Resource Estimate for Buckreef Gold Project |
younger than this orogenic event. Barth does not differentiate between the two sets and believes them both to be of Karroo age.
The regional structure is poorly understood and the correlation of specific structures from one greenstone belt to another is difficult.
Two phases of folding are generally recognized in the Nyanzian System (Barth, 1990). The first phase generated symmetric, east west trending, isoclinal folds. It is likely that this was coincident with tectonic stacking and thickening i.e. thrusting. Following this early phase, a second phase of cross folds with axial planes striking approximately 1000 - 1200 developed. These are coincident with major dextral lineaments that cross cut the LVG area (Figure 7.2).
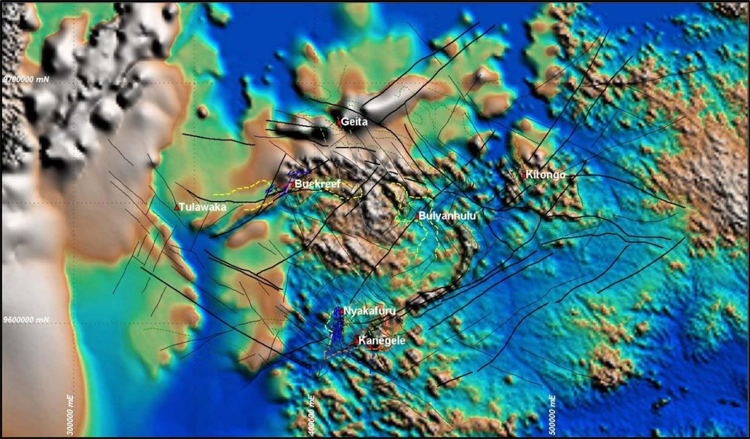
Source: SRK Report RS102/02-August 2002,
Figure 7.2 Regional Structural Geology Setting, Buckreef Project, Rwamgaza Greenstone Belt, Geita District, Tanzania
A key factor in the localization of gold mineralization seems to be where this second phase and/or regional lineaments cross cut the primary east – west phase.
The Lake Victoria Goldfield is the third largest gold producing region of Africa, surpassed only by the Witwatersrand Basin in South Africa and the Tarkwa region of Ghana. Numerous gold occurrences have been identified in the LVG, and new discoveries continue to be made. Since 1998, when the first mine, Golden Pride was commissioned, four additional large-scale mines namely, Geita, Bulyanhulu, North Mara, and Tulawaka have come into production. Geita and Bulyanhulu Mines are considered world-class deposits, together representing more than 60Moz of gold resources.
| | Page 38 |
| | NI43-101 ITR - Updated Mineral Resource Estimate for Buckreef Gold Project |
The Lake Victoria Goldfield has geological and structural similarities to major gold districts in the Canadian Shield (Val d´Or, Kirkland Lake) and the Yilgarn Craton in Western Australia (Kalgoorlie, Laverton, Leonora, Kambalda and Southern Cross). Gold mineralization within the Lake Victoria Goldfield occurs in number of styles including: -
| ● | quartz veins within minor brittle lineaments, most commonly worked on a small-scale by artisanal workers, due to their limited extent and erratic gold distribution (such as at Bulangamirwa workings in the Nzega Greenstone Belt); |
| ● | mineralization within major ductile shear zones; |
| ● | mineralization associated with replacement of iron formation and ferruginous sediments; and |
| ● | felsic (porphyry) hosted mineralization, such as within the Rwamagaza Greenstone Belt. |
Nutt (2003) also notes that approximately 19% of known gold occurrences in the LVG are associated with or hosted in part, by felsic intrusives (excluding granitoids) and significantly at least four of the larger gold deposits have known diorite or quartz and/or feldspar porphyry’s in close association i.e.:
| ● | Geita Group (diorites and felsics), |
| ● | Bulyanhulu (quartz porphyry), |
| ● | Golden Pride (quartz porphyry or rhyolite bodies) and |
| ● | Mobrama deposit – North Mara Group (siliceous felsic rock, protolith: quartz porphyry). |
Regardless of the geological environment, it is accepted that structural control on the emplacement of the mineralization is critical. The following structural features have proven to be important foci of gold mineralization: -
| ● | Structural lineaments trending at 120º; |
| ● | Flexures and splays to the 120º trend (such as at Golden Pride); |
| ● | Structural lineaments at 70º (such as at Golden Ridge); and |
| ● | Granite-greenstone contacts (such as at the Ushirombo and Rwamagaza Greenstone belts). |
| 7.2 | LOCAL GEOLOGIC SETTING |
Buckreef Gold Company Limited’s Buckreef Project is in the regionally east-west trending Rwamagaza greenstone belt. This belt is considered a segment of the larger Sukumaland greenstone belt and is one of the larger greenstone belts in northern Tanzania.
Substantial areas of the Buckreef Project are covered by lateritic units, dominantly gravels, mbuga soil and cuirasse. Cuirasse forms some highly indurated upper facies of the lateritic regolith. Several lateralization
| | Page 39 |
| | NI43-101 ITR - Updated Mineral Resource Estimate for Buckreef Gold Project |
events have resulted in weathering to depths of up to 40m. The limited bedrock exposure has hampered the development of detailed geologic models for the region.
Hill (2006) reported on a geological investigation of the Buckreef Project area for IamGold Ltd. In this PowerPoint presentation, Hill (2006) described the geology of the Buckreef Project as consisting of a tightly folded sequence of lower mafic, upper mafic-ultramafic sequence. The Lower mafic unit appears to be more deformed than upper mafic unit. The two units are separated by magnetic ultramafic flow at unconformity boundary. The mafic –ultramafic units are sandwiched between older granite to the south and young late granite to the north. The margins of granite intrusions have higher magnetic signature suggesting contact metamorphisms (Figure 7.3).
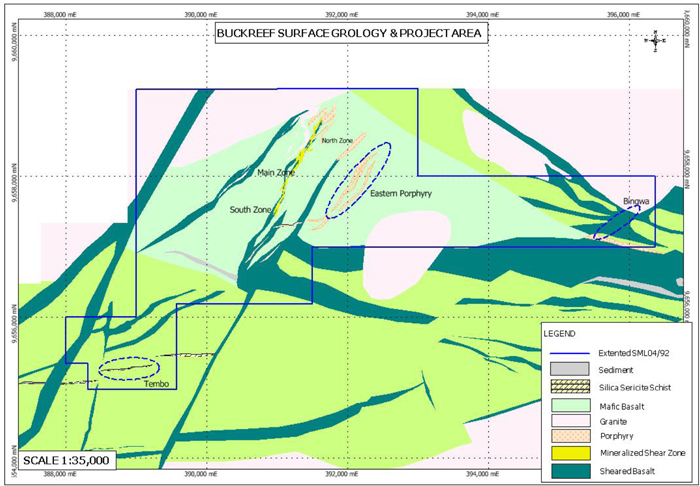
Figure 7.3 Local Geological Setting, Buckreef Project, Rwamagaza Greenstone Belt, Geita District, Tanzania
The belt is bisected by an East – West trending lineament, that is interpreted as a first-order, crustal scale, sinistral shear zone namely as the Rwamagaza Shear Zone (RSZ). The Rwamagaza greenstone sequences have been affected by at least two deformation events. The deformation D1 forms a weak E - W trending foliation and massive “buck” quartz veins that are weakly prospective for gold mineralization. D2 corresponds to the main phase of deformation and resulted in the progressive development of NE trending shear zones, and a pervasive NE foliation. N to NNE trending dextral shear faults formed during D2 and are associated with stock- work quartz veins and significant gold mineralization.
| | Page 40 |
| | NI43-101 ITR - Updated Mineral Resource Estimate for Buckreef Gold Project |
Several published data considered that regional gold deposition is tightly constrained to the pre-Lamprophyre intrusion (2697 ±10 Ma) and pre-Kuria volcanic rocks (approx. 2660Ma).
| 7.3 | DEPOSIT GEOLOGY |
Buckreef Gold Company Limited has defined four mineral deposits on the Buckreef Property. As estimated in this technical report, from largest to smallest based on ounces of gold, these include the Buckreef mineralized corridor, Bingwa, Eastern Porphyry and Tembo Deposits. In addition to the historical descriptions as summarized from reports by Venmyn (2012; 2014) and IAMGOLD (2003-2009), Tan Gold has further refined the geology of the main Buckreef deposit through interpretation of recent drilling results and historical mineralogical test-work whose interpretation is herein incorporated.
| 7.3.1 | Buckreef Deposit |
The Buckreef Prospect is a shear zone hosted gold deposit within a sequence of mafic basalts and dolerites, near basement granite. The host rocks at the Buckreef deposit comprise primarily pillowed, amygdaloidal and massive mafic meta-volcanic rocks which have been intruded by medium to coarse grained dolerite sills and dykes. Slivers of carbonaceous units have been observed in some drill-core sections incorporated in the meta- volcanic assemblages. Minor granitoids (possibly metasomatic) are noted in the north part of the deposit towards the contact with the northern granite (Figure 7.3a).
| | Page 41 |
| | NI43-101 ITR - Updated Mineral Resource Estimate for Buckreef Gold Project |
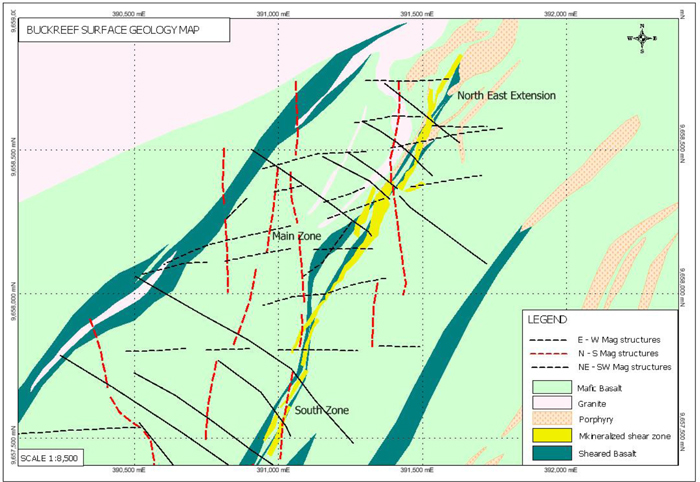
Source: TRX 2020
Figure 7.3 Local Geological Setting, Buckreef Deposit, Geita District, Tanzania
The greenstone rocks for the most part comprise mafic to intermediate volcanic with only a minor sedimentary component. Two major groups of primary lithologies have been distinguished with some confidence, namely formerly glassy quenched mafic lavas and lava breccias (textures suggest basaltic komatiites or magnesian quartz tholeiites), and high-level small intrusive bodies of broadly tonalitic rock. The latter include relatively fine-grained holocrystalline varieties, and less common porphyritic varieties with a very fine groundmass, suggesting either a near-margin very shallow intrusive or a volcanic origin (Crawford, 2005)
The table below is an extract from an internal mineralogical report by Mason (220) and Crawford (2005) that classified the dominant rock types and alteration styles prevalent at Buckreef mine.
| | Page 42 |
| | NI43-101 ITR - Updated Mineral Resource Estimate for Buckreef Gold Project |
| SAMPLE | ROCK NAME | MINERALOGY* | ||
| Primary** | Alteration*** | Veins | ||
| 1101-24 (BMRCD 185) | Strongly schistose, veined and chlorite-dolomite- sericite altered meta-basic rock (?quartz dolerite) | Qtz | Chl, car(dol), ser, leu/rut, opq(?py) | Car(dol), qtz, opq(?py), cal |
| 1101-25 (BMRCD 185) | Weakly foliated, medium-intensity chlorite-albitealtered meta-dolerite | Qtz | Alb, chl, cal, leu, opq(?sulp) | Cal |
| 1101-26 (BMDD 14) | Thinly veined and medium- to high-intensitycalcite-chlorite altered meta-basalt | - | Cal, chl, py, alb, leu/rut, cpy, hem, gld | Cal, chl, py, hem |
| 1101-27 (BMDD 4) | Veined foliated high-intensity sericite-dolomite-pyrite altered meta-dolerite | - | Car(dol), ser, py, qtz, leu, cpy | Car(dol), qtz, py, cpy, hem |
| 1101-30 (BMRCD 186) | Veined and medium- to high-intensity carbonate-albite-pyrite(-gold) altered meta-dolerite | - | Alb, car(?dol,?ank), py, ser, leu, cpy, gld | Qtz, car(?dol,?ank) |
| 1101-31 (BMDD 5) | Fractured and medium- to high-intensity chlorite-calcite-zoisite altered meta-basalt | - | Chl, cal, alb, zoi, spn, opq(?sulp) | Cal, chl, zoi, qtz |
| 1101-33 (BMDD 18) | High-intensity epidote-chlorite-calcite | - | Chl, epi, cal, alb, opq(?mt), spn | Cal, chl, epi, opq(?mt) |
| (-magnetite) altered meta-basic rock | ||||
| Low-intensity chlorite-magnetite altered meta-porphyritic basalt (dyke) | - | Alb, opq(?mt), cal, chl, epi | Cal, chl | |
| 1101-02 (BMRCD 222) | Actinolite-chlorite-epidote meta-basalt/?dolerite | - | Act, alb, chl, epi, cal, leu, qtz, opq(?py) | Cal, epi |
| 1101-03 (BMRCD 222) | Fractured and high-intensity dolomite-chlorite-sericite altered meta-basic rock (?basalt) | - | Car(dol), chl, ser, qtz, leu | Car(dol), chl, ser, opq(?py, ?cpy) |
| 1101-05 (BMRCD 222) | High-intensity carbonate-pyrite-gold altered meta-?basic rock | - | Car(?dol), py, alb, qtz, ser, chl, leu/rut,cpy, gld | - |
| 1101-06 (BMRCD 222) | Fractured and medium- to high-intensity chlorite-calcite-quartz altered meta-basalt | - | Chl, cal, qtz, opq(?py), rut, epi | Cal, qtz, chl, opq(?py) |
| 1101-07 (BMRCD 220) | Veined and deformed, foliated medium-intensity dolomite-sericite-chlorite altered meta-basaltic conglomerate | Qtz | Car(dol), ser, chl, alb, qtz, rut, py, cpy | Car(dol), qtz, chl, py, cpy |
| 1101-08 (BMRCD 220) | Fractured and medium-intensity dolomite-albite-chlorite-sericite altered meta-basalt | - | Car(dol), alb, chl, ser, rut, opq(?py), tou | Car(dol) |
| 1101-16 (BMDD 2) | Schistose high-intensity chlorite-calcite-sericite altered meta-quartz dolerite | Qtz | Chl, cal, ser, qtz, rut, opq(?py) | - |
| 1101-20 (BMDD 2) | Veined and high-intensity dolomite-albite-pyrite altered, brecciated meta-?basalt | - | Car(?dol, ?ank), alb, py, ser, rut, po | Qtz, car(?dol,?ank) |
| 1101-21 (BMRCD ?203) | Veined and deformed, medium-intensity albite- dolomite-sericite-chlorite-sulphide altered meta-basalt | - | Alb, car(?dol,?ank), ser, chl, opq(?py), leu/rut | Car(?dol,?ank), qtz, opq (?py,?hem), chl |
| 1101-22 (BMRCD 208) | High-intensity carbonate-sericite-albite altered basaltic breccia (?cataclasite) | - | Alb, car(?dol,?ank), ser, chl, opq(?py,?cpy), leu/rut | Qtz |
| 1101-23 (BMRCD 2) | Veined and weakly schistose medium-intensity albite-chlorite-dolomite-sericite-magnetite- hematite altered meta-basalt | - | Alb, car(dol), chl, ser, mt, hem, leu, py, cpy | Car(dol), mt, hem; Hem, qtz, cal |
Table 7.1: Summary of Rock names and mineralogy typical at Buckreef Gold Mine
*: Minerals are listed in each paragenesis according to approximate decreasing abundance.
**: Only primary minerals currently present in the rock are listed. Others may have been present, but are altered.
***: Earlier parageneses are separated from later parageneses by a semicolon.
Mineral abbreviations:
| Act = | actinolite; alb = albite; ank = ankerite; apa = apatite; cal = calcite; car = carbonate minerals (possible mineral in brackets); chl = chlorite; cpy = chalcopyrite; dol = dolomitic carbonate (possibly also including Fe-dolomite or ankerite); epi = epidote; gld = native gold; hem = hematite; leu = leucoxene; mt = magnetite; opq = undifferentiated opaques (possible mineral in brackets); po = pyrrhotite; py = pyrite; qtz = quartz; rut = rutile; ser = sericite; sph = sphalerite; spn = sphene; sulp = undifferentiated sulphides; tou = tourmaline; zoi = zoisite. |
Altered basic rocks display assemblages ranging from those dominated by chlorite + calcite ± opaques (mainly pyrite), through those dominated by assemblages of dolomite + chlorite + sericite + opaques, to those dominated by dolomite (?Fe-dolomite, ?ankerite) + pyrite + sericite + leucoxene/rutile ± native gold. Thin fracture fillings and veins contain assemblages that reflect the host rock alteration assemblage. The range of alteration assemblages is considered to represent increasing proximity to structures (fractures, shear zones, faults) which facilitated invasion of the rocks by mineralizing hydrothermal fluid(s), and about which alteration zones developed. Thus, the chlorite-calcite assemblages represent lower volume of fluid (distal alteration), and dolomite-pyrite-sericite-gold assemblages represent highest volume of fluid (proximal alteration) (Mason, 2002).
| | Page 43 |
| | NI43-101 ITR - Updated Mineral Resource Estimate for Buckreef Gold Project |
Alteration of these rocks is complex and variable. The mafic lavas and lava breccias show a silica-chlorite- magnetite+/-albite assemblage with little or no pyrite, and abundant late overprinting carbonate. Sericite and pyrite join this assemblage in the felsic intrusive units and those rocks interpreted as meta-sediments, and magnetite is generally much less prominent than in the mafic metavolcanics. Several generations of carbonate alteration are probably present, including an earlier one broadly contemporaneous with the sericite-chlorite- pyrite assemblage, and a later one that usually manifests as late cross-cutting veinlets.
The mineral assemblage includes py, ± po, cpy, mt with associated silica, carbonate and sericite alteration. Gold is associated directly with sulphides as microscopic inclusions. Sulphides are disseminated and may comprise up to 5% of the rock by volume. The gold mineralization at Buckreef Prospect is non-refractory in both fresh and oxide material. Deep drill-holes indicate that high grade mineralized zones plunge steeply to the north. Several narrow, more discontinuous sub-parallel zones of similar alteration and mineralization have been defined both to the west and to the east of the main fault zone.
Detailed logging of drill-hole core reveals a prominent deepening of the oxidation profile above portions of both the Main and North Zones. Superimposed on the host rock is an intensely weathered laterite profile up to 40m depth. Gold may be concentrated in the oxide weathering profile by supergene processes. Fresh sulphides generally do not occur shallower than 40m from surface. The base of the oxidation zone occurs between 15m and 40m, with an average depth of 30m, and the overburden consists of both black cotton soils and lateralized duricrusts with an average depth of ±3m-4m, to a maximum of 20m.
| 7.3.2 | Bingwa Deposit |
The Bingwa Prospect is located at the northern margin of the RGB, adjacent to a sheared contact with a granitic intrusive and is approximately 4km east of the Buckreef deposit (Figure 7.4) Gold mineralization has been identified in a drilling program over a strike length of 350m and up to 100m below surface, with the main zone of mineralization occurring over a strike length of 150m. Gold mineralization at Bingwa is associated with quartz veining in strongly foliated and altered greenstone in a shear zone adjacent to the granitoid contact. The shear zone strikes northeast and dips steeply to the northwest. The main zone of mineralization is associated with the junction of a northwest striking, shallowly north dipping fault and the northeast striking shear zone.
| | Page 44 |
| | NI43-101 ITR - Updated Mineral Resource Estimate for Buckreef Gold Project |
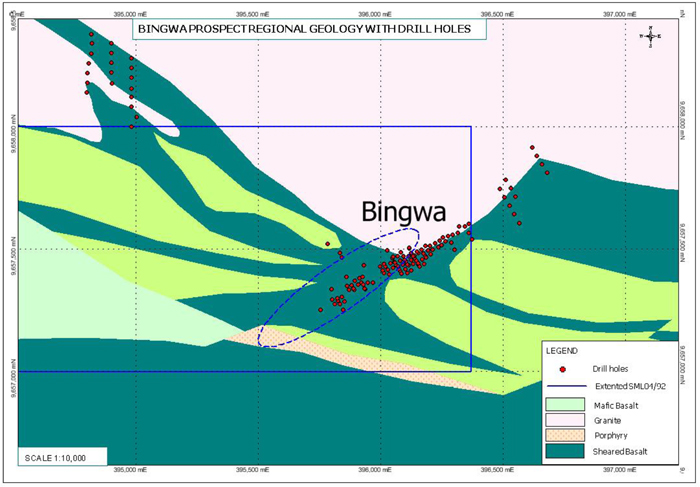
Source: TRX 2013
Figure 7.4 Local Geological Setting, Bingwa Deposit, Geita District, Tanzania
Deformation, alteration and gold mineralization appear to be limited to rheological contacts, between basalt and the early quartz veins and along the margin of the granite. The difficulty in constructing continuous grade envelopes may be due to limited continuity of the early quartz vein array, and/or the possibility that the veins are folded, transposed and boudinaged within shear zones.
Most the mineralization defined to date occurs within the oxide zone, which extends to 40m-60m below surface. The entire deposit is overlain by 5m to 8m of overburden and transported alluvial. Much of the Bingwa Prospect gold mineralization in the weathered profile occurs in lower saprolite, below the redox boundary.
There is negligible upper saprolite below the overburden cover. Given that there is typically limited chemical dispersion of gold in lower mafic saprolite, this may be one of the reasons for poor lateral grade continuity at the Bingwa Prospect. However, recent work at the Bingwa Prospect indicates that mineralization is hosted within the north-northwest to south-southeast trending structures at the intersection with the major northeast-southwest shear zone. The intersection between these structures is considered to play an important role in controlling high grade zones
| | Page 45 |
| | NI43-101 ITR - Updated Mineral Resource Estimate for Buckreef Gold Project |
| 7.3.3 | Eastern Porphyry Deposit |
The Eastern Porphyry deposit is located 0.8km east of the Buckreef main deposit and consists of weakly to moderately sheared felsic porphyry and younger fresh feldspar quartz porphyry dykes up to 30m wide within a mafic sequence dominated by medium grained dolerite.
The Eastern Porphyry structures occur within sheared basaltic lavas and medium grained dolerite intrusive of the northeast-southwest trending Nyamazama River lineament. The elongated intrusion attains a maximum thickness of 280m, but thins and disperses to the northeast and southwest into a series of relatively narrow quartz-feldspar-porphyry dykes (Figure 7.5).
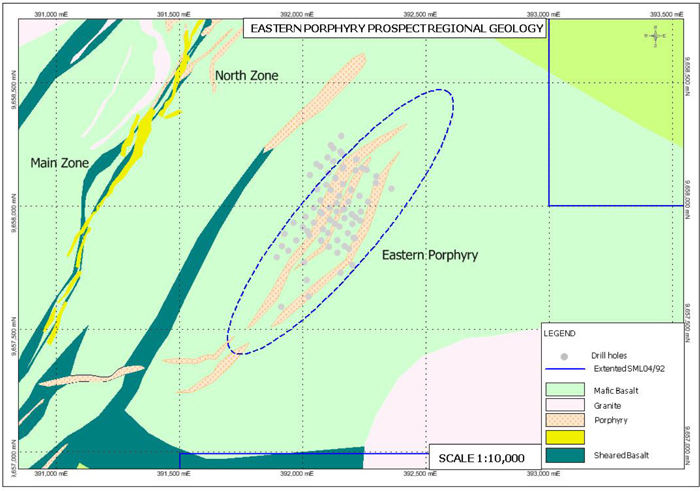
Source: TRX 2013
Figure 7.5 Local Geological Setting, Eastern Porphyry Deposit, Geita District, Tanzania
The Eastern Porphyry mineralization is associated with silicified and weakly pyritised shears, quartz veins and veinlets, and within quartz-feldspar porphyry. Quartz veining within the felsic unit may contain pyrite with or without low grade mineralization. However, zones of shearing within the dolerite up to 7m in width are associated with silica-carbonate-pyrite alteration. The mineralization has a total strike length of approximately 1,500m. The main intrusion is coincident with a circular magnetic anomaly in the area with a diameter of 350m (Barrett, 2000). In places the quartz-feldspar-porphyry is magnetite bearing, readily deflecting a hand magnet.
The gold mineralization occurs in a similar lithological and structural setting as at Buckreef Prospect, but the intensive carbonate-silica-pyrite alteration typical of the Buckreef deposit is lacking or poorly developed. The
| | Page 46 |
| | NI43-101 ITR - Updated Mineral Resource Estimate for Buckreef Gold Project |
fact that mineralization on the Nyamazama River lineament is less well developed than at Buckreef may be due to less dilation of the northeast-southwest shear compared to that of Buckreef Prospect or the presence of the porphyry intrusion which inhibited fluid flow and was less chemically reactive than the basalt.
| 7.3.4 | Tembo Deposit |
The Tembo deposit locates approximately 3km southwest of Buckreef Mine, adjacent to the main Rwamagaza Shear Zone. The mineralized zones at Tembo are confined to the east – west trending shears within met-basaltic volcanic package. Alteration in the mineralized zones consists of silica-carbonate-pyrite with well-preserved shear fabric (Figure 7.6).
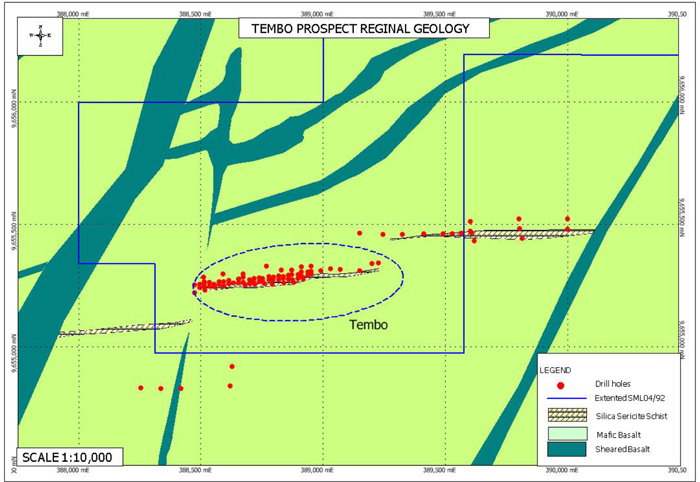
Source: TRX 2013
Figure 7.6 Local Geological Setting, Tembo Deposit, Geita District, Tanzania
Gold mineralization is associated with grey quartz thin veins, stringers and boudins parallel to the shear fabric. At Tembo deposit, the transported and residual soil cover is 7m to 9m deep, below which, completely altered and sheared mafic material occurs to a depth of 50m. Most of the oxidised zone has been exploited by artisanal mining.
| 7.4 | STRUCTURAL SETTING AND MINERALIZATION |
The defunct Buckreef Mine is located on a clearly defined, east-northeast/west-southwest trending, 5m-30m wide and 8km long, brittle-ductile shear zone within relatively un-deformed mafic volcanics. Based on preserved slickensides, the dominant displacement vector across the shear zone was sinistral, however the bulk
| | Page 47 |
| | NI43-101 ITR - Updated Mineral Resource Estimate for Buckreef Gold Project |
of the ductile fabric is post mineralization. Gold mineralization is associated with intense brecciation and quartz, carbonate, sericite pyrite alteration in at least two phases and is controlled within the regional shear by a fault zone with a 10m true width, drilled continuously for over 1.5km strike length (Figure 7.3a). A late stage veining event characterized by white, buck quartz veins, is evident in the main zone and is barren of gold mineralization but is the only visible sign of the structure in outcrop.
Gold mineralization at the Buckreef Mine is controlled by a combination of structure, host lithology, and proximity to the granite contact. The main structure is the NE-SW trending steeply dipping Buckreef Shear Zone that is displaced by a series of two dominant fault sets trending NNW-SSE and ENE-WSW. The ENE lineaments are probably related to the Rwamagaza Shear Zone and have been recently reactivated during the Bukoban and have been intruded by dolerite dykes with a strong magnetic signature even in drill-cores. The NNW trending lineaments appear to be open fractures or fault zones oftentimes host to slivers of late stage vein quartz emplacement (Figure 7.7).
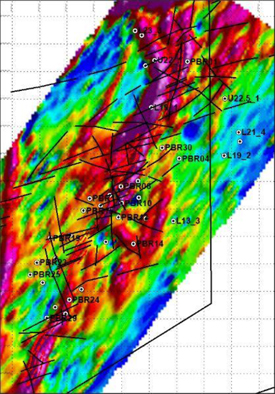
Source: TRX 2020
Figure 7.7 Structural Setting, Buckreef Deposit, Geita District, Tanzania
Crosscutting relationships are not clear, but the offset in the Rwamagaza Shear Zone along the NE Bukoban dykes suggests the Rwamagaza is the older structural event. There is little correlation between topographic lineaments and the interpreted bedrock structures, which suggests a late brittle structural event not reflected in the magnetics.
The meta-basaltic volcanic-hosted deposits Buckreef and Tembo, tend to consist of networks of anastomosing and steeply-dipping shear zones, exhibiting multiple, superimposed, phases of veining, alteration and deformation. The intrusive-hosted deposit, Eastern Porphyry, also exhibits multiple phases of veining, alteration and deformation, but tend to develop weak alteration and broader shear zones.
| | Page 48 |
| | NI43-101 ITR - Updated Mineral Resource Estimate for Buckreef Gold Project |
Bingwa and Eastern Porphyry are associated with intrusive contacts. This could be attributed to thermal aureole effect; however, it may also be controlled by competence contrasts and its effect on structural dilation during deformation and the consequent enhancement of permeability at these sites.
The structural setting and interpreted control on the main Buckreef deposit is as shown in the sketch below (Figure 7.8).
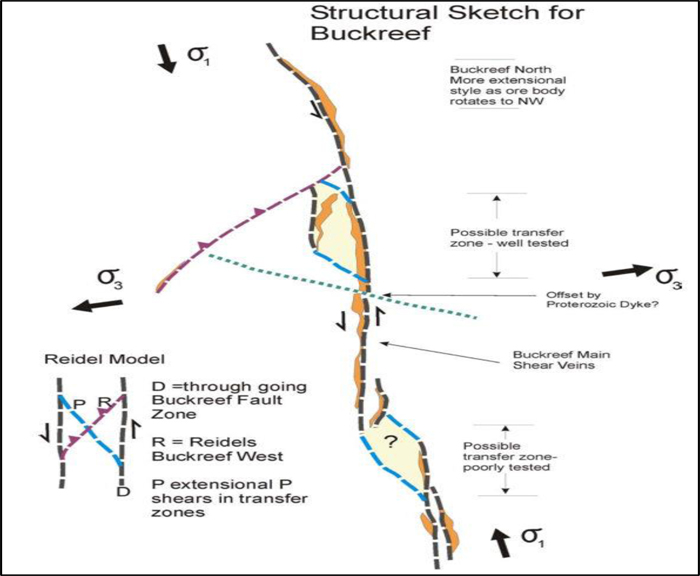
Source: Iamgold/SRK 2007
Figure 7.8 Structural Setting of the Main Buckreef Prospect, Rwamagaza Greenstone Belt, Geita District, Tanzania
Deformation occurred as part of the regional metamorphic event and varied from place to place in the rock sequence (i.e. partitioning of strain). Some samples display massive textures with good preservation of primary textures, but others are variably foliated. Logging in some drill-core samples show distinctive breccias, possibly of cataclastic deformational origin (i.e. fault zone). It is important to note that microtextures support the interpretation that alteration and associated mineralisation occurred during and/or after deformation, that is deformation of the rocks generated conduit systems which allowed invasion of the rocks by hydrothermal fluid(s).
The rock types, metamorphism, deformation and alteration are typical of Archaean lode-gold mineralised systems.
| | Page 49 |
| | NI43-101 ITR - Updated Mineral Resource Estimate for Buckreef Gold Project |
Gold is strongly associated with silica-carbonate alteration and veining. Sulphide minerals associated with mineralization consist predominantly of pyrite and minor chalcopyrite. Gold grains up to 60 microns in size have been reported in both low and high grade zones. Visible gold is known from all deposits but is not common. High amount of gold is found as inclusion in pyrite as well as fracture-filling in pyrite and chalcopyrite. Gangue minerals of interest include clay, feldspar, quartz, dolomite, and hematite and goethite in the oxide and transition material.
| | Page 50 |
| | NI43-101 ITR - Updated Mineral Resource Estimate for Buckreef Gold Project |
| 8 | DEPOSIT TYPES |
| 8.1 | Regional |
The Lake Victoria Goldfield hosts numerous small-scale and five large-scale orogenic gold deposits. Term ‘orogenic gold deposit’ is broad in scope and encompasses meso-thermal gold deposits, shear-hosted, lode-gold and metamorphic gold deposits. Orogenic gold is a distinctive class of mineral deposit that has been the source for much of world Au production.
The ores are widely recognized in both Phanerozoic mobile belts and older cratonic blocks. Orogenic gold deposits have formed over more than 3 billion years of Earth’s history, episodically during the Middle Archaean to younger Precambrian, and continuously throughout the Phanerozoic.
Typically, orogenic gold deposits are formed in regionally metamorphosed terranes, during compressional or transpressional tectonic processes at continental plates margins, in accretionary or collisional orogenic events. In both tectonic regimes, hydrated marine sedimentary sequences are added to continental margins. Subduction related thermal events then drive extensive hydrothermal fluid systems through the hydrated accretionary sequences, which results in the emplacement of gold bearing quartz veins from depths of 15km to 20km to surface (Groves 1997).
The mineralization is commonly post the deformation of the host rock but is syn-orogenic with respect to the on-going deep crustal, subduction related thermal processes (Groves 1997). In addition, mineralization has been theorized to be associated with short-lived pulses of metamorphic fluids that are released by the rapid devolatilisation of a rock column undergoing burial in a convergent orogen.
The goldfield deposits are hosted by sedimentary units intercalated with volcanics and all are associated with quartz veining. The largest deposit at Geita is hosted by ferruginous chert-pelite units. The Rwamagaza Greenstone Belt hosts numerous small-scale gold deposits exploited by small-scale miners, as well as the Tulawaka Mine that has produced more than 1 Moz at the western limit of the RGB, 56km to the west of the Buckreef Mine.
All the deposits currently being exploited by artisanal miners in the Buckreef Project area consist of narrow discontinuous quartz veins within meta-basalts, shear zones, contact zones with felsic intrusives and metamorphic foliation.
Each of the four prospects, whilst generally formed under conditions described above, are unique in the mechanisms which concentrated the mineralization. The exploration programs undertaken have been specifically designed considering the unique set of local structural, lithologic and regional tectonic conditions which created potentially favorable sites for mineralization concentration.
| 8.2 | Buckreef Gold Deposits |
The Buckreef Gold mine is hosted within a NE trending mylonitic shear zone, which cross-cuts a mafic volcanic package. The stratigraphy of the Buckreef deposit is dominated by fine grained mafic volcanics, (sub)
| | Page 51 |
| | NI43-101 ITR - Updated Mineral Resource Estimate for Buckreef Gold Project |
concordant coarser grained, ±porphyritic doleritic sills or flows with intercalated and interflow sedimentary horizons that occur as rare, thin, massive to finely laminated units within mafic sequence. This mafic package has been intruded by a series of porphyritic felsic dykes that appear to have broadly intruded parallel to the main Buckreef fault zone. The dykes are typically pink in colour and possess both quartz and feldspar phenocrysts phases in a fine-grained ground mass.
The Buckreef Prospect is a shear zone hosted gold deposit hosted by mafic basalts and dolerites (referred to locally as a lode), in close proximity to a basement granite. Porphyritic felsic intrusives are typically narrow, steeply dipping bodies, contain abundant quartz and felspar phenocrysts, more abundant in the central and northern region of the Buckreef Main zone (i.e., from approximately mine grid L1600N to at L2600N).
Gold mineralisation associated with pyrite-silica-carbonate alteration, with highest grades occurring in intensely altered and fractured host rocks ±quartz veining and appears to be dilation controlled and largely constrained by two cross-cutting sinistral faults, striking ESE-WNW and E-W which displace the Buckreef Shear. Milky to dark grey quartz veining, with higher gold grades generally associated with the (earlier) dark grey quartz,
Gold mineralisation is late stage associated with the formation of quartz-rich vein structures, including the steeply dipping lode veins, and related silica carbonate-sericite-pyrite (+Au) dominant alteration. The mineralisation and associated veining / alteration overprint earlier developed fabrics and textures, including the regional greenschist facies metamorphism. Ore-related fabric development (including vein, breccia and secondary foliation development) are more consistent with brittle to brittle-ductile and solution-precipitation processes (including breccia, vein fabrics). Although the dykes are sometimes present within the main mineralised zones they are typically a poor host rock and rarely have economic mineralisation within them. There could be a possible genetic link (hydrothermal?) between the gold mineralisation and quartz-feldspar porphyry intrusions that occur in the area.
The dominant (or defining) structural fabrics in the ‘Buckreef Fault’ / Main zone area are a narrow to broad variably foliated / layered zone (termed the ‘main fabric’) and (sub) parallel, (±laterally continuous) quartz vein lode structures; both structures trend broadly to the NE and are steep to near vertical dipping. Structural fabrics / relationships observed in core, are typically not consistent. The ‘main fabric’ varies in foliation intensity from a discrete layer silicate cleavage to a domainal / continuous schistosity. Schistose fabrics are most prominently developed in the finer grained mafic volcanics. Where Au associated alteration is intense, the ‘main fabric’ can be defined by a compositional banding that has (partially) replaced (or been superimposed on) an earlier foliation.
Buckreef Main deposit occurs as 3 discrete zones namely, the Buckreef North Zone, the Buckreef Main Zone and the Buckreef South Zone (Figure 8-1) all separated by altered but less well mineralised material. A distinctive ENE-WSW fault break marks the separation between the Main and North zone in the central north while a promininent E-W fault break marks the separation between the Main Zone and South Zone in the central south. The best mineralization occurs between mine grid sections L1800N and L2540N; high grade shoots are SW plunging.
| | Page 52 |
| | NI43-101 ITR - Updated Mineral Resource Estimate for Buckreef Gold Project |
Buckreef Main Zone
| ● | has a strike length of 600m and extends to at least 700m below surface |
| ● | fault-zone hosted, broadly NE trending, with an overall steep to near vertical dip. |
| ● | close to surface, the lode geometry, displays a near vertical dip to the NW or SE. |
| ● | Alteration within fault zone characterized pervasive iron-carbonate alteration that has undergone multiple brittle fracturing and brecciation with multiple events of grey to white quartz veining. |
| ● | Finely disseminated pyrite and also as fracture emplacement associated with Au mineralisation. |
| ● | Significant development of molybdenite mainly associated with carbonaceous meta-sedimentary units. |
| ● | Minor amounts of chalcopyrite, pyrrhotite and magnetite occasionally recorded in drill core |
| ● | Host rock appears to be an important control on higher grade ore blocks or shoots |
Buckreef North Zone
| ● | has a strike length of 250m and extends to at least 400m below surface |
| ● | fault-zone hosted, broadly NNE trending, with an overall steep to near vertical dip. |
| ● | close to surface, the lode geometry, displays a near vertical dip to the NNW or SSE. |
| ● | Silica-carbonate-sericite-sulphide (principally pyrite) dominant alteration and related quartz-rich lode vein / breccia and tension fracture emplacement) associated with Au mineralisation. |
| ● | Host rock varies from mafic volcanics to felsic porphyry. |
| ● | Porphyry hosted mineralization tends to be wide but generally low grade. |
Buckreef South Zone
| ● | has a strike length of 250m and extends to at least 150m below surface |
| ● | fault-zone hosted, broadly NE trending, with an overall steep to near vertical SE dip at shallow depths. |
| ● | Mostly occurs close to surface and carrot shaped lode geometry tend to indicate enhancement via secondary re-concentration. |
| ● | Displays a near vertical dip to the NW or SE and principal all within the weathered zone (mostly oxide and transition material). |
| ● | Detailed grade control drilling established significantly wider mineralization widths |
| | Page 53 |
| | NI43-101 ITR - Updated Mineral Resource Estimate for Buckreef Gold Project |
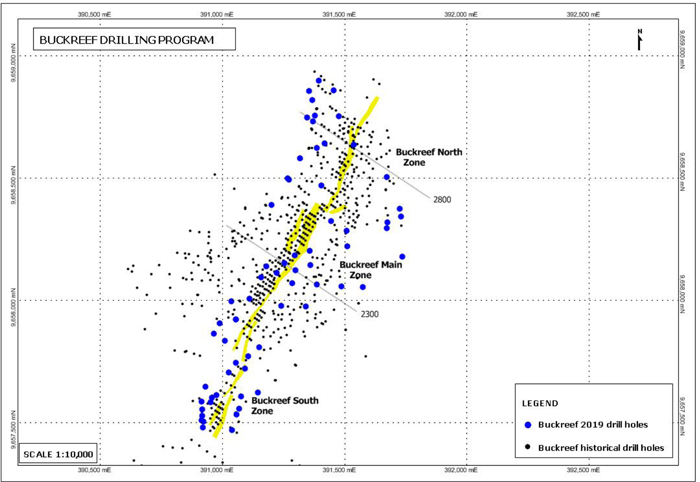
Figure 8.1: Buckreef deposit (yellow areas represent projection of mineralized orebodies to surface).
A preliminary structural interpretation using cross-sectional drilling data, related interpretive plans at various elevations and also the regional aeromagnetic and deposit-scale ground magnetics images covering the project area, the Buckreef Main zone mineralisation appears to show very limited (m-scale) displacements along interpreted E-W to ENE-SWS late stage cross cutting structures, such as dykes and faults. A second but not pervasive N-S set of late stage cross-cutting structures is also evident.
The widths of the mineralized zone do show a distinctive tendency to narrow which could reflect less dilationaly favourable inflexion in the fault zone or a typical boudinaging geometry and/or a local change in host rock including intrusion of felsic porphyries that ether diffuse or completely stope out the mineralization.
| 8.3 | Buckreef Deposit Model |
In 2005, IamGold engaged a structural geology expert, A. Turks to conduct a detailed structural interpretation of the Buckreef Gold deposit among others. The extract herein described was his summary in point forms on how the Buckreef gold deposit was formed.
The section below was an attempt by Turks (2005) to show the evolution of the Buckreef Mineralization in relation to the main structural control so far as follows:
| Ø | Eruption of mafic volcanic rocks in marine setting |
| Ø | Carbonate and chlorite alteration of mafic lithologies during seafloor metamorphism. |
| | Page 54 |
| | NI43-101 ITR - Updated Mineral Resource Estimate for Buckreef Gold Project |
| Ø | Buckreef fault may have been active a s a transfer fault in original basin. Assuming original basin bounding structures run EW (highly speculative) |
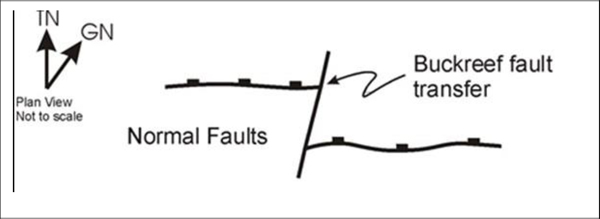
Figure 8.2: Inversion of the basin –Buckreef structure reactivates as a strike –slip transfer fault while original normal faults are now reverse faults.
| Ø | Intrusion of Felsic Porphyries partially controlled by Buckreef fault zone –i.e. Porphyries are not intruded as sills parallel to the bulk of the EW mafic stratigraphy but are broadly intruded NS sub parallel to the Buckreef fault zone. |
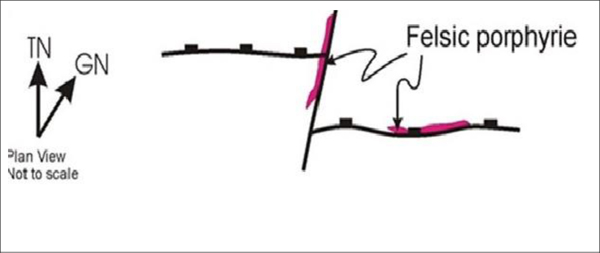
Figure 8.3: Intrusion of Felsic Porphyries controlled by basinal structures.
| Ø | Inversion of basin reactivating original normal faults as thrusts and Buckreef fault as a strike slip transfer fault |
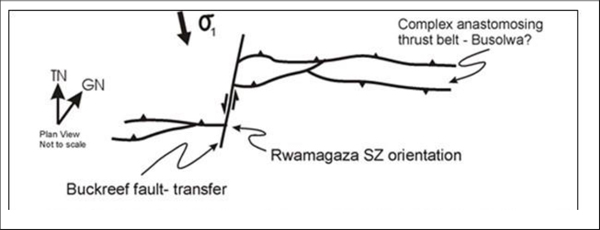
Figure 8.4: Inversion of basin-Buckreef structure reactivates as a strike slip transfer fault while original normal fault are now reverse faults.
| | Page 55 |
| | NI43-101 ITR - Updated Mineral Resource Estimate for Buckreef Gold Project |
| Ø | Early quartz – carbonate pyrite veining causing silicification and carbonate alteration (Fe carbonates – ankerite?) of the mafic rocks. There is probably some gold mineralisation associated with this event but it is difficult to interpret how significant this is due to later superimposed deformation and alteration. |
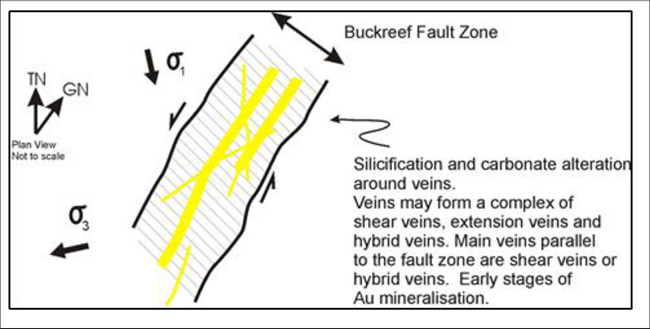
Figure 8.5: Brecciation of the previously altered zones (Early Stages of Au Mineralisation).
Early breccias have a grey quartz matrix with disseminated pyrite? There is definitely gold mineralisation associated with this event. The style of brecciation suggests cyclic high fluid pressures and several episodes of explosive brecciation.
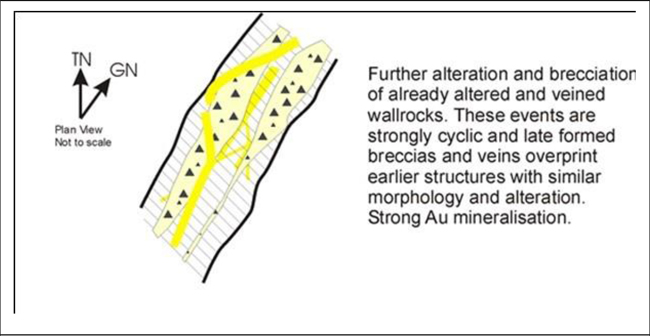
Figure 8.7: Continued Cyclic rupturing of the Buckreef fault zone under high fluid pressure conditions resulting in extensive alteration a series of printing brecciation events.
| | Page 56 |
| | NI43-101 ITR - Updated Mineral Resource Estimate for Buckreef Gold Project |
| Ø | Cyclic formation ofcarbonate + quartz ± pyrite and brecciation overprinting earlier formed veins and breccias. Additional gold mineralisation again related to sulfidation. Zones that have seen several breccia episodes form the highest-grade intersections. Limited lineation data on quartz veins and breccia zones indicates dominantly sinistral strike slip shear with minor episodes of dip slip reverse shear. Original high-grade shoot geometry would be steep to subvertical, controlled by the orientation of s2 during strike-slip movement along the Buckreef fault zone. Any jogs or transfer zones should have a steep plunge during strike slip deformation. |
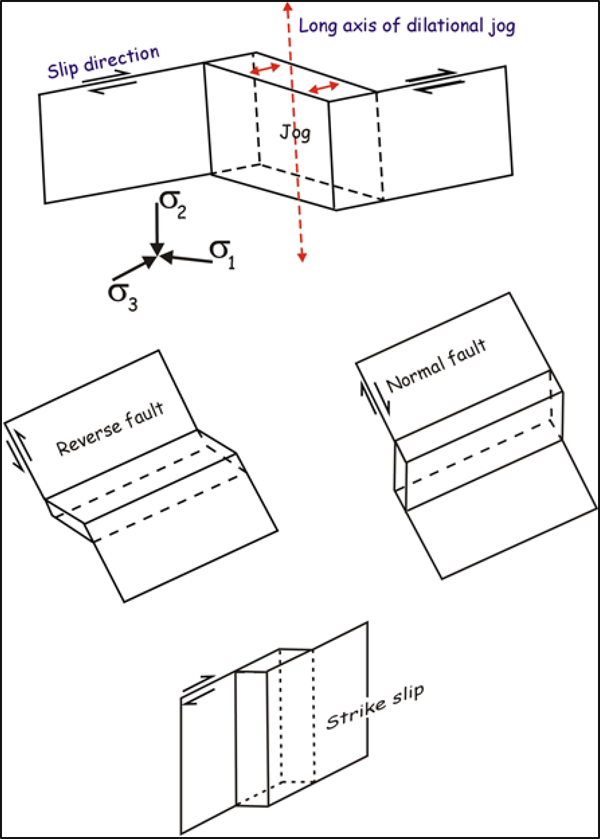
Figure 8.8: Illustrates the classic plunge possibilities for classic fault orientations. As Buckreef appears to have been dominantly strike slip we would expect a steep to sub vertical shoot geometry controlled by the σ2 direction
| | Page 57 |
| | NI43-101 ITR - Updated Mineral Resource Estimate for Buckreef Gold Project |
| 8.4 | Conclusion |
The Buckreef Gold mine is hosted within a NE trending mylonitic shear zone, which cross-cuts a mafic volcanic package. In summary, the Buckreef Mine is located on a clearly defined, east-northeast/west-southwest trending, 5m-30m wide and 8km long, brittle-ductile shear zone within relatively undeformed mafic volcanics. Gold mineralisation is controlled within the regional shear by a fault zone with a 10m true width, continuous for over 1.5km strike length, is associated with intense brecciation and quartz, carbonate, sericite pyrite alteration synonymous with typical Archean lode hydrothermal gold deposits.
Hydrothermal processes are driven by remnant heat from volcanic activity and or intrusions of regional granitoids and other felsic intrusives such as porphyries in the Rwamgaza greenstone belt. Circulating thermal waters, rising through fissures, eventually reach the “boiling level” where the hydrostatic pressure is low enough to allow boiling to occur. This can impart a limit to the vertical extent of the mineralization as the boiling and deposition of minerals is confined to a relatively narrow band of thermal and hydrostatic conditions. In many cases, however, repeated healing and reopening of host structures can occur, which causes cyclical vertical movement of the boiling zone, resulting in mineralization that spans a much broader range of elevations. This appears to have occurred at the Buckreef Gold Mine.
| | Page 58 |
| | NI43-101 ITR - Updated Mineral Resource Estimate for Buckreef Gold Project |
| 9 | EXPLORATION |
The Buckreef project has been the subject of numerous exploration programmes carried out by several companies over more fifty years. As summarized in section 6 of this report the project was originally defined by a 1966 United Nations exploration programme following up artisanal workings. The deposit was subsequently explored by the Tanzanian Mineral Resources Division and developed into a small underground mine by Buckreef Gold Mining Company a wholly owned subsidiary of the State Mining Corporation (Stamico). The mine closed down in 1990 due to low gold prices and lack of working capital resulting in inability to purchase fuel and maintain plant ending in the flooding of the mine.
Table 9.1 Summary of Buckreef Project, Historical Exploration Work, Geita District, Tanzania
| DATE | EXPLORATION UNDERTAKEN |
| 1999-2000 | EAGM signed an earn-in agreement with Ashanti AngloGold to explore Buckreef Project which was terminated late 2000. 16,324m of drilling in 67 drill holes, 18 of which were RC and 49 drill holes diamond (15,363m) |
| 2001-2003 | Spinifex Gold, operating for EAM, ran the project with very limited exploration work based on the follow up recommendations from the final exploration report by Ashanti AngloGold. 610 RC drill holes (49,000m) with 6 diamond drill holes. IP geophysical survey over Buckreef |
| 2004-2005 | Following the merger between Spinifex Gold and Gallery Gold in 2003 significant exploration work was concluded on the project and new resources established on the Buckreef Mining licence. Resources were improved at Tembo and Bingwa prospects. Geophysics and geochemical soil surveys completed with additional RAB, RC and diamond drilling. |
| 2006-2009 | Following the merger between Gallery Gold and IAMGOLD Corporation of Canada in March 2006 EAM changed names to IAMGOLD Tanzania Ltd. Under IAMGOLDT, Buckreef Project was completed up to commencement of pre-feasibility studies before the company decided to close all its exploration activities in Tanzania in 2009 and in so doing decided to surrender back to the government all its exploration portfolio under the Buckreef Re development Agreement. 2,949 drill holes were drilled for 142,302m including 2,160 aircore, 745 RC and 44 diamond drill holes. Regional soil and termite mound reconnaissance sampling programme. Regional mapping |
| 2010-2012 | In March 2010 the government of Tanzania granted afresh all the surrendered licences to Stamico, including the existed applications under IAMGOLDT. |
Source: Venmyn Deloitte 2012.
Historical exploration work conducted by Tanzanian Gold Corporation (formerly Tanzanian Royalty Exploration Corporation) between 2012 to 2017 has been reported on in detail in several published NI43-101 Technical reports as well as the Prefeasibility report published in June 2018. A brief summary of the historical exploration done on the project is summarized under Sections 9.1 to 9.2 below and is as previously reported in previous publications.
| | Page 59 |
| | NI43-101 ITR - Updated Mineral Resource Estimate for Buckreef Gold Project |
In this report, Section 9.3 below, the focus is only on the additional resource drilling that was conducted only on the Buckreef deposit in the period from June 2018 to early 2020. The extensive drilling program (both RC and diamond core drilling) was mainly targeting the down-dip and strike extensions of the three major gold prospects namely, Buckreef North, Buckreef Main and Buckreef South, that make the Buckreef Deposit.
| 9.1 | Buckreef Gold Project |
A Section in Chapter 6 briefly summarized the exploration history on the Buckreef Project starting from 1960 soon after the area was designated as a potential strategic deposit by the Tanzanian government following an incursion by local artisanal gold miners. Table 9.1 below summarizes the major exploration work conducted over the decades by the various companies that have been involved with the Buckreef project over the last 50+ years.
As reported in the published NI43-101 reported mention in Chapter 6 above, Tanzanian Royalty Exploration Corporation, through its 100% owned subsidiary, Tanzam200 commenced mainly further resource drilling and exploration work covering the five main prospects that make up the Buckreef project in 2012. Most of the exploration work at the Project was completed previously during the IAMGOLD ownership as reported in the SEDAR posted reports.
As cited in the published Venymn Independent Technical Reports, regional and detailed exploration by IAMGOLD identified the four major gold prospects as Buckreef (Main, North & South), Bingwa, Tembo and Eastern Porphyry. IAMGOLD then conducted further resource drilling on the Buckreef (Main & North), Bingwa and Tembo prospects. Exploration criteria for the five prospects were essentially based on the normal Archean gold deposit formation criteria listed below:
| ● | Presence of gold |
| ● | Favourable structure (shear zones and breccia zones) |
| ● | Significant quartz vein material |
| ● | Hydrothermal alteration minerals and assemblages |
| ● | Proximity to unconformities and disconformities; and |
| ● | Proximity to oxidation/reduction boundaries of regional scale |
For detailed descriptions and in-depth discussion of the exploration work, some of whose results are briefly summarized below, the reader is referred to Venymn Independent Projects Preliminary Economic Assessment Technical Report (ITR) completed under NI 43101 standards and amended and filed on the System for Electronic Document Analysis and Retrieval, “SEDAR”, (www.sedar.com), on August 12, 2012.
The authors of the Buckreef PEA Independent Technical Report (ITR VIP21), produced for TRX, were Qualified Persons F. Harper (Pri.Sci. Nat.; MGSSA) and A.N. Clay (Pri. Sci. Nat; MSAIMM, FGSSA, FAusIMM). Brief discussions on some of the significant exploration work done are summarized below.
| 9.2 | Geophysical Survey |
Because of the limited bedrock exposure in the Buckreef Project area, numerous geophysical surveys have been conducted at the site in the quest for additional ore. These efforts are summarized in report by Venmyn 2014. Geophysical surveys conducted include ground gravity and dipole-dipole IP/resistivity.
| | Page 60 |
| | NI43-101 ITR - Updated Mineral Resource Estimate for Buckreef Gold Project |
| 9.2.1 | Surveys |
Spectral Geophysics (Botswana) was contracted during April 2008 to complete ground gravity surveys over 5km2 and the data was interpreted by Southern Geoscience Consultants (SGC) in Australia. The final results were compiled into a 1:20,000 scale geological interpretation delineating twenty-one targets and the Rwamagaza Shear Zone. Gravity surveys proved effective for the location of large first order structures and in 2008 the airborne magnetic data was interpreted into an image atlas for future target definition.
| 9.2.2 | Induced Polarisation Surveys |
During 2007, 14 IP survey blocks were completed over the project area by Spectral Geophysics and processed by SGC Australia. The results of these surveys highlighted altered fault/shears zone structures and in conjunction with magnetics can be used for targeting prospective strike extensions of existing ore bodies.
| 9.2.3 | Geochemistry Surveys |
Several historical soil and rock chip sampling programs were completed over the Buckreef Project area on a grid of 100m x 100m, with closer spaced grids (80m x 40m) over historical target areas and targets with a high density of lineaments and interpreted mineralized structures. A total of 2,028 rock chip samples, 29,546 soil samples and 481 termite mound samples were taken during the period 1992-2009.
Transported laterite, combined with Mbuga soils which cover 60% of the area, hamper geochemical sampling and interpretation and IAMGOLD completed termite mound sampling over the problematic areas. To date the termite sample density is too low for identification of meaningful anomalies. The results of the soil geochemistry results are consistent with the known structures in the area. The largest soils anomalies occur are over the main deposits at Buckreef Prospect.
On surface, favourable structures are identified utilizing the 2006 airborne magnetometer survey covering the Rwamagaza greenstone belt. Due to lack of outcrop exposure, very limited ground geological mapping was employed to identify fabrics, offsets and abrupt changes in rock types that indicate structure. Rather detailed geological core logging was used to extrapolate the structural fabrics and hydrothermal assemblages typical for each prospect.
| 9.3 | Buckreef Deposit: Mineral Resource Upgrade Drilling |
Based on the recommendations from the June 2018 Pre-Feasibility report, TanGold Corporation conducted further mineral resource drilling on the Buckreef deposit targeting the three specific portions of the deposit, namely South, Main and North. The rationale behind the drilling program included among others:
| ● | to convert a significant portion of the previous inferred mineral resource category into indicated and measured categories; |
| ● | to clearly delineate the host structure (shear zones and breccia zones); |
| ● | to improve understanding of ore-body geometry down dip and along strike; |
| ● | to identify & confirm the significant potential for underground extension of the Buckreef Main/North deposits and |
| ● | to update the mineral resource inventory for the Buckreef deposit. |
| | Page 61 |
| | NI43-101 ITR - Updated Mineral Resource Estimate for Buckreef Gold Project |
Towards achieving the goals stated above, the Company conducted the drilling work as summarized in the Table 9.2.
Table 9.2: Mineral Resource Upgrade drilling program statistics, Buckreef Gold Deposit
| Drill-hole Type | 2019/2020 Program | Pre 2019 Program | Grand Total | |||
| # of Holes | Meters Drilled | # of Holes | Meters Drilled | # of Holes | Meters Drilled | |
| RC | 43 | 6,733.00 | 508 | 41,994.70 | 551 | 48,727.70 |
| RC Pre-Collaring | 15 | 2,713.00 | 15 | 2,713.00 | ||
| Diamond Core | 8 | 4,105.50 | 213 | 55,954.00 | 221 | 60,059.50 |
| Diamond Core Tailing | * | 3,936.90 | 43 | 10,153.20 | 43 | 14,090.10 |
| Metallurgical (core) | 1 | 162.01 | 1 | 162.01 | ||
| Totals | 67 | 17,650.41 | 764 | 108,101.90 | 831 | 125,752.31 |
| * Note: The DD Tails are already counted as RC percolate hence no figure in the table |
Some of the deeper diamond drill-holes were first pre-collared with RC drilling after which the drill-hole was then completed with diamond coring. The drilling program was targeted to cover both the strike extension and down-dip projections of the three main portions of the Buckreef deposit and the spatial location of the drill-holes is as shown in the map below.
| | Page 62 |
| | NI43-101 ITR - Updated Mineral Resource Estimate for Buckreef Gold Project |

Figure 9.1: Spatial location of the Mineral Resource Upgrade drill-holes, Buckreef Gold Deposit 2019/2020
The 2019/2020 exploration work conducted by the company represents the largest single and continuous drilling program on the Buckreef Gold Deposit and this has allowed the Company to achieve the main goals that included among others the following:
| ● | Resource conversion within the pre-feasibility pit outlines, |
| ● | Resource addition immediately below and beyond the last defined pit bottom, |
| ● | Commence additional Metallurgical test-work & |
| ● | Set the initial stage for “ultra-deep” underground potential exploration drilling. |
The detailed findings from this extensive drilling program are described in detail in the following Chapters in this report.
| | Page 63 |
| | NI43-101 ITR - Updated Mineral Resource Estimate for Buckreef Gold Project |
| 10 | DRILLING |
As summarized in the various SEDAR posted Technical Reports by Venymn, the majority of the exploration and resource drilling at Buckreef’s four major prospects namely Buckreef, Bingwa, Tembo and Eastern Porphyry was done previously by IAMGOLD.
TANZAM2000 then conducted further resource drilling on the Buckreef (Main, South & North), Bingwa, Tembo and Eastern Porphyry prospects based on recommendations from the 2012 Preliminary Economic Assessment report by Venymn.
In 2019 the most aggressive drill programme was initiated and a total of 17,650 metres were completed for 67 drill holes as indicated in Table 10.1.
Table 10.1 Summaries of the 2019 Drilling Programme on the Buckreef
| Drill-hole Type | 2019/2020 Program | |
| # of Holes | Meters Drilled | |
| RC | 43 | 6,733.00 |
| RC Pre-Collaring | 15 | 2,713.00 |
| Diamond Core | 8 | 4,105.50 |
| Diamond Core Tailing | * | 3,936.90 |
| Metallurgical (core) | 1 | 162.01 |
| Totals | 67 | 17,650.41 |
* Note: The DD Tails are already counted as RC percolate hence no figure in the table
| 10.1 | Buckreef Prospect |
Surface exploration and resource definition drilling completed, by previous owners, along the NW-SE control lines are shown in Figure 10.1. The Buckreef resource has been drilled on local grid east-west oriented drill traverses at mostly 20 meter intervals along the strike of the gold mineralization above 1100mRL (surface approximately 1225mRL). Below 1000mRL to the base of drill coverage (approximately 700mRL) the deposit has been variably intersected on 100m intervals south of 2600mN and 40-50m intervals north of 2600mN.
Many drill holes are angled steep (~60o) towards grid east or west normal to the strike of the main mineralised shear zone. On many sections the drill holes targeting the near surface gold mineralization are spaced at 10m centres providing approximate 20m spaced vertical intercept on the gold mineralization.
The RC resource delineation drill spacing was completed on a 40m to 20m x 20m spacing at Buckreef. On sections targeting the near surface gold mineralization, the drill-holes were spaced at 10m centres providing approximate 20m spaced vertical intercepts on the gold mineralization.
| | Page 64 |
| | NI43-101 ITR - Updated Mineral Resource Estimate for Buckreef Gold Project |
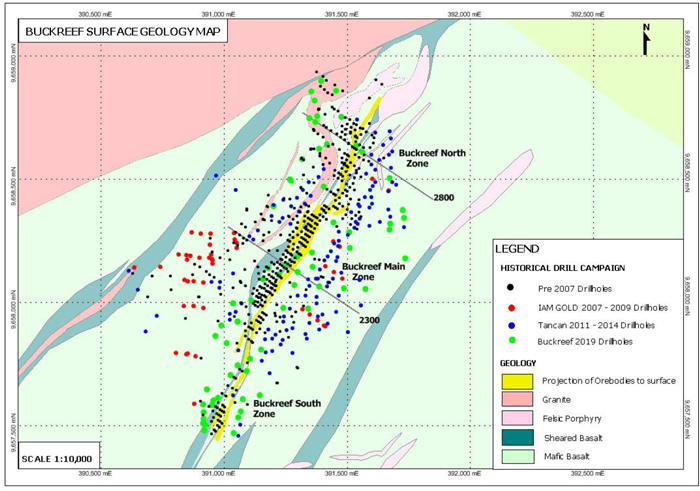 |
| Figure 10.1 Location of Historical RC/DD exploration and Resource drill-holes, Buckreef Deposit, Geita District, Tanzania |
Source: Buckreef Gold Mine 2019;
Between 2013 and 2014, the TANZAM2000 completed additional resource definition drilling mainly targeting the Buckreef South and North deposits in addition to the mandatory twinning preliminary due-diligence diamond core holes on selected portions of the Buckreef main deposit as part of recommendations from Venymn reports.
At Buckreef Prospect, the North and Main Zone mineralization occurs in a shear zone with a true width of about 10m, dipping steeply to the west. As a precaution to minimize interference and sampling by artisanal miners, the RC 1m samples were collected daily and transported to a central sample store where they were sampled and bagged.
The 2012 core drilling program was aimed at defining mineralization between 150m and 250m depths at the Buckreef Main deposit. The results identified a wide zone of mineralization, as exemplified by two drill-holes which intersected a mineralized zone 26m wide with a grade of 4.5g/t Au at 215m depth and a zone, 19m wide with a grade of 10.58g/t Au at 155m depth.
The same 2012 drilling program also confirmed that the high-grade mineralization extends northwards beyond the previous identified Buckreef North Zone mineralized zone and two significant drill-hole intercepts included a 46m wide mineralized zone with a grade of 2.31g/t Au at a depth of 28m and a 14m wide zone with a grade of 1.75g/t Au at a depth 206m.
The diamond drilling core recovery was an average of 93% (Venmyn, 2014). Most of the diamond drill-holes commenced with a tricone roller bit where near surface sampling was not required, followed by HQ diameter, which was reduced to NQ/NQ2 when fresh rock was encountered. Ten HQ core holes were drilled at Buckreef
| | Page 65 |
| | NI43-101 ITR - Updated Mineral Resource Estimate for Buckreef Gold Project |
to twin anomalous RC and diamond drill-holes as part of a QA/QC program on historical assay practice and grade continuity. PQ metallurgical samples were collected at Buckreef Prospect.
The main objective for the 2019 drill programme was in two folds, one is to drill past 700mrl and test downdip extension of gold mineralisation as well as lateral extension further North east. The second objective was to advance Mineral Resources from Inferred to Indicated and Measured categories. The diamond drilling core recovery for this programme has an average of 99.5%, a good indication of competent rock units in Buckreef. Most of the diamond drill-holes commenced with RC pre-collar or a HQ sized bit, which was reduced to NQ/NQ2 when fresh rock was encountered.
| 10.2 | Bingwa Prospect |
Bingwa lies at the northern margin of the RGB adjacent to a sheared contact with a granitic intrusive and approximately 4km east of Buckreef. Surface exploration and resource definition drilling completed, by previous owners, along the NW-SE control lines are shown in Figure 10.2. An additional 1,500m of RC and 180m of diamond core drilling was completed on the prospect in the period 2012 to 2013 by the company.
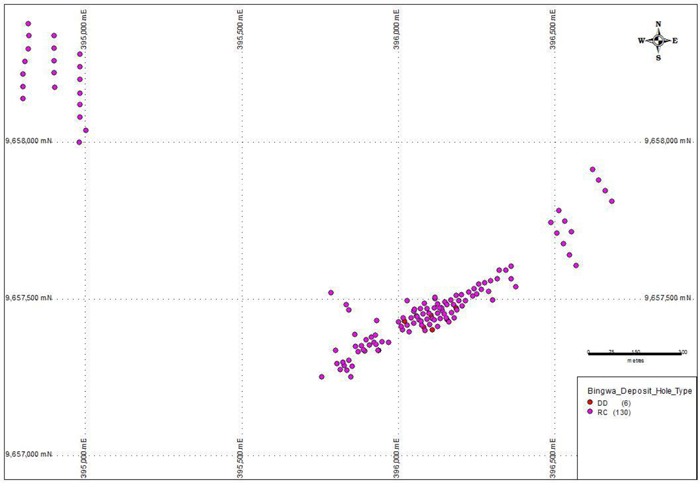 |
| Figure 10.2 Location of Historical RC/DD exploration and Resource drill-holes, Bingwa Deposit, Geita District, Tanzania |
Source: TRX 2013
The RC drilling tested the southwest strike and potential down-dip extension of the main Bingwa deposit while the core drilling is to accommodate additional metallurgical and specific gravity analytical test-work. The drilling confirmed gold mineralization over a strike length of 350m and up to 100m below surface with the main zone of mineralisation occurring over a strike length of 150m. The majority of the mineralization defined to date lies in the oxide zone, which extends to 40 to 60m below surface.
| | Page 66 |
| | NI43-101 ITR - Updated Mineral Resource Estimate for Buckreef Gold Project |
The results of this drilling program were used to advance Mineral Resources from Inferred to Measured and Indicated categories and to increase the Mineral Reserve.
| 10.3 | Eastern Porphyry Prospect |
Historical exploration work by IAMGOLD identified the Eastern Porphyry as target with potential to host a significant resource that could be added into the Buckreef Project Resource inventory.
Venymn (2012) noted that the historical wide-spaced RC drilling conducted on the Eastern Porphyry Prospect, located on the strike extension of an ENE-WSW trending, 5-30m wide, brittle-ductile fault zone, defined the presence of finely disseminated pyrite and quartz veining slivers of persistent but discontinuous sub parallel zones of quartz porphyry units hosted in the main fault zone over a 300m strike length of continuous gold mineralization associated with quartz veins emplaced in sheared felsic porphyry and dolerite.
An additional 10,814m of RC and diamond core drilling was completed on the prospect in the period 2012 to 2013 by the company. The combined historical and additional surface exploration and resource definition drilling along the NW-SE control lines are shown in Figure 10.3.
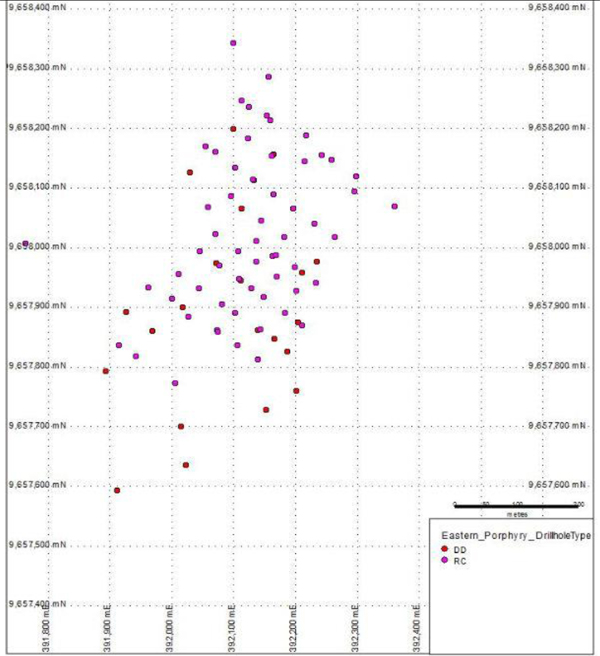 |
| Figure 10.3 Location of Historical RC/DD exploration and Resource drill-holes, Eastern Porphyry Deposit, Geita District, Tanzania, |
Source: TRX 2012
| | Page 67 |
| | NI43-101 ITR - Updated Mineral Resource Estimate for Buckreef Gold Project |
| 10.4 | Tembo Prospect |
Venmyn (2012) noted that the historical RC drilling conducted on the Tembo Prospect, defined gold mineralization within grey quartz stringers, veinlets and boudins (tension zones) all tightly constrained by a 3- 5m wide ENE-WSW trending brittle-ductile shear zone hosted in basaltic volcanic units. Historical drilling by IAMGOLD covered a 200m strike length.
Tanzam2000 conducted additional RC and diamond core drilling for metallurgical and specific gravity tests to upgrade the deposit resource from inferred to measured + indicated category. The drilling will also test strike continuity of mineralization to the east (Figure 10.4).
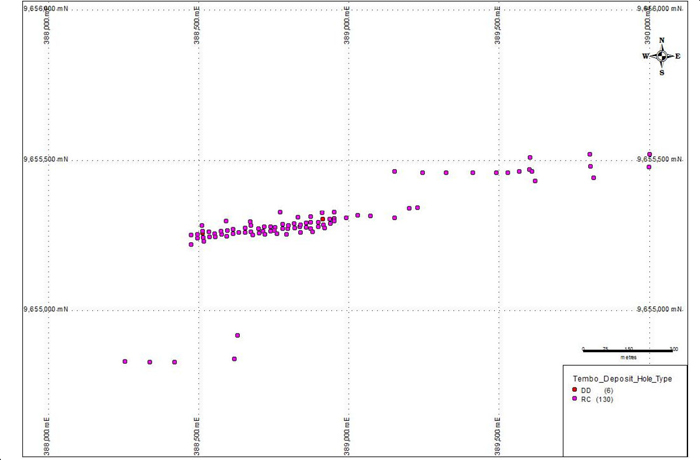 |
| Figure 10.4 Location of Historical RC/DD exploration and Resource drill-holes, Tembo Deposit, Geita District, Tanzania |
Source: TRX 2013
| 10.5 | 2019 Drilling Programme |
| 10.5.1 | Core Handling |
Drill core is retrieved from the bottom of the hole using a wire-line core barrel double tube setup. Drilling crews then arrange the core in the order from which it is drilled, before it is placed in the core trays. In between each drill run, drill crews place core blocks and mark them with depths (in metres), approximate core loss, or gain. Core trays are marked with the project name, drill hole identity number, the intersection interval (start and final depths in that box), an arrow indicating which direction is down-the-hole, and a sequential box number. In the event of breakage of core is required to fill the box edged tools are used and the end of every run is marked. The
| | Page 68 |
| | NI43-101 ITR - Updated Mineral Resource Estimate for Buckreef Gold Project |
core trays are transported to the core storage facility for subsequent core processing only after the supervising geologists has gone the cores to ensure that they are properly laid out, marked correctly and the tray is full.
| 10.5.2 | Collar Surveys |
Collar coordinates were captured in the ARC1960 Datum and UTM 36S coordinate system. Independent survey contractor was employed and uses Total station Survey instruments.
| 10.5.3 | Downhole Surveys |
The majority of drill holes at the Buckreef Deposit are orientated at a dip angle, commonly -60º to either the northeast or south west depending on accessible drill pad. This is acceptable, as the targeted mineralised shear zone is sub-vertical and interchangeably dip to the SW or NE.
In order to monitor the consistency and deviations in drill hole trajectory, multiple downhole surveys were conducted for all drill holes using a Reflex EZ Shot (electronic single shot magnetic survey tool).
At the Buckreef Deposit, the down hole surveys were completed at 20 metres intervals and when there was a change from RC pre-collar to Diamond tail.
All drill holes were downhole surveyed with the Reflex EZ shot technique. Dip and azimuth readings were recorded, along with temperature, and magnetics data in the project database. A range of magnetics data were used to accept the reliability of azimuth data set. For 2019 drill programme, ranges 32000 to 34000 are acceptable to give a reliable azimuth reading. It was observed that the average deviation was 3.2º for inclined hole and maximum deviation recorded was 12º.
| 10.5.4 | Orientated Drill Core |
All diamond drilled core is oriented, for each 3m drill run, by the drilling contractor using the Reflex ACT II RD orientation tool. Where core is sufficiently competent to allow orientation surveys, geologists collected structural information. Orientated core runs (and broken core pieces) were aligned utilising the orientation marks provided by the Reflex ACT II RD system. These core pieces were marked according to the confidence in orientation, with different orientation marks only within 15° of each other to be considered aligned.
| 10.5.5 | Recovery |
Core recovery was measured at the core yard by Buckreef technician who reconstructed the core to an intact state within the core tray. The core is measured using a tape measure. This measurement was then compared to the length of the drilled core run, and the percentage of recovery was calculated and recorded.
Calculation of the recoveries of RC drill samples is completed by collecting the drill cuttings in a large woven polyethylene bag at the underflow of the RC drill’s cyclone, and weighing the bag and contents using a digital scale. This weight was compared to a theoretical value of a cylinder of 1m length and the diameter of the RC hammer, and an assumed density (based upon measured densities of drill core from similar lithologies). The percentage recovery is then calculated by dividing the weight of the recovered sample, by the theoretical, and then multiplying by 100 to obtain the percentage recovery. This method is considered semi-quantitative as some component of the sample is always lost as airborne dust through the cyclone overflow. No consideration of
| | Page 69 |
| | NI43-101 ITR - Updated Mineral Resource Estimate for Buckreef Gold Project |
sample moisture is factored in. This method provides an indicative value to assess whether sample recovery was enough to be considered valid.
| 10.5.6 | Geological Logging |
All diamond core holes were logged at the Buckreef core storage facility. The logging was completed by exploration geologists and reviewed by Principal geologist. Industry-standard logging methods, sampling conventions, and geological codes were established for the project. Descriptions of colour, mineralogy, texture, lithology, weathering, alteration and mineralisation were completed using paper logs. Logged data are then entered into Excel spread sheets, using single data entry methods, by Buckreef database officer. Structural features such as bedding, foliation, fold, joints, veins, and faults were recorded for both geological and geotechnical purposes.
All drill cores are photographed, when wet and dry, before subsequent core processes in the core storage facility. RC drill chips were logged at site, and representative samples (coarse rejects) are stored in polyweave sacks for each 1m interval. All data, including core photographs, are captured and stored in the project database.
| 10.5.7 | Comments on Drilling Section |
The quantity and quality of drilling, geological and geotechnical logging, collar, and downhole survey data collected in the core drill programs is sufficient to support mineral resource update and subsequent use in mine design on the following observations:
| ● | Drill hole orientations are generally appropriate for the geometry of the orebodies and mineralisation style. |
| ● | Collar surveys were performed using industry-standard instrumentation. |
| ● | Downhole surveys provide appropriate representation of the trajectories of the drill holes. |
| ● | Core recoveries are satisfactory for the estimation of mineral resources. |
| ● | The accuracy and the level of detail, in both the geological logging and geotechnical logging, is considered sufficient to support the estimation of mineral resources, mining and metallurgical studies; and |
| ● | No material factors were identified with the data collection from the drill programs that could affect mineral resource estimates. |
| | Page 70 |
| | NI43-101 ITR - Updated Mineral Resource Estimate for Buckreef Gold Project |
| 11 | SAMPLE PREPARATION, ANALYSES AND SECURITY |
This section of the report briefly summarizes the sampling methods, sample preparation, assay analysis, and security procedures for historical and current 2019 drilling and sampling program. For detailed descriptions and in-depth discussion of on this topic, again the reader is referred to Venymn Independent Projects Technical Reports ITR-VIP21, ITR-VI199R and ITR-VMD1598 completed under NI 43101 standards and amended and filed on the System for Electronic Document Analysis and Retrieval, “SEDAR”, (www.sedar.com).
In brief, the procedures for both RC chips and core samples were developed and documented by the previous operator IAMGOLD and were largely adopted by TANZAM2000 to maintain continuity and congruity. The same sampling protocol are maintained in 2019 drill and sampling programme. Any changes made by TANZAM2000 were duly noted within the Independent Technical reports mentioned above.
| 11.1 | Core Sampling Methods |
Diamond core drilling at the Project was conducted by contractors under the supervision of a qualified geologist. The drill core was then placed in labelled metal trays and depth marker blocks inserted by drilling contractor personnel prior to the removal of the core from the drill site by the project geologist. Upon arrival at the secure core logging facility, the core boxes were sequentially placed in a core rack and the spatial information on each box of core is checked for accuracy and consistency. Prior to any sampling, the drill core was digitally photographed by a geological technician under the supervision of a geologist.
Exploration geologists then logged the core and recorded observations first in a manual log sheet and then subsequently uploaded into a master drill log database. Diamond core is sampled on geological basis such as the presence of mineralization, favourable structure, presence of alteration halos and quartz veining. The samples were then marked and measured for sampling and identified with one part of a three-part assay tag placed at the end of the sample interval. The minimum sampling interval is 0.5m and the maximum is 1m.
Venymn noted that the potentially mineralized portion of the drill-core was split in half using a core splitter. One half of the split core was then taken as a sample that was immediately placed in a sample bag by the geologist and identified with an assay tag, whose duplicate copy was kept in the sample book, and the sample number is recorded on the log-sheet prior to entry into the master database. Additional samples on either side of the presumed mineralized section were also collected to close off mineralization as is standard practice.
Blind standards were routinely inserted into the sample sequence prior to delivery to the assay laboratory. Blanks (also routinely inserted every 50 samples and after all noted visible gold) consist of either intervals of un-mineralized core which are identified and flagged prior to shipment to the assay lab or were sourced from a commercial laboratory and inserted into the sample stream prior to shipment.
Sealed sample bags were then transported to the assay laboratory in a timely manner. Upon arrival at the assay lab, samples are received by laboratory personnel and maintained the laboratory’s chain of custody procedures
| | Page 71 |
| | NI43-101 ITR - Updated Mineral Resource Estimate for Buckreef Gold Project |
and protocols. Historical exploration companies including IAMGOLD and TANZAM2000 maintained a chain of custody as well which was updated throughout the process.
There were additional requirements for 2019 drill programme samples security and chain of custody. This was introduced in 2016 by the Government of Tanzania through the Ministry of Minerals and it involves government personnel participation in the transportation of samples between site to the laboratory. The government official and Buckreef personnel in the presence of Government police officer verified the samples which are ready packed for dispatch. Weights for each sample is verified through a random check for individual sample weight in the bags and the count is manually done before loaded in the truck and attach a government seal on the truck door. The seal is only opened in the lab premises with government officials and lab crews. This additional security procedure assured that the samples had no chance to be tempered when transported to the laboratory.
| 11.2 | RC/RAB Sampling Methods |
The RC/RAB drilling sampling methodology comprised collection through a cyclone at 1m intervals into large plastic bags. An exploration geologist logged the drill-chips on site as each meter sample was riffle split on site, weighed and moisture content recorded for every meter drilled.
RC holes were stopped if persistent wet samples were encountered. Most RC samples collected since 1992 were homogenized and reduced to 2kg to 3kg on site by passing reduced samples at least 4 times through a single tier Jones riffle, which is demonstrated to be a more representative sample than that produced by stacked three tier splitters. In later years, the entire length of RC and RAB drill-holes was collected as 1m samples with individual RC samples for assaying taken as 3m composites. During composite sampling, the individual 1m riffle split reduced samples were collected in the field and retained for future analysis if warranted.
As with the core samples, unique Sample ID ticket books with corresponding tear off sample tickets were printed and used to record sample details and assay samples.
Both drill core and RC pulp samples were submitted to various ISO accredited laboratories who in turn utilized comprehensive in-house QA/QC measures from sample preparation to instrumental finish and reporting of the results. Equipment was cleaned between batches; crushing and pulverizing was monitored by sieve testing. Routine laboratory Quality Control sampling (pulp duplicates and pulp repeats) was also completed on pulps retained at the laboratory. This provided an indication of any sample preparation/sub-sampling/sample digest and assay error at the primary laboratory.
Both Hellman & Schofield and Venymn Independent Projects subsequently conducted a very intensive and detailed statistical assessment of the QA/QC Data for project area. They both concluded that the historic (Pre 2019 drill programme) QA/QC data available provided assurance that the data is not flawed by sampling or assaying bias. Further to that, they also considered the QA/QC performance to be good and the data suitable for incorporation in the published Mineral Resource estimates done in 2007, 2012 and 2014.
| | Page 72 |
| | NI43-101 ITR - Updated Mineral Resource Estimate for Buckreef Gold Project |
| 11.3 | Sample preparation and Analysis |
Buckreef Gold Project uses Nesch Mintech laboratory as a primary laboratory for sample preparation and analysis. The Laboratory is situated in an industrial area approximately 8 Kms outside Mwanza on Shinyanga road. The Laboratory is divided into two houses, one serves as a sample preparation facility, and the other as a fire assay, wet chemistry, instrumentation facility and administration office. The laboratory is ISO 17025 certified. Accreditation certification of the laboratory is appended hereto. The laboratory operation follows and maintains the standards supported by this accreditation.
In the laboratory, samples are sorted into numeric sequence and referenced to the clients’ submission documents. Once confirmed, the batch data is entered in the computer. And a new work sheet is created to go with sample batches at every laboratory workstation.
Samples received are crushed to ensure appropriate sample size (<2mm) before milling. Jones Riffle Splitters are used to further split samples to get a reasonable size (about 0.5kg) for milling using Labtechs LM2 pulverisers machines. Milling of samples is performed to attain 95% passing 75 micron. The Buckreef samples are fire assayed using 50g aliquot and gold results are read on Atomic Absorption spectrometry machine.
The following chapter gives details on the Quality control and quality assurance results for samples generated in 2019 drill programme.
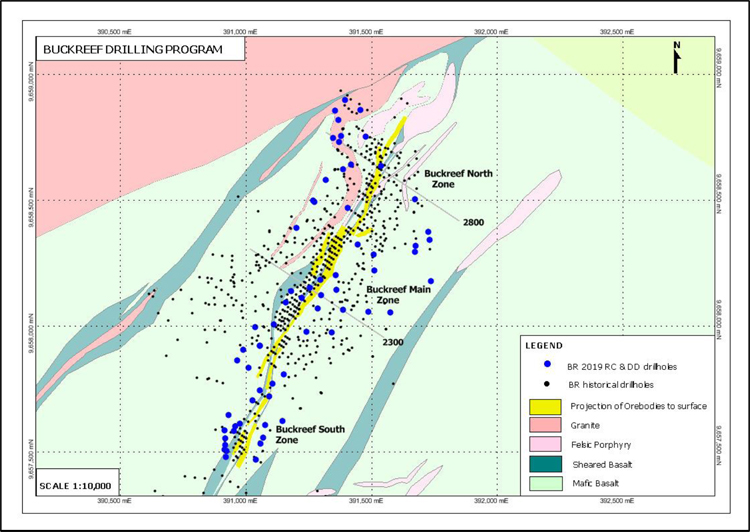
Figure 11.1: Drillholes used in 2019 Resource update
| | Page 73 |
| | NI43-101 ITR - Updated Mineral Resource Estimate for Buckreef Gold Project |
| 11.4 | QUALITY ASSURANCE & QUALITY CONTROL (QA/QC) PROCEDURE 2019 DRILLING PROGRAMME |
Figure 11.1 shows additional drill holes completed in 2019, this section deals with samples and assays quality control and quality assurance generated from this programme. Analytical performance was determined by analysis of control samples to determine precision, accuracy, bias and cross contamination. This included the analysis of certified reference materials (CRMs), coarse blanks and duplicates within sample stream batches. A review of the Buckreef QA/QC procedures were completed by a team from Virimai Projects and the staff of TRX.
| i. | Blanks |
Coarse blank material from the granitic quarry has been used in the sample streams for all Buckreef samples for both Reverse circulations and diamond drilled samples. The material was sourced approximately 10km from deposit area on a granitic borrow pit. Prior to using the blank material, a number of sub-samples were taken, and these were submitted for assay at the Nesch Mintech laboratory to confirm that the material is not mineralised.
Material used for coarse blanks was crushed to -2 mm to be used as a blank in the crushing pulverising stage of the sample preparation. The coarse blanks are inserted into the sample preparation stage at an average rate of one in every 20 samples. It is in discretion of a sampling geologist to locate a position in the sample stream where to insert a coarse blank sample, mainly with preference to start/ end of mineralised zone or a start of a sample batch.
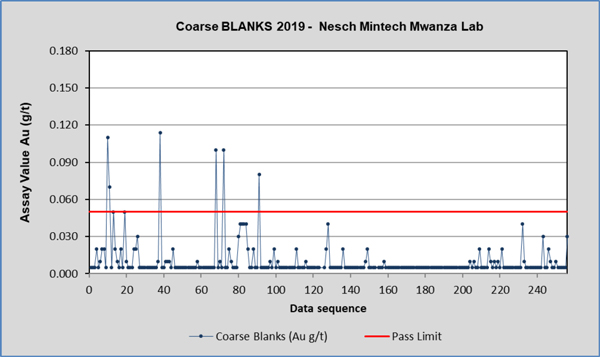
Figure 11.2: Coarse blanks assessment graph
The acceptable limit for Au on blanks was set at 0.05g/t, this is 5 times detection limit. At least 90% of blanks should be within the acceptable limits for a satisfactory performance. Au values are plotted against the order of analysis on a control chart for visual assessment (See Figure 11.2).
| | Page 74 |
| | NI43-101 ITR - Updated Mineral Resource Estimate for Buckreef Gold Project |
From the data, a total of 253 blank samples that were taken to the lab, and only five six returned results above pass limit, this equates to 98% of blanks within pass limits.
In general, the contamination levels of the 2019 drill holes analyzed by the Nesch Mintech Laboratory can be said to be within satisfactory limits. There is an indication of some level of contamination of samples or sample swapping at the Lab, these were investigated and where required, re-analyzed.
| ii. | Field Duplicates and Pulp duplicates |
Assay results from field and pulp duplicates are compared with the original results of primary assay data to assess the quality of the various subsampling procedures and repeatability of laboratory analysis at various stages. The frequency of these duplicates for 2019 drilling programme is a minimum of 1:20. The location of duplicated samples is on geologist discretion, where, he sees potential for gold mineralization. Duplication of samples around detection limit, does not serve the purpose of checking precision of the results.
In Figure 11.2 a Duplicate analyses are plotted against the original analysis. A line of X=Y (i.e. 1:1) is plotted. A correlation coefficient from linear regression line depicting actual trend of the distribution of the sets is also shown in the plot. Allowable error margins plotted are +/-20% for field duplicates and +/-10% for Pulp duplicates.
Pulp duplicate samples in Buckreef 2019 drill programme originate from Diamond drilled samples which were previously assayed by the same laboratory. As a result a pulp duplicate is thus used to check repeatability of original assaying at a later date. The pulp scatter plot shows a significant bias toward pulp duplicate results. Although this is a concern, most of the results are below 0.2g/t Au which is below a reported cutoff grade for resource update, and therefore may not have material impact on the Resource numbers reported. Nevertheless, these results were communicated to the lab to avoid potential future bias.
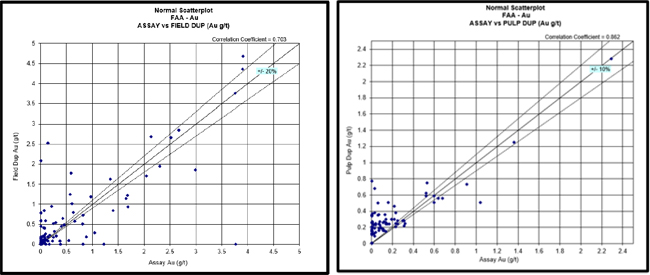
Figure 11.3: Scatter plots for Field duplicates (left) and Pulp duplicates (right)
Figure 11.3 is a graphical technique for determining if two data sets come from populations with a common distribution (as should be in the case of duplicate assay samples). The q-q plot is a plot of the quantiles of the original samples against the quantiles of the duplicates/repeats.
| | Page 75 |
| | NI43-101 ITR - Updated Mineral Resource Estimate for Buckreef Gold Project |
A 45-degree reference line is also plotted. If the two sets come from a population with the same distribution, the points should fall approximately along this reference line. The greater the departure from this reference line, the greater the evidence for concluding that the sub-sampling was erroneously done and therefore precision of sampling protocols (whether in the field or lab as the case may be) is not satisfactory. This method also helps to physically look for the relationship between various grade ranges and precision.
Field duplicates indicates a bias toward duplicate assays at a grade range of up to 1g/t Au, and pulp duplicates indicates a bias towards a second assay to up to 0.4 g/t Au.
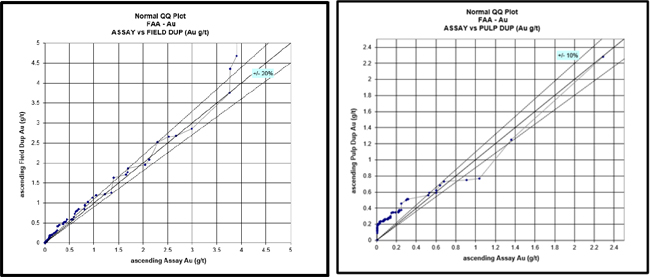
Figure 11.4: QQ plots for Field duplicates (left) and Pulp duplicates (right)
| iii. | Certified Reference Materials (CRM) |
A total of 368 certified reference materials were submitted together with the 16,624 drill core samples to determine assay accuracy and precision of the analyses. Eight CRMs were reported without valid CRM ID, these were excluded in the evaluation due to sample mislabelling.
Reference materials from various suppliers were used, to cater for various grades ranges that is high, medium and low grades as shown in Table 11.2.
A failure is defined as results outside ±3 certified standard deviations. At least 90% of the population of each standard reference material should pass the said criteria for the assay data to be considered to have a satisfactory accuracy level. During the 2019 drilling programme average CRMs achieved an average of 93.3% pass.
| | Page 76 |
| | NI43-101 ITR - Updated Mineral Resource Estimate for Buckreef Gold Project |
Table 11.1 Range of CRM Used during the 2019 sampling Programme
| CRM Category | CRM_ID | Au (g/t) Mean value | Standard Deviation |
| High Grade | AUOM-3 | 3.229 | 0.082 |
| ST10/0302 | 3.660 | 0.150 | |
| ST10/0301 | 3.400 | 0.150 | |
| AMIS 0441 | 2.440 | 0.230 | |
| Medium Grade | AMIS 0211 | 0.620 | 0.080 |
| AMIS 0440 | 1.740 | 0.080 | |
| AMIS 0221 | 1.140 | 0.080 | |
| AUOH-5 | 1.319 | 0.027 | |
| ST 37/5340 | 0.730 | 0.030 | |
| OXE 74 | 0.615 | 0.006 | |
| OXE 56 | 0.611 | 0.006 | |
| Low grade | ST 70/5344 | 0.099 | 0.010 |
| ST 07/9258 | 0.220 | 0.020 | |
| OxC 72 | 0.205 | 0.003 | |
| AMIS 0234 | 0.229 | 0.030 |
Table 11.2 Pass rate of CRMs used during the 2019 sampling Programme
| CRM ID | No of CRMS | Reported CRMs within | Certified mean (g/t Au) | Reported mean (g/t Au) | % Within Pass |
| ST100302 | 38 | 35 | 3.66 | 3.67 | 92.1% |
| AMIS0221 | 36 | 36 | 0.62 | 0.61 | 100.0% |
| AMIS0234 | 17 | 16 | 0.23 | 0.23 | 94.1% |
| AUOM-3 | 42 | 38 | 3.23 | 3.16 | 90.5% |
| OxC72 | 44 | 38 | 0.21 | 0.2 | 86.4% |
| OxE56 | 33 | 32 | 0.61 | 0.61 | 97.0% |
| OxE74 | 52 | 48 | 0.62 | 0.62 | 92.3% |
| ST70/5344 | 25 | 25 | 0.1 | 0.1 | 100.0% |
| ST100302 | 38 | 35 | 3.66 | 3.67 | 92.1% |
| AUOH-5 | 10 | 35 | 1.32 | 1.29 | 100.0% |
| ST07/9258 | 25 | 10 | 0.22 | 0.2 | 100.0% |
| ST37/5340 | 8 | 6 | 0.73 | 0.67 | 75.0% |
| Average Pass Rate | 93.3% | ||||
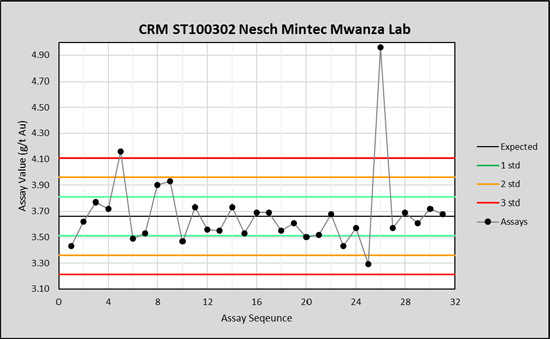
Figures 11.5 CRM ST100302 Nesch Mintech Mwanza Laboratory
| | Page 77 |
| | NI43-101 ITR - Updated Mineral Resource Estimate for Buckreef Gold Project |
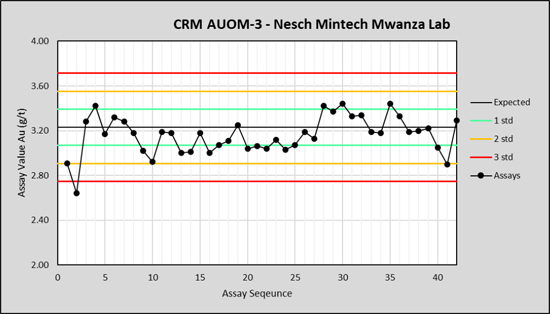
Figures 11.5 CRM AUOM-3 Nesch Mintech Mwanza Laboratory

Figures 11.6 CRM AUOH-5 Nesch Mintech Mwanza Laboratory
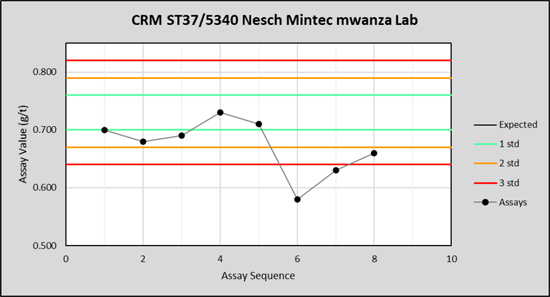
Figures 11.7 CRM ST37/5340 Nesch Mintech Mwanza Laboratory
| | Page 78 |
| | NI43-101 ITR - Updated Mineral Resource Estimate for Buckreef Gold Project |
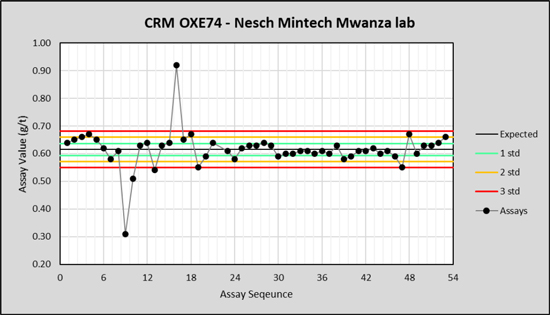
Figures 11.8 CRM OXE74 Nesch Mintech Mwanza Laboratory
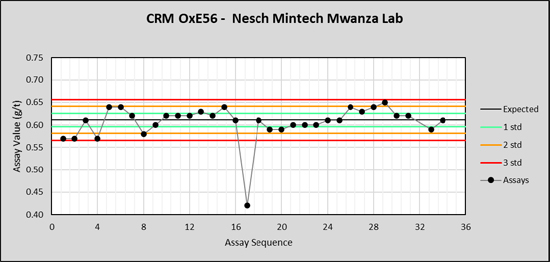
Figures 11.9 CRM OXE56 Nesch Mintech Mwanza Laboratory
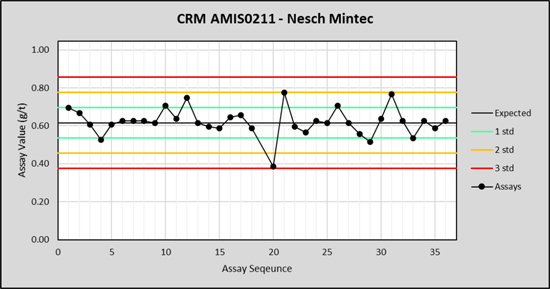
Figures 11.9 CRM AMIS0211-Nesch Mintech Mwanza Laboratory
| | Page 79 |
| | NI43-101 ITR - Updated Mineral Resource Estimate for Buckreef Gold Project |
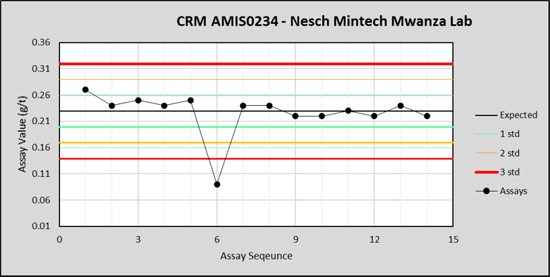
Figures 11.10 CRM AMIS0234-Nesch Mintech Mwanza Laboratory
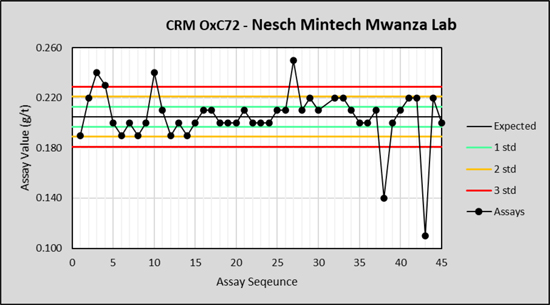
Figures 11.11 CRM OxC72-Nesch Mintech Mwanza Laboratory
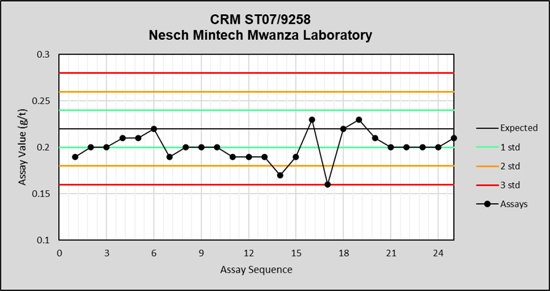
Figures 11.12 CRM ST07/9258-Nesch Mintech Mwanza Laboratory
| | Page 80 |
| | NI43-101 ITR - Updated Mineral Resource Estimate for Buckreef Gold Project |
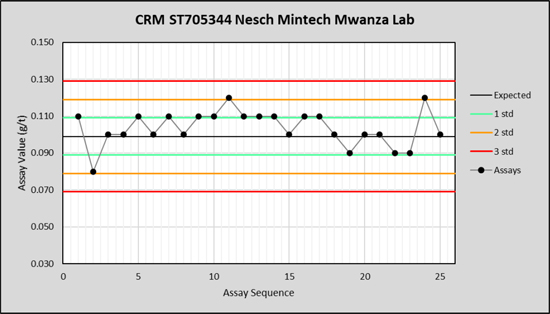
Figures 11.13 CRM ST07095344-Nesch Mintech Mwanza Laboratory
| iv. | Umpire samples |
In 2019 drilling and sampling campaign, Umpire samples in Buckreef were generated by resubmitting a pulp sample from which an aliquot has been previously assayed for assay to a different laboratory. A total of 200 samples were sent to SGS laboratory in Mwanza which is ISO17025 certified laboratory. Results for Umpire samples are statistically summarized and compared with those analyses carried out at Nesch Mintech Laboratory the Primary Laboratory used for Buckreef see table 11.2.
Table 11.2: Comparison of the Nesch Mintech Lab and SGS.
| Nesch Mintech Aug/t | SGS Au g/t | |||
| No of samples | 200 | 200 | ||
| Minimum | 0.005 | 0.005 | ||
| Lower quartile | 0.31 | 0.09 | ||
| Median | 0.86 | 0.61 | ||
| Mean | 1.65 | 1.42 | ||
| Upper quartile | 1.72 | 1.54 | ||
| Maximum | 29.43 | 27.80 | ||
| Coefficient of Variation | 2.06 | 2.23 | ||
| Standard Deviation | 3.40 | 3.17 | ||
| Variance | 11.57 | 10.03 | ||
| | Page 81 |
| | NI43-101 ITR - Updated Mineral Resource Estimate for Buckreef Gold Project |
Scatter plots of the primary versus umpire re-assay (Figure 11.14) demonstrate a restricted dispersion with the majority of data plotting within or close to the +/- 10% limits. Linear correlation of primary Nesch lab assays against SGS lab assays is at 96.7%, which is very good correlation. However a close look at the scatter plot, a tendency for the primary assay to be overstated relative to the umpire is common. Quintile - Quintile plots (Figure below) supplement the scatter plots and demonstrate consistent bias toward Nesch laboratory assay results. Grade range between 0 to 1.2 g/t Au is outside 10% correlation window and biased toward the primary laboratory. The bias trend remains in higher grades but within or close to 10% correlation margins refer to Figure 11.14.
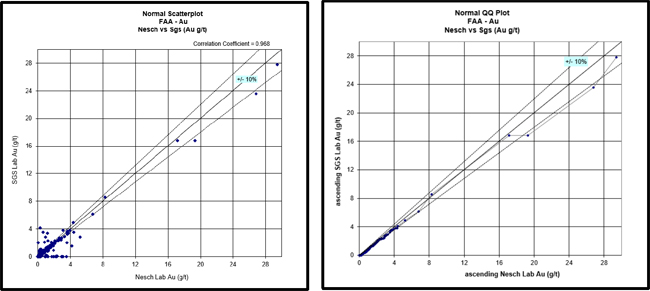
Figure 11.14: Scatter plot and QQ plot for umpire samples
| | Page 82 |
| | NI43-101 ITR - Updated Mineral Resource Estimate for Buckreef Gold Project |
| 12 | DATA VERIFICATION |
This section of the report outlines the checks carried out during the campaign on the quality of the data collected during the period to see if it meets with industry practise and supports the estimation of the resources. Data verification relates to work undertaken by Virimai Projects whose technical team conducted several visits to the mine site in 2019 and in 2020. This section of the report summarizes the verification and validation of the results of the 2019 exploration campaign carried out by people from Virimai Projects on the Buckreef.
| 12.1 | Drill Data Review |
The Historical data for the Buckreef Gold Project was provided to Virimai Projects in 2018 during the compilation of the Amended NATIONAL INSTRUMENT 43-101 Independent Technical Report Mineral Reserves Estimate and Pre-Feasibility Study on the Buckreef Gold Mine Project, Tanzania, East Africa” completed under NI 43-101 standards and filed on the System for Electronic Document Analysis and Retrieval, “SEDAR”, (www.sedar.com).
The drill hole database and resource models were supplied as Datamine Studio 3 files with the drill hole files consisting of collar, down-hole survey and interval tables. The resource models were as 3D Datamine Studio 3 wireframe files encompassing discrete mineral zones identified by a zone number in the file name. Block models of the grade estimates were also supplied for these zones.
Surface Digital Terrain Models (DTMs) were supplied for each area and this also included the DTMs at (1) the interface of the oxide and intermediate material and (2) the interface of the intermediate and fresh material.
Virimai Projects’ team then reviewed the data and models to verify the findings as previously reported and published by Venymn Independent Projects. Messrs Wenceslaus Kutekwatekwa, Wonder Mutematsaka and Arimon Ngilazi then visited the site from the 17th to the 19th April 2018 in the company of Mr. Peter T. Zizhou.
| 12.2 | Collar Location Checks |
Mr Kutekwatekwa and a team from Virimai Projects carried out field checks of pre-selected borehole collars on the Buckreef, Eastern Porphyry and Tembo anomalies from the 18th to the 19th of April 2018. The recorded co-ordinates of 20 collars were entered into a hand-held GPS and used to track to the positions in the field. Some of the collars at Buckreef anomaly have since been destroyed during pre-stripping but even so, some evidence was available through residual cement works. Using this method collar location for the surface diamond drill holes are considered to be reliable.
| | Page 83 |
| | NI43-101 ITR - Updated Mineral Resource Estimate for Buckreef Gold Project |
|
| Figure 12.1: Virimai Projects Team on Site |
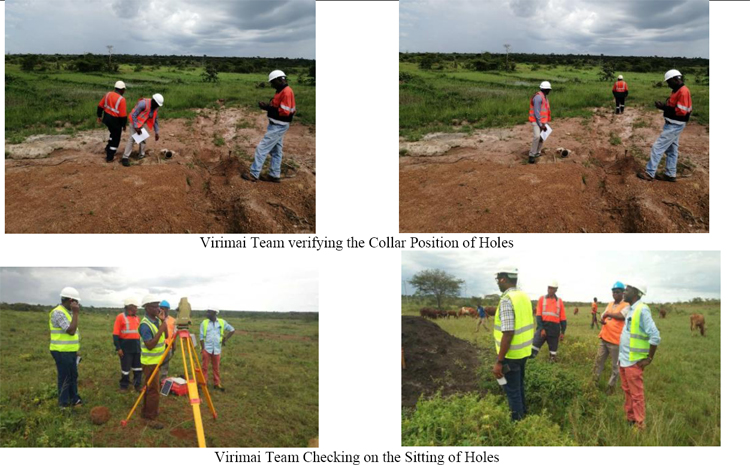
| 12.3 | Drill hole and Assays Checks |
Virimai Projects randomly selected several diamond and RC drill holes, and deliberately selected portions of holes with intersections of mineralization were selected by the Virimai Project team and the Buckreef project personnel and availed the core trays and pulp for inspection and verification logging in the core-shed.
| 12.4 | Geology Checks |
Several randomly chosen manual log-sheets for drill-core availed at site were first manually logged to acquaint the Virimai Projects team with the geological units as described in the log-sheets. A comparison with the lithology database then revealed congruency as previously established by Venymn Deloitte. The diamond core drill-hole lengths and lithologic coding for the core drill-holes is thus considered to be reliable.
| 12.5 | Core Assay Checks |
During the 18th to May 19th 2018 site visit, Mr Kutekwatekwa and Mr Ngilazi of Virimai Projects carried out geology and assay checks as a single exercise. Pre-selected holes were laid out by Buckreef staff for verification logging to validate geology, depth of intersections and mineralisation. Comparison was made with the database entries and Mr Kutekwatekwa and Ngilazi found the geological and assay data to be representative of the observed geology and mineralisation.
No assay check samples were collected for this report. Mr Kutekwatekwa and Mr Ngilazi conducted verification of the randomly chosen drill holes to check assay entries against the assay certificates. The assay certificates were obtained in both digital and manual formats directly from the assay laboratories. Mr Ngilazi’s finding was that the assay database was considered to be reliable.
| | Page 84 |
| | NI43-101 ITR - Updated Mineral Resource Estimate for Buckreef Gold Project |
On the basis of the verified collar, geology and assay data, Mr Kutekwatekwa deems the data fit for use in resource modelling, grade estimation and subsequent business use.
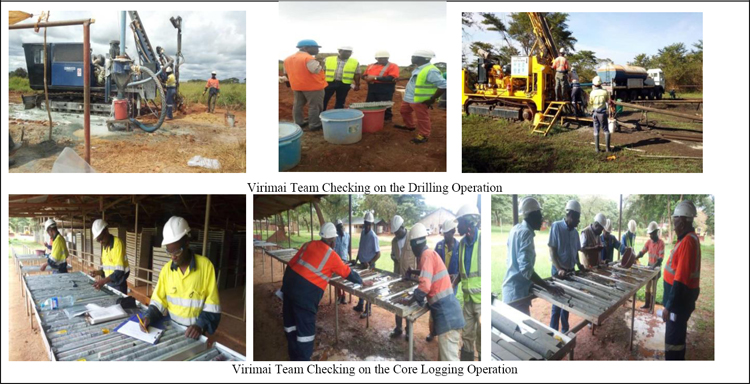
Figure 12.2: Virimai Team Checking on the Drilling on Site
From the recommendations of Messrs Kutekwatekwa and Ngilazi, TRX employed a full-time resource geologist and Database and GIS officer to help manage the 2019 exploration programme. The Database and GIS officer is responsible for receiving logging and lab results sheets for entry into the digital data base. The data officer is the only person with authority of importing assay results into the database. On receipt of each batch of results of assays for the exploration drilling the QA/QC samples are checked to accept or reject the batch. If there is a problem the senior Geologist is notified and he requests the lab to identify and solve the problem if possible or carry out reanalysis. If re-assaying is required then the whole batch or sample tray between the good QC samples is re-assayed. Excel spread sheets and graphs are used to check QC results and update this batch so that the whole program is monitored progressively.
| 12.6 | Verifications by QPs |
Mr Kutekwatekwa has been working with TRX geological team since 2018 initially for the Prefeasibility Study and were further appointed to management the 2019 drilling program by TRX. Since then weekly meetings on skype have been held between the staff of TRX and Virimai Projects to assess on progress and monitor adherence to set protocols during drilling, assaying and analysis of the results. A number of visits to the mine site were carried out by a team of Virimai Projects, in order to independently verify the information incorporated in the latest drill program were in adherence to the set protocols. In accordance with NI 43 101 guidelines Mr Kutekwatekwa most recent visit to the mine site was a weeklong from the 19th to 22nd February 2020. The primary aim of the visits was to witness the extent of the exploration work completed to date, inspect drill core, inspect core logging and sample storage facilities, review data in the database, hold discussions with geologists on the project
| | Page 85 |
| | NI43-101 ITR - Updated Mineral Resource Estimate for Buckreef Gold Project |
On the basis of the quality assurances procedures and the quality control put in place at Buckreef it is the opinion of QPs that the sampling preparation security and analytical procedures used by TRX are consistent with generally accepted industry best practise and are therefore adequate for use in mineral resource estimation and classification of Mineral Resources in accordance with generally accepted CIM standards.
| | Page 86 |
| | NI43-101 ITR - Updated Mineral Resource Estimate for Buckreef Gold Project |
| 13 | MINERAL PROCESSING AND METALLURGICAL TESTING |
| 13.1 | Introduction |
No new detailed Metallurgical test work has been completed as part of this current update study. Virimai Projects assumptions on economic recoveries are based on the several previous test work carried out and reported in previous filling.
The following section summarizes the results of the historical metallurgical test work completed between 2001 and 2017 which were reported in the published reports.
Chemical analysis, mineralogy, comminution, gravity separation and cyanidation tests have been completed that support the process design criteria for the proposed metallurgical operations. The results of these tests are summarised in this section.
| 13.2 | Previous test work |
The following reports of work on the Buckreef deposits have been issued and reviewed:
| ● | Metallurgical Testwork on Buckreef Samples – Geita Gold Mining Ltd, 15th September 2001; |
| ● | Scoping and Diagnostic Testwork on Tanzania Samples for Gallery Gold Ltd – IML (Pty) Ltd, September 2003; |
| ● | Phase 2 Metallurgical Testwork Summary – IAMGOLD, MPC Project 6011, February 2007 |
| ● | Metallurgical Test Programme: IAMGOLD, SGS Southdale, 9 March 2009 |
| ● | Heap leach Amenability Test work - SGS Southdale Metmin Report No 13/527, 16 April 2014 |
The relevant sections of each of these reports is summarised in order in the sections that follow.
| 13.3 | Metallurgical Testwork on Buckreef Samples – Geita Gold Mining Ltd |
Three samples from three drill holes were prepared. For each drill, a composite sample was prepared from 53 sub-samples taken at one-metre intervals along the drill core. The results for these three holes is summarised in Table 13.1.
Table 13.1. Key results from Gieta Gold test work.
| Sample | ||||
| Units | BMRCD 185 | BMRCD 191 | BMRCD 204 | |
| Head grade | g/t | 11.7 | 4.9 | 2.7 |
| Recovery (direct cyanidation) | % | 84 | 86 | 77 |
| Recovery (CIL) | % | 91 | 91 | 77 |
| Cyanide consumption | kg/t | 1.0 | 0.72 | 1.09 |
| Lime consumption | kg/t | 1.17 | 0.50 | 0.87 |
Key observations from this work were the following:
| ● | the gold is leached rapidly, with 80% dissolved within the first two hours; |
| ● | the gold is liberated with grinding, |
| ● | diagnostic leaching and analysis indicated that the residual gold is refractory, associated with pyrite. |
| ● | Arsenic is present at about 22 g/t. |
| | Page 87 |
| | NI43-101 ITR - Updated Mineral Resource Estimate for Buckreef Gold Project |
| 13.4 | Scoping and diagnostic test work – Gallery Gold |
Leaching tests, diagnostic leaching tests, and mineralogy were conducted by Independent Metallurgical Laboratory (IML), based in Perth, Australia. The leaching results are summarised in the Table 13.2.
Table 13.2. Key results from Gallery Gold test work.
| Sample | |||
| Units | BMDD023 | BMDD222 | |
| Head grade | g/t | 3.16 | 6.05 |
| Recovery (direct cyanidation) | % | 71.6 | 87.0 |
| Cyanide consumption | kg/t | 0.83 | 0.58 |
| Lime consumption | kg/t | 1.31 | 1.47 |
| 13.5 | Phase 2 Metallurgical test work – IAMGOLD |
IML performed further test work for IAMGOLD, with MPC acting as consultants. The results of this test work that are relevant to the current project plan are discussed in the sections that follow.
| i. | Grinding test work |
The bond rod mill and ball mill work indices (BRWI and BBWI, respectively) are given in Table 13.3.
Table 13.3. Milling characteristics.
| Item | Unit | Oxide | Primary | |||
| Buckreef Main Clay | Buckreef Main Rock | Buckreef Main 92 | Buckreef Main | Buckreef North | ||
| BRWI | kWh/t | 10.6 | 11.4 | 19.5 | 21.2 | 24.3 |
| BBWI | kWh/t | 9.9 | 12.9 | 22.3 | 17.5 | 17.2 |
| Ai | 0.014 | 0.154 | 0.586 | 0.424 | 0.042 | |
| Classification | Soft | Soft to moderate | Hard | Moderately hard | Moderately hard |
| ii. | Process selection test work |
Process selection test work was undertaken to determine the relative advantages of whole ore leaching, gravity/leaching or gravity/flotation/fine grinding/leaching.
The results of this test work suggested that a gravity/leaching circuit was best suited to this orebody. The comparison of the different options is shown in Table 13.4. The test work indicated that in order to get high recoveries of gold, the flotation tailings must be leached. The consumptions of cyanide and lime were significantly higher in the flotation/fine grinding option.
| | Page 88 |
| | NI43-101 ITR - Updated Mineral Resource Estimate for Buckreef Gold Project |
Table 13.4. Recoveries for different processing options.
| Recovery from Process | Unit | Buckreef Main Oxide | Buckreef North Primary | Buckreef Main Primary |
| Whole Ore Leaching | % | 92.7 | 88.6 | 85.3 |
| Gravity/Leaching | % | 95.5 | 92.9 | 92.4 |
| Gravity/Flotation/Leaching | % | 81.3 | 80.2 | |
| Gravity/Flotation/Tailings leaching | % | 92.1 | 94.5 |
The report recommended that the recoveries for the gravity and leaching sections that should be used in the project evaluation are those shown in Table 13.5.
Table 13.5. Recommended recovery assumptions for project evaluation.
| Item | Unit | Buckreef Main Oxide | Buckreef North Primary | Buckreef Main Primary |
| Gravity recovery | % | 30 | 37 | 41 |
| Leaching recovery | % | 65 | 55 | 51 |
| Total recovery | % | 95 | 92 | 92 |
| 13.6 | Heap leaching test work |
The process selection test work conducted summarised in Table 13.4 did not consider heap leaching as a possible option. Consequently, SGS was contracted to performed these tests. The first set of tests were “simulated heap tests’ using a bottle roll technique, and the second set were column tests at various column heights. These tests are discussed in the following sections.
| i. | Simulated heap tests – SGS 2009 |
Simulated heap leaching tests were conducted using a bottle roll technique. The 7-day simulated heap leaching tests indicated that the extractions varied between 50.2% and 88.9%. The cyanide consumptions varied between 1.08 kg/t and 3.11 kg/t.
| ii. | Heap leaching amenability test work – SGS 2016 |
The recommended height of the heap was determined by pressure percolation tests. The results indicated that the heights are 4.0, 8.2 and 16.5 m for the oxide, transition and primary orebodies, respectively.
Column tests conducted using 4.0 m columns yields leaching extractions of 67.7%, 51.0% and 52.4% for the oxide, transition and primary orebodies, respectively.
| iii. | Conclusions concerning heap leaching |
The heap leaching results were not sufficiently promising compared with those achieved using a gravity recovery and leaching process to justify this process option.
| | Page 89 |
| | NI43-101 ITR - Updated Mineral Resource Estimate for Buckreef Gold Project |
| 13.7 | Conclusions from the test work initiated prior to this study |
The process selection test work indicated that the optimal process is a combination of gravity concentration with leaching of the gravity tails. This is the process route that has been proposed in the current study.
| 13.8 | Documentation |
Apart from the historical test work that has been summarized in the previous section, test work has been undertaken to specifically support the metallurgical design of the plant for the project. This section is a summary of that supporting documentation. The relevant documents are the following:
| (i) | REPORT NO 15/059 r1, prepared by Juan van der Merwe of MMSA, dated 11 January 2016; and, |
| (ii) | Project 6011, prepared by Peter Banovich of Metallurgical Project Consultants Pty Ltd, dated February 2011. |
These documents are attached as Appendix 13.1 and 13.2, respectively, to this chapter.
| 13.9 | Metallurgical test work. |
| i. | Purpose of the test work |
The process selection work conducted by MPC on behalf of IAMGOLD (attached as Appendix 13.2 to this chapter) indicated that the optimal process for this material is a gravity circuit followed by leaching of the gravity tails. The test work conducted in this study is aimed to specifically provide confirmatory information for design purposes. As a result, the test work does not simulate the process, because that was done and reported in Appendix 13.2. Instead, the test work was intended to determine the design parameters, which are discussed in the sections that follow.
| ii. | Sample origin |
A sample of 3.9 t of material was shipped to Emisha Mining Innovations. This sample consisted of the following two bulk samples:
| (i) | a composite sample of 2 t of material from Buckreef South and Buckreef Main oxide/transition ore, and |
| (ii) | a composite sample of 1.9 t of material from Buckreef Main sulphide ore. |
| | Page 90 |
| | NI43-101 ITR - Updated Mineral Resource Estimate for Buckreef Gold Project |
These samples are referred to here as “oxide” and “sulphide”, respectively. The oxide ore is more weathered, as can be seen in Figure 13.1, while the sulphide ore is more competent, as can be seen in Figure 13.2.
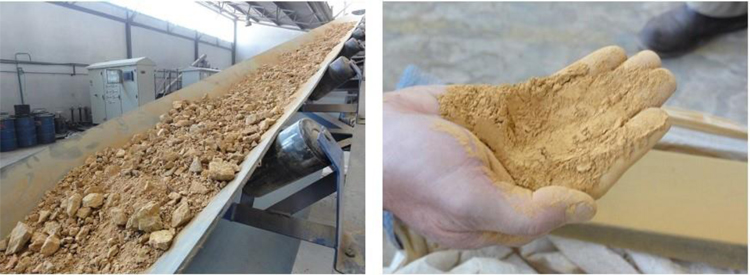
Figure 13.1: Oxide ore before milling and after a single pass of milling in the multi-shaft EDS mill.
(Source: Emisha Mining Innovations)

Figure 13.2: Sulphide ore before milling and after a single pass of milling in the multi-shaft EDS mill.
(Source: Emisha Mining Innovations)
| 13.10 | Grade and deportment |
| i. | Head grade |
The head grade of the oxide and sulphide ores is given in Table 13.6. The oxide ore is lower in grade than the sulphide ore, and possibly displays greater variability.
Table 13.6. Head analysis for gold
(Source: MMSA Report No 15/059 r1)
| Gold analysis, g/t | ||||
| Sample | Replicate 1 | Replicate 2 | Replicate 3 | Average |
| Oxide ore | 1.76 | 2.12 | 1.91 | 1.93 |
| Sulphide ore | 4.73 | 4.51 | 4.55 | 4.60 |
| | Page 91 |
| | NI43-101 ITR - Updated Mineral Resource Estimate for Buckreef Gold Project |
| ii. | Gold deportment in the milled material |
The deportment of gold by size fraction in the milled product was determined. The results of this analysis are shown in Figures 13.3 and 13.4 for the oxide and sulphide ores, respectively.
The results for the oxide ore indicate that the grade of gold is slightly lower in the fine fractions. Because of the large mass of fine material in the oxide ore, this fraction accounts for most of the gold. These results indicate that there is no justification for discarding a particular size fraction.
The results for the sulphide ore indicate that the grade of gold is relatively evenly distributed with size fraction. A similar conclusion to that reached for the oxide ore is applicable, that is, that these results indicate that there is no justification for discarding a particular size fraction.
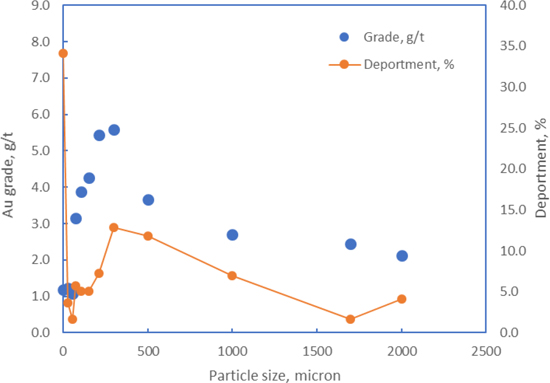
Figure 13.3: Gold grade and deportment by size fraction for the oxide ore, indicating that the gold deportment is higher in the fine fraction, bearing in mind that there is a high fines content of this ore.
(Source: MMSA Report No 15/059 r1)
| | Page 92 |
| | NI43-101 ITR - Updated Mineral Resource Estimate for Buckreef Gold Project |
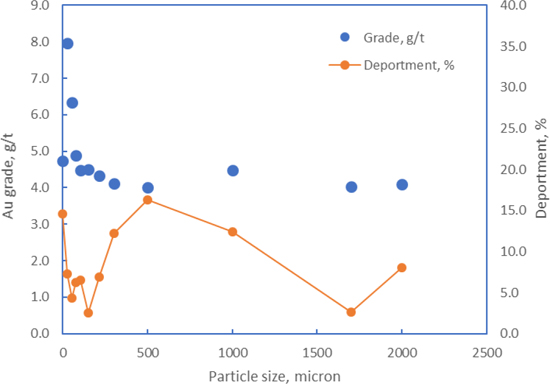
Figure 13.4. Gold grade and deportment by size fraction for the sulphide ore, indicating that the gold is not concentrated in any one size fraction.
(Source: MMSA Report No 15/059 r1)
| 13.11 | Milling |
| i. | Bond milling index |
The bond mill indices for the different ore type is given in Table 13.7. The oxide ore is soft, while the sulphide ore is moderately hard.
Table 13.7 Bond mill indices for oxide and sulphide ore materials.
(Source: Phase 2 Metallurgical Test work Summary Project 6011)
| Domain | Description | BRWI kWh/t | BBWI kWh/t | AI | Classification |
| Oxide | |||||
| Buckreef Main Clay | 10.6 | 9.9 | 0.014 | Soft | |
| Buckreef Main Rock | 11.4 | 12.9 | 0.154 | Medium | |
| Buckreef Main 92 | 19.5 | 22.3 | 0.586 | Hard | |
| Busolwa Oxide | 9.1 | 8.9 | 0.052 | Soft | |
| Busolwa Quartz | 12.8 | 19.0 | 0.335 | Soft | |
| Buziba Oxide | 11.1 | 9.2 | 0.103 | Soft | |
| Sulphide | |||||
| Buckreef Main | 21.2 | 17.5 | 0.424 | Moderately hard | |
| Buckreef North | 24.3 | 17.2 | 0.042 | Moderately hard | |
| Busolwa | 19.1 | 15.1 | 0.131 | Moderately hard | |
| Buziba | 23.2 | 17.6 | 0.339 | Moderately hard | |
| | Page 93 |
| | NI43-101 ITR - Updated Mineral Resource Estimate for Buckreef Gold Project |
| ii. | Pilot milling |
Both the oxide and sulphide bulk samples were milled in a demonstration-scale multi-shaft EDS mill. This is a unique mill, which is designed to maximize the number of particle-particle impact events to achieve milling. The mill does not require media (balls, rods or ceramics). As a consequence, the weight of mill and the associated infrastructure requirements are substantially reduced. The principle of the EDS multi-shaft mill is shown in Figure 13.5.
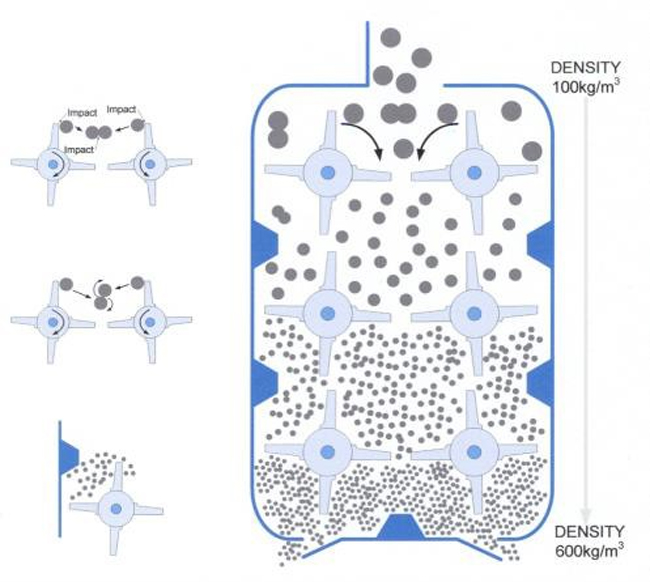
Figure 13.5. Principle of the EDS multi-shaft mill.
The material before and after the milling is shown in Figures 13.1 and 13.2 for the oxide and sulphide ores, respectively. These photographs indicate the effectiveness of a single pass through the EDS multi-shaft mill.
The particle-size distribution for the oxide material after a single milling stage is given in Figure 13.6, and that for the sulphide material is shown in Figure 13.7. These results indicate that the oxide material has a d50 of less than 25 µm, while that of the sulphide ore is about 250 µm. This is a direct consequence of the differences in the intrinsic hardness and the feed distribution of the two materials.
| | Page 94 |
| | NI43-101 ITR - Updated Mineral Resource Estimate for Buckreef Gold Project |
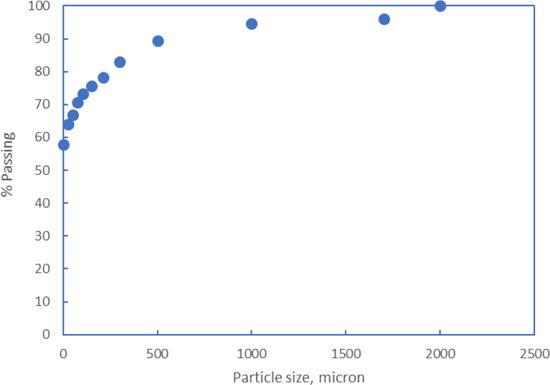
Figure 13.6. Particle-size distribution of the milled (product) oxide ore. (Source: MMSA Report No 15/059 r1)
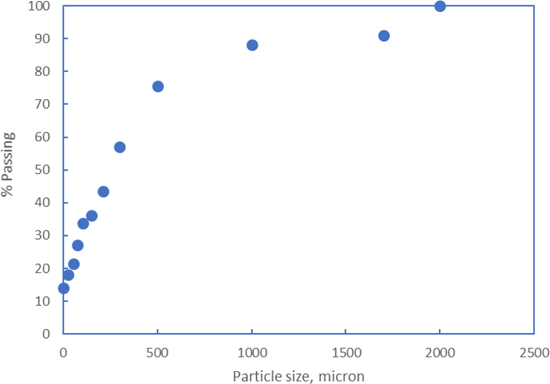
Figure 13.7. Particle-size distribution of the milled (product) sulphide ore. (Source: MMSA Report No 15/059 r1)
| | Page 95 |
| | NI43-101 ITR - Updated Mineral Resource Estimate for Buckreef Gold Project |
| 13.12 | Gravity concentration |
Gravity concentration test work was undertaken using a laboratory-scale Falcon L40 concentrator. These tests were conducted as sequential separations with inter-stage grinding. The grinding stages were as received, 50% less than 75 µm and 70% less than 75 µm.
The results of these tests are shown in Figures 13.8 and 13.9 for the oxide ore and the sulphide ore, respectively.
The gravity concentration tests for the oxide ore indicates that more than 50% of the gold can be concentrated in about 4% of the mass with a grade of about 25 g/t.
The gravity concentration tests for the sulphide ore indicates that about 20% of the gold can be concentrated in about 4% of the mass with a grade of about 25 g/t.
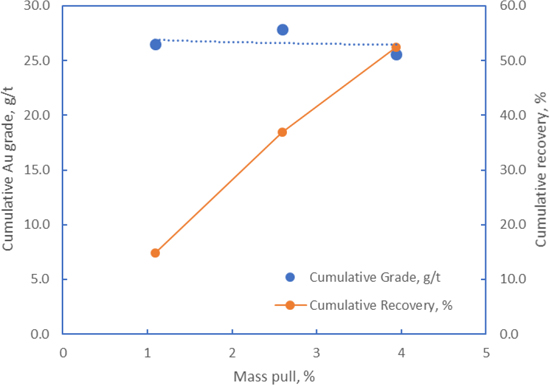
Figure 13.8. Grade and recovery curves against mass pull for the oxide ore using the Falcon L40 concentrator.
(Source: MMSA Report No 15/059 r1)
| | Page 96 |
| | NI43-101 ITR - Updated Mineral Resource Estimate for Buckreef Gold Project |
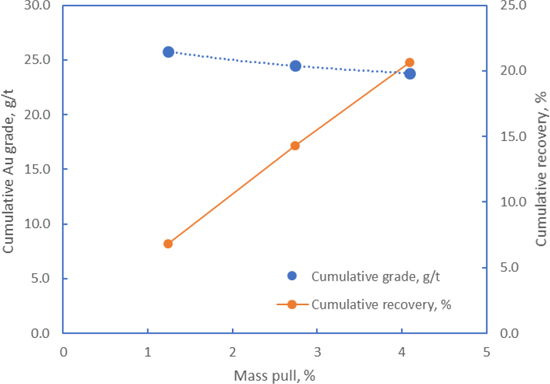
Figure 13.9. Grade and recovery curves against mass pull for the sulphide ore using the Falcon L40 concentrator.
(Source: MMSA Report No 15/059 r1)
| 13.13 | Cyanidation |
Samples of the as-received ores were ground to a p80 of 75 µm and tested with and without the addition of carbon. The results of these tests for the oxide ore and the sulphide ore are shown in Table 13.8. The other conditions of these cyanidation tests are as follows: pH 10.5; NaCN 5 kg/t; cyanidation time 48 hours. The cyanide and lime additions are excessive, and the expected cyanide and lime consumptions are closer to those determined in previous test work. See section 2 of this chapter.)
These results indicate that a leach efficiency of 93.8% can be achieved with the addition of carbon for the oxide ore, and 85.4% for the sulphide ore. These results suggest that a carbon-in-leach circuit will be beneficial in the processing of these ores.
Table 13.8. Cyanidation results for the oxide and sulphide ores.
(Source: MMSA Report No 15/059 r1)
| Domain | Carbon addition, g/L | NaCN addition, kg/t | CaO addition, kg/t | Leach efficiency, % |
| Oxide | ||||
| 0 | 5 | 1.3 | 82.4 | |
| 20 | 5 | 1.3 | 93.8 | |
| Sulphide | ||||
| 0 | 5 | 0.6 | 79.8 | |
| 20 | 5 | 0.6 | 85.4 | |
The MMSA test work summarised in Table 13.8 did not establish the residual concentrations of cyanide and lime after leaching, which means that an accurate estimate of the cyanide and lime consumptions cannot be
| | Page 97 |
| | NI43-101 ITR - Updated Mineral Resource Estimate for Buckreef Gold Project |
determined from this test work. Previous work has established the cyanide and lime consumption, and these results are summarised in Table 13.9.
Table 13.9. Cyanide and lime consumption summary.
(Source: MMSA Report No 15/059 r1)
| Report Name | Ore Type | Source | Milled Particle size (Microns) | Lime Consumption (kg/t) | NaCN Consu (kg/t) | Recovery (%) |
| MPC | Buckreef Main | Gravity | 80% - 106 | 3.84 | 1.14 | *L=62.3 |
| IAMGOLD | oxide | tailings | *G+L=96.9 | |||
| Phase 2 Met Testwork Summary Project 6011 Feb 2007 | Buckreef North Primary | Gravity tailings | 80% - 106 | 1.05 | 0.59 | *L=56.7 *G+L=94.4 |
| Buckreef Main Primary | Gravity tailings | 80% - 106 | 0.36 | 0.36 | *L=55.9 *G+L=93.9 | |
| Busolwa Main | Gravity | 80% - 106 | 3.05 | 1.58 | *L=37.2 | |
| Oxide | tailings | *G+L=98.0 | ||||
| Busolwa Main | Gravity | 80% - 75 | 0.78 | 0.55 | *L=53.8 | |
| Primary | tailings | *G+L=98.9 | ||||
| Buziba Oxide | Gravity | 80% - 106 | 3.19 | 1.07 | *L=43.3 | |
| tailings | *G+L=97.9 | |||||
| Buziba Primary | Gravity | 80% - 75 | 0.74 | 0.34 | *L=54.0 | |
| tailings | *G+L=97.6 | |||||
| MMSA | Sulphides | Ore | As Received | 0.6 | 4.98 | 71.7 |
| 15/059r1 | (48 hours) | |||||
| Report Jan 2016 | Oxides (48 hours) | Ore | As Received | 1.3 | 4.98 | 62.7 |
| Sulphides | Ore | 80% - 75 | 0.6 | *5 | 79.8 | |
| No Carbon | ||||||
| Sulphides with | Ore | 80% - 75 | 0.6 | *5 | 85.4 | |
| Carbon | ||||||
| Oxides | Ore | 80% - 75 | 1.3 | *5 | 82.4 | |
| No Carbon | ||||||
| Oxides | Ore | 80% - 75 | 1.3 | *5 | 93.8 | |
| with Carbon | ||||||
| Sulphides | Ore | As Received | 0.6 | 4.98 | 70.0 | |
| (24 hours) | ||||||
| Oxides | Ore | As Received | 1.3 | 4.98 | 61.1 | |
| (24 hours) | ||||||
* L = Leaching
* G+L = Combined recovery for gravity concentration and cyanidation of gravity tailings
* 5 = Cyanide added at the beginning of the testwork and residual cyanide after the testwork was not provided
| 13.14 | Conclusions |
Process selection: The test work conducted by MPC and SGS has shown that more than 90% of the gold can be recovered by a combination of gravity concentration and leaching of the tails. The MMSA test work established that 93% of the gold from the oxide ore can be recovered without gravity concentration by carbon-in-pulp leaching. The work established that 85% of the gold from the sulphide can be recovered in a similar manner.
Gold deportment: There does not appear to be a concentration of gold with size fraction.
| | Page 98 |
| | NI43-101 ITR - Updated Mineral Resource Estimate for Buckreef Gold Project |
Gold head grade: The gold head grade for the metallurgical tests varied between 1.5 and 6 g/t Au. For the bulk samples supplied that were milled using the EDS mill, the oxide head grade was about 1.9 g/t and the sulphide head grade was 4.6 g/t.
Milling: The bond mill index for the oxide ore is in the range of 9-12 kWh/t, while that for the sulphide ore is in the range of 19 to 24 kWh/t.
Gravity concentration: The gravity concentration test work confirmed that 50% of the gold can be recovered from the oxide ore, and 20% of the gold from the sulphide ore. The mass pulls in both cases is about 4%.
Leaching: The cyanidation test work confirmed that the gold recovery in the presence of activated carbon for the oxide ore was about 93% and for the sulphide ore was about 85%, without gravity concentration at a grind size of 80% less than 75 µm. The expected cyanide consumption is 1.1 kg/t, and the expected lime consumption is 1.5 kg/t.
| 13.15 | Recommendations |
The test work has established the basic process parameters. There is no data on settling and thickening test work, and no data on the tailings storage facility. These aspects should be addressed.
It is recommended that the following test work is conducted:
| ● | A process simulation run of the EDS mill in recirculation mode using a screen size of 100 micron, followed by bulk gravity concentration and bulk leaching of the tailings; |
| ● | Site water characterization; |
| ● | Settling and thickening test work; |
| ● | Tailings characterization; |
| ● | Variability test work. |
| 13.16 | Concluding Remarks |
In April 2020 TRX commissioned SGS Canada Inc of Lakefield Ontario to carry out further metallurgical test work on the fresh rock ores to confirm the prefeasibility flow sheet that includes either Gravity Separation with Gravity Tailing Cyanidation, or Gravity Separation, followed by sulphide Flotation of the gravity tailing, with regrinding and cyanide leaching of reground sulphide concentrate along with possible leaching of flotation tailing. These flow sheets constitute low cost and attractive alternatives for the Buckreef Project. The current round of testing is expected to take approximately five to six months, following which some additional sampling and variability testing may be required that would arise from the design of a new open pit which will be initiated shortly. This large plant will be the basis for the Company’s Final Feasibility NI 43-101 Report.
| | Page 99 |
| | NI43-101 ITR - Updated Mineral Resource Estimate for Buckreef Gold Project |
| 14 | MINERAL RESOURCE ESTIMATE |
| 14.1 | Introduction |
CIM’s Definition Standards for Mineral Resources and Mineral Reserves (May 2014) defines a mineral resource as a “concentration or occurrence of solid material of economic interest in or on the Earth’s crust in such form, grade or quality and quantity that there are reasonable prospects for eventual economic extraction. The location, quantity, grade, geological characteristics and continuity of a Mineral Resource are known, estimated or interpreted from specific geological evidence and knowledge.”
Mineral Resources are not Mineral Reserves and do not have demonstrated economic viability. There is no guarantee that all or any part of the Mineral Resource will be converted into Mineral Reserve. Confidence in the estimate of Inferred Mineral Resources is insufficient to allow the meaningful application of technical and economic parameters or to enable an evaluation of economic viability worthy of public disclosure.
The Buckreef Main Mineral Resource estimates reported in this section were carried out by Virimai Projects. The other three areas, namely Eastern Porphyry, Tembo and Bingwa, were adopted as reported in the 2018 NI- 43-101 update report and are presented in this report without amendment. The Buckreef Main resources estimates are an update necessitated by the infill and extension drilling done in 2018 and 2019 with Virimai Projects providing technical support including the location of the new drill holes.
| 14.2 | Mineral Resource Modelling |
The Buckreef Main comprises several mineralised bodies within a broad shear zone. Each one of these bodies was delineated along cross sections and wireframed. The construction of resource envelopes along sections nominally 25 m apart was done using a “natural” cut-off due to the hard boundary between potentially economic mineralisation and waste. This natural sample cut-off is variable but the lower limit is approximately 0.40 g/t in the oxides and 0.6 g/t in the sulphides with lower external grades being accepted where geological continuity warranted it. Internal waste within the resource envelopes was accepted without further definition. This is tighter than the 0.34 g/t reserve block cut off for oxides and transitional material and 0.37 g/t block cut off for fresh rock obtained from open pit optimisation obtained using the following parameters:
| (a) | Long Term Gold price: USD $1,300 per troy ounce. |
| (b) | Nominal metallurgical recoveries 92.3% Oxides and fresh 85% using conventional gravity and cynidation process. |
| (c) | Mining costs for oxides $1.88/t |
| (d) | Mining costs for fresh rock $2.78/t |
| (e) | Processing costs $10.90/t |
| (f) | Administrative and General Costs -$1.98/t |
The future prospects indicate at least higher prices (besides higher efficiencies and economies of scale or lower costs) and therefore the resource cut off should be lower than 0.34 g/t. However, the natural hard boundary cut- off keeps the economically mineralised zone largely unchanged except to merge some discontinuous zones. At
| | Page 100 |
| | NI43-101 ITR - Updated Mineral Resource Estimate for Buckreef Gold Project |
the grade control stage it is possible to realise extra ore from low grade pods that may have been excluded from the resource models for lack of defined shape and spatial continuity.
Illustrations of the hard boundaries from Buckreef are shown in Figure 14.1 the nominal surface elevation is 1225 m.a.s.l and the sections should give an indicative view of intersections depth below surface. As can be seen from these figures, the resource boundaries are self-defining in the sense that the boundary between potentially economic and uneconomic mineralisation (generally background value or below laboratory detection limit) is quite distinct.
| | Page 101 |
| | NI43-101 ITR - Updated Mineral Resource Estimate for Buckreef Gold Project |
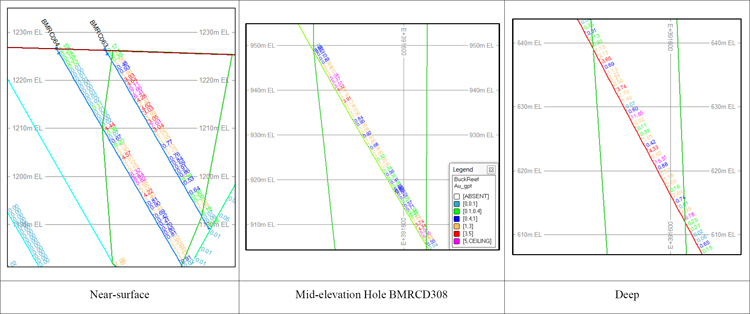
Figure 14.1: Hard boundary illustrations
The sections were the linked to form wireframes for each mineralised body.
| | Page 102 |
| | NI43-101 ITR - Updated Mineral Resource Estimate for Buckreef Gold Project |
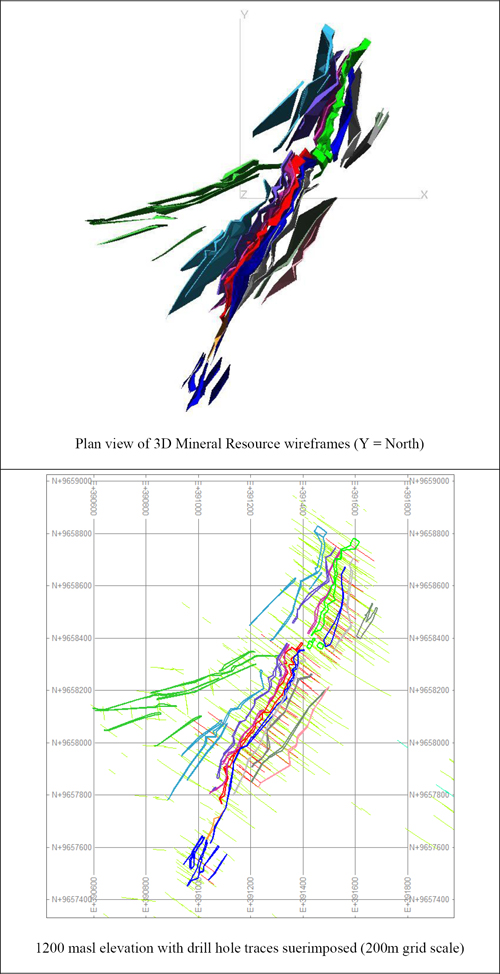
Figure 14.2: Plan View of the Buckreef Main Zone mineralised bodies
| | Page 103 |
| | NI43-101 ITR - Updated Mineral Resource Estimate for Buckreef Gold Project |
| 14.2.1 | Sample Distribution and Statistics |
This section presents the sample statistics within each mineralised body as wireframed. There are eighteen zones of which the Main Zone and South Pit areas form the core around which there are several narrow parallel including a SSW-trending splay. After selection within the wireframes, the samples were composited to 1m to cater for narrow zones which may be as narrows as 2 m to 3 m. The limit to two metres was taken considering that an initial open pit is considered before underground mining where as narrow as 1.5 m reef widths can be mined.
Table 14.1: Statistics of 1m samples and composites within the resource wireframes
| Area | Sub-domain | Records | Missing Values | Samples | Min Au(g/t) | Max Au(g/t) | Mean Au (g/t) | Std. Deviation | Standard Error | Skewness | Geomtric Mean Au (g/t) | Log Estimate of the Mean |
| Main Zone | Extension | 3636 | 157 | 3479 | 0.01 | 207.50 | 2.16 | 4.88 | 0.08 | 25.69 | 0.98 | 2.78 |
| Central | 5001 | 319 | 4682 | 0.01 | 77.50 | 2.74 | 5.49 | 0.08 | 6.03 | 0.94 | 3.66 | |
| South | 67 | 0 | 67 | 0.06 | 6.08 | 1.28 | 1.19 | 0.14 | 1.86 | 0.87 | 1.35 | |
| Main Zone Extension Parallels | Footwall 1 | 725 | 146 | 579 | 0.01 | 41.57 | 0.52 | 1.93 | 0.08 | 17.37 | 0.12 | 0.64 |
| Footwall 2 | 541 | 209 | 332 | 0.01 | 4.95 | 0.25 | 0.57 | 0.03 | 4.51 | 0.05 | 0.28 | |
| Footwall 3 | 1329 | 565 | 764 | 0.01 | 49.50 | 0.56 | 2.30 | 0.08 | 15.07 | 0.08 | 0.64 | |
| Hangingwall 1 | 429 | 100 | 329 | 0.01 | 10.80 | 0.80 | 1.50 | 0.08 | 3.18 | 0.13 | 1.22 | |
| Hangingwall 2 | 294 | 115 | 179 | 0.01 | 8.48 | 0.41 | 1.14 | 0.09 | 5.01 | 0.06 | 0.40 | |
| Hangingwall 3 | 210 | 60 | 150 | 0.01 | 4.06 | 0.36 | 0.68 | 0.06 | 2.96 | 0.08 | 0.47 | |
| Main Zone Central and South Parallels | Footwall 1 | 980 | 299 | 681 | 0.01 | 57.80 | 0.98 | 3.59 | 0.14 | 11.47 | 0.22 | 1.06 |
| Footwall 2 | 745 | 227 | 518 | 0.01 | 111.21 | 1.01 | 5.35 | 0.24 | 17.40 | 0.12 | 1.11 | |
| Footwall 3 | 691 | 189 | 502 | 0.01 | 416.50 | 1.64 | 18.65 | 0.83 | 21.97 | 0.16 | 1.12 | |
| Hangingwall 1 | 1882 | 852 | 1030 | 0.01 | 9.58 | 0.58 | 0.90 | 0.03 | 3.79 | 0.16 | 1.02 | |
| Hangingwall 2 | 415 | 149 | 266 | 0.01 | 10.22 | 0.87 | 1.54 | 0.10 | 3.05 | 0.15 | 1.71 | |
| Hangingwall 3 | 323 | 192 | 131 | 0.01 | 3.76 | 0.30 | 0.59 | 0.05 | 3.10 | 0.05 | 0.32 | |
| Hangingwall 4 | 225 | 129 | 96 | 0.01 | 7.68 | 0.68 | 1.39 | 0.14 | 2.62 | 0.06 | 1.02 | |
| Hangingwall 5 | 94 | 25 | 69 | 0.01 | 2.79 | 0.29 | 0.47 | 0.06 | 2.78 | 0.07 | 0.34 | |
| South Pit | All | 456 | 7 | 449 | 0.01 | 58.40 | 1.72 | 3.59 | 0.17 | 9.71 | 0.71 | 2.18 |
| West Splays | All | 690 | 161 | 529 | 0.01 | 43.05 | 1.05 | 3.48 | 0.15 | 7.27 | 0.12 | 0.92 |
Compared to the mean and log estimate of the mean, the lower geometric mean indicates the disproportionate effect of the relatively few extreme high grades, but the closer the classical mean is to the log estimate indicates the robustness of the mean. Very high grades area evident for the Main Zone Extension (207.50 g/t) Main Zone Central and South Parallels Footwall 2 (111.21 g/t) and Footwall 3 (416.50 g/t). An analysis of the sample grade was done to determine whether these are outliers.
| 14.2.1 | Outlier Analysis |
Outlier analysis of the Buckreef grades was done by comparing the difference between ranked samples starting with the highest grades. The expectation is that there would be a significant jump in difference between non- outlier grades and potential outliers. The magnitude of the jump relative to the whole data set is important. In this case, a difference of less than 30% was not considered significant. The result of this exercise is shown in Figure 14.3. The results shows successive differences are less than 15% up to 77.5 g/t after which there is a 35.38% jump to 105 g/t. This put the cap at 100 g/t for non-outlier grades (calculated 30% jump from 77.7g/t is 100.75 g/t). Note that these are potential outliers until their spatial positions are verified. If a resource boundary can be delineated around the samples then these are not outliers and should be treated as a separate domain. However if they are found at random among much lower-grade samples then they qualify as true outliers.
| | Page 104 |
| | NI43-101 ITR - Updated Mineral Resource Estimate for Buckreef Gold Project |
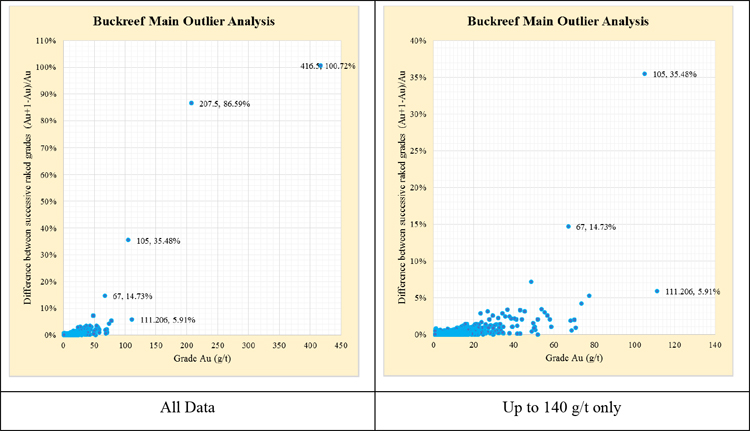
Figure 14.3: Plan View of the Buckreef Main Zone mineralised bodies
All the four grades above 100 g/t are located in Main Zone and Main Zone Extension where high grades are predominant. Two of them (105 g/t and 207.5 g/t) are in the Main Zone Extension within the same 27 m down- the-hole intersection 80 m below surface and contiguous to grades in the 20 g/t to 70 g/t Au range. The 111.206 g/t composite is in the footwall of the Main Zone Extension in a narrow 3 m zone, about 155 m below surface. The highest grade of 416.5 g/t is contiguous to an 18.2 g/t sample approximately 16 m below surface within a 4 m wide supergene-enriched zone in the footwall of the Main Zone Extension. These samples are all in settings which are expected for such high grades and are not outliers.
| 14.3 | Mineral Resource Estimation Models |
The Mineral Resource estimate was informed by both the diamond drilling and reverse circulation drilling results using only one-metre samples and composites confined within the Mineral Resource wireframes constructed by Mr Ngilazi of Virimai Projects in Datamine™ Studio 3 (version 3.21.7164). Experimental semi-variograms were calculated and model semi-variograms fitted for each zone.
| | Page 105 |
| | NI43-101 ITR - Updated Mineral Resource Estimate for Buckreef Gold Project |
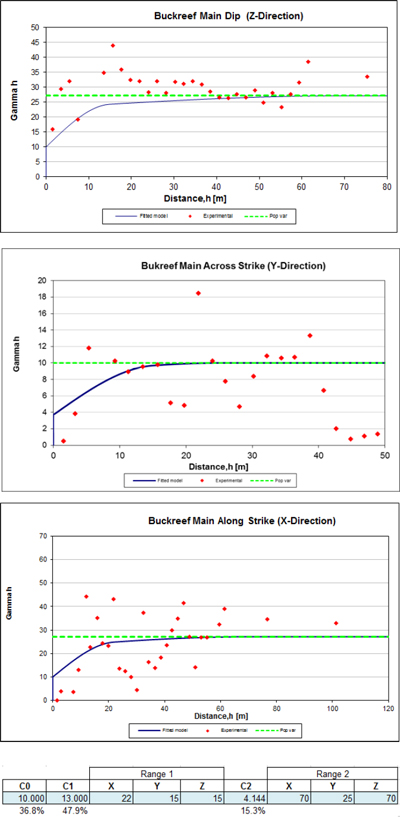
Figure 14.4: Variogram Model
For the hard boundary grade estimation, Virimai Projects applied the Ordinary Kriging (OK) method in Datamine™ Studio 3 (version 3.21.7164).
Table 14.2 Buckreef Summary Semi-Variogram Parameters
| Nugget Co | Range 1 | Spatial Variance C1 | Range 2 | Spatial Variance C2 | Total | |||||
| X1 | Y1 | Z2 | X2 | Y2 | Z2 | |||||
| Main | 0.368 | 22 | 15 | 15 | 0.479 | 70 | 25 | 70 | 0.153 | 1.0 |
| South | 0.350 | 28 | 14 | 22 | 0.481 | 65 | 20 | 75 | 0.169 | 1.0 |
| Parallels | 0.368 | 22 | 15 | 15 | 0.479 | 70 | 25 | 70 | 0.153 | 1.0 |
The search parameters used in conjunction with these semi-variogram models are in Table 14.3.
| | Page 106 |
| | NI43-101 ITR - Updated Mineral Resource Estimate for Buckreef Gold Project |
Table 14.3: Summary of Buckreef search parameters
| Main | South | Parallels | Splays | ||
| Search Rotation (X,Y,Z) | (-65,5,0) | (-65,5,0) | (-65,5,0) | (-30,5,0) | |
| Search Ranges (X,Y Z) | (75,25,70) | (65,20,75 | (75,25,70) | (75,10,75 | |
| Samples | Minimum | 4 | 4 | 2 | 2 |
| Maximum | 30 | 30 | 10 | 20 | |
| Second search range multiplier | 1.5 | 1.5 | 1.5 | 1.5 | |
| Third search range multiplier | 3.0 | 3.0 | 4.0 | 3.0 | |
Table 14.4 Buckreef Project Resource models, Geita District, Tanzania
| Mineralisation Area | Block Model | Model Type | Comment | |
| 1 | Buckreef Main | mod_br_upd2020 | OrdinaryKriging | Updated resource |
| 2 | Eastern Porphyry | mod_ep_mixed | OrdinaryKriging | As per last update |
| 3 | Tembo | mod_tb_mixed | OrdinaryKriging | As per last update |
| 4 | Bingwa | mod_bw_supercap | OrdinaryKriging | As per last update |
The block models reflect the general dimensions of the drilling grid that covers each prospect and consist of separate zones with fields for ordinary kriging grade estimate, number of samples used in the estimate, estimation variance, the check inverse distance grade estimate, oxidation code, density, search volume, domain numeric identifier, domain alphanumeric identifier, and classification.
| | Page 107 |
| | NI43-101 ITR - Updated Mineral Resource Estimate for Buckreef Gold Project |
| 14.3.1 | Density |
In keeping with the existing model, densities for this update report Virimai relied on bulk density measurements made during prior 2014 by Venmyn. The bulk densities were determined by “weight in air versus weight in water” determinations for 2,209 samples. Detailed analysis of the bulk density is given in Venmyn ITR 2014 titled “Update National Instrument 43-101 Independent Technical Report on the Buckreef Project in Tanzania for Tanzanian Royalty Exploration Corporation”. The average densities used in this update mineral resource estimates are summarised in Table 14.5.
Table 14.5 Buckreef Project Updated Resource Model Density
| Mineralisation Area | Density (t/m3) | |
| 1 | Oxide | 2.2 |
| 2 | Transition | 2.5 |
| 3 | Sulphide/Fresh Rock | 2.8 |
| 14.4 | Mineral Resource Estimation Checks |
For historical estimates, Mr Ngilazi carried out inverse distance squared estimate out as a high-level check of the global and local (block by block) of the Venmyn Deloitte ordinary kriging estimates. The comparison is shown in Figure 14.5. Although the estimates are spread around the line of equality, the high-level check validates the robustness of the Venmyn Deloitte estimates.
Virimai Projects also validated the block models using swath analysis where the average of length weighted sample grades within a 100 m wide corridor for Buckreef and 50 m for the other prospects were compared to block model grades within the same swathe. This was done in order to verify that the block models correctly reflected the average of the sample grades within the same swath (Figure 14.6). The results generally show the same trend as the sample grades and the expected smoothening effect of the ordinary kriging process with very high/low sample grades being moderated by the low/high sample grades in the neighbourhood.
The inverse distance squared method as a check method and swath analysis for comparison between block grades and samples were also used for the Buckreef upgrade.
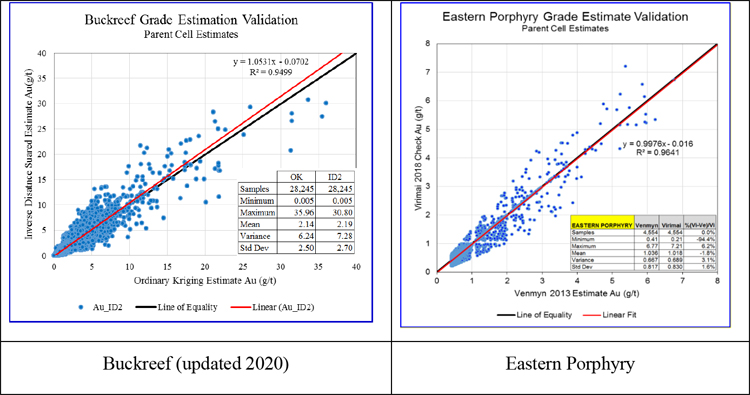
| | Page 108 |
| | NI43-101 ITR - Updated Mineral Resource Estimate for Buckreef Gold Project |
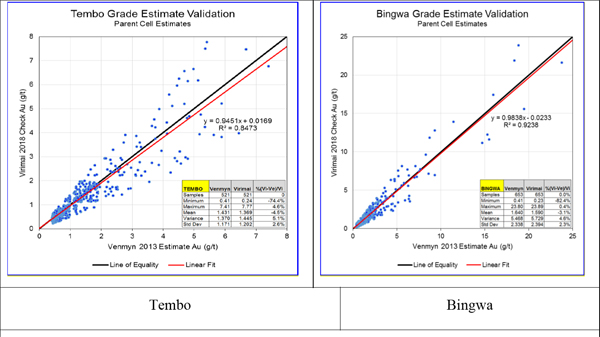 |
| Figure 14.5: Virimai Projects block grade checks |
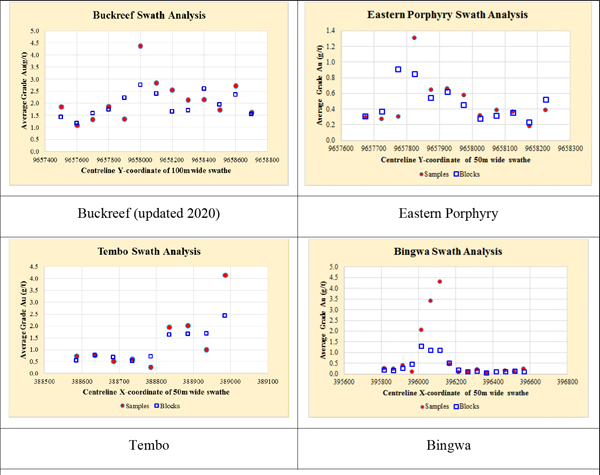 |
| Figure 14.6: Virimai Projects average sample grade compared to average estimated block grade checks |
| | Page 109 |
| | NI43-101 ITR - Updated Mineral Resource Estimate for Buckreef Gold Project |
It is pertinent to note that the Bingwa average grades drop below 0.50 g/t from the easting X+396200 (Figure 14.6). The model checks showed that in the north-eastern half of the strike, continuity is poor and resource grades only start at about 40 m below surface.
| 14.5 | Mineral Resource Classification and Reporting |
Virimai Projects considers that blocks estimated during the first estimation run considering full variogram ranges can be classified in the Measured category and the second estimation run (at one and half times the search volume) can be classified in the Indicated category. For these blocks, Virimai Projects considers that the level of confidence is sufficient to allow appropriate application of technical and economic parameters to support mine planning and to allow evaluation of the economic viability of the deposit. Blocks estimated during the third pass considering search neighbourhoods set at twice or more the variogram ranges should be appropriately classified in the Inferred category because the confidence in the estimate is insufficient to allow for the meaningful application of technical and economic parameters or to enable an evaluation of economic viability.
Based on the knowledge that due to nugget effect, kriging variance does not necessarily get lower nor does the regression slope get better as the grid tightens Virimai found it appropriate to use an additional filter for classification as shown in Table 14.6.
Table 14.6 Buckreef Project Resource models, Geita District, Tanzania
| Search Volume | Nominal Grid | Regression Slope | Class |
| 1 | 25-30 m by 25-30 m | 0.7+ | Measured |
| 2 | >30 m by 50-75m | 0.5 - 0.7 | Indicated |
| 3 | >75 m-100m | <0.5 | Inferred |
Application of the further filters resulted in the downgrading from the Measured category to the Indicated category of approximately 30% of the tonnage classified as Measured using search volume only.
| | Page 110 |
| | NI43-101 ITR - Updated Mineral Resource Estimate for Buckreef Gold Project |
Table 14.7: Buckreef Shear Zone March 2020 Mineral Resource Updated Estimates at 0.4g/t Block Cut off
| Measured | Indicated | Inferred | ||||||||
| Resource | Sub Zone | Tonnes | Grade Au(g/t) | Ounces | Tonnes | Grade Au(g/t) | Ounces | Tonnes | Grade Au(g/t) | Ounces |
| Main Zone | Extension | 8,388,927 | 2.23 | 601,323 | 1,625,876 | 2.07 | 108,388 | 1,121,343 | 1.90 | 68,449 |
| Central | 6,722,737 | 2.30 | 498,003 | 1,462,286 | 3.35 | 157,552 | 849,220 | 3.41 | 93,217 | |
| South | 392,033 | 1.36 | 17,080 | 163,260 | 1.61 | 8,437 | 156,280 | 1.63 | 8,176 | |
| Main Zone Extension Parallels | Footwall 1 | 736,723 | 0.89 | 21,055 | 110,263 | 0.86 | 3,065 | 89,449 | 0.67 | 1,937 |
| Footwall 2 | 0 | 0.00 | 0 | 482,810 | 0.99 | 15,399 | 161,974 | 0.55 | 2,871 | |
| Footwall 3 | 0 | 0.00 | 0 | 1,939,691 | 0.86 | 53,369 | 2,664,877 | 0.60 | 51,382 | |
| Hangingwall 1 | 243,490 | 1.66 | 12,983 | 3,838 | 1.26 | 155 | 0 | 0.00 | 0 | |
| Hangingwall 2 | 0 | 0.00 | 0 | 421,517 | 1.09 | 14,721 | 196 | 1.40 | 9 | |
| Hangingwall 3 | 0 | 0.00 | 0 | 927,600 | 0.68 | 20,263 | 1,284,930 | 0.55 | 22,638 | |
| Main Zone Central and South Parallels | Footwall 1 | 1,456,084 | 1.41 | 66,137 | 489,783 | 0.71 | 11,240 | 1,059,305 | 0.52 | 17,574 |
| Footwall 2 | 0 | 0.00 | 0 | 1,605,278 | 1.52 | 78,457 | 2,685,932 | 1.13 | 97,867 | |
| Footwall 3 | 0 | 0.00 | 0 | 2,916,865 | 1.32 | 123,439 | 5,848,828 | 1.03 | 193,510 | |
| Hangingwall 1 | 1,622,131 | 0.88 | 45,673 | 339,079 | 0.89 | 9,676 | 336,033 | 0.84 | 9,110 | |
| Hangingwall 2 | 0 | 0.00 | 0 | 1,340,142 | 1.62 | 69,888 | 1,309,019 | 1.40 | 58,887 | |
| Hangingwall 3 | 0 | 0.00 | 0 | 254,733 | 0.72 | 5,927 | 4,882 | 0.57 | 90 | |
| Hangingwall 4 | 0 | 0.00 | 0 | 271,919 | 1.43 | 12,494 | 84 | 0.52 | 1 | |
| Hangingwall 5 | 0 | 0.00 | 0 | 171,657 | 0.67 | 3,702 | 2,279 | 0.84 | 61 | |
| South Pit | All | 421,866 | 1.39 | 18,906 | 94,054 | 0.92 | 2,786 | 0 | 0.00 | 0 |
| West Splays | All | 0 | 0.00 | 0 | 1,273,935 | 1.37 | 56,161 | 247,407 | 1.23 | 9,764 |
| Grand Total | 19,983,991 | 1.99 | 1,281,161 | 15,894,585 | 1.48 | 755,119 | 17,822,036 | 1.11 | 635,541 | |
The NI43-101 compliant Mineral Resource estimate as revised by Virimai Projects is shown Table 14.8. To reflect the uncertainty in the shape of mineralisation as wireframed, the summary total tonnage for the Buckreef Shear Zone been rounded off to the nearest 50 tonnes while the grades has been rounded off to two decimal places Contained gold has been rounded off to the nearest 10 ounces.
Table 14.8: Buckreef Project March 2020 Mineral Resource
| Prospect | Measured | Indicated | Inferred | Total Measured + Indicated | ||||||||
| Tonnes | Grade | In Situ Content | Tonnes | Grade | In Situ Content | Tonnes | Grade | In Situ Content | Tonnes | Grade | In Situ Content | |
| (Mt) | Au (g/t) | Au (Oz) | (Mt) | Au (g/t) | Au (Oz) | (Mt) | Au (g/t) | Au (Oz) | (Mt) | Au (g/t) | Au (Oz) | |
| Buckreef | 19.98 | 1.99 | 1,281,160 | 15.89 | 1.48 | 755,120 | 17.82 | 1.11 | 635,540 | 35.88 | 1.77 | 2,036,280 |
| Eastern Porphyry | 0.09 | 1.20 | 3,366 | 1.02 | 1.17 | 38,339 | 1.24 | 1.39 | 55,380 | 1.10 | 1.18 | 41,705 |
| Tembo | 0.02 | 0.99 | 531 | 0.19 | 1.77 | 10,518 | 0.27 | 1.92 | 16,461 | 0.20 | 1.70 | 11,048 |
| Bingwa | 0.90 | 2.84 | 82,145 | 0.49 | 1.48 | 23,331 | 0.22 | 1.49 | 10,541 | 1.39 | 2.36 | 105,477 |
| Total | 20.99 | 2.03 | 1,367,202 | 17.59 | 1.46 | 827,308 | 19.55 | 1.14 | 717,922 | 38.57 | 1.77 | 2,194,510 |
# Buckreef has been updated and reported at 0.40 g/t Au block cut-off
# Eastern Porphyry, Bingwa and Tembo Mineral Resources are quoted at 0.50 g/t Au block cut-off as per last update
| | Page 111 |
| | NI43-101 ITR - Updated Mineral Resource Estimate for Buckreef Gold Project |
Table 14.9 Shows the reconciliation between this update and the last report in 2018.
Table 14.9: Buckreef Project 2020 vs 2018 reconciliation
| Buckreef | 2018 NI43-101 | 2020 NI43-101 Update | 2020 Update - 2018 Report | ||||||
| Tonnes | Grade | In Situ Content | Tonnes | Grade | In Situ Content | Tonnes | Grade | In Situ Content | |
| (Mt) | Au (g/t) | Au (Oz) | (Mt) | Au (g/t) | Au (Oz) | (Mt) | Au (g/t) | Au (Oz) | |
| Measured | 8.90 | 1.72 | 491,368 | 19.98 | 1.99 | 1,281,160 | 11.09 | 2.22 | 789,792 |
| Indicated | 13.09 | 1.41 | 594,097 | 15.89 | 1.48 | 755,120 | 2.80 | 1.79 | 161,023 |
| Inferred | 7.52 | 1.33 | 322,819 | 17.82 | 1.11 | 635,540 | 10.30 | 0.94 | 312,721 |
| Measured + Indicated | 21.99 | 1.54 | 1,085,465 | 35.88 | 1.77 | 2,036,280 | 13.89 | 2.13 | 950,815 |
| Measured + Indicated + Inferred | 29.52 | 1.48 | 1,408,284 | 53.70 | 1.55 | 2,671,820 | 24.19 | 1.62 | 1,263,536 |
The largest tonnage and grade increase has been in the Measured Resources mainly due to the down dip and extension drilling in the central and north extension of the Main Zone where grades are high. The down dip limits which used to be to 650 m.a.s.l is now 400 m.a.s.l or about 100 m from the deepest intersection which contributes to most of the Inferred. The 2018 model assumed that mineralised was narrowing down to 650 m.a.s.l but the latest drilling incorporated in this report indicates that the mineralisation is still open ended. In addition, several parallel narrow reefs have been incorporated with lower confidence levels.
| 14.6 | Exploration Targets |
Besides the estimated resources tabulated herein, there are exploration targets within and extending beyond the delineated and estimated Mineral Resources. Exploration targets within the delineated and estimated Mineral Resources refer to gaps in grade estimation within the strike and depth extent of the delineated resources resulting in islands of blocks with no grade estimates. It also refers to interpreted fault zones that need to be explored further to firm up on the mineral resource losses that were accepted for the current estimate.
Significant potential lies within the Buckreef Shear Zone that is summarised in Table 14.10.
Table 14.10 Exploration targets at the Buckreef Shear Zone
| Target Area | Tonnage Range | Grade Range Au (g/t) | Ounces Range | |||
| Minimum | Maximum | Minimum | Maximum | Minimum | Maximum | |
| Northeast Extension | 4,000,000 | 6,000,000 | 1.40 | 2.50 | 180,000 | 482,300 |
| Main Zone | 25,000,000 | 35,000,000 | 1.30 | 1.50 | 1,045,000 | 1,688,000 |
In should be noted that the potential quantity and grade of these exploration targets is conceptual in nature, that there has been insufficient exploration to define a mineral resource and that it is uncertain if further exploration will result in the target being delineated as a mineral resource as per the NI 43-101 reporting standards. The exploration targets include five isolated drill holes and assume projections of mineralized structures to deep levels as well as an extension of the Northeast Zone, and are based a continuation of favourable geological conditions that host mineralized structures that have been encountered in shallower drilling of Phase 2 to deep levels below the limits of the current wireframes used in the estimation of the new
| | Page 112 |
| | NI43-101 ITR - Updated Mineral Resource Estimate for Buckreef Gold Project |
resources described herein. The exploration targets assume that the extension of the Northeast Zone along strike will be confirmed by additional drilling.
The Phase 3 drilling program is currently underway to further test the continuity of these mineralized structures. Current information from drill holes show high grade intersections including drill-hole BMRCD298 with an intercept average 2.45 g/t from 650 m to 681 m down the hole (NE Extension) and drill-hole BMRCD309 with an intercept average 3.4 g/t from 617 m to 630 m down the hole (Main North)
| 14.7 | Mineral Resources and Conclusions |
Since the last update, June 2018, the Buckreef Shear Zone Measured Mineral Resources have more than doubled in terms of tonnage but increased by two and half times in terms of contained ounces mainly due to the high grades intersected in the Main Zone Central and North East extension during the last campaign. Indicated Mineral Resources have increased by approximately 20% with a corresponding nearly 30% increase in contained ounces. Inferred Mineral Resources have also more than doubled with but contained ounces just fall short of being double. This is due to the deeper drilling that reflects the open–ended nature of the mineralisation.
| | Page 113 |
| | NI43-101 ITR - Updated Mineral Resource Estimate for Buckreef Gold Project |
| 15. | MINERAL RESERVE ESTIMATE |
The last Mineral Reserves estimate for the Buckreef Gold Project are as reported in the last published ITR titled “Amended NATIONAL INSTRUMENT 43-101 Independent Technical Report Mineral Reserves Estimate and Pre-Feasibility Study on the Buckreef Gold Mine Project, Tanzania, East Africa” (Virimai 2018). No update Mineral Reserves have been estimated for the Buckreef Gold Project in this update report for Mineral Resources. A new pit optimisation taking into account of the current Mineral Resources update in the Buckreef prospect and the current prevailing economic factors is still to be completed. The mining philosophy for the development of the Buckreef Gold Project still remains that of initial open pit on the Buckreef deposit transitioning into underground mining at depth while it will be purely open pit for the other three smaller deposits as outlined in the ITR (Virimai 2018).
The following section is a full extract from the report titled “Amended NATIONAL INSTRUMENT 43-101 Independent Technical Report Mineral Reserves Estimate and Pre-Feasibility Study on the Buckreef Gold Mine Project, Tanzania, East Africa.” June 2018:
| 15.1 | Introduction |
This section describes the Mineral Reserves estimation process completed by Virimai Projects in June 2018. By definition a Mineral Reserve is the economically mineable part of a Measured or Indicated Mineral Resource demonstrated by at least a Preliminary Feasibility Study. The Study must include adequate information on mining, processing, metallurgical, economic and other relevant factors that demonstrate, at the time of reporting, that economic extraction can be justified. The Mineral Reserve takes into account diluting material that will be mined in conjunction with the economic mineralized rock and delivered to the processing plant also takes into account the likely unrecoverable material that will be either left in the ground or will be associated with disposed waste rock.
Further, the Mineral Reserves are classified as onlyProvenand/orProbablein accordance with the Canadian Institute of Mining, Metallurgy and Petroleum (CIM) classification of NI 43-101 Resource and Reserve definitions, and the Companion Policy 43-101CP.
In the calculation of reserves the most important step is to ascertain the portion of mineral resource that can be mined economically. Various parameters are put together and used as inputs for the purpose of carrying out criteria-based computations, in the process of defining economic limits of the orebody. In case of surface mining, these computations are done through a process known as Pit Optimization which is performed by using a well-known Lerch’s-Grossman algorithm. The algorithm is implemented in various mine planning software applications such as Geovia Whittle, NPV Scheduler and many others. Given the right input parameters such as geological block model grades, rock classification, mining and processing costs, metal recoveries, geo-technical parameters and the metal price, the software generates a series of nested pit shells. For the purposes of pit optimization, costs are grouped into five key categories as mining, processing, selling, rehabilitation/reclamation and general/administration costs.
From optimization results, final pit shell is selected usually on the basis that it in general maximizes undiscounted or discounted cash flow at the given economic parameters and the applied physical constraints;
| | Page 114 |
| | NI43-101 ITR - Updated Mineral Resource Estimate for Buckreef Gold Project |
however, it can also be selected by considering other factors such as the maximum quantity of metal product being able to realistically produce without adversely affecting the overall economic outcome of the project.
Once the optimal pitshell is selected, it is necessary to carry out designs for the purpose of putting into consideration various practical aspects such as access ramps, benched pit walls, geotechnical berms, minimum mining widths and pit phasing. Using the created pit designs, mineral reserves are calculated within those designs to determine tonnage and grade only of theindicatedandmeasuredpart of the mineral resources, which are respectively converted toprobableandprovenmineral reserves. An economic cut-off grade is usually applied in the calculation to discriminate ore and waste that fall within the designed pit. Mined rock material of grade below cut-off grade would not be profitable if processed basing on the prevailing economic and technological conditions; these materials together with completely barren rock are reported as waste. Reserves estimates presented in this report followed this process and include four deposits that are Buckreef, Eastern Porphyry, Bingwa and Tembo. These deposits contain gold mineralization starting from near the ground surface with generally continued spatial distribution in a manner that is suitable for surface mining particularly open pit mining method.
| 15.2 | Open Pit Mining |
Considering that all the four deposits somehow start from or near the ground surface, Open Pit mining method was a logical choice made by Virimai Projects in completing reserves preparation.
Open pit mining involves cutting vertical or subvertical faces in the ground with reasonable step-ins technically known as benches. Access between benches to the lowest one, is via inclined ramps wrapping around the wall of the pit. Ramps are developed progressively as the pit continues to develop downward. Open pit design follows as closely as possible the selected pit shell in order to stay within expected economic limits. Design also follows geotechnical recommendations in order to ensure long term stability of the mine and reduced risks wall failures .
| 15.3 | Resource Block Model |
Virimai Projects used resources models discussed in chapter 14 of this report for completing mine planning. The model contains among many others important attributes including gold grade field, rock type coding, ore zones coding, mineral resources classification field etc.
| | Page 115 |
| | NI43-101 ITR - Updated Mineral Resource Estimate for Buckreef Gold Project |
| 15.4 | Open Pit Optimization |
Pit optimisations were done using Lerch-Grossman algorithm available in Whittle software. The geological block models were imported into the software considering no depletion of any mined surfaces. The input parameters used in running pit optimisations are shown in Tables below.
Table 15.1: Key Economic Parameters
| Parameters | Value | Units |
| Long Term Gold Price - Reserves | 1,300 | $/Oz |
| Long Term Gold Price - Resources | 1,600 | $/Oz |
| Gov. Royalties | 6.00 | % |
| Export Fee | 1.00 | % |
| Other Applicable Fees (Local Service Levy) | 0.30 | % |
| Discount Rate | 8.00 | % |
| Other Selling Costs (Smelting, Insurance, Security etc) | 4.40 | $/Oz |
| Exchange Rate | 2,250 | TZS/USD |
| Fuel/Diesel Price | 1.20 | $/L |
Table 15.2: Main Operating Constraints
| Parameters | Value | Units |
| Maximum Mining Limit | 14.00 | Mtpa |
| Processing Limit | 1.45 | Mtpa |
| Ore Dilution (External) | 5.00 | % |
| Ore Loss | 5.00 | % |
| Call factor | 100.00 | % |
For running optimizations geotechnical parameters are an integral part and must be understood and applied correctly. Since optimization shells do not include access ramps and/or geotechnical berms, it is vital that sufficient allowance is made to account for these berms and possible geotechnical stability step offs.
Table 15.3: Geotechnical Parameters
| Inter-ramp Slope Angle | Weathered/Soft | Transitional | Fresh Rock |
| For Pit Design (Degrees) | 29 | 46 | 52 |
| For Optimization (Degrees) | 28 | 44 | 47 |
| Flattening for Ramps (Degrees) | -1 | -2 | -5 |
It is noted that the hard rock part has been penalized with higher IRA flattening in order to account for ramps wrapping around the pit walls several times. Geotechnical berms are also taken into consideration.
Table 15.4: Processing Parameters
| Processing | Units | Oxide | Trans | Hard |
| Recoveries | % | 92.33% | 92.33% | 85.50% |
| Processing Cost | ($/t) | 10.09 | 10.09 | 10.24 |
| Rehabilitation Cost | ($/t) | 0.03 | 0.03 | 0.03 |
| G&A Costs | ($/t) | 1.98 | 1.98 | 1.98 |
| Total Ore Cost | ($/t) | 12.10 | 12.10 | 12.25 |
| | Page 116 |
| | NI43-101 ITR - Updated Mineral Resource Estimate for Buckreef Gold Project |
The following is a summary of the outcome of pit optimization for the four deposits.
| ● | There are in total 4 possible push-backs for Buckreef Pit. |
| ● | Bingwa is a single pushback to the final limits |
| ● | Eastern Porphyry is also a single pushback to the final limits |
| ● | Tembo is mined to the ultimate pit limits in one single phase also. |
Optimizations were carried out based on $1300/Oz gold price where by nested pit shells were create using a range of revenue factors between 0.3 and 2 at $20 increments for each deposit.
Analysis for each of the pits was completed resulting in cashflow summaries and charts showing various metrics including discounted and undiscounted cashflow useful for decision making in shell selection.
Guided by the corporate policy where by the company intends to maximize gold production at the best possible economic value, pitshells selected were not necessarily of highest undiscounted cash flow as shown in the charts for each deposit. Selected pits strike a balance between best pit value and gold ounces produce to also maximize mine life which give optionality for developing other potential targets within the area.
| 15.4.1 | Buckreef Pit |
Due to its relatively larger size, Buckreef pit was split into a total of four phases; as a result, its overall value improved significantly by differing waste stripping and improves cash flow in the early years of its life.
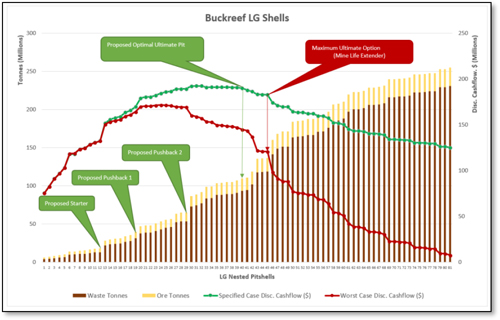 |
| Figure 15-1: Pit by Pit Graph for Buckreef Pit |
Buckreef has been determined to be mineable in 4 phases; which by doing so would allow for deferment of waste stripping hence improve cashflow in the earlier years. Pit shell number 12 was selected to be Phase One or the starter pit, Pit shell number 19 Phase Two, pit shell 29 phase three and the final pit shell was 49. By
| | Page 117 |
| | NI43-101 ITR - Updated Mineral Resource Estimate for Buckreef Gold Project |
looking at pit by pit graphs, usually at step changes represent significant pits shell size change hence suitable for picking pit phases.
Isometric view of the selected pit shells with ore blocks as presented below, depict that Buckreef pits is generally high stripping pit due to its sub vertical ore body.
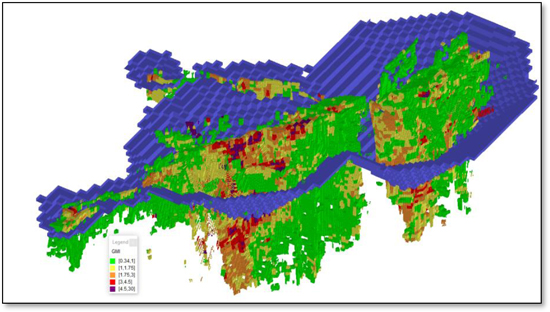 |
| Figure 15-2: Buckreef Selected Ultimate Pit |
In view of the changes in the mineral resource estimates of this prospect the shape general extent of this pit will change once the new pit optimisation taking into account the additional resources is doneinto account.
TRX commissioned SGS of Canada to complete a conceptual study of the underground operation at Buckreef Prospect for the exploitation of the underground. The report provides recommendations to guide stope, underground infrastructure, and crown pillar designs. Key recommendations are:
a. A crown pillar with a minimum thickness of 15 m between the open pit and underground workings
b. Unsupported long hole longitudinal stopes have been assessed for widths of 7.5, 10, and 12.5 m for both single 25 m sub-level interval heights, using Q’ median values. These conceptual or Level 1 underground stope designs will be advanced to the next level of mine design as the basis for a possible underground operation below the planned Buckreef open pit. The presented open pit is based on the June 26, 2018 43-101 Pre- Feasibility Report.
| 15.4.2 | Bingwa Pit |
Bingwa is the second in size on tonnage basis, it however is not large enough to warrant phasing. And is also a short life pit which as a result phasing would not bear any beneficial outcome. Therefore, only the ultimate pit was selected.
| | Page 118 |
| | NI43-101 ITR - Updated Mineral Resource Estimate for Buckreef Gold Project |
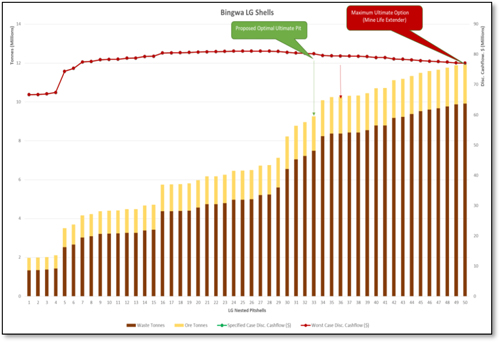 |
| Figure 15-3: Pit by Pit graph for Bingwa |
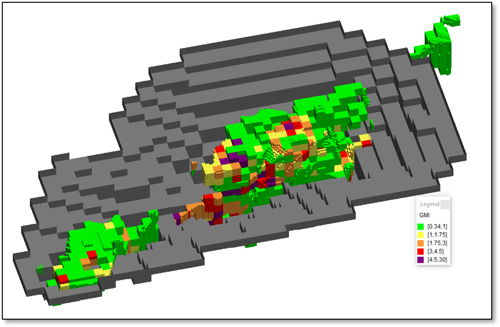 |
| Figure 15-4: Bingwa Selected Ultimate Pit |
| 15.4.3 | Eastern Porphyry Pit |
Eastern Porphyry is a small pit just next to the main Buckreef pit, similar to Bingwa it is a small satellite pit that cannot be practically phased. Ultimate pit shells was selected to be shell number 38
| | Page 119 |
| | NI43-101 ITR - Updated Mineral Resource Estimate for Buckreef Gold Project |
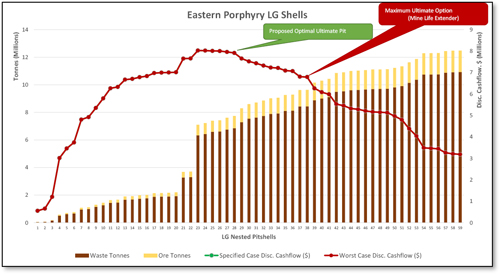 |
| Figure 15-5: Pit by Pit graph for Eastern Porphyry |
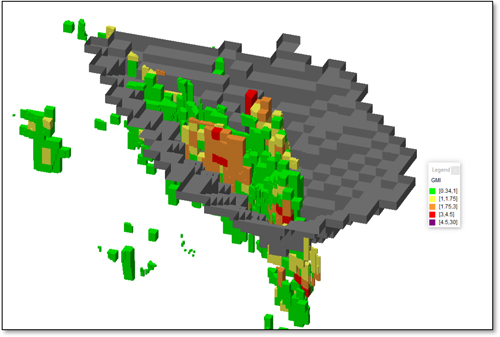 |
| Figure 15-6: Eastern Porphyry Pit Selected Ultimate Pit |
| 15.4.4 | Tembo Pit |
Tembo is the smallest of all the four deposits, and follows the same trend as other satellite pits being too small for any possible phasing. Ultimate selected shell is number 13.
| | Page 120 |
| | NI43-101 ITR - Updated Mineral Resource Estimate for Buckreef Gold Project |
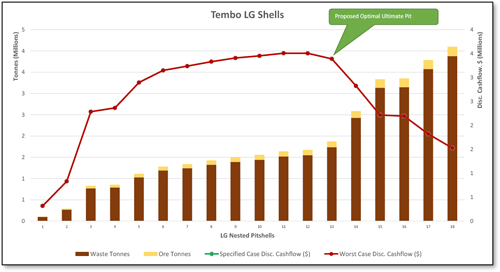 |
| Figure 15-7: Pit by Pit graph for Tembo |
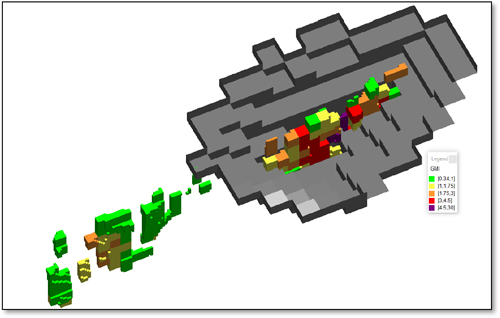 |
| Figure 15-8: Tembo Pit Selected Ultimate Pit |
| 15.5 | Detailed Mine Design |
Open pit mine designs followed the selected economic limits represented by the selected pit shells. Considering that, the deposits are made up of weathered/soft, Transitional and fresh rocks which differ in competency, the design parameters differed based on rock type. Detailed geotechnical study is yet to be completed which may optimize these parameters. However, present assumptions are quite reasonable and are within the limits of
| | Page 121 |
| | NI43-101 ITR - Updated Mineral Resource Estimate for Buckreef Gold Project |
parameters applied by mines around the Buckreef project with similar rock characteristics. Pit design parameters used for design of all the four pits are summarised in Table 15-6
Table 15-6 Mine Design Parameters
| Design Criteria | Weathered/Soft | Transitional | Fresh Rock |
| Bench Height (m) | 5 | 10 | 10 |
| Berm Width (m) | 6 | 8 | 6 |
| Batter Angle (Degrees) | 60 | 80 | 80 |
| Ramp Width (m) | 10 | 10 | 10 |
| Stack Height (m) | 40 | 40 | 40 |
| Stack Berm Width (m) | 10 | 10 | 10 |
| Inter-ramp Slope Angle (Degrees) | 29 | 46 | 52 |
Additionally, waste rock dumps were designed taking into account the final footprint after rehabilitation shaping for rehabilitation purposes. A summary of waste rock dump design parameters are as follows: -
| ● | Lift Height | 15m |
| ● | Ramp Width | 10m |
| ● | Ramp Gradient | 10% |
| ● | Tipping Angle | 32 degrees |
| ● | Final Angle of Rehab | 18 degrees |
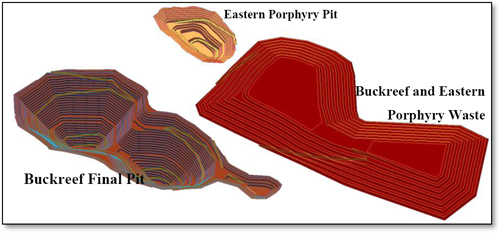 |
| Figure 15-8: Buckreef and Eastern Porphyry Pit and Waste Dump |
| | Page 122 |
| | NI43-101 ITR - Updated Mineral Resource Estimate for Buckreef Gold Project |
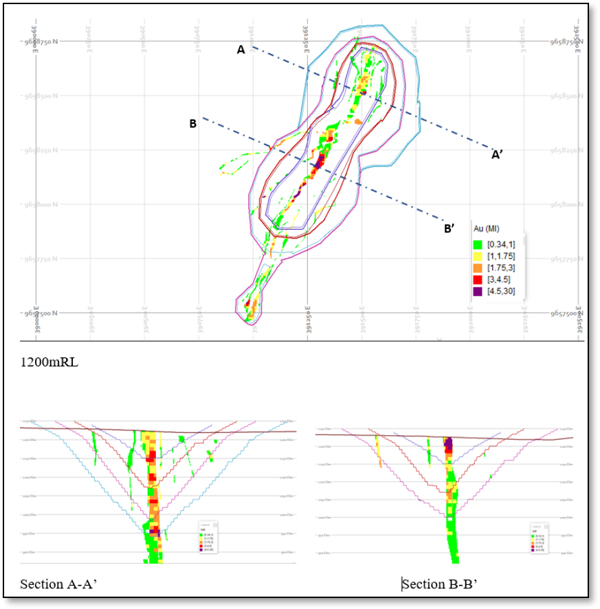 |
| Figure 15-9: Buckreef Pit Design Plan and Sections |
| 15.6 | In-Pit Dilution and Mining Recovery |
Dilution is the term used to describe the grade drop of mined ore in relation to the originally computed insitu grade due to addition of lower grade material or completely barren material. Technically there are two types of dilution, these areinternalandexternaldilution.
Internal dilution is usually a result of averaging material grade to include waste lenses that may be within the ore zone. This is taken care off during resource modelling and so the estimated grade has already accounted for internal dilution. Of particular concern for mine planning purpose is external dilution which is taken into account in order to a consider practical limitations of mining the ore without mixing it with lower grade or barren material. In real life it is not practically possible to completely avoid the mixing consequently the ore grade is diluted due to mining practices. For this project, no extensive mining has taken place hence estimation of dilution is based on experience from other deposits of similar characteristics. It is further expected that responsible mining will be practiced in order to minimize ore dilution. For the purpose of this study it was therefore assumed that 5% will be the applicable dilution.
On the other hand, ore loss is a result of poor recovery from especially ore body contacts where by part of the ore is left in the ground or the split in waste and ore boundaries is not precise enough as a result portion of the ore is sent to the waste rock disposal areas. This is also an outcome of mining practices. With application of leading practices, it can be controlled and reduced. An ore loss of 5% was also considered.
| | Page 123 |
| | NI43-101 ITR - Updated Mineral Resource Estimate for Buckreef Gold Project |
| 15.7 | Cut-Off Grade Criteria |
In order to determine ore and waste within the pit designs, fixed cut-off grades by rock type were computed based on break-even analysis. In this analysis, all materials with grades equal or above the prescribed cut-off were classified as ore, whereas the rest with grades lower than the cut-off were considered as waste.
The breakeven calculation formula is used is as follows: -
| Cut − Off = | (Processing Cost − Rehabilitation Costs) |
| (Gold Price x Recovery) |
Where
| ● | Cut-Off is expressed in grams per tonne (g/t) |
| ● | Processing cost is in dollars per tonne of ore processed ($/t) |
| ● | Rehabilitation cost is in dollars per tonne of mined ($/t) |
| ● | Gold price in dollars per gram recovered ($/gm) |
| ● | And recovery in percentage or fraction of contained gold in the ore fed to the process. |
| 15.8 | Open Pit Material Inventory |
After completing all the steps in preparation as described in this section for computation of reserves pit design and cut off grades were used to calculate reserves for each deposit. The obtained Cut off grade was used to classify ore and waste but also resource class Indicated and Measured were used to convert ore tonnes in those categories into Probable and Proven reserves respectively.
Table 15.7 Open Pit Reserves Summary
| Pits Design Reserves Summary Round 3 | COG: Oxide & Trans = 0.34, Fresh = 0.37 | ||||
| Virimai June 2018 Pit Design Reserves Summary | |||||
| Prospect Name | Reserves Category | Tonnes | Grade | In Situ Gold Content | |
| (Mt) | Au (g/t) | Kg | oz | ||
| Buckreef | Proven | 8,174,415 | 1.64 | 13,374 | 429,986 |
| Probable | 8,174,147 | 1.40 | 11,436 | 367,667 | |
| Total (Proven + Probable) | 16,348,562 | 1.52 | 24,810 | 797,652 | |
| Eastern Porphyry | Proven | 79,385 | 1.17 | 93 | 2,982 |
| Probable | 976,281 | 1.03 | 1,003 | 32,242 | |
| Total (Proven + Probable) | 1,055,666 | 1.04 | 1,096 | 35,224 | |
| Tembo | Proven | - | - | - | - |
| Probable | 70,183 | 2.35 | 165 | 5,312 | |
| Total (Proven + Probable) | 70,183 | 2.35 | 165 | 5,312 | |
| Bingwa | Proven | 1,098,383 | 2.39 | 2,625 | 84,390 |
| Probable | 510,154 | 1.30 | 662 | 21,271 | |
| Total (Proven + Probable) | 1,608,536 | 2.04 | 3,286 | 105,661 | |
| Grand Total | Proven -Stockpile | 119,726 | 1.86 | 223 | 7,160 |
| Proven | 9,352,183 | 1.72 | 16,092 | 517,358 | |
| Probable | 9,730,764 | 1.36 | 13,265 | 426,492 | |
| Total Ore | (Proven + Probable) | 19,202,673 | 1.54 | 29,580 | 951,009 |
| 1. | CIM definitions were followed for Mineral Resource Estimates |
| 2. | Mineral Reserve is estimated at gold price of US$1,300/oz |
| 3. | Cutoff grade of Oxides 0.34g/t and fresh rock of 0.37g/t |
| 4 | Metallurgical recoveries of 92% for oxides and 85% for fresh rock |
| | Page 124 |
| | NI43-101 ITR - Updated Mineral Resource Estimate for Buckreef Gold Project |
| 15.1 | Concluding Remarks |
As stated in section 15.1 of the report the Mineral Reserves stated herein are based on the optimisation of the Mineral Resources as at June 2018. Virimai expects a change in the Mineral Reserves inventory of the Buckreef Prospect in view of the May 2020 update of the Mineral Resources of the Buckreef Prospect on completion of the new pit optimisation and design work and the planned feasibility study of the underground mine to exploit the deep Mineral Resources of the prospect as identified through this update report. The Mineral Reserves of the other smaller pits of Bingwa, Tembo and Eastern Porphyry will remain as defined in the 2018 ITR.
| | Page 125 |
| | NI43-101 ITR - Updated Mineral Resource Estimate for Buckreef Gold Project |
| 16. | MINING METHOD |
| 16.1 | Introduction |
In the 2018 update study it was assumed that only open pit mining methods will be used for the resource extraction and any resource falling below the pit will be subject of future studies. The mining methods and production capacity have been tailored to match the milling throughput of 0.5Mtpa in year 1 ramping up in year 2 to 1.0Mtpa and then to 1,5Mtpa when in full production in year 4 of project start up. The open pit operations will deliver mined ore to the primary crusher for sizing and delivery into the processing plant.
The project consists of four deposits that are Buckreef, Eastern Porphyry, Tembo and Bingwa. These are near to the surface and are suitable for open pit mining method. The deposits consist of weathered zones/soft, transition and fresh zones. Selection of mining method is usually dictated by among other aspects the nature of the orebody which ultimately dictates the economics. For near surface orebodies, usually the first choice is to look for possibility to mine by surface method. Deep seated orebodies are commonly considered for underground mining. At Buckreef project all the deposits are near surface, consequently Open Pit mining method was chosen as the highest-ranked option for consideration. Validation of this selection was verified by running pit optimization to see if the larger portion of the orebody would be mineable economically by means of open pit.
| 16.2 | Open Pit Mining Method |
Open pit mining is a method of extracting ore from the ground by mean of excavating a series of vertical or sub vertical faces while leaving wide horizontal ledges to make what is commonly know is mining benches. Mining will involve conventional drilling, blasting load and haul of both waste and ore using Articulated Dump Trucks (ADT) and Excavators R966 Liebherr. This will be a owner mining meaning the owner will acquire the mining fleet an operate using own crew to carry out mining activities.
In order to appropriately schedule waste stripping in a manner that improves project economics, Buckreef main pit will be mined by a series of four pushback starting with a small cut and increasing in size by step of each pushback to the final pit.
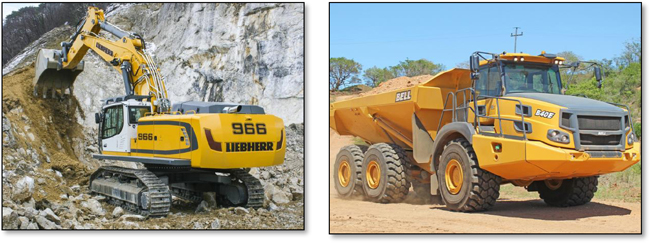 |
| Figure 16-1. Key Mining Equipment |
| | Page 126 |
| | NI43-101 ITR - Updated Mineral Resource Estimate for Buckreef Gold Project |
| 16.3 | Open Pit and Stockpiles Geotechnical Designs |
Long term mine stability is a critical component in consideration during design, especially when a pit has to operate for several years. Therefore, as mining continues, the walls must be able to hold in place while going through changes in seasons and excavation continue to the bottom. The pit wall will be subjected to various forces including vibrations due to blasting, wetting due to rains, gravitational forces due to changing shape of the ground also possible seismic activities. In order to achieve the intended wall stability, detailed geotechnical study is required that will identify key rockmass characterizations and establish design parameters for suitable mining without rock failures.
For purpose of pre-feasibility study, a preliminary rockmass characterization was carried out using existing core samples taken from drilling around the site. Rock core sample as shown in figure 16-2, appear to be good based on what can be seen as superior Rock Quality Designation (RQD) Index.
Using this information preliminary recommendation for stability design were completed and have been used in the current pit designs.
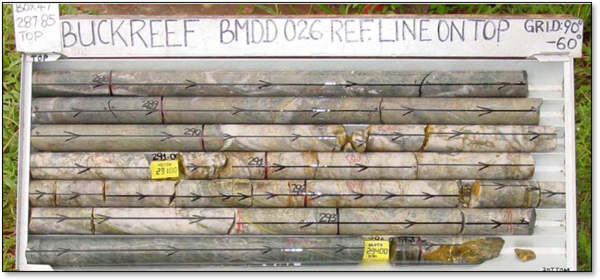 |
| Figure 16-2: Buckreef Rock Core Sample (Source Geology of the Rwamagaza Greenstone Belt and Au prospects therein. Andrew Tunks & Jamie Rogers September 2006) |
| 16.4 | Open Pit Mine Planning |
| 16.4.1 | Open Pit Mine Production Schedule |
Open pit mine production schedule was developed for each of the pit by Virimai for the operation of the Buckreef Gold Project. The schedule is summarised in Table 16.4.
| | Page 127 |
| | NI43-101 ITR - Updated Mineral Resource Estimate for Buckreef Gold Project |
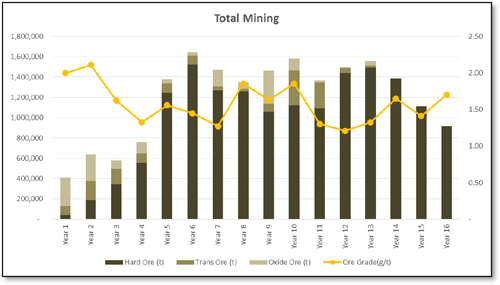 |
| Figure 16-3 Mining Annual Summary |
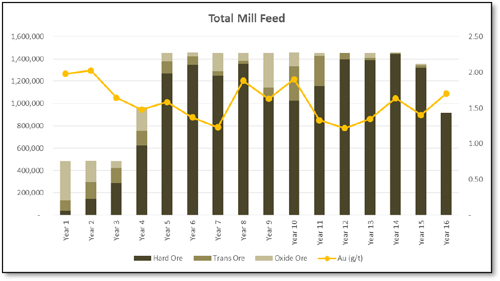 |
| Figure 16-4 Mill Feed Annual Summary |
| | Page 128 |
| | NI43-101 ITR - Updated Mineral Resource Estimate for Buckreef Gold Project |
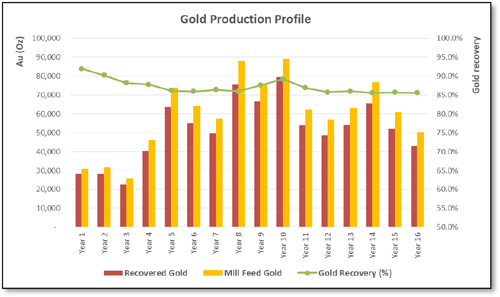 |
| Figure 16-5 Gold Production Annual Profile |
| | Page 129 |
| | NI43-101 ITR - Updated Mineral Resource Estimate for Buckreef Gold Project |
Table 16.4 Summary of Scheduled Milled Tonnages and Waste Tonnages (Refer –Appendix 16.1)
| Total | |||||||||||||||||
| Tonnes of Oxide Ore | 274 | 256 | 80 | 110 | 39 | 31 | 159 | 65 | 321 | 118 | 16 | 1 | 41 | - | - | - | 1,510 |
| AUMI of Oxide Ore | 2.04 | 1.53 | 1.13 | 0.89 | 0.70 | 1.22 | 1.02 | 2.08 | 1.98 | 3.92 | 0.74 | 0.79 | 2.11 | - | - | - | 1.78 |
| Tonnes of Oxide Waste | 2,713 | 1,443 | 2,087 | 598 | 191 | 1,551 | 2,086 | 2,140 | 1,978 | 3,323 | 918 | 82 | 1,046 | - | - | - | 20,155 |
| Tonnes of Oxide Ore & Waste | 2,988 | 1,699 | 2,166 | 707 | 230 | 1,581 | 2,245 | 2,205 | 2,299 | 3,440 | 935 | 83 | 1,086 | - | - | - | 21,665 |
| Tonnes of Trans. Ore | 92 | 192 | 150 | 93 | 93 | 91 | 40 | 21 | 82 | 341 | 256 | 52 | 17 | - | - | - | 1,520 |
| AUMI of Trans. Ore | 2.18 | 2.86 | 1.63 | 0.87 | 1.01 | 1.01 | 1.57 | 1.04 | 1.05 | 3.10 | 1.29 | 0.91 | 2.72 | - | - | - | 1.92 |
| Tonnes of Trans. Waste | 1,296 | 1,097 | 2,134 | 1,410 | 733 | 1,525 | 1,930 | 1,277 | 1,629 | 2,700 | 2,878 | 1,368 | 368 | - | - | - | 20,346 |
| Tonnes of Trans. Ore & Waste | 1,388 | 1,289 | 2,284 | 1,504 | 825 | 1,616 | 1,970 | 1,298 | 1,711 | 3,041 | 3,134 | 1,420 | 385 | - | - | - | 21,866 |
| Tonnes of Hard Ore | 43 | 187 | 346 | 555 | 1,247 | 1,522 | 1,269 | 1,263 | 1,060 | 1,122 | 1,092 | 1,440 | 1,497 | 1,386 | 1,110 | 915 | 16,053 |
| AUMI of Hard Ore | 1.37 | 2.14 | 1.73 | 1.49 | 1.63 | 1.48 | 1.29 | 1.86 | 1.57 | 1.26 | 1.31 | 1.22 | 1.29 | 1.65 | 1.41 | 1.70 | 1.48 |
| Tonnes of Hard Waste | 508 | 1,766 | 4,055 | 6,824 | 7,781 | 6,839 | 7,985 | 9,294 | 14,640 | 12,160 | 14,550 | 15,490 | 12,149 | 12,888 | 13,176 | 1,102 | 141,207 |
| Tonnes of Hard Ore & Waste | 551 | 1,953 | 4,401 | 7,379 | 9,028 | 8,361 | 9,254 | 10,557 | 15,700 | 13,283 | 15,641 | 16,930 | 13,645 | 14,274 | 14,286 | 2,017 | 157,260 |
| Tonnes of Oxide, Trans and Hard Ore | 409 | 635 | 575 | 758 | 1,378 | 1,644 | 1,469 | 1,349 | 1,462 | 1,581 | 1,364 | 1,493 | 1,555 | 1,386 | 1,110 | 915 | 19,083 |
| AUMI of of Oxide, Trans and Hard Ore | 2.00 | 2.11 | 1.62 | 1.33 | 1.56 | 1.45 | 1.27 | 1.85 | 1.63 | 1.85 | 1.30 | 1.21 | 1.32 | 1.65 | 1.41 | 1.70 | 1.54 |
| Tonnes of of Oxide, Trans and Hard Waste | 4,518 | 4,306 | 8,276 | 8,833 | 8,705 | 9,914 | 12,000 | 12,712 | 18,248 | 18,183 | 18,346 | 16,940 | 13,562 | 12,888 | 13,176 | 1,102 | 181,708 |
| Tonnes of of Oxide, Trans and Hard Ore & Waste | 4,927 | 4,941 | 8,851 | 9,590 | 10,083 | 11,558 | 13,469 | 14,060 | 19,710 | 19,764 | 19,710 | 18,432 | 15,117 | 14,274 | 14,286 | 2,017 | 200,791 |
| SR (w/o) | 11.04 | 6.79 | 14.38 | 11.66 | 6.32 | 6.03 | 8.17 | 9.42 | 12.48 | 11.50 | 13.45 | 11.35 | 8.72 | 9.30 | 11.87 | 1.20 | 9.52 |
| | Page 130 |
| | NI43-101 ITR - Updated Mineral Resource Estimate for Buckreef Gold Project |
The production schedule was developed with the aim of delivering the highest ore grades to the mill as early as possible in order to maximize the near term cash flow of the project and maximize the net present value. This was guided by mining the Buckreef pit in four phases in a value sequence per the price sensitivity of the pits and phases from the pit optimization exercise.
Production of ore and waste will begin in the first year of operation at the Buckreef open pit. The mining schedule is based upon all proven and probable reserves located within pits defined using only measured and indicated resources.
Virimai adopted a value based (cash-generation capacity) pit ranking as well as proximity to process plant and ease of mine development approach to come up with an optimal production schedule. This strategy should be revisited and reviewed annually in the development of the next life of mine business plan considering available information and evolving business climate.
To assist the sequencing, cash cost per recovered ounce for each cutback or pit was calculated and ranked from lowest to highest. To maximize the return on investment, pits with the lowest cash cost (or in other words highest cash margins) are sequenced first. Other considerations were:
| ● | Percentage of oxidation, |
| ● | Plant capacity, |
| ● | Satellite Haulage capacity, and |
| ● | Bench turnover rate. |
Table 16.5 Summary of Scheduled Tonnages by Pit Tonnages
| Buckreef | Bingwa | Eastern Porphyry | Tembo | ||
| Waste | t | 160,217,803 | 10,311,730 | 9,823,912 | 1,424,651 |
| Ore | t | 16,348,562 | 1,608,536 | 1,055,666 | 70,183 |
| Grade | g/t | 1.52 | 2.04 | 1.04 | 2.35 |
| Ounce Mined | g/t | 797,664.77 | 105,660.16 | 35,223.36 | 5,312.10 |
| Stripping Ratio | t:t | 9.80 | 6.41 | 9.31 | 20.30 |
| Distance to Plant | km | 1.2 | 5 | 1.3 | 3 |
| Ranking | 1 | 2 | 3 | 4 |
Based on the total in pit reserves available the open pit mine life is estimated at 16 years using the production rate of 0.5Mtpa for the first year 1.0Mtpa for year 2-3 and then 1.497Mtpa from the fourth year to end of mine life.
Major considerations for the mining schedule included:
| ● | The bench by bench mining approach is considered for this type of ore body. The ore body is vertical so ore body selectivity is limited in almost all the pits. This approach brings more benefits in the middle of the life of mine. |
| ● | Mining production operations commence at and continue at the Buckreef Main Pit for the first four (4) years, the focus will be treating the oxide material at the process plant in that period. The production rate is gradually increased from ~300,000tpa to ~480,000tpa by end of 4th year. |
| | Page 131 |
| | NI43-101 ITR - Updated Mineral Resource Estimate for Buckreef Gold Project |
| ● | Year-0 includes pit pre-development including waste stripping, haul road and infrastructure construction with the process plant mainly processing ROMPAD material already on-hand for commissioning. |
| ● | In Year-4 production rate is ramped up to ~1.497Mtpa from the Buckreef main pit while in Year-4, production from the Bingwa pit will commence with production rates set around ~120,000tpa during its first years of operation. Production from Bingwa will be mostly be saprolite material while sulphide ores will commence being mined at the main Buckreef pit. |
| ● | In Year-10 production from the Eastern Porphyry pit will commence with production rates set around ~20,000-87,000tpa. |
| ● | In Year -10, the Tembo pit also comes online with overall mine production rates approximating 20ktpa to 25ktpa until LOM in Year-11. This is a small pit with a life of one year. |
The production schedule applies a stockpiling strategy in order to elevate the feed grade to the mill early on. Saprolite and fresh rock ores are divided into low grade, medium grade and high grade categories with high and medium grades being prioritized in the mill feed. Low grade saprolite and rock ores are stockpiled separately until required to “fill the mill” when insufficient high grade and medium grade are being mined.
The Buckreef main pit remains the backbone of the mine over current LOM. The pit has ore of higher tonnages. Therefore, it is of strategic importance that the ore supply from this pit flows constantly. The Bingwa project is mostly oxide and it contains a larger amount of low grade as well. Enough time is given to this pit to allow grade control to take place. The grade control will turn this project into a pit of higher value because its ore body is thick and consistence as compared to the rest of the pits.
The ore treatment philosophy is that all material above the cut off is treated first. The grade control is potentially very important to increase the confidence of the ore body and increase the tonnage. It is very important to note that marginal material is separately stockpiled for treatment at the end of life after all pit mining has stopped, i.e. under reduced cost structure. The full detailed of mining and plant schedule is as indicated in Appendix 16.1
| 16.4.2 | Material Management |
During mining operations ore from the various pits will be tipped direct into the grizzlies of the three modular plants or will be stockpiled on the feed stockpile or on low grade stockpile for material with grades below cut- off. Both the RoM ore and the low grade stockpiles will be placed close to the primary crusher to reduce the re- handling costs. The low grade stockpile will be depleted after the pits have been depleted. It must however be noted that in this study all material below cut off grade has been considered as waste.
| 16.4.3 | Waste Dump Design |
The waste rock piles have been designed according to the waste requirements of each of the pit and are located around the periphery of the pits to minimize the haulage distance. The material properties assumptions used for the design of the waste rock piles are an in-situ waste rock density of 2.75t/m3 and a swell factor of 35%. The waste dumps are located and sized to fit entirely within Buckreef’s mining claims or leasing area and are kept at an adequate distance from all major water basins.
Each of the waste dumps for the four pits are estimated to hold waste volumes as summarised in table 16.5.
| | Page 132 |
| | NI43-101 ITR - Updated Mineral Resource Estimate for Buckreef Gold Project |
Table 16.5 Summary of Waste Dump Volumes at each of the Pits
| Area | Waste | Waste dumps Volumes |
| (t) | Mm3 | |
| Buckreef | 160,217,803 | 96.52 |
| Bingwa | 10,311,730 | 6.21 |
| Eastern Porphyry | 9,823,912 | 5.92 |
| Tembo | 1,354,467 | 0.82 |
| Totals | 181,707,912 | 109.46 |
The dumps will be built in 5 m lifts, with 15 m bench heights. Dumping has been sequenced in phases to allow for shorter hauls during earlier years of operation.
| 16.4.4 | In-Pit Dumping |
The Buckreef pit is a elongated pit of about 1.5km in total length as the pit gets to the lower depth in order to reduce the cycle times for waste haulage and maintain the quantity of dump trucks at reasonable levels an in-pit dumping regime is considered. These in pit dumps will be located to the south of the pit and to the north. These in-pit dumps will only be considered after further drilling to sterilise the zones below those currently defined by the current drilling in the south and north of Buckreef.
| 16.5 | Operating Time Assumptions |
The operating regimes for the Buckreef Gold Project have been set in two categories as follow:
| ● | Primary Plant operating times |
| ● | Open Pit Mining operating times. |
The two have been separated in order to take into account the extra scheduled hours typically associated with mining operation such as blasting times, inspection and refuelling of earthmoving equipment and shift change. The plant is planned to operate on 3 -8hour shifts per day, 7 days per week while the mining operations are planned on 2 -10 hour shifts per day, 7 days per week. The 2 hour in between shifts is allowed for blasting, inspection and refuelling of earthmoving equipment.
| 16.6 | Mine Equipment and Operations |
Selection and sizing of mining fleet was done by computational simulations using Talpac fleet management software. Ancillary equipment also included in the list of machines require for the operation.
The full schedule of mining equipment employed to meet its current requirements is given below.
| Item | Machine Type | Model | Make | Units |
| 1 | ADT | B40E | Bell | 17 |
| 2 | Excavator | R966 | Liebherr | 3 |
| 3 | Dozer | PR754 | Liebherr | 3 |
| 4 | Wheel Dozer | PR755 | Liebherr | 1 |
| 5 | Grader | 770G | Bell | 1 |
| 6 | ADT Water Bowser | B30E - 27,000L | Bell | 1 |
| 7 | ADT Fuel Bowser | B25E - 23,000L | Bell | 1 |
| 8 | Drilling Rig | 3 |
| | Page 133 |
| | NI43-101 ITR - Updated Mineral Resource Estimate for Buckreef Gold Project |
The loading equipment are backhoe hydraulic excavators equipped with 4.5m3 bucket capacity and these will be supported by a fleet of articulated dump trucks with 40tonne payload capacity which is a good match for the 4m3 bucket excavator. The truck fleet will start with 6 in year 1 and will increase to 17no in year 4 when the mine reaches steady production. The support equipment such as dozer and grader tend to follow the increase in the profile of the prime earthmovers.
An analysis was performed to evaluate and determine the optimum size and configuration of the truck and excavator fleet.Various sizes, brands of haul trucks, excavators, and drill rigs were evaluated. Given the close availability and relatively lack of power in the area diesel powered equipment were chosen as the most cost effective for the project. Due to the changing production requirements of the mine over the period varying numbers of key production equipment will be required. The annual requirements of the trucks, loaders/excavator and drill rigs for the project in order to meet the plant production requirements and be able to expose the same amount of ore material are summarised in Table 16.3. In addition to the key equipment auxiliary equipment such as tracked dozers for pit cleaning, rubber tyred dozers for stockpile management graders for haul roads etc will be required.
| 16.6.1 | Drilling Requirement |
The initial drill requirements would consist of two diesel-powered hydraulic percussion track drill rigs capable of drilling 110mm diameter blast holes. A 2.5m x 3.0m pattern has been selected for fresh rock ore material and a 3.70m x 4.00m pattern for fresh waste material.
| 16.6.2 | Blasting |
Overall explosive consumption was based on using a 70% ANFO and 30% emulsion mix product. Some blasting parameters may be seen in Table 16.6. Where possible drill hole liners will be used in wet holes to maximise the use of ANFO however in the study it has been assumed that mixture of ANFO/Emulsion will be the predominate explosive material. The selected explosive supplier is to erect a plant and storage facility on site. All Blasting operations will be carried out under the supervision of the mine blasting foreman, the supplier will be contracted to supply, deliver, and load explosives into the blast holes. The estimate explosive powder factor (PF) in waste has been estimated at 0.75kg/bcm (0.3kg/t) in waste material and 1.2kg/bcm (0.4kg/t) in ore material.
| 16.7 | Mine Personnel Requirements |
In view of the mining philosophy adopted by the mine of owner mining a full schedule of personnel required to maintain the pits producing at the required rate to feed the plant will include earthmoving operative and support technical support. The mine personnel requirement will cater for the operation and repair of the mining equipment, supervision, grade control and technical services. Summarised in Appendix 16.6 is the full schedule of mine staff required to support the operation of the Buckreef Gold Project.
| 16.8 | Concluding Remarks |
In view of the material change in the change in the Mineral Resource inventory of the Buckreef the overall design and scheduling of the Buckreef Prospect will to take into account the increase in Mineral Resource
| | Page 134 |
| | NI43-101 ITR - Updated Mineral Resource Estimate for Buckreef Gold Project |
through the proposed new optimisation and design and the underground mining of the deep sitting resources of the resources.
Virimai envisages that the overall mining philosophy would remain the same for the smaller deposits of Bingwa, Tembo and Eastern Porphyry which would consist of a number of conventional open pit layouts with access to the orebodies provided via a series of ramps into the pits. However, for the Buckreef prospect the mining philosophy will start with open pit accessed by a series of ramps transitioning into underground mining accessed through a decline into the orebody leaving a crown pillar between the underground working and the pit. This work is the subject of the next level of study for the Buckreef Gold Project.
| | Page 135 |
| | NI43-101 ITR - Updated Mineral Resource Estimate for Buckreef Gold Project |
| 17. | RECOVERY METHODS |
| 17.1 | Introduction |
In April 2020 TRX started mining the oxide ores and processing them through a small pilot oxide gravity CIL plant installed at the Buckreef Prospect. The small plant is to confirm the proposed flow-sheet that includes either Gravity Separation with Gravity Tailing Cyanidation outlined in the Prefeasibility Study of 2018. TRX has commissioned SGS Canada Inc, to carry out metallurgical testing of several large fresh rock samples at its Lakefield, Ontario, Canada facilities. These samples were collected from holes recently drilled in the area of the Pre-Feasibility Study open pit to collect critical flow sheet and design information for a large plant that will process the primary ores of the Buckreef. This large plant will be the basis for the Company’s Final Feasibility 43-101 Report that is still to be commissioned.
The design of the processing facilities described in the “Amended NI43-101 Independent Technical Mining Reserves Estimate and Feasibility Study on the Buckreef Gold Mine Project Tanzania East Africa” is reproduced in this section of this update. The test work conducted on the ores of the Buckreef indicated that both the oxide (and transition) ore and the sulphide ore are amenable to conventional gold recovery techniques, namely, crushing, milling, gravity concentration and cyanidation. The proposed process is outlined in this section, starting with the overall design criteria, and finishing with the process description.
| 17.2 | Description of the ore |
| 17.2.1 | Ore types |
The ore body consists of oxide material that overlies sulphide material, with a transition zone in between these two ore types. The oxide ore is weathered, has a clay consistency, and can be classified as a ’saprolite’. Ore from the transition zone will, for the purposes of this design section, be included with oxide ore. The depth of the oxidised layer varies between about 18 and 33 m. The sulphide ore is hard-rock, composed predominantly of quartzite.
The deportment of gold in both the oxide and sulphide ore types is ‘free-milling’, in the sense that it is amenable to gravity concentration and cyanidation with high recoveries.
| 17.2.2 | Head grade |
The design head grade for the ore is given in Table 17.1.
Table 17.1 Design head grade for oxide and sulphide ores
| Gold analysis, | |
| Sample | g/t |
| Oxide ore | 3.25 |
| Sulphide ore | 3.16 |
(Source: MMSA Report No 15/059 r1)
| 17.3 | Processing strategy |
The mining plan calls for the stripping of overburden, and the mining of the oxidised ore. Feed to the plant and hence production of gold will be ramped up over a period of time. To enable this, the plant will be built in modules, each with a capacity of 60t/h. In the first two years, feed material will be fed to one module,
| | Page 136 |
| | NI43-101 ITR - Updated Mineral Resource Estimate for Buckreef Gold Project |
consisting of crushing, milling, carbon-in-leach, elution, doré production and tailings detoxification. Each module has been designed to accommodate both oxide and sulphide materials.
In the third year, the fed rate will increase to 120t/h, and the type of material will change to predominantly sulphide. A second processing module will be added to accommodate this increased production rate. This second processing module will be a replica of the first, that is, it will consist of crushing, milling, carbon-in- leach, elution, dore production and tailings detoxification.
In the fourth year, a third module will be added, raising the capacity of the processing facilities to180 t/hr. As with the second module, this will be a replica, consisting of an entire production train.
| 17.4 | Overall Design Criteria |
The overall process criteria are given in Table 17.2. The process is design to treat 60t/hr of oxide ore in years 1 to 2 of the mining and beneficiation plant development. In total, the processing of the oxide will take a year and quarter. In year 3, a second module will increase the production to 120t/hr, treating sulphide ore. The front end will be modified in this phase to accommodate the sulphide ore. A third module will be installed in year 5 to increase production to 180t/hr. The process is designed to produce 78000 oz of gold per annum, bearing in mind that the lower throughput in the first four years.
Table 17.2 Overall design criteria
| Criteria | Units | Year 1-2 | Years 3 | Years 4 on |
| Dry feed rate (design) | t/h | 60 | 120 | 180 |
| Feed rate (nominal) | tpa | 483 552 | 967 104 | 1 450 656 |
| Overall availability | % | 97 | 97 | 97 |
| Recovery | % | 86 | 94 | 94 |
| Gold Production | oz pa | 27 700 | 51 621 | 80 678 |
| 17.5 | Mass balance |
A mass balance has been prepared, and the mass flows expected through each price of equipment in the process are presented with the equipment list in Appendix 13.1.
| 17.6 | Process Description and Design Criteria |
The process consists of scrubbing, crushing, milling, gravity concentration, carbon-in-leach, elution and regeneration, and electrowinning and smelting. A model of the gold processing is shown in Figure 17.1, and a block flow diagram of the process is shown in Figure 17.2.
Each of the process sections will be described in further detail. The individual process flow diagrams are given in Appendix 13.1 and the list of mechanical items is given in Appendix 13.2.
| | Page 137 |
| | NI43-101 ITR - Updated Mineral Resource Estimate for Buckreef Gold Project |
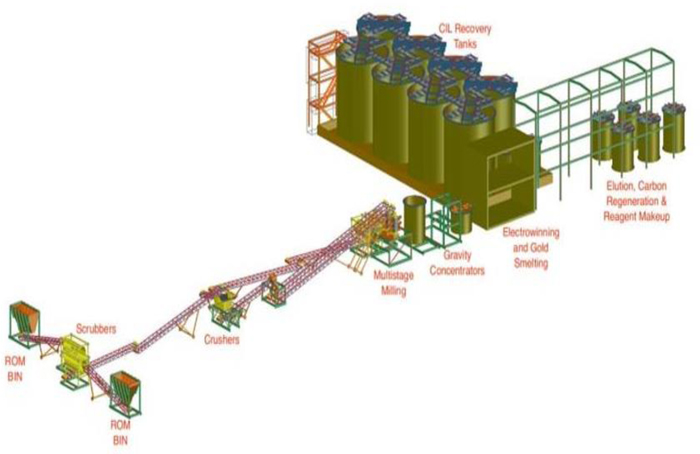
Figure 17.1. Model of the gold processing plant.
| | Page 138 |
| | NI43-101 ITR - Updated Mineral Resource Estimate for Buckreef Gold Project |
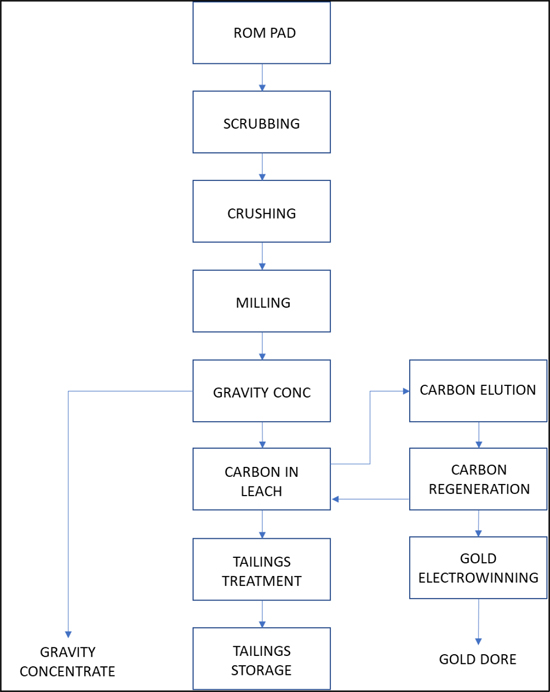
Figure 17.2. Block flow diagram of the process.
| 17.6.1 | Ore receipt and scrubbing |
The ore is stockpiled on a run-of-mine (ROM) pad and then fed to the ROM bin. The ore is conveyed from the ROM bin to a Rotaspiral. An electromagnet is used to remove tramp iron from the conveyor belt.
The oxide material is screened at 1 mm and scrubbed with water in the Rotaspiral. The minus 1 mm fraction and the water used in scrubbing drains to the underflow sump, from where it is pumped to the milling section. Water addition is controlled so that the specific gravity of the underflow is 1.3. The plus 1 mm fraction, which is now scrubbed of clay-type material, is discharged onto a conveyor and transported to the crushing section.
The design criteria for the Rotaspiral scrubbing unit are given in Table 17.3.
| | Page 139 |
| | NI43-101 ITR - Updated Mineral Resource Estimate for Buckreef Gold Project |
Table 17.3 Design criteria for the scrubber/screen.
| Criteria | Units | Value |
| Dry feed rate per unit | t/h | 30 |
| Screen size | µm | 1000 |
| Oversize | - | 40% |
| 17.6.2 | Crushing and milling |
The material is conveyed to the jaw crushers. The discharge from the crushers is collected in a crusher bin, from where it is conveyed to the milling plant. Tramp iron is removed from the conveyor using an electromagnet.
The design criteria for the crusher are given in Table 17.4. The close-side setting of the crusher is 40 mm in order to create a feed of the optimal size to the EDS mill.
Table 17.4 Design criteria for the jaw crusher.
| Criteria | Units | Value |
| Plant availability | % | 65% |
| Effective operating hours | hr/y | 5694 |
| Effective operating hours | hr/d | 16 |
| Dry solids feed rate per unit | t/hr | 92 |
| Feed top size | Mm | 200 |
The crushed ore is combined with the oversize material from the mill on the feed conveyor to the mill. The feed from the conveyor is split in a two-way splitter chute, which discharge directly into the EDS multi-shaft mills. Each of the mills discharges directly into the feed chute of a Rotaspiral. The Rotaspirals are fitted with a sizing screen of 100 µm (90 x 400 µm). The oversize from the Rotaspiral is discharged onto a conveyor that feeds it back onto the mill feed conveyor as a recirculating load. Thus, the mill product will be 100% passing 100 microns.
The undersize forms the product from the milling sections and is pumped at a specific gravity of about 1.4 to the gravity concentrators.
The design criteria for the EDS mill are given in Table 17.5.
Table 17.5 Design criteria for the EDS mill and classification circuit.
| Criteria | Units | Value | |
| Oxide ore | Sulphide ore | ||
| Bond work index | kWh/t | 22 | 12 |
| Classification screen | microns | 100 | 100 |
| | Page 140 |
| | NI43-101 ITR - Updated Mineral Resource Estimate for Buckreef Gold Project |
For the treatment of the oxide ore, about 50% of ore will report to the undersize in the scrubber and will not be fed to the crushing and milling section. Consequently, the production through the mill will only be 50% of capacity.
The design of the mill anticipates that 20% of the material fed to the mill will be oversize on a single pass. Thus, the re-circulating load to the mill will be 120%.
| 17.6.3 | Gravity concentration |
The underflow from the Rotaspirals is pumped to the gravity feed tank. Two Knelson concentrators are configured in series. Concentrate from the two gravity concentrators collected in a sump, and then fed to a Deister concentrating table. The concentrate is collected and bagged.
The tailings from the gravity circuit are pumped to the thickening plant.
The design criteria for the gravity concentrators are given in Table 17.6.
Table 17.6 Design criteria for gravity concentrators.
| Criteria | Units | Value |
| Configuration | No | 2 units in series |
| Mass recovery – Unit 1 | % | 2.8% |
| Mass recovery – Unit 2 | % | 1.4% |
| Gold recovery – Unit 1 | % | 34.6% |
| Gold recovery – Unit 2 | % | 8.7% |
The design criteria for the shaking table are given in Table 17.7.
Table 17.7 Design criteria for the shaking table.
| Criteria | Units | Value |
| Type | Deister No 6 | |
| Gold recovery | 75% | |
| Gold grade | g/t | 300 |
| 17.6.4 | Thickening plant |
The tailings from the gravity concentration plant are pumped to a dewatering cyclone. The cyclone underflow is fed to a pre-leach thickener, where the slurry stream is thickened.
The overflow from the cyclone and the thickener are pumped to the settling pond. The underflow from the thickener is pumped to the leaching (carbon-in-leach plant).
The design criteria for the dewatering cyclone are given in Table 17.8.
| | Page 141 |
| | NI43-101 ITR - Updated Mineral Resource Estimate for Buckreef Gold Project |
Table 17.8 Design criteria for the dewatering cyclone.
| Criteria | Units | Value |
| Underflow percentage solids | % | 43% |
The design criteria for the thickener are given in Table 17.9.
Table 17.9 Design criteria for the thickener.
| Criteria | Units | Value |
| Underflow density | kg/m3 | 1480 |
| Underflow percent solids | w/w | 50% |
| 17.6.5 | Carbon-in-leach plant |
The thickened slurry is pumped to a pre-conditioning tank, where the pH is adjusted to a value greater than 10 by the addition of lime. The slurry flows by gravity from the pre-conditioning tank into the first of the carbon- in-leach (CIL) tanks.
The preconditioned slurry flows by gravity into the first of the 6 CIL tanks. The residence time of the slurry in each tank is 4 h. A solution of NaCN is pumped into the first tank. The slurry flows by gravity through from the first tank to the sixth tank. A screen with an aperture of 630 µm on each tank allows the slurry to pass while withholding the carbon.
Carbon is pumped from the regeneration circuit to the regenerated-carbon screen (sieve-bend), and into the sixth CIL tank. Each tank has a Kemix pump cell agitator for the transfer of carbon counter-current to the flow of slurry. Loaded carbon from the first CIL tank is pumped to the carbon acid wash area.
The design criteria for the carbon-in-leach section are given in Table 17.10.
Table 17.10 Design criteria for the carbon-in-leach section.
| Criteria | Units | Value |
| Slurry feed rate | m3/h | 81 |
| Pre-oxidation residence time | h | 3.5 |
| CIL residence time | h | 21 |
| Leach efficiency | 91% | |
| NaCN consumption | kg/t | 1.4 |
| CaO consumption | kg/t | 4.0 |
| Carbon loading | g/t | 800 |
| Carbon residence time per stage | h | 24 |
| Carbon flowrate | t/h | 0.17 |
| Carbon concentration | g/L (slurry) | 14.42 |
| Carbon pumping | 16.7% | |
| Soluble gold recovery | 90% |
| | Page 142 |
| | NI43-101 ITR - Updated Mineral Resource Estimate for Buckreef Gold Project |
| 17.6.6 | Carbon Acid wash and Elution |
Loaded carbon from the CIL circuit is pumped to the loaded carbon screen, where the ore solids are screened from the ore solids. The underflow from the screen is pumped back to the first tank of the CIL. The carbon from the loaded carbon screen is collected in the loaded carbon tank, slurried with water and pumped the acid wash column. The carbon is collected in the column, and the water is drained from the carbon.
A solution of dilute hydrochloric acid is pumped from the acid wash tank into the acid wash column and drained to the acid wash tank. The purpose of the acid wash is to remove impurities like Ca from the carbon. The carbon is then washed in water and transferred to the elution column.
The carbon is loaded into the elution column. The method of elution is of the Zadra type. Gold is eluted from the carbon using a dilute caustic soda/sodium cyanide eluent solution at an elevated temperature and pressure. The eluent is pumped through a series of heat exchangers to elevate the temperature to 135°C using a combination of the exiting eluent and boiler steam.
The eluent from the elution column is pumped from the elution column through a heat exchanger, which cools the solution to 35°C, to the electrowinning cells. Spent electrolyte from the electrowinning cells is returned to the eluent tank. Recycling continues until the gold in solution is depleted to a sufficiently low level.
The design criteria for tails screening is given in Table 17.11.
Table 17.11 Design criteria for the tails screening.
| Criteria | Units | Value |
| Screen aperture | µm | 500 |
The design criterion for carbon elution is given in Table 17.12.
Table 17.12 Design criteria for carbon elution.
| Criteria | Units | Value |
| Elution frequency per day | No | 1 |
| Carbon mass per elution | t | 4.08 |
| Eluant volume | BV | 4 |
| Eluted carbon grade | g/t | 50 |
| NaOH concentration | % | 2.5% |
| NaCN concentration | % | 3.0% |
| 17.6.7 | Carbon regeneration |
Carbon from the elution column is transferred to a dewatering screw, and then thermally regenerated at 700°C. Regenerated carbon is discharged into a quench tank, where it is mixed with process water, and pumped to the elution circuit.
| | Page 143 |
| | NI43-101 ITR - Updated Mineral Resource Estimate for Buckreef Gold Project |
| 17.7 | Tailings treatment |
The slurry from CIL is pumped to the tailings treatment plant, where it passes over a screen for the collection of carbon that might pass through the final tank screen. Any carbon collected on this screen is transferred to the elution section. The underflow from the screen is pumped to the cyanide detoxification section.
The cyanide detoxification section consists of a single tank into which the slurry is pumped. A solution containing ferrous sulphate is added to complex the free cyanide and a dilute solution of HCl is added to lower the pH. The slurry is pumped from this tank to the existing tailings dams.
The design criteria for the tailings detoxification are given in Table 17.13.
Table 17.13 Design criteria for tailings detoxification.
| Criteria | Units | Value |
| FeSO4 consumption | kg/kg NaCN | 1.6 |
| HCl consumptions | m3/h | 0.1 |
| i. | Reagents |
The reagents to the process are NaCN, NaOH, CaO, FeSO4, and HCl.
The cyanide required in operation is made up by mixing solid NaCN supplied in bulk reagent in a make-up tank with process water. The cyanide solution is pumped into a holding tank and then pumped into with a ring main to the CIL and carbon elution areas.
Caustic soda is made up by mixing solid NaOH bulk supplied in reagent bags in with process water. This solution of caustic soda is pumped to the elution area.
Lime is required for neutralisation. It is made up by mixing CaO supplied in bulk reagent bags with process water. The resulting lime slurry is pumped into a holding tank and pumped from there to a ring main that supplies the CIL area.
Ferrous sulphate used for cyanide detoxification. A solution of ferrous sulphate is made up by mixing solid ferrous sulphate supplied bulk reagent bags with process water. The ferrous sulphate solution is pumped into a ring main to tailings treatment area.
Concentrated hydrochloric acid, supplied in from the isotainer, is pumped into a tank where it is diluted with process water. The dilute acid is pumped in a ring main that supplies the elution and tailings treatment areas.
| 17.8 | Utilities |
Water is used as potable water, process water, cooling water and carbon transfer water in the elution section. Separate supply systems are provided for each of these uses.
| | Page 144 |
| | NI43-101 ITR - Updated Mineral Resource Estimate for Buckreef Gold Project |
| 17.9 | Equipment |
| 17.9.1 | General equipment selection |
The equipment and its design capacity is listed in Appendix13. 2. This equipment list has bene costed to construct a capital cost estimate.
| 17.9.2 | EDS Mill |
The process has been designed using tried and tested equipment, except for the EDS multishift mill.
Attention should be drawn to the selection of the EDS multishaft mill. This mill is of a vertical mill consisting of several horizontal shafts at various levels. The shafts drive internal fingers or flingers that accelerate the particles. The particles break due to impact with the rotating flingers, with the wall, or with the mill liners attached to the body.
The mill is shown in Figure 17. 3, and a view of the internal rotating flingers is shown in Figure 17.4. The mill has been tested both industrially and academically. The mill offers positive benefits in terms of plant footprint, high reduction ratio, and high throughput. Powell et al. (2016) concluded that their “study proved the mills’ ability to continuously sustain operation and product size for two different ore types under various configurations”.
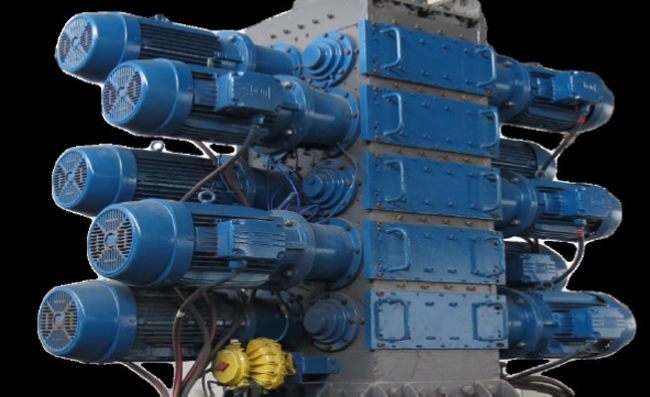
Figure 17.3. The EDS multishift mill (Source: Jeff Wain, EDS).
| | Page 145 |
| | NI43-101 ITR - Updated Mineral Resource Estimate for Buckreef Gold Project |
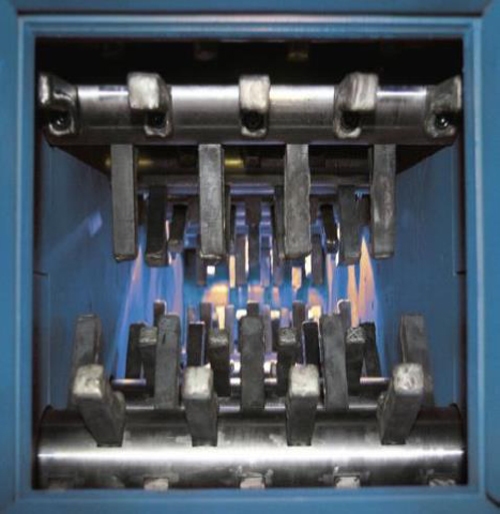
Figure 17.4. A view of the internals of the EDS multishift mill seen from the feed chute. (Source: Jeff Wain, EDS).
The industrial applications of the EDS mill are listed in Table 17.14.
Table 17.14 Industrial applications of the EDS mill.
| Criteria | Units | Value | ||||
| Operation Site | Kalgold | WCM Mooi Nooi | De Hoek | Rayton | Marble hall | |
| Owner | Harmony | Samancor | PPC | Randquip | Afrimat | |
| Material | Gold ore | Chrome ore | Limestone | Kimberlite | Limestone | |
| Start date | ~Apr 2013 | ~Nov 2014 | ~Dec 2014 | ~Jan 2017 | ~Sept 2016 | |
| Date ended | ~Oct 2013 | ~Apr 2015 | ~June 2015 | ~July 2017 | ~Nov 2016 | |
| Feed rate | t/h | 20 – 100 | 65 | 80 | 80 | 120 |
| Feed size F80 | Mm | 26 | 18 | 28 | 15 | 12 |
| Product size P80 | Mm | 1-5 | 2-3 | 2-3.5 | 1 | 2-3 |
| Power consumption | kWh/t | 5 | 1.5 to 2 | 3-4 | <2 | <2 |
| Availability | Unknown | 85% | 91 | 88% | 6 | |
| Maintenance cost | R/t | Unknown | 45 | 20 | 20 | |
| | Page 146 |
| | NI43-101 ITR - Updated Mineral Resource Estimate for Buckreef Gold Project |
| 17.10 | Power consumption |
The installed power is calculated from the installed equipment. The installed power for the oxide circuit is 1215 kW, and for the sulphide ore is 1428 kW.
| 17.11 | Summary and Conclusions |
A feasibility level design (class 3, -15%/+20%) has been prepared for the Buckreef project. The status of the following items for this design is summarised in Table 17.15.
Table 17.15 Status of Buckreef design.
| Item | Requirement for Class III estimate | Current Status |
| Plant capacity | Fixed | defined |
| Process selection | optimised | defined |
| Test work | Finalised | Defined – items that may be considered are listed in Chapter 13. |
| Design basis | Final | defined |
| Process flowsheets | Detailed | completed |
| Process design criteria | Detailed | completed |
| Mass balances | optimised | completed |
| Process equipment | completed list/sizied | completed |
| Specifications | Major equipment only | completed |
| Layout | optimised | completed |
| GA drawings | Full outlines | completed |
| 17.1 | Concluding Remarks |
The current metallurgical testing being carried out by SGS Canada Inc will help incoming up with low cost gold processing flow sheets alternatives for the Buckreef Gold Project. The flow sheets alternatives will form the basis of the design and selection of the large processing plant for the project. This large processing plant will be then form the basis for the Company’s Final Feasibility 43-101 Report. Furthermore new approaches will need to be adopted with respect to the mill throughput and equipment selection and sizes in light of the increased resource level.
| | Page 147 |
| | NI43-101 ITR - Updated Mineral Resource Estimate for Buckreef Gold Project |
| 18. | PROJECT INFRASTRUCTURE |
| 18.1 | Introduction |
Buckreef being the largest pit, it will be most cost effective to setup the processing facility near the Buckreef pit. All satellite pits many times smaller than the main pit will result in long haulage of ore makes more economic sense if the processing infrastructure is setup at the Buckreef pit area. Presently, some of the basic infrastructure is present as left over from previous mining activities and from exploration camps. Most importantly also, there is a natural depression that can be modified and become suitable location for storing fresh water. There is an existing airstrip, but this will have to be relocated as it is situated at the edge of the current Buckreef main pit designed..
| 18.2 | Site Layout |
Mine infrastructure at the mine will be required for smooth operation of the mine and the plant. Figure 18-1 shows overall site layout depicting major infrastructure.
Main additional infrastructures required for the project include the following: -
| a. | Primary AccessPrimary access to the site is via the Katoro Rwamagaza road which passes through the mine lease area. The road is a gravel road with a number of small bridges. This link road will need to be diverted away from the mining area. |
| b. | Power Supply:The project is serviced by Tanesco the national power distribution company of Tanzania. The substation is currently being upgraded to provide power to the small oxide plant and back-up generators are being acquired to provide uninterrupted power for the plant. |
| c. | Tailings Storage Facility (TSF)– The construction of the initial tailing storage facility to handle tailings from the small plant treating oxides from the Buckreef plant has been completed in compliance to the environmental standards of the country. |
| d. | Fresh water dam– old water storage dam from previous mining has been rehabilitated for process water supply makeup water is supplied from the old underground mine through a submersible pump and line to the plant. Portable water for the mine complex is supplied from three boreholes sunk within the mine lease area. |
| e. | Haulage Roads- Provisional siting shown in figure 18-1 illustrate haulage routes from the two distant satellite pits of Bingwa and Tembo which are respectively 5.6km and 4.2km in length. The haulage roads will follow existing local roads and will be upgraded to suit for frequent heavy trucks passage. Shorter haulage roads will be connecting Buckreef main pit and the near stockpile, waste and plant. |
| f. | Waste Rock Dumps– Each mining pit site will have its own waste rock dump except that Buckreef and Eastern Porphyry will have a common waste rock dumping site. |
| | Page 148 |
| | NI43-101 ITR - Updated Mineral Resource Estimate for Buckreef Gold Project |
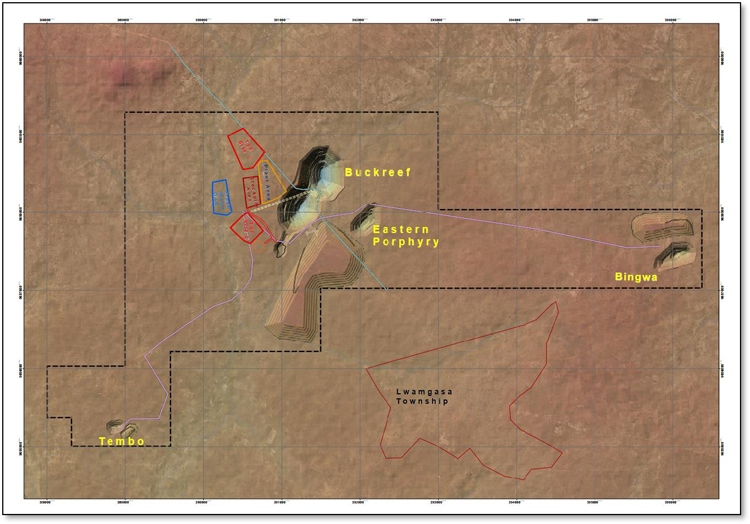
Figure 18.1: Buckreef Project Infrastructure Layout (Emisha 2016; MaSS 2017)
| | Page 149 |
| | NI43-101 ITR - Updated Mineral Resource Estimate for Buckreef Gold Project |
| 19. | MARKET STUDIES AND CONTRACTS |
| 19.1 | Market Studies |
Neither Virimai Projects nor TRX has conducted a market study in relation to the gold market which will be produced by Buckreef Gold Project. Gold is a freely traded commodity on the world market for which there is a ready and steady demand from buyers worldwide.
| 19.2 | Contracts |
There are no refining agreements or sales contracts currently in place that are relevant to this update Technical Report.
| | Page 150 |
| | NI43-101 ITR - Updated Mineral Resource Estimate for Buckreef Gold Project |
| 20. | ENVIRONMENTAL AND SOCIAL IMPACT STUDIES PERMITTING AND SOCIAL AND COMMUNITY IMPACT |
| 20.1 | General Approach |
TRX is committed to excellence in the management of health, safety environment and sustainability in the conduct of its operations. The company’s objectives are as follows:
| ● | Ensure the health and safety of its employees, contractors and visitors in the workplace. |
| ● | Responsible management of the impact that its mineral exploration and development operation may have on the environment and the community. |
| ● | Demonstrate its commitment to having sustainable development in the communities in which it is operating. |
| 20.2 | Environmental Studies |
Several environmental and environmental management plan studies have been performed on the project area. The environmental Scoping Studies for the project was conducted by URS from Australia in collaboration with MTL Consulting a local company. A Social Impact Assessment (SIA) was undertaken by Social Sustainability Services Ltd of Australia and the University of Dar es Salaam in 2006.
The environmental and socio-economic baseline for the project is documented in the Environmental and Social Impact Assessment (ESIA) performed by Enata Ltd 2014. This document was submitted to the NATIONAL ENVIRONMENT MANAGEMENT COUNCIL (NEMC). This report was approved by NEMC and an EIA certificate was awarded on 19th May 2014. The Enata Ltd ESIA was subsequently updated by Sphere Envirotech & Engineering Ltd, to reflect changes which were implemented from 19th May 2014 after the issuance of the Environmental Impact Assessment Certificate in compliance with Section 92 (1) of the Environmental Management Act No.20 of 2004 and the proposed future changes following mining operations changes.
The approved ESIA for the Buckreef Project covers areas which encompass the Buckreef Main, South and North, Eastern Porphyry, Tembo and Bingwa deposits.
| 20.3 | Community and Government Communications |
Tanzam200 is an active member of the local community in Geita and Mwanza area and is in constant contact with the local and government leadership about developments on the Buckreef. The local leadership and the government leadership have been engaged in the planning activities for the project. This has been done through meetings with members of the local communities and ministry of mines
| | Page 151 |
| | NI43-101 ITR - Updated Mineral Resource Estimate for Buckreef Gold Project |
| 20.4 | Overview |
The Buckreef Project is primarily an undeveloped exploration project, although the project area includes the defunct Buckreef Mine area that was exploited by STAMICO until the mine closed in 1994. The historic mine site will ultimately form part of the future operation developed within the Buckreef Prospect. A couple of years of environmental baseline investigation have been completed on the project in support of the Buckreef Gold Project.
A summary of existing environment is provided herein and the intent of this summary is to give the reader a familiarization local setting of the area where the gold project is located. Further details of the baseline reports herein referred to are given in the referenced Environmental Assessment Reports.
| i. | Climate, Air Quality and Sound |
The Buckreef Project is in the northwest region of Tanzania. The area has a moderately warm tropical climate with minimal variation through the year. Daily temperatures vary between 22oC and 30oC with a mean annual daily temperature of 25oC.
The region gets an average of 900 mm – 1200 mm of rainfall per annum. There are two distinct rainy seasons; the long rains or Masika from March to May and the short rains or Vuli from late September to December. The rainy seasons are characterized by short storm events, which lead to highly localized variations in rainfall. Storm events are often interspersed with relatively long dry spells. Between the two rainy seasons, is a long dry spell, occurring from June to August, which makes the area drought prone? During hot and rain season the humidity ranges between 35% and 60% respectively.
Evaporation remains relatively high throughout the year although daily evaporation rates decrease during the rainy seasons because of increased cloud cover. Average daily evaporation throughout the year varies between 4.5 and 7.2 mm/day (1,642.5 mm/yr.).
| ii. | Physiography, Soils and Geology |
The project area topography consists of gently rolling hills at an elevation of 1200 to 1250 above sea level (amsl), with flat alluvium deposits and black cotton soil filled valleys. The average elevation difference is 50m on profiles north-south and east-west over 5km. This equates to an average elevation slope of 0.01m per km or 1%.
Most of the soils in the area are iron-rich due to the widespread presence of “cuirasse” or hard laterite on the property. In river valleys and drainages saturated, clay-rich soils known as Mbuga can be found but account for only a small proportion of all soils present.
In general, soils in the project area which have not been exposed to artisanal mining activities show no pollution in the form of mercury, cyanide, or heavy metals while soils located where artisanal mining has been conducted are often found to possess contaminant levels higher than established guidelines.
| | Page 152 |
| | NI43-101 ITR - Updated Mineral Resource Estimate for Buckreef Gold Project |
A study was conducted on the stream water and sediment quality as well as on the groundwater quality in 2009 (Sphere, 2016). In terms of geochemistry the stream water and sediment quality concluded that:
| ● | Arsenic and Cr were above probable effects levels in stream sediments, |
| ● | Sediment quality showed no enrichment in metals; |
| ● | Mercury in sediment samples were below guideline values; and |
| ● | Natural elevation of F, NO3, Al, Cr, Cu and Pb were above Canadian guidelines for aquatic life. |
| iii. | Surface Water and Sediment |
Surface water is scarce in the Project area but wetlands are developed in drainage channels. The main surface water flow in the project area is a dammed Nyamazovu River, a small stream to the west of the BRMA, which was used historically as a fresh water supply for the Buckreef process plant. Another important drainage channel is that of the Nyamazama stream, which forms a confluence with the Nyikonga approximately 12km to the southeast of Buckreef mine. Due to the low topographic relief of the area the river is extremely shallow, typically no more than 1-2 m in depth, but may reach a width of 50 m during the height of flow each year.
Considering the proximity of the rivers course within the Project area, Plans including the treating and recycling water from storm water storage have been considered. This is to save the wastage of water and ensure the surface run-off are directed and kept away from the operation consequently reducing chances of the interference to the mining activities as well as the stability of the Pit walls. A storm water management plan will be implemented for the Mine Project area to ensure that water resources are protected from pollution and that run- off is managed in accordance with the applicable environmental legal requirements. Storm water will be a valuable water resource and can be effectively used to decrease water use from water sources and thus potentially decrease costs.
| 20.5 | Groundwater Quality |
Tests from the drill-holes show that ground water level depth is shallow at an average of 6.34meters below ground level (6.34mbgl). This suggests that only shallow structures and perhaps the unconfined aquifers were intersected. Nevertheless, assessment will focus on understanding the impact of excavating the open pit and abstracting groundwater on the hydro geological regime. The three pits (Buckreef, Bingwa and Eastern Porphyry) and the ROM Pad may be affected by the ground water from the two main rivers (Nyamazama and Nyamazovu). It is therefore important to make a frequent follow up on the soil behaviour and its contribution to the charge of the ground water.
| 20.6 | Biological Environment |
| 20.6.1 | Vegetation |
There are several vegetation zones in the project area. Their presence is strongly related to proximity to water and human activities. Barren land, shrub-steppe, grassland, and forest zones all occur naturally and generally correspond to the increasing presence of water.
| | Page 153 |
| | NI43-101 ITR - Updated Mineral Resource Estimate for Buckreef Gold Project |
The project area is still covered with categories of natural vegetation types with diversity of life forms including trees, shrubs, herbs, climbers, grasses, sedges and reeds. The most common vegetation in the project area is Acacia polyacantha woodland and Miombo woodland. Human activities in the form of agriculture, pastoralism, artisanal mining, and settlements areas to generate firewood have had a distinct impact on the vegetation in the project area.
Pastoralism is practiced widely with cattle, sheep, and goats foraging in the woods and plain areas as they are able, however, the quality of feed is poor. The potential for damage to an already fragile ecosystem from overgrazing is high.
| 20.6.2 | Wildlife |
The area like most of the savannah areas is a very good habitat for several species of animals and birds. DikDik (Madoquaswaynei), lesser kudu (Strepsicerosimberbis) and greater kudu (Strepsicerosstrepsiceros) can all be found in the project area. It also includes the reedbuck, bushbuck, orb, hyena, serval cat, jackal, Nile crocodiles, short snouted crocodiles, baboons etc. Bird species include the shoebill (Balaenicepsrex). Other species are wattled crane (Bugeranuscarunculatus), ducks, geese, guinea fowls, bastards, plovers, vultures, Spur winged goose (Plectroptermsgumbensis).
| 20.6.3 | Human Environment |
The Buckreef Project lies entirely within the Geita District in Geita region. The area is by large undeveloped tracts of land, poor infrastructure, and a largely rural population. There are three villages immediate to project area. The villages are Mnekezi located at the northwest and Kaseme at the west end of the project. Rwamagaza village which is the center for artisanal miners is located around five kilometres southeast of Buckreef mine.
The political environment in the country is stable with a growing influence of opposition parties in a country traditionally run on single party basis for decades. The parliamentary and presidential elections were held in October 2015. Generally, the elections were peacefully and successfully held in the country.
Currently there is no incident reported regarding the trespassing or intruding into the mine area.
The mine drilled a bore hole of water as one the community engagement project and the project has been handled over to the Mnekezi village authority.
The social license to operate will be greatly enhanced judging by the current response from different stakeholders that include villagers and their leaders, interfaith organizations, local and regional government and the government leaders at a national level.
| 20.6.4 | Population |
Most of the residents in the project area belong to the Sukuma tribe. Rwamagaza village has many ethnic groups than Mnekezi. Apart from Sukuma tribe other tribes available in Rwamagaza are Waha, Wasumbwa,
| | Page 154 |
| | NI43-101 ITR - Updated Mineral Resource Estimate for Buckreef Gold Project |
Wachaga, Wakurya, Wajaluo and Wazinza whereas in Mnekezi village Wasumbwa and Wazinza make minor population. The local language spoken in the project area is Sukuma.
In 2012, the total population of Mnekezi village was approximately 1820. The largest village is Rwamagaza with a population of 3,202. These are the immediately villages which will be impacted by the proposed Buckreef mine.
It is notable that among the residents of the project area, 75% are under the age of 35 and more than 50% have an age less than 20. There are slightly more women than men. This demographic is amplified in the dry season when lack of rain makes it impossible to farm and young men of working age engage themselves in artisanal gold mining activities.
| 20.6.5 | Health |
The most prevalent disease in the project area is malaria. Over 50% of all sickness treated in the region is malaria. HIV/AIDS is not only the threat to the health of the region’s population but also to the economic and social well-being of the people. Available statistics shows that the rate of HIV & AIDS infections in the region has been decreased from 8.2% to 4.5% in December 2011. The leading group due to infections is the youth group age aging between 15-24 years. Geita district had the highest number of reported AIDS cases accounting to 40.8% of all reported cases in the region. Nyang’hwale district had 872 cases equivalent to 4.1%.
Mnekezi has a dispensary staffed by four nurses and one doctor which serves residents of the project area. At Rwamagaza village there is a dispensary with one doctor and four nurses as well.
| 20.6.6 | Farming |
Agriculture is by far the most prevalent form of employment in the project area. More than 77% of the labour force is engaged in subsistence farming. Crops most commonly grown are maize, paddy, cassava, beans, groundnuts, sorghum and sweet potatoes while the major cash crops are cotton and tobacco. Where sufficient water is available, rice and vegetables are also grown (in mbuga soil); both for personal consumption and as cash crops. Issues affecting the successes of farming in the project area include poor soil, and lack of equipment.
| 20.6.7 | Livestock |
Livestock is the second most important economic activity in Geita Region. The climate of the region also favours growth of improved dairy breed particularly promotion of dairy cattle through cross breeding. The livestock kept in the region are cattle, goats, sheep, donkeys, pigs, chicken and ducks. Overgrazing is a common occurrence. Lack of pasture and veterinarians, and poor knowledge of sound livestock management practices all present challenges to cattle keepers.
| 20.6.8 | Commerce |
Trade and commerce are an important activity. Rwamagaza market is held twice in a week, Tuesday and Friday. There are small shops, a crop and second-hand clothes market in Rwamagaza-CCM. For the surrounding
| | Page 155 |
| | NI43-101 ITR - Updated Mineral Resource Estimate for Buckreef Gold Project |
villages, this is really a town with its several bars, eating places (migahawa) and guest houses. The centre is always full of people engaged in trading.
Katoro Township in the north is a big business centre providing manufactured goods as well as produce from local farmers.
| 20.6.9 | Gold Mining |
Gold mining is a popular and well-organized activity regionally. Artisanal mining is an important and growing source of income in the project area. Miners are of two types: residents and migrants. Residents are local people, mostly women and children, who work local deposits by hand during the dry season when agriculture is limited or not possible. Migrants may be individuals who drift through the area hoping to find a likely spot to work or more often, bands of workers, organized, and financed by gold buyers.
Artisanal mining practices have already been hampered by the proposed Project, and illegal miners on the project will have to be removed once the project is implemented. Several small-scale operations in the area operating under Primary Mining Licenses provide employment to the local populations, and TRX will offer employment to the local population.
| 20.7 | Seismicity |
Buckreef Gold Mine Project is located approximately 360 km north-east of the seismically active Lake Tanganyika Rift seismic zone. According to the Global Seismic Hazard Map produced by the Global Seismic Hazard Assessment Program (GSHAP, 2015), the site is in an area of low seismicity but borders an area of moderate seismicity about 67km in the Southwest.
The risk of catastrophic failure during a seismic event because of liquefaction of top soils and saprolite material is negligible as the natural water table lies well below the clay and saprolite zones. Nevertheless, potential instability because of seismic ground acceleration and loading on low shear strength defects cannot be ruled out. The seismic acceleration coefficient applicable to the site is between 0.04g and 0.08g for a return period of 475 years (10% chance of exceedance in 50 years). Further study at the final design stage is recommended to ensure the hazard from the nearby source zone of moderate seismicity to the east of the site does not warrant an increase in the peak accelerations quoted above.
A search of seismic events (from the USGS/NEIC 1973 – present database) indicated that there have been 16 earthquakes of magnitude 3 or above since 1973 within a 300-km radius of the site. The most significant event was a M5.3 event in December1983, the epicentre of which was 92 km from site. The most recent earthquake event in September 2016 in Bukoba, was a 5.9 magnitude in Richter scale and the epicentre was 40km deep. This area is about 240km northwest of the Buckreef Mine Area. It is considered that these peak accelerations experienced at Buckreef Gold Mine from this event would have been negligible.
| | Page 156 |
| | NI43-101 ITR - Updated Mineral Resource Estimate for Buckreef Gold Project |
| 20.8 | Environmental Sensitivities |
Based on information available there are no known Endangered Species within the Buckreef area. There are no wild life parks or protected land within the project footprint and as such no special permits will be required to proceed with the project. Further there no areas of natural scientific and archaeological interest to inhibit the development of the gold project.
| 20.9 | Regulatory Context |
Mining operations has been taking place at Buckreef since 1990 until the underground mine closed down in 1994. Mining although on a small scale is the major source of income for the local communities in the area. Currently the Buckreef project site is fully compliant with the existing environmental laws of Tanzania. A copy of the EIA issued to Buckreef Gold Project is annexed in Appendix 20.1.
| | Page 157 |
| | NI43-101 ITR - Updated Mineral Resource Estimate for Buckreef Gold Project |
| 21. | CAPITAL AND OPERATING COSTS ESTIMATES |
The capital estimates presented in this update report relate to the estimates presented in the prefeasibility study report of June 2018. No new capital and operating costs estimates could be developed for this ITR at this stage as new and processing flow designs for the Buckreef Prospect are still to be developed. The current prevailing economic factors have changed considerably from those presented in 2018 study. This will call for the revision of the costs in light of the material change in the mineral resources and the operating environment.
The capital and operating costs estimates developed for the update prefeasibility study are based on the development of an open pit mine and processing plant facility having a nominal processing capacity of 2880tpd ramped up to 4320tpd of ore feed at steady production in year 4. The estimates presented in this study relates to the open pit, processing plant and surface infrastructure developed by Virimai Projects with consultation with TRX. Capital and operating costs related to the gold processing plant have been developed by Emisha Solutions while costs for the TSF were developed by Epoch. Virimai Projects consultants consolidated the costs information from various sources to determine the project capital and operating costs.
| 21.1 | Capital Costs estimates |
The capital costs estimates (CAPEX) for the Buckreef Gold Project has been prepared in accordance with industry practise for prefeasibility studies to intended accuracy of -15% to 20%. This estimate includes direct costs estimates based on current pricing for the common items required for the project of this nature. To establish current market pricing, various contractors, freight forwarders vendor and service providers were consulted in the process of compiling the capital estimates for the project.
| 21.1.1 | Pricing |
The pricing of the capital costs build up for the supply of equipment are budgetary and not based upon binding quotations. These budgetary quotes where obtained from reputable vendors and contractors who provide unit rates or prices. The capital costs estimates are inclusive of all local tax components as applicable.
| 21.1.2 | Project Currency |
All capital costs are expressed in US Dollars with costs based on the June 2018 market conditions with no escalation from that date. Costs submitted in Tanzanian Shillings were converted into US Dollars at the prevailing exchange rate of TZS 2,250 =US$1.00 used in this study.
| 21.1.3 | Capital Costs Summary |
The projected capital cost estimates for the project are estimated to be US$76.336Million inclusive of a 15% contingency sum for the Buckreef Gold Project. Taxes and land acquisition permitting licensing are included. The project capital costs summary is outlined in table 21.1 with all the capital cost breakdown descriptions.
| | Page 158 |
| | NI43-101 ITR - Updated Mineral Resource Estimate for Buckreef Gold Project |
Table 21.1 Summary of the Capital Costs estimates
| Item | Capital Description | No | Unit Cost | Total Capex |
| 1 | Mining | |||
| 1.1 | Mining Equipment ( Fleet) | 1 | 17,531,424 | |
| 1.2 | Loader | 3 | 265,500 | 796,500 |
| 1.3 | Water Truck | 1 | 100,000 | 100,000 |
| 1.4 | Service Truck | 1 | 100,000 | 100,000 |
| 1.5 | Light Trucks & Cars | 8 | 41,500 | 332,000 |
| 1.6 | Dewatering Pump | 4 | 40,000 | 160,000 |
| 1.7 | Survey Tools | 1 | 45,000 | 45,000 |
| 1.8 | Pit Optimisation | 1 | 75,000 | 75,000 |
| 1.9 | Mining Offices/Shop | 1 | 300,000 | 300,000 |
| 1.1 | Haul Roads | 1 | 100,000 | 100,000 |
| 1.11 | HME - Workshop Construction | 1 | 700,000 | 700,000 |
| 1.12 | Explosive magazine | 1 | 150,000 | 150,000 |
| 1.13 | Fuel Tanks with a Capacity to hold 400klt | 1 | 240,000 | 240,000 |
| Subtotal Mining | 20,629,924 | |||
| 2 | Processing Plant | |||
| 2.1 | TSF Construction & Design | 1 | 1,750,000 | 1,750,000 |
| 2.2 | Portable Water Plant | 1 | 600,000 | 600,000 |
| 2.3 | Laboratory | 1 | 500,000 | 500,000 |
| 2.4 | Process Plant Development | 1 | 35,284,625 | 35,284,625 |
| 2.5 | Generators 4No x 2.5MVa | 1 | 1,100,000 | 1,100,000 |
| 2.6 | Substation and Power Reticulation | 1 | 500,000 | 500,000 |
| 2.7 | Engineering Workshop for Plant +tools | 1 | 400,000 | 400,000 |
| Subtotal Processing Plant | 40,134,625 | |||
| 3 | Human Resources & Community | |||
| 3.1 | Camping Facilities | 1 | 250,000 | 250,000 |
| 3.2 | Camp Houses (2Bx20+4Bx30) | 50 | 15,000 | 750,000 |
| 3.3 | Relocation of Mnekezi road | 1 | 250,000 | 250,000 |
| 3.4 | Airport/Aerodrome | 1 | 35,000 | 35,000 |
| 3.5 | Helicopter Pad | 1 | 10,000 | 10,000 |
| 3.6 | Compensation - Relocation from SML | 1 | 2,500,000 | 2,500,000 |
| 3.7 | Sewer Ponds & Facilities | 1 | 350,000 | 350,000 |
| 3.8 | Security fencing | 1 | 520,000 | 520,000 |
| Subtotal Human Resources & Community | 4,665,000 | |||
| 4 | HSE | |||
| 4.1 | Clinic | 1 | 100,000 | 100,000 |
| 4.2 | Waste Handling Facilities | 1 | 75,000 | 75,000 |
| Subtotal HSE | 175,000 | |||
| 5 | Finance + IT | |||
| 5.1 | Computer & Server | 1 | 40,000 | 40,000 |
| 5.2 | Desktop | 1 | 45,000 | 45,000 |
| 5.3 | Laptop | 1 | 30,000 | 30,000 |
| 5.4 | Networking & Communication | 1 | 40,000 | 40,000 |
| 5.5 | Process Plant Insurance - 6% Plant Cost | 1 | 600,000 | 600,000 |
| 5.6 | Mining Equipment Insurance - 2.5% Equip Cost | 1 | 19,913 | 19,913 |
| Subtotal Finance +IT | 774,913 | |||
| 6 | Contingency 15% | 15% | 9,956,919 | |
| 7 | Total Capex | 76,336,381 |
| 21.1.4 | Open Pit Mining Capital Cost Estimate |
Open pit mining equipment will be owned and operated by the mine to carry out all the mining operations and related activities at Buckreef. Virimai Projects has not carried out an option analysis on owner mining versus contractor mining as the client preferred owner mining to contract mining. The acquisition of the mobile mining equipment is phased in line with the ramp up in production of the Buckreef project. The total capital for mobile
| | Page 159 |
| | NI43-101 ITR - Updated Mineral Resource Estimate for Buckreef Gold Project |
equipment is estimated at US$20Million. The quotes for the supply of the earthmoving equipment are based on quotes from Bell Equipment a major equipment supplier in Tanzania.
| 21.1.5 | Process Plant Capital Costs |
The design of the processing plant and associated infrastructure was carried out by Emisha Metallurgical Consultants (Emisha). Using their experience and the general layout and drawings Emisha developed estimates capital costs in the sum of US$35.285million for the procurement and installation of the processing plant facilities as defined in the flow sheet diagrams in Appendix 13. Other plant related costs and equipment as itemised in table 21.1 have been included the costs to bring it to a sum total of US$39Million.
| 21.1.6 | Tailings Storage Facility |
Tailings Storage Facility is the other major component required to support the Buckreef Gold project. In coming up with the capital estimates for the facility the following philosophy was adopted in guiding the design of the tailings storage facility (TSF).
| ● | Economical Stage 1 development of the TSF |
| ● | Efficient use of area and use of local construction materials |
| ● | Maximum water recovery; and |
| ● | Minimum environmental impacts (location relative to streams, dams) |
The estimate design costs are included in the TSF Capital costs and the construction costs are estimated by DE Cooper Associates Geotechnical Engineers as a sum of US$1.75Million for stage 1. Stage 2 and subsequent TSF facilities have been assumed in this study to be financed from operating capital.
| 21.1.7 | Surface Infrastructure |
In support of the mining operation Buckreef will aim at housing its employees in camping facilities to be built on the project premises. Most of the project employees will be recruited from the nearby surrounding villages and town centres. The surface infrastructure required to support the Buckreef Project is fully outlined in section 18.3 of this report. The total estimate for these facilities is given in table 21.1.
| 21.1.8 | Primary Access Roads |
The capital costs estimates for the road works were based on the preliminary BOQ of the earthworks and storm water drainage systems required to divert the road which currently passes through the mine. The Geita District Council had put plans for the diversion of the gravel road away from the mine site. However, Buckreef have set aside funds to assist the council in expediting the construction work. Quotes received for the works put the total upgrading and diversion costs at US$250,000.00.
| 21.1.9 | On-Site Roads |
All site road construction within the mine will be constructed as part of the pit excavations and utilising hard waste material from the pits. A provision has been made for a sum of $100,000 to cater for some roads which are not related to the mining activities.
| 21.1.10 | Airstrip |
The cost of US$45k for the construction of a new gravel airstrip is based on the use of current mine equipment in clearing and compacting the runway.
| | Page 160 |
| | NI43-101 ITR - Updated Mineral Resource Estimate for Buckreef Gold Project |
| 21.1.11 | Office Buildings and Workshops |
The costs of building up the camp facilities, operations and maintenance buildings, plant and open pit buildings are based on the Tanzanian rebuilding costs of the defined structures. The estimate rebuilding costs for the steel structure with brick cladding under IBR roofing in Geita Town range from US$500/m2 to 750/m2 while that for camp and housing facilities range from US$250 to US$350/m2. Using these factors Virimai Projects was able to estimate the capital costs for putting up the proposed infrastructure at Buckreef as itemised in table 21.1.
| 21.1.12 | Laboratory |
In addition to the cost of putting up the building there will be the cost of equipping the laboratory with state of the art equipment for use in assaying samples from the plant and for grade control in the pits. The full estimate costs for the construction and equipping is a total of US$0.5Million.
| 21.1.13 | Fuel Storage facilities |
The cost of the fuel tanks is based on installation of above ground fuel storage tanks of 50,000lt capacity each at $30,000 each.
| 21.1.14 | Explosives Magazine |
The magazine construction is based on reinforced concrete structure under a reinforced concrete roof for storage of explosive material. In view of the amount of oxides ore material to be mined at Buckreef a view was taken that this capital cost will come late in the life of the project in year 2 or 3.
| 21.1.15 | Power Plant and Distribution |
The total requirement for the mine at peak production is estimated at 4.5MVA supplied from the national grid and backed up with a number of diesel generators. A total of 5No 1.6MVA generators will be purchased to back up power supply to the project TRX has been assured that enough grid power will be available for the mine requirements. The estimate costs for the power plant and the substation for the mine is summarised as sum of US$1.1Million. This cost is inclusive of power lines used to deliver power to various locations within Buckreef Gold Project area.
| 21.1.16 | Fresh Water Supply, Fire Suppression Water and Distribution |
Buckreef portable water supply will be met through additional boreholes drilled on mine site including an additional water purification unit for the mine complex. The total cost of the new system is US$300,000 with the total for the two units coming to $600k.
| 21.1.17 | Sewage Collection and Disposal |
In keeping with the environmental philosophy of the mine capital estimates for modern collection of all mine sewer through sewer line to the stabilisation ponds has been provided for. The treatment process facility consisting of stabilisation ponds catering for a mine population of say 500 people at a time have been estimated at US$350,000
| 21.1.18 | Site Security |
A high-level security fence will be constructed to enclose the main Buckreef operations which include the camp site, process facility and open pits and tailings storage facility. In view of the local invasion of mining areas by
| | Page 161 |
| | NI43-101 ITR - Updated Mineral Resource Estimate for Buckreef Gold Project |
small scale miners the need for security perimeter fencing around the pits becomes more critical. The total perimeter fencing for the Buckreef main is 16km and for Tembo and Bingwa pits the perimeter fencing is 2km each. The estimate cost of installation of 1.8m high diamond mesh security fence at US$26/m for the project is a sum of US$520,000.
| 21.1.19 | Rehabilitation and Mine Closure Costs |
It has been assumed in the study that progressive rehabilitation will be carried out as development of the mine is been carried out. These costs have been considered as part of the mine operating costs at a unit rate of $0.03per tonne of waste mined. However some capital costs have been factored in to come in two or so years from the end of life of the mine for the removal of some of the mine infrastructure, equipment and plant at the end of the project. This capital sum has been estimated at US$4.5Million. To reduce the overall costs of plant and equipment removal, scrap steel dealers will be engaged to recover most of the steel on site for resale.
| 21.1.20 | Sustaining Costs |
Sustaining capital is the periodic addition of capital required by the gold project to maintain operations at existing levels of production. The main components of sustaining capital required for the Buckreef relates to the replacement of aging equipment during the life of the project. With TRX concurrence, this capital has been pegged at 7.5% of start-up capital per year.
| 21.2 | Operating Costs |
| 21.2.1 | Introduction |
The operating costs estimates include all recurring costs for labour, service contractors, mine operation maintenance parts and supplies, consumables supplies, freight transport etc to operate the facilities as described in the study. Operating costs is defined as any recurring expenditure which can be expensed in the tax year in which it is incurred.
The Buckreef mine and plant operating regime schedule is summarised as follows:
| ● | Two 12 hour shifts daily for the mining operation. |
| ● | Salaried staff will be paid monthly including vacation |
| ● | Hourly personnel will be paid hourly excluding vacation |
Operating expenses commence with the introduction of feed into the plant in year 1
The operating costs are summarised as follows:
| ● | Mining |
| ● | Process |
| ● | Power |
| ● | Tailings |
| ● | Labour |
| ● | General & Administration (G&A) |
All costs details were developed for a typical year and extended over the years of operation. The estimates are considered complete in terms of the scope and allowances for all the planned and anticipated events, activities and occurrences throughout the life of the Buckreef project. The level of estimate detail was determined by the general significance of the item and its cost and the degree of definition available.
| | Page 162 |
| | NI43-101 ITR - Updated Mineral Resource Estimate for Buckreef Gold Project |
| 21.2.2 | Scope |
The recurring annual operating expense estimate includes all labour, spares supplies, services, logistical and turnaround costs to mine, process and service the operation for a nominal 1.5Mt ore per year operation. It includes all costs to be incurred by TRX management organisation and includes all activities from the start of mining operations through to gold product transfer to the buyer.
| 21.2.3 | Mining Operating Costs |
The Buckreef Mine operating costs encompass the labour material/supply/power costs incurred in the mining and haulage of RoM ore to the processing plant. These mine operating costs include the costs associated with the typical surface mining activities (such as drilling, blasting, load and haul of waste and ore), maintenance and operational support for the mining operations, grade control, rehabilitation and direct supervision of the mining operation.
To allow for a more thorough analysis and reporting of the mining operations expenses, costs were aggregated separately for each of the primary mine functions, drill and blast, load and haul and rehabilitation.
Table 21.1 Summary of the Mining Operating Costs
| Description | Unit | Rate $/t | Comment |
| Drilling and Blasting Waste | $/t | 0.74 | Based on Virimai Estimation |
| Drilling and Blasting Ore | $/t | 0.90 | Based on Virimai Estimation |
| Load and Haul Ore | $/t | 1.13 | Based on Virimai Estimation |
| Load and Haul waste | $/t | 1.03 | Based on Virimai Estimation |
| Overhaul rate | $/t/km | 0.08 | Based on Virimai Estimation |
| Mine Rehabilitation (Pits & Dumps) | $/t | 0.03 | Based on Virimai Estimation |
| Note | 0.1 | km per 10m bench at 10% grade. | |
| 21.2.4 | Labour Costs |
Buckreef Mine labour requirements were estimated using a zero-based approach with the annual staffing levels for the mine determined by the level of deployment of staff to manning various sections of the operations of the Buckreef Gold Project. Most of the labour will be employed in the pits and in the processing plant. The main departments of the Buckreef will comprise of the following sections each headed by a departmental head.
| ● | Management |
| ● | Open Pit Operations |
| ● | Engineering |
| ● | Technical Services |
| ● | Processing Plant and Metallurgy |
| ● | Safety Health and Environment |
| ● | Human Resources Management |
| ● | Administration and Accounts |
A total staffing level estimated for the Buckreef operation is about 307 employees ranging from salaried staff to hourly paid employees. The annual cost labour costs at full production is estimated at USD$2.87Million which works out at US$1.98/t based on annual ore production of 1. 497Mt.The full schedule of assumed staffing levels of the project over the life of the project is summarized in table 21.2.
| | Page 163 |
| | NI43-101 ITR - Updated Mineral Resource Estimate for Buckreef Gold Project |
| 21.2.5 | Security Costs & Other Licenses |
Mine security will be provided by Tanzanian local company which has provided security over the exploration projects of the company over the last 10years. In addition to the local security company the Tanzanian national police will be contracted for periodic security duties for the security of the gold product. The annual costs of security in Tanzanian shillings are in the sum of TZS1, 007 Million and have been converted to US$448k at the current exchange rate of TZS2,250 to 1US$. This equates to about US$0.29/t of ore milled at full production.
| 21.2.6 | SHE & Licenses |
During the operation of the mine a number of licenses are required for the abstraction of water, landfill permits etc and the operation of aerodrome to the Tanzanian Government air traffic control authority and annual audits stipulated by the Environmental Management Agency of Tanzania in the Buckreef EIA certificates. These costs are estimated at about at TSZ580Million per year which at current rate of exchange is US$0.17/t milled at the planned production rate of 1.5Mtpa.
| 21.2.7 | Open Pit Mining |
Mine operating costs were estimated assuming all mining functions would be directly performed by the owner using company owned equipment and company employees. All mining will be carried out using a fleet of hydraulic excavators loading into 40tonne capacity articulated dump truck. The mining costs relate to the running cost of the mining mobile equipment which include for the fuel, maintenance (spares and labour), operators and other consumables.
Table 21.2: Mining rates for the Buckreef
| Item | Description | Unit | Rate |
| 3 | Load and Haul Ore | $/t | 1.13 |
| 4 | Load and Haul waste | $/t | 1.03 |
| 5 | Overhaul rate | $/t/km | 0.08 |
| 21.2.8 | Power |
The power supply estimate is based on the use of combination of grid power from Tanesco and diesel generators powered by diesel fuel at an assumed ratio of 80% and 20% respectively. The current grid power cost from Tanesco is 159TZS /kWhr which equates to US$0.07/kWhr. The inclusion of generators is to provide backup power for the operations in the case of power outages. The operating load estimate for the plant and other mine facilities has been developed based mostly on equipment sized in the study. Price of power used in this update study for the Buckreef is a weighted average of the grid and generator power at ratio of 80% to 20% grid supply and diesel power supply respectively.
| 21.2.9 | Fuel Cost |
The fuel cost includes selling price at source plus taxes and transport cost for delivery at the mine site. The current delivery price of diesel fuel to the mine from the Mwanza is at US$1.20/lt. All fuel costs have being captured in the other respective costs centres like mining and processing.
| | Page 164 |
| | NI43-101 ITR - Updated Mineral Resource Estimate for Buckreef Gold Project |
| 21.2.10 | Process |
The processing operating cost estimates were prepared from quotes presented by various suppliers and on metallurgical test results on reagent consumption levels. The metallurgical test results on which the costs are based on are from Emisha Metallurgical Solutions and the metallurgical tests results from CN Solutions. Based on the current test results and reagent consumption levels this update study has estimated the process operating costs at US$ 10.24 /t of ore milled. The process plant has been designed in three modules of 60tphr capacity each sized to process 3888tpd in total with an availability of 90%. The costs include the costs of direct process operations, labour, consumables and reagents maintenance and laboratory assay costs. A detailed process operating reagent cost estimate is provided in table 21.3.
Table 21.3: Processing Chemical Consumption & Cost estimation
| Item | Description | Unit | Cons Kg/t | Unit price $/kg | Costs $/tRoM |
| 1 | Flocculent | kg/t | 1.085 | 0.2 | 0.217 |
| 2 | Lime | kg/t | 1.01 | 3 | 3.031 |
| 3 | Cyanide | kg/t | 0.007 | 0.68 | 0.005 |
| 4 | HCL | kg/tc | 0.213 | 1.27 | 0.27 |
| 5 | NaOH | kg/tc | 0.001 | 3.78 | 0.004 |
| 6 | Carbon | kg/tc | 0.036 | 22.73 | 0.814 |
| 7 | Ferrous Sulphate | kg/t | 8E-04 | 1.2 | 0.001 |
| 8 | Diesel | kg/t | 1.085 | 0.2 | 0.217 |
| 9 | Total Consumable Costs $/tRoM | 4.39 | |||
| 21.2.11 | Tailing Storage Facility (TSF) |
The TSF operating costs were developed and provided by Fraser Alexander of South Africa and the estimate operating costs cover routine maintenance and servicing of the TSF infrastructure which include the earthworks related tailings and water handling systems presented in the update study report.
Table 21.4: Annual TSF Management Costs
| Description | Annual Costs $/yr | Unit Cost $/t |
| TSF management | 84,375 | 0.06 |
The prices of liners and steel balls in the crushing and grinding section of the plant are based on vendor data and industry standards. In summary the processing costs estimates are given in table 21.5.
Table 21.5: Summary of Processing Costs estimates
| Item | Description | Unit | Rate |
| 1 | Processing reagents | $/t | 4.39 |
| 2 | General spares & mechanical consumables | $/t | 0.52 |
| 3 | General spares and consumables | $/t | 1.66 |
| 4 | Power | $/t | 1.56 |
| 5 | Process Labour | $/t | 1.76 |
| 6 | TSF management | $/t | 0.06 |
| 7 | RoM Ore Re-handle | $/t | 0.28 |
| 8 | Processing Costs | $/t | 10.23 |
| | Page 165 |
| | NI43-101 ITR - Updated Mineral Resource Estimate for Buckreef Gold Project |
| 21.2.12 | Labour Costs |
Buckreef Mine labour requirements were estimated using a zero-based approach with the annual staffing levels determined by the level of manpower requirements dictated by the production sequence. The manpower requirements necessary for the operation which is inclusive of supervising the mining operations in the pits, running the processing plant and the other production support facilities were based on the respective operating shifts. The engineering staffing levels were based on Virimai Projects engineering experience in the allocation of manning levels to maintain the facilities and the equipment on the project. Support labour and mine supervisory personnel were assigned in accordance with manning conventions at other Tanzanian mines and as deemed necessary to adequately support the production requirements of the Buckreef Project.
The total annual salaries and wage for labour at the mine were based on salary information provided by TRX and Table 21.6 is the summarised annual cost by section of the mine.
Table 21.6: Labour and General Costs Summary
| ITEM | CATEGORY | NO | Annual USD |
| 1 | Management | 3 | 162,000 |
| 2 | Mine Operation | 111 | 385,800 |
| 3 | Mining Engineering | 42 | 558,000 |
| 4 | Technical Services | 15 | 297,600 |
| 5 | Process Plant | 18 | 60,000 |
| 6 | Safety, Health & Environment | 8 | 201,600 |
| 7 | Metallurgical Laboratory | 6 | 80,400 |
| 8 | Human Resources | 12 | 132,000 |
| 9 | Purchasing | 7 | 74,400 |
| 10 | Accounting | 11 | 210,000 |
| 11 | Camp | 28 | 127,200 |
| 12 | TOTAL | 261 | 2,289,000 |
| 13 | Skills Development Levy | 5% | 103,005 |
| 14 | Workers Compensation Fund | 1% | 22,890 |
| 15 | Company social contribution | 10% | 228,900 |
| 16 | SUB TOTAL | 2,643,795 | |
| 17 | Other Non-Labour G& A | 10% | 228,900 |
| 18 | GRAND TOTAL | 2,872,695 | |
| 19 | Annual Tonnage | 1,450,656 | |
| 20 | UNIT LABOUR COSTS | $/t | 1.98 |
| 21.2.13 | Summary |
On the basis of estimated steady state production of 1,497,000tpa of ore milled the average operating costs for the mine at Buckreef are summarised in table 21.7. This cost is not inclusive of additional costs required for exploration for the addition of more resources to the reserve pipeline in order to sustain the mine to the end of the life of the station. Further these costs are not inclusive of the overhead costs incurred by the head office in Toronto.
| | Page 166 |
| | NI43-101 ITR - Updated Mineral Resource Estimate for Buckreef Gold Project |
Table 21.7: Operating Costs Summary
| Item | Description | Unit | Rate |
| 1 | Mining Rates | ||
| 1.1 | Mining Drilling and Blasting Waste | $/tw | 0.90 |
| 1.2 | Mining Drilling and Blasting Ore | $/to | 1.20 |
| 1.3 | Load and Haul Ore | $/to | 1.88 |
| 1.4 | Load and Haul waste | $/tw | 1.88 |
| 1.5 | Overhaul rate | $/t/km | 0.08 |
| 2 | Processing Rates | ||
| 2.1 | Processing reagents | $/to | 5.07 |
| 2.2 | General spares & mechanical consumables | $/to | 2.05 |
| 2.3 | RoM Ore Re-handle | $/to | 0.28 |
| 3 | Power (Diesel Generators) | $/to | 3.11 |
| 4 | TSF Management | $/to | 0.06 |
| 5 | Labour Costs & General Costs | $/to | 1.98 |
Note: to = tonnes of ore material tw =tonnes of waste material
In the cash flow model, the unit costs of material were used in determining the net annual cash-flows based on the scheduled tonnages of materials from the each of the pits of Buckreef Project.
| | Page 167 |
| | NI43-101 ITR - Updated Mineral Resource Estimate for Buckreef Gold Project |
| 22. | ECONOMIC ANALYSIS |
The new mine optimisation and design on the Buckreef Prospect based on the updated Mineral Resources is still to be commissioned. The metallurgical testing of the fresh rock samples at SGS Canada Inc to provide critical flow sheet and design information for a large plant is will take up to six months. These two exercises will form the basis economic analysis of the Final feasibility NI43-101 Report to be commissioned by TRX on the Buckreef Gold Project. Notwithstanding that the full feasibility study is still to be commissioned Mr Kutekwtekwa outlines the economic analysis carried out in 2018 in support of the Mineral Reserves estimated in 2018 Prefeasibility study.
| 22.1 | Cash-flow Model |
A cash flow model was developed by Virimai Projects to allow a after-tax economic evaluation of the Buckreef Gold Project to be carried out. The model was subsequently reviewed by TRX to ensure that all cost considerations were catered for. As noted elsewhere all costs are stated in US Dollars and the cash flow and financial analysis are presented in June 2018 dollars and no provision of inflation was made in the model.
The capital and operating costs that were developed during the study were entered into the model and the annual cash flow forecasts were made on the basis of the scheduled tonnages and these cash-flows are shown in Table 22.1
As described elsewhere in the study report the mine is planned to operate for 15 years or more utilising surface mining. The surface mining operations begins in year 1 producing from the outcrops of the oxide ore areas in the pits. Surface mining reaches full production of 1.497Mtpa RoM in year four of starting operation.
A summary of the unit average operating costs used in the model are given in Table 21.4 in section 21 of the report.
| 22.2 | Discount Rate |
The cash flow in the model was discounted at 3%, 5% and 8% per annum after tax. The current commercial lending rates worldwide are relatively low. TRX has been operating for many years in Tanzania without difficulty; and had good relations with all levels of authority. It has a partnership with Stamico, a state mining company; it has provided access to its properties to artisan miners and it has active and positive relations with local communities. After all the foregoing considerations, the base case discount rate for the project is therefore pegged at 5%.
| 22.3 | Tax |
The financial analysis for the study was performed on after-tax basis. The Buckreef Project is subject to income tax at 30% of taxable income. Virimai Projects compiled the tax calculations for the
| | Page 168 |
| | NI43-101 ITR - Updated Mineral Resource Estimate for Buckreef Gold Project |
Buckreef with the assistance of Mr John Shimbala, a tax consultant and partner/director with Ark Associates Limited of Tanzania. Ark’s consent is shown in Figure 32.14 in the Appendices
The summary of Government taxes and levies used, where appropriate, in the computation of costs and the financial model is listed below for the record:
Table 22.1 Summary of Government taxes and levies used in costing and the Financial Model
| Corporate Tax | 30% | |
| VAT | 18% | |
| Capital Gains Tax | 10% | Resident |
| Capital Gains Tax | 15% | Non-resident |
| Withholding Tax on Services | 5% | Local |
| Withholding Tax on Services | 15% | Foreign |
| Stamp Duty | 1% | |
| Skills Development Levy | 5% | |
| Workmen’s Compensation | 1% | |
| Company Social Contribution | 10% | |
| Gov. Royalties | 6% | |
| Export Fee | 1% | |
| Other Applicable Fees (Local Service Levy) | 0.3% |
| 22.4 | Inflation |
No inflation factor was applied to the analysis. The escalation of costs and revenues were assumed to be equal throughout the life of the project.
| 22.5 | Revenue |
The projections of revenue are based on the quantity of gold produced at Buckreef based on the production scheduling as fully outlined in the study over the life of the project LoM at constant gold price of $1300/oz.
| 22.6 | Royalty |
The Government of Tanzania has established that the state and district are entitled to receive royalties for the exploitation of mineral resources by holders of mining concessions. The government royalty rate for gold is currently at 6% arising from the sale of the gold product and the district council service levy is pegged at 1.3% of revenue.
| | Page 169 |
| | NI43-101 ITR - Updated Mineral Resource Estimate for Buckreef Gold Project |
| 22.7 | Selling Costs |
The gold selling costs as levied by the government is US$40/oz which is deducted directly from the proceeds of sales.
| 22.8 | Summary of the Parameters Used in the Financial Model |
The following data was fed into a financial model built by Virimai Projects to carry out an economic assessment of the Buckreef Gold Project.
Table 22.2 Summary of the inputs into the Financial Model
| DESCRIPTION | UNIT | VALUE |
| Total Ore (Mineral Reserves) | (tonnes) | 19,202,000 |
| Grade (Mineral Reserves) | (g/t) | 1.54 |
| Waste (In Pit) | (tonnes) | 180,707,000 |
| Average Stripping Ratio | 9.54 | |
| Production Rate | Mtpa | 1.497 |
| In Situ Ounces | (oz) | 943,850 |
| Mining Dilution | % | 5 |
| Gold Price | (USD/oz) | 1,300 |
| Discount Rate | (%) | 5% |
| Royalty Rate | (%) | 7.3% |
| Capital Costs | USD($Million) | 76.5 |
| Expansion Year 1 | USD($Million) | 36.8 |
| Expansion Year 2 | USD($Million) | 5.8 |
| Expansion Year 3 | USD($Million) | 14.3 |
| Expansion Year 4 | USD($Million) | 19.6 |
| | Page 170 |
| | NI43-101 ITR - Updated Mineral Resource Estimate for Buckreef Gold Project |
| 22.9 | Financial Analysis |
Table 22.3 below shows the full after-tax financial analysis:
Table 22.3: Financial Analysis of the Buckreef Gold Project
| YEARS | |||||||||||||||||||
| Description | Rates | Fact | Year 1 | Year 2 | Year 3 | Year 4 | Year 5 | Year 6 | Year 7 | Year 8 | Year 9 | Year 10 | Year 11 | Year 12 | Year 13 | Year 14 | Year 15 | Year 16 | Total |
| Ore Mining | |||||||||||||||||||
| Oxide Ore (Tonnes) | kt | 349 | 188 | 57 | 209 | 73 | 30 | 159 | 66 | 309 | 118 | 21 | - | 41 | 2 | 8 | - | 1,629 | |
| Oxide Ore (g/t) | g/t | 2.00 | 1.40 | 1.24 | 1.28 | 1.17 | 1.20 | 1.02 | 2.07 | 1.98 | 3.92 | 0.97 | - | 2.11 | 1.65 | 1.65 | - | ||
| Trans Ore (Tonnes) | kt | 92 | 151 | 136 | 133 | 106 | 78 | 40 | 28 | 82 | 309 | 270 | 52 | 17 | 6 | 21 | - | 1,520 | |
| Trans Ore (g/t) | g/t | 2.18 | 2.68 | 1.72 | 1.46 | 1.25 | 1.01 | 1.57 | 1.06 | 1.05 | 3.27 | 1.30 | 0.92 | 2.72 | 1.41 | 1.41 | - | ||
| Hard Ore (Tonnes) | kt | 43 | 146 | 290 | 625 | 1,271 | 1,347 | 1,251 | 1,356 | 1,060 | 1,028 | 1,160 | 1,399 | 1,392 | 1,446 | 1,323 | 915 | 16,053 | |
| Hard Ore (g/t) | g/t | 1.37 | 2.15 | 1.69 | 1.55 | 1.63 | 1.39 | 1.25 | 1.89 | 1.57 | 1.26 | 1.34 | 1.23 | 1.31 | 1.64 | 1.40 | 1.70 | ||
| Oxide Waste | kt | 2,713 | 1,443 | 2,087 | 598 | 191 | 1,551 | 2,086 | 2,140 | 1,978 | 3,323 | 918 | 82 | 1,046 | - | - | - | 20,155 | |
| Trans Waste | kt | 1,296 | 1,097 | 2,134 | 1,410 | 733 | 1,525 | 1,930 | 1,277 | 1,629 | 2,700 | 2,878 | 1,368 | 368 | - | - | - | 20,346 | |
| Hard Waste | kt | 508 | 1,766 | 4,055 | 6,824 | 7,781 | 6,839 | 7,985 | 9,294 | 14,640 | 12,160 | 14,550 | 15,490 | 12,149 | 12,888 | 13,176 | 1,102 | 141,207 | |
| Oxide & Trans Ore Recovery | % | 92% | 92% | 92% | 92% | 92% | 92% | 92% | 92% | 92% | 92% | 92% | 92% | 92% | 92% | 92% | 92% | 92% | |
| Sulphide Ore Recovery | 85% | 85% | 85% | 85% | 85% | 85% | 85% | 85% | 85% | 85% | 85% | 85% | 85% | 85% | 85% | 85% | 85% | ||
| Mining Dilution | % | 5% | 5% | 5% | 5% | 5% | 5% | 5% | 5% | 5% | 5% | 5% | 5% | 5% | 5% | 5% | 5% | 5% | |
| Gold produced | |||||||||||||||||||
| Fine (kg) | kg | 876 | 869 | 677 | 1,208 | 1,878 | 1,621 | 1,468 | 2,225 | 1,989 | 2,405 | 1,599 | 1,433 | 1,595 | 1,924 | 1,535 | 1,258 | 24,559 | |
| Fine (oz) (1oz =31.1034768grams) | koz | 28,162 | 27,944 | 21,752 | 38,837 | 60,375 | 52,111 | 47,181 | 71,532 | 63,956 | 77,320 | 51,412 | 46,069 | 51,295 | 61,851 | 49,347 | 40,448 | 789,593 | |
| Gold price (US$000) | $/oz | 1300 | 1,300 | 1,300 | 1,300 | 1,300 | 1,300 | 1,300 | 1,300 | 1,300 | 1,300 | 1,300 | 1,300 | 1,300 | 1,300 | 1,300 | 1,300 | 1,300 | |
| Gross revenue | US ($000) | 0 | 36,610 | 36,327 | 28,277 | 50,488 | 78,487 | 67,744 | 61,336 | 92,992 | 83,143 | 100,516 | 66,835 | 59,890 | 66,684 | 80,406 | 64,151 | 52,583 | 1,026,471 |
| Less Royalties & Selling Costs | - | ||||||||||||||||||
| : Royalties 7.3% on Revenue | 7.3% | (2,673) | (2,652) | (2,064) | (3,686) | (5,730) | (4,945) | (4,478) | (6,788) | (6,069) | (7,338) | (4,879) | (4,372) | (4,868) | (5,870) | (4,683) | (3,839) | (74,932) | |
| : Selling Costs per oz of gold | 4.40 | (124) | (123) | (96) | (171) | (266) | (229) | (208) | (315) | (281) | (340) | (226) | (203) | (226) | (272) | (217) | (178) | (3,470) | |
| Net revenue | 33,814 | 33,553 | 26,117 | 46,631 | 72,492 | 62,570 | 56,651 | 85,889 | 76,792 | 92,838 | 61,730 | 55,315 | 61,590 | 74,264 | 59,251 | 48,566 | 948,064 | ||
| | Page 171 |
| | NI43-101 ITR - Updated Mineral Resource Estimate for Buckreef Gold Project |
| YEARS | |||||||||||||||||||
| Description | Rates | Fact | Year 1 | Year 2 | Year 3 | Year 4 | Year 5 | Year 6 | Year 7 | Year 8 | Year 9 | Year 10 | Year 11 | Year 12 | Year 13 | Year 14 | Year 15 | Year 16 | Total |
| Capital Costs | US ($k) | ||||||||||||||||||
| Start up Capital | 36,799 | 5,804 | 14,334 | 19,563 | 76,501 | ||||||||||||||
| Closure Costs | U$ | 4,507 | 4,507 | ||||||||||||||||
| Sustaining Costs | U$ | 7.5% | - | - | - | 5,738 | - | - | 5,738 | - | - | 5,738 | - | - | 5,738 | - | 22,950 | ||
| Total Capital Costs | U$ | - | 36,799 | 5,804 | 14,334 | 19,563 | 5,738 | - | - | 5,738 | - | - | 5,738 | - | - | 5,738 | - | 4,507 | 103,958 |
| Operating expenditure | U$ | ||||||||||||||||||
| Mining Rates | US ($k) | ||||||||||||||||||
| Drill & Blast Waste | $/tw | 0.74 | 1,337 | 2,122 | 3,796 | 6,103 | 6,310 | 6,198 | 7,348 | 7,834 | 12,057 | 11,013 | 12,916 | 12,493 | 9,276 | 9,551 | 9,764 | 817 | 118,936 |
| Drill & Blast Ore | $/to | 0.90 | 122 | 269 | 385 | 685 | 1,244 | 1,287 | 1,166 | 1,250 | 1,031 | 1,208 | 1,291 | 1,310 | 1,274 | 1,312 | 1,213 | 827 | 15,876 |
| Load and Haul Ore | $/to | 1.13 | 544 | 546 | 544 | 1,088 | 1,632 | 1,637 | 1,632 | 1,632 | 1,632 | 1,637 | 1,632 | 1,632 | 1,632 | 1,637 | 1,520 | 1,030 | 21,609 |
| Load and Haul waste | $/tw | 1.03 | 4,663 | 4,444 | 8,541 | 9,115 | 8,983 | 10,231 | 12,384 | 13,118 | 18,831 | 18,764 | 18,933 | 17,481 | 13,996 | 13,300 | 13,597 | 1,138 | 187,519 |
| Overhaul rate | $/t/km | 0.08 | |||||||||||||||||
| Mine Rehabilitation | $/tw | 0.03 | 136 | 129 | 248 | 265 | 261 | 297 | 360 | 381 | 547 | 545 | 550 | 508 | 407 | 387 | 395 | 33 | 5,451 |
| Processing Rates | |||||||||||||||||||
| Processing reagents | $/to | 10.24 | 4,952 | 4,966 | 4,952 | 9,905 | 14,853 | 14,894 | 14,853 | 14,853 | 14,853 | 14,894 | 14,853 | 14,853 | 14,853 | 14,894 | 13,836 | 9,370 | 196,646 |
| Labour Costs | $/to | 1.98 | 958 | 960 | 958 | 1,915 | 2,872 | 2,880 | 2,872 | 2,872 | 2,872 | 2,880 | 2,872 | 2,872 | 2,872 | 2,880 | 2,675 | 1,812 | 38,023 |
| Total operating costs | US ($k) | 12,712 | 13,436 | 19,424 | 29,076 | 36,156 | 37,425 | 40,616 | 41,942 | 51,825 | 50,941 | 53,048 | 51,151 | 44,310 | 43,960 | 43,001 | 15,026 | 584,048 | |
| Opex +Capex | US ($k) | - | 49,511 | 19,240 | 33,758 | 48,639 | 41,894 | 37,425 | 40,616 | 47,679 | 51,825 | 50,941 | 58,786 | 51,151 | 44,310 | 49,698 | 43,001 | 19,533 | 688,006 |
| Pre Tax Net Cash Flows | US ($k) | - | (15,697) | 14,313 | (7,641) | (2,008) | 30,598 | 25,145 | 16,035 | 38,210 | 24,967 | 41,897 | 2,944 | 4,165 | 17,280 | 24,567 | 16,250 | 29,033 | 260,058 |
| Taxable Income | US ($k) | 12,644 | 27,206 | 16,607 | 31,338 | 50,119 | 33,483 | 23,247 | 48,350 | 25,515 | 42,444 | 9,229 | 4,712 | 17,828 | 30,852 | 16,797 | 34,088 | 424,457 | |
| Tax Payable | US ($k) | 3,793 | 8,162 | 4,982 | 9,401 | 15,036 | 10,045 | 6,974 | 14,505 | 7,654 | 12,733 | 2,769 | 1,414 | 5,348 | 9,255 | 5,039 | 10,226 | 127,337 | |
| Net Cashflows after Tax | US ($k) | (19,490) | 6,151 | (12,623) | (11,409) | 15,563 | 15,100 | 9,061 | 23,705 | 17,313 | 29,164 | 176 | 2,751 | 11,932 | 15,311 | 11,211 | 18,807 | 132,721 | |
| Add back Depreciation | US ($k) | 5,955 | 7,090 | 9,913 | 13,783 | 13,783 | 8,338 | 7,212 | 4,403 | 547 | 547 | 547 | 547 | 547 | 547 | 547 | 547 | 74,854 | |
| Net Cashflow after tax adjusted for tax dep | US ($k) | (13,536) | 13,240 | (2,709) | 2,373 | 29,346 | 23,438 | 16,273 | 28,107 | 17,860 | 29,711 | 723 | 3,298 | 12,479 | 15,859 | 11,758 | 19,354 | 207,575 | |
| After Tax NPV @ ( 3%) | US ($k) | 3% | 156,552 | ||||||||||||||||
| After Tax @ NPV (5%) | US ($k) | 5% | 130,964 | ||||||||||||||||
| After Tax @ NPV (8%) | US ($k) | 8% | 101,495 | ||||||||||||||||
| After Tax IRR | % | 74% | |||||||||||||||||
| Cash cost per oz | $/oz | 451 | 481 | 893 | 749 | 599 | 718 | 861 | 586 | 810 | 659 | 1,032 | 1,110 | 864 | 711 | 871 | 371 | 735 | |
| All in cash costs | $/oz | 1,758 | 689 | 1,552 | 1,252 | 694 | 718 | 861 | 667 | 810 | 659 | 1,143 | 1,110 | 864 | 804 | 871 | 483 | 933 | |
| | Page 172 |
| | NI43-101 ITR - Updated Mineral Resource Estimate for Buckreef Gold Project |
| 22.10 | Financial Analysis Summary |
The results of the Buckreef Project’s economic analysis based on mining the identified open-pit Mineral Reserve, indicate a positive after-tax Net Present Value (NPV) of $130.96 million at a discount rate of 5% pa with an Internal Rate of Return (IRR) of 74% as summarized in Table 22.4 using a 30% Corporate tax rate.
Table 22.4: Results of the After-Tax Financial Analysis of the Buckreef Gold Project
| Item | Description | Units | Amount |
| 1 | Mining Profile | ||
| 1.1 | Mineral Reserves (Prove +Probable) | Mt | 19.202 |
| 1.3 | In situ Grade | g/t | 1.54 |
| 1.4 | Waste in Pit Shell | Mt | 181 |
| 1.5 | Mine Dilution | % | 5 |
| 2.4 | Stripping Ratio in Area 1 | waste/ore | 9.54 |
| 2 | Processing | ||
| 2.1 | Annual Ore Milling | Mtpa | 1.497 |
| 2.1.1 | Year 1-2 | Mtpa | 0.486 |
| 2.1.2. | Year 3-4 | Mtpa | 0.972 |
| 2.1.3 | Year 4-16 | Mtpa | 1.497 |
| 2.2 | Life of Mine in Years | Years | 16 |
| 2.3 | Gold Production | ||
| 2.3.1 | Average Gold Production per year | (oz) | 51,000 |
| 2.3.2 | Total Gold Production (LoM) | (oz) | 822,000 |
| 3 | Capital Expenditure | ||
| 3.1 | Start-up Capital Plant etc | USD$ M | 76.5 |
| 3.2 | Sustaining capital costs | USD$ M | 22.95 |
| 3.3 | Closure Costs (in Opex) | USD$M | 4.500 |
| 4 | Financial Modelling Result | ||
| 4.1 | Average LoM Cash Costs | USD$/oz | 735 |
| 4.2 | After Tax NPV @ 5%pa | USD$M | 130.96 |
| 4.3 | IRR | % | 74 |
| 22.11 | Financial Model Sensitivity Analysis |
A financial sensitivity analysis was conducted on the base case cash flow net present value (NPV) and internal rate of return on the following variable: capital costs, operational costs, gold price, and recoveries. A deterministic sensitivity analysis was carried out by varying the input values and calculating the new net present value at discount rate of 5% pa. The input values where varied by up to plus and minus 20% on the follows:
| ● | Price of gold (revenue parameters) |
| ● | Operating costs |
| ● | Capital costs |
| | Page 173 |
| | NI43-101 ITR - Updated Mineral Resource Estimate for Buckreef Gold Project |
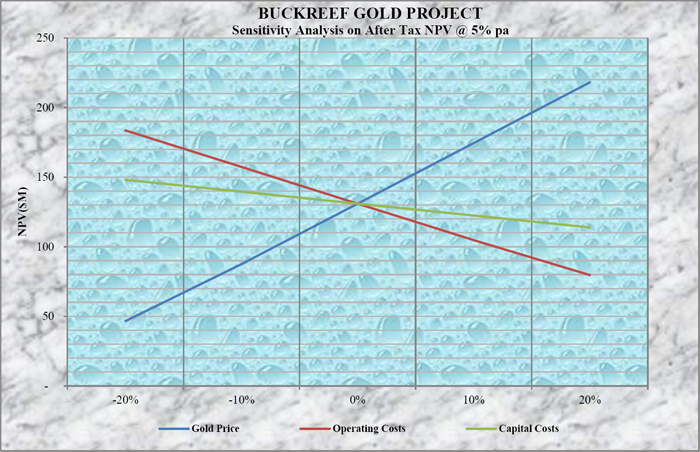 |
| Figure 22.1 Buckreef After-tax Sensitivity Analysis on NPV @ 5% |
| | Page 174 |
| | NI43-101 ITR - Updated Mineral Resource Estimate for Buckreef Gold Project |
| 23. | ADJACENT PROPERTIES |
The Buckreef project is situated within the Lake Victoria Gold Belt (LVGB), which is host to numerous small and a number of large scale gold mining operations as illustrated in figure 23.1.
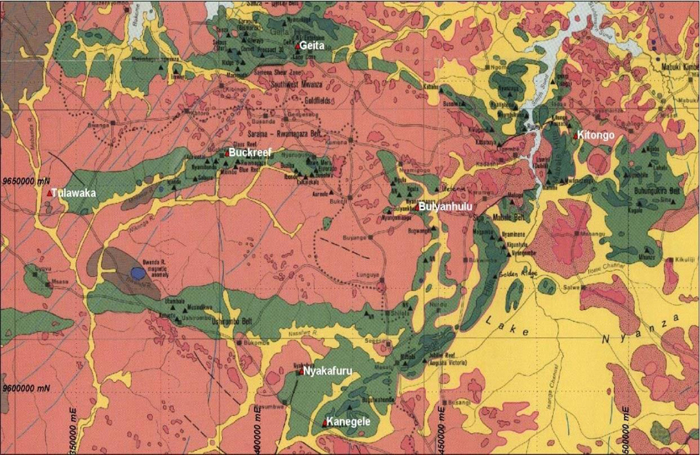 |
| Figure 23.1 Location of adjacent Gold Properties to Buckreef |
The nearest large-scale gold mines projects are outlined as follows:
| ● | Geita Gold Mine: Located on the outer arc of the Lake Victoria Greenstone belt, Geita mine is an open pit and underground mine and is one of AngloGold Ashanti’s flagship mines. The mine has been in operation as a large-scale mine since the 1930s. Geita is an Archaean mesothermal, mainly banded ironstone formation (BIF)-hosted, deposit. Mineralization is found on sheared BIF-diorite contacts and in the diorite as well. |
| ● | Tulawaka Mine (now Stamigold): Located on the western end of the inner arc of the Lake Victoria Greenstone ~50km due west of Buckreef Gold Mine, the Tulawaka gold deposit is hosted in a complex upper greenschist to amphibolite facies metamorphic terrain comprised of meta-sediments, including a minor component of meta-silicate-iron formation and meta-gabbro dykes or sills. The local stratigraphy has been folded into a large-scale Z-shaped fold that plunges to the south. The anticline portion of the fold has been cut by a thrust fault sub-parallel to the south-dipping fold axial plane. Gold occurs principally as free gold within quartz veins or stockworks, often associated with felsic intrusives.an exploration project and gold mine currently owned by STAMIGOLD a subsidiary of STAMICO. |
| | Page 175 |
| | NI43-101 ITR - Updated Mineral Resource Estimate for Buckreef Gold Project |
| ● | Bulyanhulu Mine: Located ~50km east of the Buckreef Mine on the inner arc of the Lake Victoria Greenstone, the geology consists of mafic volcanic flows overlain by a series of pyroclastics and ash tuffs. Argillite is present at the contact between the mafic and felsic rocks. The gold, silver and copper mineralization on the property occurs in mineralized “reefs” or quartz veins localize along steeply dipping northwest striking structures, generally localized in the argillite units. The mine is owned by Barrick Gold Corporation. |
The LVGB represents an important, large scale gold province in which regional mineralising systems have utilised rheologic, chemical and structural boundaries to remobilise and concentrate gold to produce economic deposits. Buckreef Project occurs in the LVG context with similarly suitable lithologic and structural features and theoretically therefore, could prove as potentially prospective.
The QP has not verified the public domain information with regards the Geita, Tulawaka and Bulyanhulu Mines and the information provided is not necessarily indicative of the mineralisation at Buckreef Project.
| | Page 176 |
| | NI43-101 ITR - Updated Mineral Resource Estimate for Buckreef Gold Project |
| 24. | OTHER RELEVANT DATA AND INFORMATION |
Not applicable
| | Page 177 |
| | NI43-101 ITR - Updated Mineral Resource Estimate for Buckreef Gold Project |
| 25. | INTERPRETATION AND CONCLUSIONS |
TRX has undertaken further detailed exploration diamond core drilling and sampling of the Buckreef deposit during the period January 2019 to February 2020 with the aim of upgrading the inferred resources within the pit shell generated by Virimai Projects in 2018 and to test for the mineralisation continuity down dip below the pit shells. All these activities have been undertaken by applying industry best standard methods and practices.
Sample collection and preparation has been done using industry best practises and analysis have been undertaken by certified laboratory resulting in results that support the Mineral Resource estimates as fully outlined in Chapter 14 of this update report. In light of the results of this resource update the QP recommend the advancement of the project to full Feasibility Study.
The project has positive attributes that justify the advancement some of which were fully outlined in the Amended ITR of 2018 (Virimai Projects 2018). These attributes include the following:
| ● | Increased inventory of mineral resources in the Buckreef Main. |
| ● | Project location in the highest gold producing region of East Africa. |
| ● | Metallurgical test work provides favourable indications that optimal gold recoveries can be achieved through cyanidation leaching of both oxides and fresh rock mineralization. Test work of samples of the both oxides indicates that recoveries in the order of 92% for oxides and 90% for fresh rock can be achieved. |
| ● | The project can be developed in stages utilizing cash flows from free dig oxides mineralization to capitalize future fresh rock mining and processing of the deposit. The potential for transitioning from open pit to underground exists as indicated from the down dip mineral resources at depth which cannot be accessed through open pit mining. |
The objective of Virimai’s mandate was to prepare an up Mineral Resource estimate for the Buckreef Project and prepare a supporting Independent Technical Report (ITR) in compliance with NI43-101 and CIM Definition Standards. After conducting a detailed review of all pertinent information and completing the mandate Virimai Projects concludes as follows:
Table 25.1 Comparison of Buckreef June 2018 and May 2020 Mineral Resources:
| Prospect | Measured | Indicated | Inferred | Total Measured + Indicated | ||||||||
| Tonnes | Grade | In Situ Content | Tonnes | Grade | In Situ Content | Tonnes | Grade | In Situ Content | Tonnes | Grade | In Situ Content | |
| (Mt) | Au (g/t) | Au (Oz) | (Mt) | Au (g/t) | Au (Oz) | (Mt) | Au (g/t) | Au (Oz) | (Mt) | Au (g/t) | Au (Oz) | |
| Buckreef June 2018 | 8.90 | 1.72 | 491,529 | 13.10 | 1.41 | 594,456 | 7.53 | 1.33 | 322,902 | 22.00 | 1.54 | 1,085,978 |
| Buckreef May 2020 | 19.98 | 1.99 | 1,281,160 | 15.89 | 1.48 | 755,120 | 17.82 | 1.11 | 635,540 | 35.88 | 1.77 | 2,036,280 |
| ● | The data base supporting the 2020 Mineral Resource Estimate for the Buckreef Gold Project is complete, valid, and up to date (including historical drilling and current drilling 2019 program) |
| ● | The geological and grade continuity of gold mineralization in the Buckreef deposit has been demonstrated and is supported by surface drilling carried out in the area. |
| | Page 178 |
| | NI43-101 ITR - Updated Mineral Resource Estimate for Buckreef Gold Project |
| ● | The mineral resource estimate is considered to be reliable, thorough and based on quality data and reasonable assumptions compliant with NI43-101 requirements and CIM Definitions Standards. |
| ● | Mr Kutekwatekwa is of the opinion that the Mineral Resource Estimates results of the Buckreef Project support the recommendations to advance the project to a full feasibility stage. |
| ● | Opportunities exist for new discoveries and to potentially add more mineral resources to the project. |
| | Page 179 |
| | NI43-101 ITR - Updated Mineral Resource Estimate for Buckreef Gold Project |
| 26. | RECOMMENDATIONS |
The project appears to have positive attributes that justify the advancement of the project and in that vein, that QPs would recommend the following follow:
| 8. | To continue with the ultra-deep drilling programme to increased inventory of mineral resources down dip and the north east strike mineralization’s extend in the Buckreef Main in the identified explorations targets. |
| 9. | Complete the metallurgical testing of the fresh rock samples to identify the low costs alternative processing of the ores of the Buckreef Project. |
| 10. | To carry out rock geo-technical studies to see their impact the pit slope stability and possible underground mining options. |
| 11. | To carry out additional detailed metallurgical test work, on all significant lithological domains, to inform the gold recovery methods and the development of the processing flow sheet. |
| 12. | To recomputed the Mineral Reserves on the updated Mineral Resources in this report. |
| 13. | To proceed to the project full Feasibility Study. |
| 14. | To maintain a strict local legal compliance checklist for the project, in order to close any possible unreasonable political machinations. |
Effective dated: May 15, 2020.
| | |||
| Wenceslaus Kutekwatekwa | Frank K Crundwell | |||
| BSc (Hons) Ming Eng. MBA | BSc(Hons) BSc(Maths) MSc(Eng) PhD. MBA | |||
| FSAIMM, FIoDZ, MPMZ | FSAIMM, FChemI | |||
| CONSULTING DIRECTOR | METALLURGICAL CONSULTANT | |||
| | Page 180 |
| | NI43-101 ITR - Updated Mineral Resource Estimate for Buckreef Gold Project |
| 27. | REFERENCE |
| ● | Virimai Projects-Update National Instrument 43-101 Independent Technical Mining Reserve Estimate and Prefeasibility Study on the Buckreef Gold Project, Tanzania East Africa, June 2018 |
| ● | RSG Global, - Metallurgical Test-work Review and Recommendations for the Buckreef Project, July 2004 |
| ● | Metallurgical Project Consultants Pty Limited, - Phase 2 Metallurgical Test-work Summary, February 2007 |
| ● | Hellman & Schofield Pty Ltd (H&S), Estimates of the Gold Resources at Buckreef Prospect – Tanzania, June 2007 |
| ● | Sound Mining (SMS), Buckreef Gold Project Mining Study, - Preliminary Economic Assessment, January 2012 |
| ● | Venmyn Independent Projects (Pty) Limited, - National Instrument 43-101 Preliminary Economic Assessment of Tanzania Royalty Exploration Corporation’s Buckreef Gold Mine, Re-development Project in Tanzania, May 31st, 2012 |
| ● | ENATA LTD, - Environmental Impact Assessment for Gold Mining Project at Mnekezi Village in Geita District, Geita Region, Tanzania; February 2014 |
| ● | Venmyn Deloitte, - Update National Instrument 43-101, Independent Technical Report on the Buckreef Project in Tanzania for Tanzanian Gold Corporation; February 24th, 2014 |
| ● | Mark Noppe, - Reporting Mineral Resources and Ore Reserves – How Confident are we? – MINERAL RESOURCE & ORE RESERVE ESTIMATION bulletin, June 2014 |
| ● | Sphere Envirotech & Engineering (T)Ltd – Buckreef Gold Mine, Environment Management Plan (EMP) Update, January 2016 |
| ● | Tanzania Minerals Audit Agency:https://www.tmaa.go.tz - Accessed on 23rd January 2017. |
| ● | MMSA Report No 15/059 r1 “Metallurgical testwork on oxide and sulphide gold bearing ore samples” by Juan van der Merwe, MMSA, 11 January, 2016. |
| ● | Project 6011 “Phase 2 Metallurgical Test work Summary Project 6011” prepared by Peter Banovich of Metallurgical Project Consultants Pty Ltd, dated February 2011. |
| | Page 181 |
| | NI43-101 ITR - Updated Mineral Resource Estimate for Buckreef Gold Project |
| 28. | ABBREVIATIONS GENERAL |
| ADT | as in ADT Truck, referring to rear articulated dump | |
| ANFO | a site-mixed blend of Ammonium Nitrate (prills) & Fuel Oil (predominantly diesel, used as a | |
| CoG | Cut-off Grade | |
| CAPEX | Capital Costs Expenditure | |
| DTM | Digital Terrain Model | |
| EDS | Energy and Densification Systems | |
| EIA | Environmental Impact Assessment | |
| EPC | refers to Engineering, Procurement and Construction management of a project by a contractor | |
| EMP | Environmental Management Plan | |
| ESIA | Environmental and Social Impact Assessment | |
| Hex | Hydraulic Excavator | |
| JV | Joint Venture | |
| IRR | Internal Rate of Return | |
| NPV | net present value of a cash flow at a stated discount rate | |
| OPEX | Operating Costs Expenditure | |
| PFS | Preliminary Feasibility Study | |
| ROMPAD | Run of Mine Ore Stockpile | |
| RL | Reduced Level, referring to the height of a point above datum | |
| ROM | Run of Mine, referring to excavated material that has not been further treated | |
| RT | as in RT Dozer, referring to rubber tired Dozer | |
| SR | Strip Ratio, being the tonnes of waste to be moved to expose a tonne of ore | |
| TSF | Tailings Storage facility | |
| TZS | Tanzanian Shilling |
| | Page 182 |
| | NI43-101 ITR - Updated Mineral Resource Estimate for Buckreef Gold Project |
| 29. | MEASURES OF QUANTITY |
| bcm | bank cubic metre, being a volumetric measure of (undisturbed) rock | |
| cm | cubic metre, used to classify the volume of loader buckets, truck size etc | |
| ha | hectare, or 10,000 square metres | |
| in-situ | refers to undisturbed (un-blasted, un-dug) material | |
| k | as a suffix to a number refers to a thousand (103) units | |
| kg | kilogram | |
| km | kilometre | |
| lcm | loose cubic metre, being a volumetric measure applied to, broken rock | |
| m | as a suffix to a number refers to a metre length | |
| M | as a suffix to a number refers to a million (106) units | |
| m2 | as a suffix to a number refers to a square metre of area | |
| mm | as a suffix to a number refers to a millimeter | |
| pa | as a suffix to a number refers to a value per annum | |
| PF | Powder Factor, a measure of the kg of explosive to be blasted per tonne of rock | |
| t | tonne, being a metric tonne of 1,000 kg | |
| m.a.m.s.l | metres above mean sea level |
| | Page 183 |
| | NI43-101 ITR - Updated Mineral Resource Estimate for Buckreef Gold Project |
| 30. | ORGANISATIONS |
| ARSM | Associate of the Royal School of Mines | |
| CM | Commissioner of Minerals | |
| GOT | Government of Tanzania | |
| FSAIMM | Fellow of South African Institute of Mining and Metallurgy | |
| LBMA | London Bullion Market Association | |
| MEM | Ministry of Energy and Minerals | |
| MSAIMM | Member of South African Institute of Mining and Metallurgy | |
| MAusIMM | Member of Australian Institute of Mining and Metallurgy | |
| MZIE | Member of the Zimbabwe Institution of Engineer | |
| NEMC | National Environment Management Council | |
| TRX | Tanzanian Gold Corporation | |
| STAMICO | State Mining Corporation of Tanzania | |
| USGS | United States Geological Survey | |
| UNISA | University of South Africa |
| | Page 184 |
| | NI43-101 ITR - Updated Mineral Resource Estimate for Buckreef Gold Project |
| 31. | GLOSSARY |
| Archaean | Geological eon – subdivision of the Precambrian 2.5Ga to 3.8Ga | |
| Assay | A chemical test performed on a sample of ore or minerals to determine the amount of valuable metals contained. | |
| Basalt | Fine grained mafic volcanic rock | |
| Borehole | A hole drilled from surface or underground, in which core of the rock is cut by a diamond drill bit as the cutting edge. | |
| Bulk sample | A large sample of mineralized rock, frequently hundreds of tonnes, selected in such a manner as to be representative of the potential orebody being sampled. Used to determine metallurgical characteristics. Large sample which is processed through a small-scale plant, not a laboratory. | |
| Carbon-in-leach | The recovery process in which Au is leached from Au ore pulp by cyanide and simultaneously adsorbed onto activated carbon granules in the same vessel. The loaded carbon is then separated from the pulp for subsequent Au removal by elution. The process is typically employed where there is a naturally occurring Au adsorbent in the ore. | |
| Conglomerate | Sedimentary rock comprising of pebbles in a finer grained matrix | |
| Cross section | A diagram or drawing that shows features transacted by a vertical plane drawn at right angles to the longer axis of a geologic feature. | |
| Cyanidation | Method of extracting gold by dissolving in potassium cyanide solution | |
| Density | Measure of the relative “heaviness” of objects with a constant volume, density = mass/volume | |
| Deposit | Any sort of earth material that has accumulated through the action of wind, water, ice or other agents. | |
| Diamond drilling | A drilling method, where the rock is cut with a diamond bit, to extract cores. | |
| Dip | The angle that a structural surface, i.e. a bedding or fault plane, makes with the horizontal measured perpendicular to the strike of the structure. | |
| Dyke | Intrusive igneous rock vertically or sub-vertically emplaced. | |
| Estimation | The quantitative judgement of a variable. | |
| Exploration | Prospecting, sampling, mapping, diamond drilling and other work involved in the search for mineralization. |
| | Page 185 |
| | NI43-101 ITR - Updated Mineral Resource Estimate for Buckreef Gold Project |
| Exploration License/ Property | A Mineral Asset which is being actively explored for Mineral deposits or petroleum fields, but for which economic viability has not been demonstrated. | |
| Facies | An assemblage or association of mineral, rock, or fossil features reflecting the environment and conditions of origin of the rock. | |
| Fault | A fracture in earth materials, along which the opposite sides have been displaced parallel to the plane of the movement | |
| Feasibility study | A definitive engineering estimate of all costs, revenues, equipment requirements and production levels likely to be achieved if a mine is developed. The study is used to define the economic viability of a project and to support the search for project financing. | |
| Grade | The relative quantity or percentage of gold within the rock mass. Measured as grams per tonnes in this report. | |
| Greenstone Belt | Archaean sequence of mafic and ultramafic rocks | |
| Hanging wall | The overlying unit of a stratigraphic horizon, fault ore body or stope | |
| In situ | In its original place, most often used to refer to the location of the mineral resources. | |
| Indicated Mineral Resource | That part of a mineral resource for which tonnage, densities, shape, physical characteristics, grade and average mineral content can be estimated with a reasonable level of confidence. It is based on exploration sampling and testing information gathered through appropriate techniques from locations such as outcrops, trenches, pits, workings and drill holes. The locations are too widely or inappropriately spaced to confirm geological and/or grade continuity but are spaced closely enough for continuity to be assumed and sufficient minerals have been recovered to allow a confident estimate of average mineral value. | |
| Inferred Mineral Resource | That part of a mineral resource for which tonnage, grade and average mineral content can be estimated with a low level of confidence. It is inferred from geological evidence and assumed but not verified by geological and/or grade continuity. It is based on information gathered through appropriate techniques from locations such as outcrops, trenches, pits, workings and drill holes that may be limited or of uncertain quality and reliability. | |
| Laterite | Residual soil in humid climates form the leaching of silica and aluminium and enrichment in iron | |
| Lava | Molten silicate material extruded by a volcano. |
| | Page 186 |
| | NI43-101 ITR - Updated Mineral Resource Estimate for Buckreef Gold Project |
| License, Permit, Lease or other similar entitlement | Any form of license, permit, lease or other entitlement granted by the relevant Government department in accordance with its mining legislation that confers on the holder certain rights to explore for and/or extract minerals that might be contained in the land or ownership title that may prove ownership of the minerals. | |
| Life-of- Mine/LoM | Expected duration of time that it will take to extract accessible material. | |
| Liberation | Release of Au from the host rock through processing. | |
| Lithologies | The description of the characteristics of rocks, as seen in hand-specimens and outcrops based on colour, grain size and composition. | |
| Lode | Metalliferous ore that fills a fissure | |
| Mineral Reserve | The economically mineable material derived from a Measured and/or Indicated Mineral Resource. It is inclusive of diluting materials and allows for losses that may occur when the material is mined. Appropriate assessments, which may include feasibility studies, have been carried out, including consideration of and modification by, realistically assumed mining, metallurgical, economic, marketing, legal, environmental, social and governmental factors. These assessments demonstrate at the time of reporting that extraction is reasonably justified. Mineral Reserves are sub-divided in order of increasing confidence into Probable Mineral Reserves and Proven Mineral Reserve. | |
| Mineral Resource | A concentration of material of economic interest in or on Earth’s crust in such form, quality and quantity that there are reasonable and realistic prospects for eventual economic extraction. The location, quantity, grade, continuity and other geological characteristics of a Mineral Resource are known, estimated from specific geological evidence and knowledge, or interpreted from a well constrained and portrayed geological model. Mineral Resources are subdivided, in order of increasing confidence in respect of geoscientific evidence, into Inferred, Indicated and Measured categories. | |
| A deposit is a concentration of material of possible economic interest in, on or near the Earth’s crust. Portions of a deposit that do not have reasonable and realistic prospects for eventual economic extraction must not be included in a Mineral resource. | ||
| Measured Mineral Resource | That part of a mineral resource for which tonnage, densities, shape, physical characteristics, grade and mineral content can be estimated with a high level of confidence. It is based on detailed and reliable exploration, sampling and testing information gathered through appropriate techniques from locations such as outcrops, trenches, pits, workings and drill-holes. The locations are spaced closely enough to confirm geological and grade continuity. |
| | Page 187 |
| | NI43-101 ITR - Updated Mineral Resource Estimate for Buckreef Gold Project |
| MEM | Ministry of Energy and Minerals | |
| Mineralization | The presence of a target mineral in a mass of host rock. | |
| Mining Property | A Mineral Asset which is in production. | |
| National Instrument 43-101 | Canadian National Instrument on the reporting of exploration, mineral resources and mineral reserves for the TSX. | |
| Opencast / Open pit | Surface mining in which the ore is extracted from a pit. The geometry of the pit may vary with the characteristics of the ore body. | |
| Orebody | A continuous well-defined mass of material of sufficient ore content to make extraction economically feasible. | |
| Overburden | The alluvium and rock that must be removed in-order to expose an ore deposit. | |
| Porphyry | Fine grained igneous rock with large feldspar crystals | |
| Probable reserves | The economically mineable material derived from a Measured and/or Indicated Mineral Resource. It is estimated with a lower level of confidence than a Proven Reserve. It is inclusive of diluting materials and allows for losses that may occur when the material is mined. Appropriate assessments, which may include feasibility studies, have been carried out, including consideration of, and modification by, realistically assumed mining, metallurgical, economic, marketing, legal, environmental, social and governmental factors. These assessments demonstrate at the time of reporting that extraction is reasonably justified. | |
| Prospect | A deposit with the potential for economic extraction. | |
| Pyrite | Fool’s gold a common yellow sulphide mineral, FeS. Pyrite forms under a wide range of pressure-temperature conditions, and so is found in many geological environments. | |
| Quartzite | A metamorphic rock consisting primarily of quartz grains, formed by the recrystallisation of sandstone by thermal or regional metamorphism or a sandstone composed of quartz grains cemented by silica. | |
| Recovered grade/Yield | The actual grade of ore realised after the mining and treatment process. | |
| Reef | Mineralized lode. |
| | Page 188 |
| | NI43-101 ITR - Updated Mineral Resource Estimate for Buckreef Gold Project |
| Rehabilitation | The process of restoring mined land to a condition approximating to a greater or lesser degree its original state. Reclamation standards are determined by the Russia Federation Department of Mineral and Energy Affairs and address ground and surface water, topsoil, final slope gradients, waste handling and re-vegetation issues. | |
| Rhyolite | One of a group of extrusive rocks commonly showing flow texture, and typically porphyritic, with phenocrysts of quartz and potassium feldspar in a glassy to microcrystalline groundmass. | |
| Sample | The removal of a small amount of rock pertaining to the deposit which is used to estimate the grade of the deposit and other geological parameters. | |
| Sampling | Taking small pieces of rock at intervals along exposed mineralization for assay (to determine the mineral content). | |
| Saprolite | In situ weathered profile on laterite terrane where the soil comprises mostly clays | |
| Sedimentary | Formed by the deposition of solid fragmental or chemical material that originates from weathering of rocks and is transported from a source to a site of deposition. | |
| Specific gravity/S.G. | Measure of quantity of mass per unit of volume, density. | |
| Stockpile | A store of unprocessed ore or marginal grade material. | |
| Stripping | Removal of waste overburden covering the mineral deposit. | |
| Stripping ratio | Ratio of ore rock to waste rock. | |
| Subduction | The movement of one crustal plate (lithospheric plate) under another so that the descending plate is consumed. | |
| Tailings | The waste products of the processing circuit. These may still contain very small quantities of the economic mineral. | |
| Tailings dam | Dams or dumps created from waste material from processed ore after the economically recoverable metal or mineral has been extracted. | |
| Tonnage | Quantities where the tonne is an appropriate unit of measure. Typically used to measure reserves of metal-bearing material in-situ or quantities of ore and waste material mined, transported or milled. | |
| Trenching | Making elongated open-air excavations for the purposed of mapping and sampling. |
| | Page 189 |
| | NI43-101 ITR - Updated Mineral Resource Estimate for Buckreef Gold Project |
| Veins | A tabular or sheet like body of one or more minerals deposited in openings of fissures, joints or faults, frequently with associated replacement of the host rock. | |
| Yield/Recovered grade | The actual grade of ore realised after the mining and treatment process. |
| | Page 190 |
| | NI43-101 ITR - Updated Mineral Resource Estimate for Buckreef Gold Project |
| 32. | APPENDICES |
| 32.1 | Certificate of Qualified Persons Certificate of Wenceslaus Kutekwatekwa |
I, Wenceslaus Kutekwatekwaof Block 4, Tunsgate Office Park, 30 Tunsgate Road, Mount Pleasant, Harare, Zimbabwe, as author of the report(the “NATIONAL INSTRUMENT 43-101 Independent Technical Report, Updated Mineral Resource Estimate for the Buckreef Gold Mine Project, Tanzania, East Africa For Tanzanian Gold Corporation (TRX)”with an effective date of May 15, 2020 (the “Effective Date”) and with an amendment date of June 8, 2020, do hereby certify that:
I am a senior mining engineer in Zimbabwe with Virimai Projects and hold the designation of Consulting Director.
I graduated with a BSc (Hons) degree in Mining Engineering from University of Zimbabwe in 1989.
I am a member/fellow of the following professional association
| a. | Fellow Southern African Institute of Mining and Metallurgy (SAIMM), membership number 703812. |
| b. | Fellow Institute of Directors Zimbabwe (IoDZ), membership number ZW11768/13 |
| c. | Member Project Management Institute of Zimbabwe (PMIZ) membership number PMH132 |
I have worked as a mining engineer for 31 years since my graduation from university.
I have read the definition of “qualified person” set out in National Instrument 43-101 (“NI 43-101”) and certify that by reason of my education, affiliation with a professional organization (as described in NI 43-101) and past relevant work experience, I fulfill the requirements to be a “qualified person” for the purpose of NI 43-101.
I visited the Buckreef property and spent a total of 96 hours, in three separate visits, visiting mine sites, test pit, test processing plant, analysing core and general ground truthing, looking at plans and technical data.
My latest, and third, visit of my personal inspection to the Buckreef property was from 19 to 22 February 2020.
I am responsible for all sections of this NI43-101 ITR - Updated Mineral Resources Estimate Buckreef Gold Project Report, excluding Sections 13 and 17.
I have not received and do not expect to receive any interest, either direct or indirect, in any properties of Tanzanian Gold Corporation (the “Issuer”) and I do not beneficially own, either directly or indirectly, any securities of the Issuer.
I am independent of the Issuer as set out in section 1.5 of NI 43-101.
I have had prior involvement with the Buckreef property that is the subject of thisNI43-101 ITR-Updated Mineral Resources Estimate Buckreef Gold Projectin 2018, when I co-authored the“Amended Independent Technical Mining Reserve Estimate Pre-Feasibility Study on the Buckreef Gold Mine
| | Page 191 |
| | NI43-101 ITR - Updated Mineral Resource Estimate for Buckreef Gold Project |
Project, Tanzania, East Africa”prepared for the then Tanzanian Royalty Exploration Corporation with an effective date of 26th June 2018.
I have read NI 43-101 and Form 43-101F1 and thisNI43-101 ITR - Updated Mineral Resources Estimate Buckreef Gold Project Reporthas been prepared in compliance with NI 43-101 and Form 43-101F1.
As at the Effective Date of thisNI43-101 ITR - Updated Mineral Resources Estimate Buckreef Gold Project Report, to the best of my knowledge, information and belief, the Report contains all scientific and technical information that is required to be disclosed to make theNI43-101 ITR - Updated Mineral Resources Estimate Buckreef Gold Projectnot misleading.
I consent to the filing of the Technical Report with any stock exchange and other regulatory authority and any publication by them for regulatory purposes, including electronic publication in the public company files on their websites accessible by the public, of the Technical Report.
Dated June 8, 2020.
Wenceslaus Kutekwatekwa
BSc (Hons) Ming Eng. MBA
FSAIMM, FIoDZ, MPMZ
CONSULTING DIRECTOR
Summary of Recent Experience
| YEAR | CLIENT | COMMODITY | TYPE OF STUDY | PROJECT DESCRIPTION |
| 2019 | Mimosa Mining Company | Platinum | PFS | Review on DRA, North Hill Projects |
| 2018 | Hanzu | Gold | DFS | EPCM |
| 2018 | Anglo Platinum Unki | Platinum | Scoping | Decline Access and |
| 2018 | Metallon Gold | Gold | PEA | Scoping Study of Corporate Growth Strategy |
| 2017 | Samrec Vermiculite | Vermiculite | LOM | Pit Optimisation Scheduling and LoM Planning |
| 2017 | Prospect Resources | Lithium | PFS | Open Pit Optimisation design and Scheduling |
| 2016 | Global Platinum Resources | Platinum | PFS | Green Field Project PFS |
| 2015 | Mimosa Mining Company | Platinum | LOM | Scoping Study of the Mtshingwe expansion |
| | Page 192 |
| | NI43-101 ITR - Updated Mineral Resource Estimate for Buckreef Gold Project |
Certificate of Frank K Crundwell
I,Frank K. Crundwellof 89J Victoria Drive, London, SW196PT, United Kingdom, am the author of the sections for metallurgical test work and recovery methods for the report(the “NATIONAL INSTRUMENT 43-101 Independent Technical Report, Updated Mineral Resource Estimate for the Buckreef Gold Mine Project, Tanzania, East Africa For Tanzanian Gold Corporation (TRX)” with an effective date of May 15, 2020 (the “Effective Date”) and with an amendment date of June 8, 2020, do hereby certify that:
| 1. | I am a Director of CM Solutions (Pty) Ltd, a company registered in South Africa, and I am a Consulting Engineer with Crundwell Metallurgy Limited, a company registered in the United Kingdom. |
| 2. | I graduated with a BSc Engineering degree in Chemical Engineering from the University of the Witwatersrand, Johannesburg in 1983. I also hold MSc (Eng) and PhD degrees from the same university. |
| 3. | I am a member/fellow of the following professional association |
| i. | Fellow of the Southern African Institute of Mining and Metallurgy (SAIMM), membership number 56496. |
| ii. | A Registered Professional Engineer with Engineering Council of South Africa, registration number 20040172. |
| iii. | Fellow of the Institution of Chemical Engineers, membership number 99963109. |
| 4. | I have worked as a metallurgical engineer for 36 years since my graduation from university in 1983. |
| 5. | I have read the definition of “qualified person” set out in National Instrument 43-101 (“NI 43-101”) and certify that by reason of my education, affiliation with a professional organization (as described in NI 43-101) and past relevant work experience, I fulfill the requirements to be a “qualified person” for the purpose of NI 43-101. |
| 6. | I witnessed the bulk milling test work conducted using the EDS mill pilot rig in Johannesburg, South Africa. |
| 7. | I am responsible for the “Metallurgical test work” (item 13) and the “Recovery methods” (item 17) sections of the Updated Mineral Resources Estimates Buckreef Report. |
| 8. | I have not received and do not expect to receive any interest, either direct or indirect, in any properties of Tanzanian Gold Corporation (the “Issuer”) and I do not beneficially own, either directly or indirectly, any securities of the Issuer. |
| 9. | I am independent of the Issuer as set out in section 1.5 of NI 43-101. |
| 10. | I have had prior involvement with this Buckreef property that is the subject of this NI43-101 ITR - Updated Mineral Resources Estimate Buckreef Gold Project in 2018, when I |
| | Page 193 |
| | NI43-101 ITR - Updated Mineral Resource Estimate for Buckreef Gold Project |
co-authored the “Amended Independent Technical Mining Reserve Estimate Pre- Feasibility Study on the Buckreef Gold Mine Project, Tanzania, East Africa” prepared for the then Tanzanian Royalty Exploration Corporation with an effective date of 26th June 2018.
| 11. | I have read NI 43-101 and Form 43-101F1 and the Amended Buckreef Report has been prepared in compliance with NI 43-101 and Form 43-101F1. |
| 12. | As at the Effective Date of the Amended Buckreef Report, to the best of my knowledge, information and belief, the Amended Buckreef Report contains all scientific and technical information that is required to be disclosed to make the Amended Buckreef Report not misleading. |
| 13. | I consent to the filing of the Technical Report with any stock exchange and other regulatory authority and any publication by them for regulatory purposes, including electronic publication in the public company files on their websites accessible by the public, of the Technical Report. |
Dated June 8, 2020.
Frank Crundwell
BSc (Eng) Chem, BSc (Hons) Financial Maths, MSc (Eng) Chem, PhD,
Pr Eng, FSAIMM, FIChemE
DIRECTOR
Summary of Recent Experience
| YEAR | CLIENT | COMMODITY | TYPE OF STUDY | PROJECT DESCRIPTION |
| 2018 | Horizon Mining | Copper/cobalt | DFS | EPCM |
| 2018 | Anglo Platinum | Platinum | FS | Pressure leaching |
| 2018 | Sumitomo | Cobalt | Scoping | Optimization |
| 2018 | Undisclosed | Nickel | Consulting | Board document |
| 2017 | Undisclosed | Gold | Metallurgical dispute | Analysis, assessment |
| 2017 | Kansanshi | Copper/gold | Metallurgical test work | Test work |
| 2017 | Undisclosed | Gold/Sb | Metallurgical test work | Test work |
| | Page 194 |
| | NI43-101 ITR - Updated Mineral Resource Estimate for Buckreef Gold Project |
| 32.2 | Consent to publish |
Frank K. Crundwell
I Frank K Crundwell consent to the filing of the Technical Report titled “National Instrument 43-101 Independent Technical Report Update Mineral Resource Estimate for the Buckreef Gold Mine Project Tanzania East Africa.”
I Frank K Crundwell certify that I have read (i) the “National Instrument 43-101 Independent Technical Report Update Mineral Resource Estimate for the Buckreef Gold Mine Project Tanzania East Africa” dated 15th May 2020 by Virimai Projects and (ii) the news release of Tanzanian Gold Corporation dated March 17, 2020, and confirm they fairly and accurately represents the information in sections of the technical report for which I am responsible.
Dated June 8, 2020
Frank K. Crundwell
BSc (Eng) Chem, BSc (Hons) Financial Maths, MSc (Eng) Chem, PhD,
Pr Eng, FSAIMM, FIChemE
DIRECTOR
89J Victoria Drive, London, SW196PT, United Kingdom
| | Page 195 |
| | NI43-101 ITR - Updated Mineral Resource Estimate for Buckreef Gold Project |
Wenceslaus Kutekwatekwa
IWenceslaus Kutekwatekwaconsent to the filing of the Technical Report titled “National Instrument 43- 101 Independent Technical Report Update Mineral Resource Estimate for the Buckreef Gold Mine Project Tanzania East Africa.”
I Wenceslaus Kutekwatekwa certify that I am responsible for the compilation of the ITR titled “National Instrument 43-101 Independent Technical Report Update Mineral Resource Estimate for the Buckreef Gold Mine Project Tanzania East Africa” dated 15th May 2020 by Virimai Projects and I have read the news release of Tanzanian Gold Corporation dated March 17, 2020, and confirm they fairly and accurately represents the information in sections of the technical report for which I am responsible.
Dated June 8, 2020
Wenceslaus Kutekwatekwa
BSc (Hons) Ming Eng. MBA
FSAIMM, FIoDZ, MPMZ
CONSULTING DIRECTOR
| | Page 196 |
| | NI43-101 ITR - Updated Mineral Resource Estimate for Buckreef Gold Project |
| 32.3 | ESIA CERTIFICATION |
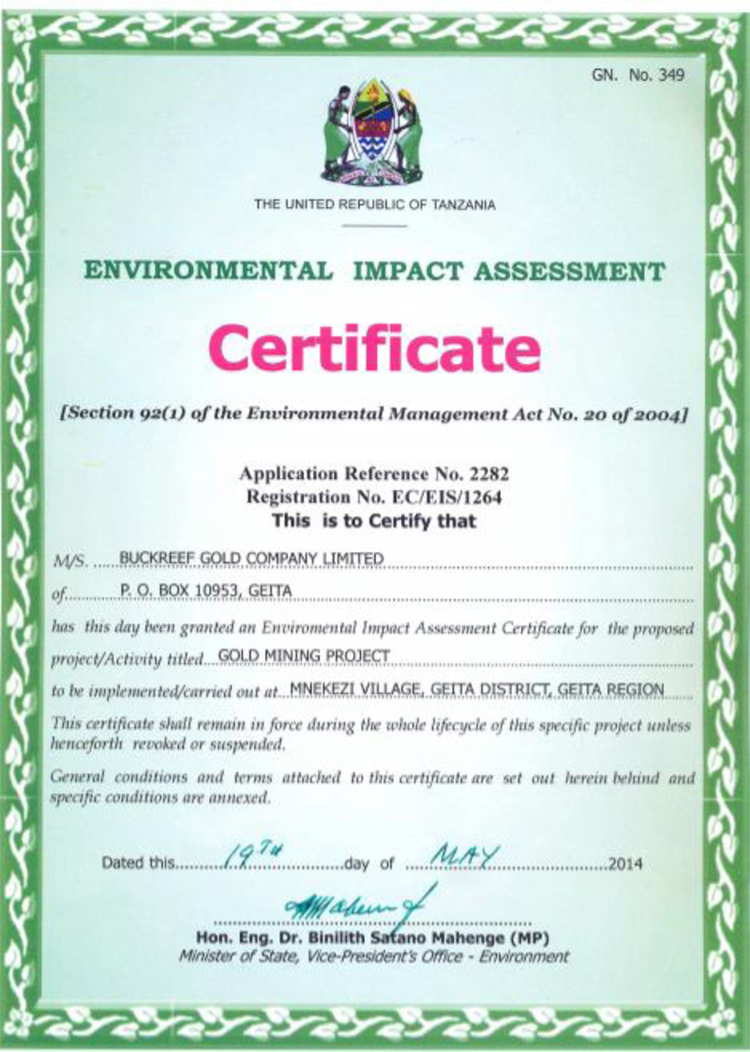
| | Page 197 |
| | NI43-101 ITR - Updated Mineral Resource Estimate for Buckreef Gold Project |
| 32.4 | LABORATORIES ACCREDITATION CERTIFICATES |
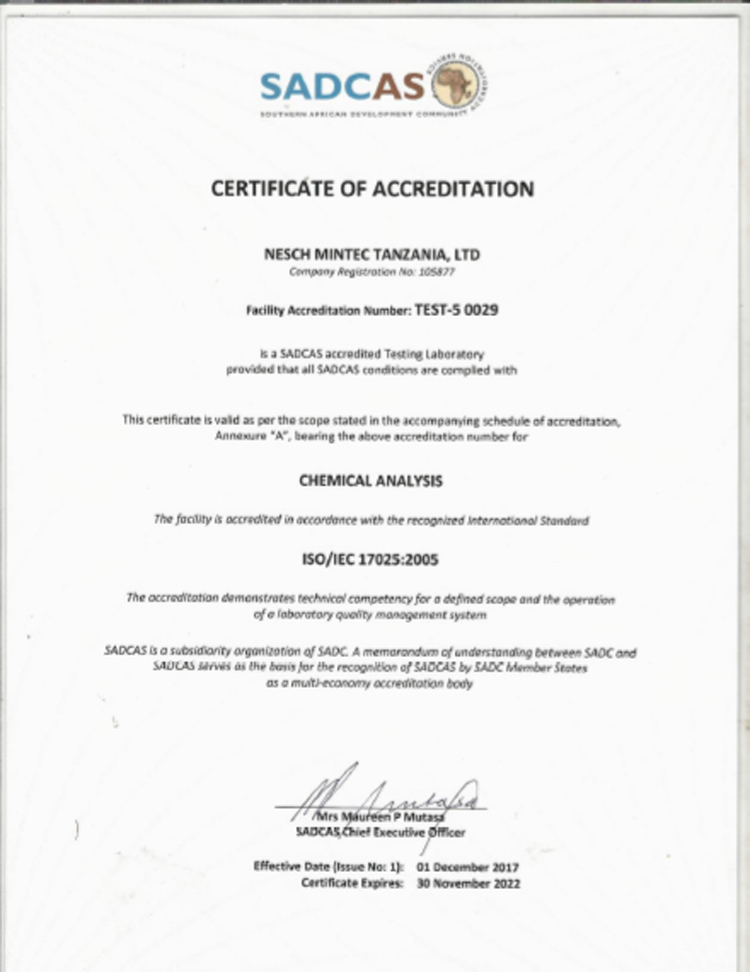
| | Page 198 |
| | NI43-101 ITR - Updated Mineral Resource Estimate for Buckreef Gold Project |

| | Page 199 |
| | NI43-101 ITR - Updated Mineral Resource Estimate for Buckreef Gold Project |
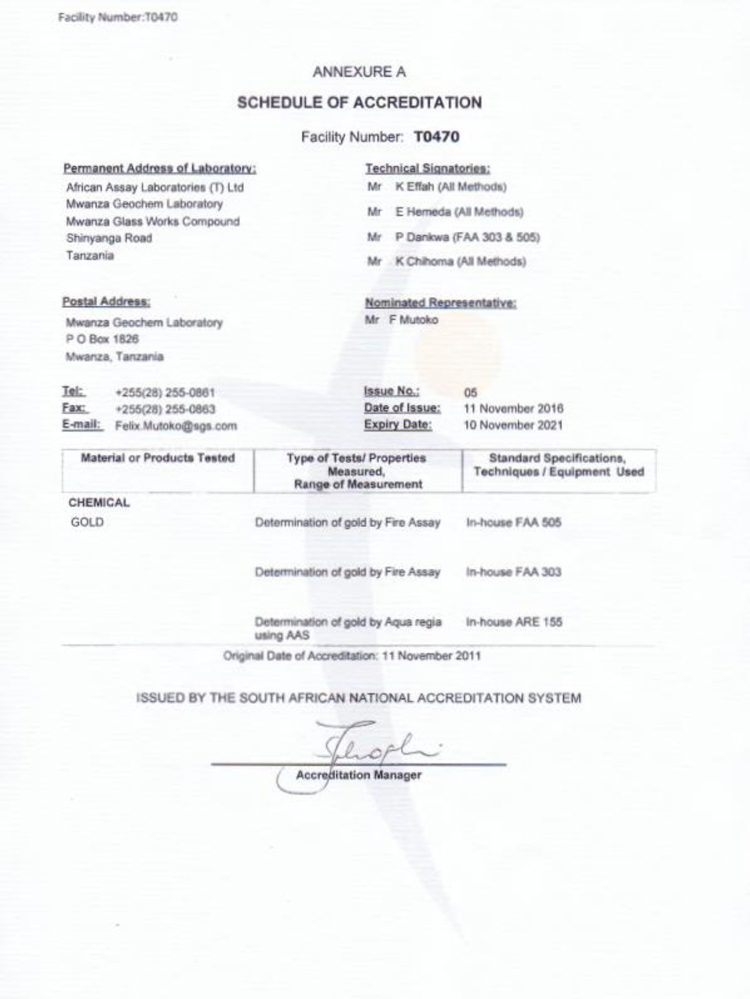
| | Page 200 |
| | NI43-101 ITR - Updated Mineral Resource Estimate for Buckreef Gold Project |
| 32.5 | PROCESS FLOW DIAGRAMS |
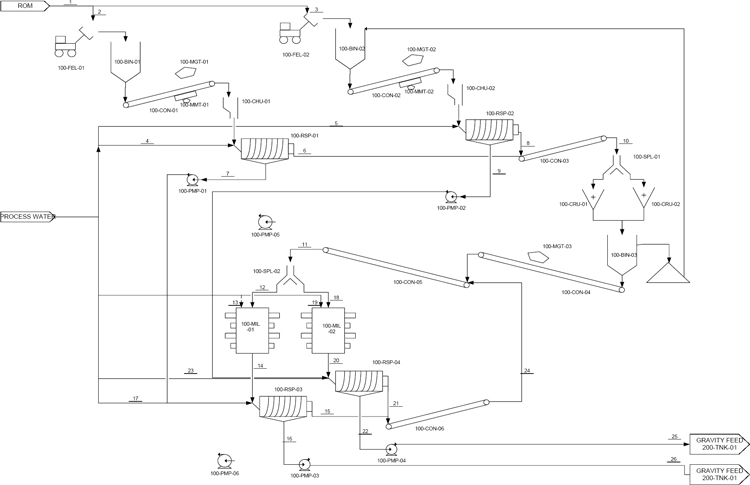
Figure 32.1: Process flow diagram for Area 100.
| | Page 201 |
| | NI43-101 ITR - Updated Mineral Resource Estimate for Buckreef Gold Project |
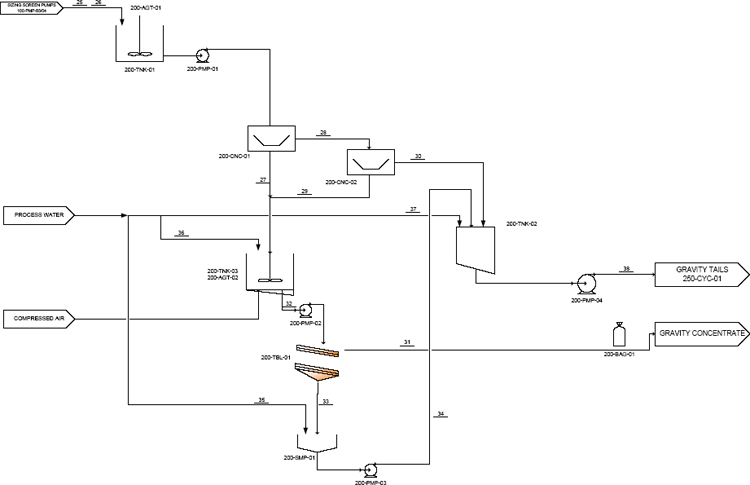
Figure 32.2. Process flow diagram for Area 200
| | Page 202 |
| | NI43-101 ITR - Updated Mineral Resource Estimate for Buckreef Gold Project |
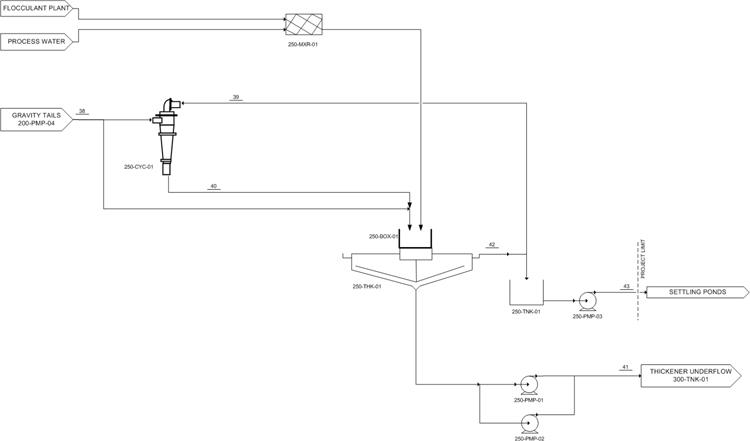
Figure 32.3. Process flow diagram for Area 250
| | Page 203 |
| | NI43-101 ITR - Updated Mineral Resource Estimate for Buckreef Gold Project |
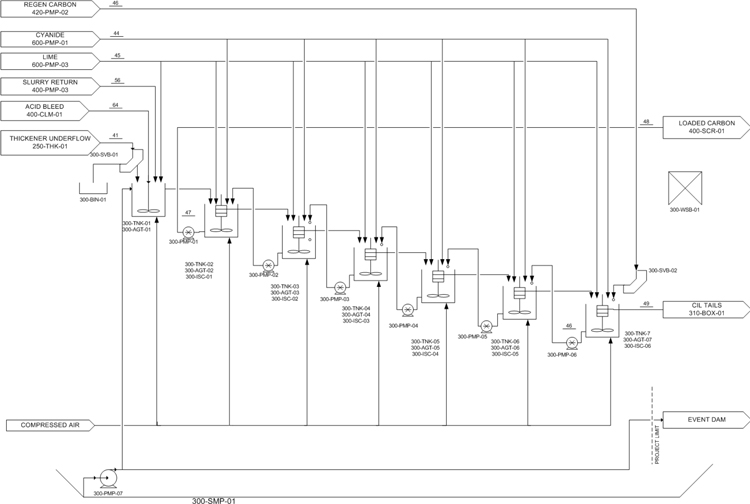
Figure 32.4. Process flow diagram for Area 300
| | Page 204 |
| | NI43-101 ITR - Updated Mineral Resource Estimate for Buckreef Gold Project |
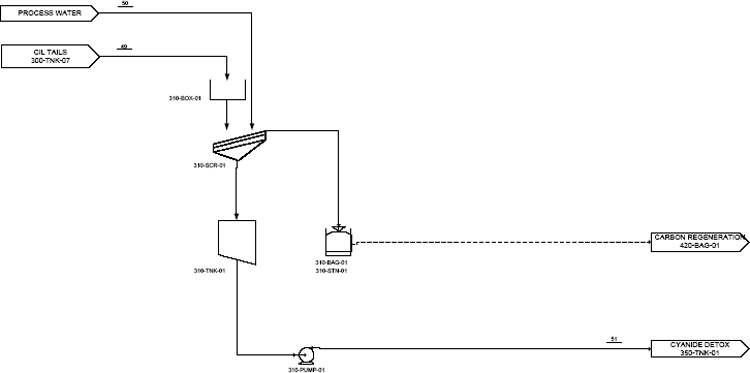
Figure 32.5. Process flow diagram for Area 310
| | Page 205 |
| | NI43-101 ITR - Updated Mineral Resource Estimate for Buckreef Gold Project |
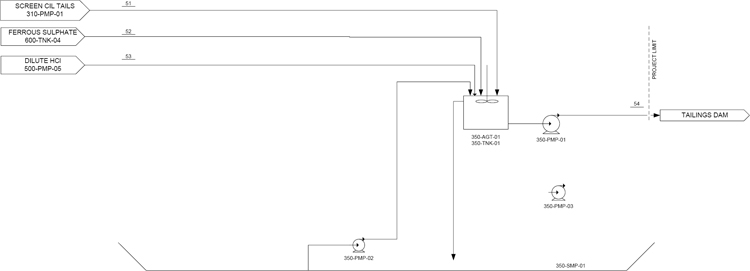
Figure 32.6. Process flow diagram for Area 350.
| | Page 206 |
| | NI43-101 ITR - Updated Mineral Resource Estimate for Buckreef Gold Project |
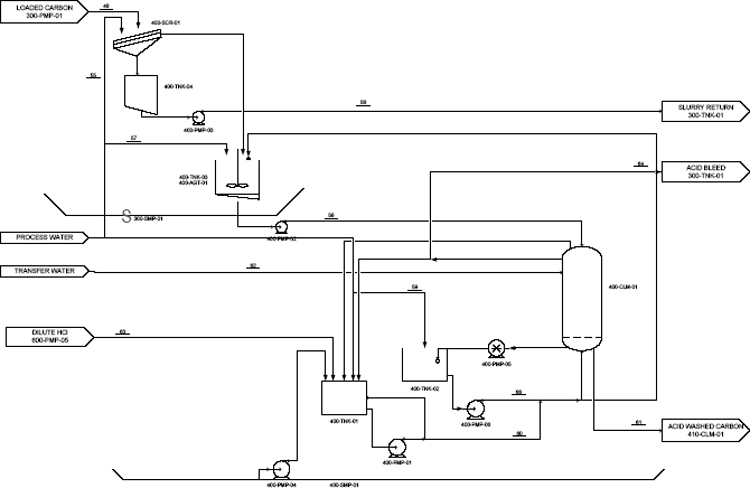
Figure 32.7. Process flow diagram for Area 400.
| | Page 207 |
| | NI43-101 ITR - Updated Mineral Resource Estimate for Buckreef Gold Project |
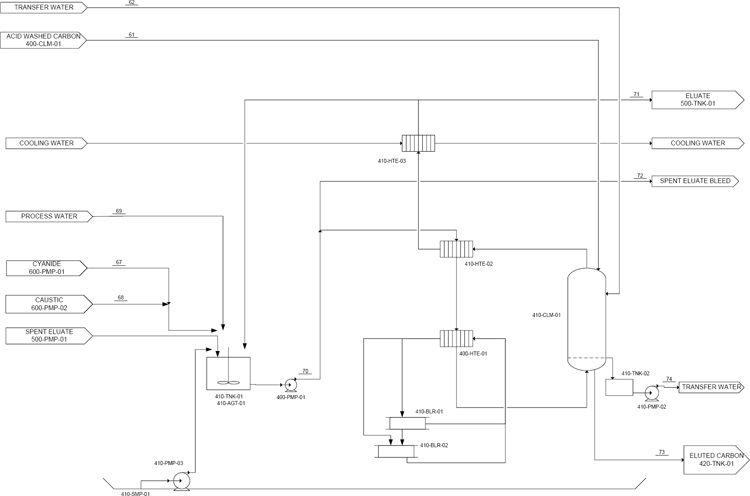
Figure 32.8. Process flow diagram for Area 410.
| | Page 208 |
| | NI43-101 ITR - Updated Mineral Resource Estimate for Buckreef Gold Project |
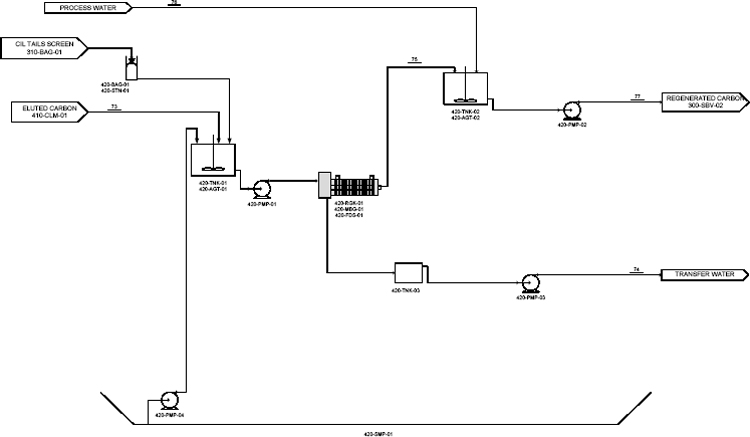
Figure 32.9. Process flow diagram for Area 420
| | Page 209 |
| | NI43-101 ITR - Updated Mineral Resource Estimate for Buckreef Gold Project |
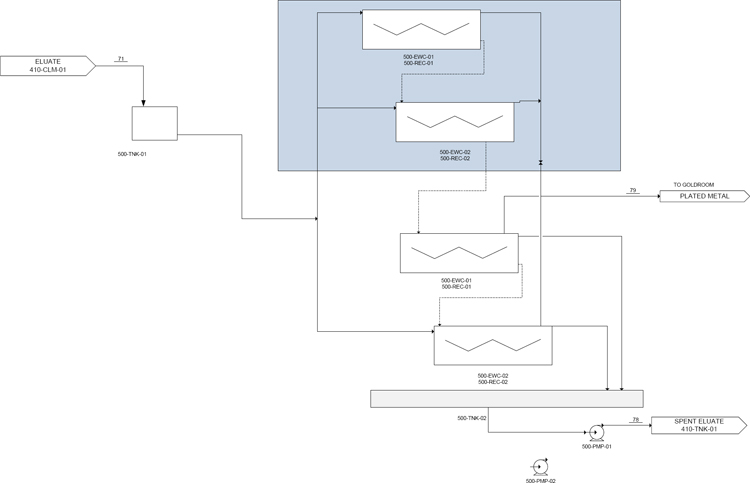
Figure 32.10. Process flow diagram for Area 500
| | Page 210 |
| | NI43-101 ITR - Updated Mineral Resource Estimate for Buckreef Gold Project |

Figure 32.11. Process flow diagram for Area 600
| | Page 211 |
| | NI43-101 ITR - Updated Mineral Resource Estimate for Buckreef Gold Project |
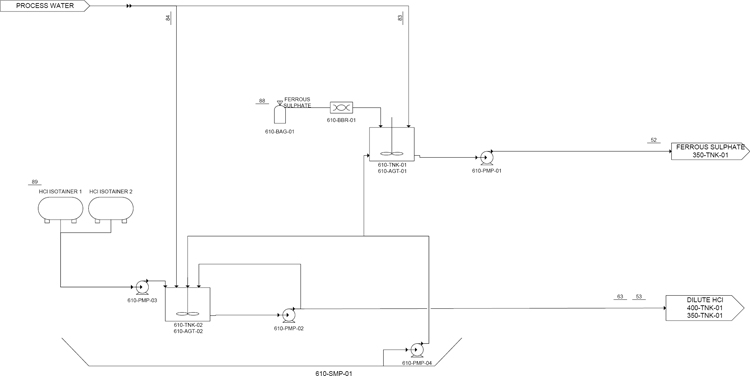
Figure 32.12. Process flow diagram for Area 610
| | Page 212 |
| | NI43-101 ITR - Updated Mineral Resource Estimate for Buckreef Gold Project |
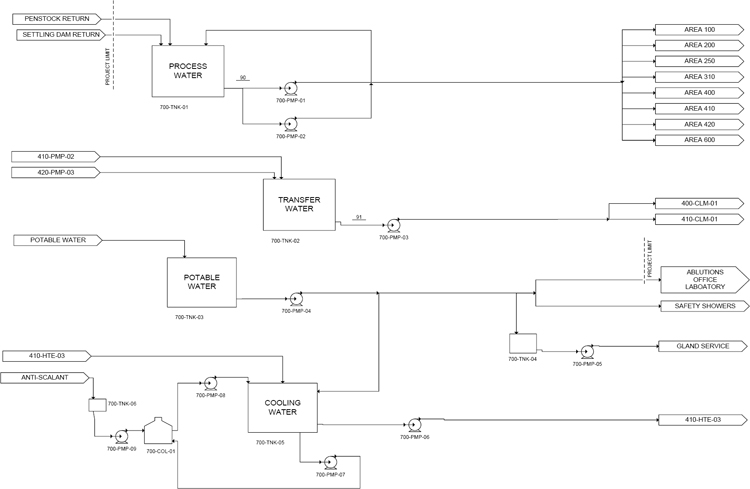
Figure 32.13. Process flow diagram for Area 700.
| | Page 213 |
| | NI43-101 ITR - Updated Mineral Resource Estimate for Buckreef Gold Project |
| 32.6 | PROCESSING PLANT MECHANICAL ITEMS |
| Volumetric | Design | |||||||
| Equipment Tag | Description | Total feed | flow | volume | Design Flow | |||
| Area | Description | Sequential number | t/h | m3/h | m3 | m3/h | t/h | |
| 100 | BIN | 01 | Feed Bin 1 | 31 | 17.6 | 22.0 | ||
| 100 | BIN | 02 | Feed Bin 2 | 31 | 17.6 | 22.0 | ||
| 100 | BIN | 03 | Jaw Crusher Discharge Overflow Bin | 67 | 35.3 | 43.0 | ||
| 100 | CHT | 01 | Rotaspiral 1 Feed Chute | 63 | 43.8 | 52.5 | ||
| 100 | CHT | 02 | Rotaspiral 2 Feed Chute | 63 | 43.8 | 52.5 | ||
| 100 | CRU | 01 | Jaw Crusher 1 | 67 | 35.3 | 103 | ||
| 100 | CRU | 02 | Jaw Crusher 2 | 67 | 35.3 | 103 | ||
| 100 | CON | 01 | Feed Bin 1 Conveyor | 31 | 17.6 | 38 | ||
| 100 | CON | 02 | Feed Bin 2 Conveyor | 31 | 17.6 | 38 | ||
| 100 | CON | 03 | Scrubbing Rotaspiral Oversize Conveyor | 67 | 35.3 | 80 | ||
| 100 | CON | 04 | Jaw Crusher Discharge Conveyor | 67 | 35.3 | 80 | ||
| 100 | CON | 05 | Mill Feed Conveyor | 89 | 45.8 | 107 | ||
| 100 | CON | 06 | Classification Rotaspiral Oversize Conveyor | 22 | 10.5 | 27 | ||
| 100 | FEL | 01 | ROM Front End Loader | |||||
| 100 | FEL | 02 | ROM Front End Loader | |||||
| 100 | MGT | 01 | Feed Bin 1 Conveyor Magnet | 31 | ||||
| 100 | MGT | 02 | Feed Bin 2 Conveyor Magnet | 31 | ||||
| 100 | MGT | 03 | Jaw Crusher Discharge Conveyor Magnet | 67 | ||||
| 100 | MIL | 01 | EDS Mill 1 | 42 | 51 | |||
| 100 | MIL | 02 | EDS Mill 2 | 42 | 51 | |||
| 100 | MMT | 01 | Feed Bin 1 Conveyor Weightometer | 31 | ||||
| 100 | MMT | 02 | Feed Bin 2 Conveyor Weightometer | 31 | ||||
| 100 | PMP | 01 | Scrubbing Rotaspiral 1 Underflow Pump | 50 | 38.5 | 47 | ||
| 100 | PMP | 02 | Scrubbing Rotaspiral 2 Underflow Pump | 50 | 38.5 | 47 | ||
| 100 | PMP | 03 | Classification Rotaspiral 1 Underflow Pump | 75 | 55.5 | 67 | ||
| 100 | PMP | 04 | Classification Rotaspiral 2 Underflow Pump | 75 | 55.5 | 67 | ||
| 100 | RSP | 01 | Scrubbing Rotaspiral 1 | 63 | 43.8 | 53 | 76 | |
| 100 | RSP | 02 | Scrubbing Rotaspiral 2 | 63 | 43.8 | 53 | 76 | |
| 100 | RSP | 03 | Classification Rotaspiral 1 | 82 | 55.9 | 68 | 99 | |
| 100 | RSP | 04 | Classification Rotaspiral 2 | 82 | 55.9 | 68 | 99 | |
| 100 | SPL | 01 | Jaw Crusher 2-way Splitter | 67 | 35.3 | 103 | ||
| 100 | SPL | 02 | EDS Mill 2-way Splitter | 89 | 45.8 | 107 | ||
| 100 | PMP | 05 | Standby 100-PMP-01/02 | |||||
| Volumetric | |||||||
| Equipment Tag | Description | Total feed | flow | Design Flow | |||
| Area | Description | Sequential number | t/h | m3/h | m3/h | t/h | |
| 200 | AGT | 01 | Gravity Feed Tank Agitator | ||||
| 200 | AGT | 02 | Gravity Concentrate Tank Agitator | ||||
| 200 | BAG | 1 | Gravity Concentrate | 2 | |||
| 200 | CNC | 01 | Gravity Concentrator 1 | 150 | 110.9 | 134 | 180 |
| 200 | CNC | 02 | Gravity Concentrator 2 | 150 | 110.9 | 134 | 180 |
| 200 | PMP | 01 | Gravity Feed Pump | 150 | 110.9 | 134 | |
| 200 | PMP | 02 | Gravity Concentrate Pump | 5 | 3.1 | 4 | |
| 200 | PMP | 03 | Shaking Table Sump Pump | 10.0 | 12 | ||
| 200 | PMP | 04 | Gravity Tails Pump | 153 | 108.3 | 131 | |
| 200 | SMP | 01 | Shaking Table Sump | ||||
| 200 | TBL | 01 | Shaking Table | 2.5 | |||
| 200 | TNK | 01 | Gravity Feed Tank | 150.0 | 110.9 | ||
| 200 | TNK | 02 | Gravity Tails Tank | 148.0 | 110.0 | ||
| 200 | TNK | 03 | Gravity Concentrate Tank | 5.0 | 3.1 | ||
| Equipment Tag | Description | Total feed | Volumetric flow | Design volume | Design Flow | |||
| Area | Description | Sequential number | t/h | m3/h | m3 | m3/h | t/h | |
| 250 | BOX | 01 | Thickener Feed Box | 137.3 | 93.4 | 0.5 | ||
| 250 | CYC | 01 | Dewatering Cyclone | 150.4 | 106.5 | |||
| 250 | MXR | 01 | Flocculant Mixer | |||||
| 250 | PMP | 01 | Thickener Underflow Pump | 118.1 | 79.8 | 96 | ||
| 250 | PMP | 02 | Thickener Underlow Pump (Standby) | 118.1 | 79.8 | 96 | ||
| 250 | PMP | 03 | Thickener Overflow Pump | 32.3 | 32.3 | 39 | ||
| 250 | THK | 01 | Hi-rate Thickener | 137.3 | 93.4 | |||
| 250 | TNK | 01 | Thickener Overflow Tank | 32.3 | 32.3 | 19.4 | ||
| | Page 214 |
| | NI43-101 ITR - Updated Mineral Resource Estimate for Buckreef Gold Project |
| Equipment Tag | Description | Total feed | Volumetric flow | Design volume | Design Flow | |||
| Area | Description | Sequential number | t/h | m3/h | m3 | m3/h | t/h | |
| 310 | BAG | 01 | CIL Tails Fine Carbon Collection Bag | 1.0 | ||||
| 310 | BOX | 01 | CIL Tails Screen Feed Box | 122 | 77.9 | 3.1 | ||
| 310 | PMP | 01 | CIL Tails Transfer Pump | 130 | 85.6 | 103 | ||
| 310 | SCR | 01 | CIL Tails Carbon Fine Screen | 122 | 77.9 | |||
| 310 | STN | 01 | CIL Tails Bag Stand | 1.0 | ||||
| 310 | TNK | 01 | CIL Tails Tank | 122 | 77.9 | 6.2 | ||
| Volumetric | Design | |||||||
| Equipment Tag | Description | Total feed | flow | volume | Design Flow | |||
| Area | Description | Sequential number | t/h | m3/h | m3 | m3/h | t/h | |
| 350 | AGT | 01 | Detox Tank2pt Agitator | 344.7 | ||||
| 350 | PMP | 01 | Detox Tank Discharge | 131 | 91.7 | 111 | ||
| 350 | PMP | 02 | Detox Spillage Pump | 10.0 | 12 | |||
| 350 | SSH | 01 | Detox Safety Shower | |||||
| 350 | SMP | 01 | Detox Spillage Sump | |||||
| 350 | TNK | 01 | Detox Tank | 130 | 85.6 | 344.7 | ||
| 350 | PMP | 03 | Standby 310/350 | |||||
| Volumetric | Design | |||||||
| Equipment Tag | Description | Total feed | flow | volume | Design Flow | |||
| Area | Description | Sequential number | t/h | m3/h | m3 | m3/h | t/h | |
| 400 | AGT | 01 | Loaded Carbon Tank Agitator | 11.3 | ||||
| 400 | CLM | 01 | Acid Wash Column | 4.4 | ||||
| 400 | PMP | 01 | Acid Wash Pump | 3.7 | 4.4 | |||
| 400 | PMP | 02 | Loaded Carbon Transfer Pump | 9.2 | 13.8 | |||
| 400 | PMP | 03 | Slurry Return Pump | 79.7 | 96 | |||
| 400 | PMP | 04 | Acid Wash Spillage Pump | 10.0 | 12 | |||
| 400 | PMP | 05 | Column Pump | 14.73 | 7.37 | 9 | ||
| 400 | PMP | 06 | Wash Water Pump | 3.7 | 5 | |||
| 400 | SCR | 01 | Loaded Carbon Screen | 69.8 | ||||
| 400 | SMP | 01 | Acid Wash Spillage Sump | |||||
| 400 | SSH | 01 | Safety Shower | |||||
| 400 | TNK | 01 | Acid Wash Tank | 3.68 | 3.6 | 21.1 | ||
| 400 | TNK | 02 | Wash Water Tank | 7.4 | 7.4 | 8.8 | ||
| 400 | TNK | 03 | Loaded Carbon Tank | 0.4 | 0.4 | 11.3 | ||
| 400 | TNK | 04 | Slurry Return Tank | 113.2 | 79.7 | 34.0 | ||
| Equipment Tag | Description | Total feed | Volumetric flow | Design volume | Design Flow | |||
| Area | Description | Sequential number | t/h | m3/h | m3 | m3/h | t/h | |
| 410 | AGT | 01 | Eluate Agitator | 21.1 | ||||
| 410 | BLR | 01 | Elution Boiler 1 | |||||
| 410 | BLR | 02 | Elution Boiler 2 | |||||
| 410 | CLM | 01 | Elution Column | 4.40 | ||||
| 410 | HTE | 01 | Primary Heat Exchanger | |||||
| 410 | HTE | 02 | Secondary Heat Exchanger | |||||
| 410 | HTE | 03 | Tertiary Heat Exchanger | |||||
| 410 | PMP | 01 | Elution Pump | 3.68 | 3.7 | 4.4 | ||
| 410 | PMP | 02 | Transfer Water Pump | 14.73 | 14.7 | 17.7 | ||
| 410 | PMP | 03 | Elution Spillage Pump | 10.0 | 12.0 | |||
| 410 | SMP | 01 | Elution Spillage Sump | |||||
| 410 | SSH | 01 | Safety Shower | |||||
| 410 | TNK | 01 | Elution Tank | 21.1 | ||||
| 410 | TNK | 02 | Transfer Water Tank | 7.37 | 7.4 | 4.4 | ||
| Equipment Tag | Description | Total feed | Volumetric flow | Design volume | Design Flow | |||
| Area | Description | Sequential number | t/h | m3/h | m3 | m3/h | t/h | |
| 420 | AGT | 01 | Eluted Carbon Tank Agitator | 20.1 | ||||
| 420 | AGT | 02 | Regenerated Carbon Agitator | 21.7 | ||||
| 420 | BAG | 01 | CIL Tails Carbon Bag | 1.0 | ||||
| 420 | FDS | 01 | Regeneration Kiln Screw Feeder | 0.4 | 0.4 | |||
| 420 | MBG | 01 | Kiln DC Drive | |||||
| 420 | PMP | 01 | Kiln Carbon Pump | 0.4 | 0.4 | 0.56 | ||
| 420 | PMP | 02 | Regeneration Carbon Pump | 0.4 | 0.4 | 0.56 | ||
| 420 | PMP | 03 | Water Transport Pump | 7.4 | 7.4 | 8.84 | ||
| 420 | PMP | 04 | Carbon Regeneration Sump Pump | 10.0 | 12.00 | |||
| 420 | RGK | 01 | Carbon Regeneration Kiln | 1.8 | 1.7 | |||
| 420 | SMP | 01 | Carbon Regeneration Sump | |||||
| 420 | STN | 01 | CIL Tails Carbon Bag Stand | 1.0 | ||||
| 420 | TNK | 01 | Eluted Carbon Tank | 9.2 | 8.4 | 20.1 | ||
| 420 | TNK | 02 | Regenerated Carbon Tank | 9.2 | 9.0 | 21.7 | ||
| 420 | TNK | 03 | Transfer Water Tank | 9.2 | 9.0 | 43.4 | ||
| | Page 215 |
| | NI43-101 ITR - Updated Mineral Resource Estimate for Buckreef Gold Project |
| Volumetric | Design | |||||||
| Equipment Tag | Description | Total feed | flow | volume | Design Flow | |||
| Area | Description | Sequential number | t/h | m3/h | m3 | m3/h | t/h | |
| 500 | EWC | 01 | Electrowinning Cell 1 | 1.8 | 1.8 | 26.5 | ||
| 500 | EWC | 02 | Electrowinning Cell 2 | 1.8 | 1.8 | 26.5 | ||
| 500 | PMP | 01 | Electrowinning Discharge Pump | 1.8 | 2.2 | |||
| 500 | REC | 01 | Electrowinning Rectifier 1 | 1.8 | 1.8 | |||
| 500 | REC | 02 | Electrowinning Rectifier 2 | 1.8 | 1.8 | |||
| 500 | TNK | 01 | Electrowinning Overflow Discharge Tank | 1.8 | 26.5 | |||
| 500 | PMP | 02 | Standby 500/420 | |||||
| | Page 216 |
| | NI43-101 ITR - Updated Mineral Resource Estimate for Buckreef Gold Project |
| Volumetric | Design | |||||||
| Equipment Tag | Description | Total feed | flow | volume | Design Flow | |||
| Area | Description | Sequential number | t/h | m3/h | m3 | m3/h | t/h | |
| 600 | AGT | 01 | Cyanide Make-up Agitator | 14.8 | ||||
| 600 | AGT | 02 | Caustic Make-up Agitator | 15.8 | ||||
| 600 | AGT | 03 | Lime Make-up Agitator | 24.9 | ||||
| 600 | AGT | 04 | Cyanide Tank Agitator | 14.8 | ||||
| 600 | AGT | 05 | Lime Tank Agitator | 24.9 | ||||
| 600 | BAG | 01 | Sodium Cyanide Reagent | 12.0 | ||||
| 600 | BAG | 02 | Caustic Reagent | 6.0 | ||||
| 600 | BAG | 03 | Lime (Calcium Oxide) Reagent | 6.0 | ||||
| 600 | BBR | 01 | Bag Breaker Cyanide | |||||
| 600 | BBR | 02 | Bag Breaker Caustic | |||||
| 600 | BBR | 03 | Bag Breaker Lime | |||||
| 600 | PMP | 01 | Cyanide Make-Up Pump | 3.1 | 3.39 | |||
| 600 | PMP | 02 | Caustic Pump | 6.6 | 7.92 | |||
| 600 | PMP | 03 | Lime Make-Up Pump | 20.7 | 24.88 | |||
| 600 | PMP | 04 | Cyanide Pump | |||||
| 600 | PMP | 05 | Lime Pump | |||||
| 600 | PMP | 06 | Base Sump Pump | 10.0 | 12.00 | |||
| 600 | SMP | 01 | Base Sump | |||||
| 600 | SSH | 02 | Base Safety Shower | |||||
| 600 | TNK | 01 | Cyanide Make-up Tank | 0.5 | 14.8 | |||
| 600 | TNK | 02 | Caustic Make-up Tank | 1.1 | 15.8 | |||
| 600 | TNK | 03 | Lime Make-up Tank | 3.5 | 24.9 | |||
| 600 | TNK | 04 | Cyanide Tank | 14.7744 | 0 | 0 | ||
| 600 | TNK | 05 | Lime Tank | 24.8832 | 0 | 0 | ||
| 610 | AGT | 01 | Ferrous Sulphate Agitator | 22.9 | ||||
| 610 | AGT | 02 | Acid Agitator | 8.7 | ||||
| 610 | BAG | 01 | Ferrous Sulphate Reagent | 12.0 | ||||
| 610 | BBR | 01 | Bag Breaker Ferrous Sulphate | |||||
| 610 | PMP | 01 | Ferrous Sulphate Tank Pump | 1.6 | 1.91 | |||
| 610 | PMP | 02 | Dilute Acid Pump | 3.6 | 4.37 | |||
| 610 | PMP | 03 | Concentrate Acid Pump | 1.1 | 1.34 | |||
| 610 | PMP | 04 | Acid Sump Pump | 10.0 | 12.00 | |||
| 610 | SMP | 01 | Acid Sump | |||||
| 610 | SSH | 01 | Acid Safety Shower | |||||
| 610 | TNK | 01 | Ferrous Sulphate Make-Up Tank | 0.8 | 22.9 | |||
| 610 | TNK | 02 | Dilute Acid Tank | 3.6 | 8.7 | |||
| Equipment Tag | Description | Total feed | Volumetric flow | Design volume | Design Flow | |||
| Area | Description | Sequential number | t/h | m3/h | m3 | m3/h | t/h | |
| 700 | PMP | 01 | Process Water Pump | 107 | 128.9 | |||
| 700 | PMP | 02 | Process Water Pump (Stand-by) | 107 | 128.9 | |||
| 700 | PMP | 03 | Transfer Water Pump | 7 | 8.84 | |||
| 700 | PMP | 04 | Potable Water Pump | |||||
| 700 | PMP | 05 | Gland Water Pump | |||||
| 700 | PMP | 06 | Cooling Water Pump | |||||
| 700 | PMP | 07 | Cooling Tower Feed Pump | |||||
| 700 | PMP | 08 | Cooling Tower Return Pump | |||||
| 700 | PMP | 09 | Anti-Scalant Pump | |||||
| 700 | TNK | 01 | Process Water Tank | 107 | 107 | 257.7 | ||
| 700 | TNK | 02 | Transfer Water Tank | 7 | 7 | 8.8 | ||
| 700 | TNK | 03 | Potable Water Tank | 20 | ||||
| 700 | TNK | 04 | Gland Water Tank | 5 | ||||
| 700 | TNK | 05 | Cooling Water Tank | 20 | ||||
| 700 | TNK | 06 | Anti-Scalant Tank | 5 | ||||
| | Page 217 |
| | NI43-101 ITR - Updated Mineral Resource Estimate for Buckreef Gold Project |
| 32.7 | TABLES APPENDICES |
Table 32.1: Buckreef Project Full Schedule of Mined Tonnages
| TRX Mine Plan 2019 | |||||||||||||||||
| YEAR | 1 | 2 | 3 | 4 | 5 | 6 | 7 | 8 | 9 | 10 | 11 | 12 | 13 | 14 | 15 | 16 | Total |
| MINING Summary | |||||||||||||||||
| Oxide Ore (Tonnes) | 274,483 | 256,217 | 79,578 | 109,536 | 38,713 | 30,525 | 159,318 | 64,833 | 320,880 | 117,506 | 16,298 | 1,232 | 40,585 | - | - | - | - |
| Oxide Ore (g/t) | 2.04 | 1.53 | 1.13 | 0.89 | 0.70 | 1.22 | 1.02 | 2.08 | 1.98 | 3.92 | 0.74 | 0.79 | 2.11 | - | - | - | - |
| Oxide Waste | 2,713,383 | 1,442,951 | 2,086,748 | 597,909 | 191,169 | 1,550,517 | 2,085,844 | 2,140,360 | 1,978,185 | 3,322,567 | 918,366 | 81,707 | 1,045,748 | - | - | - | - |
| Oxide Ore & Waste | 2,987,867 | 1,699,167 | 2,166,326 | 707,445 | 229,881 | 1,581,042 | 2,245,162 | 2,205,193 | 2,299,065 | 3,440,074 | 934,664 | 82,939 | 1,086,332 | - | - | - | - |
| Trans Ore (Tonnes) | 91,927 | 191,820 | 149,582 | 93,467 | 92,763 | 91,086 | 40,183 | 21,171 | 81,587 | 341,223 | 255,904 | 51,915 | 17,472 | - | - | - | - |
| Trans Ore (g/t) | 2.18 | 2.86 | 1.63 | 0.87 | 1.01 | 1.01 | 1.57 | 1.04 | 1.05 | 3.10 | 1.29 | 0.91 | 2.72 | - | - | - | - |
| Trans Waste | 1,296,460 | 1,097,386 | 2,134,297 | 1,410,330 | 732,696 | 1,524,586 | 1,929,790 | 1,276,813 | 1,629,170 | 2,700,193 | 2,878,323 | 1,367,761 | 367,706 | - | - | - | - |
| Trans Ore & Waste | 1,388,387 | 1,289,207 | 2,283,879 | 1,503,798 | 825,459 | 1,615,673 | 1,969,973 | 1,297,984 | 1,710,757 | 3,041,416 | 3,134,227 | 1,419,675 | 385,177 | - | - | - | - |
| Hard Ore (Tonnes) | 42,968 | 186,569 | 346,182 | 554,797 | 1,246,759 | 1,522,363 | 1,269,055 | 1,262,780 | 1,059,983 | 1,122,314 | 1,091,578 | 1,439,843 | 1,496,521 | 1,386,337 | 1,110,020 | 915,073 | - |
| Hard Ore (g/t) | 1.37 | 2.14 | 1.73 | 1.49 | 1.63 | 1.48 | 1.29 | 1.86 | 1.57 | 1.26 | 1.31 | 1.22 | 1.29 | 1.65 | 1.41 | 1.70 | - |
| Hard Waste | 508,278 | 1,766,057 | 4,054,862 | 6,824,336 | 7,781,025 | 6,839,042 | 7,984,725 | 9,294,444 | 14,640,194 | 12,160,196 | 14,549,531 | 15,490,042 | 12,148,632 | 12,887,663 | 13,175,550 | 1,102,370 | - |
| Hard Ore & Waste | 551,246 | 1,952,626 | 4,401,044 | 7,379,132 | 9,027,784 | 8,361,405 | 9,253,780 | 10,557,224 | 15,700,177 | 13,282,510 | 15,641,109 | 16,929,886 | 13,645,153 | 14,273,999 | 14,285,570 | 2,017,443 | - |
| Total Ore (Tonnes) | 409,378 | 634,606 | 575,342 | 757,800 | 1,378,235 | 1,643,974 | 1,468,556 | 1,348,784 | 1,462,450 | 1,581,043 | 1,363,781 | 1,492,990 | 1,554,578 | 1,386,337 | 1,110,020 | 915,073 | - |
| Total Ore (g/t) | 2.00 | 2.11 | 1.62 | 1.33 | 1.56 | 1.45 | 1.27 | 1.85 | 1.63 | 1.85 | 1.30 | 1.21 | 1.32 | 1.65 | 1.41 | 1.70 | - |
| Total Waste | 4,518,121 | 4,306,394 | 8,275,908 | 8,832,575 | 8,704,890 | 9,914,145 | 12,000,359 | 12,711,617 | 18,247,549 | 18,182,956 | 18,346,219 | 16,939,510 | 13,562,085 | 12,887,663 | 13,175,550 | 1,102,370 | - |
| Total Ore & Waste | 4,927,500 | 4,941,000 | 8,851,250 | 9,590,375 | 10,083,125 | 11,558,119 | 13,468,915 | 14,060,401 | 19,709,999 | 19,763,999 | 19,709,999 | 18,432,500 | 15,116,663 | 14,273,999 | 14,285,570 | 2,017,443 | - |
| MILL FEED Summary | |||||||||||||||||
| Oxide Ore (Tonnes) | 348,730 | 187,710 | 57,425 | 208,941 | 73,014 | 29,574 | 159,318 | 66,452 | 308,940 | 117,506 | 21,063 | - | 40,585 | 2,241 | 7,930 | - | 1,629,430 |
| Oxide Ore (g/t) | 2.00 | 1.40 | 1.24 | 1.28 | 1.17 | 1.20 | 1.02 | 2.07 | 1.98 | 3.92 | 0.97 | - | 2.11 | 1.65 | 1.65 | - | 1.79 |
| Trans Ore (Tonnes) | 91,927 | 150,814 | 136,218 | 133,167 | 106,462 | 77,843 | 40,183 | 27,971 | 81,587 | 308,576 | 269,834 | 51,538 | 17,472 | 5,842 | 20,668 | - | 1,520,100 |
| Trans Ore (g/t) | 2.18 | 2.68 | 1.72 | 1.46 | 1.25 | 1.01 | 1.57 | 1.06 | 1.05 | 3.27 | 1.30 | 0.92 | 2.72 | 1.41 | 1.41 | - | 1.92 |
| Hard Ore (Tonnes) | 42,968 | 146,426 | 289,982 | 625,143 | 1,271,034 | 1,347,066 | 1,251,009 | 1,356,088 | 1,059,983 | 1,028,401 | 1,159,613 | 1,398,972 | 1,392,453 | 1,446,401 | 1,322,530 | 915,073 | 16,053,143 |
| Hard Ore (g/t) | 1.37 | 2.15 | 1.69 | 1.55 | 1.63 | 1.39 | 1.25 | 1.89 | 1.57 | 1.26 | 1.34 | 1.23 | 1.31 | 1.64 | 1.40 | 1.70 | 1.48 |
| 483,625 | 484,950 | 483,625 | 967,250 | 1,450,510 | 1,454,484 | 1,450,510 | 1,450,510 | 1,450,510 | 1,454,484 | 1,450,510 | 1,450,510 | 1,450,510 | 1,454,484 | - | - | - | |
| Total Ore (Tonnes) | 483,625 | 484,950 | 483,625 | 967,250 | 1,450,510 | 1,454,484 | 1,450,510 | 1,450,510 | 1,450,510 | 1,454,484 | 1,450,510 | 1,450,510 | 1,450,510 | 1,454,484 | 1,351,128 | 915,073 | 19,202,673 |
| Hard Ore (g/t) | 1.98 | 2.02 | 1.64 | 1.48 | 1.58 | 1.37 | 1.23 | 1.88 | 1.63 | 1.90 | 1.33 | 1.22 | 1.35 | 1.64 | 1.40 | 1.70 | 1.54 |
| Oz Fed to Plant | 30,748 | 31,540 | 25,534 | 45,975 | 73,767 | 64,004 | 57,394 | 87,814 | 75,987 | 88,989 | 61,959 | 56,839 | 62,911 | 76,537 | 60,916 | 50,091 | 951,012 |
| Oxide Waste | 2,713,383 | 1,442,951 | 2,086,748 | 597,909 | 191,169 | 1,550,517 | 2,085,844 | 2,140,360 | 1,978,185 | 3,322,567 | 918,366 | 81,707 | 1,045,748 | - | - | - | - |
| Trans Waste | 1,296,460 | 1,097,386 | 2,134,297 | 1,410,330 | 732,696 | 1,524,586 | 1,929,790 | 1,276,813 | 1,629,170 | 2,700,193 | 2,878,323 | 1,367,761 | 367,706 | - | - | - | - |
| Hard Waste | 508,278 | 1,766,057 | 4,054,862 | 6,824,336 | 7,781,025 | 6,839,042 | 7,984,725 | 9,294,444 | 14,640,194 | 12,160,196 | 14,549,531 | 15,490,042 | 12,148,632 | 12,887,663 | 13,175,550 | 1,102,370 | - |
| Total | 4,518,121 | 4,306,394 | 8,275,908 | 8,832,575 | 8,704,890 | 9,914,145 | 12,000,359 | 12,711,617 | 18,247,549 | 18,182,956 | 18,346,219 | 16,939,510 | 13,562,085 | 12,887,663 | 13,175,550 | 1,102,370 | - |
| SR | 9.34 | 8.88 | 17.11 | 9.13 | 6.00 | 6.82 | 8.27 | 8.76 | 12.58 | 12.50 | 12.65 | 11.68 | 9.35 | 8.86 | 9.75 | 1.20 | 9.56 |
| | Page 218 |
| | NI43-101 ITR - Updated Mineral Resource Estimate for Buckreef Gold Project |
Table 32.1: Buckreef Project Full Schedule of Mined Tonnages
| TRX Mine Plan 2019 | |||||||||||||||||
| YEAR | 1 | 2 | 3 | 4 | 5 | 6 | 7 | 8 | 9 | 10 | 11 | 12 | 13 | 14 | 15 | 16 | Total |
| MINING Summary | |||||||||||||||||
| Oxide Ore (Tonnes) | 274,483 | 256,217 | 79,578 | 109,536 | 38,713 | 30,525 | 159,318 | 64,833 | 320,880 | 117,506 | 16,298 | 1,232 | 40,585 | - | - | - | - |
| Oxide Ore (g/t) | 2.04 | 1.53 | 1.13 | 0.89 | 0.70 | 1.22 | 1.02 | 2.08 | 1.98 | 3.92 | 0.74 | 0.79 | 2.11 | - | - | - | - |
| Oxide Waste | 2,713,383 | 1,442,951 | 2,086,748 | 597,909 | 191,169 | 1,550,517 | 2,085,844 | 2,140,360 | 1,978,185 | 3,322,567 | 918,366 | 81,707 | 1,045,748 | - | - | - | - |
| Oxide Ore & Waste | 2,987,867 | 1,699,167 | 2,166,326 | 707,445 | 229,881 | 1,581,042 | 2,245,162 | 2,205,193 | 2,299,065 | 3,440,074 | 934,664 | 82,939 | 1,086,332 | - | - | - | - |
| Trans Ore (Tonnes) | 91,927 | 191,820 | 149,582 | 93,467 | 92,763 | 91,086 | 40,183 | 21,171 | 81,587 | 341,223 | 255,904 | 51,915 | 17,472 | - | - | - | - |
| Trans Ore (g/t) | 2.18 | 2.86 | 1.63 | 0.87 | 1.01 | 1.01 | 1.57 | 1.04 | 1.05 | 3.10 | 1.29 | 0.91 | 2.72 | - | - | - | - |
| Trans Waste | 1,296,460 | 1,097,386 | 2,134,297 | 1,410,330 | 732,696 | 1,524,586 | 1,929,790 | 1,276,813 | 1,629,170 | 2,700,193 | 2,878,323 | 1,367,761 | 367,706 | - | - | - | - |
| Trans Ore & Waste | 1,388,387 | 1,289,207 | 2,283,879 | 1,503,798 | 825,459 | 1,615,673 | 1,969,973 | 1,297,984 | 1,710,757 | 3,041,416 | 3,134,227 | 1,419,675 | 385,177 | - | - | - | - |
| Hard Ore (Tonnes) | 42,968 | 186,569 | 346,182 | 554,797 | 1,246,759 | 1,522,363 | 1,269,055 | 1,262,780 | 1,059,983 | 1,122,314 | 1,091,578 | 1,439,843 | 1,496,521 | 1,386,337 | 1,110,020 | 915,073 | - |
| Hard Ore (g/t) | 1.37 | 2.14 | 1.73 | 1.49 | 1.63 | 1.48 | 1.29 | 1.86 | 1.57 | 1.26 | 1.31 | 1.22 | 1.29 | 1.65 | 1.41 | 1.70 | - |
| Hard Waste | 508,278 | 1,766,057 | 4,054,862 | 6,824,336 | 7,781,025 | 6,839,042 | 7,984,725 | 9,294,444 | 14,640,194 | 12,160,196 | 14,549,531 | 15,490,042 | 12,148,632 | 12,887,663 | 13,175,550 | 1,102,370 | - |
| Hard Ore & Waste | 551,246 | 1,952,626 | 4,401,044 | 7,379,132 | 9,027,784 | 8,361,405 | 9,253,780 | 10,557,224 | 15,700,177 | 13,282,510 | 15,641,109 | 16,929,886 | 13,645,153 | 14,273,999 | 14,285,570 | 2,017,443 | - |
| Total Ore (Tonnes) | 409,378 | 634,606 | 575,342 | 757,800 | 1,378,235 | 1,643,974 | 1,468,556 | 1,348,784 | 1,462,450 | 1,581,043 | 1,363,781 | 1,492,990 | 1,554,578 | 1,386,337 | 1,110,020 | 915,073 | - |
| Total Ore (g/t) | 2.00 | 2.11 | 1.62 | 1.33 | 1.56 | 1.45 | 1.27 | 1.85 | 1.63 | 1.85 | 1.30 | 1.21 | 1.32 | 1.65 | 1.41 | 1.70 | - |
| Total Waste | 4,518,121 | 4,306,394 | 8,275,908 | 8,832,575 | 8,704,890 | 9,914,145 | 12,000,359 | 12,711,617 | 18,247,549 | 18,182,956 | 18,346,219 | 16,939,510 | 13,562,085 | 12,887,663 | 13,175,550 | 1,102,370 | - |
| Total Ore & Waste | 4,927,500 | 4,941,000 | 8,851,250 | 9,590,375 | 10,083,125 | 11,558,119 | 13,468,915 | 14,060,401 | 19,709,999 | 19,763,999 | 19,709,999 | 18,432,500 | 15,116,663 | 14,273,999 | 14,285,570 | 2,017,443 | - |
| MILL FEED Summary | |||||||||||||||||
| Oxide Ore (Tonnes) | 348,730 | 187,710 | 57,425 | 208,941 | 73,014 | 29,574 | 159,318 | 66,452 | 308,940 | 117,506 | 21,063 | - | 40,585 | 2,241 | 7,930 | - | 1,629,430 |
| Oxide Ore (g/t) | 2.00 | 1.40 | 1.24 | 1.28 | 1.17 | 1.20 | 1.02 | 2.07 | 1.98 | 3.92 | 0.97 | - | 2.11 | 1.65 | 1.65 | - | 1.79 |
| Trans Ore (Tonnes) | 91,927 | 150,814 | 136,218 | 133,167 | 106,462 | 77,843 | 40,183 | 27,971 | 81,587 | 308,576 | 269,834 | 51,538 | 17,472 | 5,842 | 20,668 | - | 1,520,100 |
| Trans Ore (g/t) | 2.18 | 2.68 | 1.72 | 1.46 | 1.25 | 1.01 | 1.57 | 1.06 | 1.05 | 3.27 | 1.30 | 0.92 | 2.72 | 1.41 | 1.41 | - | 1.92 |
| Hard Ore (Tonnes) | 42,968 | 146,426 | 289,982 | 625,143 | 1,271,034 | 1,347,066 | 1,251,009 | 1,356,088 | 1,059,983 | 1,028,401 | 1,159,613 | 1,398,972 | 1,392,453 | 1,446,401 | 1,322,530 | 915,073 | 16,053,143 |
| Hard Ore (g/t) | 1.37 | 2.15 | 1.69 | 1.55 | 1.63 | 1.39 | 1.25 | 1.89 | 1.57 | 1.26 | 1.34 | 1.23 | 1.31 | 1.64 | 1.40 | 1.70 | 1.48 |
| 483,625 | 484,950 | 483,625 | 967,250 | 1,450,510 | 1,454,484 | 1,450,510 | 1,450,510 | 1,450,510 | 1,454,484 | 1,450,510 | 1,450,510 | 1,450,510 | 1,454,484 | - | - | - | |
| Total Ore (Tonnes) | 483,625 | 484,950 | 483,625 | 967,250 | 1,450,510 | 1,454,484 | 1,450,510 | 1,450,510 | 1,450,510 | 1,454,484 | 1,450,510 | 1,450,510 | 1,450,510 | 1,454,484 | 1,351,128 | 915,073 | 19,202,673 |
| Hard Ore (g/t) | 1.98 | 2.02 | 1.64 | 1.48 | 1.58 | 1.37 | 1.23 | 1.88 | 1.63 | 1.90 | 1.33 | 1.22 | 1.35 | 1.64 | 1.40 | 1.70 | 1.54 |
| Oz Fed to Plant | 30,748 | 31,540 | 25,534 | 45,975 | 73,767 | 64,004 | 57,394 | 87,814 | 75,987 | 88,989 | 61,959 | 56,839 | 62,911 | 76,537 | 60,916 | 50,091 | 951,012 |
| Oxide Waste | 2,713,383 | 1,442,951 | 2,086,748 | 597,909 | 191,169 | 1,550,517 | 2,085,844 | 2,140,360 | 1,978,185 | 3,322,567 | 918,366 | 81,707 | 1,045,748 | - | - | - | - |
| Trans Waste | 1,296,460 | 1,097,386 | 2,134,297 | 1,410,330 | 732,696 | 1,524,586 | 1,929,790 | 1,276,813 | 1,629,170 | 2,700,193 | 2,878,323 | 1,367,761 | 367,706 | - | - | - | - |
| Hard Waste | 508,278 | 1,766,057 | 4,054,862 | 6,824,336 | 7,781,025 | 6,839,042 | 7,984,725 | 9,294,444 | 14,640,194 | 12,160,196 | 14,549,531 | 15,490,042 | 12,148,632 | 12,887,663 | 13,175,550 | 1,102,370 | - |
| Total | 4,518,121 | 4,306,394 | 8,275,908 | 8,832,575 | 8,704,890 | 9,914,145 | 12,000,359 | 12,711,617 | 18,247,549 | 18,182,956 | 18,346,219 | 16,939,510 | 13,562,085 | 12,887,663 | 13,175,550 | 1,102,370 | - |
| SR | 9.34 | 8.88 | 17.11 | 9.13 | 6.00 | 6.82 | 8.27 | 8.76 | 12.58 | 12.50 | 12.65 | 11.68 | 9.35 | 8.86 | 9.75 | 1.20 | 9.56 |
| | Page 219 |
| | NI43-101 ITR - Updated Mineral Resource Estimate for Buckreef Gold Project |
Table 32.2 Buckreef Project Summary of Schedule of Milled Tonnages
| Period | 1 | 2 | 3 | 4 | 5 | 6 | 7 | 8 | 9 | 10 | 11 | 12 | 13 | 14 | 15 | 16 |
| MINING Summary | ||||||||||||||||
| Oxide Ore (Tonnes) | 274 | 256 | 80 | 110 | 39 | 31 | 159 | 65 | 321 | 118 | 16 | 1 | 41 | - | - | - |
| Oxide Ore (g/t) | 2.04 | 1.53 | 1.13 | 0.89 | 0.70 | 1.22 | 1.02 | 2.08 | 1.98 | 3.92 | 0.74 | 0.79 | 2.11 | - | - | - |
| Oxide Waste | 2,713 | 1,443 | 2,087 | 598 | 191 | 1,551 | 2,086 | 2,140 | 1,978 | 3,323 | 918 | 82 | 1,046 | - | - | - |
| Oxide Ore & Waste | 2,988 | 1,699 | 2,166 | 707 | 230 | 1,581 | 2,245 | 2,205 | 2,299 | 3,440 | 935 | 83 | 1,086 | - | - | - |
| Trans Ore (Tonnes) | 92 | 192 | 150 | 93 | 93 | 91 | 40 | 21 | 82 | 341 | 256 | 52 | 17 | - | - | - |
| Trans Ore (g/t) | 2.18 | 2.86 | 1.63 | 0.87 | 1.01 | 1.01 | 1.57 | 1.04 | 1.05 | 3.10 | 1.29 | 0.91 | 2.72 | - | - | - |
| Trans Waste | 1,296 | 1,097 | 2,134 | 1,410 | 733 | 1,525 | 1,930 | 1,277 | 1,629 | 2,700 | 2,878 | 1,368 | 368 | - | - | - |
| Trans Ore & Waste | 1,388 | 1,289 | 2,284 | 1,504 | 825 | 1,616 | 1,970 | 1,298 | 1,711 | 3,041 | 3,134 | 1,420 | 385 | - | - | - |
| Hard Ore (Tonnes) | 43 | 187 | 346 | 555 | 1,247 | 1,522 | 1,269 | 1,263 | 1,060 | 1,122 | 1,092 | 1,440 | 1,497 | 1,386 | 1,110 | 915 |
| Hard Ore (g/t) | 1.37 | 2.14 | 1.73 | 1.49 | 1.63 | 1.48 | 1.29 | 1.86 | 1.57 | 1.26 | 1.31 | 1.22 | 1.29 | 1.65 | 1.41 | 1.70 |
| Hard Waste | 508 | 1,766 | 4,055 | 6,824 | 7,781 | 6,839 | 7,985 | 9,294 | 14,640 | 12,160 | 14,550 | 15,490 | 12,149 | 12,888 | 13,176 | 1,102 |
| Hard Ore & Waste | 551 | 1,953 | 4,401 | 7,379 | 9,028 | 8,361 | 9,254 | 10,557 | 15,700 | 13,283 | 15,641 | 16,930 | 13,645 | 14,274 | 14,286 | 2,017 |
| Total Ore (Tonnes) | 409 | 635 | 575 | 758 | 1,378 | 1,644 | 1,469 | 1,349 | 1,462 | 1,581 | 1,364 | 1,493 | 1,555 | 1,386 | 1,110 | 915 |
| Total Ore (g/t) | 2.00 | 2.11 | 1.62 | 1.33 | 1.56 | 1.45 | 1.27 | 1.85 | 1.63 | 1.85 | 1.30 | 1.21 | 1.32 | 1.65 | 1.41 | 1.70 |
| Total Waste | 4,518 | 4,306 | 8,276 | 8,833 | 8,705 | 9,914 | 12,000 | 12,712 | 18,248 | 18,183 | 18,346 | 16,940 | 13,562 | 12,888 | 13,176 | 1,102 |
| Total Ore & Waste | 4,927 | 4,941 | 8,851 | 9,590 | 10,083 | 11,558 | 13,469 | 14,060 | 19,710 | 19,764 | 19,710 | 18,432 | 15,117 | 14,274 | 14,286 | 2,017 |
| MILL FEED Summary | ||||||||||||||||
| Oxide Ore (Tonnes) | 349 | 188 | 57 | 209 | 73 | 30 | 159 | 66 | 309 | 118 | 21 | - | 41 | 2 | 8 | - |
| Oxide Ore (g/t) | 2.00 | 1.40 | 1.24 | 1.28 | 1.17 | 1.20 | 1.02 | 2.07 | 1.98 | 3.92 | 0.97 | - | 2.11 | 1.65 | 1.65 | - |
| Trans Ore (Tonnes) | 92 | 151 | 136 | 133 | 106 | 78 | 40 | 28 | 82 | 309 | 270 | 52 | 17 | 6 | 21 | - |
| Trans Ore (g/t) | 2.18 | 2.68 | 1.72 | 1.46 | 1.25 | 1.01 | 1.57 | 1.06 | 1.05 | 3.27 | 1.30 | 0.92 | 2.72 | 1.41 | 1.41 | - |
| Hard Ore (Tonnes) | 43 | 146 | 290 | 625 | 1,271 | 1,347 | 1,251 | 1,356 | 1,060 | 1,028 | 1,160 | 1,399 | 1,392 | 1,446 | 1,323 | 915 |
| Hard Ore (g/t) | 1.37 | 2.15 | 1.69 | 1.55 | 1.63 | 1.39 | 1.25 | 1.89 | 1.57 | 1.26 | 1.34 | 1.23 | 1.31 | 1.64 | 1.40 | 1.70 |
| 484 | 485 | 484 | 967 | 1,451 | 1,454 | 1,451 | 1,451 | 1,451 | 1,454 | 1,451 | 1,451 | 1,451 | 1,454 | 1,351 | 915 | |
| Total Ore (Tonnes) | 484 | 485 | 484 | 967 | 1,451 | 1,454 | 1,451 | 1,451 | 1,451 | 1,454 | 1,451 | 1,451 | 1,451 | 1,454 | 1,351 | 915 |
| Hard Ore (g/t) | 1.98 | 2.02 | 1.64 | 1.48 | 1.58 | 1.37 | 1.23 | 1.88 | 1.63 | 1.90 | 1.33 | 1.22 | 1.35 | 1.64 | 1.40 | 1.70 |
| Oz Fed to Plant | 31 | 32 | 26 | 46 | 74 | 64 | 57 | 88 | 76 | 89 | 62 | 57 | 63 | 77 | 61 | 50 |
| Oxide Waste | 2,713 | 1,443 | 2,087 | 598 | 191 | 1,551 | 2,086 | 2,140 | 1,978 | 3,323 | 918 | 82 | 1,046 | - | - | - |
| Trans Waste | 1,296 | 1,097 | 2,134 | 1,410 | 733 | 1,525 | 1,930 | 1,277 | 1,629 | 2,700 | 2,878 | 1,368 | 368 | - | - | - |
| Hard Waste | 508 | 1,766 | 4,055 | 6,824 | 7,781 | 6,839 | 7,985 | 9,294 | 14,640 | 12,160 | 14,550 | 15,490 | 12,149 | 12,888 | 13,176 | 1,102 |
| | Page 220 |
| | NI43-101 ITR - Updated Mineral Resource Estimate for Buckreef Gold Project |
Table 32.3: Full Schedule of Staffing Requirements of the Buckreef Project
| 2019 | 2020 | 2021 | 2022 | 2023 | 2024 | 2025 | 2026 | 2027 | 2028 | 2029 | 2030 | 2031 | 2032 | 2033 | 2034 | 2035 | |||
| MANAGEMENT | (US$) | ||||||||||||||||||
| Chief Operating Officer | M | 120,000 | 1 | 1 | 1 | 1 | 1 | 1 | 1 | 1 | 1 | 1 | 1 | 1 | 1 | 1 | 1 | 1 | 1 |
| General Manager | 0 | 0 | 0 | 0 | 0 | 0 | 0 | 0 | 0 | 0 | 0 | 0 | 0 | 0 | 0 | 0 | 0 | 0 | |
| Executive Secretary | S | 42,000 | 1 | 1 | 1 | 1 | 1 | 1 | 1 | 1 | 1 | 1 | 1 | 1 | 1 | 1 | 1 | 1 | 1 |
| TOTAL | 162,000 | 2 | 2 | 2 | 2 | 2 | 2 | 2 | 2 | 2 | 2 | 2 | 2 | 2 | 2 | 2 | 2 | 2 | |
| MINE OPERATION | |||||||||||||||||||
| Mine /Production Manager | M | 72,000 | 1 | 1 | 1 | 1 | 1 | 1 | 1 | 1 | 1 | 1 | 1 | 1 | 1 | 1 | 1 | 1 | |
| Pit Superintendent | 0 | 0 | 0 | 0 | 0 | 0 | 0 | 0 | 0 | 0 | 0 | 0 | 0 | 0 | 0 | 0 | 0 | ||
| Shift Supervisor | S | 12,000 | 2 | 2 | 2 | 2 | 2 | 2 | 2 | 2 | 2 | 2 | 2 | 2 | 2 | 2 | 2 | 2 | |
| Driller-Contractor/Supervisor | C | 9,000 | 1 | 1 | 1 | 1 | 1 | 1 | 1 | 1 | 1 | 1 | 1 | 1 | 1 | 1 | 1 | 1 | |
| Blasters-Contractor/Supervisor | C | 9,000 | 1 | 1 | 1 | 1 | 1 | 1 | 1 | 1 | 1 | 1 | 1 | 1 | 1 | 1 | 1 | 1 | |
| Loader Operator | S | 9,600 | 2 | 2 | 2 | 2 | 2 | 2 | 2 | 2 | 2 | 2 | 2 | 2 | 2 | 2 | 2 | 2 | |
| Excavator Operator | S | 9,600 | 1 | 2 | 2 | 2 | 2 | 2 | 2 | 2 | 2 | 2 | 2 | 2 | 2 | 2 | 2 | 2 | 2 |
| Truck Driver /Dumper | S | 8,400 | 1 | 10 | 10 | 10 | 5 | 10 | 10 | 10 | 10 | 10 | 10 | 10 | 10 | 10 | 10 | 10 | 10 |
| Wheel Dozer Operator | S | 9,600 | 1 | 2 | 2 | 2 | 2 | 2 | 2 | 2 | 2 | 2 | 2 | 2 | 2 | 2 | 2 | 2 | 2 |
| Track Dozer Operator | S | 9,600 | 1 | 2 | 2 | 2 | 2 | 2 | 2 | 2 | 2 | 2 | 2 | 2 | 2 | 2 | 2 | 2 | 2 |
| Water Truck Operator | S | 8,400 | 1 | 2 | 2 | 2 | 2 | 2 | 2 | 2 | 2 | 2 | 2 | 2 | 2 | 2 | 2 | 2 | 2 |
| Grader Operator | S | 9,600 | 2 | 2 | 2 | 2 | 2 | 2 | 2 | 2 | 2 | 2 | 2 | 2 | 2 | 2 | 2 | 2 | |
| Lube Fuel Truck Operator | S | 9,000 | 1 | 1 | 1 | 1 | 1 | 1 | 1 | 1 | 1 | 1 | 1 | 1 | 1 | 1 | 1 | 1 | |
| Ore Spotter | S | 9,000 | 2 | 2 | 2 | 2 | 6 | 2 | 2 | 2 | 2 | 2 | 2 | 2 | 2 | 2 | 2 | 2 | 2 |
| Pit Pump Operator | S | 9,000 | 2 | 2 | 2 | 2 | 2 | 2 | 2 | 2 | 2 | 2 | 2 | 2 | 2 | 2 | 2 | 2 | 2 |
| Laborer | L | 9,000 | 3 | 4 | 4 | 4 | 4 | 4 | 4 | 4 | 4 | 4 | 4 | 4 | 4 | 4 | 4 | 4 | 4 |
| TOTAL | 202,800 | 12 | 36 | 36 | 36 | 35 | 36 | 36 | 36 | 36 | 36 | 36 | 36 | 36 | 36 | 36 | 36 | 36 | |
| MINING ENGINEERING | |||||||||||||||||||
| Engineering Manager | 60,000 | 0 | 0 | 0 | 0 | 1 | 0 | 0 | 0.0 | 0.0 | 0.0 | 0.0 | 0.0 | 0.0 | 0.0 | 0.0 | 0.0 | 0.0 | |
| Shift Supervisor | S | 30,000 | 2 | 3 | 4 | 5 | 4 | 7 | 4 | 3 | 3 | 3 | 3 | 3 | 3 | 3 | 3 | 3 | 3 |
| Mine Engineers | S | 24,000 | 1 | 2 | 2 | 2 | 2 | 2 | 1 | ||||||||||
| Fitters and Mechanics | S | 12,000 | 10 | 20 | 20 | 20 | 20 | 10 | 10 | ||||||||||
| Fuel Bay Attendants Fitter Asst | L | 6,000 | 4 | 4 | 4 | 4 | 14 | 4 | 4 | 2 | 2 | 2 | 2 | 2 | 2 | 2 | 2 | 2 | 2 |
| Data Clerks | L | 6,000 | 1 | 1 | 1 | 1 | 1 | 1 | 1 | 11 | 7 | 7 | 7 | 7 | 7 | 7 | 7 | 7 | 7 |
| TOTAL | 18 | 30 | 31 | 32 | 42 | 24 | 20 | 16 | 12 | 12 | 12 | 12 | 12 | 12 | 12 | 12 | 12 | ||
| TECHNICAL SERVICES | |||||||||||||||||||
| Geology Manager | 0 | 0 | 0 | 0 | 0 | 0 | 0 | 0 | 0.0 | ||||||||||
| Mine Surveyor | S | 30,000 | 2 | 2 | 2 | 2 | 3 | 3 | 3 | ||||||||||
| 2019 | 2020 | 2021 | 2022 | 2023 | 2024 | 2025 | 2026 | 2027 | 2028 | 2029 | 2030 | 2031 | 2032 | 2033 | 2034 | 2035 |
| | Page 221 |
| | NI43-101 ITR - Updated Mineral Resource Estimate for Buckreef Gold Project |
| Geotechnical Engineer | L | 21,600 | 1 | 1 | 1 | 1 | 1 | 1 | 1 | ||||||||||
| Survey Technician | L | 10,800 | 1 | 3 | 3 | 3 | 4 | 4 | 4 | ||||||||||
| Geotechnical Technicisn | L | 10,800 | 1 | 2 | 2 | 2 | 2 | 2 | 2 | 1 | 1 | 1 | 1 | 1 | 1 | 1 | 1 | 1 | 1 |
| Mine/Exploration Geologist | S | 36,000 | 2 | 2 | 2 | 2 | 2 | 2 | 1 | ||||||||||
| Resource Geologist | 0 | 0 | 0 | 0 | 0 | 0 | 0 | 0 | |||||||||||
| Geology Technician | L | 10,800 | 4 | 2 | 4 | 4 | 4 | 4 | 4 | ||||||||||
| Data Clerk | L | 6,000 | 1 | 1 | 1 | 1 | 1 | 1 | 1 | 1 | 1 | 1 | 1 | 1 | 1 | 1 | 1 | 1 | 1 |
| TOTAL | 12 | 13 | 15 | 15 | 17 | 17 | 16 | 2 | 2 | 2 | 2 | 2 | 2 | 2 | 2 | 2 | 2 | ||
| PROCESS PLANT | |||||||||||||||||||
| Plant Manager/Supritendent | M | 72,000 | 1 | 1 | 1 | 1 | 1 | 1 | 1 | 1 | 1 | 1 | 1 | 1 | 1 | 1 | 1 | 1 | |
| Process/Maintanance Engineer | S | 30,000 | 1 | 1 | 1 | 0 | 1 | 1 | 1 | 1 | 1 | 1 | 1 | 1 | 1 | 1 | 1 | 1 | |
| Shift Supervisor | S | 30,000 | 2 | 2 | 2 | 0 | 2 | 2 | 2 | 2 | 2 | 2 | 2 | 2 | 2 | 2 | 2 | 2 | |
| Gold Room Supervisor | S | 30,000 | 2 | 2 | 2 | 0 | 2 | 2 | 2 | 2 | 2 | 2 | 2 | 2 | 2 | 2 | 2 | 2 | |
| Operators | L | 10,800 | 20 | 20 | 20 | 0 | 20 | 20 | 20 | 20 | 20 | 20 | 20 | 20 | 20 | 20 | 20 | 20 | |
| Fitters and Mechanics | S | 10,800 | 2 | 2 | 2 | 0 | 2 | 2 | 2 | 2 | 2 | 2 | 2 | 2 | 2 | 2 | 2 | 2 | |
| Metallurgist | S | 24,000 | 1 | 1 | 1 | 1 | 0 | 1 | 1 | 1 | 1 | 1 | 1 | 1 | 1 | 1 | 1 | 1 | 1 |
| Effluent Treatment Operator | L | 8,400 | 2 | 2 | 2 | 0 | 2 | 2 | 2 | 2 | 2 | 2 | 2 | 2 | 2 | 2 | 2 | 2 | |
| TOTAL | 1 | 31 | 31 | 31 | 1 | 31 | 31 | 31 | 31 | 31 | 31 | 31 | 31 | 31 | 31 | 31 | 31 | ||
| SAFETY, HEALTH & ENVIRONMENT | |||||||||||||||||||
| SHE Manager | M | 60,000 | 1 | 1 | 1 | 1 | 1 | 1 | 1 | 1 | 1 | 1 | 1 | 1 | 1 | 1 | 1 | 1 | |
| Medical Doctor | S | 36,000 | 1 | 1 | 1 | 1 | 1 | 1 | 1 | 1 | 1 | 1 | 1 | 1 | 1 | 1 | 1 | 1 | |
| Safety/Environment Officer | S | 30,000 | 1 | 2 | 2 | 2 | 2 | 2 | 2 | 2 | 2 | 2 | 2 | 2 | 2 | 2 | 2 | 2 | 2 |
| Nurse | S | 11,400 | 2 | 2 | 2 | 2 | 2 | 2 | 2 | 2 | 2 | 2 | 2 | 2 | 2 | 2 | 2 | 2 | |
| Lab Technician | S | 11,400 | 1 | 2 | 2 | 2 | 2 | 2 | 2 | 2 | 2 | 2 | 2 | 2 | 2 | 2 | 2 | 2 | 2 |
| TOTAL | 2 | 8 | 8 | 8 | 8 | 8 | 8 | 8 | 8 | 8 | 8 | 8 | 8 | 8 | 8 | 8 | 8 | ||
| METALLURGICAL LABORATORY | |||||||||||||||||||
| Chief Chemist | S | 36,000 | 1 | 1 | 1 | 1 | 1 | 1 | 1 | 1 | 1 | 1 | 1 | 1 | 1 | 1 | 1 | 1 | |
| Assayers | S | 8,400 | 2 | 2 | 2 | 2 | 2 | 2 | 2 | 2 | 2 | 2 | 2 | 2 | 2 | 2 | 2 | 2 | |
| Sample Preparation | L | 8,400 | 2 | 2 | 2 | 2 | 2 | 2 | 2 | 2 | 2 | 2 | 2 | 2 | 2 | 2 | 2 | 2 | |
| Instrumentation Techn. | S | 10,800 | 1 | 1 | 1 | 1 | 1 | 1 | 1 | 1 | 1 | 1 | 1 | 1 | 1 | 1 | 1 | 1 | |
| TOTAL | 0 | 6 | 6 | 6 | 6 | 6 | 6 | 6 | 6 | 6 | 6 | 6 | 6 | 6 | 6 | 6 | 6 | ||
| HUMAN RESOURCES | |||||||||||||||||||
| Human Resource Manager | 0 | 0 | 0 | 0 | 0 | 0 | 0 | 0 | 0 | 0 | 0 | 0 | 0 | 0 | 0 | 0 | 0 | 0 | |
| HR Officer | S | 30,000 | 2 | 2 | 2 | 2 | 2 | 2 | 2 | 2 | 2 | 2 | 2 | 2 | 2 | 2 | 2 | 2 | |
| Community Relations Officer | S | 18,000 | 1 | 2 | 2 | 2 | 2 | 2 | 2 | 2 | 2 | 2 | 2 | 2 | 2 | 2 | 2 | 2 | 2 |
| 2019 | 2020 | 2021 | 2022 | 2023 | 2024 | 2025 | 2026 | 2027 | 2028 | 2029 | 2030 | 2031 | 2032 | 2033 | 2034 | 2035 |
| | Page 222 |
| | NI43-101 ITR - Updated Mineral Resource Estimate for Buckreef Gold Project |
| Administration Officer | S | 18,000 | 2 | 2 | 2 | 2 | 2 | 2 | 2 | 2 | 2 | 2 | 2 | 2 | 2 | 2 | 2 | 2 | |
| TOTAL | 1 | 6 | 6 | 6 | 6 | 6 | 6 | 6 | 6 | 6 | 6 | 6 | 6 | 6 | 6 | 6 | 6 | ||
| PURCHASING | |||||||||||||||||||
| Chief Buyer | S | 48,000 | 1 | 1 | 1 | 1 | 1 | 1 | 1 | 1 | 1 | 1 | 1 | 1 | 1 | 1 | 1 | 1 | 1 |
| Procurement Officer | S | 12,000 | 1 | 1 | 1 | 1 | 1 | 1 | 1 | 1 | 1 | 1 | 1 | 1 | 1 | 1 | 1 | 1 | |
| Receiving Supervisor | 0 | 0 | 0 | 0 | 0 | 0 | 0 | 0 | 0 | 0 | 0 | 0 | 0 | 0 | 0 | 0 | 0 | ||
| Data Clerks | L | 7,200 | 2 | 2 | 2 | 2 | 2 | 2 | 2 | 2 | 2 | 2 | 2 | 2 | 2 | 2 | 2 | 2 | |
| TOTAL | 1 | 4 | 4 | 4 | 4 | 4 | 4 | 4 | 4 | 4 | 4 | 4 | 4 | 4 | 4 | 4 | 4 | ||
| ACCOUNTING | |||||||||||||||||||
| Chief Accountant | M | 72,000 | 1 | 1 | 1 | 1 | 1 | 1 | 1 | 1 | 1 | 1 | 1 | 1 | 1 | 1 | 1 | 1 | 1 |
| Accountant/Payroll Officer | S | 36,000 | 1 | 1 | 1 | 1 | 1 | 1 | 1 | 1 | 1 | 1 | 1 | 1 | 1 | 1 | 1 | 1 | 1 |
| Accountant/Accounts payable officer | S | 36,000 | 0 | 1 | 1 | 1 | 1 | 1 | 1 | 1 | 1 | 1 | 1 | 1 | 1 | 1 | 1 | 1 | 1 |
| Cost accountant/PPE | S | 48,000 | 0 | 1 | 1 | 1 | 1 | 1 | 1 | 1 | 1 | 1 | 1 | 1 | 1 | 1 | 1 | 1 | 1 |
| IT Technician | S | 18,000 | 0 | 1 | 1 | 1 | 1 | 1 | 1 | 1 | 1 | 1 | 1 | 1 | 1 | 1 | 1 | 1 | 1 |
| TOTAL | 2 | 5 | 5 | 5 | 5 | 5 | 5 | 5 | 5 | 5 | 5 | 5 | 5 | 5 | 5 | 5 | 5 | ||
| CAMP | |||||||||||||||||||
| Camp Manager | S | 42,000 | 1 | 1 | 1 | 1 | 1 | 1 | 1 | 1 | 1 | 1 | 1 | 1 | 1 | 1 | 1 | 1 | 1 |
| Chief Cook | S | 30,000 | 1 | 1 | 1 | 1 | 1 | 1 | 1 | 1 | 1 | 1 | 1 | 1 | 1 | 1 | 1 | 1 | 1 |
| Assistant Cook | L | 10,200 | 2 | 2 | 2 | 2 | 2 | 2 | 2 | 2 | 2 | 2 | 2 | 2 | 2 | 2 | 2 | 2 | 2 |
| Kitchen Assistant | L | 10,200 | 2 | 2 | 2 | 2 | 2 | 2 | 2 | 2 | 2 | 2 | 2 | 2 | 2 | 2 | 2 | 2 | 2 |
| Office Cleaners | L | 7,200 | 2 | 2 | 2 | 2 | 2 | 2 | 2 | 2 | 2 | 2 | 2 | 2 | 2 | 2 | 2 | 2 | 2 |
| TOTAL | 8 | 8 | 8 | 8 | 8 | 8 | 8 | 8 | 8 | 8 | 8 | 8 | 8 | 8 | 8 | 8 | 8 |
| | Page 223 |
| | NI43-101 ITR - Updated Mineral Resource Estimate for Buckreef Gold Project |
Table 32.4: Summary of Capital Costs Estimates
| 60tph Prod | 120tph Prod | 180tph Prod | |||||||||
| Item | Capital Description | No | Unit Cost | Total Capex | Year 0 | Year 1 | Year 2 | Year 3 | Year 4 | Year 5 | Year 6 |
| Capital Plan | USD | USD | |||||||||
| 1 | Mining | ||||||||||
| 1.1 | Mining Equipment ( Fleet) | 1 | 17,531,424 | 17,531,424 | 8,737,653 | 4,581,271 | 4,212,500 | ||||
| 1.2 | Loader | 3 | 265,500 | 796,500 | 796,500 | ||||||
| 1.3 | Water Truck | 0 | 100,000 | 100,000 | 100,000 | ||||||
| 1.4 | Service Truck | 1 | 100,000 | 100,000 | 100,000 | ||||||
| 1.5 | Light Trucks & Cars | 8 | 41,500 | 332,000 | 166,000 | 166,000 | |||||
| 1.6 | Dewatering Pump | 4 | 40,000 | 160,000 | 160,000 | ||||||
| 1.7 | Survey Tools | 1 | 45,000 | 45,000 | 45,000 | ||||||
| 1.8 | Pit Optimisation | 1 | 75,000 | 75,000 | 75,000 | ||||||
| 1.9 | Mining Offices/Shop | 1 | 300,000 | 300,000 | 300,000 | ||||||
| 1.1 | Haul Roads | 1 | 100,000 | 100,000 | 100,000 | ||||||
| 1.11 | HME - Workshop Construction | 1 | 700,000 | 700,000 | 700,000 | ||||||
| 1.12 | Explosive magazine | 1 | 150,000 | 150,000 | 150,000 | ||||||
| 1.13 | Fuel Tanks with a Capacity to hold 400klt | 1 | 240,000 | 240,000 | 240,000 | ||||||
| Subtotal Mining | 20,629,924 | 11,520,153 | 4,897,271 | 0 | 4,212,500 | ||||||
| 2 | Processing Plant | ||||||||||
| 2.1 | TSF Construction & Design | 1 | 1,750,000 | 1,750,000 | 1,250,000 | 250,000 | 250,000 | �� | |||
| 2.2 | Portable Water Plant | 1 | 600,000 | 600,000 | 300,000 | 300,000 | |||||
| 2.3 | Laboratory | 1 | 500,000 | 500,000 | 500,000 | ||||||
| 2.4 | Process Plant Development | 1 | 35,284,625 | 35,284,625 | 11,500,000 | 150,000 | 11,500,000 | 12,134,625 | |||
| 2.5 | Generators 4No x 2.5MVa | 1 | 1,243,000 | 1,243,000 | 414,333 | - | 414,333 | 414,333 | |||
| 2.6 | Substation and Power Reticulation | 1 | 500,000 | 500,000 | 500,000 | ||||||
| 2.7 | Engineering Workshop for Plant +tools | 1 | 400,000 | 400,000 | 400,000 | ||||||
| Subtotal Processing Plant | 40,277,625 | 40,277,625 | 14,864,333 | 150,000 | 12,464,333 | 12,798,958 | |||||
| 3 | Human Resources & Community | ||||||||||
| 3.1 | Camping Facilities | 1 | 250,000 | 250,000 | 250,000 | ||||||
| 3.2 | Camp Houses (2Bx20+4Bx30) | 50 | 15,000 | 750,000 | 750,000 | ||||||
| 3.3 | Relocation of Mnekezi road | 1 | 250,000 | 250,000 | 250,000 | ||||||
| 3.4 | Airport/Aerodrome | 1 | 35,000 | 35,000 | 35,000 | ||||||
| 3.5 | Helicopter Pad | 1 | 10,000 | 10,000 | 10,000 | ||||||
| 3.6 | Compensation - Relocation from SML | 1 | 2,500,000 | 2,500,000 | 2,500,000 | ||||||
| 3.7 | Sewer Ponds & Facilities | 1 | 350,000 | 350,000 | 350,000 | ||||||
| 3.8 | Security fencing | 1 | 520,000 | 520,000 | 520,000 | ||||||
| Subtotal Human Resources & Community | 3,930,000 | 4,665,000 | 4,665,000 | 0 | 0 | 0 | |||||
| 4 | HSE | ||||||||||
| 4.1 | Clinic | 1 | 100,000 | 100,000 | 100,000 | ||||||
| | Page 224 |
| | NI43-101 ITR - Updated Mineral Resource Estimate for Buckreef Gold Project |
| 60tph Prod | 120tph Prod | 180tph Prod | |||||||||
| Item | Capital Description | No | Unit Cost | Total Capex | Year 0 | Year 1 | Year 2 | Year 3 | Year 4 | Year 5 | Year 6 |
| 4.2 | Waste Handling Facilties | 1 | 75,000 | 75,000 | 75,000 | ||||||
| Subtotal HSE | 175,000 | 175,000 | 175,000 | 0 | 0 | 0 | |||||
| 5 | Finance + IT | ||||||||||
| 5.1 | Computer & Server | 1 | 40,000 | 40,000 | 40,000 | ||||||
| 5.2 | Desktop | 1 | 45,000 | 45,000 | 45,000 | ||||||
| 5.3 | Laptop | 1 | 30,000 | 30,000 | 30,000 | ||||||
| 5.4 | Networking & Communication | 1 | 40,000 | 40,000 | 40,000 | ||||||
| 5.5 | Process Plant Insurance - 6% Plant Cost | 1 | 600,000 | 600,000 | 600,000 | ||||||
| 5.6 | Mining Equipment Insurance - 2.5% Equip Cost | 1 | 19,913 | 19,913 | 19,913 | ||||||
| Subtotal Finance +IT | 774,913 | 774,913 | 774,913 | 0 | 0 | 0 | |||||
| 6 | Contingency 15% | 15% | 9,978,369 | 4,799,910 | 757,091 | 1,869,650 | 2,551,719 | ||||
| 7 | Total Capex | 76,500,831 | 36,799,309 | 5,804,362 | 14,333,983 | 19,563,177 | |||||
| For Depreciation | Total Capex | Year 0 | Year 1 | Year 2 | Year 3 | Year 4 | Year 5 | Year 6 | |||
| 1 | Plant and Equipment | US$ | 64,707,681 | 26,873,384 | 5,876,725 | 14,657,200 | 20,113,750 | ||||
| 2 | Building and Infrastructure | US$ | 11,059,500 | 10,887,000 | 3,952,500 | 3,780,000 | 3,780,000 | ||||
| 3 | Office & Computers Equipment | US$ | 891,150 | 891,150 | 0 | 0 | 0 | ||||
| 4 | Total | US$ | 76,658,331 | 38,651,534 | 9,829,225 | 18,437,200 | 23,893,750 | ||||
| | Page 225 |
| | NI43-101 ITR - Updated Mineral Resource Estimate for Buckreef Gold Project |
Table 32.50: Equipment Operating Costs\
| FUEL PRICE | USD 1.20 | Type | TRACKED BULL DOZER | TRACKED BULL DOZER | MOTOR GRADER | HYDRAULIC EXCAVATOR | HYDRAULIC EXCAVATOR | ARTICULATED DUMP TRUCK | FUEL BOWSER | WATER BOWSER | TRACKED DRILL RIG |
| ENGINE OIL | USD 4.60 | Make | BELL | CAT | CAT | CAT | LIEBHEER | BELL | BELL | BELL | Sandvik |
| TRANS OIL | USD 7.17 | Model | PR754 | D8R | 140H | 374 | R966 | B40D | B25E | B30E | |
| HYD OIL | USD 4.60 | kW | 123 | 112 | |||||||
| F / DRIVE OIL | USD 5.10 | kg | 32,000 | 17,083 | 13,529 | 32,000 | |||||
| Delivery Price | DP | USD 683,771.00 | USD 850,000.00 | USD 385,000.00 | USD 855,000.00 | USD 855,000.00 | USD 540,000.00 | USD 343,000.00 | USD 385,000.00 | USD 675,750.00 | |
| Residual Value At Replacement | RVR | USD 0.00 | USD 85,000.00 | USD 38,500.00 | USD 85,500.00 | USD 85,500.00 | USD 54,000.00 | USD 34,300.00 | USD 38,500.00 | USD 0.00 | |
| Value To Be Recovered Through Work | VRTW | USD 683,771.00 | USD 765,000.00 | USD 346,500.00 | USD 769,500.00 | USD 769,500.00 | USD 486,000.00 | USD 308,700.00 | USD 346,500.00 | USD 675,750.00 | |
| Estimated Ownership | N | years | 5 | 5 | 5 | 5 | 5 | 6 | 10 | 5 | 5 |
| Estimated Usage | H | hours/year | 7,200 | 7,200 | 7,200 | 7,200 | 7,200 | 7,200 | 4,500 | 7,200 | 7,200 |
| Ownership Usage | T | hours | 36,000 | 36,000 | 36,000 | 36,000 | 36,000 | 43,200 | 45,000 | 36,000 | 36,000 |
| Cost Per Hour | CPH | USD/hr | USD 18.99 | USD 21.25 | USD 9.63 | USD 21.38 | USD 21.38 | USD 11.25 | USD 6.86 | USD 9.63 | USD 18.77 |
| Simple Interest Rate | SI | % | 12% | 12% | 12% | 12% | 12% | 12% | 12% | 12% | 12% |
| Interest Costs | SIC | USD/hr | USD 6.84 | USD 8.50 | USD 3.85 | USD 8.55 | USD 8.55 | USD 5.25 | USD 5.03 | USD 3.85 | USD 6.76 |
| Insurance Rate | IN | % | 2% | 2% | 2% | 2% | 2% | 2% | 4% | 4% | 2% |
| Insurance Costs | INSC | USD/hr | USD 1.14 | USD 1.42 | USD 0.64 | USD 1.43 | USD 1.43 | USD 0.88 | USD 1.68 | USD 1.28 | USD 1.13 |
| TOTAL OWNING COSTS | TOC | USD/hr | USD 0.00 | USD 0.00 | USD 0.00 | USD 0.00 | USD 0.00 | USD 0.00 | USD 0.00 | USD 0.00 | USD 0.00 |
| Fuel Consumption Rate | F | litres/hour | 35 | 35 | 20 | 60 | 60 | 28 | 20 | 27 | 28 |
| Fuel Price | FP | USD/litre | USD 1.20 | USD 1.20 | USD 1.20 | USD 1.20 | USD 1.20 | USD 1.20 | USD 1.20 | USD 1.20 | USD 1.20 |
| Dry (D) Or Wet (W) Rate | D/W | w | w | w | w | w | w | w | w | w | w |
| Fuel Consumption | FC | USD/hour | USD 42.00 | USD 42.00 | USD 24.00 | USD 72.00 | USD 72.00 | USD 33.60 | USD 24.00 | USD 32.40 | USD 33.60 |
| Engine Oil Price | EOP | USD | USD 4.60 | USD 4.60 | USD 4.60 | USD 4.60 | USD 4.60 | USD 4.60 | USD 4.60 | USD 4.60 | USD 4.60 |
| Engine Oil Consumption Rate | EOCR | litres/hour | 0.160 | 0.140 | 0.140 | 0.300 | 0.200 | 0.150 | USD 0.15 | 0.150 | 0.160 |
| Transmission Oil Price | TOP | USD | USD 4.60 | USD 4.60 | USD 4.60 | USD 4.60 | USD 4.60 | USD 4.60 | USD 4.60 | USD 4.60 | USD 4.60 |
| Transmission Oil Consumption Rate | TOCR | litres/hour | 0.150 | 0.144 | 0.047 | 0.000 | 0.000 | 0.040 | USD 0.04 | 0.040 | 0.150 |
| Final Drives Fluid Price | FDFP | USD | USD 5.10 | USD 5.10 | USD 5.10 | USD 5.10 | USD 5.10 | USD 5.10 | USD 5.10 | USD 5.10 | USD 0.00 |
| Final Drives Fluid Consumption Rate | FDFCR | litres/hour | 0.015 | 0.013 | 0.065 | 0.150 | 0.040 | 0.050 | USD 0.05 | 0.050 | 0.015 |
| Hydraulic Oil Price | HOP | USD | USD 4.60 | USD 4.60 | USD 4.60 | USD 4.60 | USD 4.60 | USD 4.60 | USD 4.60 | USD 4.60 | USD 0.00 |
| Hydraulic Oil Consumption Rate | HOCR | litres/hour | 0.075 | 0.050 | 0.019 | 1.000 | 1.000 | 0.250 | USD 0.25 | 0.250 | 0.075 |
| Grease Price | GP | USD | USD 6.20 | USD 6.20 | USD 6.20 | USD 6.20 | USD 6.20 | 6.200 | USD 6.20 | USD 6.20 | USD 6.20 |
| Grease Consumption Rate | GCR | kg/hour | 0.140 | 0.139 | 0.139 | 0.200 | 0.200 | 0.140 | 0.140 | 0.140 | 0.140 |
| Engine Oil Cost | EOC | USD/hour | USD 0.74 | USD 0.64 | USD 0.64 | USD 1.38 | USD 0.92 | USD 0.69 | USD 0.69 | USD 0.69 | USD 0.74 |
| Transmission Oil Cost | TOC | USD/hour | USD 0.69 | USD 0.66 | USD 0.22 | USD 0.00 | USD 0.00 | USD 0.18 | USD 0.18 | USD 0.18 | USD 0.69 |
| Final Drives Fluid Cost | FDFC | USD/hour | USD 0.08 | USD 0.07 | USD 0.33 | USD 0.77 | USD 0.20 | USD 0.26 | USD 0.26 | USD 0.26 | USD 0.00 |
| Hydraulic Oil Cost | HOC | USD/hour | USD 0.35 | USD 0.23 | USD 0.09 | USD 4.60 | USD 4.60 | USD 1.15 | USD 1.15 | USD 1.15 | USD 0.00 |
| Grease Cost | GC | USD/hour | USD 0.87 | USD 0.86 | USD 0.86 | USD 1.24 | USD 1.24 | USD 0.87 | USD 0.87 | USD 0.87 | USD 0.87 |
| Filter Cost [From Tables] | FILC | USD/hour | USD 2.00 | USD 1.50 | USD 1.50 | USD 2.50 | USD 2.50 | USD 2.00 | USD 2.00 | USD 2.00 | USD 2.00 |
| Total Lubricants, Oils And Filter Cost | LC | USD/hour | USD 6.51 | USD 6.51 | USD 3.72 | USD 11.16 | USD 11.16 | USD 5.04 | USD 3.72 | USD 5.02 | USD 5.21 |
| Number Of Wheels | NW | 0 | 6 | 0 | 0 | 6 | 6 | 6 | 0 | ||
| Tyre Size | TS | 0 | 17.5x25 | 0 | 0 | 26.5R25 | 26.5R25 | 26.5R25 | 0 | ||
| Tyre Price | CT | USD 0.00 | USD 2,500.00 | USD 0.00 | USD 0.00 | USD 6,500.00 | USD 6,500.00 | USD 6,500.00 | 0 | ||
| Life Of Tyre | LT | hours | 0 | 2,000 | 0 | 0 | 4,500 | 6,000 | 3,000 | 0 | |
| Tyre Replacement Cost | TRC | USD 0.00 | USD 7.50 | USD 0.00 | USD 0.00 | USD 8.67 | USD 6.50 | USD 13.00 | USD 0.00 | ||
| FUEL PRICE | USD 1.20 | Type | TRACKED | TRACKED | MOTOR | HYDRAULIC | HYDRAULIC | ARTICULATED | FUEL | WATER | TRACKED |
| | Page 226 |
| | NI43-101 ITR - Updated Mineral Resource Estimate for Buckreef Gold Project |
| BULL DOZER | BULL DOZER | GRADER | EXCAVATOR | EXCAVATOR | DUMP TRUCK | BOWSER | BOWSER | DRILL RIG | |||
| ENGINE OIL | USD 4.60 | Make | BELL | CAT | CAT | CAT | LIEBHEER | BELL | BELL | BELL | Sandvik |
| TRANS OIL | USD 7.17 | Model | PR754 | D8R | 140H | 374 | R966 | B40D | B25E | B30E | |
| Impact Factor | IF | 0.4 | 0.4 | 0.0 | 0.5 | 0.4 | 0.0 | 0.0 | 0.0 | 0.4 | |
| Abrasiveness | A | 0.6 | 0.6 | 0.0 | 0.6 | 0.6 | 0.0 | 0.0 | 0.0 | 0.6 | |
| “Z” Factor | Z | 0.5 | 0.5 | 0.0 | 1.0 | 1.0 | 0.0 | 0.0 | 0.0 | 0.5 | |
| Undercarriage Basic Factor | Ba | 10.0 | 10.0 | 0.0 | 10.0 | 10.0 | 0.0 | 0.0 | 0.0 | 6.0 | |
| Extended Use Multiplier | EM | 1.0 | 1.0 | 1.0 | 1.0 | 1.0 | 1.0 | 1.0 | 1.0 | 1.0 | |
| Basic Repair Factor | BF | 10 | 10 | 5.0 | 10.0 | 10.0 | 10.0 | 6.0 | 6.0 | 4 | |
| Undercarriage Repair Costs | URC | USD/hour | USD 15.00 | USD 15.00 | USD 0.00 | USD 21.00 | USD 20.00 | USD 0.00 | USD 0.00 | USD 0.00 | USD 9.00 |
| Repair Reserve | RR | USD 10.00 | USD 10.00 | USD 5.00 | USD 10.00 | USD 10.00 | USD 10.00 | USD 6.00 | USD 6.00 | USD 11.00 | |
| Price Of Cutting Edges/Bucket | PCE | USD | USD 400.00 | USD 460.00 | USD 248.39 | USD 20,000.00 | USD 20,000.00 | USD 0.00 | USD 0.00 | USD 0.00 | USD 0.00 |
| Price Of Ripper Tips/Picks | PRT | USD | USD 200.00 | USD 230.00 | USD 16.16 | USD 0.00 | USD 0.00 | USD 0.00 | USD 0.00 | USD 0.00 | USD 0.00 |
| Price Of Bucket Tips/Pick Holders | PBT | USD | USD 0.00 | USD 0.00 | USD 0.00 | USD 400.00 | USD 400.00 | USD 0.00 | USD 0.00 | USD 0.00 | USD 0.00 |
| Price Of Bin Liners/Corner Piece/End Ring | PEB | USD | USD 350.00 | USD 402.50 | USD 281.54 | USD 0.00 | USD 0.00 | USD 3,000.00 | USD 2,000.00 | USD 2,000.00 | USD 0.00 |
| No. Of Cutting Edges | NCE | 2 | 2 | 2 | 1 | 1 | 0 | 0 | 0 | 0 | |
| No. Of Ripper Tips/Picks | NRT | 1 | 3 | 3 | 0 | 0 | 0 | 0 | 0 | 0 | |
| No. Of Bucket Tips/Pick Holders | NRT | 0 | 0 | 0 | 4 | 4 | 0 | 0 | 0 | 0 | |
| No. Of Bin Liners/Corner Piece/Endrings | NEB | 2 | 2 | 2 | 1 | 0 | 1 | 1 | 1 | 0 | |
| Life Of Cutting Edges/Bucket | LCE | hours | 200 | 200 | 200 | 2,000 | 2,000 | 0 | 0 | 0 | 0 |
| Life Of Ripper Tips/Picks | LRT | hours | 200 | 200 | 200 | 0 | 0 | 0 | 0 | 0 | 0 |
| Life Of Bucket Tips/Pick Holders | LBT | hours | 0 | 0 | 0 | 150 | 150 | 0 | 0 | 0 | 0 |
| Life Of Bin Liners/Corner Piece/End Ring | LEB | hours | 200 | 250 | 0 | 0 | 0 | 2,500 | 4,000 | 4,000 | 0 |
| Cost Of Cutting Edges | CCE | USD/hour | USD 4.00 | USD 4.60 | USD 2.48 | USD 10.00 | USD 10.00 | USD 0.00 | USD 0.00 | USD 0.00 | USD 0.00 |
| Cost Of Ripper Tips | CRT | USD/hour | USD 1.00 | USD 3.45 | USD 0.24 | USD 0.00 | USD 0.00 | USD 0.00 | USD 0.00 | USD 0.00 | USD 0.00 |
| Cost Of Bucket Tips | CBT | USD/hour | USD 0.00 | USD 0.00 | USD 0.00 | USD 10.67 | USD 10.67 | USD 0.00 | USD 0.00 | USD 0.00 | USD 0.00 |
| Cost Of Bin Liners | CEB | USD/hour | USD 3.50 | USD 3.22 | USD 0.00 | USD 0.00 | USD 0.00 | USD 1.20 | USD 0.50 | USD 0.50 | USD 0.00 |
| Special Wear Items | SWI | USD/hour | USD 8.50 | USD 11.27 | USD 2.73 | USD 20.67 | USD 20.67 | USD 1.20 | USD 0.50 | USD 0.50 | USD 0.00 |
| Operator Costs | OPC | USD/hour | USD 0.00 | USD 0.00 | USD 0.00 | USD 0.00 | USD 0.00 | USD 0.00 | USD 0.00 | USD 0.00 | USD 0.00 |
| TOTAL OPERATING CXOSTS | TOC | USD/hour | USD 82.01 | USD 84.78 | USD 42.95 | USD 134.83 | USD 133.83 | USD 58.51 | USD 40.72 | USD 56.92 | USD 58.81 |
| USD/hour | USD 82.01 | USD 84.78 | USD 42.95 | USD 134.83 | USD 133.83 | USD 58.51 | USD 40.72 | USD 56.92 | USD 58.81 | ||
| | Page 227 |
| | NI43-101 ITR - Updated Mineral Resource Estimate for Buckreef Gold Project |
Table 32.7: Buckreef Cash Flow Analysis
| YEARS | |||||||||||||||||||
| Description | Rates | Fact | Year 1 | Year 2 | Year 3 | Year 4 | Year 5 | Year 6 | Year 7 | Year 8 | Year 9 | Year 10 | Year 11 | Year 12 | Year 13 | Year 14 | Year 15 | Year 16 | Total |
| Ore Mining | |||||||||||||||||||
| Oxide Ore (Tonnes) | kt | 349 | 188 | 57 | 209 | 73 | 30 | 159 | 66 | 309 | 118 | 21 | - | 41 | 2 | 8 | - | 1,629 | |
| Oxide Ore (g/t) | g/t | 2.00 | 1.40 | 1.24 | 1.28 | 1.17 | 1.20 | 1.02 | 2.07 | 1.98 | 3.92 | 0.97 | - | 2.11 | 1.65 | 1.65 | - | ||
| Trans Ore (Tonnes) | kt | 92 | 151 | 136 | 133 | 106 | 78 | 40 | 28 | 82 | 309 | 270 | 52 | 17 | 6 | 21 | - | 1,520 | |
| Trans Ore (g/t) | g/t | 2.18 | 2.68 | 1.72 | 1.46 | 1.25 | 1.01 | 1.57 | 1.06 | 1.05 | 3.27 | 1.30 | 0.92 | 2.72 | 1.41 | 1.41 | - | ||
| Hard Ore (Tonnes) | kt | 43 | 146 | 290 | 625 | 1,271 | 1,347 | 1,251 | 1,356 | 1,060 | 1,028 | 1,160 | 1,399 | 1,392 | 1,446 | 1,323 | 915 | 16,053 | |
| Hard Ore (g/t) | g/t | 1.37 | 2.15 | 1.69 | 1.55 | 1.63 | 1.39 | 1.25 | 1.89 | 1.57 | 1.26 | 1.34 | 1.23 | 1.31 | 1.64 | 1.40 | 1.70 | ||
| Oxide Waste | kt | 2,713 | 1,443 | 2,087 | 598 | 191 | 1,551 | 2,086 | 2,140 | 1,978 | 3,323 | 918 | 82 | 1,046 | - | - | - | 20,155 | |
| Trans Waste | kt | 1,296 | 1,097 | 2,134 | 1,410 | 733 | 1,525 | 1,930 | 1,277 | 1,629 | 2,700 | 2,878 | 1,368 | 368 | - | - | - | 20,346 | |
| Hard Waste | kt | 508 | 1,766 | 4,055 | 6,824 | 7,781 | 6,839 | 7,985 | 9,294 | 14,640 | 12,160 | 14,550 | 15,490 | 12,149 | 12,888 | 13,176 | 1,102 | 141,207 | |
| Oxide & Trans Ore Recovery | % | 92% | 92% | 92% | 92% | 92% | 92% | 92% | 92% | 92% | 92% | 92% | 92% | 92% | 92% | 92% | 92% | 92% | |
| Sulphide Ore Recovery | 85% | 85% | 85% | 85% | 85% | 85% | 85% | 85% | 85% | 85% | 85% | 85% | 85% | 85% | 85% | 85% | 85% | ||
| Mining Dilution | % | 5% | 5% | 5% | 5% | 5% | 5% | 5% | 5% | 5% | 5% | 5% | 5% | 5% | 5% | 5% | 5% | 5% | |
| Gold produced | |||||||||||||||||||
| Fine (kg) | kg | 876 | 869 | 677 | 1,208 | 1,878 | 1,621 | 1,468 | 2,225 | 1,989 | 2,405 | 1,599 | 1,433 | 1,595 | 1,924 | 1,535 | 1,258 | 24,559 | |
| Fine (oz) (1oz =31.1034768grams) | koz | 28,162 | 27,944 | 21,752 | 38,837 | 60,375 | 52,111 | 47,181 | 71,532 | 63,956 | 77,320 | 51,412 | 46,069 | 51,295 | 61,851 | 49,347 | 40,448 | 789,593 | |
| Gold price (US$000) | $/oz | 1300 | 1,300 | 1,300 | 1,300 | 1,300 | 1,300 | 1,300 | 1,300 | 1,300 | 1,300 | 1,300 | 1,300 | 1,300 | 1,300 | 1,300 | 1,300 | 1,300 | |
| Gross revenue | US ($000) | 0 | 36,610 | 36,327 | 28,277 | 50,488 | 78,487 | 67,744 | 61,336 | 92,992 | 83,143 | 100,516 | 66,835 | 59,890 | 66,684 | 80,406 | 64,151 | 52,583 | 1,026,471 |
| Less Royalties & Selling Costs | - | ||||||||||||||||||
| : Royalties 7.3% on Revenue | 7.3% | (2,673) | (2,652) | (2,064) | (3,686) | (5,730) | (4,945) | (4,478) | (6,788) | (6,069) | (7,338) | (4,879) | (4,372) | (4,868) | (5,870) | (4,683) | (3,839) | (74,932) | |
| : Selling Costs per oz of gold | 4.40 | (124) | (123) | (96) | (171) | (266) | (229) | (208) | (315) | (281) | (340) | (226) | (203) | (226) | (272) | (217) | (178) | (3,470) | |
| Net revenue | 33,814 | 33,553 | 26,117 | 46,631 | 72,492 | 62,570 | 56,651 | 85,889 | 76,792 | 92,838 | 61,730 | 55,315 | 61,590 | 74,264 | 59,251 | 48,566 | 948,064 | ||
| | Page 228 |
| | NI43-101 ITR - Updated Mineral Resource Estimate for Buckreef Gold Project |
| YEARS | |||||||||||||||||||
| Description | Rates | Fact | Year 1 | Year 2 | Year 3 | Year 4 | Year 5 | Year 6 | Year 7 | Year 8 | Year 9 | Year 10 | Year 11 | Year 12 | Year 13 | Year 14 | Year 15 | Year 16 | Total |
| Capital Costs | US ($k) | ||||||||||||||||||
| Start up Capital | 36,799 | 5,804 | 14,334 | 19,563 | 76,501 | ||||||||||||||
| Closure Costs | U$ | 4,507 | 4,507 | ||||||||||||||||
| Sustaining Costs | U$ | 7.5% | - | - | - | 5,738 | - | - | 5,738 | - | - | 5,738 | - | - | 5,738 | - | 22,950 | ||
| Total Capital Costs | U$ | - | 36,799 | 5,804 | 14,334 | 19,563 | 5,738 | - | - | 5,738 | - | - | 5,738 | - | - | 5,738 | - | 4,507 | 103,958 |
| Operating expenditure | U$ | ||||||||||||||||||
| Mining Rates | US ($k) | ||||||||||||||||||
| Drill & Blast Waste | $/tw | 0.74 | 1,337 | 2,122 | 3,796 | 6,103 | 6,310 | 6,198 | 7,348 | 7,834 | 12,057 | 11,013 | 12,916 | 12,493 | 9,276 | 9,551 | 9,764 | 817 | 118,936 |
| Drill & Blast Ore | $/to | 0.90 | 122 | 269 | 385 | 685 | 1,244 | 1,287 | 1,166 | 1,250 | 1,031 | 1,208 | 1,291 | 1,310 | 1,274 | 1,312 | 1,213 | 827 | 15,876 |
| Load and Haul Ore | $/to | 1.13 | 544 | 546 | 544 | 1,088 | 1,632 | 1,637 | 1,632 | 1,632 | 1,632 | 1,637 | 1,632 | 1,632 | 1,632 | 1,637 | 1,520 | 1,030 | 21,609 |
| Load and Haul waste | $/tw | 1.03 | 4,663 | 4,444 | 8,541 | 9,115 | 8,983 | 10,231 | 12,384 | 13,118 | 18,831 | 18,764 | 18,933 | 17,481 | 13,996 | 13,300 | 13,597 | 1,138 | 187,519 |
| Overhaul rate | $/t/km | 0.08 | |||||||||||||||||
| Mine Rehabilitation | $/tw | 0.03 | 136 | 129 | 248 | 265 | 261 | 297 | 360 | 381 | 547 | 545 | 550 | 508 | 407 | 387 | 395 | 33 | 5,451 |
| Processing Rates | |||||||||||||||||||
| Processing reagents | $/to | 10.24 | 4,952 | 4,966 | 4,952 | 9,905 | 14,853 | 14,894 | 14,853 | 14,853 | 14,853 | 14,894 | 14,853 | 14,853 | 14,853 | 14,894 | 13,836 | 9,370 | 196,646 |
| Labour Costs | $/to | 1.98 | 958 | 960 | 958 | 1,915 | 2,872 | 2,880 | 2,872 | 2,872 | 2,872 | 2,880 | 2,872 | 2,872 | 2,872 | 2,880 | 2,675 | 1,812 | 38,023 |
| Total operating costs | US ($k) | 12,712 | 13,436 | 19,424 | 29,076 | 36,156 | 37,425 | 40,616 | 41,942 | 51,825 | 50,941 | 53,048 | 51,151 | 44,310 | 43,960 | 43,001 | 15,026 | 584,048 | |
| Opex +Capex | US ($k) | - | 49,511 | 19,240 | 33,758 | 48,639 | 41,894 | 37,425 | 40,616 | 47,679 | 51,825 | 50,941 | 58,786 | 51,151 | 44,310 | 49,698 | 43,001 | 19,533 | 688,006 |
| Pre Tax Net Cash Flows | US ($k) | - | (15,697) | 14,313 | (7,641) | (2,008) | 30,598 | 25,145 | 16,035 | 38,210 | 24,967 | 41,897 | 2,944 | 4,165 | 17,280 | 24,567 | 16,250 | 29,033 | 260,058 |
| Taxable Income | US ($k) | 12,644 | 27,206 | 16,607 | 31,338 | 50,119 | 33,483 | 23,247 | 48,350 | 25,515 | 42,444 | 9,229 | 4,712 | 17,828 | 30,852 | 16,797 | 34,088 | 424,457 | |
| Tax Payable | US ($k) | 3,793 | 8,162 | 4,982 | 9,401 | 15,036 | 10,045 | 6,974 | 14,505 | 7,654 | 12,733 | 2,769 | 1,414 | 5,348 | 9,255 | 5,039 | 10,226 | 127,337 | |
| Net Cashflows after Tax | US ($k) | (19,490) | 6,151 | (12,623) | (11,409) | 15,563 | 15,100 | 9,061 | 23,705 | 17,313 | 29,164 | 176 | 2,751 | 11,932 | 15,311 | 11,211 | 18,807 | 132,721 | |
| Add back Depreciation | US ($k) | 5,955 | 7,090 | 9,913 | 13,783 | 13,783 | 8,338 | 7,212 | 4,403 | 547 | 547 | 547 | 547 | 547 | 547 | 547 | 547 | 74,854 | |
| Net Cashflow after tax adjusted for tax dep | US ($k) | (13,536) | 13,240 | (2,709) | 2,373 | 29,346 | 23,438 | 16,273 | 28,107 | 17,860 | 29,711 | 723 | 3,298 | 12,479 | 15,859 | 11,758 | 19,354 | 207,575 | |
| After Tax NPV @ ( 3%) | US ($k) | 3% | 156,552 | ||||||||||||||||
| After Tax @ NPV (5%) | US ($k) | 5% | 130,964 | ||||||||||||||||
| After Tax @ NPV (8%) | US ($k) | 8% | 101,495 | ||||||||||||||||
| After Tax IRR | % | 74% | |||||||||||||||||
| Cash cost per oz | $/oz | 451 | 481 | 893 | 749 | 599 | 718 | 861 | 586 | 810 | 659 | 1,032 | 1,110 | 864 | 711 | 871 | 371 | 735 | |
| All in cash costs | $/oz | 1,758 | 689 | 1,552 | 1,252 | 694 | 718 | 861 | 667 | 810 | 659 | 1,143 | 1,110 | 864 | 804 | 871 | 483 | 933 | |
| | Page 229 |
| | NI43-101 ITR - Updated Mineral Resource Estimate for Buckreef Gold Project |

Reference: 2018-L01
16 July 2018
Buckreef Gold Company Limited
Plot No. 263, Chato Street, Regent Estate
P O Box 33407
Dares Salaam - Tanzania
Buckreef Gold Company Limited; TIN: 116-448-459
Expert Opinion on Net Present Value (NPV) Model for Buckreef Project covering a 16 years period
We have reviewed the NPV Model for the Buckreef project in accordance with our understanding of the taxation laws as currently applicable in Tanzanian. Based on our review, we confirm as experts in the taxation field in Tanzania that the parameters in the summary below for the 16 years model period (model attached) represent a true and fair view of the cash flow and project cost assumptions.
Table of NPV model results for Buckreef project
| Description | Years 1 to 16 (US$(k)) |
| Gross revenue | 1,026,471 |
| Royalties and selling costs | (78,402) |
| Net revenue | 948,069 |
| Capital costs | (103,958) |
| Operating costs | (584,048) |
| Pre-tax net cash flows | 260,062 |
| Tax | (127,337) |
| Net cash-flow after Tax | 132,725 |
| Add back tax depreciation | 74,854 |
| Net cash-flow after tax & depreciation adjustments | 207,579 |
| After Tax NPV @ (3%) – US ($k) | 156,552 |
| After Tax NPV @ (5%) – US ($k) | 130,964 |
| After Tax NPV @ (8%) – US ($k) | 101,495 |
| After Tax IRR (%) | 74% |
We are available to provide clarifications in case of any queries on this confirmation.
Yours faithfully John Shimbala, Director Ark Associates Limited |  |
Ark Associates Limited, Ground Floor 369 Kilwa House, Toure Drive – Oysterbay, P O Box 23197 Dar es salaam, Tanzania,
Tel +255 2222 96800, Email:info@ark.co.tzWebsite:www.ark.co.tzTIN: 130-210- 392 VRN: 40-024085-J
Figure 32.14. Expert Opinion on Buckreef Gold Project After-Tax Cashflow, NPV & IRR
| | Page 230 |
| | NI43-101 ITR - Updated Mineral Resource Estimate for Buckreef Gold Project |
Table 32.1: Buckreef Project Full Schedule of Mined Tonnages
| TRX Mine Plan 2019 | |||||||||||||||||
| YEAR | 1 | 2 | 3 | 4 | 5 | 6 | 7 | 8 | 9 | 10 | 11 | 12 | 13 | 14 | 15 | 16 | Total |
| MINING Summary | |||||||||||||||||
| Oxide Ore (Tonnes) | 274,483 | 256,217 | 79,578 | 109,536 | 38,713 | 30,525 | 159,318 | 64,833 | 320,880 | 117,506 | 16,298 | 1,232 | 40,585 | - | - | - | - |
| Oxide Ore (g/t) | 2.04 | 1.53 | 1.13 | 0.89 | 0.70 | 1.22 | 1.02 | 2.08 | 1.98 | 3.92 | 0.74 | 0.79 | 2.11 | - | - | - | - |
| Oxide Waste | 2,713,383 | 1,442,951 | 2,086,748 | 597,909 | 191,169 | 1,550,517 | 2,085,844 | 2,140,360 | 1,978,185 | 3,322,567 | 918,366 | 81,707 | 1,045,748 | - | - | - | - |
| Oxide Ore & Waste | 2,987,867 | 1,699,167 | 2,166,326 | 707,445 | 229,881 | 1,581,042 | 2,245,162 | 2,205,193 | 2,299,065 | 3,440,074 | 934,664 | 82,939 | 1,086,332 | - | - | - | - |
| Trans Ore (Tonnes) | 91,927 | 191,820 | 149,582 | 93,467 | 92,763 | 91,086 | 40,183 | 21,171 | 81,587 | 341,223 | 255,904 | 51,915 | 17,472 | - | - | - | - |
| Trans Ore (g/t) | 2.18 | 2.86 | 1.63 | 0.87 | 1.01 | 1.01 | 1.57 | 1.04 | 1.05 | 3.10 | 1.29 | 0.91 | 2.72 | - | - | - | - |
| Trans Waste | 1,296,460 | 1,097,386 | 2,134,297 | 1,410,330 | 732,696 | 1,524,586 | 1,929,790 | 1,276,813 | 1,629,170 | 2,700,193 | 2,878,323 | 1,367,761 | 367,706 | - | - | - | - |
| Trans Ore & Waste | 1,388,387 | 1,289,207 | 2,283,879 | 1,503,798 | 825,459 | 1,615,673 | 1,969,973 | 1,297,984 | 1,710,757 | 3,041,416 | 3,134,227 | 1,419,675 | 385,177 | - | - | - | - |
| Hard Ore (Tonnes) | 42,968 | 186,569 | 346,182 | 554,797 | 1,246,759 | 1,522,363 | 1,269,055 | 1,262,780 | 1,059,983 | 1,122,314 | 1,091,578 | 1,439,843 | 1,496,521 | 1,386,337 | 1,110,020 | 915,073 | - |
| Hard Ore (g/t) | 1.37 | 2.14 | 1.73 | 1.49 | 1.63 | 1.48 | 1.29 | 1.86 | 1.57 | 1.26 | 1.31 | 1.22 | 1.29 | 1.65 | 1.41 | 1.70 | - |
| Hard Waste | 508,278 | 1,766,057 | 4,054,862 | 6,824,336 | 7,781,025 | 6,839,042 | 7,984,725 | 9,294,444 | 14,640,194 | 12,160,196 | 14,549,531 | 15,490,042 | 12,148,632 | 12,887,663 | 13,175,550 | 1,102,370 | - |
| Hard Ore & Waste | 551,246 | 1,952,626 | 4,401,044 | 7,379,132 | 9,027,784 | 8,361,405 | 9,253,780 | 10,557,224 | 15,700,177 | 13,282,510 | 15,641,109 | 16,929,886 | 13,645,153 | 14,273,999 | 14,285,570 | 2,017,443 | - |
| Total Ore (Tonnes) | 409,378 | 634,606 | 575,342 | 757,800 | 1,378,235 | 1,643,974 | 1,468,556 | 1,348,784 | 1,462,450 | 1,581,043 | 1,363,781 | 1,492,990 | 1,554,578 | 1,386,337 | 1,110,020 | 915,073 | - |
| Total Ore (g/t) | 2.00 | 2.11 | 1.62 | 1.33 | 1.56 | 1.45 | 1.27 | 1.85 | 1.63 | 1.85 | 1.30 | 1.21 | 1.32 | 1.65 | 1.41 | 1.70 | - |
| Total Waste | 4,518,121 | 4,306,394 | 8,275,908 | 8,832,575 | 8,704,890 | 9,914,145 | 12,000,359 | 12,711,617 | 18,247,549 | 18,182,956 | 18,346,219 | 16,939,510 | 13,562,085 | 12,887,663 | 13,175,550 | 1,102,370 | - |
| Total Ore & Waste | 4,927,500 | 4,941,000 | 8,851,250 | 9,590,375 | 10,083,125 | 11,558,119 | 13,468,915 | 14,060,401 | 19,709,999 | 19,763,999 | 19,709,999 | 18,432,500 | 15,116,663 | 14,273,999 | 14,285,570 | 2,017,443 | - |
| MILL FEED Summary | |||||||||||||||||
| Oxide Ore (Tonnes) | 348,730 | 187,710 | 57,425 | 208,941 | 73,014 | 29,574 | 159,318 | 66,452 | 308,940 | 117,506 | 21,063 | - | 40,585 | 2,241 | 7,930 | - | 1,629,430 |
| Oxide Ore (g/t) | 2.00 | 1.40 | 1.24 | 1.28 | 1.17 | 1.20 | 1.02 | 2.07 | 1.98 | 3.92 | 0.97 | - | 2.11 | 1.65 | 1.65 | - | 1.79 |
| Trans Ore (Tonnes) | 91,927 | 150,814 | 136,218 | 133,167 | 106,462 | 77,843 | 40,183 | 27,971 | 81,587 | 308,576 | 269,834 | 51,538 | 17,472 | 5,842 | 20,668 | - | 1,520,100 |
| Trans Ore (g/t) | 2.18 | 2.68 | 1.72 | 1.46 | 1.25 | 1.01 | 1.57 | 1.06 | 1.05 | 3.27 | 1.30 | 0.92 | 2.72 | 1.41 | 1.41 | - | 1.92 |
| Hard Ore (Tonnes) | 42,968 | 146,426 | 289,982 | 625,143 | 1,271,034 | 1,347,066 | 1,251,009 | 1,356,088 | 1,059,983 | 1,028,401 | 1,159,613 | 1,398,972 | 1,392,453 | 1,446,401 | 1,322,530 | 915,073 | 16,053,143 |
| Hard Ore (g/t) | 1.37 | 2.15 | 1.69 | 1.55 | 1.63 | 1.39 | 1.25 | 1.89 | 1.57 | 1.26 | 1.34 | 1.23 | 1.31 | 1.64 | 1.40 | 1.70 | 1.48 |
| 483,625 | 484,950 | 483,625 | 967,250 | 1,450,510 | 1,454,484 | 1,450,510 | 1,450,510 | 1,450,510 | 1,454,484 | 1,450,510 | 1,450,510 | 1,450,510 | 1,454,484 | ||||
| Total Ore (Tonnes) | 483,625 | 484,950 | 483,625 | 967,250 | 1,450,510 | 1,454,484 | 1,450,510 | 1,450,510 | 1,450,510 | 1,454,484 | 1,450,510 | 1,450,510 | 1,450,510 | 1,454,484 | 1,351,128 | 915,073 | 19,202,673 |
| Hard Ore (g/t) | 1.98 | 2.02 | 1.64 | 1.48 | 1.58 | 1.37 | 1.23 | 1.88 | 1.63 | 1.90 | 1.33 | 1.22 | 1.35 | 1.64 | 1.40 | 1.70 | 1.54 |
| Oz Fed to Plant | 30,748 | 31,540 | 25,534 | 45,975 | 73,767 | 64,004 | 57,394 | 87,814 | 75,987 | 88,989 | 61,959 | 56,839 | 62,911 | 76,537 | 60,916 | 50,091 | 951,012 |
| Oxide Waste | 2,713,383 | 1,442,951 | 2,086,748 | 597,909 | 191,169 | 1,550,517 | 2,085,844 | 2,140,360 | 1,978,185 | 3,322,567 | 918,366 | 81,707 | 1,045,748 | - | - | - | - |
| Trans Waste | 1,296,460 | 1,097,386 | 2,134,297 | 1,410,330 | 732,696 | 1,524,586 | 1,929,790 | 1,276,813 | 1,629,170 | 2,700,193 | 2,878,323 | 1,367,761 | 367,706 | - | - | - | - |
| Hard Waste | 508,278 | 1,766,057 | 4,054,862 | 6,824,336 | 7,781,025 | 6,839,042 | 7,984,725 | 9,294,444 | 14,640,194 | 12,160,196 | 14,549,531 | 15,490,042 | 12,148,632 | 12,887,663 | 13,175,550 | 1,102,370 | - |
| Total | 4,518,121 | 4,306,394 | 8,275,908 | 8,832,575 | 8,704,890 | 9,914,145 | 12,000,359 | 12,711,617 | 18,247,549 | 18,182,956 | 18,346,219 | 16,939,510 | 13,562,085 | 12,887,663 | 13,175,550 | 1,102,370 | |
| SR | 9.34 | 8.88 | 17.11 | 9.13 | 6.00 | 6.82 | 8.27 | 8.76 | 12.58 | 12.50 | 12.65 | 11.68 | 9.35 | 8.86 | 9.75 | 1.20 | 9.56 |
| | Page 231 |
| | NI43-101 ITR - Updated Mineral Resource Estimate for Buckreef Gold Project |
Table 32.2 Buckreef Project Summary of Schedule of Milled Tonnages
| Period | 1 | 2 | 3 | 4 | 5 | 6 | 7 | 8 | 9 | 10 | 11 | 12 | 13 | 14 | 15 | 16 |
| MINING Summary | ||||||||||||||||
| Oxide Ore (Tonnes) | 274 | 256 | 80 | 110 | 39 | 31 | 159 | 65 | 321 | 118 | 16 | 1 | 41 | - | - | - |
| Oxide Ore (g/t) | 2.04 | 1.53 | 1.13 | 0.89 | 0.70 | 1.22 | 1.02 | 2.08 | 1.98 | 3.92 | 0.74 | 0.79 | 2.11 | - | - | - |
| Oxide Waste | 2,713 | 1,443 | 2,087 | 598 | 191 | 1,551 | 2,086 | 2,140 | 1,978 | 3,323 | 918 | 82 | 1,046 | - | - | - |
| Oxide Ore & Waste | 2,988 | 1,699 | 2,166 | 707 | 230 | 1,581 | 2,245 | 2,205 | 2,299 | 3,440 | 935 | 83 | 1,086 | - | - | - |
| Trans Ore (Tonnes) | 92 | 192 | 150 | 93 | 93 | 91 | 40 | 21 | 82 | 341 | 256 | 52 | 17 | - | - | - |
| Trans Ore (g/t) | 2.18 | 2.86 | 1.63 | 0.87 | 1.01 | 1.01 | 1.57 | 1.04 | 1.05 | 3.10 | 1.29 | 0.91 | 2.72 | - | - | - |
| Trans Waste | 1,296 | 1,097 | 2,134 | 1,410 | 733 | 1,525 | 1,930 | 1,277 | 1,629 | 2,700 | 2,878 | 1,368 | 368 | - | - | - |
| Trans Ore & Waste | 1,388 | 1,289 | 2,284 | 1,504 | 825 | 1,616 | 1,970 | 1,298 | 1,711 | 3,041 | 3,134 | 1,420 | 385 | - | - | - |
| Hard Ore (Tonnes) | 43 | 187 | 346 | 555 | 1,247 | 1,522 | 1,269 | 1,263 | 1,060 | 1,122 | 1,092 | 1,440 | 1,497 | 1,386 | 1,110 | 915 |
| Hard Ore (g/t) | 1.37 | 2.14 | 1.73 | 1.49 | 1.63 | 1.48 | 1.29 | 1.86 | 1.57 | 1.26 | 1.31 | 1.22 | 1.29 | 1.65 | 1.41 | 1.70 |
| Hard Waste | 508 | 1,766 | 4,055 | 6,824 | 7,781 | 6,839 | 7,985 | 9,294 | 14,640 | 12,160 | 14,550 | 15,490 | 12,149 | 12,888 | 13,176 | 1,102 |
| Hard Ore & Waste | 551 | 1,953 | 4,401 | 7,379 | 9,028 | 8,361 | 9,254 | 10,557 | 15,700 | 13,283 | 15,641 | 16,930 | 13,645 | 14,274 | 14,286 | 2,017 |
| Total Ore (Tonnes) | 409 | 635 | 575 | 758 | 1,378 | 1,644 | 1,469 | 1,349 | 1,462 | 1,581 | 1,364 | 1,493 | 1,555 | 1,386 | 1,110 | 915 |
| Total Ore (g/t) | 2.00 | 2.11 | 1.62 | 1.33 | 1.56 | 1.45 | 1.27 | 1.85 | 1.63 | 1.85 | 1.30 | 1.21 | 1.32 | 1.65 | 1.41 | 1.70 |
| Total Waste | 4,518 | 4,306 | 8,276 | 8,833 | 8,705 | 9,914 | 12,000 | 12,712 | 18,248 | 18,183 | 18,346 | 16,940 | 13,562 | 12,888 | 13,176 | 1,102 |
| Total Ore & Waste | 4,927 | 4,941 | 8,851 | 9,590 | 10,083 | 11,558 | 13,469 | 14,060 | 19,710 | 19,764 | 19,710 | 18,432 | 15,117 | 14,274 | 14,286 | 2,017 |
| MILL FEED Summary | ||||||||||||||||
| Oxide Ore (Tonnes) | 349 | 188 | 57 | 209 | 73 | 30 | 159 | 66 | 309 | 118 | 21 | - | 41 | 2 | 8 | - |
| Oxide Ore (g/t) | 2.00 | 1.40 | 1.24 | 1.28 | 1.17 | 1.20 | 1.02 | 2.07 | 1.98 | 3.92 | 0.97 | - | 2.11 | 1.65 | 1.65 | - |
| Trans Ore (Tonnes) | 92 | 151 | 136 | 133 | 106 | 78 | 40 | 28 | 82 | 309 | 270 | 52 | 17 | 6 | 21 | - |
| Trans Ore (g/t) | 2.18 | 2.68 | 1.72 | 1.46 | 1.25 | 1.01 | 1.57 | 1.06 | 1.05 | 3.27 | 1.30 | 0.92 | 2.72 | 1.41 | 1.41 | - |
| Hard Ore (Tonnes) | 43 | 146 | 290 | 625 | 1,271 | 1,347 | 1,251 | 1,356 | 1,060 | 1,028 | 1,160 | 1,399 | 1,392 | 1,446 | 1,323 | 915 |
| Hard Ore (g/t) | 1.37 | 2.15 | 1.69 | 1.55 | 1.63 | 1.39 | 1.25 | 1.89 | 1.57 | 1.26 | 1.34 | 1.23 | 1.31 | 1.64 | 1.40 | 1.70 |
| 484 | 485 | 484 | 967 | 1,451 | 1,454 | 1,451 | 1,451 | 1,451 | 1,454 | 1,451 | 1,451 | 1,451 | 1,454 | 1,351 | 915 | |
| Total Ore (Tonnes) | 484 | 485 | 484 | 967 | 1,451 | 1,454 | 1,451 | 1,451 | 1,451 | 1,454 | 1,451 | 1,451 | 1,451 | 1,454 | 1,351 | 915 |
| Hard Ore (g/t) | 1.98 | 2.02 | 1.64 | 1.48 | 1.58 | 1.37 | 1.23 | 1.88 | 1.63 | 1.90 | 1.33 | 1.22 | 1.35 | 1.64 | 1.40 | 1.70 |
| Oz Fed to Plant | 31 | 32 | 26 | 46 | 74 | 64 | 57 | 88 | 76 | 89 | 62 | 57 | 63 | 77 | 61 | 50 |
| Oxide Waste | 2,713 | 1,443 | 2,087 | 598 | 191 | 1,551 | 2,086 | 2,140 | 1,978 | 3,323 | 918 | 82 | 1,046 | - | - | - |
| Trans Waste | 1,296 | 1,097 | 2,134 | 1,410 | 733 | 1,525 | 1,930 | 1,277 | 1,629 | 2,700 | 2,878 | 1,368 | 368 | - | - | - |
| Hard Waste | 508 | 1,766 | 4,055 | 6,824 | 7,781 | 6,839 | 7,985 | 9,294 | 14,640 | 12,160 | 14,550 | 15,490 | 12,149 | 12,888 | 13,176 | 1,102 |
| | Page 232 |
| | NI43-101 ITR - Updated Mineral Resource Estimate for Buckreef Gold Project |
Table 32.3: Full Schedule of Staffing Requirements of the Buckreef Project
| 2019 | 2020 | 2021 | 2022 | 2023 | 2024 | 2025 | 2026 | 2027 | 2028 | 2029 | 2030 | 2031 | 2032 | 2033 | 2034 | 2035 | |||
| MANAGEMENT | (US$) | ||||||||||||||||||
| Chief Operating Officer | M | 120,000 | 1 | 1 | 1 | 1 | 1 | 1 | 1 | 1 | 1 | 1 | 1 | 1 | 1 | 1 | 1 | 1 | 1 |
| General Manager | 0 | 0 | 0 | 0 | 0 | 0 | 0 | 0 | 0 | 0 | 0 | 0 | 0 | 0 | 0 | 0 | 0 | 0 | |
| Executive Secretary | S | 42,000 | 1 | 1 | 1 | 1 | 1 | 1 | 1 | 1 | 1 | 1 | 1 | 1 | 1 | 1 | 1 | 1 | 1 |
| TOTAL | 162,000 | 2 | 2 | 2 | 2 | 2 | 2 | 2 | 2 | 2 | 2 | 2 | 2 | 2 | 2 | 2 | 2 | 2 | |
| MINE OPERATION | |||||||||||||||||||
| Mine /Production Manager | M | 72,000 | 1 | 1 | 1 | 1 | 1 | 1 | 1 | 1 | 1 | 1 | 1 | 1 | 1 | 1 | 1 | 1 | |
| Pit Superintendent | 0 | 0 | 0 | 0 | 0 | 0 | 0 | 0 | 0 | 0 | 0 | 0 | 0 | 0 | 0 | 0 | 0 | ||
| Shift Supervisor | S | 12,000 | 2 | 2 | 2 | 2 | 2 | 2 | 2 | 2 | 2 | 2 | 2 | 2 | 2 | 2 | 2 | 2 | |
| Driller-Contractor/Supervisor | C | 9,000 | 1 | 1 | 1 | 1 | 1 | 1 | 1 | 1 | 1 | 1 | 1 | 1 | 1 | 1 | 1 | 1 | |
| Blasters-Contractor/Supervisor | C | 9,000 | 1 | 1 | 1 | 1 | 1 | 1 | 1 | 1 | 1 | 1 | 1 | 1 | 1 | 1 | 1 | 1 | |
| Loader Operator | S | 9,600 | 2 | 2 | 2 | 2 | 2 | 2 | 2 | 2 | 2 | 2 | 2 | 2 | 2 | 2 | 2 | 2 | |
| Excavator Operator | S | 9,600 | 1 | 2 | 2 | 2 | 2 | 2 | 2 | 2 | 2 | 2 | 2 | 2 | 2 | 2 | 2 | 2 | 2 |
| Truck Driver /Dumper | S | 8,400 | 1 | 10 | 10 | 10 | 5 | 10 | 10 | 10 | 10 | 10 | 10 | 10 | 10 | 10 | 10 | 10 | 10 |
| Wheel Dozer Operator | S | 9,600 | 1 | 2 | 2 | 2 | 2 | 2 | 2 | 2 | 2 | 2 | 2 | 2 | 2 | 2 | 2 | 2 | 2 |
| Track Dozer Operator | S | 9,600 | 1 | 2 | 2 | 2 | 2 | 2 | 2 | 2 | 2 | 2 | 2 | 2 | 2 | 2 | 2 | 2 | 2 |
| Water Truck Operator | S | 8,400 | 1 | 2 | 2 | 2 | 2 | 2 | 2 | 2 | 2 | 2 | 2 | 2 | 2 | 2 | 2 | 2 | 2 |
| Grader Operator | S | 9,600 | 2 | 2 | 2 | 2 | 2 | 2 | 2 | 2 | 2 | 2 | 2 | 2 | 2 | 2 | 2 | 2 | |
| Lube Fuel Truck Operator | S | 9,000 | 1 | 1 | 1 | 1 | 1 | 1 | 1 | 1 | 1 | 1 | 1 | 1 | 1 | 1 | 1 | 1 | |
| Ore Spotter | S | 9,000 | 2 | 2 | 2 | 2 | 6 | 2 | 2 | 2 | 2 | 2 | 2 | 2 | 2 | 2 | 2 | 2 | 2 |
| Pit Pump Operator | S | 9,000 | 2 | 2 | 2 | 2 | 2 | 2 | 2 | 2 | 2 | 2 | 2 | 2 | 2 | 2 | 2 | 2 | 2 |
| Laborer | L | 9,000 | 3 | 4 | 4 | 4 | 4 | 4 | 4 | 4 | 4 | 4 | 4 | 4 | 4 | 4 | 4 | 4 | 4 |
| TOTAL | 202,800 | 12 | 36 | 36 | 36 | 35 | 36 | 36 | 36 | 36 | 36 | 36 | 36 | 36 | 36 | 36 | 36 | 36 | |
| MINING ENGINEERING | |||||||||||||||||||
| Engineering Manager | 60,000 | 0 | 0 | 0 | 0 | 1 | 0 | 0 | 0.0 | 0.0 | 0.0 | 0.0 | 0.0 | 0.0 | 0.0 | 0.0 | 0.0 | 0.0 | |
| Shift Supervisor | S | 30,000 | 2 | 3 | 4 | 5 | 4 | 7 | 4 | 3 | 3 | 3 | 3 | 3 | 3 | 3 | 3 | 3 | 3 |
| Mine Engineers | S | 24,000 | 1 | 2 | 2 | 2 | 2 | 2 | 1 | ||||||||||
| Fitters and Mechanics | S | 12,000 | 10 | 20 | 20 | 20 | 20 | 10 | 10 | ||||||||||
| Fuel Bay Attendants Fitter Asst | L | 6,000 | 4 | 4 | 4 | 4 | 14 | 4 | 4 | 2 | 2 | 2 | 2 | 2 | 2 | 2 | 2 | 2 | 2 |
| Data Clerks | L | 6,000 | 1 | 1 | 1 | 1 | 1 | 1 | 1 | 11 | 7 | 7 | 7 | 7 | 7 | 7 | 7 | 7 | 7 |
| TOTAL | 18 | 30 | 31 | 32 | 42 | 24 | 20 | 16 | 12 | 12 | 12 | 12 | 12 | 12 | 12 | 12 | 12 | ||
| TECHNICAL SERVICES | |||||||||||||||||||
| Geology Manager | 0 | 0 | 0 | 0 | 0 | 0 | 0 | 0 | 0.0 | ||||||||||
| Mine Surveyor | S | 30,000 | 2 | 2 | 2 | 2 | 3 | 3 | 3 | ||||||||||
| 2019 | 2020 | 2021 | 2022 | 2023 | 2024 | 2025 | 2026 | 2027 | 2028 | 2029 | 2030 | 2031 | 2032 | 2033 | 2034 | 2035 |
| | Page 233 |
| | NI43-101 ITR - Updated Mineral Resource Estimate for Buckreef Gold Project |
| Geotechnical Engineer | L | 21,600 | 1 | 1 | 1 | 1 | 1 | 1 | 1 | ||||||||||
| Survey Technician | L | 10,800 | 1 | 3 | 3 | 3 | 4 | 4 | 4 | ||||||||||
| Geotechnical Technicisn | L | 10,800 | 1 | 2 | 2 | 2 | 2 | 2 | 2 | 1 | 1 | 1 | 1 | 1 | 1 | 1 | 1 | 1 | 1 |
| Mine/Exploration Geologist | S | 36,000 | 2 | 2 | 2 | 2 | 2 | 2 | 1 | ||||||||||
| Resource Geologist | 0 | 0 | 0 | 0 | 0 | 0 | 0 | 0 | |||||||||||
| Geology Technician | L | 10,800 | 4 | 2 | 4 | 4 | 4 | 4 | 4 | ||||||||||
| Data Clerk | L | 6,000 | 1 | 1 | 1 | 1 | 1 | 1 | 1 | 1 | 1 | 1 | 1 | 1 | 1 | 1 | 1 | 1 | 1 |
| TOTAL | 12 | 13 | 15 | 15 | 17 | 17 | 16 | 2 | 2 | 2 | 2 | 2 | 2 | 2 | 2 | 2 | 2 | ||
| PROCESS PLANT | |||||||||||||||||||
| Plant Manager/Supritendent | M | 72,000 | 1 | 1 | 1 | 1 | 1 | 1 | 1 | 1 | 1 | 1 | 1 | 1 | 1 | 1 | 1 | 1 | |
| Process/Maintanance Engineer | S | 30,000 | 1 | 1 | 1 | 0 | 1 | 1 | 1 | 1 | 1 | 1 | 1 | 1 | 1 | 1 | 1 | 1 | |
| Shift Supervisor | S | 30,000 | 2 | 2 | 2 | 0 | 2 | 2 | 2 | 2 | 2 | 2 | 2 | 2 | 2 | 2 | 2 | 2 | |
| Gold Room Supervisor | S | 30,000 | 2 | 2 | 2 | 0 | 2 | 2 | 2 | 2 | 2 | 2 | 2 | 2 | 2 | 2 | 2 | 2 | |
| Operators | L | 10,800 | 20 | 20 | 20 | 0 | 20 | 20 | 20 | 20 | 20 | 20 | 20 | 20 | 20 | 20 | 20 | 20 | |
| Fitters and Mechanics | S | 10,800 | 2 | 2 | 2 | 0 | 2 | 2 | 2 | 2 | 2 | 2 | 2 | 2 | 2 | 2 | 2 | 2 | |
| Metallurgist | S | 24,000 | 1 | 1 | 1 | 1 | 0 | 1 | 1 | 1 | 1 | 1 | 1 | 1 | 1 | 1 | 1 | 1 | 1 |
| Effluent Treatment Operator | L | 8,400 | 2 | 2 | 2 | 0 | 2 | 2 | 2 | 2 | 2 | 2 | 2 | 2 | 2 | 2 | 2 | 2 | |
| TOTAL | 1 | 31 | 31 | 31 | 1 | 31 | 31 | 31 | 31 | 31 | 31 | 31 | 31 | 31 | 31 | 31 | 31 | ||
| SAFETY, HEALTH & ENVIRONMENT | |||||||||||||||||||
| SHE Manager | M | 60,000 | 1 | 1 | 1 | 1 | 1 | 1 | 1 | 1 | 1 | 1 | 1 | 1 | 1 | 1 | 1 | 1 | |
| Medical Doctor | S | 36,000 | 1 | 1 | 1 | 1 | 1 | 1 | 1 | 1 | 1 | 1 | 1 | 1 | 1 | 1 | 1 | 1 | |
| Safety/Environment Officer | S | 30,000 | 1 | 2 | 2 | 2 | 2 | 2 | 2 | 2 | 2 | 2 | 2 | 2 | 2 | 2 | 2 | 2 | 2 |
| Nurse | S | 11,400 | 2 | 2 | 2 | 2 | 2 | 2 | 2 | 2 | 2 | 2 | 2 | 2 | 2 | 2 | 2 | 2 | |
| Lab Technician | S | 11,400 | 1 | 2 | 2 | 2 | 2 | 2 | 2 | 2 | 2 | 2 | 2 | 2 | 2 | 2 | 2 | 2 | 2 |
| TOTAL | 2 | 8 | 8 | 8 | 8 | 8 | 8 | 8 | 8 | 8 | 8 | 8 | 8 | 8 | 8 | 8 | 8 | ||
| METALLURGICAL LABORATORY | |||||||||||||||||||
| Chief Chemist | S | 36,000 | 1 | 1 | 1 | 1 | 1 | 1 | 1 | 1 | 1 | 1 | 1 | 1 | 1 | 1 | 1 | 1 | |
| Assayers | S | 8,400 | 2 | 2 | 2 | 2 | 2 | 2 | 2 | 2 | 2 | 2 | 2 | 2 | 2 | 2 | 2 | 2 | |
| Sample Preparation | L | 8,400 | 2 | 2 | 2 | 2 | 2 | 2 | 2 | 2 | 2 | 2 | 2 | 2 | 2 | 2 | 2 | 2 | |
| Instrumentation Techn. | S | 10,800 | 1 | 1 | 1 | 1 | 1 | 1 | 1 | 1 | 1 | 1 | 1 | 1 | 1 | 1 | 1 | 1 | |
| TOTAL | 0 | 6 | 6 | 6 | 6 | 6 | 6 | 6 | 6 | 6 | 6 | 6 | 6 | 6 | 6 | 6 | 6 | ||
| HUMAN RESOURCES | |||||||||||||||||||
| Human Resource Manager | 0 | 0 | 0 | 0 | 0 | 0 | 0 | 0 | 0 | 0 | 0 | 0 | 0 | 0 | 0 | 0 | 0 | 0 | |
| HR Officer | S | 30,000 | 2 | 2 | 2 | 2 | 2 | 2 | 2 | 2 | 2 | 2 | 2 | 2 | 2 | 2 | 2 | 2 | |
| Community Relations Officer | S | 18,000 | 1 | 2 | 2 | 2 | 2 | 2 | 2 | 2 | 2 | 2 | 2 | 2 | 2 | 2 | 2 | 2 | 2 |
| 2019 | 2020 | 2021 | 2022 | 2023 | 2024 | 2025 | 2026 | 2027 | 2028 | 2029 | 2030 | 2031 | 2032 | 2033 | 2034 | 2035 |
| | Page 234 |
| | NI43-101 ITR - Updated Mineral Resource Estimate for Buckreef Gold Project |
| Administration Officer | S | 18,000 | 2 | 2 | 2 | 2 | 2 | 2 | 2 | 2 | 2 | 2 | 2 | 2 | 2 | 2 | 2 | 2 | |
| TOTAL | 1 | 6 | 6 | 6 | 6 | 6 | 6 | 6 | 6 | 6 | 6 | 6 | 6 | 6 | 6 | 6 | 6 | ||
| PURCHASING | |||||||||||||||||||
| Chief Buyer | S | 48,000 | 1 | 1 | 1 | 1 | 1 | 1 | 1 | 1 | 1 | 1 | 1 | 1 | 1 | 1 | 1 | 1 | 1 |
| Procurement Officer | S | 12,000 | 1 | 1 | 1 | 1 | 1 | 1 | 1 | 1 | 1 | 1 | 1 | 1 | 1 | 1 | 1 | 1 | |
| Receiving Supervisor | 0 | 0 | 0 | 0 | 0 | 0 | 0 | 0 | 0 | 0 | 0 | 0 | 0 | 0 | 0 | 0 | 0 | ||
| Data Clerks | L | 7,200 | 2 | 2 | 2 | 2 | 2 | 2 | 2 | 2 | 2 | 2 | 2 | 2 | 2 | 2 | 2 | 2 | |
| TOTAL | 1 | 4 | 4 | 4 | 4 | 4 | 4 | 4 | 4 | 4 | 4 | 4 | 4 | 4 | 4 | 4 | 4 | ||
| ACCOUNTING | |||||||||||||||||||
| Chief Accountant | M | 72,000 | 1 | 1 | 1 | 1 | 1 | 1 | 1 | 1 | 1 | 1 | 1 | 1 | 1 | 1 | 1 | 1 | 1 |
| Accountant/Payroll Officer | S | 36,000 | 1 | 1 | 1 | 1 | 1 | 1 | 1 | 1 | 1 | 1 | 1 | 1 | 1 | 1 | 1 | 1 | 1 |
| Accountant/Accounts payable officer | S | 36,000 | 0 | 1 | 1 | 1 | 1 | 1 | 1 | 1 | 1 | 1 | 1 | 1 | 1 | 1 | 1 | 1 | 1 |
| Cost accountant/PPE | S | 48,000 | 0 | 1 | 1 | 1 | 1 | 1 | 1 | 1 | 1 | 1 | 1 | 1 | 1 | 1 | 1 | 1 | 1 |
| IT Technician | S | 18,000 | 0 | 1 | 1 | 1 | 1 | 1 | 1 | 1 | 1 | 1 | 1 | 1 | 1 | 1 | 1 | 1 | 1 |
| TOTAL | 2 | 5 | 5 | 5 | 5 | 5 | 5 | 5 | 5 | 5 | 5 | 5 | 5 | 5 | 5 | 5 | 5 | ||
| CAMP | |||||||||||||||||||
| Camp Manager | S | 42,000 | 1 | 1 | 1 | 1 | 1 | 1 | 1 | 1 | 1 | 1 | 1 | 1 | 1 | 1 | 1 | 1 | 1 |
| Chief Cook | S | 30,000 | 1 | 1 | 1 | 1 | 1 | 1 | 1 | 1 | 1 | 1 | 1 | 1 | 1 | 1 | 1 | 1 | 1 |
| Assistant Cook | L | 10,200 | 2 | 2 | 2 | 2 | 2 | 2 | 2 | 2 | 2 | 2 | 2 | 2 | 2 | 2 | 2 | 2 | 2 |
| Kitchen Assistant | L | 10,200 | 2 | 2 | 2 | 2 | 2 | 2 | 2 | 2 | 2 | 2 | 2 | 2 | 2 | 2 | 2 | 2 | 2 |
| Office Cleaners | L | 7,200 | 2 | 2 | 2 | 2 | 2 | 2 | 2 | 2 | 2 | 2 | 2 | 2 | 2 | 2 | 2 | 2 | 2 |
| TOTAL | 8 | 8 | 8 | 8 | 8 | 8 | 8 | 8 | 8 | 8 | 8 | 8 | 8 | 8 | 8 | 8 | 8 |
| | Page 235 |
| | NI43-101 ITR - Updated Mineral Resource Estimate for Buckreef Gold Project |
Table 32.4: Summary of Capital Costs Estimates
| 60tph Prod | 120tph Prod | 180tph Prod | |||||||||
| Item | Capital Description | No | Unit Cost | Total Capex | Year 0 | Year 1 | Year 2 | Year 3 | Year 4 | Year 5 | Year 6 |
| Capital Plan | USD | USD | |||||||||
| 1 | Mining | ||||||||||
| 1.1 | Mining Equipment ( Fleet) | 1 | 17,531,424 | 17,531,424 | 8,737,653 | 4,581,271 | 4,212,500 | ||||
| 1.2 | Loader | 3 | 265,500 | 796,500 | 796,500 | ||||||
| 1.3 | Water Truck | 0 | 100,000 | 100,000 | 100,000 | ||||||
| 1.4 | Service Truck | 1 | 100,000 | 100,000 | 100,000 | ||||||
| 1.5 | Light Trucks & Cars | 8 | 41,500 | 332,000 | 166,000 | 166,000 | |||||
| 1.6 | Dewatering Pump | 4 | 40,000 | 160,000 | 160,000 | ||||||
| 1.7 | Survey Tools | 1 | 45,000 | 45,000 | 45,000 | ||||||
| 1.8 | Pit Optimisation | 1 | 75,000 | 75,000 | 75,000 | ||||||
| 1.9 | Mining Offices/Shop | 1 | 300,000 | 300,000 | 300,000 | ||||||
| 1.1 | Haul Roads | 1 | 100,000 | 100,000 | 100,000 | ||||||
| 1.11 | HME - Workshop Construction | 1 | 700,000 | 700,000 | 700,000 | ||||||
| 1.12 | Explosive magazine | 1 | 150,000 | 150,000 | 150,000 | ||||||
| 1.13 | Fuel Tanks with a Capacity to hold 400klt | 1 | 240,000 | 240,000 | 240,000 | ||||||
| Subtotal Mining | 20,629,924 | 11,520,153 | 4,897,271 | 0 | 4,212,500 | ||||||
| 2 | Processing Plant | ||||||||||
| 2.1 | TSF Construction & Design | 1 | 1,750,000 | 1,750,000 | 1,250,000 | 250,000 | 250,000 | ||||
| 2.2 | Portable Water Plant | 1 | 600,000 | 600,000 | 300,000 | 300,000 | |||||
| 2.3 | Laboratory | 1 | 500,000 | 500,000 | 500,000 | ||||||
| 2.4 | Process Plant Development | 1 | 35,284,625 | 35,284,625 | 11,500,000 | 150,000 | 11,500,000 | 12,134,625 | |||
| 2.5 | Generators 4No x 2.5MVa | 1 | 1,243,000 | 1,243,000 | 414,333 | - | 414,333 | 414,333 | |||
| 2.6 | Substation and Power Reticulation | 1 | 500,000 | 500,000 | 500,000 | ||||||
| 2.7 | Engineering Workshop for Plant +tools | 1 | 400,000 | 400,000 | 400,000 | ||||||
| Subtotal Processing Plant | 40,277,625 | 40,277,625 | 14,864,333 | 150,000 | 12,464,333 | 12,798,958 | |||||
| 3 | Human Resources & Community | ||||||||||
| 3.1 | Camping Facilities | 1 | 250,000 | 250,000 | 250,000 | ||||||
| 3.2 | Camp Houses (2Bx20+4Bx30) | 50 | 15,000 | 750,000 | 750,000 | ||||||
| 3.3 | Relocation of Mnekezi road | 1 | 250,000 | 250,000 | 250,000 | ||||||
| 3.4 | Airport/Aerodrome | 1 | 35,000 | 35,000 | 35,000 | ||||||
| 3.5 | Helicopter Pad | 1 | 10,000 | 10,000 | 10,000 | ||||||
| 3.6 | Compensation - Relocation from SML | 1 | 2,500,000 | 2,500,000 | 2,500,000 | ||||||
| 3.7 | Sewer Ponds & Facilities | 1 | 350,000 | 350,000 | 350,000 | ||||||
| 3.8 | Security fencing | 1 | 520,000 | 520,000 | 520,000 | ||||||
| Subtotal Human Resources & Community | 3,930,000 | 4,665,000 | 4,665,000 | 0 | 0 | 0 | |||||
| 4 | HSE | ||||||||||
| 4.1 | Clinic | 1 | 100,000 | 100,000 | 100,000 | ||||||
| | Page 236 |
| | NI43-101 ITR - Updated Mineral Resource Estimate for Buckreef Gold Project |
| 60tph Prod | 120tph Prod | 180tph Prod | |||||||||
| Item | Capital Description | No | Unit Cost | Total Capex | Year 0 | Year 1 | Year 2 | Year 3 | Year 4 | Year 5 | Year 6 |
| 4.2 | Waste Handling Facilties | 1 | 75,000 | 75,000 | 75,000 | ||||||
| Subtotal HSE | 175,000 | 175,000 | 175,000 | 0 | 0 | 0 | |||||
| 5 | Finance + IT | ||||||||||
| 5.1 | Computer & Server | 1 | 40,000 | 40,000 | 40,000 | ||||||
| 5.2 | Desktop | 1 | 45,000 | 45,000 | 45,000 | ||||||
| 5.3 | Laptop | 1 | 30,000 | 30,000 | 30,000 | ||||||
| 5.4 | Networking & Communication | 1 | 40,000 | 40,000 | 40,000 | ||||||
| 5.5 | Process Plant Insurance - 6% Plant Cost | 1 | 600,000 | 600,000 | 600,000 | ||||||
| 5.6 | Mining Equipment Insurance - 2.5% Equip Cost | 1 | 19,913 | 19,913 | 19,913 | ||||||
| Subtotal Finance +IT | 774,913 | 774,913 | 774,913 | 0 | 0 | 0 | |||||
| 6 | Contingency 15% | 15% | 9,978,369 | 4,799,910 | 757,091 | 1,869,650 | 2,551,719 | ||||
| 7 | Total Capex | 76,500,831 | 36,799,309 | 5,804,362 | 14,333,983 | 19,563,177 | |||||
| For Depreciation | Total Capex | Year 0 | Year 1 | Year 2 | Year 3 | Year 4 | Year 5 | Year 6 | |||
| 1 | Plant and Equipment | US$ | 64,707,681 | 26,873,384 | 5,876,725 | 14,657,200 | 20,113,750 | ||||
| 2 | Building and Infrastructure | US$ | 11,059,500 | 10,887,000 | 3,952,500 | 3,780,000 | 3,780,000 | ||||
| 3 | Office & Computers Equipment | US$ | 891,150 | 891,150 | 0 | 0 | 0 | ||||
| 4 | Total | US$ | 76,658,331 | 38,651,534 | 9,829,225 | 18,437,200 | 23,893,750 | ||||
| | Page 237 |
| | NI43-101 ITR - Updated Mineral Resource Estimate for Buckreef Gold Project |
Table 32.50: Equipment Operating Costs\
| FUEL PRICE | USD 1.20 | Type | TRACKED BULL DOZER | TRACKED BULL DOZER | MOTOR GRADER | HYDRAULIC EXCAVATOR | HYDRAULIC EXCAVATOR | ARTICULATED DUMP TRUCK | FUEL BOWSER | WATER BOWSER | TRACKED DRILL RIG |
| ENGINE OIL | USD 4.60 | Make | BELL | CAT | CAT | CAT | LIEBHEER | BELL | BELL | BELL | Sandvik |
| TRANS OIL | USD 7.17 | Model | PR754 | D8R | 140H | 374 | R966 | B40D | B25E | B30E | |
| HYD OIL | USD 4.60 | kW | 123 | 112 | |||||||
| F / DRIVE OIL | USD 5.10 | kg | 32,000 | 17,083 | 13,529 | 32,000 | |||||
| Delivery Price | DP | USD 683,771.00 | USD 850,000.00 | USD 385,000.00 | USD 855,000.00 | USD 855,000.00 | USD 540,000.00 | USD 343,000.00 | USD 385,000.00 | USD 675,750.00 | |
| Residual Value At Replacement | RVR | USD 0.00 | USD 85,000.00 | USD 38,500.00 | USD 85,500.00 | USD 85,500.00 | USD 54,000.00 | USD 34,300.00 | USD 38,500.00 | USD 0.00 | |
| Value To Be Recovered Through Work | VRTW | USD 683,771.00 | USD 765,000.00 | USD 346,500.00 | USD 769,500.00 | USD 769,500.00 | USD 486,000.00 | USD 308,700.00 | USD 346,500.00 | USD 675,750.00 | |
| Estimated Ownership | N | years | 5 | 5 | 5 | 5 | 5 | 6 | 10 | 5 | 5 |
| Estimated Usage | H | hours/year | 7,200 | 7,200 | 7,200 | 7,200 | 7,200 | 7,200 | 4,500 | 7,200 | 7,200 |
| Ownership Usage | T | hours | 36,000 | 36,000 | 36,000 | 36,000 | 36,000 | 43,200 | 45,000 | 36,000 | 36,000 |
| Cost Per Hour | CPH | USD/hr | USD 18.99 | USD 21.25 | USD 9.63 | USD 21.38 | USD 21.38 | USD 11.25 | USD 6.86 | USD 9.63 | USD 18.77 |
| Simple Interest Rate | SI | % | 12% | 12% | 12% | 12% | 12% | 12% | 12% | 12% | 12% |
| Interest Costs | SIC | USD/hr | USD 6.84 | USD 8.50 | USD 3.85 | USD 8.55 | USD 8.55 | USD 5.25 | USD 5.03 | USD 3.85 | USD 6.76 |
| Insurance Rate | IN | % | 2% | 2% | 2% | 2% | 2% | 2% | 4% | 4% | 2% |
| Insurance Costs | INSC | USD/hr | USD 1.14 | USD 1.42 | USD 0.64 | USD 1.43 | USD 1.43 | USD 0.88 | USD 1.68 | USD 1.28 | USD 1.13 |
| TOTAL OWNING COSTS | TOC | USD/hr | USD 0.00 | USD 0.00 | USD 0.00 | USD 0.00 | USD 0.00 | USD 0.00 | USD 0.00 | USD 0.00 | USD 0.00 |
| Fuel Consumption Rate | F | litres/hour | 35 | 35 | 20 | 60 | 60 | 28 | 20 | 27 | 28 |
| Fuel Price | FP | USD/litre | USD 1.20 | USD 1.20 | USD 1.20 | USD 1.20 | USD 1.20 | USD 1.20 | USD 1.20 | USD 1.20 | USD 1.20 |
| Dry (D) Or Wet (W) Rate | D/W | w | w | w | w | w | w | w | w | w | w |
| Fuel Consumption | FC | USD/hour | USD 42.00 | USD 42.00 | USD 24.00 | USD 72.00 | USD 72.00 | USD 33.60 | USD 24.00 | USD 32.40 | USD 33.60 |
| Engine Oil Price | EOP | USD | USD 4.60 | USD 4.60 | USD 4.60 | USD 4.60 | USD 4.60 | USD 4.60 | USD 4.60 | USD 4.60 | USD 4.60 |
| Engine Oil Consumption Rate | EOCR | litres/hour | 0.160 | 0.140 | 0.140 | 0.300 | 0.200 | 0.150 | USD 0.15 | 0.150 | 0.160 |
| Transmission Oil Price | TOP | USD | USD 4.60 | USD 4.60 | USD 4.60 | USD 4.60 | USD 4.60 | USD 4.60 | USD 4.60 | USD 4.60 | USD 4.60 |
| Transmission Oil Consumption Rate | TOCR | litres/hour | 0.150 | 0.144 | 0.047 | 0.000 | 0.000 | 0.040 | USD 0.04 | 0.040 | 0.150 |
| Final Drives Fluid Price | FDFP | USD | USD 5.10 | USD 5.10 | USD 5.10 | USD 5.10 | USD 5.10 | USD 5.10 | USD 5.10 | USD 5.10 | USD 0.00 |
| Final Drives Fluid Consumption Rate | FDFCR | litres/hour | 0.015 | 0.013 | 0.065 | 0.150 | 0.040 | 0.050 | USD 0.05 | 0.050 | 0.015 |
| Hydraulic Oil Price | HOP | USD | USD 4.60 | USD 4.60 | USD 4.60 | USD 4.60 | USD 4.60 | USD 4.60 | USD 4.60 | USD 4.60 | USD 0.00 |
| Hydraulic Oil Consumption Rate | HOCR | litres/hour | 0.075 | 0.050 | 0.019 | 1.000 | 1.000 | 0.250 | USD 0.25 | 0.250 | 0.075 |
| Grease Price | GP | USD | USD 6.20 | USD 6.20 | USD 6.20 | USD 6.20 | USD 6.20 | 6.200 | USD 6.20 | USD 6.20 | USD 6.20 |
| Grease Consumption Rate | GCR | kg/hour | 0.140 | 0.139 | 0.139 | 0.200 | 0.200 | 0.140 | 0.140 | 0.140 | 0.140 |
| Engine Oil Cost | EOC | USD/hour | USD 0.74 | USD 0.64 | USD 0.64 | USD 1.38 | USD 0.92 | USD 0.69 | USD 0.69 | USD 0.69 | USD 0.74 |
| Transmission Oil Cost | TOC | USD/hour | USD 0.69 | USD 0.66 | USD 0.22 | USD 0.00 | USD 0.00 | USD 0.18 | USD 0.18 | USD 0.18 | USD 0.69 |
| Final Drives Fluid Cost | FDFC | USD/hour | USD 0.08 | USD 0.07 | USD 0.33 | USD 0.77 | USD 0.20 | USD 0.26 | USD 0.26 | USD 0.26 | USD 0.00 |
| Hydraulic Oil Cost | HOC | USD/hour | USD 0.35 | USD 0.23 | USD 0.09 | USD 4.60 | USD 4.60 | USD 1.15 | USD 1.15 | USD 1.15 | USD 0.00 |
| Grease Cost | GC | USD/hour | USD 0.87 | USD 0.86 | USD 0.86 | USD 1.24 | USD 1.24 | USD 0.87 | USD 0.87 | USD 0.87 | USD 0.87 |
| Filter Cost [From Tables] | FILC | USD/hour | USD 2.00 | USD 1.50 | USD 1.50 | USD 2.50 | USD 2.50 | USD 2.00 | USD 2.00 | USD 2.00 | USD 2.00 |
| Total Lubricants, Oils And Filter Cost | LC | USD/hour | USD 6.51 | USD 6.51 | USD 3.72 | USD 11.16 | USD 11.16 | USD 5.04 | USD 3.72 | USD 5.02 | USD 5.21 |
| Number Of Wheels | NW | 0 | 6 | 0 | 0 | 6 | 6 | 6 | 0 | ||
| Tyre Size | TS | 0 | 17.5x25 | 0 | 0 | 26.5R25 | 26.5R25 | 26.5R25 | 0 | ||
| Tyre Price | CT | USD 0.00 | USD 2,500.00 | USD 0.00 | USD 0.00 | USD 6,500.00 | USD 6,500.00 | USD 6,500.00 | 0 | ||
| Life Of Tyre | LT | hours | 0 | 2,000 | 0 | 0 | 4,500 | 6,000 | 3,000 | 0 | |
| Tyre Replacement Cost | TRC | USD 0.00 | USD 7.50 | USD 0.00 | USD 0.00 | USD 8.67 | USD 6.50 | USD 13.00 | USD 0.00 | ||
| FUEL PRICE | USD 1.20 | Type | TRACKED | TRACKED | MOTOR | HYDRAULIC | HYDRAULIC | ARTICULATED | FUEL | WATER | TRACKED |
| | Page 238 |
| | NI43-101 ITR - Updated Mineral Resource Estimate for Buckreef Gold Project |
| BULL DOZER | BULL DOZER | GRADER | EXCAVATOR | EXCAVATOR | DUMP TRUCK | BOWSER | BOWSER | DRILL RIG | |||
| ENGINE OIL | USD 4.60 | Make | BELL | CAT | CAT | CAT | LIEBHEER | BELL | BELL | BELL | Sandvik |
| TRANS OIL | USD 7.17 | Model | PR754 | D8R | 140H | 374 | R966 | B40D | B25E | B30E | |
| Impact Factor | IF | 0.4 | 0.4 | 0.0 | 0.5 | 0.4 | 0.0 | 0.0 | 0.0 | 0.4 | |
| Abrasiveness | A | 0.6 | 0.6 | 0.0 | 0.6 | 0.6 | 0.0 | 0.0 | 0.0 | 0.6 | |
| “Z” Factor | Z | 0.5 | 0.5 | 0.0 | 1.0 | 1.0 | 0.0 | 0.0 | 0.0 | 0.5 | |
| Undercarriage Basic Factor | Ba | 10.0 | 10.0 | 0.0 | 10.0 | 10.0 | 0.0 | 0.0 | 0.0 | 6.0 | |
| Extended Use Multiplier | EM | 1.0 | 1.0 | 1.0 | 1.0 | 1.0 | 1.0 | 1.0 | 1.0 | 1.0 | |
| Basic Repair Factor | BF | 10 | 10 | 5.0 | 10.0 | 10.0 | 10.0 | 6.0 | 6.0 | 4 | |
| Undercarriage Repair Costs | URC | USD/hour | USD 15.00 | USD 15.00 | USD 0.00 | USD 21.00 | USD 20.00 | USD 0.00 | USD 0.00 | USD 0.00 | USD 9.00 |
| Repair Reserve | RR | USD 10.00 | USD 10.00 | USD 5.00 | USD 10.00 | USD 10.00 | USD 10.00 | USD 6.00 | USD 6.00 | USD 11.00 | |
| Price Of Cutting Edges/Bucket | PCE | USD | USD 400.00 | USD 460.00 | USD 248.39 | USD 20,000.00 | USD 20,000.00 | USD 0.00 | USD 0.00 | USD 0.00 | USD 0.00 |
| Price Of Ripper Tips/Picks | PRT | USD | USD 200.00 | USD 230.00 | USD 16.16 | USD 0.00 | USD 0.00 | USD 0.00 | USD 0.00 | USD 0.00 | USD 0.00 |
| Price Of Bucket Tips/Pick Holders | PBT | USD | USD 0.00 | USD 0.00 | USD 0.00 | USD 400.00 | USD 400.00 | USD 0.00 | USD 0.00 | USD 0.00 | USD 0.00 |
| Price Of Bin Liners/Corner Piece/End Ring | PEB | USD | USD 350.00 | USD 402.50 | USD 281.54 | USD 0.00 | USD 0.00 | USD 3,000.00 | USD 2,000.00 | USD 2,000.00 | USD 0.00 |
| No. Of Cutting Edges | NCE | 2 | 2 | 2 | 1 | 1 | 0 | 0 | 0 | 0 | |
| No. Of Ripper Tips/Picks | NRT | 1 | 3 | 3 | 0 | 0 | 0 | 0 | 0 | 0 | |
| No. Of Bucket Tips/Pick Holders | NRT | 0 | 0 | 0 | 4 | 4 | 0 | 0 | 0 | 0 | |
| No. Of Bin Liners/Corner Piece/Endrings | NEB | 2 | 2 | 2 | 1 | 0 | 1 | 1 | 1 | 0 | |
| Life Of Cutting Edges/Bucket | LCE | hours | 200 | 200 | 200 | 2,000 | 2,000 | 0 | 0 | 0 | 0 |
| Life Of Ripper Tips/Picks | LRT | hours | 200 | 200 | 200 | 0 | 0 | 0 | 0 | 0 | 0 |
| Life Of Bucket Tips/Pick Holders | LBT | hours | 0 | 0 | 0 | 150 | 150 | 0 | 0 | 0 | 0 |
| Life Of Bin Liners/Corner Piece/End Ring | LEB | hours | 200 | 250 | 0 | 0 | 0 | 2,500 | 4,000 | 4,000 | 0 |
| Cost Of Cutting Edges | CCE | USD/hour | USD 4.00 | USD 4.60 | USD 2.48 | USD 10.00 | USD 10.00 | USD 0.00 | USD 0.00 | USD 0.00 | USD 0.00 |
| Cost Of Ripper Tips | CRT | USD/hour | USD 1.00 | USD 3.45 | USD 0.24 | USD 0.00 | USD 0.00 | USD 0.00 | USD 0.00 | USD 0.00 | USD 0.00 |
| Cost Of Bucket Tips | CBT | USD/hour | USD 0.00 | USD 0.00 | USD 0.00 | USD 10.67 | USD 10.67 | USD 0.00 | USD 0.00 | USD 0.00 | USD 0.00 |
| Cost Of Bin Liners | CEB | USD/hour | USD 3.50 | USD 3.22 | USD 0.00 | USD 0.00 | USD 0.00 | USD 1.20 | USD 0.50 | USD 0.50 | USD 0.00 |
| Special Wear Items | SWI | USD/hour | USD 8.50 | USD 11.27 | USD 2.73 | USD 20.67 | USD 20.67 | USD 1.20 | USD 0.50 | USD 0.50 | USD 0.00 |
| Operator Costs | OPC | USD/hour | USD 0.00 | USD 0.00 | USD 0.00 | USD 0.00 | USD 0.00 | USD 0.00 | USD 0.00 | USD 0.00 | USD 0.00 |
| TOTAL OPERATING CXOSTS | TOC | USD/hour | USD 82.01 | USD 84.78 | USD 42.95 | USD 134.83 | USD 133.83 | USD 58.51 | USD 40.72 | USD 56.92 | USD 58.81 |
| USD/hour | USD 82.01 | USD 84.78 | USD 42.95 | USD 134.83 | USD 133.83 | USD 58.51 | USD 40.72 | USD 56.92 | USD 58.81 | ||
| | Page 239 |
| | NI43-101 ITR - Updated Mineral Resource Estimate for Buckreef Gold Mine Project |
Table 32.7: Buckreef Cash Flow Analysis
| YEARS | |||||||||||||||||||
| Description | Rates | Fact | Year 1 | Year 2 | Year 3 | Year 4 | Year 5 | Year 6 | Year 7 | Year 8 | Year 9 | Year 10 | Year 11 | Year 12 | Year 13 | Year 14 | Year 15 | Year 16 | Total |
| Ore Mining | |||||||||||||||||||
| Oxide Ore (Tonnes) | kt | 349 | 188 | 57 | 209 | 73 | 30 | 159 | 66 | 309 | 118 | 21 | - | 41 | 2 | 8 | - | 1,629 | |
| Oxide Ore (g/t) | g/t | 2.00 | 1.40 | 1.24 | 1.28 | 1.17 | 1.20 | 1.02 | 2.07 | 1.98 | 3.92 | 0.97 | - | 2.11 | 1.65 | 1.65 | - | ||
| Trans Ore (Tonnes) | kt | 92 | 151 | 136 | 133 | 106 | 78 | 40 | 28 | 82 | 309 | 270 | 52 | 17 | 6 | 21 | - | 1,520 | |
| Trans Ore (g/t) | g/t | 2.18 | 2.68 | 1.72 | 1.46 | 1.25 | 1.01 | 1.57 | 1.06 | 1.05 | 3.27 | 1.30 | 0.92 | 2.72 | 1.41 | 1.41 | - | ||
| Hard Ore (Tonnes) | kt | 43 | 146 | 290 | 625 | 1,271 | 1,347 | 1,251 | 1,356 | 1,060 | 1,028 | 1,160 | 1,399 | 1,392 | 1,446 | 1,323 | 915 | 16,053 | |
| Hard Ore (g/t) | g/t | 1.37 | 2.15 | 1.69 | 1.55 | 1.63 | 1.39 | 1.25 | 1.89 | 1.57 | 1.26 | 1.34 | 1.23 | 1.31 | 1.64 | 1.40 | 1.70 | ||
| Oxide Waste | kt | 2,713 | 1,443 | 2,087 | 598 | 191 | 1,551 | 2,086 | 2,140 | 1,978 | 3,323 | 918 | 82 | 1,046 | - | - | - | 20,155 | |
| Trans Waste | kt | 1,296 | 1,097 | 2,134 | 1,410 | 733 | 1,525 | 1,930 | 1,277 | 1,629 | 2,700 | 2,878 | 1,368 | 368 | - | - | - | 20,346 | |
| Hard Waste | kt | 508 | 1,766 | 4,055 | 6,824 | 7,781 | 6,839 | 7,985 | 9,294 | 14,640 | 12,160 | 14,550 | 15,490 | 12,149 | 12,888 | 13,176 | 1,102 | 141,207 | |
| Oxide & Trans Ore Recovery | % | 92% | 92% | 92% | 92% | 92% | 92% | 92% | 92% | 92% | 92% | 92% | 92% | 92% | 92% | 92% | 92% | 92% | |
| Sulphide Ore Recovery | 85% | 85% | 85% | 85% | 85% | 85% | 85% | 85% | 85% | 85% | 85% | 85% | 85% | 85% | 85% | 85% | 85% | ||
| Mining Dilution | % | 5% | 5% | 5% | 5% | 5% | 5% | 5% | 5% | 5% | 5% | 5% | 5% | 5% | 5% | 5% | 5% | 5% | |
| Gold produced | |||||||||||||||||||
| Fine (kg) | kg | 876 | 869 | 677 | 1,208 | 1,878 | 1,621 | 1,468 | 2,225 | 1,989 | 2,405 | 1,599 | 1,433 | 1,595 | 1,924 | 1,535 | 1,258 | 24,559 | |
| Fine (oz) (1oz =31.1034768grams) | koz | 28,162 | 27,944 | 21,752 | 38,837 | 60,375 | 52,111 | 47,181 | 71,532 | 63,956 | 77,320 | 51,412 | 46,069 | 51,295 | 61,851 | 49,347 | 40,448 | 789,593 | |
| Gold price (US$000) | $/oz | 1300 | 1,300 | 1,300 | 1,300 | 1,300 | 1,300 | 1,300 | 1,300 | 1,300 | 1,300 | 1,300 | 1,300 | 1,300 | 1,300 | 1,300 | 1,300 | 1,300 | |
| Gross revenue | US ($000) | 0 | 36,610 | 36,327 | 28,277 | 50,488 | 78,487 | 67,744 | 61,336 | 92,992 | 83,143 | 100,516 | 66,835 | 59,890 | 66,684 | 80,406 | 64,151 | 52,583 | 1,026,471 |
| Less Royalties & Selling Costs | - | ||||||||||||||||||
| : Royalties 7.3% on Revenue | 7.3% | (2,673) | (2,652) | (2,064) | (3,686) | (5,730) | (4,945) | (4,478) | (6,788) | (6,069) | (7,338) | (4,879) | (4,372) | (4,868) | (5,870) | (4,683) | (3,839) | (74,932) | |
| : Selling Costs per oz of gold | 4.40 | (124) | (123) | (96) | (171) | (266) | (229) | (208) | (315) | (281) | (340) | (226) | (203) | (226) | (272) | (217) | (178) | (3,470) | |
| Net revenue | 33,814 | 33,553 | 26,117 | 46,631 | 72,492 | 62,570 | 56,651 | 85,889 | 76,792 | 92,838 | 61,730 | 55,315 | 61,590 | 74,264 | 59,251 | 48,566 | 948,064 | ||
| | Page 240 |
| | NI43-101 ITR - Updated Mineral Resource Estimate for Buckreef Gold Mine Project |
| YEARS | |||||||||||||||||||
| Description | Rates | Fact | Year 1 | Year 2 | Year 3 | Year 4 | Year 5 | Year 6 | Year 7 | Year 8 | Year 9 | Year 10 | Year 11 | Year 12 | Year 13 | Year 14 | Year 15 | Year 16 | Total |
| Capital Costs | US ($k) | ||||||||||||||||||
| Start up Capital | 36,799 | 5,804 | 14,334 | 19,563 | 76,501 | ||||||||||||||
| Closure Costs | U$ | 4,507 | 4,507 | ||||||||||||||||
| Sustaining Costs | U$ | 7.5% | - | - | - | 5,738 | - | - | 5,738 | - | - | 5,738 | - | - | 5,738 | - | 22,950 | ||
| Total Capital Costs | U$ | - | 36,799 | 5,804 | 14,334 | 19,563 | 5,738 | - | - | 5,738 | - | - | 5,738 | - | - | 5,738 | - | 4,507 | 103,958 |
| Operating expenditure | U$ | ||||||||||||||||||
| Mining Rates | US ($k) | ||||||||||||||||||
| Drill & Blast Waste | $/tw | 0.74 | 1,337 | 2,122 | 3,796 | 6,103 | 6,310 | 6,198 | 7,348 | 7,834 | 12,057 | 11,013 | 12,916 | 12,493 | 9,276 | 9,551 | 9,764 | 817 | 118,936 |
| Drill & Blast Ore | $/to | 0.90 | 122 | 269 | 385 | 685 | 1,244 | 1,287 | 1,166 | 1,250 | 1,031 | 1,208 | 1,291 | 1,310 | 1,274 | 1,312 | 1,213 | 827 | 15,876 |
| Load and Haul Ore | $/to | 1.13 | 544 | 546 | 544 | 1,088 | 1,632 | 1,637 | 1,632 | 1,632 | 1,632 | 1,637 | 1,632 | 1,632 | 1,632 | 1,637 | 1,520 | 1,030 | 21,609 |
| Load and Haul waste | $/tw | 1.03 | 4,663 | 4,444 | 8,541 | 9,115 | 8,983 | 10,231 | 12,384 | 13,118 | 18,831 | 18,764 | 18,933 | 17,481 | 13,996 | 13,300 | 13,597 | 1,138 | 187,519 |
| Overhaul rate | $/t/km | 0.08 | |||||||||||||||||
| Mine Rehabilitation | $/tw | 0.03 | 136 | 129 | 248 | 265 | 261 | 297 | 360 | 381 | 547 | 545 | 550 | 508 | 407 | 387 | 395 | 33 | 5,451 |
| Processing Rates | |||||||||||||||||||
| Processing reagents | $/to | 10.24 | 4,952 | 4,966 | 4,952 | 9,905 | 14,853 | 14,894 | 14,853 | 14,853 | 14,853 | 14,894 | 14,853 | 14,853 | 14,853 | 14,894 | 13,836 | 9,370 | 196,646 |
| Labour Costs | $/to | 1.98 | 958 | 960 | 958 | 1,915 | 2,872 | 2,880 | 2,872 | 2,872 | 2,872 | 2,880 | 2,872 | 2,872 | 2,872 | 2,880 | 2,675 | 1,812 | 38,023 |
| Total operating costs | US ($k) | 12,712 | 13,436 | 19,424 | 29,076 | 36,156 | 37,425 | 40,616 | 41,942 | 51,825 | 50,941 | 53,048 | 51,151 | 44,310 | 43,960 | 43,001 | 15,026 | 584,048 | |
| Opex +Capex | US ($k) | - | 49,511 | 19,240 | 33,758 | 48,639 | 41,894 | 37,425 | 40,616 | 47,679 | 51,825 | 50,941 | 58,786 | 51,151 | 44,310 | 49,698 | 43,001 | 19,533 | 688,006 |
| Pre Tax Net Cash Flows | US ($k) | - | (15,697) | 14,313 | (7,641) | (2,008) | 30,598 | 25,145 | 16,035 | 38,210 | 24,967 | 41,897 | 2,944 | 4,165 | 17,280 | 24,567 | 16,250 | 29,033 | 260,058 |
| Taxable Income | US ($k) | 12,644 | 27,206 | 16,607 | 31,338 | 50,119 | 33,483 | 23,247 | 48,350 | 25,515 | 42,444 | 9,229 | 4,712 | 17,828 | 30,852 | 16,797 | 34,088 | 424,457 | |
| Tax Payable | US ($k) | 3,793 | 8,162 | 4,982 | 9,401 | 15,036 | 10,045 | 6,974 | 14,505 | 7,654 | 12,733 | 2,769 | 1,414 | 5,348 | 9,255 | 5,039 | 10,226 | 127,337 | |
| Net Cashflows after Tax | US ($k) | (19,490) | 6,151 | (12,623) | (11,409) | 15,563 | 15,100 | 9,061 | 23,705 | 17,313 | 29,164 | 176 | 2,751 | 11,932 | 15,311 | 11,211 | 18,807 | 132,721 | |
| Add back Depreciation | US ($k) | 5,955 | 7,090 | 9,913 | 13,783 | 13,783 | 8,338 | 7,212 | 4,403 | 547 | 547 | 547 | 547 | 547 | 547 | 547 | 547 | 74,854 | |
| Net Cashflow after tax adjusted for tax dep | US ($k) | (13,536) | 13,240 | (2,709) | 2,373 | 29,346 | 23,438 | 16,273 | 28,107 | 17,860 | 29,711 | 723 | 3,298 | 12,479 | 15,859 | 11,758 | 19,354 | 207,575 | |
| After Tax NPV @ ( 3%) | US ($k) | 3% | 156,552 | ||||||||||||||||
| After Tax @ NPV (5%) | US ($k) | 5% | 130,964 | ||||||||||||||||
| After Tax @ NPV (8%) | US ($k) | 8% | 101,495 | ||||||||||||||||
| After Tax IRR | % | 74% | |||||||||||||||||
| Cash cost per oz | $/oz | 451 | 481 | 893 | 749 | 599 | 718 | 861 | 586 | 810 | 659 | 1,032 | 1,110 | 864 | 711 | 871 | 371 | 735 | |
| All in cash costs | $/oz | 1,758 | 689 | 1,552 | 1,252 | 694 | 718 | 861 | 667 | 810 | 659 | 1,143 | 1,110 | 864 | 804 | 871 | 483 | 933 | |
| | Page 241 |