UNITED STATES
SECURITIES AND EXCHANGE COMMISSION
WASHINGTON, DC 20549
FORM 10-K
| x | ANNUAL REPORT PURSUANT TO SECTION 13 OR 15(d) OF THE SECURITIES EXCHANGE ACT OF 1934 |
For the fiscal year ended December 31, 2007
OR
| ¨ | TRANSITION REPORT PURSUANT TO SECTION 13 OR 15(d) OF THE SECURITIES EXCHANGE ACT OF 1934 |
For the transition period from to .
Commission file number 0-50680
BARRIER THERAPEUTICS, INC.
(Exact Name of Registrant as Specified in Its Charter)
| | |
| Delaware | | 22-3828030 |
| (State of Incorporation) | | (I.R.S. Employer Identification No.) |
600 College Road East, Suite 3200
Princeton, New Jersey 08540
(Address of Principal Executive Offices) (Zip Code)
(609) 945-1200
(Registrant’s telephone number, including area code)
Securities registered pursuant to Section 12(b) of the Act:
| | |
| Title of each class | | Name of each exchange on which registered |
| Common stock, par value $.0001 per share | | The NASDAQ Stock Market, LLC |
Securities registered pursuant to Section 12(g) of the Act:
None.
(Title of Class)
Indicate by check mark if the registrant is a well-known seasoned issuer, as defined in Rule 405 of the Securities Act. ¨ Yes x No
Indicate by check mark if the registrant is not required to file reports pursuant to Section 13 or Section 15(d) of the Act. ¨ Yes x No
Indicate by check mark whether the registrant (1) has filed all reports to be filed by Section 13 or 15(d) of the Securities Exchange Act of 1934 during the preceding 12 months (or for such shorter period that the registrant was required to file such reports), and (2) has been subject to such filing requirements for the past 90 days. Yes x No ¨
Indicate by check mark if disclosure of delinquent filers pursuant to Item 405 of Regulation S-K is not contained herein, and will not be contained, to the best of registrant’s knowledge, in definitive proxy or information statements incorporated by reference in Part III of this Form 10-K or any amendment to this Form 10-K. x
Indicate by check mark whether the registrant is a large accelerated filer, an accelerated filer, a non-accelerated filer, or a smaller reporting company. See definition of “accelerated filer,” “large accelerated filer” and “smaller reporting company” in Rule 12b-2 of the Exchange Act. (Check one):
| | | | | | |
| ¨ Large accelerated filer | | x Accelerated filer | | ¨ Non-accelerated filer | | ¨ Smaller reporting company |
Indicate by check mark whether the registrant is a shell company (as defined in Rule 12b-2 of the Act). ¨ Yes x No
The aggregate market value of the voting common stock held by non-affiliates of the registrant as of June 30, 2007 was approximately $155.4 million. Such aggregate market value was computed by reference to the closing price of the common stock as reported on the NASDAQ National Market on June 30, 2007. For purposes of making this calculation only, the registrant has defined affiliates as including all directors and executive officers.
The number of shares of the registrant’s common stock outstanding as of March 7, 2008 was 35,042,055.
DOCUMENTS INCORPORATED BY REFERENCE
Portions of the registrant’s definitive proxy statement for its 2008 annual meeting of stockholders of the registrant to be held on June 4, 2008 are incorporated by reference into Part III of this Annual Report on Form 10-K.
TABLE OF CONTENTS
i
CAUTIONARY NOTE REGARDING FORWARD-LOOKING STATEMENTS
In addition to historical facts or statements of current condition, this report contains forward-looking statements within the meaning of Section 21E of the Securities Exchange Act of 1934, as amended (the “Exchange Act”). Forward-looking statements contained in this report constitute our expectations or forecasts of future events as of the date this report was filed with the SEC and are not statements of historical fact. You can identify these statements by the fact that they do not relate strictly to historical or current facts. Such statements may include words such as “anticipate,” “will,” “estimate,” “expect,” “project,” “intend,” “should,” “plan,” “believe,” “hope,” and other words and terms of similar meaning. In particular, these forward-looking statements include, among others, statements about:
| | • | | the trend of operating losses and the reasons for those losses; |
| | • | | the commercialization of our products, particularly our Xolegel®, Vusion® and Solagé® products; |
| | • | | the future commercialization of any of our product candidates, if approved, particularly our Hyphanox™ product candidate; |
| | • | | the market success of our products and anticipated revenues associated with those products; |
| | • | | our plans to in-license or acquire dermatological products for marketing; |
| | • | | our spending on the clinical development of our product candidates; |
| | • | | our plans regarding the development or regulatory path for any of our product candidates, particularly with respect to our Hyphanox, Rambazole™, Pramiconazole and Hivenyl™ product candidates; |
| | • | | our plans to secure arrangements to help fund the development of Pramiconazole and Rambazole; |
| | • | | the timing of the initiation or completion of any clinical trials, particularly with respect to our Hyphanox, Rambazole, Pramiconazole and Hivenyl product candidates; |
| | • | | the potential safety or efficacy profiles anticipated for any of our product candidates; |
| | • | | the timing of filing for regulatory approvals with governmental agencies; and |
| | • | | other statements regarding matters that are not historical facts or statements of current condition. |
Any or all of our forward-looking statements in this report may turn out to be wrong. These statements involve known and unknown risks, uncertainties and other factors that may cause our or our industry’s actual results, level of activity, performance or achievements to be materially different from the information expressed or implied by these forward-looking statements. Therefore, you should not place undue reliance on any such forward-looking statements. The factors that could cause actual results to differ from those expressed or implied by our forward-looking statements include, in addition to those items set forth in Part II, Item 1A under the heading “Risk Factors”, our ability to:
| | • | | obtain substantial additional funds; |
| | • | | obtain and maintain all necessary patents or licenses; |
| | • | | market our Xolegel, Vusion and Solagé products, and product candidates if approved, and generate revenues; |
| | • | | enter into development arrangements for Pramiconazole and Rambazole; |
| | • | | demonstrate the safety and efficacy of product candidates at each stage of development; |
| | • | | meet applicable regulatory standards in the United States to commence or continue clinical trials, particularly with respect to our Hyphanox, Rambazole, Pramiconazole and Hivenyl product candidates, and in the case of Rambazole, to remove the product from clinical hold; |
| | • | | meet applicable regulatory standards and file for or receive required regulatory approvals; |
| | • | | produce our drug products in commercial quantities at reasonable costs and compete successfully against other products and companies; |
| | • | | meet our obligations and required milestones under our license and other agreements, including our agreements with the Johnson & Johnson family of companies; and |
| | • | | accurately estimate prescription demand, inventory levels, rebates, product returns and other financial related data from third parties in our revenue recognition process. |
ii
PART I
Overview
We are a pharmaceutical company focused on the development and commercialization of pharmaceutical products in the field of dermatology. We currently market three prescription pharmaceutical products in the United States. We promote our marketed products primarily through our specialty sales force consisting of approximately 60 sales representatives. We have an extensive product pipeline that includes product candidates in Phases 2 and 3 of clinical development.
Our goal is to become a leader in the development and commercialization of proprietary innovative products in therapeutic dermatology. Our strategy is to continue to actively market our current products while continuing to seek and selectively acquire other marketed dermatological products that complement our existing business. In addition, we intend to continue the development of our pipeline of product candidates, all but one of which are based on new chemical entities, while continuing to seek to supplement and diversify these efforts by acquiring additional compounds that we believe to be potentially superior to currently marketed products. We also intend to establish development arrangements to help fund the development of some of our product candidates.
Our Marketed Products
Our marketed products are:
| | • | | Vusion® (0.25% miconazole nitrate, 15% zinc oxide, and 81.35% white petrolatum) Ointment: a topical ointment indicated for the treatment of infants and children with diaper dermatitis complicated by documented candidiasis, an inflammatory disease characterized by diaper rash infected by a yeast calledCandida. |
| | • | | Xolegel® (ketoconazole, USP) 2% Gel: a topical gel for the treatment of seborrheic dermatitis, a type of eczema characterized by inflammation and scaling of the skin, principally of the scalp, face and trunk. Our Xolegel line of products also includes Xolegel Duo™, a kit containing a tube of prescription Xolegel and a 4 oz. bottle of over the counter Xolex™ (zinc pyrithione 1%) Shampoo, designed to help patients in treating seborrheic dermatitis by providing a gel formulation for the face and body, plus a medicated shampoo for the scalp, in one package. |
| | • | | Solagé® (mequinol 2.0% and tretinoin 0.01%) Topical Solution: a topical solution indicated for the treatment of solar lentigines, commonly known as “age spots.” |
Our Product Pipeline
We have product candidates in various stages of clinical development for the treatment of a range of dermatological conditions, including onychomycosis, psoriasis, acne, skin allergies and superficial fungal infections. In addition, we have access to the classes of compounds claimed in the patents licensed to us under our license agreements with affiliates of Johnson & Johnson. The development of each of our product candidates involves significant risks. No assessment of the efficacy or safety of any product candidate can be considered definitive until all clinical trials needed to support a submission for marketing approval are completed.
Our three most advanced product candidates are:
| | • | | Hyphanox™: an oral tablet formulation of the active ingredient itraconazole, an antifungal agent that we are developing for the treatment of onychomycosis, commonly known as nail fungus. We are currently conducting a Phase 3 pivotal clinical trial for Hyphanox to test once daily dosing of one 200 mg tablet in the treatment of toenail onychomycosis. If the results of this Phase 3 clinical trial are favorable, we plan to file a New Drug Application, or NDA, seeking marketing approval with the United States Food and Drug Administration, or FDA, in the first quarter of 2009. |
1
| | • | | Pramiconazole: an oral liquid formulation of the active ingredient pramiconazole, a novel antifungal agent that we are developing as a treatment for onychomycosis, and skin and mucosal fungal infections. In March 2007, we announced positive results from a completed Phase 2b study conducted outside the United States for tinea versicolor. We are currently conducting a Phase 2a clinical trial outside the United States with Pramiconazole in the treatment of onychomycosis for which we announced positive interim results in October 2007. In November 2007, we also announced promising results from a completed Phase 1 dose escalation study outside the United States in healthy volunteers showing high doses of Pramiconazole were well tolerated. We are actively seeking a development partner for this product candidate. |
| | • | | Oral Rambazole™: an oral formulation of the active ingredient talarozole, a drug from a novel class of molecules known as retinoic acid metabolism blocking agents, that we are developing for the treatment of psoriasis. In July 2007, we announced positive results from a Phase 2b dose finding clinical trial in severe plaque psoriasis conducted outside the United States. |
Our pipeline also includes two earlier stage product candidates:
| | • | | Topical Rambazole: a topical formulation of the active ingredient talarozole that we are developing for the treatment of acne. We are currently conducting a Phase 2a clinical trial in mild to moderate acne outside the United States. |
| | • | | Hivenyl: an oral formulation of the active ingredient vapitidine hydrochloride, a novel antihistamine that may not cause sedation typically associated with antihistamines. We are developing this product candidate as an oral treatment for allergic reactions of the skin, such as the types of reactions associated with hives. In January 2007, we announced positive data on a Phase 2a clinical trial that was conducted outside the United States, in the treatment of the itch associated with atopic dermatitis. We are also currently conducting a Phase 2a study for chronic idiopathic urticaria. |
Our History
We were founded in September 2001 by Geert Cauwenbergh, Ph.D., our Chief Executive Officer, who identified a portfolio of dermatological product candidates and intellectual property within the Johnson & Johnson family of companies that he believed could form the basis for an independent pharmaceutical company focused on dermatology. In May 2002, we acquired these assets through licenses from Janssen Pharmaceutica Products, L.P., Johnson & Johnson Consumer Companies, Inc. and Ortho-McNeil Pharmaceutical, Inc., each a Johnson & Johnson company, in exchange for an equity interest in us. In this document, we sometimes refer to Janssen Pharmaceutica Products, L.P. and its affiliates as Janssen. We were incorporated in Delaware in September 2001 and commenced active operations in May 2002. Our principal offices are located at 600 College Road East, Suite 3200, Princeton, New Jersey 08540.
Recent Developments
In January 2008, we announced that Mr. Alfred Altomari, the Chief Operating Officer of the Company, will succeed Dr. Geert Cauwenbergh, Founder and Chief Executive Officer of the Company, on March 31, 2008. Dr. Cauwenbergh will continue to serve on the Board of Directors of the Company. Mr. Altomari also became a member of the Board at the time of the announcement.
Dermatology Overview
Dermatology is the field of medicine concerned with the study and treatment of disorders and diseases of the skin. Skin is a vital organ of the human body. Skin functions as a barrier, protecting organs and tissues in the body from injury and invasion by foreign organisms that may cause infections or other damage. It helps regulate body temperature and sense external stimuli. The condition of one’s skin also has a significant impact on an individual’s overall health and appearance.
2
Dermatological diseases and disorders may result from a number of factors, including aging, sun damage, immunological diseases, genetic background, viral, fungal or bacterial infections, allergic reactions and emotional or seasonal factors. These diseases and disorders can have a significant impact on an individual’s physical and mental health and his or her social acceptance.
Despite the significant sales of prescription products for treatment of diseases of the skin, we believe that many limitations remain in the treatment of these diseases. Existing treatments are often inadequate for reasons of efficacy, toxicity or patient noncompliance. Many of the drugs currently used to treat dermatological diseases originally were developed to treat diseases of other parts of the body. For example, many of the oral antifungal drugs used today to treat dermatological infections first were developed as treatments for fungal infections of other parts of the anatomy. We believe that our focus on understanding the molecular basis for diseases of the skin may yield more convenient and effective drugs with fewer undesirable side effects.
Business Strategy
Our goal is to develop a portfolio of innovative products that address major medical needs in the treatment of dermatological diseases and disorders and become a leader in the development and commercialization of prescription pharmaceutical products to treat these diseases and disorders. To achieve our goal, we intend to:
Commercialize our products in the United States. We market our products directly to dermatologists and other target physicians through both our own specialty sales force and under a co-promotion agreement with Novartis Consumer Health in the United States.
Pursue the development of our product candidates. We are committing substantial resources towards completing the development of our later stage product candidates. We are also seeking to supplement those efforts and reduce our expenditures by entering into development arrangements with third parties.
Maintain a portfolio of product candidates at various stages of clinical development.We are developing a product portfolio that includes product candidates at various stages of clinical development. We believe that the diversity in our product development pipeline increases the probability of our long-term commercial success.
Expand our product portfolio through a combination of internal development efforts and, if appropriate, selective acquisitions of compounds, marketed products and businesses. We intend to continue expanding our product development pipeline through life cycle management and by licensing or otherwise acquiring additional compounds that we believe to be potentially superior to currently marketed products and by seeking to selectively acquire marketed dermatological products or businesses that complement our development and commercialization strategy.
Marketed Products and Development Pipeline
The following tables summarize our marketed products and product candidates in clinical development, all of which we plan to develop as prescription drugs. The names listed below for our product candidates in our development pipeline are our current designations for these programs and may not be the final approved trade name. With respect to our product candidates in our development pipeline, our assessment of the stage of development is based on our ongoing or most recently completed clinical trial for each product candidate. For each of our product candidates other than Hyphanox, we will need to conduct additional non-clinical and clinical studies before proceeding to the next stage of development.
3
Marketed Products
| | | | | | | | |
Product | | Active Ingredients | | Method of Administration | | Approved Indication | | Countries |
Vusion® | | miconazole nitrate zinc oxide white petrolatum | | Topical | | diaper dermatitis complicated by candidiasis | | United States |
| | | | |
Xolegel® | | ketoconazole | | Topical | | seborrheic dermatitis | | United States |
| | | | |
Solagé® | | mequinol tretinoin | | Topical | | solar lentigines | | United States |
Development Pipeline
| | | | | | | | |
Product | | Active Ingredients or Class of Molecule | | Method of Administration | | Key Indications | | Stage of Development |
Hyphanox™ | | itraconazole | | Oral | | onychomycosis | | Phase 3 |
| | | | |
Pramiconazole | | pramiconazole | | Oral | | tinea versicolor onychomycosis, superficial skin infections | | Phase 2b Phase 2a |
| | | | |
Rambazole™ | | talarozole | | Oral | | psoriasis (moderate to severe) nodular acne | | Phase 2b Phase 2a |
| | | | |
Rambazole | | talarozole | | Topical | | acne (mild to moderate) | | Phase 2a |
| | | | |
Hivenyl™ | | vapitadine hydrochloride | | Oral | | skin allergies | | Phase 2a |
Our Marketed Products
Vusion. Vusion is a topical ointment containing 0.25% miconazole nitrate, an antifungal agent, 15% zinc oxide and 81.35% white petrolatum. Vusion is indicated for use in the treatment of diaper dermatitis complicated by documented candidiasis in infants and children four weeks and older. This inflammatory condition occurs when diaper dermatitis, also known as diaper rash, is complicated with a fungal infection caused by a yeast calledCandida. The existence ofCandida, which thrive in the warm, moist conditions typically found in an infant’s diaper, is determined by microscopic evaluation for presence of pseudohyphae or budding yeast. Vusion is the only prescription product approved for the treatment of this condition in the United States. Miconazole nitrate is an antifungal agent that treats theCandida infection. The ointment base in Vusion is comprised of zinc oxide and white petrolatum, which are the main components in most common diaper rash products.
Based on data from the Centers for Disease Control and Prevention, we estimate that there are eight million infants under the age of two in the United States. Based on published reports, we estimate that diaper dermatitis is observed in approximately one million pediatric outpatient visits each year, and that of all diaper dermatitis cases treated by physicians, more than 40% are complicated by the fungusCandida.
We received marketing approval from the FDA for Vusion in February 2006. Net product revenues for Vusion were $18.1 million in 2007 and $3.8 million in 2006. In connection with its marketing approval, Vusion
4
is entitled to three years of marketing exclusivity under the United States Drug Price Competition and Patent Term Restoration Act of 1984, known as the Hatch-Waxman Act, which will expire in February of 2009.
In connection with the FDA’s approval of Vusion, we agreed to conduct two Phase 4 clinical studies: a percutaneous absorption study to determine the amount, if any, of miconazole nitrate which is absorbed into the bloodstream through the skin and its potential effect on liver function; and a microbial resistance study to evaluate the extent, if any, to which theCandida yeast may develop resistance to repeated treatment courses with Vusion. We have completed the percutaneous absorption study and submitted the results to the FDA. We have not yet completed the microbial resistance study and plan to seek an extension from the FDA.
We have an exclusive, royalty-free license in the field of dermatology to an issued United States patent covering the formulation of the combination of miconazole nitrate and zinc oxide contained in Vusion and methods of treating diaper dermatitis. This patent was originally set to expire on March 27, 2007. We have applied for up to 5 years of patent term extension under the Hatch-Waxman Act due to the patent term lost during development of this product. This application is currently being reviewed by the United States Patent and Trademark Office, or USPTO, in consultation with the FDA. As part of the patent term extension process we received a one-year interim extension to March 27, 2008. We are currently waiting for a response to our application for a second interim extension. We are also pursuing additional strategies to strengthen our intellectual property protection with respect to Vusion. Each of the active ingredients in Vusion, miconazole nitrate, zinc oxide and white petrolatum, are off patent.
Xolegel. Xolegel is a patented topical formulation of 2% ketoconazole, an antifungal agent, in a waterless gel. Xolegel is indicated as a once daily topical treatment for seborrheic dermatitis in immunocompetent adults and children twelve years of age and older. Seborrheic dermatitis is a common skin inflammation that is characterized by a red, scaly, itchy rash primarily occurring on the face, scalp, hairline, eyebrows and trunk. The condition often recurs, thereby requiring retreatment over time. Ketoconazole has potent pharmacological effects against the fungus known asmalassezia furfur, which, when over colonizing the skin, is considered to be one of the main causes of seborrheic dermatitis. Ketoconazole quickly suppresses this type of fungus and also exhibits anti-inflammatory effects that help to reduce redness in affected areas. We have designed Xolegel to deliver the benefits of ketoconazole with the advantages of our waterless gel. In addition, in a cumulative irritation patch study that we conducted in volunteers we observed that Xolegel was approximately five times less irritating than a traditional ketoconazole cream.
We estimate that seborrheic dermatitis affects approximately 3% to 5% of the United States population. Based on United States census bureau data, we estimate this to be approximately 8.5 million to 14.3 million people in the United States. Prior to the approval of Xolegel, prescription therapies for seborrheic dermatitis consisted primarily of shampoos, and topical antifungal creams, including ketoconazole creams, and topical steroids, that typically require two or more applications per day over periods of up to four weeks to be effective. With its unique gel formulation Xolegel provides patients with a dosing regimen of a once daily application for only 14 days.
We received FDA marketing approval for Xolegel in July of 2006 and began shipping product to United States wholesalers in the middle of the fourth quarter 2006. Net product revenues for Xolegel were $3.9 million in 2007 and $0.1 million in 2006. In August 2007, we began offering Xolegel Duo™, a kit containing a tube of Xolegel and Xolex™ (zinc pyrithione 1%) Shampoo (4 oz. bottle), to treat seborrheic dermatitis by providing a gel formulation for the face and body, plus a medicated shampoo for the scalp, in one package. In connection with the FDA’s approval of Xolegel, we agreed to conduct a post approval non-clinical study to assess the dermal carcinogenic potential of Xolegel. This study is ongoing and we expect to be able to complete it in a timely manner, consistent with the FDA’s requirements.
We have an exclusive, royalty-free license in the field of dermatology to a United States patent claiming the specific formulation of ketoconazole in a waterless gel. This patent is scheduled to expire in December 2018. The active ingredient of Xolegel, ketoconazole, is off patent.
5
Solagé. Solagé is a patented topical solution containing 2.0% mequinol and 0.01% tretinoin for use in the treatment of solar lentigines or “age spots”. According to published reports, solar lentigines or “age spots” are very common in light skinned individuals and appear in as many as 90% of those over the age of 60 and 20% of those under the age of 35. We estimate that more than 20 million people in the United States have this condition. Currently, Solagé is the only combination product approved in the United States for the treatment of solar lentigines, commonly known as “age spots”. Solagé is also currently the only non-hydroquinone based, FDA-approved bleaching agent on the market. We believe this may become a competitive advantage since the FDA has expressed safety concerns regarding the carcinogenicity and toxicity of hydroquinone-based products.
We acquired the United States and Canadian rights to Solagé in February 2005 from Moreland Enterprises Limited. Under the terms of the acquisition, we made an initial cash payment of $3 million and are making additional payments, primarily as royalties on our net sales. The aggregate amount of these additional payments is capped at $2 million. Net product revenues for Solagé were $1.1 million, $1.6 million and $0.8 million in 2007, 2006 and 2005, respectively.
As part of the Solagé acquisition, we were assigned all United States marketing authorizations, patents and trademarks for the product and we purchased all of the then existing inventory. The patent rights include United States patents covering the product’s pharmaceutical formulation and methods of use. The earliest of the United States patents expires in 2013 while a United States patent encompassing a version of Solagé with extended shelf life expires in 2020. Each of the active ingredients in Solagé, mequinol and tretinoin, is off patent.
Our Development Pipeline
Our product candidates must go through extensive clinical evaluation and clearance by the FDA before we can sell them commercially. Our product development pipeline includes product candidates that are in various stages of clinical development. All of these product candidates are based on intellectual property licensed to us under our principal license agreements. We are developing product candidates in various stages of clinical development for the treatment of a range of dermatological conditions, including onychomycosis, psoriasis, acne, skin allergies and superficial fungal infections.
We plan to advance the clinical development of these product candidates based on our assessment of their market potential, the results of pilot studies and clinical trials, the requirements of regulatory agencies and our available resources. Our development strategy anticipates that we will conduct simultaneous studies on several product candidates at any given time. However, from time to time, we re-evaluate our product development efforts. On the basis of these evaluations, we have in the past, and may in the future, abandon, suspend or delay development efforts for particular products.
Moreover, due to the breadth of our pipeline of development projects we must manage this portfolio in accordance with our financial resources. This means that we must, at times, perform development activities for a product candidate sequentially rather than concurrently. This may affect the amount of time it takes to go from one clinical phase to another and potentially delay the time to market. For example, completion of a Phase 2 dose ranging study does not necessarily mean that the next study will be a Phase 3 pivotal trial. There may be additional non-clinical, clinical, chemistry and manufacturing activities required prior to moving into that next phase or seeking regulatory approval.
The preliminary observations of efficacy and safety from any of our preclinical or clinical trials for our product candidates are not necessarily indicative of the results that may be demonstrated in future clinical trials. Data obtained from studies performed on animals is not necessarily indicative of the results that may be demonstrated in future clinical trials in humans. We will need to conduct significant additional preclinical studies or clinical trials prior to seeking marketing approval for the product candidates in our development pipeline. No assessment of the safety or efficacy of any product candidate can be considered definitive until all clinical trials needed to support a submission for marketing approval are complete.
6
Oral Antifungals: Hyphanox.
Hyphanox is an oral formulation of itraconazole, an antifungal agent that we are developing for the treatment of onychomycosis, commonly known as nail fungus. Itraconazole is effective in treating this type of fungal infection. Janssen currently markets different formulations of itraconazole under Sporanox and other brand names in various countries. Sporanox is approved in the United States for the treatment of various disorders, including onychomycosis. A generic form of itraconazole has also been approved in the United States. A 100 mg capsule is the maximum strength in which oral Sporanox and its generics are currently available. We are developing Hyphanox as a 200 mg tablet. We believe this 200 mg formulation may provide a more convenient form of dosing and potentially better patient compliance.
Product Background.In an effort to produce a more convenient dosing form of Sporanox, Janssen conducted a program to reformulate itraconazole into 200 mg tablets using a proprietary formulation of itraconazole requiring a manufacturing process known as melt extrusion. Melt extrusion is a manufacturing process that has made it possible to formulate itraconazole into tablets. In September 2005, we announced that Janssen had notified us that it would not exercise its pre-negotiated option for this product candidate and, as a result, we retain worldwide rights for all dermatologic indications for this product candidate.
Clinical Development. We are currently conducting a Phase 3 clinical trial to test once daily dosing of one 200 mg tablet for three months in the treatment of toenail onychomycosis. We established the trial design after discussions with the FDA following the special protocol assessment process. In September 2007, we announced the completion of enrollment in this trial. We expect to be able to report top line data from this trial in the fourth quarter of 2008. If the results of this Phase 3 trial are favorable, we plan to file an NDA with the FDA seeking marketing approval in the first quarter of 2009.
Proprietary Rights.We have an exclusive license in the field of dermatology to a United States patent claiming the Hyphanox formulation and methods of using this formulation for treatment of fungal infections. The United States patent claiming the formulation and methods of treatment expires in 2017. We also have an exclusive license to corresponding patents and patent applications in Europe, Japan and other foreign countries. The issued patent and any additional patents issuing from the patent applications in Europe, Japan and other foreign countries will expire in 2016 through 2017. The active ingredient of Hyphanox, itraconazole, is off patent.
Oral Antifungals: Pramiconazole.
Pramiconazole is a novel antifungal agent that we are developing for onychomycosis and, potentially, as a short course treatment for superficial skin and mucosal fungal infections.
Product Background. Preclinical testing has shown Pramiconazole to be more potent than itraconazole against dermatological fungal infections and less interactive than itraconazole with the metabolism of other drugs. Based on the results from a one week Phase 1 clinical trial that we conducted for Pramiconazole which indicated that, at the doses tested, Pramiconazole has a half-life in the body which is approximately three times longer than that of itraconazole, we believe that Pramiconazole may be an effective short course oral treatment for fungal infections. We are developing Pramiconazole as a second generation antifungal product to our Hyphanox product candidate and are actively seeking a development partner for this product candidate.
In 2005, we announced positive results from Phase 2a clinical trials for infections of the skin. The product candidate was studied in tinea pedis, commonly known as athlete’s foot, tinea corporis, commonly known as ring worm, tinea cruris, commonly known as jock itch, tinea versicolor and seborrheic dermatitis. In these studies, Pramiconazole was well tolerated and there were no serious treatment-related adverse effects reported. Based upon the encouraging response rates obtained in these studies, we advanced Pramiconazole into Phase 2b clinical testing.
7
Clinical Development.In March 2007, we announced positive results from a completed Phase 2b study conducted outside the United States for tinea versicolor, a common skin fungal infection characterized by a discolored, scaly, itchy rash primarily on back, chest and upper arms. The 147 patients involved in the study reported no serious treatment-related adverse events, and were “effectively treated” at day 28. For purposes of this study, “effectively treated” was defined as significant reduction in disease signs and symptoms, with response rates varying from 35% for the lowest dose to 85% for the highest dose, compared to 16% for placebo.
We are currently conducting a Phase 2a clinical trial outside the United States with Pramiconazole in the treatment of onychomycosis. In October 2007, we announced interim data for 18 patients in this study. Patients in this 2a open label single-arm study are being treated with 200 mg of pramiconazole once weekly for 12 weeks, with follow up for an additional 36 weeks after treatment. Interim results indicated that patients being treated in this study showed a marked onset of clinical improvement in total signs and symptoms, and those evaluated at three months post-treatment demonstrated both mycological cure and a significant decrease in clinical signs and symptoms of the affected toenail. A total of 20 patients have been included in this ongoing study.
In November 2007, we also announced promising results from a completed Phase 1 dose escalation study outside the United States. No clinically relevant changes were seen in any of the 32 healthy volunteers who were dosed with up to 6 grams of pramiconazole given over a five-day period, as compared to placebo. The total of 6 grams is 30 times higher than the single weekly dose of 200 mg of Pramiconazole that is currently being used in the phase 2a study in toenail onychomycosis currently under way.
Proprietary Rights. We have an exclusive license in the field of dermatology to a United States patent claiming the chemical compound pramiconazole, pharmaceutical formulations containing pramiconazole and methods of treatment with pramiconazole. The United States patent expires in 2018. We also have an exclusive license to corresponding patents and patent applications in Europe, Japan and other foreign countries. The issued patent and any additional patents issuing from the patent applications in Europe, Japan and other foreign countries will expire in 2017 through 2018.
RAMBAs: Oral Rambazole.
Oral Rambazole is an oral formulation of a molecule from a novel class of molecules known as retinoic acid metabolism blocking agents, or RAMBAs. We are developing oral Rambazole for the treatment of psoriasis. We believe that Rambazole may address some of the limitations of existing therapies, such as toxicity, or the degree to which existing therapies are harmful at certain levels of treatment, and immune suppression, or the tendency of some existing therapies to compromise a patient’s immune system.
Through clinical studies, we are still learning about RAMBA’s mechanism of action, meaning how they work. One possibility is that RAMBAs work by blocking the intracellular metabolism of natural retinoic acid in cells. This blocking results in a transient elevation of the body’s own retinoic acid in the body’s cells, which we believe may provide the same therapeutic benefits as synthetic retinoid therapy but potentially with less risk of adverse side effects related to the accumulation of synthetic retinoids in the body’s tissues. However, RAMBAs may work in other ways as well.
Product Background.Various preclinical and clinical studies were conducted on Rambazole prior to our acquisition of rights to this product candidate. In 2005, we announced positive results from two Phase 2a clinical trials in Europe using oral Rambazole, one in moderate to severe psoriasis, and the other in moderate to severe nodular acne. In the Phase 2a trial in psoriasis, patients who were treated demonstrated a reduction at week 10 in the median psoriasis area severity index, commonly known as PASI score, by approximately 50%. There were no serious treatment-related adverse effects reported.
In the Phase 2a trial in acne, patients with moderate to severe nodular acne were treated with 1 mg of oral Rambazole once daily for 12 consecutive weeks. The results of this study indicate that 16 of 17 patients
8
experienced a significant reduction in total acne lesion count of more that 50% and 6 of 17 subjects were considered “cleared or almost cleared”. There were no serious treatment related adverse effects reported, while non-serious side effects experienced by this patient group included some dryness of skin and lips. Based on data from this trial, we advanced Rambazole into Phase 2b clinical testing in severe plaque psoriasis to explore additional therapeutic potential.
Clinical Development. In July 2007, we announced positive results from a Phase 2b dose finding clinical trial in severe plaque psoriasis conducted outside the United States. The main purpose of this study was to evaluate the dose-ranging response in safety and efficacy of oral Rambazole for the treatment of severe plaque psoriasis in order to select a dose for further clinical development. The 176 patients enrolled in the study with plaque psoriasis and PASI scores greater than or equal to 10 were randomized into one of four treatment groups, received either Rambazole at doses of 0.5 mg, 1 mg, or 2 mg or placebo once daily for 12 weeks. 49% of patients receiving 2 mg per day of Rambazole were scored “cleared or almost cleared” at week 20 as compared to 20% for patients receiving placebo. The drug was well tolerated at all levels of concentration, and there were no serious adverse events reported.
The FDA has placed oral Rambazole on clinical hold meaning that we may not initiate any clinical studies in humans in the United States until we address the FDA’s request for additional safety data. We believe this is due to the FDA’s concern about the safety profile of a class of drugs known as synthetic retinoids. Although oral Rambazole is not a synthetic retinoid, it blocks the intracellular metabolism of natural retinoic acid in cells, resulting in transient elevation of the body’s own retinoic acid. We expect to provide the data from the 2b study, as well as the data from other pharmacology and toxicology studies, to the FDA in an attempt to address their concerns and remove the clinical hold.
Proprietary Rights. We have an exclusive license in the field of dermatology to a United States patent claiming the chemical compound Rambazole, pharmaceutical formulations containing Rambazole and methods of treatment with Rambazole. The United States patent expires in 2017. We also have an exclusive license to corresponding patents and patent applications in Europe, Japan and other foreign countries. The issued patent and any additional patents issuing from the patent applications in Europe, Japan and other foreign countries will expire in 2016 through 2017.
Earlier Stage Clinical Candidates
Topical Rambazole. We are developing a topical formulation of Rambazole for dermatological indications, including common forms of acne and psoriasis. Preclinicalin vitro and animal studies suggest that topical Rambazole may have the potential to be effective in the treatment of psoriasis, acne and photo-damage.
We are currently conducting a Phase 2a clinical trial in Europe to evaluate the effectiveness of topical Rambazole in mild to moderate acne. The study is a double-blind, vehicle-controlled study, in which patients receive once-daily treatment of 0.35% topical Rambazole or vehicle for 12 weeks. We have enrolled 74 patients in this study. Based on our review of the interim efficacy data from 50 patients in this study, it is possible that topical Rambazole’s efficacy is comparable to that of existing synthetic retinoid therapies, with potentially less irritation, but the data to date is inconclusive. We are planning to complete this current trial and we may perform additional small scale clinical trials to obtain a better understanding of the efficacy profile of this product candidate prior to performing additional development work on this program.
Hivenyl. Hivenyl is an antihistamine that we are developing as an oral treatment for allergic reactions of the skin, such as the types of reactions associated with hives. We believe an advantage of Hivenyl over other antihistamines may be the absence of sedation typically associated with antihistamines. Patients experience sedation when an antihistamine crosses the blood-brain barrier. In preclinical studies in animal models, Hivenyl did not cross the blood-brain barrier. In addition, the results of two dose escalation Phase 1 clinical trials of Hivenyl suggest that Hivenyl inhibits allergic reactions, has a fast onset of action and does not cause sedation. In
9
these trials, no cardiovascular side effects or sedation was experienced at doses of five to 15 times those that elicited an antihistamine response.
In January 2007, we announced data from our Phase 2a clinical trial in Europe for Hivenyl, in the treatment of the itch associated with atopic dermatitis. In this study, which was a multi-center, double-blind, placebo-controlled study, 45 adult patients with atopic dermatitis underwent a one-week lead-in period followed by randomization to treatment with oral Hivenyl 60 mg twice daily (n=23) or placebo (n=22) for one week. All patients were also treated daily with a topical corticosteroid and an emollient throughout the study. Nine of the 23 patients in the Hivenyl group reported either a marked improvement or an almost complete to complete relief of their itch symptoms versus none of the 22 patients in the placebo group (p<0.01). The drug was well tolerated and no patients reported signs of sedation, which supports similar findings in prior studies with Hivenyl.
We are currently conducting a Phase 2a study for chronic idiopathic urticaria. Assuming the results of this study are positive, we plan to move forward with the development of this early stage clinical program.
Sales and Marketing
The dermatological medical community in the United States is relatively small. We believe that we can best serve this discrete target physician market with a focused, specialty sales force.
During 2006, following the approval of Vusion, we expanded the sales force in the United States to approximately 60 sales representatives, approximately one-third of which were inVentiv employees, and two-thirds of which were Barrier employees. In 2007, we completed the process of transitioning all sales representatives to full time Barrier employees, including six regional managers. inVentiv continues to provide us with supplemental sales and marketing services on an as-needed basis.
In March 2007, we entered into an agreement with Novartis Consumer Health, Inc., for the co-promotion of our Vusion product. Under the agreement, which became effective in June 2007, Novartis Consumer Health promotes our Vusion product to pediatricians in the United States, supplementing the efforts of our 60 person sales force. Under the agreement, which runs through 2008, we will pay Novartis a flat fee for each sales call made to a pediatrician. We will remain responsible for the marketing and product strategy, as well as for the development, manufacture, distribution and sale of the product.
As part of our marketing strategy, we utilize a variety of marketing tools to convey information about our products and their approved uses, including product sampling, rebate coupons, vouchers, journal advertising, print direct-to-consumer advertising, specialty publications, and product specific internet sites. For Vusion, we also utilize direct-to-consumer television advertising. We continually evaluate the effectiveness of these programs and may discontinue some, or add others, as we believe appropriate to market our products.
We rely on the Specialty Pharmaceutical Services unit of Cardinal Health to perform a variety of functions related to the sale and distribution of our products in the United States. These services include distribution, logistics management, inventory storage and transportation, invoicing and collections.
Although we intend eventually to market our products globally, our efforts in Canada and Europe to date have not yielded our desired results. As a result, we have ceased our sales and marketing related activities in Canada and Europe, and are focusing our efforts on our primary market, the United States.
Manufacturing
Our products and product candidates include both oral and topical formulations and are produced through a variety of manufacturing processes of varying degrees of difficulty. For example, Vusion, Solagé and Xolegel are produced through a fairly common manufacturing process, while Hyphanox is manufactured as a tablet using a proprietary melt extrusion process that is currently only available through our supply agreement with a contract
10
manufacturer. We have relied and will continue to rely on third-party contract manufacturers to produce sufficient quantities of our products for commercial supply and product candidates for use in our preclinical studies and clinical trials.
The following table summarizes our manufacturing relationships for our marketed products.
| | | | | | | | |
Product | | Country Where
Product is Sold | | Manufacturer/Supplier | | Country Where
Product is Made | | Contract Expiration |
Xolegel | | United States | | DPT Laboratories, Ltd. | | United States | | Oct. 31, 2011 |
| | | | |
Vusion | | United States | | DSM Pharmaceuticals, Inc. | | United States | | Dec. 31, 2009 |
| | | | |
Solagé | | United States | | Contract Pharmaceuticals Limited Niagra | | United States | | Dec. 31, 2010 |
The active pharmaceutical ingredients of our marketed products and our Hyphanox product candidate are generic and are currently available from a limited number of suppliers. However, we predominately rely on a single source of supply for those active ingredients. If any of the manufacturers of our products, product candidates or active ingredients, were to become unable or unwilling to continue to provide us with these products or ingredients, we may need to obtain an alternate supplier. The active pharmaceutical ingredients of Rambazole, Pramiconazole and Hivenyl are proprietary. We have relied and will continue to rely on third-party contract manufacturers to produce sufficient quantities of these active ingredients for our product candidates for use in our preclinical studies and clinical trials.
Our contract manufacturers are subject to an extensive governmental regulation process. Regulatory authorities in our markets require that drugs be manufactured, packaged and labeled in conformity with current Good Manufacturing Processes, or cGMPs. The cGMP requirements govern quality control of the manufacturing process and documentation policies and procedures.
Material Agreements
DPT Laboratories, Ltd. (for Xolegel finished product)
In March 2005, we entered into a manufacturing agreement with DPT Laboratories, Ltd. for the manufacture of our Xolegel product. The agreement has an initial term of five years and will automatically renew for additional periods of one year each. Under the agreement, DPT will manufacture and supply us with all Xolegel product at a mutually agreed upon price which is based on volume. This price may be subject to periodic change under certain conditions. Either party may terminate the agreement upon six months’ written notice to the other or upon sixty days’ notice for a failure to remedy any breach under the agreement.
DSM Pharmaceuticals, Inc. (for Vusion finished product)
In January 2005, we entered into a supply agreement with DSM Pharmaceuticals, Inc. for the manufacture of our Vusion product. Under the agreement, we agreed to purchase and DSM agrees to supply Vusion at mutually agreed upon price based on a rolling forecast, which price may be subject to periodic change under certain conditions. We are also obligated to annual minimum purchase requirements under this agreement. The agreement will currently expire by its terms on December 31, 2009, and either party may terminate the agreement by written notice at any time.
11
Abbott Supply Agreement (for Hyphanox intermediate melt extrudate)
In July 2007, we entered into a supply agreement with Abbott for the exclusive manufacture and supply of the intermediate used in the manufacture of Hyphanox. Under the Supply Agreement, Abbott agrees to manufacture and supply melt extrudate bulk material exclusively for us using Abbott’s patented drug delivery technology. The Supply Agreement, which has a term of ten years from the date of first commercial sale of a finished product, will require us to purchase certain minimums of melt extrudate based on rolling forecasts to be agreed upon at the time we file an NDA for Hyphanox. In addition to the supply price, we will pay Abbott a fee based on a percentage of net sales of our finished product. Either party may terminate the Supply Agreement upon twelve months’ written notice to the other or upon sixty (60) days notice for failure to remedy any breach. However, in the event of Abbott’s termination of the Supply Agreement for convenience, it must first put in place an adequate alternative supplier without interruption of supply.
Sanico Manufacturing Agreement (for Hyphanox finished product)
In January 2008, we entered into a manufacturing agreement with Sanico NV under which Sanico will manufacture and supply our Phase 3 product candidate, Hyphanox. The Third Party Manufacturing Agreement has an initial term of three years from the date of first invoice of the first commercial batch of the product, and shall automatically renew for subsequent two-year periods unless the agreement is otherwise terminated pursuant to its terms. Under the agreement, we will supply Sanico with bulk material (defined in the agreement as itraconazole melt extrudate) for the manufacture of Hyphanox, and Sanico agrees to manufacture and supply Hyphanox exclusively for us in exchange for a fee per unit manufactured. Either party may terminate the agreement upon eighteen months’ written notice to the other, or upon thirty days’ notice for failure to remedy any breach under the agreement. Also, either party may terminate the agreement if the FDA does not approve an NDA for Hyphanox by the fifth anniversary date of the effective date. If we do not commercialize Hyphanox by the fifth anniversary date of the effective date of the agreement, we will be required to make a one-time, lump sum payment to Sanico to cover FDA-related expenses incurred by Sanico during the agreement term.
Novartis Consumer Health Sales Force Agreement
In March 2007, we entered into a Sales Force Services Agreement with Novartis Consumer Health, Inc. under which Novartis Consumer Health will promote our Vusion product to pediatricians in the United States Beginning in May 2007, Novartis Consumer Health initiated promotion of Vusion to pediatricians, supplementing the efforts of our 60 person sales force. Under the agreement which runs through 2008, we will pay Novartis a flat fee for each sales call made to a pediatrician. We remain responsible for the marketing and product strategy, as well as for the development, manufacture, distribution and sale of the product. This agreement can be extended by mutual agreement of the parties.
Grupo Ferrer Distribution and License Agreement
In November 2004, we entered into a distribution and license agreement with Grupo Ferrer Internacional, S.A. The agreement provides for Grupo Ferrer to be our exclusive marketer and distributor of our Vusion, Xolegel, and two other non-core product candidates in several countries outside the United States. Under the agreement, we would receive our primary revenues from the sale of finished products to Grupo Ferrer. The agreement also provided for an initial fee of €500,000, which we received in January 2005. To date, only our Vusion product (marketed under the name Zimycan) has been launched by Grupo Ferrer in Portugal under this Agreement. We are currently in discussions with Grupo Ferrer to restructure, and potentially terminate, this agreement.
Johnson & Johnson License Agreements
In May 2002, we licensed our initial portfolio of product candidates and the patents and other intellectual property and know-how, test data, marketing data and other tangible property associated with those product
12
candidates, from Janssen Pharmaceutica Products, L.P., Johnson & Johnson Consumer Companies, Inc. and Ortho-McNeil Pharmaceutical, Inc., under two similar but separate intellectual property transfer and license agreements. In September 2004, we amended these two intellectual property transfer and license agreements to provide for revised territories and exclusivity terms.
Under these license agreements, we obtained exclusive licenses to a portfolio of patents and non-exclusive licenses to related know-how to make, use and sell our initial product candidates in the field of dermatology. For purposes of the agreements, the field of dermatology includes applications for the treatment or prevention of diseases of human skin, hair, nails and oral and genital mucosa, but excludes treatments for skin cancer. We also have access to classes of compounds claimed in the patents licensed to us under the agreements, which we can screen in our search for new product candidates in the field of dermatology. If we or an affiliate of Johnson & Johnson advance one of these compounds to Phase 1 clinical development, the developing party must give notice to the other party when the developing party has initiated a Phase 1 clinical trial for the particular compound. At that point, the other party must discontinue any activity towards the development or commercialization of that compound for any indication in any field for so long as the compound continues to be in active clinical development or commercialization by the developing party. In addition, neither Johnson & Johnson nor its affiliates may develop Rambazole, Pramiconazole, Hivenyl and several other specified candidates in any formulation for any indication in any field. In exchange for these licenses, we issued an aggregate of 8,333,333 shares of our series A convertible preferred stock to Johnson & Johnson Consumer Companies, Inc. and Janssen Pharmaceutica Products, L.P. All of these shares were converted into 4,166,666 shares of our common stock in connection with our initial public offering.
License Terms for Our Product Candidates
The following is a summary of the terms of the license agreements with respect to our existing product candidates and to any products that we may develop from the classes of compounds claimed in the patents licensed to us:
Royalties. The licenses are royalty free, except that, with respect to Hyphanox only, if we decide to use a third party to commercialize Hyphanox, we will owe a royalty based on our net sales of Hyphanox. This royalty would also apply to sales by a successor company in the event of a change of control.
Territories and Exclusivity. For the most part, the licenses are exclusive throughout most of the world including the United States.
Commercialization and Manufacturing Rights. We have the sole right to commercialize any product candidate covered by intellectual property licensed to us under the license agreements that we elect to commercialize ourselves or with the assistance of a contract sales organization. In other circumstances, however, Johnson & Johnson, through any of its affiliates, has a right of first negotiation for the commercialization of our product candidates based on such intellectual property. The rights of first negotiation for the commercialization of our product candidates can be exercised on a territory-by-territory basis. The material elements of these rights are as follows:
| | • | | If we intend to commercialize any product through a third party, other than a contract sales organization, in a particular territory, we must provide notice of this intention in accordance with the provisions of the license agreements. Johnson & Johnson has 90 days after the provision of this notice to advise us if it desires to enter into a commercialization agreement for that product in that territory. |
| | • | | If, prior to the expiration of the 90-day offer period we do not receive that notice, we may enter into a commercialization agreement with a third party for that product without further restrictions or obligations under these rights of first negotiation. |
| | • | | If, prior to the expiration of the 90-day offer period we do receive that notice, we must negotiate exclusively for 90 days to execute a commercialization agreement. |
13
| | • | | If we do not agree on a definitive agreement within the 90-day negotiation period, we may, at any time within a specified period of time after the end of the 90-day negotiation period, enter into a commercialization agreement for that product with a third party so long as the terms are not, taken as a whole, materially less favorable to us than those proposed by the Johnson & Johnson affiliate with which we were negotiating. |
| | • | | If within the specified negotiation period, we intend to enter into a commercialization agreement with a third party with terms materially less favorable to us than those proposed by the Johnson & Johnson affiliate or, if after the specified negotiation period, we intend to enter into a commercialization agreement with a third party on any terms, then Johnson & Johnson, through any of its affiliates, is entitled to an additional 45-day offer period to express an interest in commercializing that product. If, prior to the termination of the additional 45-day offer period, Johnson & Johnson notifies us of its interest in commercializing the product, we must negotiate exclusively for 60 days to execute a commercialization agreement. |
| | • | | If we enter into a commercialization agreement with an affiliate of Johnson & Johnson, it will have the right to negotiate a manufacturing agreement with us relating to that particular product in the territory covered by the commercialization agreement. The terms of the right of first negotiation for a manufacturing agreement are the same as the terms of the right of first negotiation for a commercialization agreement. |
We triggered this right of first negotiation with respect to Pramiconazole and Rambazole by indicating our intention to commercialize these product candidates through third-party arrangements. Since the 90-day offer period for these product candidates has expired, if we receive marketing approvals, we have the exclusive right to commercialize Pramiconazole and Rambazole, either by ourselves or with a third party. In September 2005, Janssen notified us that it would not exercise its pre-negotiated option for Hyphanox and, as a result, we retain worldwide rights for all dermatology indications for this product candidate.
Term and Termination.The license agreements expire on a country-by-country basis and product-by-product basis after the later of 10 years from the execution date or the expiration of the last patent included in the license agreement in the particular country. Following expiration of the license agreements with respect to a product, we receive a fully paid, royalty-free license applicable to that product in the particular country. These licenses may be terminated on a product-by-product basis, if, by dates specified in the license agreements, we are not conducting active clinical trials of the particular product or if we do not obtain regulatory approval for that product. Either of the license agreements may be terminated if we breach that agreement and do not cure the breach within 90 days or in the event of our bankruptcy or liquidation.
Patent and Intellectual Property Protection; Orphan Drug; Hatch-Waxman Act; Pediatric Treatment Exclusivity
We are pursuing a number of methods to establish and maintain market exclusivity for our product candidates, including seeking patent protection for our product candidates, the use of statutory market exclusivity provisions and otherwise protecting our intellectual property.
Patents and Intellectual Property Protection
Our success depends in part on our ability to obtain and maintain proprietary protection for our product candidates, technology and know-how, to operate without infringing the proprietary rights of others and to prevent others from infringing our proprietary rights. Our policy is to seek to protect our proprietary position by, among other methods, filing United States and foreign patent applications related to our proprietary technology, inventions and improvements that are important to the development of our business. We also rely on trade secrets, know-how, continuing technological innovation and in-licensing opportunities to develop and maintain our proprietary position.
14
Our patent portfolio includes patents and patent applications with claims directed to the active ingredients, pharmaceutical formulations, methods of use and methods of manufacturing of a number of our product candidates. We include a discussion of our proprietary rights related to each of our marketed products and our later stage product candidates and the applicable limitations to our rights in the discussion of those products elsewhere in this “Business” section and in the “Risk Factors” section.
United States patents issuing from patent applications filed on or after June 8, 1995 have a term of twenty years from the earliest claimed priority date. For United States patents in force on June 8, 1995 or that issued from applications filed before June 8, 1995, the term is the greater of twenty years from the earliest claimed priority date or seventeen years from the date of issue.
The patent positions of companies like ours are generally uncertain and involve complex legal and factual questions. Our ability to maintain and solidify our proprietary position for our technology will depend on our success in obtaining effective claims and enforcing those claims once granted. We do not know whether any of our patent applications or those patent applications that we license will result in the issuance of any patents. Our issued patents and those that may issue in the future, or those licensed to us, may be challenged, invalidated or circumvented, which could limit our ability to stop competitors from marketing related products or the length of term of patent protection that we may have for our products. In addition, the rights granted under any issued patents may not provide us with proprietary protection or competitive advantages against competitors with similar technology. Furthermore, our competitors may independently develop similar technologies or duplicate any technology developed by us. Because of the extensive time required for development, testing and regulatory review of a potential product, it is possible that, before any of our products can be commercialized, any related patent may expire or remain in force for only a short period following commercialization, thereby reducing any advantage of the patent.
We may rely, in some circumstances, on trade secrets to protect our technology. However, trade secrets are difficult to protect. We seek to protect our proprietary technology and processes, in part, by confidentiality agreements with our employees, consultants, scientific advisors and other contractors. These agreements may be breached, and we may not have adequate remedies for any breach. In addition, our trade secrets may otherwise become known or be independently discovered by competitors. To the extent that our employees, consultants or contractors use intellectual property owned by others in their work for us, disputes may arise as to the rights in related or resulting know-how and inventions.
The Hatch-Waxman Act—Marketing Exclusivity
Under the United States Drug Price Competition and Patent Term Restoration Act of 1984, known as the Hatch-Waxman Act, newly approved drugs and indications benefit from a statutory period of non-patent marketing exclusivity. The Hatch-Waxman Act provides five year marketing exclusivity to the first applicant to gain approval of an NDA for a new chemical entity, meaning that the FDA has not previously approved any other new drug containing the same active ingredient. Hatch-Waxman prohibits an abbreviated new drug application, an ANDA, or an NDA where the applicant does not own or have a legal right of reference to all the data required for approval, to be submitted by another company for another version of such drug during the five year exclusive period. Protection under Hatch-Waxman will not prevent the filing or approval of another full NDA, however, the applicant would be required to conduct its own adequate and well-controlled clinical trials to demonstrate safety and effectiveness.
The Hatch-Waxman Act also provides three years of marketing exclusivity for the approval of new NDAs with new clinical trials for previously approved drugs and supplemental NDAs, for example, for new indications, dosages, or strengths of an existing drug, if new clinical investigations are essential to the approval. This three year exclusivity covers only the new changes associated with the supplemental NDA and does not prohibit the FDA from approving ANDAs for drugs containing the original active ingredient. Our Vusion product has been granted three years of exclusivity under this Act.
15
The Hatch-Waxman Act—Patent Term Extension
The Hatch-Waxman Act also permits a patent extension term of up to five years as compensation for patent term lost during product development and the FDA regulatory review process. However, patent extension cannot extend the remaining term of a patent beyond a total of 14 years. The patent term restoration period is generally one-half the time between the effective date of an IND and the submission date of an NDA, plus the time between the submission date of an NDA and the approval of that application. Only one patent applicable to an approved drug is eligible for the extension and it must be applied for prior to expiration of the patent. The USPTO in consultation with the FDA, reviews and approves the application for patent term extension. We have applied for patent term extension for the formulation patent for our Vusion product. The application is currently under review.
An application for patent term extension goes through a series of sequential processing steps alternating between the USPTO and the FDA until a certificate of extension is eventually granted. This process may take several years. Upon receiving the initial application for extension, the USPTO makes a preliminary review of the application to determine whether or not the patent is eligible for extension, and provides a copy to the FDA. The FDA then confirms and verifies with the USPTO that the product is eligible for extension from the FDA’s point of view.
This begins a more thorough and detailed review of the application by the USPTO to ensure that the claims of the patent cover the approved product. Once the USPTO determines an application is eligible, it requests the FDA make a determination of the applicable regulatory review period. This is the current status of our application for Vusion, and we are awaiting notification of the regulatory review period. Upon confirming the eligibility time period in the application, the information is then published in the Federal Register. The purpose of the notice is to provide any interested party 180 days to petition the FDA in opposition of the application for extension.
Following this 180-day period, provided no petition has been filed, the USPTO conducts an even more thorough review of the application and carries out a complex calculation to arrive at the number of days of extension that will be granted, which could take from several months to a year. Once this calculation is complete, a formal notice is sent to the applicant. An applicant has 30 days to disagree with the contents of the notice, including the period of extension. However, provided no reconsideration is made, the extension is considered final and a certificate of extension is issued by the USPTO within a few months.
Pediatric Treatment Exclusivity
The Best Pharmaceuticals for Children Act provides an additional six months of marketing exclusivity for new or marketed drugs for specific pediatric studies conducted at the written request of the FDA. The Pediatric Research Equity Act of 2003, or PREA, authorizes the FDA to require pediatric studies for drugs to ensure the drugs’ safety and efficacy in children. PREA requires that new NDAs or supplements to NDAs contain data assessing the safety and effectiveness for the claimed indication in all relevant pediatric subpopulations. Dosing and administration must be supported for each pediatric subpopulation for which the drug is safe and effective. The FDA may also require this data for approved drugs that are used in pediatric patients for the labeled indication, or where there may be therapeutic benefits over existing products. The FDA may grant deferrals for submission of data, or full or partial waivers from PREA. Unless otherwise required by regulation, PREA does not apply to any drug for an indication with orphan designation.
Government Regulation
Government authorities in the United States, at the federal, state, and local level, and foreign countries extensively regulate, among other things, the following areas relating to our marketed products and product candidates:
| | • | | the development, and testing; |
| | • | | manufacture and distribution; |
16
| | • | | labeling, promotion, advertising, sampling, and marketing; and |
All of our product candidates will require regulatory approval by government agencies prior to commercialization. In particular, human therapeutic products are subject to rigorous preclinical and clinical trials and other approval procedures of the FDA and similar regulatory authorities in foreign countries. Various federal, state, local, and foreign statutes and regulations also govern testing, manufacturing, safety, labeling, storage and record-keeping related to such products and their marketing. The process of obtaining these approvals and the subsequent substantial compliance with appropriate federal, state, local, and foreign statutes and regulations require the expenditure of substantial time and financial resources.
United States Government Regulation
In the United States, the FDA regulates drugs under the Federal Food, Drug, and Cosmetic Act and implementing regulations. If we fail to comply with the applicable requirements at any time during the product development process, approval process, or after approval, we may become subject to administrative or judicial sanctions. These sanctions could include the FDA’s refusal to approve pending applications, withdrawals of approvals, clinical holds, warning letters, product recalls, product seizures, total or partial suspension of our operations, injunctions, fines, civil penalties or criminal prosecution. Any agency enforcement action could have a material adverse effect on us.
The steps required before a drug may be marketed in the United States include:
| | • | | preclinical laboratory tests, animal studies and formulation studies under the FDA’s good laboratory practices regulations; |
| | • | | submission to the FDA of an investigational new drug application, or IND, which must become effective before human clinical trials may begin; |
| | • | | execution of adequate and well-controlled clinical trials to establish the safety and efficacy of the product for each indication for which approval is sought; |
| | • | | submission to the FDA of an NDA; |
| | • | | satisfactory completion of an FDA inspection of the manufacturing facility or facilities at which the product is produced to assess compliance with current good manufacturing practice, or cGMP; and |
| | • | | FDA review and approval of the NDA. |
Preclinical studies generally are conducted in laboratory animals to evaluate the potential safety and activity of a product. Violation of the FDA’s good laboratory practices regulations can, in some cases, lead to invalidation of the studies, requiring these studies to be replicated. In the United States, drug developers submit the results of preclinical trials, together with manufacturing information and analytical and stability data, to the FDA as part of the IND, which must become effective before clinical trials can begin in the United States. An IND becomes effective 30 days after receipt by the FDA unless before that time the FDA raises concerns or questions about issues such as the proposed clinical trials outlined in the IND. In that case, the IND sponsor and the FDA must resolve any outstanding FDA concerns or questions before clinical trials can proceed. If these concerns or questions are unresolved, the FDA may not allow the clinical trials to commence.
Pilot studies generally are conducted in a limited patient population to determine whether the product candidate warrants further clinical trials based on preliminary indications of efficacy. These pilot studies may be performed in the United States after an IND has become effective or outside of the United States prior to the filing of an IND in the United States in accordance with government regulations and institutional procedures in the country in which the trials are conducted.
17
Clinical trials involve the administration of the investigational product candidate to human subjects under the supervision of qualified investigators. Clinical trials are conducted under protocols detailing, among other things, the objectives of the study, the parameters to be used in assessing the safety and the effectiveness of the drug. Each protocol must be submitted to the FDA as part of the IND prior to beginning the trial.
Typically, clinical evaluation involves a time-consuming and costly three-phase sequential process, but the phases may overlap. Each trial must be reviewed, approved and conducted under the auspices of an independent institutional review board, and each trial must include the patient’s informed consent.
Phase I:Refers typically to closely monitored clinical trials and includes the initial introduction of an investigational new drug into human patients or healthy volunteer subjects. Phase 1 clinical trials are designed to determine the safety, metabolism and pharmacologic actions of a drug in humans, the potential side effects associated with increasing doses of the product candidate and, if possible, to gain early evidence of the product candidate’s effectiveness. Phase 1 trials also include the study of structure-activity relationships, drug metabolism and mechanism of action in humans, as well as studies in which investigational drugs are used as research tools to explore biological phenomena or disease processes. During Phase 1 clinical trials, sufficient information about a drug’s pharmacokinetics and pharmacological effects should be obtained to permit the design of well-controlled, scientifically valid Phase 2 studies. The total number of subjects and patients included in Phase 1 clinical trials varies, but are generally in the range of 20 to 80 people.
Phase 2:Refers to controlled clinical trials conducted to evaluate appropriate dosage and the effectiveness of a drug for a particular indication or indications in patients with a disease or condition under study and to determine the common short-term side effects and risks associated with the drug. These clinical trials are typically well controlled, closely monitored and conducted in a relatively small number of patients, usually involving no more than several hundred subjects. Although the FDA regulations do not do so, it is common practice in the pharmaceutical industry to sometimes distinguish Phase 2 clinical trials as Phase 2a and Phase 2b. In general, we believe that the common understanding in the industry of Phase 2a and Phase 2b is as follows:
| | • | | Phase 2a refers to a clinical trial in a targeted patient population to evaluate preliminary efficacy and/or further safety of a drug candidate. One or more of the following properties may be evaluated: dose response, duration of effect and kinetic/dynamic relationship. |
| | • | | Phase 2b refers to a controlled dose ranging clinical trial to evaluate further the efficacy and safety of a candidate drug in a targeted patient population and to attempt to define an appropriate dosing regimen. |
Phase 3:Refers to expanded controlled and uncontrolled clinical trials. These clinical trials are performed after preliminary evidence suggesting effectiveness of a drug has been obtained. Phase 3 clinical trials are intended to gather additional information about the effectiveness and safety that is needed to evaluate the overall benefit-risk relationship of the drug and to provide an adequate basis for physician labeling. Phase 3 trials usually include from several hundred to several thousand subjects.
Phase 1, 2 and 3 testing may not be completed successfully within any specified time period, if at all. The FDA closely monitors the progress of each of the three phases of clinical trials that are conducted in the United States and may, at its discretion, reevaluate, alter, suspend or terminate the testing based upon the data accumulated to that point and the FDA’s assessment of the risk/benefit ratio to the patient. A clinical program is designed after assessing the causes of the disease, the mechanism of action of the active pharmaceutical ingredient of the product candidate and all clinical and preclinical data of previous trials performed. Typically, the trial design protocols and efficacy endpoints are established in consultation with the FDA. Upon request through a special protocol assessment, the FDA can also provide specific guidance on the acceptability of protocol design for clinical trials. The FDA, an institutional review board, or we may suspend or terminate clinical trials at any time for various reasons, including a finding that the subjects or patients are being exposed to an unacceptable health risk. The FDA can also request additional clinical trials be conducted as a condition to product approval. During all clinical trials, physicians monitor the patients to determine effectiveness and to observe and report any reactions or other safety risks that may result from use of the drug.
18
Assuming successful completion of the required clinical trials, drug developers submit the results of preclinical studies and clinical trials, together with other detailed information including information on the manufacture and composition of the product, to the FDA, in the form of an NDA, requesting approval to market the product for one or more indications. In most cases, the NDA must be accompanied by a substantial user fee. The FDA reviews an NDA to determine, among other things, whether a product is safe and effective for its intended use.
Before approving an application, the FDA may inspect the facility or facilities at which the product is manufactured. The FDA will not approve the application unless cGMP compliance is satisfactory. The FDA will issue an approval letter if it determines that the application, manufacturing process and manufacturing facilities are acceptable. If the FDA determines that the application, manufacturing process or manufacturing facilities are not acceptable, it will outline the deficiencies in the submission and will often request additional testing or information. Notwithstanding the submission of any requested additional information, the FDA ultimately may decide that the application does not satisfy the regulatory criteria for approval and refuse to approve the application by issuing a “refusal to approve” letter.
The testing and approval process requires substantial time, effort and financial resources, and each may take several years to complete. The FDA may not grant approval on a timely basis, or at all. We may encounter difficulties or unanticipated costs in our efforts to secure necessary governmental approvals, which could delay or preclude us from marketing our products. Furthermore, the FDA may prevent a drug developer from marketing a product under a label for its desired indications or place other conditions on distribution as a condition of any approvals, which may impair commercialization of the product. After approval, some types of changes to the approved product, such as adding new indications, manufacturing changes and additional labeling claims, are subject to further FDA review and approval. Similar regulatory procedures must also be complied with in countries outside the United States.
If the FDA approves the NDA, the drug becomes available for physicians to prescribe in the United States. After approval, the drug developer must comply with a number of post-approval requirements, including delivering periodic reports to the FDA, submitting descriptions of any adverse reactions reported, and complying with drug sampling and distribution requirements. The holder of an approved NDA is required to provide updated safety and efficacy information and to comply with requirements concerning advertising and promotional labeling. Also, quality control and manufacturing procedures must continue to conform to cGMPs after approval. Drug manufacturers and their subcontractors are required to register their facilities and are subject to periodic unannounced inspections by the FDA to assess compliance with cGMPs which imposes certain procedural and documentation requirements relating to quality assurance and quality control. Accordingly, manufacturers must continue to expend time, money and effort in the area of production and quality control to maintain compliance with cGMPs and other aspects of regulatory compliance. The FDA may require post market testing and surveillance to monitor the product’s safety or efficacy, including additional studies, known as Phase 4 trials, to evaluate long-term effects.
In addition to studies requested by the FDA after approval, a drug developer may conduct other trials and studies to explore use of the approved compound for treatment of new indications, which require FDA approval. The purpose of these trials and studies is to broaden the application and use of the drug and its acceptance in the medical community.
We use, and will continue to use, third-party manufacturers to produce our products in clinical and commercial quantities. Future FDA inspections may identify compliance issues at our facilities or at the facilities of our contract manufacturers that may disrupt production or distribution, or require substantial resources to correct. In addition, discovery of problems with a product or the failure to comply with requirements may result in restrictions on a product, manufacturer or holder of an approved NDA, including withdrawal or recall of the product from the market or other voluntary or FDA-initiated action that could delay further marketing. Newly discovered or developed safety or effectiveness data may require changes to a product’s approved labeling,
19
including the addition of new warnings and contra-indications. Also, new government requirements may be established that could delay or prevent regulatory approval of our products under development.
Marketed products are subject to continued regulatory oversight by the Office of Medical Policy Division of Drug Marketing, Advertising and Communications, and the failure to comply with applicable regulations could result in marketing restrictions, financial penalties and other sanctions.
Foreign Regulation
Whether or not we obtain FDA approval for a product, we must obtain approval of a product by the comparable regulatory authorities of foreign countries before we can commence clinical trials or marketing of the product in those countries. The approval process varies from country to country, and the time may be longer or shorter than that required for FDA approval. The requirements governing the conduct of clinical trials, product licensing, pricing and reimbursement also vary greatly from country to country. Although governed by the applicable country, clinical trials conducted outside of the United States typically are administered with the three-phase sequential process that is discussed above under “—United States Governmental Regulation.”
Under European Union regulatory systems, we may submit marketing authorization applications either under a centralized or decentralized procedure. The centralized procedure which is available for medicines produced by biotechnology or which are highly innovative, provides for the grant of a single marketing authorization that is valid for all European Union member states. This authorization is a marketing authorization approval, or MAA. The decentralized procedure provides for mutual recognition of national approval decisions. Under this procedure, the holder of a national marketing authorization may submit an application to the remaining member states. Within 90 days of receiving the applications and assessment report, each member state must decide whether to recognize approval. This procedure is referred to as the mutual recognition procedure, or MRP.
In addition, regulatory approval of prices is required in most countries other than the United States. We face the risk that the resulting prices would be insufficient to generate an acceptable return to us or our collaborators.
Competition
The pharmaceutical industry and the dermatology segment in particular, are highly competitive and include a number of established, large and mid-sized pharmaceutical companies, as well as smaller emerging companies, whose activities are directly focused on our target markets and areas of expertise. Our products compete, and if approved, our product candidates will compete, with a large number of products that include over-the-counter treatments, prescription drugs specifically indicated for a dermatological condition and prescription drugs that are prescribed off-label. In addition, new developments, including the development of other drug technologies and methods of preventing the incidence of disease, occur in the pharmaceutical industry at a rapid pace. These developments may render our product candidates or technologies obsolete or noncompetitive.
Each of our marketed products competes, and if approved each of our product candidates will compete, for a share of the existing market with numerous products that have become standard treatments recommended or prescribed by physicians. For example, we believe the primary competition for our marketed products are:
| | • | | For Xolegel, in the treatment of seborrheic dermatitis, topical antifungal products such as Extina from Stiefel, Tersi Foam from Quinnova Pharmaceuticals, Nizoral from Janssen, Loprox from Medicis Pharmaceutical Corporation and generic equivalents, topical corticosteroids (class IV-VII) such as Desowen from Galderma S.A. and generic equivalents. |
| | • | | For Vusion in the treatment of diaper dermatitis complicated by candidiasis, ointments and creams containing nystatin, Mycolog II from Bristol-Myers Squibb Company, clotrimazole containing creams from Bayer AG and from generic manufacturers and topical miconazole creams. Apart from Vusion, |
20
| | none of these products are indicated for the treatment of diaper dermatitis complicated by documented candidiasis. |
| | • | | For Solagé in the treatment of solar lentigenes, prescription 4% hydroquinone containing formulations such as Triluma from Galderma S.A. and EpiQuin Micro from SkinMedica, Inc; as well as over-the-counter 2% hydroquinone products; topical retinoid products, such as Retin-A from Neutrogena and Avage from Allergan, Inc. |
We believe the primary competition for our later stage product candidates in development are:
| | • | | For Hyphanox and Pramiconazole, in the treatment of onychomycosis, Sporanox from Janssen and generic manufacturers, Lamisil from Novartis AG and generic manufacturers, and Penlac from Dermik Laboratories and generic equivalents. |
| | • | | For oral Rambazole, in the treatment of psoriasis, Soriatane from Stiefel Laboratories, biologic agents such as Enbrel from Amgen, Remicade from Johnson &Johnson, Raptiva from Genentech, Inc., and Amevive from Astellas Pharma US, Inc., cyclosporine such as Neoral from Novartis AG and generic equivalents and methotrexate from generic manufacturers. |
| | • | | For Pramiconazole, in the treatment of superficial fungal infections, topical antifungals including Loprox from Medicis Pharmaceutical Corporation, Lotrimin AF from Schering-Plough and generic manufacturers, Lotrimin Ultra from Schering-Plough, Lamisil AT from Novartis, and ketoconazole, miconazole and nystatin from generic manufacturers. |
We expect to compete on, among other things, the efficacy of our products, the reduction in adverse side effects experienced and more desirable treatment regimens, combined with the effectiveness of our experienced management team. Competing successfully will depend on our continued ability to attract and retain skilled and experienced personnel, to identify, secure the rights to and develop pharmaceutical products and compounds and to exploit these products and compounds commercially before others are able to develop competitive products. In addition, our ability to compete may be affected because insurers and other third-party payors in some cases seek to encourage the use of generic products making branded products less attractive, from a cost perspective, to buyers.
Although we believe that, if approved, our product candidates will have favorable features for the treatment of their intended indications, existing treatments or treatments currently under clinical development that also receive regulatory approval may possess advantages in competing for market share.
Third-Party Reimbursement and Pricing Controls
In the United States and elsewhere, sales of pharmaceutical products depend in significant part on the availability of reimbursement to the consumer from third-party payors, such as government and private insurance plans. Third-party payors are increasingly challenging the prices charged for medical products and services. It will be time-consuming and expensive for us to go through the process of seeking reimbursement from Medicare and private payors. Our products may not be considered cost effective, and coverage and reimbursement may not be available or sufficient to allow us to sell our products on a competitive and profitable basis. The passage of the Medicare Prescription Drug and Modernization Act of 2003 imposes new requirements for the distribution and pricing of prescription drugs which may affect the marketing of our products.
In many foreign markets, including the countries in the European Union, pricing of pharmaceutical products is subject to governmental control. In the United States, there have been, and we expect that there will continue to be, a number of federal and state proposals to implement similar governmental pricing control. While we cannot predict whether such legislative or regulatory proposals will be adopted, the adoption of such proposals could have a material adverse effect on our business, financial condition and profitability.
21
Employees
As of December 31, 2007, we had 130 full-time employees. Of our full time employees, 83 were engaged in sales and marketing, 26 were engaged in research and development and 21 were engaged in general and administrative activities. None of our employees is represented by a collective bargaining arrangement, and we believe our relationship with our employees is good.
Trademarks
Barrier Therapeutics®, Xolegel®, Vusion®, and Solagé® are registered trademarks of Barrier Therapeutics, Inc. Zimycan® is a registered European Community Trademark of Barrier Therapeutics, Inc. We are seeking United States trademark registrations for our trademarks Xolex™, Xolegel Duo™, Hyphanox™, Rambazole™ and Hivenyl™.
Available Information
We maintain a website at www.barriertherapeutics.com. General information about us, including our Corporate Governance Guidelines and the charters for the committees of our Board of Directors, can be found on this website. Our Board of Directors has adopted a Code of Conduct, which applies to all employees, officers and directors. This Code of Conduct can also be found on our website. We make available free of charge through the Investor Relations section of our website our annual reports on Form 10-K, quarterly reports on Form 10-Q, current reports on Form 8-K and all amendments to those reports as soon as reasonably practicable after such material is electronically filed with or furnished to the Securities and Exchange Commission. We include our website address in this Annual Report on Form 10-K only as an inactive textural reference and do not intend it to be an active link to our website. The material on our website is not part of our Annual Report on Form 10-K. You may also obtain a free copy of these reports and amendments, as well as our Corporate Governance Guidelines, committee charters and Code of Conduct, by contacting our General Counsel at Barrier Therapeutics, Inc., 600 College Road East, Suite 3200, Princeton, NJ 08540.
22
RISKS RELATED TO OUR BUSINESS
Risks related to our financial results and need for additional financing
We have incurred losses since inception and anticipate that we will continue to incur losses for the next several years.
Since our inception in September 2001, we have incurred significant operating losses and, as of December 31, 2007, we had an accumulated deficit of $257.9 million. We currently market three pharmaceutical products in the United States: Xolegel, Vusion and Solagé. Our product pipeline includes several product candidates in various stages of clinical development. Prior to our acquisition of Solagé in February 2005, we had generated no revenues from the sale of our products. We expect to continue to incur significant operating expenses as we:
| | • | | conduct our sales and marketing activities to commercialize our products; |
| | • | | conduct clinical trials; |
| | • | | conduct research and development on existing and new product candidates; |
| | • | | seek regulatory approvals for our product candidates; |
| | • | | hire additional clinical, scientific, sales and marketing, management and compliance personnel; |
| | • | | add operational, financial and management information systems; and |
| | • | | identify and in-license or acquire additional compounds, technologies, marketed products or businesses. |
We need to generate significant revenue to achieve profitability. We may never generate sufficient sales revenue to achieve and then maintain profitability. We expect to incur operating losses for the next several years.
We are highly dependent upon sales of Vusion and, if these revenues do not grow, or if we cannot grow sales of Xolegel or commercialize new products, we will not become profitable.
A significant portion of our revenues are generated by sales of Vusion. Until such time as we develop, acquire or in-license additional approved products or significantly increase sales of Xolegel, we will continue to rely on Vusion for most of our revenues. Accordingly, our near term success currently depends significantly on our ability to increase sales of Vusion. Our sales and marketing efforts may not be successful in increasing prescriptions for Vusion. Sales of Vusion are dependent upon our ability to, among other things:
| | • | | increase physician and patient awareness and continued use of the product; |
| | • | | successfully implement our direct to consumer television advertising campaign and our other marketing efforts; |
| | • | | obtain patent term extension for the existing patent covering Vusion’s formulation and obtain additional intellectual property protection; |
| | • | | develop line extensions; and |
| | • | | obtain coverage from third-party payors. |
For the foreseeable future, if we are unable to grow Vusion sales or if we cannot grow sales of Xolegel or commercialize new products, we will be unable to increase our revenues or achieve profitability and we may be forced to delay or change our current plans to develop our product candidates.
We may need substantial additional funding and may be unable to raise capital when needed, which would force us to delay, reduce or eliminate our product development programs or commercialization efforts.
As of December 31, 2007, we had cash, cash equivalents and marketable securities of $48.5 million. We believe that our existing cash resources and our interest on these funds will be sufficient to meet our projected
23
operating requirements and debt obligations for at least the next 12 months. Other than our existing secured credit facility, we currently have no additional commitments or arrangements for any additional financing to fund the commercialization of our marketed products and the research, development and commercial launch of our product candidates. We may require additional funding in order to continue our commercialization efforts and our research and development programs, including preclinical studies and clinical trials of our product candidates, pursue regulatory approvals for our product candidates, commercialize our products, expand our sales and marketing capabilities and for general corporate purposes. Our future capital requirements will depend on many factors, including:
| | • | | the success of our commercialization of our marketed products and our ability to increase revenues; |
| | • | | the costs of commercialization activities, including manufacturing, product advertising and marketing, sales and distribution, compliance, and related working capital needs; |
| | • | | our ability to establish and maintain collaborative and other strategic arrangements; |
| | • | | the advancement and success of the development of our product candidates, including clinical trial results; |
| | • | | the timing of, and the costs involved in, obtaining regulatory approvals, particularly with respect to Hyphanox; |
| | • | | the costs of manufacturing activities for our clinical trials; |
| | • | | the costs involved in preparing, filing, prosecuting, maintaining and enforcing patent claims and other intellectual property-related costs, including any possible litigation costs; and |
| | • | | potential acquisition or in-licensing of other technologies, products or businesses. |
A key part of our business strategy is to seek to selectively acquire additional marketed or approved dermatological products. The acquisition of any such product would likely require upfront and near term milestone payments which would require additional cash resources.
We may continue to seek additional capital through public or private equity offerings, or debt financings. Adequate financing may not be available on terms acceptable to us, if at all.
If we raise additional funds by issuing equity securities, our stockholders would experience dilution. Debt financing, if available, may involve agreements that include covenants limiting or restricting our ability to take specific actions such as incurring additional debt, making capital expenditures or declaring dividends. Any debt financing that we raise or additional equity we may sell may contain terms that are not favorable to us or our common stockholders. If we raise additional funds through collaboration and licensing arrangements with third parties, it will be necessary to relinquish some rights to our technologies or our product candidates or grant licenses on terms that may not be favorable to us. Lack of funding could adversely affect our ability to pursue our business. For example, if adequate funds are not available, we may be required to curtail significantly or eliminate one or more of our product development programs or the commercialization of our marketed products.
We may not be able to complete the development of our Pramiconazole, Rambazole and Hivenyl product candidates if can’t enter into acceptable development arrangements with third parties.
Developing pharmaceutical products, especially those based on new chemical entities such as Pramiconazole, Rambazole and Hivenyl, is costly and time-consuming and requires substantial financial and human resources. A key part of our business strategy is to enter into collaborative licensing arrangements to provide funding for the development and commercialization of our product candidates. Currently, we are seeking these arrangements for our Pramiconazole product candidate and plan to seek such arrangements for Rambazole if we are able to remove the FDA’s clinical hold. If we are unable to enter into these types of arrangements or unable to do so in a timely manner, the development of one or more of our product candidates may be delayed or possibly discontinued.
24
If our ongoing Phase 3 pivotal clinical trial for Hyphanox in onychomycosis is not successful, we will not be able to submit an application for marketing approval in a timely manner which would adversely affect our future revenues.
We are currently conducting a Phase 3 pivotal clinical trial for Hyphanox to test once daily dosing of one 200 mg tablet in the treatment of toenail onychomycosis. If the results of this Phase 3 clinical trial are favorable, we plan to file a New Drug Application, or NDA, seeking marketing approval with the United States Food and Drug Administration, or FDA, in the first quarter of 2009. If this trial does not produce favorable results we will not be able to submit an NDA for marketing approval with the FDA in our expected timeframe. This delay would likewise delay any potential approval, or depending upon the data, cause us to discontinue developing this product candidate, in either case adversely affecting any future revenues we might obtain from this product candidate.
Our revenues, operating results and cash flows may fluctuate in future periods and we may fail to meet investor expectations, which may cause the price of our common stock to decline.
Variations in our quarterly operating results and cash flows are difficult to predict and may fluctuate significantly from period to period. We are a relatively new company and our sales prospects are uncertain as we have only recently commenced our commercialization efforts. We currently only have three FDA-approved products: Vusion, Solagé and Xolegel. We cannot predict with certainty the timing or level of sales on these products in the future. In addition, our quarterly operating results and cash flows may fluctuate significantly depending on revenues and expenses related to our clinical development programs, including clinical trials and research and development, entry into new collaborative licensing arrangements, events or milestones under, or termination of, current collaborative licensing arrangements, and regulatory approval activities. If our quarterly or annual sales or operating results fall below expectations of investors or securities analysts, the price of our common stock could decline substantially.
If the estimates we make and the assumptions on which we rely in preparing our financial statements prove inaccurate, our actual results may vary significantly.
Our financial statements have been prepared in accordance with accounting principles generally accepted in the United States. The preparation of these financial statements requires us to make estimates and judgments that affect the reported amounts of our assets, liabilities, revenues and expenses, the amounts of charges taken by us and related disclosure. Such estimates and judgments include the carrying value of our inventory and intangible assets, the value of certain liabilities and revenue recognition, including prescription demand, rebates, coupon redemptions, and product returns, and forfeiture rates and other estimates related to stock based compensation. We base our estimates and judgments on historical experience and on various other assumptions that we believe to be reasonable under the circumstances. These estimates and judgments are difficult to make accurately due to our limited operating history. In addition, these estimates and judgments, or the assumptions underlying them, may change over time, which could make any guidance we may give inaccurate and could require us to restate some of our previously reported financial information. A restatement of previously reported financial information could cause our stock price to decline and could subject us to securities litigation.
Risks related to commercialization
If our products and product candidates for which we receive regulatory approval do not achieve broad market acceptance, the revenues that we generate from their sales will be limited.
The commercial success of our products and our product candidates for which we obtain marketing approval from the FDA or other regulatory authorities will depend upon the acceptance of these products by physicians, patients and healthcare payors. Safety, efficacy, convenience and cost-effectiveness, particularly as compared to competitive products, are the primary factors that affect market acceptance. Even if a product displays a favorable efficacy and safety profile in clinical trials, market acceptance of the product will not be known until
25
after it is launched. We have three FDA approved products: Vusion, Xolegel and Solagé. Our efforts to educate the medical community and third-party healthcare payors on the benefits of Vusion, Xolegel and Solagé, or any of our future products may require significant resources and may never be successful. Our most advanced product candidate, Hyphanox, contains the same active ingredient, itraconazole, as that contained in other branded and generic products currently on the market. Consequently, even if Hyphanox is approved by the FDA, we may not be able to achieve or maintain market acceptance of this product.
If our products fail to achieve and maintain market acceptance, including coverage by private and public health care insurers, or if new products or technologies are introduced by others that are more favorably received than our products, or if we are otherwise unable to market and sell our products successfully, our business, financial condition, results of operations and future growth will suffer.
If third-party payors do not reimburse patients for our products those products might not be used or purchased, and our revenues and profits will be adversely affected and may not grow.
Our revenues and profits depend, in part, upon the availability of coverage and reimbursement from third-party healthcare and state and federal government payors. Third-party payors include state and federal programs such as Medicare and Medicaid, managed care organizations, private insurance plans and health maintenance organizations. Reimbursement by a third-party payer may depend upon a number of factors, including determination if the product is:
| | • | | safe, effective and medically necessary; |
| | • | | appropriate for the specific patient; |
| | • | | approved for the intended use. |
Since reimbursement approval for a product is required from third-party and government payors, seeking this approval, particularly when seeking approval for a preferred form of reimbursement over other competitive products, is a time-consuming and costly process.
Managed care organizations and other third-party payors negotiate the pricing of medical services and products to control their costs. Managed care organizations and pharmacy benefit managers typically develop formularies to reduce their cost for medications. Formularies can be based on the prices and therapeutic benefits of the available products. Due to their lower costs, generics are often favored on formularies and the active ingredients in each of our marketed products are generically available, although not in the same formulations as our products. Consumers and third-party payors may not view our marketed products as cost-effective, and consumers may not be able to get reimbursement or reimbursement may be so low that we cannot market our products on a competitive basis. If a product is excluded or removed from a formulary, or if a formulary requires a physician to obtain authorization from the third party payor prior to writing a prescription, its usage may be sharply reduced in the managed care organization patient population. If our products, particularly our Vusion and Xolegel products, are not included within an adequate number of formularies or adequate reimbursement levels are not provided, or if those policies increasingly favor generic products, our market share and gross margins could be negatively affected, as could our overall business and financial condition.
Any regulatory approval we may receive for our product candidates may be subject to limitations on its indicated uses which could adversely affect our ability to market the product as anticipated.
Even if regulatory approval of one or more of our product candidates is granted, the approval may be subject to limitations on the indicated uses for which the product may be marketed or to the conditions of approval or contain requirements for costly post-marketing testing and surveillance to monitor the safety or efficacy of the
26
product. If this happens it could adversely affect our ability to market that product and potentially adversely affect our revenues for that product.
If we fail to comply with the laws governing the marketing and sale of our products, regulatory agencies may take action against us, which could significantly harm our business.
As a pharmaceutical company, we are subject to a large body of legal and regulatory requirements. In particular, there are many federal, state and local laws that we need to comply with now that we are engaged in the marketing, promoting, distribution and sale of pharmaceutical products. The FDA extensively regulates, among other things, promotions and advertising of prescription drugs. In addition, the marketing and sale of prescription drugs must comply with the Federal fraud and abuse laws, which are enforced by the Office of the Inspector General of the Division, or OIG, of the Department of Health and Human Services. These laws make it illegal for anyone to give or receive anything of value in exchange for a referral for a product or service that is paid for, in whole or in part, by any federal health program. The federal government can pursue fines and penalties under the Federal False Claims Act which makes it illegal to file, or induce or assist another person in filing, a fraudulent claim for payment to any governmental agency.
Because, as part of our commercialization efforts, we provide physicians with samples we must comply with the Prescription Drug Marketing Act, or PDMA, which governs the distribution of prescription drug samples to healthcare practitioners. Among other things, the PDMA prohibits the sale, purchase or trade of prescription drug samples. It also sets out record keeping and other requirements for distributing samples to licensed healthcare providers.
In addition, we must comply with the body of laws comprised of the Medicaid Rebate Program, the Veterans’ Health Care Act of 1992 and the Deficit Reduction Act of 2005. This body of law governs product pricing for government reimbursement and sets forth detailed formulas for how we must calculate and report the pricing of our products so as to ensure that the federally funded programs will get the best price.
Moreover, many states have enacted laws dealing with fraud and abuse, false claims, the distribution of prescription drug samples and gifts and the calculation of best price. These laws typically mirror the federal laws but in some cases, the state laws are more stringent than the federal laws and often differ from state to state, making compliance more difficult. We expect more states to enact similar laws, thus increasing the number and complexity of requirements with which we would need to comply.
Compliance with this body of laws is complicated, time consuming and expensive. We are a relatively small company that only recently began selling pharmaceutical products. As such, we have very limited experience in developing, managing and training our employees regarding, a comprehensive healthcare compliance program. We cannot assure you that we are or will be in compliance with all potentially applicable laws and regulations. Even minor, inadvertent irregularities can potentially give rise to claims that the law has been violated. Failure to comply with all potentially applicable laws and regulations could lead to penalties such as the imposition of significant fines, debarment from participating in drug development and marketing and the exclusion from government-funded healthcare programs. The imposition of one or more of these penalties could adversely affect our revenues and our ability to conduct our business as planned.
In addition, the Federal False Claims Act, which allows any person to bring suit alleging the false or fraudulent submission of claims for payment under federal programs and other violations of the statute and to share in any amounts paid by the entity to the government in fines or settlement. Such suits, known as qui tam actions, have increased significantly in recent years and have increased the risk that companies like us may have to defend a false claim action. We could also become subject to similar false claims litigation under state statutes. If we are unsuccessful in defending any such action, such action may have a material adverse effect on our business, financial condition and results of operations.
27
If we fail to comply with regulatory requirements governing the manufacture of our marketed products, regulatory agencies may take action against us, which could significantly harm our business.
The manufacturing facilities and processes for our marketed products are subject to continual requirements and periodic inspection by the FDA and other regulatory bodies, as well as with compliance with the current Good Manufacturing Practices, or cGMPs. The cGMP regulations include requirements relating to quality control and quality assurance, as well as the corresponding maintenance of records and documentation. We rely on the compliance by our contract manufacturers with cGMP regulations and other regulatory requirements relating to the manufacture of products. Other than through contract, we do not have control over compliance by our contract manufacturers with these regulations and standards. Our present or future contract manufacturers may not be able to comply with cGMPs and other FDA requirements or similar regulatory requirements outside the United States. Failure of our contract manufacturers or our employees to comply with applicable regulations or the discovery of previously unknown problems with our products or manufacturing processes may result in any of the following:
| | • | | restrictions on our products or manufacturing processes; |
| | • | | withdrawal of the products from the market; |
| | • | | voluntary or mandatory recall; |
| | • | | suspension or withdrawal of regulatory approvals; |
| | • | | refusal to permit the import or export of our products; |
| | • | | refusal to approve pending applications or supplements to approved applications that we submit; and |
We rely on third parties to perform many necessary commercial services for our products, including services related to the distribution, storage, and transportation of our products and a large portion of the physician detailing for Vusion.
We rely on the Specialty Pharmaceutical Services unit of Cardinal Health to perform a variety of functions related to the sale and distribution of our products in the United States. These services include distribution, logistics management, inventory storage and transportation, invoicing and collections. We also rely on Novartis Consumer Health, Inc. to co-promote our Vusion product directly to pediatricians. If these third party service providers fail to comply with applicable laws and regulations, fail to meet expected deadlines or otherwise do not carry out their contractual duties, our ability to deliver products to meet commercial demand would be significantly impaired.
We depend on three wholesalers for the vast majority of our product revenues in the United States, and the loss of any of these wholesalers would decrease our revenues.
The prescription drug wholesaling industry in the United States is highly concentrated, with a vast majority of all sales made by three major full-line companies. Those companies are Cardinal Health, McKesson Corporation and AmerisourceBergen. Approximately 85% of our product revenues in the twelve months ended December 31, 2007 were through these three companies. Although we have entered into agreements with each of these companies concerning the terms of their purchase of products from us, none of them is under an obligation to purchase minimum quantities or to continue to purchase our products. The loss of any of these wholesalers, a material reduction in their purchases, the cancellation of product orders or unexpected returns of unsold products, or the failure to pay an outstanding invoice, from any one of these wholesalers could decrease our revenues and impede our future growth prospects.
28
It is also possible that these wholesalers, or others, could decide to change their policies or fees, or both in the future. This could result in their refusal to distribute smaller volume products, such as ours, or cause us to incur higher product distribution costs, lower margins or the need to find alternative methods of distributing our products. Such alternative methods may not exist or may not be economically feasible.
We may acquire additional products, product candidates, technology and businesses in the future and any difficulties from integrating such acquisitions could damage our ability to attain profitability.
We have acquired our entire current product pipeline by licensing intellectual property from third parties, and we may acquire additional products or product candidates or technologies that complement or augment our existing product development pipeline. However, because we acquired substantially all of our existing product candidates in the same transaction, we have limited experience integrating products or product candidates into our existing operations. Integrating any newly acquired product or product candidate could be expensive and time-consuming. We may not be able to integrate any acquired product or product candidate successfully. Moreover, we may need to raise additional funds through public or private debt or equity financing to make these acquisitions, which may result in dilution for stockholders and the incurrence of indebtedness.
We plan to consider, as appropriate, acquisitions of businesses, which may subject us to a number of risks that may affect our stock price, operating results and financial condition. If we were to acquire a business in the future, we would need to consolidate and integrate its operations with our business. Integration efforts often take a significant amount of time, place a significant strain on our managerial, operational and financial resources, and could prove to be more difficult and expensive than we predicted. If we fail to realize the expected benefits from acquisitions we may consummate in the future, our business, results of operations and financial condition could be adversely affected.
If our post-marketing studies or other data generated for one or more of our marketed products produce undesirable results, the FDA may require us to withdraw such products, make changes to the applicable product’s label or otherwise decrease demand, either of which could adversely affect our ability to market that product.
In connection with its approval of our Xolegel and Vusion products, the FDA has required us to conduct additional post marketing studies. For Xolegel, we must perform a pre-clinical dermal carcinogenicity study in mice to determine the carcinogenic potential of repeated treatment courses of Xolegel over a prolonged period of time. For Vusion, we must conduct two Phase 4 clinical studies: a percutaneous absorption study to determine the amount, if any, of miconazole nitrate which is absorbed into the bloodstream through the skin and its potential effect on liver function; and a microbial resistance study to evaluate the extent, if any, to which theCandida yeast may develop resistance to repeated treatment courses with Vusion. If any of these studies, or any Phase 4 clinical study that we conduct, produces undesirable results, the FDA could require us to make changes to the approved label for Xolegel or Vusion, as applicable, which would adversely affect our ability to market that product and potentially adversely affect our revenues for that product.
Risks related to development of product candidates
We will not be able to commercialize our product candidates if our preclinical studies do not produce successful results or if our clinical trials do not demonstrate safety and efficacy in humans.
We must conduct extensive preclinical studies and clinical trials to demonstrate the safety and efficacy in humans of our product candidates in order to obtain regulatory approval for the sale of our product candidates. Preclinical studies and clinical trials are expensive, can take many years and have uncertain outcomes.
Our success will depend on the success of our currently ongoing clinical trials and subsequent clinical trials that have not yet begun. It takes several years to complete the clinical trials of a product, and a failure of one or more of our clinical trials can occur at any stage of testing. We believe that the development of each of our
29
product candidates involves significant risks at each stage of testing. If clinical trial difficulties and failures arise, our product candidates may never be approved for sale or become commercially viable. We do not believe that any of our product candidates have alternative uses if we are not successful developing them as pharmaceutical products.
There are a number of difficulties and risks associated with clinical trials. These difficulties and risks may result in the failure to receive regulatory approval to continue to test or to sell our product candidates or the inability to commercialize any of our product candidates. For instance, we may discover that a product candidate does not exhibit the expected therapeutic results in humans, may cause harmful side effects or have other unexpected characteristics that may delay or preclude regulatory approval or limit commercial use if approved. The risk of clinical trial failure is even greater where the product candidate contains a new chemical entity, such as Pramiconazole, Rambazole and Hivenyl, and where the product candidate uses a novel or not fully known mechanism of action, such as Rambazole. Likewise, the risk of discovering harmful side effects is greater where the product candidate contains a new chemical entity.
In addition, the possibility exists that:
| | • | | the results from early clinical trials may not be statistically significant or predictive of results that will be obtained from expanded, advanced clinical trials; |
| | • | | institutional review boards or regulators, including the FDA, may hold, suspend or terminate our clinical research or the clinical trials of our product candidates for various reasons, including noncompliance with regulatory requirements or if, in their opinion, the participating subjects are being exposed to unacceptable health risks; |
| | • | | subjects may drop out of our clinical trials; |
| | • | | our preclinical studies or clinical trials may produce negative, inconsistent or inconclusive results, and we may decide, or regulators may require us, to conduct additional preclinical studies or clinical trials; and |
| | • | | the cost of our clinical trials may be greater than we currently anticipate. |
For example, the FDA has placed our oral Rambazole product candidate on clinical hold. If we do not receive regulatory approval to sell our product candidates or cannot successfully commercialize our product candidates, we would not be able to grow revenues in future periods, which would result in significant harm to our financial position and adversely impact our stock price.
If our clinical trials for our product candidates are delayed, we would be unable to commercialize our product candidates on a timely basis, which would materially harm our business.
Planned clinical trials may not begin on time, may take longer to complete than anticipated, or may need to be restructured after they have begun. Clinical trials can be delayed for a variety of reasons, including delays related to:
| | • | | obtaining an effective investigational new drug application, or IND, or regulatory approval to commence a clinical trial; |
| | • | | identifying and engaging a sufficient number of clinical trial sites; |
| | • | | negotiating acceptable clinical trial agreement terms with prospective trial sites; |
| | • | | obtaining institutional review board approval to conduct a clinical trial at a prospective site; |
| | • | | recruiting qualified subjects to participate in clinical trials in a timely manner; |
| | • | | competition in recruiting clinical investigators; |
| | • | | shortage or lack of availability of supplies of drugs for clinical trials; |
30
| | • | | the need to repeat clinical trials as a result of inconclusive results or poorly executed testing; |
| | • | | the placement of a clinical hold on a study; |
| | • | | the failure of third parties conducting and overseeing the operations of our clinical trials to perform their contractual or regulatory obligations in a timely fashion; and |
| | • | | exposure of clinical trial subjects to unexpected and unacceptable health risks or noncompliance with regulatory requirements, which may result in suspension of the trial. |
All of our product candidates have significant milestones to reach, including the successful completion of clinical trials, before commercialization. If we experience significant delays in or termination of clinical trials, our financial results and the commercial prospects for our product candidates or any other products that we may develop will be adversely impacted. In addition, our product development costs would increase and our ability to generate revenue could be impaired.
We may need or elect to alter the formulations of our product candidates which would increase the time and expense of development and could require us to repeat pre-clinical or clinical studies.
The current formulations of our product candidates, other than Hyphanox, may not be the final formulations for which we would seek regulatory approval. This risk is particularly applicable to our Pramiconazole, Hivenyl and Rambazole product candidates. Each of these product candidates is in a relatively early stage of development and we have not yet selected the final formulation for any of them. Altering the formulation of a product candidate would increase the cost and potentially the time of development due to the additional formulation development work and manufacturing work, as well as the potential need for additional pre-clinical and clinical trials. In addition, altering the formulation could affect the pharmaceutical properties of the product candidate thereby potentially decreasing the usefulness or reliability of any pre-clinical or clinical results utilizing our current formulation.
Risks related to regulatory approval of our product candidates
We may not receive regulatory approvals for our product candidates or approvals may be delayed, either of which could materially harm our business.
Government authorities in the United States and foreign countries extensively regulate the development, testing, manufacture, distribution, marketing and sale of our product candidates and our ongoing research and development activities. Our failure to receive regulatory approval or failure to receive regulatory approval within the anticipated timeframe for our product candidates could significantly adversely affect future revenues.
The process of obtaining regulatory approvals is expensive, often takes many years, if approval is obtained at all, and can vary substantially based upon the type, complexity and novelty of the product candidates involved. Application fees for the approval of prescription drugs continues to increase. According to the FDA, a Phase 1 clinical trial typically takes several months to complete, a Phase 2 clinical trial typically takes several months to two years to complete and a Phase 3 clinical trial typically takes one to four years to complete. Moreover, Phase 3 clinical trials may not directly follow successful completion of Phase 2 clinical trials, as additional non-clinical and clinical trials may be required prior to initiating a Phase 3 trial. For instance, the FDA may require a cardiovascular safety study at the expected dose and an elevated dose prior to initiating Phase 3 clinical trials. In addition, additional trials may be needed following successful completion of a Phase 3 clinical trial prior to seeking marketing approval. For instance, depending upon the outcome of our ongoing Phase 3 trial for Hyphanox, and any directions or feedback we may receive from regulatory agencies, we may need to perform additional non-clinical or clinical studies prior to seeking marketing approval for Hyphanox.
Industry sources report that the preparation and submission of new drug applications, or NDAs, which are required for regulatory approval, generally take six months to one year to complete after completion of a pivotal clinical trial. Industry sources also report that approximately 10 to 15% of all NDAs accepted for filing by the
31
FDA are rejected and that FDA approval, if granted, usually takes approximately one year after submission, although it may take longer if additional information is required by the FDA. Accordingly, we cannot assure you that the FDA will approve any NDA that we may file. In addition, the Pharmaceutical Research and Manufacturers of America reports that only one out of five product candidates that enter clinical trials will ultimately be approved by the FDA for commercial sale.
In particular, human therapeutic products are subject to rigorous preclinical studies, clinical trials and other approval procedures of the FDA and similar regulatory authorities in foreign countries. The FDA regulates, among other things, the development, testing, manufacture, safety, efficacy, record keeping, labeling, storage, approval, advertising, promotion, sale and distribution of pharmaceutical products. Securing FDA approval requires the submission of extensive preclinical and clinical data, information about product manufacturing processes and inspection of facilities and supporting information to the FDA for each therapeutic indication to establish the product candidate’s safety and efficacy. Varying interpretations of the data obtained from preclinical and clinical testing could delay, limit or prevent regulatory approval of a product candidate. For example in May 2005, the FDA issued a not approvable letter for Vusion. Although the FDA ultimately approved our Vusion product in February 2006, the FDA’s initial interpretation of our data and resulting not approvable letter resulted in a delay of approximately nine months.
Changes in the FDA approval process during the development period or changes in regulatory review for each submitted product application may also cause delays in the approval or result in rejection of an application. In addition, recent withdrawals of approved products by major pharmaceutical companies have resulted in a renewed focus on safety at the FDA, which may result in delays in the approval process.
The FDA has substantial discretion in the approval process and may reject our data or disagree with our interpretations of regulations or our clinical trial data or ask for additional information at any time during their review, which could result in one or more of the following:
| | • | | delays in our ability to submit an NDA; |
| | • | | the refusal by the FDA to file any NDA we may submit; |
| | • | | requests for additional studies or data; |
| | • | | delays of an approval; or |
| | • | | the rejection of an application. |
Any FDA or other regulatory approval of our product candidates, once obtained, may be withdrawn, including for failure to comply with regulatory requirements, an increase in, or appearance of new, adverse events, or if clinical or manufacturing problems follow initial marketing.
In addition, any proposed brand name that we intend to use for our product candidates will require approval from the FDA. The FDA typically conducts a rigorous review of proposed product names, including an evaluation of potential for confusion with other product names. The FDA may also object to a product name if it believes the name inappropriately implies medical claims.
Any failure to receive the regulatory approvals necessary to commercialize our product candidates would severely harm our business. The process of obtaining these approvals and the subsequent compliance with appropriate domestic and foreign statutes and regulations require spending substantial time and financial resources. If we fail to obtain or maintain, or encounter delays in obtaining or maintaining, regulatory approvals, it could adversely affect the marketing of any product candidate we develop, our ability to receive product or royalty revenues, and our liquidity and capital resources.
32
Some of our product candidates are based on new chemical entities that have not been extensively tested in humans, which may affect our ability or the time we require to obtain necessary regulatory approvals.
Some of our product candidates are based on new chemical entities that have not been extensively tested in humans. The regulatory requirements governing these types of products may be less well defined or more rigorous than for products containing active ingredients that have been previously approved by the FDA. As a result, we may experience a longer and more expensive regulatory process in connection with obtaining regulatory approvals of these types of product candidates.
This risk is particularly applicable to our oral and topical Rambazole product candidates, which are based on a novel class of molecules known as retinoic acid metabolism blocking agents, or RAMBAs. Since 2004, the FDA has become increasingly concerned about the safety profile of a class of drugs known as synthetic retinoids. Although Rambazole is not a synthetic retinoid, it blocks the intracellular metabolism of natural retinoic acid in cells, resulting in an increased presence of the body’s own retinoic acid. Because this is designed to provide similar therapeutic benefits of synthetic retinoid therapy, the FDA and foreign regulatory authorities may impose a more difficult, time consuming and expensive regulatory path in order to commence and complete the clinical testing of these product candidates as compared to others in our pipeline at the same stage of development. The FDA has placed our oral Rambazole product candidate on clinical hold. Because the active ingredient of our topical Rambazole product candidate is the same as oral Rambazole, we may experience a longer and more expensive regulatory process for this product candidate, as well.
Risks related to our dependence on third parties for manufacturing, research and development and marketing and distribution activities
Because we have no manufacturing capabilities, we contract with third-party contract manufacturers whose performance may be substandard or not in compliance with regulatory requirements, which could increase the risk that we will not have adequate supplies of our product candidates and harm our ability to commercialize our product candidates.
We do not have any manufacturing facilities and we have limited manufacturing experience. We rely on third-party contract manufacturers to produce the products that we commercialize and use in our clinical trials. If we are unable to retain our current, or engage additional, contract manufacturers, we will not be able to conduct our clinical trials or sell any products for which we receive regulatory approval. The risks associated with our reliance on contract manufacturers include the following:
| | • | | Contract manufacturers may encounter difficulties in achieving volume production, quality control and quality assurance and also may experience shortages in qualified personnel. As a result, our contract manufacturers might not be able to meet our clinical development schedules or adequately manufacture our products in commercial quantities when required. |
| | • | | Changing manufacturers may be difficult because the number of potential manufacturers for some of our product candidates may be limited and, in one case, there is only a single source of supply. Specifically, the intermediate for our product candidate Hyphanox is manufactured using a process that is proprietary to our contract manufacturer. We do not have a license to the technology used by our contract manufacturer to make the intermediate needed for the Hyphanox tablets. If this manufacturer cannot provide adequate supplies of the intermediate for Hyphanox, we cannot sublicense this technology to a third party to act as our supplier. As a result, it may be difficult or impossible for us to find a qualified replacement manufacturer quickly or on terms acceptable to us, the FDA and corresponding foreign regulatory agencies, or at all. |
| | • | | Each of our marketed products could be produced by multiple manufacturers. However, if we need to change manufacturers, the FDA and corresponding foreign regulatory agencies must approve these manufacturers in advance. This would involve testing and pre-approval inspections to ensure compliance with FDA and foreign regulations and standards, which could potentially cause delays and would increase our cost of goods. |
33
| | • | | Our contract manufacturers may breach our manufacturing agreements because of factors beyond our control or may terminate or fail to renew a manufacturing agreement based on their own business priorities at a time that is costly or inconvenient for us. |
We may compete with other drug developers for access to manufacturing facilities for our products and product candidates. If we are not able to obtain adequate supplies of our products we may not be able to distribute our products as planned which could adversely affect our revenues. If we are not able to obtain adequate supplies of our product candidates, it will be more difficult for us to develop our product candidates. Dependence upon third parties for the manufacture of our product candidates may reduce our profit margins, if any, and may limit our ability to develop and deliver products on a timely and competitive basis.
We rely on a single source supplier for the manufacture of each of our marketed products and the active ingredients contained in those products and the loss of these suppliers could disrupt our business.
Although each of our marketed products and the active ingredients in those products can be produced by multiple manufacturers, we predominately rely on a single source of supply for those products and active ingredients. If any of these manufacturers, or any manufacturer of any other ingredient or component contained in our marketed products or their packaging, were to become unable or unwilling to continue to provide us with these products or ingredients, we may need to obtain an alternate supplier. The process of changing or adding a manufacturer includes qualification activities and may require approval from the FDA and corresponding foreign regulatory agencies, and can be time consuming and expensive. If we are not able to manage this process efficiently or if an unforeseen event occurs, we could face supply disruptions that would result in significant costs and delays, undermine goodwill established with physicians and patients, damage the commercial prospects for our products and adversely affect our operating results.
If third parties on whom we rely do not perform as contractually required or expected, we may not be able to obtain regulatory approval for or commercialize our products and product candidates.
We depend on independent clinical investigators and contract research organizations to conduct our clinical trials. Contract research organizations also assist us in the collection and analysis of trial data. The investigators, contract research organizations, and other contractors are not our employees, and we cannot control, other than by contract, the amount of resources, including time, that they devote to our product candidates. However, we are responsible for ensuring that each of our clinical trials is conducted in accordance with the general investigational plan and protocols for the trial that have been approved by regulatory agencies and for ensuring that we report product-related adverse events in accordance with applicable regulations. Furthermore, the FDA and European regulatory authorities require us to comply with standards, commonly referred to as good clinical practice, for conducting, recording and reporting clinical trials to assure that data and reported results are credible and accurate and that the rights, integrity and confidentiality of trial participants are protected.
In connection with our reliance on our independent clinical investigators and contract research organizations, our clinical trials may be extended, delayed, suspended, terminated, or deemed unacceptable including as a result of:
| | • | | the failure of these investigators and research organizations to comply with good clinical practice or to meet their contractual duties; |
| | • | | the failure of our independent investigators to devote sufficient resources to the development of our product candidates or to perform their responsibilities at a sufficiently high level; |
| | • | | our need to replace these third parties for any reason, including for performance reasons or if these third parties go out of business; or |
| | • | | the existence of problems in the quality or accuracy of the data they obtain due to the failure to adhere to clinical protocols or regulatory requirements or for other reasons. |
34
Extensions, delays, suspensions or terminations of our clinical trials as a result of the performance of our independent clinical investigators and contract research organizations will delay, and make more costly, regulatory approval for any product candidates that we may develop.
In addition, although we have used a number of contract research organizations to conduct our clinical trials, there are many other qualified contract research organizations available. Any change in a contract research organization during an ongoing clinical trial could seriously delay that trial and potentially compromise the results of the trial.
We are dependent upon distribution arrangements and marketing alliances to commercialize our product candidates outside the United States. These distribution arrangements and marketing alliances place the marketing and sale of our product candidates in these regions outside our control.
We have entered into distribution arrangements and marketing alliances relating to the commercialization of some of our product candidates. Dependence on these arrangements and alliances subjects us to a number of risks, including:
| | • | | we may not be able to control the amount and timing of resources that our distributors may devote to the commercialization of our product candidates; |
| | • | | our distributors may experience financial difficulties; |
| | • | | our distributors may determine not to launch our product candidates in countries where the distributor determines that commercialization of a particular product candidate is not feasible or is economically unreasonable due to government pricing controls or other market conditions existing in a particular country; |
| | • | | business combinations or significant changes in a distributor’s business strategy may also adversely affect a distributor’s willingness or ability to complete its obligations under any arrangement; and |
| | • | | these arrangements are often terminated or allowed to expire, which could interrupt the marketing and sales of a product and decrease our revenue. |
We may not be successful in entering into additional distribution arrangements and marketing alliances with third parties for our earlier stage product candidates. Our failure to enter into these arrangements on favorable terms could delay or impair our ability to commercialize our product candidates outside the United States and could increase our costs of commercialization. In addition, we may be at a competitive disadvantage in negotiating these agreements with third parties because under our license agreements, Johnson & Johnson, through any of its affiliates, has a right of first negotiation for the commercialization of our product candidates that are based on the licensed intellectual property. Because this first right of negotiation may only be triggered after Phase 2b clinical trials and could extend for up to 180 days, it may hinder our ability to enter into distribution agreements and marketing alliances. It may also delay our receipt of any milestone payments or reimbursement of development costs.
Risks related to intellectual property
There are limitations on our patent rights relating to our products and product candidates that may affect our ability to exclude third parties from competing against us.
The patent rights that we own or have licensed relating to our products and product candidates are limited in ways that may affect our ability to exclude third parties from competing against us. In particular:
| | • | | We do not hold composition of matter patents covering the active pharmaceutical ingredients of Xolegel, Vusion, Solagé, or our Hyphanox product candidate. Composition of matter patents on active pharmaceutical ingredients are the strongest form of intellectual property protection for pharmaceutical products as they apply without regard to any method of use or other type of limitation. The active |
35
| | ingredients for Solagé, Vusion, Xolegel and Hyphanox are off patent. As a result, competitors who obtain the requisite regulatory approval can offer products with the same active ingredients as our products so long as the competitors do not infringe any method of use or formulation patents that we may hold. |
| | • | | The composition of matter patent covering the formulation of our Vusion product is scheduled to expire on March 27, 2008, meaning that competitors who obtain the requisite regulatory approval can offer a product with the same formulation following the expiration of our Hatch Waxman marketing exclusivity in February 2009. Although we have submitted an application for patent term extension until March 2012, it is possible that the USPTO could reject that application or grant an extension for a shorter period of time. |
| | • | | Our patent licenses from Janssen Pharmaceutica Products, L.P., Johnson & Johnson Consumer Companies, Inc. and Ortho-McNeil Pharmaceutical, Inc. are limited to the field of dermatology. As a result, if we were to discover that one or more of our product candidates had potential to be effective in indications outside the field of dermatology, we would not be able to capitalize on that potential without first obtaining a license to do so. We may not be able to obtain such a license on attractive terms or at all. |
These limitations on our patent rights may result in competitors taking product sales away from us, which would reduce our revenues and harm our business.
If we are unable to obtain and maintain patent protection for our intellectual property, our competitors could develop and market products similar or identical to ours, which may reduce demand for our product candidates.
Our success will depend in part on our ability to obtain and maintain patent protection for our proprietary technologies and product candidates and our ability to prevent third parties from infringing our proprietary rights. The patent situation in the field of biotechnology and pharmaceuticals generally, and dermatology products specifically, is highly uncertain and involves complex legal and scientific questions. We may not be able to obtain additional issued patents relating to our technology or products. Even if issued, patents may be challenged, narrowed, invalidated, or circumvented, which could limit our ability to stop competitors from marketing similar products or limit the length of term of patent protection we may have for our products. Changes in either patent laws or in interpretations of patent laws in the United States and other countries may diminish the value of our intellectual property or narrow the scope of our patent protection. We also may not have the resources to aggressively protect and enforce existing patent protection, and our competitors may infringe our patents or successfully avoid them through design innovation. To prevent infringement or unauthorized use, we may need to file infringement lawsuits, which are expensive and time-consuming.
Because of the substantial length of time and expense associated with bringing new products through the development and regulatory approval processes in order to reach the marketplace, the pharmaceutical industry places considerable importance on patent protection for new technologies, products and processes. Accordingly, we expect to seek patent protection for our new proprietary technologies and some of our product candidates. The risk exists, however, that new patents may be unobtainable and that the breadth of the claims in a patent, if obtained, may not provide adequate protection for our proprietary technologies or product candidates.
Although we own or otherwise have rights to a number of patents, these patents may not effectively exclude competitors. The issuance of a patent is not conclusive as to its validity or enforceability and third parties may challenge the validity or enforceability of our patents. Because patent applications in the United States and many foreign jurisdictions are typically not published until 18 months after filing, or in some cases not at all, and because publications of discoveries in the scientific literature often lag behind actual discoveries, we cannot be certain that we were the first to make the inventions claimed in our issued United States patents or pending patent applications, or that we were the first to file for protection of the inventions set forth in the foreign patents or
36
patent applications. It is possible that a competitor may successfully challenge our patents or that challenges will result in the elimination or narrowing of patent claims and, therefore, reduce our patent protection.
We may need to initiate lawsuits to protect or enforce our patents and other intellectual property rights, which could result in the forfeiture of these rights.
Any issued patents that cover our proprietary technologies may not provide us with substantial protection or be commercially beneficial to us. The issuance of a patent may be challenged with respect to its validity or its enforceability. In particular, if a competitor were to file a paragraph IV certification under the United States Drug Price Competition and Patent Term Restoration Act of 1984, known as the Hatch-Waxman Act, in connection with that competitor’s submission to the FDA of an abbreviated new drug application, or ANDA, for approval of a generic version of any of our products for which we believed we held a valid patent, then we would have 45 days in which to initiate a patent infringement lawsuit against such competitor. In any infringement proceeding, a court may decide that a patent of ours is not valid or is unenforceable, may narrow our patent claims or may refuse to stop the other party from using the technology at issue on the grounds that our patents do not cover its technology. If a court so found that one of our patents was invalid or not infringed in an infringement suit under paragraph IV of the Hatch-Waxman Act, then the FDA would be permitted to approve the competitor’s ANDA resulting in a competitive generic product.
If we are unable to protect the confidentiality of our proprietary information and know-how, the value of our technology may be adversely affected.
In addition to patent protection, we rely upon trade secrets relating to unpatented know-how and technological innovations to develop and maintain our competitive position, which we seek to protect, in part, by confidentiality agreements with our employees, consultants and other third parties. We also have confidentiality and invention or patent assignment agreements with our employees and our consultants. If our employees, consultants or other third parties breach these agreements, we may not have adequate remedies for any of these breaches. In addition, our trade secrets may otherwise become known to or be independently developed by our competitors.
If the development of our product candidates infringes the intellectual property of our competitors or other third parties, we may be required to pay license fees or cease our development activities and pay damages, which could significantly harm our business.
Even if we have our own patents which protect our products and our product candidates they may nonetheless infringe the patents or violate the proprietary rights of third parties. In these cases, we may be required to obtain licenses to patents or proprietary rights of others in order to continue to develop and commercialize our product candidates. We may not, however, be able to obtain any licenses required under any patents or proprietary rights of third parties on acceptable terms, or at all. Even if we were able to obtain rights to a third party’s intellectual property, these rights may be non-exclusive, thereby giving our competitors potential access to the same intellectual property.
Third parties may assert patent or other intellectual property infringement claims against us, or our collaborators, with respect to technologies used in potential product candidates. Any claims that might be brought against us relating to infringement of patents may cause us to incur significant expenses and, if successfully asserted against us, may cause us to pay substantial damages. Even if we were to prevail, any litigation could be costly and time-consuming and could divert the attention of our management and key personnel from our business operations. In addition, any patent claims brought against our collaborators could affect their ability to carry out their obligations to us.
Furthermore, as a result of a patent infringement suit brought against us, or our collaborators, the development, manufacture or potential sale of product candidates claimed to infringe a third party’s intellectual
37
property may have to be stopped or be delayed. Ultimately, we may be unable to commercialize some of our product candidates or may have to cease some of our business operations as a result of patent infringement claims, which could severely harm our business.
If we fail to comply with our obligations in the agreements under which we license development or commercialization rights to products or technology from third parties, we could lose license rights that are important to our business.
All of our current product candidates in clinical development are based on intellectual property that we have licensed from Janssen Pharmaceutica Products, L.P., Johnson & Johnson Consumer Companies, Inc. and Ortho-McNeil Pharmaceutical, Inc. We depend, and will continue to depend, on these license agreements. The terms of these licenses are set out in two license agreements. These license agreements may be terminated on a product-by- product basis, if, by dates specified in the license agreements, we are not conducting active clinical development of the particular product or if we do not obtain regulatory approval for that product. Either of the license agreements may also be terminated if we breach that license agreement and do not cure the breach within 90 days or in the event of our bankruptcy or liquidation.
Disputes may arise with respect to our licensing agreements regarding manufacturing, development and commercialization of any products relating to this intellectual property. These disputes could lead to delays in or termination of the development, manufacture and commercialization of our product candidates or to litigation.
Various aspects of our Johnson & Johnson license agreements may adversely affect our business.
Under our principal license agreements, neither Johnson & Johnson nor any of its affiliates is restricted from developing or acquiring products that may address similar indications as our products or otherwise compete with our products. We have the sole right to commercialize any product candidate based on intellectual property licensed to us under these agreements that we elect to commercialize ourselves or with the assistance of a contract sales organization. In other circumstances, however, Johnson & Johnson and any of its affiliates has a right of first negotiation for the commercialization of our product candidates based on such intellectual property. The rights of first negotiation for the commercialization of our product candidates can be exercised on a territory-by-territory basis. This negotiation may extend for up to 180 days, which may delay our commercialization efforts or hinder our ability to enter into development, commercialization and distribution agreements.
The license agreements also permit each of Janssen Pharmaceutica Products, L.P., Johnson & Johnson Consumer Companies, Inc. and Ortho-McNeil Pharmaceutical, Inc., to abandon its maintenance of any patents or the prosecution of any patent applications included in the licensed intellectual property for any reason. If any of these companies abandon these activities, we have the option to undertake their maintenance and prosecution if we decide to prevent their abandonment. To date, we have assumed the maintenance and prosecution for all of the patents and patent applications relating to our Xolegel and Vusion product candidates. If we are required to undertake these activities for any additional product candidates, our operating costs will increase.
In addition, our license agreements limit our use of our product candidates to the specific field of dermatology as defined in the license agreements. As so defined, dermatology consists of applications for the treatment or prevention of diseases of human skin, hair, nails and oral and genital mucosa, but excludes treatments for skin cancer. This field of use restriction may limit our ability to market our products for indications outside of dermatology and, therefore, limit the potential market size for our products.
38
Risk related to our industry
Federal legislation will likely increase the pressure to reduce the price of pharmaceutical products paid for by Medicare, which will adversely affect our revenues.
The Medicare Prescription Drug Improvement and Modernization Act of 2003 reformed the way Medicare covers and reimburses for pharmaceutical products. The law expands Medicare coverage for drug purchases by the elderly and introduced a new reimbursement methodology based on average sales prices for drugs. In addition, the law provides authority for limiting the number of drugs that will be covered in any therapeutic class. As a result of the expansion of federal coverage of drug products, we expect that there will be additional pressure to contain and reduce costs. These cost initiatives and other provisions of this law could decrease the coverage and price that we receive for our products and could seriously harm our business.
If we are not able to retain our current senior management team or attract and retain qualified scientific, technical and business personnel, our business will suffer.
We are dependent on the members of our senior management team for our business success. In addition, an important element of our strategy is to leverage the development, regulatory and commercialization expertise of our current management in our development activities. The loss of key employees may result in a significant loss in the knowledge and experience that we, as an organization, possess and could cause significant delays, or outright failure, in the further commercialization of our products and development of product candidates. If we are unable to attract and retain qualified and talented senior management personnel, our business may suffer.
In addition, competition for qualified scientific, technical, and business personnel is intense in the pharmaceutical industry. If we are unable to hire and retain qualified personnel, our business will suffer.
Our operations may be impaired unless we can successfully manage our growth.
As of December 31, 2007, we had 130 full-time employees, including approximately 60 sales representatives. We recently converted our sales force to be entirely Barrier employees. This type of expansion may place a significant strain on our management and operational resources. To manage this and any further growth, we will be required to continue to improve existing, and implement additional systems, procedures and controls, and hire, train and manage these additional employees. Our current and planned personnel, systems, procedures and controls may not be adequate to support our anticipated growth and we may not be able to hire, train, retain, motivate and manage required personnel. Our failure to manage growth effectively could limit our ability to achieve our business goals. In addition, our sales force consists of relatively newly hired employees. Turnover in our sales force or marketing team could adversely affect product sales growth.
We face potential product liability exposure, and, if successful claims are brought against us, we may incur substantial liability for a product and may have to limit its commercialization.
The use of our product candidates in clinical trials and the sale of products may expose us to the risk of product liability claims. This risk is even greater for our product candidates that are administered orally such as Hyphanox, Pramiconazole, Rambazole and Hivenyl or which contain a new chemical entity such as Pramiconazole, Rambazole and Hivenyl. Product liability claims might be brought against us by consumers, health care providers, pharmaceutical companies or others selling our products. If we cannot successfully defend ourselves against these claims, we may incur substantial losses or expenses, be required to limit the commercialization of our product candidates and face adverse publicity. We have product liability insurance coverage with a $10 million annual aggregate coverage limit, and our insurance coverage may not reimburse us or may not be sufficient to reimburse us for any expenses or losses we may suffer. Moreover, insurance coverage is becoming increasingly expensive, and, in the future, we may not be able to maintain insurance coverage at a reasonable cost or in sufficient amounts to protect us against losses due to liability. On occasion, large judgments have been awarded in class action lawsuits based on drugs that had unanticipated side effects. A successful
39
product liability claim or series of claims brought against us could cause our stock price to fall and, if judgments exceed our insurance coverage, could decrease our cash.
If our competitors develop and market products faster than we do or if the products of our competitors are considered more desirable than ours, revenues for any of our products and product candidates that are approved for marketing will not develop or grow.
The pharmaceutical industry, and the dermatology segment in particular, is highly competitive and includes a number of established, large and mid-sized pharmaceutical companies, as well as smaller emerging companies, whose activities are directly focused on our target markets and areas of expertise. We face and will continue to face competition in the discovery, in-licensing, development and commercialization of our product candidates, which could severely impact our ability to generate revenue or achieve significant market acceptance of our product candidates. Furthermore, new developments, including the development of other drug technologies and methods of preventing the incidence of disease, occur in the pharmaceutical industry at a rapid pace. These developments may render our product candidates or technologies obsolete or noncompetitive.
Compared to us, many of our competitors and potential competitors have substantially greater:
| | • | | research and development resources, including personnel and technology; |
| | • | | preclinical study and clinical trial experience; and |
| | • | | manufacturing, distribution and sales and marketing experience. |
As a result of these factors, our competitors may obtain regulatory approval of their products more rapidly than us. Our competitors may obtain patent protection or other intellectual property rights that limit our ability to develop or commercialize our product candidates or technologies. Our competitors may also develop drugs that are more effective, useful and less costly than ours and may also be more successful than us in manufacturing and marketing their products.
Each of our marketed products competes, and if approved each of our product candidates will compete, for a share of the existing market with numerous products that have become standard treatments recommended or prescribed by physicians. For example, we believe the primary competition for our marketed products are:
| | • | | For Xolegel, in the treatment of seborrheic dermatitis, Nizoral from Janssen, Desowen from Galderma S.A., Loprox from Medicis Pharmaceutical Corporation and the generic equivalents of each, Tersi Foam from Quinnova Pharmaceuticals and Extina Foam from Stiefel Laboratories, Inc. |
| | • | | For Vusion in the treatment of diaper dermatitis complicated by candidiasis, from ointments and creams containing nystatin, Mycolog II from Bristol-Myers Squibb Company, clotrimazole containing creams from Bayer AG and from generic manufacturers and topical miconazole creams. None of these products are indicated for the treatment of diaper dermatitis complicated by documented candidiasis. |
| | • | | For Solagé in the treatment of solar lentigines from Triluma from Galderma S.A., Avage from Allergan, Inc., EpiQuin Micro from SkinMedica, Inc. and other prescription 4% hydroquinone formulations as well as over-the-counter 2% hydroquinone products, Retin-A from Neutrogena and other tretinoin containing topical formulations. |
We believe the primary competition for our later stage product candidates in development are:
| | • | | For Hyphanox and Pramiconazole, in the treatment of onychomycosis, Sporanox from Janssen and generic manufacturers, Lamisil from Novartis AG and generic manufacturers, and Penlac from Dermik Laboratories and generic suppliers. |
40
| | • | | For Pramiconazole, in the treatment of superficial fungal infections, topical antifungals including Loprox from Medicis, Lotrimin AF from Schering-Plough and generic manufacturers, Lotrimin Ultra from Schering Plough, Lamisil AT from Novartis, and ketoconazole, miconazole and nystatin from generic manufacturers. |
| | • | | For oral Rambazole, in the treatment of psoriasis, Soriatane from Hoffman-La Roche and Stiefel Laboratories, biologic agents such as Amevive from Astellas Pharma US, Inc., Raptiva from Genentech, Inc., and methotrexate from generic manufacturers. |
Risks related to our common stock
Our stock price is volatile, and the market price of our common stock may drop below the price you pay.
Market prices for securities of biopharmaceutical and specialty pharmaceutical companies have been particularly volatile. Some of the factors that may cause the market price of our common stock to fluctuate include:
| | • | | results of our clinical trials or those of our competitors; |
| | • | | the regulatory status of our product candidates; |
| | • | | failure of any of our products to achieve commercial success; |
| | • | | our quarterly revenues and fluctuations in our prescription trend data; |
| | • | | developments concerning our competitors and their products; |
| | • | | success of competitive products and technologies; |
| | • | | regulatory developments in the United States and foreign countries; |
| | • | | developments or disputes concerning our patents or other proprietary rights; |
| | • | | our ability to manufacture any products to commercial standards; |
| | • | | public concern over our drugs; |
| | • | | litigation involving our company or our general industry or both; |
| | • | | future sales of our common stock; |
| | • | | changes in the structure of health care payment systems, including developments in price control legislation; |
| | • | | departure of key personnel; |
| | • | | period-to-period fluctuations in our financial results or those of companies that are perceived to be similar to us; |
| | • | | changes in estimates of our financial results or recommendations by securities analysts; |
| | • | | investors’ general perception of us; and |
| | • | | general economic, industry and market conditions. |
If any of these risks occur, it could cause our stock price to fall and may expose us to class action lawsuits that, even if unsuccessful, could be costly to defend and a distraction to management.
Provisions in our certificate of incorporation and bylaws and under Delaware law may prevent or frustrate a change in control or a change in management that stockholders believe is desirable.
Provisions of our certificate of incorporation and bylaws may discourage, delay or prevent a merger, acquisition or other change in control that stockholders may consider favorable, including transactions in which
41
you might otherwise receive a premium for your shares. These provisions may also prevent or frustrate attempts by our stockholders to replace or remove our management. These provisions include:
| | • | | a classified board of directors; |
| | • | | limitations on the removal of directors; |
| | • | | advance notice requirements for stockholder proposals and nominations; |
| | • | | the inability of stockholders to act by written consent or to call special meetings; and |
| | • | | the ability of our board of directors to designate the terms of and issue new series of preferred stock without stockholder approval, which could be used to institute a rights plan, or a poison pill, that would work to dilute the stock ownership of a potential hostile acquirer, effectively preventing acquisitions that have not been approved by our board of directors. |
The affirmative vote of the holders of at least two-thirds of our shares of capital stock entitled to vote is necessary to amend or repeal the above provisions of our certificate of incorporation. In addition, absent approval of our board of directors, our bylaws may only be amended or repealed by the affirmative vote of the holders of at least two-thirds of our shares of capital stock entitled to vote.
In addition, Section 203 of the Delaware General Corporation Law prohibits a publicly held Delaware corporation from engaging in a business combination with an interested stockholder, generally a person which together with its affiliates owns or within the last three years has owned 15% of our voting stock, for a period of three years after the date of the transaction in which the person became an interested stockholder, unless the business combination is approved in a prescribed manner. Accordingly, Section 203 may discourage, delay or prevent a change in control of our company.
| ITEM 1B. | UNRESOLVED STAFF COMMENTS |
None.
We lease approximately 20,300 square feet of administrative offices at our corporate headquarters, which is located in Princeton, New Jersey. We also lease approximately 10,600 square feet of administrative offices in Geel, Belgium. Our Princeton, New Jersey lease expires in 2010 if not renewed by September 30, 2010, and our lease in Belgium is short-term and renewable. We believe that our current facilities are adequate for our present purposes.
None.
42
| ITEM 4. | SUBMISSION OF MATTERS TO A VOTE OF SECURITY HOLDERS |
We did not submit any matters to the vote of security holders during the fourth quarter of fiscal 2007.
OUR EXECUTIVE OFFICERS
The following table identifies our current executive officers:
| | | | |
Name | | Age | | Position |
Geert Cauwenbergh, Ph.D | | 54 | | Chief Executive Officer and Director |
Alfred Altomari | | 49 | | Chief Operating Officer |
Braham Shroot | | 65 | | Chief Scientific Officer |
Albert C. Bristow | | 38 | | General Counsel and Secretary |
Anne M. VanLent | | 59 | | Executive Vice President, Chief Financial Officer and Treasurer |
Dennis P. Reilly | | 49 | | Vice President, Principal Accounting Officer |
Geert Cauwenbergh, Ph.D. is our founder and Chief Executive Officer. Dr. Cauwenbergh served as our Chairman of the Board and Chief Executive Officer from September 2001 until June 2006. Prior to joining us, Dr. Cauwenbergh was at Johnson & Johnson Consumer and Personal Care Products Companies from 2000 to 2002 where he served in various capacities, most recently as Vice President of Technology. From 1994 to 2000, Dr. Cauwenbergh was at Johnson & Johnson Consumer Companies Worldwide where he served in various capacities, most recently as Vice President of Research & Development. He received his Ph.D. in Medical Sciences from the Catholic University of Leuven, Faculty of Medicine, Belgium where he also completed his Masters and undergraduate work. Dr Cauwenbergh serves on the Board of Trustees of the Biotechnology Council of New Jersey, currently as Vice Chairman of the Board. He has been the author of numerous publications in the fields of Dermatology and Infectious Diseases. On January 25, 2008, Dr. Cauwenbergh announced that he will step down as our Chief Executive Officer effective March 31, 2008. Dr. Cauwenbergh will remain a member of our Board of Directors.
Alfred Altomari was appointed Chief Operating Officer in February 2006. From August 2003 until February 2006, Mr. Altomari served as our Chief Commercial Officer. Prior to joining us, Mr. Altomari was at affiliates of Johnson & Johnson from 1982 to 2003 where he most recently served as General Manager of the Ortho Neutrogena prescription drug development group. Mr. Altomari also serves as a director of Auxilium Pharmaceuticals, Inc. and Agile Therapeutics, Inc. Mr. Altomari received a bachelor’s degree in Science with a dual major in finance and accounting from Drexel University and received his M.B.A. from Rider University. On January 25, 2008, Mr. Altomari was elected as a member of our Board of Directors. Effective April 1, 2008, Mr. Altomari will become our Chief Executive Officer.
Albert C. Bristow has been our General Counsel since October 2003. Prior to joining us, Mr. Bristow was an attorney with Morgan, Lewis & Bockius LLP, Princeton, New Jersey. Mr. Bristow received a bachelor’s degree in the Arts from Lafayette College and a J.D. from the University of Pennsylvania.
Braham Shroot, Ph.D.has served as the Company’s Chief Scientific Officer since May 2007. Prior to joining the Company, from 1999 to 2007, Dr. Shroot served as the Chief Scientific Officer and Vice President of Research and Development for DFB Pharmaceuticals family of companies (DPT Laboratories, DFB BioScience, Healthpoint, Coria Laboratories and Phyton Biotech). From 1979 to 1997 Dr. Shroot was the Vice General Manager of Galderma CIRD, a division of the L’Oreal Group, and President of Galderma Research, Inc. from 1998 to 1999, where he established a basic retinoid research group and then directed the facility’s move to New Jersey in 1999. Dr. Shroot began his career with Pfizer, Inc. serving as a principal scientist from 1970 to 1976, and later as group leader from 1976 to 1979, where he specialized in antimicrobial and antifungal drug design and development. Dr. Shroot has a Bachelor of Science in Chemistry and a Doctorate of Philosophy degree in Organic Chemistry, both from Glasgow University, in Glasgow, Scotland, United Kingdom. He followed with postdoctoral research in the team of Professor RB Woodward, Nobel Laureate, on vitamin B12 at Harvard University and is an inventor on over 50 patents and author of over 260 publications.
43
Anne M. VanLent has been our Executive Vice President, Chief Financial Officer and Treasurer since May 2002. Prior to joining us, Ms. VanLent served as a principal of the Technology Compass Group, LLC, a healthcare/technology consulting firm, since she founded it in October 2001. From July 1997 to October 2001, she was the Executive Vice President—Portfolio Management for Sarnoff Corporation, a multidisciplinary research and development firm. Ms. VanLent also currently serves as a director of Penwest Pharmaceuticals Co. and Integra Lifesciences Holdings Corp. She received a bachelor’s degree in Physics from Mount Holyoke College and did graduate work in biophysics.
Dennis P. Reilly was appointed Principal Accounting Officer in June 2006. Mr. Reilly has been Barrier Therapeutics’ Vice President of Finance since September 2005. Prior to joining Barrier, from May 2002 until September 2005, Mr. Reilly was Senior Director and Controller of The Medicines Company. From September 2000 through April 2002, Mr. Reilly was the U.S. Controller of Orbiscom, Inc. Mr. Reilly also spent 17 years with Mobil Corporation in various accounting and finance roles. Mr. Reilly received a bachelor’s degree in Accounting from Villanova University and a master’s degree in Finance from Virginia Tech University. Mr. Reilly is also a Certified Public Accountant.
44
PART II
| ITEM 5. | MARKET FOR REGISTRANT’S COMMON EQUITY, RELATED STOCKHOLDER MATTERS AND ISSUER PURCHASES OF EQUITY SECURITIES |
Our common stock is quoted on the NASDAQ National Market under the symbol “BTRX.” The following table sets forth the range of high and low sale prices for the common stock as reported on the NASDAQ National Market for the periods indicated below.
| | | | | | |
| | | High | | Low |
2007 | | | | | | |
First Quarter | | $ | 8.69 | | $ | 5.70 |
Second Quarter | | $ | 7.50 | | $ | 5.62 |
Third Quarter | | $ | 7.60 | | $ | 5.93 |
Fourth Quarter | | $ | 6.06 | | $ | 3.32 |
| | |
2006 | | | | | | |
First Quarter | | $ | 11.34 | | $ | 7.40 |
Second Quarter | | $ | 9.93 | | $ | 5.25 |
Third Quarter | | $ | 7.30 | | $ | 5.01 |
Fourth Quarter | | $ | 7.85 | | $ | 5.98 |
As of March 7, 2008, there were 41 holders of record of our common stock. On March 7, 2008, the last reported sale price of our common stock as reported on the NASDAQ National Market was $3.65 per share.
Dividend Policy
Since we became a public company, we have not paid any dividends on our common stock. We do not anticipate paying any dividends on our common stock in the foreseeable future. We intend to retain future earnings in order to finance the growth and development of our business.
Recent Sales of Unregistered Securities
During the year ended December 31, 2007, we did not sell any securities which were not covered by an effective registration statement under the Securities Act of 1933.
Equity Compensation Plan Information
The following table sets forth certain information as of the end of our fiscal year ended December 31, 2007 with respect to our compensation plans under which equity securities are authorized.
| | | | | | | | |
Plan Category | | Number of securities to
be issued upon exercise
of outstanding options,
warrants or rights
(a) | | Weighted average price of
outstanding stock
options, warrants or rights
(b) | | Number of securities
remaining available for future
issuance under equity
compensation plans (excluding
securities reflected in column (a))
(c) | |
Equity compensation plans approved by security holders | | 3,125,901 | | $ | 7.91 | | 2,073,967 | * |
Equity compensation plans not approved by security holders | | 0 | | | N/A | | 0 | |
Total | | 3,125,901 | | $ | 7.91 | | 2,073,967 | * |
| * | Effective as of January 1, 2008, this number reflects an increase of 1,000,000 shares of common stock reserved for issuance under the Plan. The Plan contains an evergreen provision which provides for an automatic increase or reserved shares under the Plan each year on the first trading day in January of each calendar year by an amount equal to 5% of the total number of shares of common stock outstanding on the last trading day in December, not in excess of 1,000,000. This number also takes into consideration 150,391 shares of restricted common stock issued to certain employees under the Plan during 2006 and 2007, which is subject to future vesting. Future vesting is contingent upon the individual’s continued employment with the Company. |
45
Comparative Stock Performance Graph
The following Performance Graph and related information shall not be deemed “soliciting material” or to be “filed” with the Securities and Exchange Commission, nor shall such information be incorporated by reference into any future filing under the Securities Act of 1933 or Securities Exchange Act of 1934, each as amended, except to the extent that we specifically incorporate it by reference into such filing.
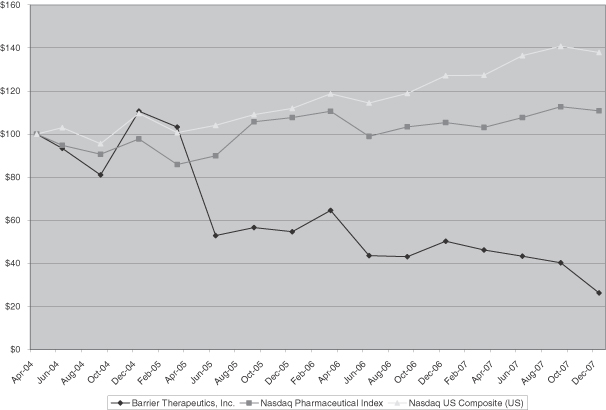
ASSUMES $100 INVESTED ON APRIL 28, 2004
ASSUMES DIVIDENDS REINVESTED THROUGH FISCAL YEAR ENDING DECEMBER 31, 2007
| | | | | | | | | | | | | | | | | | | | | | | | |
| | | 4/28/04 | | 6/30/04 | | 9/30/04 | | 12/31/04 | | 3/31/05 | | 6/30/05 | | 9/30/05 | | 12/30/05 |
Barrier Therapeutics, Inc. | | $ | 100 | | $ | 93.40 | | $ | 81.07 | | $ | 110.67 | | $ | 103.27 | | $ | 52.87 | | $ | 56.60 | | $ | 54.67 |
Nasdaq Pharmaceutical Index | | $ | 100 | | $ | 94.77 | | $ | 90.64 | | $ | 97.77 | | $ | 85.86 | | $ | 89.92 | | $ | 105.71 | | $ | 107.66 |
Nasdaq US Composite (US) | | $ | 100 | | $ | 102.98 | | $ | 95.56 | | $ | 109.60 | | $ | 100.68 | | $ | 104.10 | | $ | 109.07 | | $ | 111.93 |
| | | | | | | | | | | | | | | | | | | | | | | | |
| | | 3/31/06 | | 6/30/06 | | 9/30/06 | | 12/31/06 | | 3/30/07 | | 6/29/07 | | 9/28/07 | | 12/31/07 |
Barrier Therapeutics, Inc. | | $ | 64.53 | | $ | 43.60 | | $ | 43.07 | | $ | 50.27 | | $ | 46.20 | | $ | 43.33 | | $ | 40.27 | | $ | 26.27 |
Nasdaq Pharmaceutical Index | | $ | 110.59 | | $ | 98.93 | | $ | 103.37 | | $ | 105.39 | | $ | 103.12 | | $ | 107.67 | | $ | 112.73 | | $ | 110.82 |
Nasdaq US Composite (US) | | $ | 118.73 | | $ | 114.46 | | $ | 118.95 | | $ | 127.17 | | $ | 127.37 | | $ | 136.45 | | $ | 140.79 | | $ | 137.91 |
46
| ITEM 6. | SELECTED FINANCIAL DATA |
The selected consolidated financial data presented below for, and as of the end of, each of our last five fiscal years has been derived from and is qualified by reference to our consolidated financial statements. Our consolidated financial statements for the fiscal years ended December 31, 2007, 2006, 2005, 2004, and 2003, have been audited by Ernst & Young LLP, an independent registered public accounting firm.
This information should be read in conjunction with our consolidated financial statements and the related notes thereto and “Management’s Discussion and Analysis of Financial Condition and Results of Operations” which is Item 7 of Part II of this annual report on Form 10-K.
We have not paid any cash dividends on our shares of common stock during the periods presented.
| | | | | | | | | | | | | | | | | | | | |
| | | Year Ended December 31, | |
| | | 2007 | | | 2006 | | | 2005 | | | 2004 | | | 2003 | |
| | | (in thousands, except share and per share data) | |
Consolidated Statement of Operations Data: | | | | | | | | | | | | | | | | | | | | |
Revenues: | | | | | | | | | | | | | | | | | | | | |
Net product revenue | | $ | 23,519 | | | $ | 5,853 | | | $ | 792 | | | $ | — | | | $ | — | |
Other revenue | | | 563 | | | | 885 | | | | 1,748 | | | | 897 | | | | 367 | |
| | | | | | | | | | | | | | | | | | | | |
Total net revenue | | | 24,082 | | | | 6,738 | | | | 2,540 | | | | 897 | | | | 367 | |
| | | | | | | | | | | | | | | | | | | | |
Operating expenses: | | | | | | | | | | | | | | | | | | | | |
Cost of product revenues | | | 3,192 | | | | 1,431 | | | | 544 | | | | — | | | | — | |
Research and development | | | 27,900 | * | | | 25,895 | * | | | 30,369 | | | | 30,904 | | | | 17,485 | |
Selling, general and administrative | | | 49,630 | * | | | 35,795 | * | | | 20,280 | | | | 11,475 | | | | 3,730 | |
| | | | | | | | | | | | | | | | | | | | |
Total operating expenses | | | 80,722 | * | | | 63,121 | * | | | 51,193 | | | | 42,379 | | | | 21,215 | |
| | | | | | | | | | | | | | | | | | | | |
Loss from operations | | | (56,640 | ) | | | (56,383 | ) | | | (48,653 | ) | | | (41,482 | ) | | | (20,848 | ) |
Interest income | | | 2,127 | | | | 3,015 | | | | 2,929 | | | | 1,408 | | | | 419 | |
Interest expense | | | (229 | ) | | | (61 | ) | | | (53 | ) | | | (36 | ) | | | (3 | ) |
| | | | | | | | | | | | | | | | | | | | |
Net loss before income tax benefit and cumulative effect of change in accounting principle | | | (54,742 | )* | | | (53,429 | )* | | | (45,777 | ) | | | (40,110 | ) | | | (20,432 | ) |
Income tax benefit | | | 1,050 | | | | 655 | | | | 536 | | | | 367 | | | | 217 | |
Cumulative effect of change in accounting principle | | | — | | | | 57 | | | | — | | | | — | | | | — | |
Preferred stock accretion | | | — | | | | — | | | | — | | | | (4,592 | ) | | | (8,432 | ) |
| | | | | | | | | | | | | | | | | | | | |
Net loss attributable to common stockholders | | $ | (53,692 | )* | | $ | (52,717 | )* | | $ | (45,241 | ) | | $ | (44,335 | ) | | $ | (28,647 | ) |
| | | | | | | | | | | | | | | | | | | | |
Basic and diluted net loss per share | | $ | (1.74 | )* | | $ | (2.06 | )* | | $ | (1.91 | ) | | $ | (3.02 | ) | | $ | (83.95 | ) |
| | | | | | | | | | | | | | | | | | | | |
Weighted average shares used in computing basic and diluted net loss per share | | | 30,862,594 | | | | 25,583,259 | | | | 23,656,306 | | | | 14,677,710 | | | | 341,256 | |
| | | | | | | | | | | | | | | | | | | | |
| * | Note: As discussed inNote 1, “Summary of Significant Accounting Policies”to the consolidated financial statements, effective January 1, 2006, we adopted Statement of Financial Accounting Standards No. 123(R), “Share-Based Payment” (“FAS 123(R)”). |
| | | | | | | | | | | | | | | | | | | | |
| | | December 31, | |
| | | 2007 | | | 2006 | | | 2005 | | | 2004 | | | 2003 | |
| | | (in thousands) | |
Consolidated Balance Sheet Data: | | | | |
Cash, cash equivalents and marketable securities | | $ | 48,463 | | | $ | 58,884 | | | $ | 78,120 | | | $ | 89,081 | | | $ | 53,776 | |
Working capital | | | 31,035 | | | | 50,056 | | | | 72,785 | | | | 82,846 | | | | 51,682 | |
Total assets | | | 67,416 | | | | 67,234 | | | | 84,961 | | | | 92,784 | | | | 56,971 | |
Long-term notes payable | | | 104 | | | | 280 | | | | 405 | | | | 443 | | | | 193 | |
Accumulated deficit | | | (257,850 | ) | | | (204,158 | ) | | | (151,441 | ) | | | (106,200 | ) | | | (61,865 | ) |
Total stockholders’ equity (deficit) | | | 33,918 | | | | 53,213 | | | | 76,266 | | | | 83,570 | | | | (61,534 | ) |
47
| ITEM 7. | MANAGEMENT’S DISCUSSION AND ANALYSIS OF FINANCIAL CONDITION AND RESULTS OF OPERATIONS |
You should read the following discussion and analysis of our financial condition and results of operations together with our consolidated financial statements and the related notes appearing at the end of this Form 10-K. Some of the information contained in this discussion and analysis or set forth elsewhere in this Form 10-K, including information with respect to our plans and strategy for our business, includes forward-looking statements that involve risks and uncertainties. You should review the “Risk Factors” in Item 1A of Part I of this Form 10-K for a discussion of important factors that could cause actual results to differ materially from the results described in or implied by the forward-looking statements contained in the following discussion and analysis.
Overview
Our goal is to develop a portfolio of innovative products that address major medical needs in the treatment of dermatological diseases and disorders and become a leader in the development and commercialization of prescription pharmaceutical products to treat these diseases and disorders.
We currently market three pharmaceutical products in the U.S., Xolegel (ketoconazole, USP) Gel 2%, Vusion (0.25% miconazole nitrate, 15% zinc oxide, and 81.35% white petrolatum) Ointment and Solagé (mequinol 2.0% and tretinoin 0.01%) Topical Solution. We market our products directly to dermatologists and other target physicians through both our own specialty sales force and under a co-promotion agreement with Novartis Consumer Health in the United States.
We have other product candidates in various stages of clinical development for the treatment of a range of dermatological conditions, including onychomycosis, psoriasis, acne, skin allergies and superficial fungal infections. In addition, we have access to the classes of compounds claimed in the patents licensed to us under our license agreements with affiliates of Johnson & Johnson. The development of each of our product candidates involves significant risks. No assessment of the efficacy or safety of any product candidate can be considered definitive until all clinical trials needed to support a submission to the FDA for marketing approval are completed.
In 2007, we recognized total product revenues of $23.5 million mostly related to our Vusion and Xolegel sales in the United States. In 2006, we recognized total product revenues of $5.9 million mostly related to our Vusion sales in the U.S. and sales of Solagé in the U.S. and Canada. We expect product revenues to increase in 2008 to between $46 million to $50 million, primarily due to the anticipated growth in sales for our Vusion and Xolegel products. We have increased our focus on the U.S. market for sales growth in the near term. Due to pricing pressures on our current product portfolio we have discontinued sales and marketing efforts in Canada and the European Union.
We have financed our operations and internal growth almost entirely through proceeds from private placements of preferred stock, our initial public offering in the second quarter of 2004 and our follow-on public offerings in the first quarter of 2005, the third quarter of 2006 and the third quarter of 2007. In June 2007, we entered into a $12 million senior secured credit facility to finance ongoing working capital requirements of our commercial operations.
We were incorporated in September 2001 and commenced active operations in May 2002. Since our inception we have incurred significant losses. As of December 31, 2007, we had an accumulated deficit of $257.9 million. We expect to continue to spend significant amounts on the commercial development of our products, including the sales and marketing of Vusion and Xolegel. We also plan to continue to invest in the clinical development of our product candidates and to seek marketing approvals for our product candidates, primarily in the United States. Accordingly, we will need to generate significantly greater revenues to achieve and then
48
maintain profitability. Additionally, we plan to continue to evaluate possible acquisitions of marketed products or businesses that complement our development and commercialization strategy.
Selling, general and administrative expenses consist primarily of salaries and other related personnel costs (including stock based compensation expense), sales, marketing and promotion expenses, general corporate activities, professional fees and facilities costs. In 2007, selling, general and administrative expenses totaled $49.6 million. We expect these costs to increase in 2008 compared to 2007, to within the range of $54 million to $56 million, as we continue to increase our commercial efforts in support of Vusion and Xolegel. In addition, if we were to acquire or in-license other products, we would then incur sales and marketing costs related to such products.
Research and clinical development expenses represent:
| | • | | cost incurred for the conduct of our clinical trials, |
| | • | | cost related to pre-clinical studies, including toxicology and pharmacokinetics, |
| | • | | cost incurred in screening for new product candidates, |
| | • | | manufacturing development costs related to our clinical product candidates, |
| | • | | personnel and related costs related to our research and product development activities (including stock based compensation expense), and |
| | • | | outside professional fees related to clinical development and regulatory matters. |
We outsource the conduct of our pre-clinical studies, clinical trials and all of our manufacturing development activities to third parties to maximize efficiency and minimize our internal overhead. We expense these research and development costs as they are incurred. In 2007, research and development expenses totaled $27.9 million. We expect that our research and development expenses will be slightly lower in 2008 compared to 2007, within the range of $24 million to $26 million. We plan to complete our ongoing Hyphanox phase 3 study in onychomychosis as well as continue our efforts for other pipeline candidates. Currently, we are actively seeking partnership opportunities for our Pramiconazole product candidate. In addition, we are gathering toxicology and clinical data on our Rambazole product. We plan to submit this data to the FDA to request removal of their clinical hold in the United States.
We expect to continue to incur net losses over the next several years as we continue our clinical development, apply for regulatory approvals, enter into arrangements with third parties for manufacturing and distribution services and market our products. We expect these losses to decrease over time with the anticipation of product revenue growth. We expect that our net loss will be lower in 2008 compared to 2007, within a range of $30 million to $35 million. We have a limited history of operations and anticipate that our quarterly results of operations will fluctuate for several reasons, including:
| | • | | the timing and extent of recognition of product and other revenues; |
| | • | | the timing of any contract, license fee or royalty payments that we may receive or be required to make; |
| | • | | the timing and outcome of our applications for regulatory approvals; |
| | • | | the timing and extent of marketing and selling expenses; |
| | • | | the timing and extent of our research and development efforts; |
| | • | | the timing and extent of our adding new employees and infrastructure; and |
| | • | | the timing and extent of employee stock grants and stock option grants. |
49
Critical Accounting Policies and Significant Judgments and Estimates
Our management’s discussion and analysis of our financial condition and results of operations are based on our consolidated financial statements, which have been prepared in accordance with U.S. generally accepted accounting principles. The preparation of these financial statements requires us to make estimates and assumptions that affect the reported amounts of assets and liabilities and the disclosure of contingent assets and liabilities at the date of the financial statements as well as the reported revenues and expenses during the reporting periods. On an ongoing basis, we evaluate our estimates and assumptions. We base our estimates on historical experience and on various other factors that we believe are reasonable under the circumstances, the results of which form the basis for making judgments about the carrying value of assets and liabilities that are not readily apparent from other sources. Actual results may differ from these estimates under different assumptions or conditions.
While our significant accounting policies are more fully described in Note 1 to our consolidated financial statements appearing at the end of this annual report on Form 10-K, we believe that the following accounting policies are the most critical to aid you in fully understanding and evaluating our reported financial results.
Revenue Recognition
We use revenue recognition criteria in Staff Accounting Bulletin No. 104, “Revenue Recognition in Financial Statements,” Emerging Issues Task Force (“EITF”) Issue 00-21 “Revenue Arrangements with Multiple Deliverables” (“EITF 00-21”) and Statement of Financial Accounting Standards No 48 (“FAS 48”) “Revenue Recognition When Right of Return Exists.” Revenue arrangements that include multiple deliverables are divided into separate units of accounting if the deliverables meet certain criteria, including whether the fair value of the delivered items can be determined and whether there is evidence of fair value of the undelivered items. In addition, the consideration is allocated among the separate units of accounting based on their fair values, and the applicable revenue recognition criteria are considered separately for each of the separate units of accounting.
Net Product Revenue. We sell our products primarily to wholesalers, who, in turn, sell to pharmacies. The following are our revenue recognition policies.
New Product Launch—At the time of a new product launch, we utilize a pull-through sales method that recognizes revenue based on estimated prescription demand based on third party market research data. Once we have established a normal level of wholesale inventory based on a normalized prescription demand, revenue is recognized, net of reserves, upon shipment to the wholesaler. Estimating the amount of returns and discounts for new products is based on specific facts and circumstances including acceptance rates from established products with similar marketing characteristics. At the time of a new product launch, absent the ability to make reliable estimates, we defer revenue on sales to wholesalers until we can make reliable estimates of returns, discounts and related end user demand. We attempt to monitor our inventory levels at our wholesalers and pharmacies to ensure inventory outstanding remain within normal levels. We estimate inventory at wholesalers based on historical sales to wholesalers, inventory data provided to us by these wholesalers and from third party market research data related to prescription trends and patient demand. Making these determinations involves estimating whether trends in past buying patterns will predict future product sales.
Product Sales Allowances—We record product sales net of the following significant categories of product sales allowances: prompt payment discounts, wholesaler fees, returns, coupons, discounts for Medicaid, managed care and governmental contracts. In determining allowances for product returns, coupons and Medicaid rebates, we must make significant judgments and estimates. For example, in determining these amounts, we estimate prescription demand and the levels of inventory held by wholesalers. Making these determinations involves estimating whether trends in past buying patterns will predict future product sales. Calculating some of these items involves significant estimates and judgments and, at times, requires us to use information from external sources.
50
Returns—Customers can return short-dated or expired product that meets the guidelines set forth in our return goods policy. Returns are accepted from wholesalers and retail pharmacies. Wholesaler customers can return short dated product with six months, or less, shelf life remaining and expired product within twelve months following the expiration date. Retail pharmacies are not permitted to return short-dated product but can return full or partial quantities of expired product only within twelve months following the expiration date. We base our estimates of product returns for each of our products on the percentage of returns that we have experienced historically or based on industry data for similar products. Notwithstanding this, we may adjust our estimate of product returns if we are aware of other factors that we believe could meaningfully impact our expected return percentages. These factors could include, among others, our estimates of inventory levels of our products in the distribution channel, known sales trends and existing or anticipated competitive market forces such as product entrants and/or pricing changes.
Rebates - Patient Discount/Coupons—From time to time we offer patients the opportunity to obtain free or discounted products through a program whereby physicians provide coupons or payment cards to qualified patients for redemption at retail pharmacies. We reimburse retail pharmacies for the cost of these products through a third party administrator. We recognize the estimated cost of this reimbursement as a reduction of gross sales when product is sold. As a result of these patient discount and coupon offers, at the time of product shipment, we must estimate the likelihood that products sold to wholesalers and pharmacies might be ultimately sold to a patient who redeems a coupon. We base our estimates on the historic coupon redemption rates for similar products we receive from third party administrators, which detail historic patterns. We maintain an accrual for unused coupons based on inventory in the distribution channel and historical coupon usage rates and adjust this accrual whenever changes in such coupon usage rates occur.
Rebates - Medicaid discounts— In some states we participate or have applied to participate in the Federal Medicaid rebate program, as well as several state government-managed supplemental Medicaid rebate programs, which were developed to provide assistance to certain vulnerable and needy individuals and families. Under the Medicaid rebate program, we pay a rebate to each participating state and local government for our products that their programs reimburse. For purposes of this discussion, discounts and rebates provided through these programs are considered Medicaid rebates and are included in our Medicaid rebate accrual.
We record accruals for Medicaid rebates as a reduction of sales when product is sold to our wholesaler distributors. These reductions are based on historical rebate amounts and trends of sales eligible for these governmental programs for a period, as well as any expected changes to the trends of our total product sales. In addition, we estimate the expected unit rebate amounts to be used and adjust our rebate accruals based on the expected changes in rebate pricing. Rebate amounts are generally invoiced and paid quarterly in arrears, so that our accrual consists of an estimate of the amount expected to be incurred for the current quarter’s activity, plus an accrual for prior quarters’ unpaid rebates and an accrual for inventory in the distribution channel. We analyze the accrual at least quarterly and adjust the balance as required.
We will adjust our allowances for product returns, coupon and Medicaid rebates based on our actual sales experience, and we will likely be required to make adjustments to these allowances in the future. We continually monitor our allowances and make adjustments when we believe actual experience may differ from our estimates.
Other Revenues. Contract revenues include license fees and other payments associated with collaborations with third parties. Revenue is generally recognized when there is persuasive evidence of an arrangement exists, delivery has occurred or services have been rendered, the price is fixed or determinable, and collectability is reasonably assured.
Revenue from non-refundable, upfront license fees where we have a continuing involvement is recognized on a straight-line basis over the performance period. We periodically re-evaluate our estimates of the performance period and revise our assumptions as appropriate. These changes in assumptions may affect the amount of revenue recorded in our financial statements in future periods. At December 31, 2007, we had no deferred revenue in our financial statements.
51
Grant revenues are recognized when we provide the services stipulated in the underlying grant based on the time and materials incurred up to the amount of grant payments received. Amounts received in advance of services provided are recorded as deferred revenue and amortized as revenue when the services are provided.
Inventories.Inventory is recorded upon the transfer of title from our vendors. Our inventories are valued at the lower of cost or market and include finished good inventories. Cost is computed on inventories using the first-in, first-out (“FIFO”) method. Our inventories are subject to expiration dating. We regularly review inventory, including inventory purchase commitments, for short dated or slow moving inventory based on expected revenues and expiration dates of inventories. For those units we identify as short dated or slow moving, we estimate their market value based on current trends. If the projected net realizable value is less than cost, on a product basis, we will record a provision to reflect the lower value of inventory. Although we make every effort to ensure the accuracy of forecasts of future product demand, any significant unanticipated decreases in demand could have a material impact on the carrying value of our inventories and our reported operating results. In 2007, inventory reserves totaled $0.3 million primarily related to Canadian inventory write-offs due to the Company exiting commercial operations in Canada during 2007 and a reserve for short dated product in the United States. In 2006, inventory reserves totaled $0.2 million related to obsolete inventory in Europe.
We have committed to make future minimum inventory commitments under supply agreements to third parties for certain product inventories. We evaluate our ability to meet these future minimum commitments on a regular basis using current product demand along with estimated future product demand and forecasts. If we determine we can not meet the future minimum we record a charge to cost of product revenues. In 2007, we recorded a charge of $0.6 million in cost of product revenues related to an international inventory commitment with Janssen Pharmaceutica, NV. No such charges were recorded in 2006 or 2005. As of December 31, 2007, our minimum purchase commitments total $8.8 million, the majority of which relate to Vusion and Xolegel. We expect to fully utilize these contracts.
We expense our inventory costs associated with products prior to regulatory approval as research and development expense.
Intangible Assets.Product rights are being amortized on a straight-line basis over the life of the underlying patent, which expires in 2013. We continually evaluate the reasonableness of the carrying value of its intangible assets. An impairment may be recognized if the expected future undiscounted cash flows are less than their carrying amounts. As of December 31, 2007, no impairment exists.
Stock-based Compensation.On January 1, 2006, we adopted Statement of Financial Accounting Standards No. 123 (revised 2004), “Accounting for Stock-Based Compensation” (FAS 123(R)) using the modified prospective method. FAS 123(R) requires companies to recognize compensation expense in an amount equal to the fair value of all share-based payments granted to employees. We commenced the new method of valuing stock-based compensation as prescribed by FAS 123(R) on all stock-based awards granted after the effective date.
For years ended December 31, 2007 and 2006, we recorded an expense for stock based compensation of $4.6 million, $0.7 million of which was recorded in research and development expense and $3.9 million was recorded in selling, general and administrative expense, and $5.3 million, $1.4 million of which was recorded in research and development expense and $3.9 million was recorded in selling, general and administrative expenses. In December 2007, we recorded an adjustment related to forfeitures to true-up actual expense reported in our financial statements in 2006 and 2007. This adjustment was not material to either the current or prior periods.
Stock options are granted to employees at exercise prices equal to the fair market value of our stock at date of grant. Stock options generally vest over three to four years and have a term of 10 years. Compensation cost is recognized over the requisite service period for each separately vesting portion of the stock option. The expense is recognized, net of forfeitures, over the vesting period of the options using an accelerated method. We have
52
never paid cash dividends and do not currently intend to pay cash dividends, and thus have assumed a 0% dividend yield. Expected volatilities are based on historical volatility of our stock price, which is compared to the volatility of a peer group of companies for reasonableness. The expected life of stock options is calculated using the “short-cut approach” in developing our estimate of expected term for “plain vanilla” stock options granted by using the mid-point between the vesting date and contractual termination date as allowed by Staff Accounting Bulletin No. 107. The risk-free interest rates are derived from the United States Treasury rates. In addition, the Company applies an expected forfeiture rate when amortizing stock-based compensation expenses. The estimate of the forfeiture rate is based primarily upon historical experience of employee turnover. The fair value of the options was estimated using the Black-Scholes pricing model with the following weighted average assumptions:
| | | | | | | | | |
| | | Year Ended December 31, | |
| | | 2007 | | | 2006 | | | 2005 | |
Risk-free interest rate | | 3.89 | % | | 4.75 | % | | 4.0 | % |
Dividend yield | | 0 | % | | 0 | % | | 0 | % |
Expected life | | 6.0 years | | | 6.0 years | | | 6.0 years | |
Volatility | | 62 | % | | 70 | % | | 75 | % |
Prior to January 1, 2006, as allowed by SFAS 123, we had applied the intrinsic value-based method of accounting prescribed in APB 25 and its related interpretations, and, accordingly, did not recognize compensation expense for stock option grants made at an exercise price equal to or in excess of the fair market value of the stock at the date of grant. For pro forma purposes, the stock compensation expense was based on an accelerated vesting method. SFAS 123 pro forma information regarding net loss was required by SFAS 123, and had been determined as if we had accounted for its stock-based employee compensation under the fair value method prescribed in SFAS 123. The fair values of the options were estimated using the Black-Scholes pricing model. In addition, no compensation expense was recorded in the financial statements for shares purchased under our Employee Stock Purchase Plan as that plan was considered non-compensatory under APB 25.
In addition, prior to the adoption of FAS 123(R), we presented our unamortized portion of deferred compensation cost for nonvested stock options in the statement of changes in shareholders equity with a corresponding credit to additional paid in capital. Upon the adoption of FAS 123(R), these amounts were offset against each other. Under FAS 123(R), an equity instrument is not considered to be issued until the instrument vests. As a result, compensation cost is recognized over the requisite service period with an offsetting credit to additional paid in capital, and the deferred compensation balance of $532,000 at December 31, 2005 was netted against additional paid in capital.
APB 25 did not permit the estimation of forfeitures for the unvested awards outstanding, and therefore forfeitures were recognized as they occurred. Under FAS 123(R), an estimate of forfeitures must be made for the unvested awards outstanding as of the adoption date. As such, an adjustment to record the cumulative effect of a change in accounting principle is needed to reflect the compensation cost that would not have been recognized in prior periods had forfeitures been estimated during those periods. This adjustment applies only to compensation cost previously recognized in the financial statements for awards that are unvested on the adoption date. As such, we recognized a cumulative effect adjustment of $57,000 as of January 1, 2006 related to the accounting change for forfeitures.
FAS 123(R) does not change the accounting guidance for how we account for options issued to non-employees. We account for options issued to non-employees under SFAS No. 123 and EITF Issue No. 96-18, “Accounting for Equity Instruments That Are Issued to Other Than Employees for Acquiring, or in Conjunction with Selling, Goods or Services.” As such, the value of such options is periodically re-measured and income or expense is recognized during their vesting terms. We recorded $69,000, $133,000 and $378,000, non-employee stock compensation expense for years ended December 31, 2007, 2006, and 2005, respectively.
53
Recent Accounting Pronouncements
In September 2006, the FASB issued Statement 157,Fair Value Measurement (“Statement 157”). Statement 157 defines fair value, establishes a framework for measuring fair value in generally accepted accounting principles and establishes a hierarchy that categorizes and prioritizes the sources to be used to estimate fair value. Statement 157 also expands financial statement disclosures about fair value measurements. On February 6, 2008, the FASB issued FASB Staff Position (FSP) 157-b which delays the effective date of Statement 157 for one year for all nonfinancial assets and nonfinancial liabilities, except those that are recognized or disclosed at fair value in the financial statements on a recurring basis (at least annually). Statement 157 and FSP 157-b are effective for financial statements issued for fiscal years beginning after November 15, 2007. We are currently assessing the impact this provision may have on our consolidated financial statements; however, we do not believe that its adoption will have a significant impact on our consolidated financial statements.
In February 2007, the FASB issued Statement 159,The Fair Value Option for Financial Assets and Financial Liabilities—Including an Amendment of SFAS 115 (“Statement 159”), which permits but does not require a Company to measure financial instruments and certain other items at fair value. Unrealized gains and losses on items for which the fair value option has been elected are reported in earnings. This statement is effective for financial statements issued for fiscal years beginning after November 15, 2007. We are currently evaluating the impact, if any, that the adoption of Statement 159 will have on our consolidated financial statements.
In June 2007, the FASB issued EITF Issue No. 07-3,Accounting for Nonrefundable Advance Payments for Goods or Services to Be Used in Future Research and Development Activities, (“EITF 07-3”). EITF 07-3 requires that nonrefundable advance payments for goods or services that will be used or rendered for future research and development activities should be deferred and capitalized. The capitalized amounts should be expensed as the related goods are delivered or the services are performed. EITF 07-3 is effective for new contracts entered into during fiscal years beginning after December 15, 2007. We are currently evaluating the requirements of EITF 07-3; however, we do not believe that its adoption will have a significant impact on our consolidated financial statements.
In December 2007, the FASB issued Statement No. 141(R),Business Combinations(“Statement 141 (R)”), a replacement of FASB Statement No. 141. Statement 141(R) is effective for fiscal years beginning on or after December 15, 2008 and applies to all business combinations. Statement 141(R) provides that, upon initially obtaining control, an acquirer shall recognize 100 percent of the fair values of acquired assets, including goodwill, and assumed liabilities, with only limited exceptions, even if the acquirer has not acquired 100 percent of its target. As a consequence, the current step acquisition model will be eliminated. Additionally, Statement 141(R) changes current practice, in part, as follows: (1) contingent consideration arrangements will be fair valued at the acquisition date and included on that basis in the purchase price consideration; (2) transaction costs will be expensed as incurred, rather than capitalized as part of the purchase price; (3) pre-acquisition contingencies, such as legal issues, will generally have to be accounted for in purchase accounting at fair value; and (4) in order to accrue for a restructuring plan in purchase accounting, the requirements in FASB Statement No. 146,Accounting for Costs Associated with Exit or Disposal Activities, would have to be met at the acquisition date. We do not expect that the adoption of Statement No. 141(R) will have a significant impact on our consolidated financial statements.
In December 2007, the Securities and Exchange Commission (“SEC”) issued Staff Accounting Bulletin No. 110 (“SAB 110”) which amends and replaces Question 6 of Section D.2 of Topic 14,Share-Based Payment. SAB 110 expresses the views of the staff regarding the use of the “simplified” method in developing an estimate of expected term of “plain vanilla” share options in accordance with FASB Statement No. 123(R),Share Based Payment.The use of the “simplified” method was scheduled to expire on December 31, 2007; however, SAB 110 extends the use of the “simplified” method for “plain vanilla” awards in certain situations. We currently use the “simplified” method to estimate the expected term for share option grants since we do not have enough historical experience to provide a reasonable estimate due to the limited period that our equity shares have been publicly traded. We will continue to use the “simplified” method until we have enough historical experience to provide a
54
reasonable estimate of expected term in accordance with SAB 110. SAB 110 is effective for options granted after December 31, 2007.
Results of Operations
Years ended December 31, 2007, 2006 and 2005
Net Revenues. Net Revenues are summarized below:
| | | | | | | | | |
| | | Year ended December 31, |
| | | 2007 | | 2006 | | 2005 |
| | | (in thousands) |
Net product revenues | | | | | | | | | |
U.S. | | $ | 23,055 | | $ | 5,331 | | $ | 684 |
International | | | 464 | | | 522 | | | 108 |
| | | | | | | | | |
Total net product revenues | | | 23,519 | | | 5,853 | | | 792 |
Grant revenue | | | 510 | | | 256 | | | 1,059 |
Contract revenue | | | 53 | | | 629 | | | 689 |
| | | | | | | | | |
Total net revenue | | $ | 24,082 | | $ | 6,738 | | $ | 2,540 |
| | | | | | | | | |
Total net revenues for 2007 increased $17.3 million over 2006 mostly related to increased product revenues of Vusion and Xolegel in the United States, offset in part by a decrease in contract revenue. Total net revenues for 2006 increased $4.2 million over 2005 mostly related to the launch of Vusion in the U.S., offset by a decrease in grant revenue.
Net Product Revenues.Net product revenues for the year ended December 31, 2007 increased $17.7 million compared to the same period in 2006 primarily due to U.S. sales of Vusion and Xolegel, which launched in Q2 2006 and Q4 2006, respectively. Net product revenues for the year ended December 31, 2006 increased $5.1 million compared to the same period in 2005 primarily due to the launch of Vusion. We expect product revenues to grow significantly as we expand our marketing efforts for our products. In 2005, we recognized product revenues of $0.8 million for our sales of Solagé in the U.S. and Canada and sales of VANIQA in Canada. Due to pricing pressures on our current product portfolio we have discontinued sales and marketing efforts in Canada and the European Union.
| | • | | Vusion—Vusion is approved for the treatment of diaper dermatitis complicated by documented candidiasis. Vusion was approved by the FDA in February 2006 and we commercially launched the product in the United States in May 2006. |
| | • | | Xolegel—Xolegel is approved for the treatment of seborrheic dermatitis. Xolegel was approved by the FDA in July 2006 and we commercially launched the product in the U.S. in November 2006. |
| | • | | Solagé—Solagé is approved for the treatment of solar lentigines. We acquired Solagé in 2005 and market the product in both the U.S. and Canada. |
Net Product Revenues are summarized below:
| | | | | | | | | |
| | | Year ended December 31, |
| | | 2007 | | 2006 | | 2005 |
| | | (in thousands) |
Net product revenues | | | | | | | | | |
Vusion | | $ | 18,133 | | $ | 3,765 | | $ | — |
Xolegel | | | 3,928 | | | 130 | | | — |
Solagé | | | 994 | | | 1,436 | | | 684 |
| | | | | | | | | |
US net product revenues | | | 23,055 | | | 5,331 | | | 684 |
| | | | | | | | | |
International | | | 464 | | | 522 | | | 108 |
| | | | | | | | | |
Total net product revenues | | $ | 23,519 | | $ | 5,853 | | $ | 792 |
| | | | | | | | | |
55
At December 31, 2007, there was no Deferred Revenue. Deferred Revenue of $0.4 million at December 31, 2006, primarily reflects the deferral of sales related to the Xolegel launch in the U.S. along with some Canadian sales. Deferred Revenue of $0.6 million at December 31, 2005, reflects primarily the deferral of contract milestones related to our distribution agreements and some Canadian sales.
Gross-to-Net Product Revenue Adjustments. We recognize product revenues net of allowances and accruals for estimated rebates, wholesaler fees, cash discounts, product returns and chargeback and other discounts. Rebate deductions reflect estimates of coupon discounts and Medicaid rebates based on historical payment data and estimates of future Medicaid beneficiary utilization. Wholesaler service fees are fees paid to our U.S wholesalers for distribution services. Cash discounts deductions reflect prompt payment term discounts extended to our customers. Allowance for sales returns are based on the actual returns history as well as anticipated returns.
The following table summarizes our gross-to-net revenue deductions:
| | | | | | | | | |
| | | Year ended December 31, |
| | | 2007 | | 2006 | | 2005 |
| | | (in thousands) |
Gross product revenues | | $ | 42,472 | | $ | 7,152 | | $ | 822 |
Rebates (Medicaid and coupon) | | | 15,621 | | | 706 | | | 4 |
Wholesaler fees | | | 1,401 | | | 200 | | | — |
Cash discounts | | | 809 | | | 148 | | | 18 |
Product returns | | | 548 | | | 25 | | | 7 |
Other (including chargebacks) | | | 574 | | | 220 | | | 1 |
| | | | | | | | | |
Total net product revenues | | $ | 23,519 | | $ | 5,853 | | $ | 792 |
| | | | | | | | | |
Rebates increased $14.9 million in 2007 as compared to 2006 primarily due to increased sales volume and increased unit rebate amounts for Medicaid as well as the introduction of our coupon discount. Wholesaler fees, cash discounts, product returns and chargebacks increased in 2007 as compared to 2006 as a result of the increase in sales volume.
The following is a summary of gross to net sales reductions that are accrued on our consolidated balance sheets as of December 31, 2007 and 2006 (in thousands):
| | | | | | |
| | | December 31,
2007 | | December 31,
2006 |
| | | (in thousands) |
Accounts Receivable Reductions | | | | | | |
Cash discounts | | $ | 227 | | $ | 37 |
Other (including doubtful accounts) | | | 35 | | | 12 |
| | | | | | |
Total accounts receivable reductions | | | 262 | | | 49 |
Accrued Liabilities | | | | | | |
Rebates (Medicaid and coupon) | | $ | 10,013 | | $ | 630 |
Wholesaler fees | | | 618 | | | 135 |
Other(including product returns, chargebacks, etc) | | | 448 | | | 30 |
| | | | | | |
Total revenue related accrued liabilities | | $ | 11,079 | | $ | 795 |
| | | | | | |
56
The following table provides a summary of activity with respect to the Company’s rebates, wholesaler fees and other accruals during 2007 (amounts in thousands):
| | | | | | | | | |
| | | Rebates | | Wholesaler
Fees | | Other |
| | | (in thousands) |
Balance at December 31, 2006 | | $ | 630 | | $ | 135 | | $ | 30 |
Provision | | | 15,621 | | | 1,401 | | | 1,122 |
Payments | | | 6,238 | | | 918 | | | 704 |
| | | | | | | | | |
Balance at December 31, 2007 | | $ | 10,013 | | $ | 618 | | $ | 448 |
| | | | | | | | | |
Other Revenues. Other revenues consist of grant revenues and milestone payments for certain product rights which are amortized over the estimated service period. Grant revenue primarily relates to payments on a Belgium research grant. Other revenues in 2007 decreased $0.3 million as compared to 2006 due to primarily to the absence of contract revenue. Other revenues declined $0.9 million for the year ended December 31, 2006 compared to the same period in 2005 due to the timing of a Belgian research grant. We received a new grant in May 2006 from a Belgian governmental agency promoting technology in the Flemish region of Belgium that will pay €1.25 million (approximately $1.8 million) over a three-year period starting in 2006. In 2005, we recorded grant revenue from a similar Belgian governmental agency research grant of $1.1 million.
Cost of Product Revenues.Total cost of product revenues including cost of finished goods, distribution expenses, and amortization expenses related to our commercial products was $3.2 million, or 14% of net product revenues in 2007 as compared with $1.4 million, or 24% of net product revenues in 2006. The decrease in the cost to revenue ratio was a result of both higher net prices and lower per unit fixed expenses partially offset by a one time $0.6 million charge related to an international manufacturing commitment. Total cost of product revenues for year ended December 31, 2006 increased $0.9 million to $1.4 million or 24% of net product revenues compared to the same period in 2005 due to higher sales volumes, primarily from Vusion, and the recording of a $0.2 million allowance for inventory obsolescence in Europe. Cost of product revenue totaled $0.5 million for the year ended December 31, 2005. In the first quarter of 2005, we acquired the U.S. and Canadian rights to Solagé, and are amortizing the remaining intangible asset over the expected patent life. Amortization expense related to the product rights for the acquisition of Solagé was $351,000, $351,000 and $320,000 for 2007, 2006 and 2005, respectively. We expect that our gross margin as a percentage of net sales will fluctuate based on the relative mix of our various products sales.
| | | | | | | | | | | | |
| | | Year ended December 31, | |
| | | 2007 | | | 2006 | | | 2005 | |
| | | (in thousands) | |
Cost of product revenue | | | | | | | | | | | | |
Manufacturing costs | | $ | 2,527 | | | $ | 898 | | | $ | 121 | |
Distribution costs | | | 314 | | | | 182 | | | | 103 | |
Amortization of product rights | | | 351 | | | | 351 | | | | 320 | |
| | | | | | | | | | | | |
Total cost of product revenue | | $ | 3,192 | | | $ | 1,431 | | | $ | 544 | |
| | | |
Percentage of net product revenue | | | 14 | % | | | 24 | % | | | 69 | % |
Research and Development Expenses. Total research and development expenses for 2007 of $27.9 million were $2.0 million, or 8%, higher than 2006. Total research and development expenses for 2006 of $25.9 million were $4.5 million, or 15%, lower than 2005.
57
Below is a summary of our research and development expenses:
| | | | | | | | | | | | | | | | | | |
| | | Year ending December 31 | |
| | | 2007 | | % of
Total | | | 2006 | | % of
Total | | | 2005 | | % of
Total | |
| | | (in thousands) | |
Marketed products | | $ | 2,501 | | 9 | % | | $ | 2,567 | | 10 | % | | $ | 6,280 | | 21 | % |
Hyphanox | | | 9,213 | | 33 | % | | | 2,576 | | 10 | % | | | 4,992 | | 16 | % |
Rambazole | | | 3,333 | | 12 | % | | | 5,207 | | 20 | % | | | 3,444 | | 11 | % |
Pramiconazole | | | 2,268 | | 8 | % | | | 2,987 | | 12 | % | | | 3,130 | | 11 | % |
Liarozole | | | 618 | | 2 | % | | | 2,137 | | 8 | % | | | 1,275 | | 4 | % |
Other clinical/pre-clinical stage products | | | 894 | | 3 | % | | | 810 | | 3 | % | | | 1,640 | | 5 | % |
Internal expenses | | | 8,345 | | 30 | % | | | 8,200 | | 32 | % | | | 9,608 | | 32 | % |
Stock based compensation | | | 728 | | 3 | % | | | 1,411 | | 5 | % | | | n/a | | | |
| | | | | | | | | | | | | | | | | | |
Total research and development expenses | | $ | 27,900 | | 100 | % | | $ | 25,895 | | 100 | % | | $ | 30,369 | | 100 | % |
| | | | | | | | | | | | | | | | | | |
In the preceding table, research and development expenses are set forth in the following eight categories:
| | • | | Marketed Products—Expenses for the year ending December 31, 2007 remained constant compared to the year ending December 31, 2006, as lower spending for Xolegel and Solagé was offset by higher Vusion expenses. Most of the decrease related to Xolegel expenses in 2006 included stability and manufacturing expenses which related to our commercial launch and post approval commitments offset by higher spending relating to the Vusion Phase 4 Resistance Study. Expenses for the year ending December 31, 2006 decreased $3.7 million compared to the year ending December 31, 2005, mostly related to the absence in 2006 of the Xolegel long-term safety study and other regulatory filing and preparation expenses for both Xolegel and Vusion in 2005. |
| | • | | Hyphanox— Expenses for the year ending December 31, 2007 increased $6.6 million compared to the year ending December 31, 2006. The Phase 3 clinical study in toenail onychomycosis was ongoing throughout the year, began enrollment in Q3 2006, and completed enrollment in September 2007. In 2006 the expenses realized for this study were related to study and site start up fees as well as supporting initial enrollment. Expenses for the year ending December 31, 2006 decreased $2.4 million compared to the year ending December 31, 2005 primarily due to the completion in mid 2005 of the Phase 3 clinical trial in vulvovaginal candidiasis, (VVC). Our expenses for Hyphanox for 2005 are related to the completion of the VVC trial, supportive pharmacokinetics studies, and set-up expenses for the Phase 3 clinical trial for the treatment of toenail onychomycosis. |
| | • | | Rambazole—Expenses for year ending December 31, 2007 decreased $1.9 million compared to the year ending December 31, 2006 primarily due to the completion of our Phase 2b study in psoriasis. Expenses for the year ending December 31, 2006 increased $1.8 million compared to year ending December 31, 2005, primarily due to expenses realized from the commencement of the Phase 2b study in psoriasis, the ongoing manufacturing development, and the conduct of pre-clinical studies. |
| | • | | Pramiconazole—Expenses for the year ending December 31, 2007 decreased $0.7 million compared to the year ending December 31, 2006 primarily due to the decrease in Pharmaceutical Development expenses in 2007 offset partially by expenses related to the Phase 1 dose escalation study and the Phase 2a study in onychomycosis. Expenses for the year ending December 31, 2006 decreased $0.1 million compared to year ending December 31, 2005. This was a result of lowered manufacturing development expenses offset by increased clinical expenses related to the Phase 2b study in pityriasis (tinea) versicolor. |
| | • | | Liarozole—Expenses for the year ending 2007 decreased $1.5 million compared to year ending December 31, 2006 due to the completion of our Phase 2/3 trial for the treatment of lamellar ichthyosis in April 2007. We have no plans to further develop this drug. Expenses for the year ending |
58
| | December 31, 2006 increased $0.9 million compared to year ending December 31, 2005, primarily due to conduct of the Phase 2/3 trial for the treatment of lamellar ichthyosis in 2006, offset partially by lower manufacturing and pre-clinical expenses in 2006. |
| | • | | Other pre-clinical/clinical stage products—These expenses generally encompass direct expenses relating to the development of our research and preclinical product candidates and the screening of molecules to identify new product candidates. |
| | • | | Internal expenses—Internal research and development expenses, including personnel and related expenses for the year ended December 31, 2007 decreased as compared to the year ending December 31, 2006. Lower overhead and other expenses were partially offset by higher personnel and consulting expenses. Internal expenses for the year ending December 31, 2006 decreased $1.4 million as compared to the corresponding period in 2005. This decrease is primarily due to lower personnel, consulting and related expenses. |
| | • | | Stock based compensation—Stock based compensation for 2007 was $0.7 million in 2007 compared to $1.4 million in 2006. The decrease in stock compensation expense is partially due to an adjustment recorded in the fourth quarter of 2007 related to forfeitures and a decrease in the fair value of our common stock. |
We expect that our research and development expenses will be slightly lower in 2008 compared to 2007, within the range of $24 million to $26 million. We plan to complete our ongoing Hyphanox phase 3 study in onychomychosis as well as continue our efforts for other pipeline candidates. We are actively seeking partnership opportunities for our Pramiconazole product candidate to accelerate development and offset expenses.
Selling, General and Administrative expense. Total selling, general and administrative expenses for 2007 of $49.6 million were $13.8 million, or 39% higher than 2006. Total selling, general and administrative expenses for 2006 of $35.8 million were $15.5 million, or 77% higher compared to 2005.
| | | | | | | | | | | | | | | | | | |
| | | Year ended December 31, | |
| | | 2007 | | % of
Total | | | 2006 | | % of
Total | | | 2005 | | % of
Total | |
| | | (in thousands) | |
Selling, general and administrative | | | | | | | | | | | | | | | | | | |
Selling expenses | | $ | 15,541 | | 31 | % | | $ | 11,210 | | 32 | % | | $ | 2,686 | | 13 | % |
Commercial infrastructure, marketing and market research expenses | | | 22,109 | | 44 | % | | | 12,817 | | 36 | % | | | 9,158 | | 45 | % |
Corporate administrative expenses | | | 8,133 | | 17 | % | | | 7,909 | | 22 | % | | | 8,436 | | 42 | % |
Stock based compensation expense | | | 3,847 | | 8 | % | | | 3,859 | | 10 | % | | | — | | | |
| | | | | | | | | | | | | | | | | | |
Total selling, general and administrative expenses | | $ | 49,630 | | 100 | % | | $ | 35,795 | | 100 | % | | $ | 20,280 | | 100 | % |
| | | | | | | | | | | | | | | | | | |
Selling expenses—Additional expenses related to the expansion of our U.S. sales force of $2.7 million along with $1.6 million of expenses related to our third party co-promotion services for Vusion accounted for the increase in 2007 selling expenses as compared to 2006. The expansion of our U.S. sales force from 21 to 60 sales associates in the second quarter of 2006 accounted for $8.5 million of the increase in 2006 expenses as compared to the same period in 2005.
Commercial infrastructure, marketing and market research expenses—Commercial expenses increased $9.3 million in 2007 as compared to 2006 primarily due to our investment in the commercial launches of Vusion and Xolegel, including our direct to consumer campaign for Vusion and our sampling programs. Commercial expenses increased $3.7 million in 2006 primarily due to higher brand marketing and market research expenses compared to the same period in 2005. This increase is related to costs for the launch of Vusion and Xolegel, and support of our other commercial products in the U.S., Canada and Europe.
59
Corporate general and administrative expenses of $8.1 million for 2007 remained relatively flat as compared to 2006. Corporate general and administrative expenses totaled $7.9 million for 2006, which represents a decrease of $0.5 million compared to the same period in 2005.
In 2007 and 2006 we recorded $3.8 million and $3.9 million, respectively, of stock based compensation expense in selling, general and administrative expenses.
We expect selling, general and administrative costs to increase in 2008 compared to 2007, within the range of $54 million to $56 million, as we continue to increase our commercial efforts in support of Vusion and Xolegel. In addition, if we were to acquire or in-license other products, we would then incur sales and marketing costs related to such products.
Interest Income, net of interest expense. Interest income, net of interest expense, totaled $1.9 million for 2007 declined by $1.1 million as lower average balances more than offset higher interest rates. Interest income, net of interest expense, totaled $3.0 million for 2006, and was comparable to $2.9 million for 2005.
Income Taxes. The income tax benefit of $1.1 million in 2007 increased $0.4 million from 2006. The income tax benefit of $0.7 million in 2006 increased $0.1 million from 2005. Income tax benefits in all three years represent the net proceeds from the sale of a portion of unused prior years’ New Jersey State net operating loss carryforwards.
Liquidity and Capital Resources
Sources of Liquidity. Since our inception, we have funded our operations principally from issuances of convertible preferred stock, the proceeds from our initial public offering of common stock, our follow-on public offering of common stock and a registered direct offering. In our most recent follow-on public offering in September 2007, we issued and sold, through a registered direct offering, approximately 5.5 million shares of our common stock for net proceeds of approximately $29.4 million. Prior to that we raised net proceeds of approximately $24.0 million from our follow-on public offering in September 2006, $36.0 million from our follow-on public offering in February 2005 and $67.9 million from our initial public offering in May 2004. Through all of these offerings we have raised an aggregate net cash proceeds of approximately $157.3 million. We have an equipment financing agreement with a third party for up to $1.5 million with an interest rate of 6.15%, plus the three year Treasury Constant Maturities rate at the time of funding. Each time we received funding, we entered into a promissory note with a term of 3 years, secured by the related fixed assets. As of December 31, 2007, the line is closed for further drawdowns.
In June 2007, we entered into a $12 million senior secured credit facility to finance ongoing working capital requirements of our commercial operations. We will make regular borrowings and payments each month against the credit facility and consider the outstanding amounts to be short-term in nature. Credit available under the three-year revolving loan facility will be a percentage of our accounts receivable due from third-parties plus a percentage of inventory, with an interest rate equal to the one-month LIBOR rate at draw plus 300 basis points margin and 100 basis points collateral fee. We will also pay a 1% commitment fee of the line on the first anniversary of the closing date. Total fees of $0.2 million are being amortized to interest expense over the three-year term of the credit facility. We issued no stock warrants or other dilutive securities in conjunction with the creation of the credit facility. At December 31, 2007, we had outstanding borrowings under the facility of approximately $8.5 million.
Cash, cash equivalents and investments at December 31, 2007 were $48.5 million, representing 72% of total assets, down from $58.9 million, representing 88% of total assets, at December 31, 2006.
Cash Flows. At December 31, 2007 we had $18.9 million in cash and cash equivalents, as compared to $11.1 million at December 31, 2006. Our major uses of cash in 2007 include $48.2 million of cash used in operations, partially offset by $18.1 million cash provided by investing activities and $38.0 million in cash
60
provided by financing activities. At December 31, 2006 we had $11.1 million in cash and cash equivalents, as compared to $16.9 million at December 31, 2005. Our major uses of cash in 2006 include $43.3 million of cash used in operations, partially offset by $13.2 million in cash provided by investing activities and $24.3 million in cash provided by financing activities. Cash used in operations for both periods mostly related to research and development spending and the investment in the commercial launches of two new products in the United States including the expansion of our sales force from 21 to 60 territories.
The change in cash and cash equivalents is as follows:
| | | | | | | | | | | | |
| | | Year ended December 31, | |
| | | 2007 | | | 2006 | | | 2005 | |
| | | (in thousands) | |
Net cash used in operating activities | | $ | (48,224 | ) | | $ | (43,307 | ) | | $ | (44,238 | ) |
Net cash provided by investing activities | | | 18,098 | | | | 13,198 | | | | 12,550 | |
Net cash provided by financing activities | | | 38,011 | | | | 24,263 | | | | 36,703 | |
Effect of exchange rate changes on cash and cash equivalents | | | (51 | ) | | | 16 | | | | (32 | ) |
| | | | | | | | | | | | |
Net increase (decrease) in cash and cash equivalents | | $ | 7,834 | | | $ | (5,830 | ) | | $ | 4,983 | |
| | | | | | | | | | | | |
Working capital, which is calculated as current assets less current liabilities, decreased $19.0 million to $31.0 million at December 31, 2007 compared to $50.1 million at December 31, 2006 primarily due to a net decrease in cash and marketable securities balances of $10.4 million, an $11.7 million increase in accounts payable and accrued expenses, and an $8.4 million increase in current notes payable which were partially offset by a $9.9 million increase in trade receivables and a $1.5 million increase in prepaids and other assets. The increase in accounts payable and accrued expenses primarily relates to revenue related accruals including Medicaid rebates, wholesaler fees and coupon rebates along with promotional expenses. The increase in notes payable relates to our borrowings under our $12 million senior secured credit facility. Receivables increases were directly attributable to our net product revenue growth in 2007.
Net Cash Used in Operating Activities.Cash used in operating activities for 2007 was $48.2 million, mostly related to spending on research and development, investment in commercial operations, and corporate administration. In addition, we had an increase of $11.7 million in our accounts payable and accrued liabilities accounts since year-end 2006 reflecting higher revenue related accruals including Medicaid rebates, wholesaler fees and coupon rebates and commercial liabilities associated with our expanded sales organization, third party co-promotion agreement and marketing costs associated with our Vusion and Xolegel products. This favorable cash item was offset by $11.4 million of additional cash usage related to higher accounts receivable and prepaid expenses mostly associated with our expanded commercial infrastructure.
Net Cash Provided By Investing Activities.Cash provided by investing activities for the year ended December 31, 2007 was $18.1 million. This was primarily attributable to $18.3 million of net proceeds from sales and maturities of marketable securities transactions. Our investing activities reflect investments in marketable securities, purchase of product rights and purchases of fixed assets necessary for operations. We plan to continue utilizing third parties to manufacture our products and to conduct laboratory-based research. Therefore, we do not expect to make significant capital expenditures for the foreseeable future.
Net Cash Provided By Financing Activities.Net cash provided by financing activities for the year ended December 31, 2007 was $38.0 million, primarily related to proceeds from a registered direct offering in September 2007 with net proceeds of approximately $29.4 million and $8.5 million in borrowings under the revolving credit facility offset in part by repayment of notes payable.
We expect that our existing cash at December 31, 2007 will be sufficient to fund our anticipated operating expenses, debt obligations and capital requirements for at least the next 12 months. We currently have no additional commitments or arrangements for any additional financing to fund the commercialization of our
61
marketed products and the research, development and commercial launch of our product candidates. We may require additional funding in order to continue our commercialization efforts and our research and development programs, including preclinical studies and clinical trials of our product candidates, pursue regulatory approvals for our product candidates, pursue the commercial launch of our product candidates, expand our sales and marketing capabilities and for general corporate purposes. Our future capital requirements will depend on many factors, including:
| | • | | the success of our development and commercialization of our product candidates; |
| | • | | the scope and results of our clinical trials; |
| | • | | advancement of other product candidates into clinical development; |
| | • | | potential acquisition or in-licensing of other products or technologies; |
| | • | | the timing of, and the costs involved in, obtaining regulatory approvals; |
| | • | | the costs of manufacturing activities; and |
| | • | | the costs of commercialization activities, including product marketing, sales and distribution and related working capital needs. |
Commitments
The following table summarizes our material commitments as of December 31, 2007:
| | | | | | | | | | | | |
(in thousands) Commitments | | Total | | Less
than one
year | | One to
Three
Years | | After
Three
Years |
Notes payable | | $ | 8,815 | | $ | 8,711 | | $ | 104 | | $ | — |
Operating lease obligations | | | 1,767 | | | 636 | | | 1,131 | | | — |
Other commitments(a) | | | 36,123 | | | 30,024 | | | 5,510 | | | 589 |
| | | | | | | | | | | | |
Total | | $ | 46,705 | | $ | 39,371 | | $ | 6,745 | | $ | 589 |
| | | | | | | | | | | | |
| (a) | The other commitments reflected in the table include obligations to purchase product and product candidate materials contingent on the delivery of the materials and to fund various clinical trials contingent on the performance of services. These obligations also include long-term obligations, including milestone payments that may arise under agreements that we may terminate prior to the milestone payments being due. The table excludes contingent royalty payments that we may be obligated to pay in the future. |
62
| ITEM 7A. | QUANTITATIVE AND QUALITATIVE DISCLOSURES ABOUT MARKET RISKS |
The recent decline in the market value of certain securities backed by residential mortgage loans has led to a large liquidity crisis effecting the broader U.S. housing market, the financial services industry and global financial markets. Investors in many industry sectors have experienced substantial decreases in asset valuations and uncertain market liquidity. Furthermore, credit rating authorities have, in many cases, been slow to respond to the rapid changes in the underlying value of certain securities and pervasive market illiquidity, regarding these securities.
As a result, this “credit crisis” may have a potential impact on the determination of the fair value of financial instruments or possibly require impairments in the future should the value of certain investments suffer a decline in value which is determined to be other than temporary. We currently do not believe that any change in the market value of our money market funds to be material or warrant a determination of an other than temporary write down.
Most of our transactions are conducted in United States dollars although we do have some agreements with vendors located outside the United States. Transactions under some of these agreements are conducted in United States dollars, subject to adjustment based on significant fluctuations in currency exchange rates. Transactions under other of these agreements are conducted in the local foreign currency. We have a wholly-owned subsidiary, Barrier Therapeutics, N.V., which is located in Geel, Belgium and a wholly owned subsidiary, Barrier Therapeutics Canada Inc., which is located in Toronto, Canada. Except for funding being received under our grant from a Belgian governmental agency which is denominated in Euros, and locally earned interest income, all research costs incurred by Barrier Therapeutics, N.V. are funded under a service agreement with Barrier Therapeutics, Inc. from investments denominated in dollars. Our Canadian subsidiary, Barrier Therapeutics Canada, Inc. became operational in the third quarter of 2005. We ceased commercial operations in Canada during 2007. Any continuing funding for these operations will also come from investments denominated in dollars. Therefore, we are subject to currency fluctuations and exchange rate gains and losses on these transactions. If the exchange rate undergoes a change of 10%, we do not believe that it would have a material impact on our results of operations or cash flows.
| ITEM 8. | FINANCIAL STATEMENTS AND SUPPLEMENTARY DATA |
Our financial statements are annexed to this Annual Report on Form 10-K beginning on page F-1.
| ITEM 9. | CHANGES IN AND DISAGREEMENTS WITH ACCOUNTANTS ON ACCOUNTING AND FINANCIAL DISCLOSURE |
None.
63
| ITEM 9A. | CONTROLS AND PROCEDURES |
Evaluation of Disclosure Controls and Procedures
Management, with the participation of our Chief Executive Officer and Chief Financial Officer, evaluated the effectiveness of our disclosure controls and procedures as of the end of the period covered by this report. Based on that evaluation, the Chief Executive Officer and Chief Financial Officer concluded that our disclosure controls and procedures as of the end of the period covered by this report are functioning effectively to provide reasonable assurance that the information required to be disclosed by us in reports filed under the Securities Exchange Act of 1934 is recorded, processed, summarized and reported within the time periods specified in the SEC’s rules and forms. A controls system, no matter how well designed and operated, cannot provide absolute assurance that the objectives of the controls system are met, and no evaluation of controls can provide absolute assurance that all control issues and instances of fraud, if any, within a company have been detected.
Management’s Annual Report on Internal Control Over Financial Reporting
Our management is responsible for establishing and maintaining adequate internal control over financial reporting. Internal control over financial reporting is defined in Rule 13a-15(f) and 15d-15(f) promulgated under the Securities Exchange Act of 1934 as a process designed by, or under the supervision of, our principal executive officer, principal financial officer, principal accounting officer, and effected by our board of directors, management and other personnel, to provide reasonable assurance regarding the reliability of financial reporting and the preparation of financial statements for external purposes in accordance with generally accepted accounting principles and includes those policies and procedures that:
| | • | | Pertain to the maintenance of records that in reasonable detail accurately and fairly reflect the transactions and dispositions of our assets; |
| | • | | Provide reasonable assurance that transactions are recorded as necessary to permit preparation of financial statements in accordance with generally accepted accounting principles, and that our receipts and expenditures are being made only in accordance with authorizations of our management and directors; and |
| | • | | Provide reasonable assurance regarding prevention or timely detection of unauthorized acquisition, use or disposition of our assets that could have a material effect on the financial statements. |
Our management assessed the effectiveness of our internal control over financial reporting as of December 31, 2007. In making this assessment, our management used the criteria set forth by the Committee of Sponsoring Organizations of the Treadway Commission (COSO) in Internal Control-Integrated Framework. Based on this assessment, management believes that, as of December 31, 2007, our internal control over financial reporting is effective based on those criteria.
Changes in Internal Control over Financial Reporting
There was no change in our internal control over financial reporting during the quarter ended December 31, 2007, that materially affected, or is reasonably likely to materially affect, our internal control over financial reporting.
64
Report of Independent Registered Public Accounting Firm
The Board of Directors and Stockholders of Barrier Therapeutics, Inc.
We have audited Barrier Therapeutics, Inc.’s internal control over financial reporting as of December 31, 2007, based on criteria established in Internal Control—Integrated Framework issued by the Committee of Sponsoring Organizations of the Treadway Commission (the COSO criteria). Barrier Therapeutics, Inc.’s management is responsible for maintaining effective internal control over financial reporting, and for its assessment of the effectiveness of internal control over financial reporting included in the accompanyingManagement’s Annual Report on Internal Control over Financial Reporting. Our responsibility is to express an opinion on the company’s internal control over financial reporting based on our audit.
We conducted our audit in accordance with the standards of the Public Company Accounting Oversight Board (United States). Those standards require that we plan and perform the audit to obtain reasonable assurance about whether effective internal control over financial reporting was maintained in all material respects. Our audit included obtaining an understanding of internal control over financial reporting, assessing the risk that a material weakness exists, testing and evaluating the design and operating effectiveness of internal control based on the assessed risk, and performing such other procedures as we considered necessary in the circumstances. We believe that our audit provides a reasonable basis for our opinion.
A company’s internal control over financial reporting is a process designed to provide reasonable assurance regarding the reliability of financial reporting and the preparation of financial statements for external purposes in accordance with generally accepted accounting principles. A company’s internal control over financial reporting includes those policies and procedures that (1) pertain to the maintenance of records that, in reasonable detail, accurately and fairly reflect the transactions and dispositions of the assets of the company; (2) provide reasonable assurance that transactions are recorded as necessary to permit preparation of financial statements in accordance with generally accepted accounting principles, and that receipts and expenditures of the company are being made only in accordance with authorizations of management and directors of the company; and (3) provide reasonable assurance regarding prevention or timely detection of unauthorized acquisition, use, or disposition of the company’s assets that could have a material effect on the financial statements.
Because of its inherent limitations, internal control over financial reporting may not prevent or detect misstatements. Also, projections of any evaluation of effectiveness to future periods are subject to the risk that controls may become inadequate because of changes in conditions, or that the degree of compliance with the policies or procedures may deteriorate.
In our opinion, Barrier Therapeutics, Inc. maintained, in all material respects, effective internal control over financial reporting as of December 31, 2007, based on the COSO criteria.
We also have audited, in accordance with the standards of the Public Company Accounting Oversight Board (United States), the consolidated balance sheets of Barrier Therapeutics, Inc. as of December 31, 2007 and 2006, and the related consolidated statements of operations, stockholders’ equity, and cash flows for each of the three years in the period ended December 31, 2007 of Barrier Therapeutics, Inc. and our report dated March 7, 2008 expressed an unqualified opinion thereon.
/s/ Ernst & Young LLP
MetroPark, New Jersey
March 7, 2008
65
| ITEM 9B. | OTHER INFORMATION |
None.
PART III
| ITEM 10. | DIRECTORS, EXECUTIVE OFFICERS AND CORPORATE GOVERNANCE |
The information required by Item 10 is incorporated by reference to the information which shall be included in our definitive proxy statement for the 2008 annual meeting of stockholders.
| ITEM 11. | EXECUTIVE COMPENSATION |
The information required by Item 11 is incorporated by reference to the information which shall be included in our definitive proxy statement for the 2008 annual meeting of stockholders.
| ITEM 12. | SECURITY OWNERSHIP OF CERTAIN BENEFICIAL OWNERS AND MANAGEMENT AND RELATED STOCKHOLDER MATTERS |
The information required by Item 12 is incorporated by reference to the information which shall be included in our definitive proxy statement for the 2008 annual meeting of stockholders.
| ITEM 13. | CERTAIN RELATIONSHIPS, RELATED TRANSACTIONS AND DIRECTOR INDEPENDENCE |
The information required by Item 13 is incorporated by reference to the information which shall be included in our definitive proxy statement for the 2008 annual meeting of stockholders.
| ITEM 14. | PRINCIPAL ACCOUNTANT FEES AND SERVICES |
The information required by Item 14 is incorporated by reference to the information which shall be included in our definitive proxy statement for the 2008 annual meeting of stockholders.
66
PART IV
| ITEM 15. | EXHIBITS AND FINANCIAL STATEMENT SCHEDULES |
| Item 1B. | DOCUMENTS FILED AS PART OF THIS REPORT |
The following is a list of our consolidated financial statements and our subsidiaries and supplementary data included in this report under Item 8 of Part II hereof:
| 1. | FINANCIAL STATEMENTS AND SUPPLEMENTAL DATA |
Report of Independent Registered Public Accounting Firm.
Consolidated Balance Sheets as of December 31, 2007 and 2006.
Consolidated Statements of Operations for the years ended December 31, 2007, 2006 and 2005.
Consolidated Statements of Stockholders’ Equity for the three years ended December 31, 2007.
Consolidated Statements of Cash Flows for the years ended December 31, 2007, 2006 and 2005.
Notes to Consolidated Financial Statements.
| 2. | FINANCIAL STATEMENT SCHEDULES |
Schedules are omitted because they are not applicable or are not required, or because the required information is included in the consolidated financial statements or notes thereto.
67
Exhibits
The following is a list of exhibits filed as part of this annual report on Form 10-K. Where so indicated by footnote, exhibits that were previously filed are incorporated by reference. For exhibits incorporated by reference, the location of the exhibit in the previous filing is indicated.
| | |
Exhibit No. | | Description |
| 1.1 | | Underwriting Agreement dated September 14, 2006 entered into by and between the Registrant and Pacific Growth Equities, LLC, filed as Exhibit 1.1 to Form 8-K filed on September 15, 2006 |
| |
| 3.1 | | Amended and Restated Certificate of Incorporation, filed as Exhibit 3.2 to the Company’s Registration Statement on Form S-1 (File No. 333-112539) |
| |
| 3.2 | | Third Amended and Restated Bylaws of the Registrant, filed as Exhibit 3.1 to the Company’s current report on 8-K on December 5, 2007 |
| |
| 4.1 | | Specimen copy of stock certificate for shares of common stock of the Registrant, filed as Exhibit 4.1 to the Company’s Registration Statement on Form S-1 (File No. 333-112539) |
| |
| 4.2 | | Amended and Restated Investors Rights Agreement, dated as of April 20, 2004, by and among the Registrant and the Investors listed therein, filed as Exhibit 4.2 to the Company’s Registration Statement on Form S-1 (File No. 333-112539) |
| |
| 10.1† | | 2002 Equity Compensation Plan, filed as Exhibit 10.1 to the Company’s Registration Statement on Form S-1 (File No. 333-112539) |
| |
| 10.2(1) | | Intellectual Property Transfer and License Agreement, dated as of May 6, 2002, by and between the Registrant and Johnson & Johnson Consumer Companies, Inc., filed as Exhibit 10.2 to the Company’s Registration Statement on Form S-1 (File No. 333-112539) |
| |
| 10.3 | | Amendment No. 1 to the Intellectual Property Transfer and License Agreement dated as of September 7, 2004, by and between Barrier Therapeutics, Inc. and Johnson & Johnson Consumer Companies, Inc., filed as Exhibit 10.1 to the Company’s Current Report on Form 8-K filed on September 10, 2004 |
| |
| 10.4(1) | | Intellectual Property Transfer and License Agreement, dated as of May 6, 2002, by and among the Registrant and Janssen Pharmaceutica Products, L.P. and Ortho-McNeil Pharmaceutical, Inc., filed as Exhibit 10.3 to the Company’s Registration Statement on Form S-1 (File No. 333-112539) |
| |
| 10.5 | | Amendment No. 1 to the Intellectual Property Transfer and License Agreement, dated as of September 7, 2004, by and between Barrier Therapeutics, Inc. and Janssen Pharmaceutica Products, L.P. , filed as Exhibit 10.2 to the Company’s Current Report on Form 8-K filed on September 10, 2004 |
| |
| 10.6† | | Restricted Stock Purchase Agreement, dated as of October 31, 2001, by and between the Registrant and Geert Cauwenbergh, Ph.D., filed as Exhibit 10.7 to the Company’s Registration Statement on Form S-1 (File No. 333-112539) |
| |
| 10.7† | | Amendment No. 1 to Restricted Stock Purchase Agreement, dated as of May 7, 2002, by and between the Registrant and Geert Cauwenbergh, Ph.D., filed as Exhibit 10.8 to the Company’s Registration Statement on Form S-1 (File No. 333-112539) |
| |
| 10.8† | | Amendment No. 2 to Restricted Stock Purchase Agreement, dated as of April 1, 2004, by and between the Registrant and Geert Cauwenbergh, Ph.D., filed as Exhibit 10.18 to the Company’s Registration Statement on Form S-1 (File No. 333-112539) |
| |
| 10.9† | | Restricted Stock Purchase Agreement, dated as of February 20, 2002, by and between the Registrant and Charles Nomides, filed as Exhibit 10.9 to the Company’s Registration Statement on Form S-1 (File No. 333-112539) |
68
| | |
Exhibit No. | | Description |
| 10.10† | | Amendment No. 1 to Restricted Stock Purchase Agreement, dated May 7, 2002, by and between the Registrant and Charles Nomides, filed as Exhibit 10.10 to the Company’s Registration Statement on Form S-1 (File No. 333-112539) |
| |
| 10.11† | | Amendment No. 2 to Restricted Stock Purchase Agreement, dated as of April 1, 2004, by and between the Registrant and Charles Nomides, filed as Exhibit 10.19 to the Company’s Registration Statement on Form S-1 (File No. 333-112539) |
| |
| 10.12† | | Restricted Stock Purchase Agreement, dated as of August 1, 2002, by and between the Registrant and Anne M. VanLent, filed as Exhibit 10.11 to the Company’s Registration Statement on Form S-1 (File No. 333-112539) |
| |
| 10.13† | | Amendment No. 1 to Restricted Stock Purchase Agreement, dated as of April 1, 2004, by and between the Registrant and Anne M. VanLent, filed as Exhibit 10.20 to the Company’s Registration Statement on Form S-1 (File No. 333-112539) |
| |
| 10.14 | | Lease Agreement, dated May 28, 2003, between the Registrant and Peregrine Investment Partners-I relating to property located at 600 College Road East, Princeton Forrestal Center, New Jersey, filed as Exhibit 10.12 to the Company’s Registration Statement on Form S-1 (File No. 333-112539) |
| |
| 10.15 | | Amendment No. 1 dated November 6, 2003, to Lease Agreement, dated May 28, 2003, between the Registrant and Peregrine Investment Partners-I relating to property located at 600 College Road East, Princeton Forrestal Center, New Jersey, filed as Exhibit 10.13 to the Company’s Registration Statement on Form S-1 (File No. 333-112539) |
| |
| 10.16 | | Master Security Agreement, dated as of August 21, 2003 and Amendment, dated as of September 3, 2003, between the Registrant and General Electric Capital Corporation, filed as Exhibit 10.14 to the Company’s Registration Statement on Form S-1 (File No. 333-112539) |
| |
| 10.17(1) | | Development and Supply Agreement, dated as of May 16, 2002, between the Registrant and Abbott GmbH & Co. KG, filed as Exhibit 10.15 to the Company’s Registration Statement on Form S-1 (File No. 333-112539) |
| |
| 10.18† | | 2004 Stock Incentive Plan, filed as Exhibit 10.16 to the Company’s Registration Statement on Form S-1 (File No. 333-112539) |
| |
| 10.19† | | Employee Stock Purchase Plan, filed as Exhibit 10.17 to the Company’s Registration Statement on Form S-1 (File No. 333-112539) |
| |
| 10.20 | | Amendment No. 2 dated May 13, 2004, to Lease Agreement, dated May 28, 2003, between the Registrant and Peregrine Investment Partners-I relating to property located at 600 College Road East, Princeton Forrestal Center, New Jersey, filed as Exhibit 10.1 to the Company’s Quarterly Report on Form 10-Q filed on August 11, 2004. |
| |
| 10.21(1) | | Distribution and License Agreement dated November 4, 2004 between the Registrant and Grupo Ferrer Internacional, S.A., filed as Exhibit 10.1 to the Company’s Current Report on Form 8-K filed on November 9, 2004. |
| |
| 10.22 | | Finished Product Supply Agreement dated July 14, 2004 between the Registrant and Janssen Pharmaceutica, NV, filed as Exhibit 10.25 to the Company’s Amendment No. 1 to the Registration Statement on Form S-1 (File No. 333-122261). |
| |
| 10.23 | | Product Acquisition Agreement dated February 5, 2005 between the Registrant and Moreland Enterprises Limited, filed as Exhibit 10.26 to the Company’s Amendment No. 2 to the Registration Statement on Form S-1 (File No. 333-122261). |
| |
| 10.24 | | Amendment No. 2 to the Intellectual Property Transfer and License Agreement, dated as of May 12, 2005, by and between the Registrant and Janssen Pharmaceutica Products, L.P., filed as Exhibit 10.1 to the Company’s Quarterly Report on Form 10-Q filed on August 11, 2005. |
69
| | |
Exhibit No. | | Description |
| 10.25 | | Scientific Advisory Board Consulting Agreement dated as of August 1, 2005 by and between the Registrant and Carl W. Ehmann, M.D., filed as Exhibit 10.2 to the Company’s Quarterly Report on Form 10-Q filed on August 11, 2005. |
| |
| 10.26 | | Amendment dated as of August 26, 2005 to the Finished Product Supply Agreement by and between the Registrant and Janssen Pharmaceutica, NV, filed as Exhibit 10.1 to the Company’s Quarterly Report on Form 10-Q filed on November 14, 2005. |
| |
| 10.27(1) | | Pharmaceutical Product Supply Agreement dated as of January 27, 2005 by and between the Registrant and DSM Pharmaceuticals, Inc., filed as Exhibit 10.32 to the Company’s Annual Report on Form 10-K on March 12, 2007. |
| |
| 10.28(1) | | Manufacturing Agreement dated as of March 31, 2005 by and between the Registrant and DPT Laboratories, Ltd., filed as Exhibit 10.33 to the Company’s Annual Report on Form 10-K on March 12, 2007. |
| |
| 10.29(1) | | Amendment No. 1 dated December 6, 2005 to Pharmaceutical Product Supply Agreement dated as of January 27, 2005 by and between the Registrant and DSM Pharmaceuticals, Inc., filed as Exhibit 10.34 to the Company’s Annual Report on Form 10-K on March 12, 2007. |
| |
| 10.30† | | Amended and Restated Employment Agreement, dated as of December 6, 2006, by and between the Registrant and Geert Cauwenbergh, Ph.D., filed as Exhibit 10.35 to the Company’s Annual Report on Form 10-K on March 12, 2007. |
| |
| 10.31† | | Amended and Restated Employment Agreement, dated as of December 6, 2006, by and between the Registrant and Charles Nomides, filed as Exhibit 10.36 to the Company’s Annual Report on Form 10-K on March 12, 2007. |
| |
| 10.32† | | Amended and Restated Employment Agreement, dated as of December 6, 2006, by and between the Registrant and Anne M. VanLent, filed as Exhibit 10.37 to the Company’s Annual Report on Form 10-K on March 12, 2007. |
| |
| 10.33† | | Amended and Restated Employment Agreement, dated as of December 6, 2006, by and between the Registrant and Alfred Altomari, filed as Exhibit 10.38 to the Company’s Annual Report on Form 10-K on March 12, 2007. |
| |
| 10.34† | | Amended and Restated Employment Agreement, dated as of April 1, 2004, by and between the Registrant and Albert Bristow, filed as Exhibit 10.39 to the Company’s Annual Report on Form 10-K on March 12, 2007. |
| |
| 10.35 | | Sales Force Services Agreement, dated as of March 2, 2007, by and between the Registrant and Novartis Consumer Health, Inc., filed as Exhibit 10.40 to the Company’s Annual Report on Form 10-K on March 12, 2007. |
| |
| 10.36(1) | | Supply Agreement, dated as of July 12, 2007, by and between the Registrant and Abbott GmbH & Co., KG, filed as Exhibit 10.1 to the Company’s Quarterly Report on Form 10-Q on August 8, 2007. |
| |
| 10.37 | | Credit and Security Agreement, dated as of June 29, 2007, by and between the Registrant and Merrill Lynch Capital, filed as Exhibit 10.2 to the Company’s Quarterly Report on Form 10-Q on August 8, 2007. |
| |
| 10.38 | | Revolving Loan Note, dated as of June 29, 2007, by and between the Registrant and Merrill Lynch Capital, filed as Exhibit 10.3 to the Company’s Quarterly Report on Form 10-Q on August 8, 2007. |
| |
| 10.39 | | Ownership Pledge, Assignment and Security Agreement, dated as of June 29, 2007, by and between the Registrant and Merrill Lynch Capital, filed as Exhibit 10.4 to the Company’s Quarterly Report on Form 10-Q on August 8, 2007. |
70
| | |
Exhibit No. | | Description |
| 10.40† | | Employment Agreement, dated as of May 16, 2007, by and between the Registrant and Dr. Braham Shroot, filed as Exhibit 99.2 to the Company’s current report on Form 8-K on May 16, 2007. |
| |
| 10.41 | | Letter Agreement, dated as of June 14, 2007, by and between the Registrant and Charles T. Nomides, filed as Exhibit 00.1 to the Company’s current report on Form 8-K on June 18, 2007. |
| |
| 10.42 | | Placement Agency Agreement, dated as of September 21, 2007, by and between the Registrant and J.P. Morgan Securities, Inc. filed as Exhibit 1.1 to the Company’s current report on Form 8-K on September 24, 2007. |
| |
| 10.43 | | Engagement Letter, dated as of September 21, 2007, by and between the Registrant and Pacific Growth Equities, LLC, filed as Exhibit 10.1 to the Company’s current report on Form 8-K on September 24, 2007. |
| |
| 10.44*(1) | | Third Party Manufacturing Agreement dated January 8, 2008 by and between the Registrant and Sanico, N.V. |
| |
| *21 | | List of Subsidiaries |
| |
| *23.1 | | Consent of Ernst & Young LLP |
| |
| *31.1 | | Certification of principal executive officer required by Rule 13a-14(a) |
| |
| *31.2 | | Certification of principal financial officer required by Rule 13a-14(a) |
| |
| *31.3 | | Certification of principal accounting officer required by Rule 13a-14(a) |
| |
| ¤32.1 | | Section 1350 Certification of principal executive officer |
| |
| ¤32.2 | | Section 1350 Certification of principal financial officer |
| |
| 32.3 | | Section 1350 Certification of principal accounting officer |
| † | Compensation plans and arrangements for executives and others. |
| (1) | Portions of the Exhibit have been omitted and have been filed separately pursuant to an application for confidential treatment granted by the Securities and Exchange Commission. |
71
SIGNATURES
Pursuant to the requirements of Section 13 or 15(d) of the Securities Exchange Act of 1934, as amended, the registrant has duly caused this report to be signed on its behalf by the undersigned, thereunto duly authorized.
| | | | |
March 12, 2008 | | | | BARRIER THERAPEUTICS, INC. |
| | | | (Registrant) |
| | |
| | By: | | /s/ GEERT CAUWENBERGH |
| | | | Geert Cauwenbergh, Ph.D. Chief Executive Officer (Principal Executive Officer) |
| | |
| | By: | | /s/ ANNE M. VANLENT |
| | | | Anne M. VanLent Executive Vice President, Chief Financial Officer & Treasurer (Principal Financial Officer) |
| | |
| | By: | | /s/ DENNIS P. REILLY |
| | | | Dennis P. Reilly Vice President Finance (Principal Accounting Officer) |
72
POWER OF ATTORNEY
Pursuant to the requirements of the Securities Act of 1934, as amended, this report has been signed below by the following persons on behalf of the registrant and in the capacities and on the dates indicated. Each person whose signature appears below in so signing also makes, constitutes and appoints Geert Cauwenbergh, Ph.D. and Anne M. VanLent and each of them acting alone, his or her true and lawful attorney-in-fact and agent, with full power of substitution and resubstitution, for him or her and in his or her name, place and stead, in any and all capacities, to execute and cause to be filed with the Securities and Exchange Commission any and all amendments to this Annual Report on Form 10-K, and to file the same, with all exhibits thereto and other documents in connection therewith, and hereby ratifies and confirms all that said attorney-in-fact or his substitute or substitutes may do or cause to be done by virtue hereof.
| | | | |
Signature | | Title | | Date |
/s/ GEERT CAUWENBERGH Geert Cauwenbergh, Ph.D. | | Chief Executive Officer (Principal Executive Officer) | | March 12, 2008 |
| | |
| | |
/s/ ANNE M. VANLENT Anne M. VanLent | | Executive Vice President, Chief Financial Officer and Treasurer (Principal Financial Officer) | | March 12, 2008 |
| | |
| | |
/s/ DENNIS P. REILLY Dennis P. Reilly | | Vice President Finance (Principal Accounting Officer) | | March 12, 2008 |
| | |
| | |
/s/ ALFRED ALTOMARI Alfred Altomari | | Director | | March 12, 2008 |
| | |
| | |
/s/ SRINIVAS AKKARAJU Srinivas Akkaraju, M.D., Ph.D. | | Director | | March 12, 2008 |
| | |
| | |
/s/ ROBERT CAMPBELL Robert Campbell | | Director | | March 12, 2008 |
| | |
| | |
/s/ CARL EHMANN Carl Ehmann, M.D. | | Director | | March 12, 2008 |
| | |
| | |
/s/ EDWARD L. ERICKSON Edward L. Erickson | | Director | | March 12, 2008 |
| �� | |
| | |
/s/ PETER ERNSTER Peter Ernster | | Chairman | | March 12, 2008 |
| | |
| | |
/s/ CHARLES F. JACEY, JR. Charles F. Jacey, Jr. | | Director | | March 12, 2008 |
| | |
| | |
/s/ CAROL RAPHAEL Carol Raphael | | Director | | March 12, 2008 |
| | |
73
BARRIER THERAPEUTICS, INC.
INDEX TO CONSOLIDATED FINANCIAL STATEMENTS
F-1
BARRIER THERAPEUTICS, INC.
REPORT OF INDEPENDENT REGISTERED PUBLIC ACCOUNTING FIRM
The Board of Directors and Stockholders
Barrier Therapeutics, Inc.
We have audited the accompanying consolidated balance sheets of Barrier Therapeutics, Inc. as of December 31, 2007 and 2006, and the related consolidated statements of operations, stockholders’ equity, and cash flows for each of the three years in the period ended December 31, 2007. Our audits also included the financial statement schedule included in Item15(a)(2). These financial statements and schedule are the responsibility of the Company’s management. Our responsibility is to express an opinion on these financial statements and schedule based on our audits.
We conducted our audits in accordance with the standards of the Public Company Accounting Oversight Board (United States). Those standards require that we plan and perform the audit to obtain reasonable assurance about whether the financial statements are free of material misstatement. An audit includes examining, on a test basis, evidence supporting the amounts and disclosures in the financial statements. An audit also includes assessing the accounting principles used and significant estimates made by management, as well as evaluating the overall financial statement presentation. We believe that our audits provide a reasonable basis for our opinion.
In our opinion, the financial statements referred to above present fairly, in all material respects, the consolidated financial position of Barrier Therapeutics, Inc. at December 31, 2007 and 2006, and the consolidated results of its operations and its cash flows for each of the three years in the period ended December 31, 2007, in conformity with US generally accepted accounting principles. Also, in our opinion, the related financial statement schedule, when considered in relation to the basic financial statements taken as a whole, presents fairly, in all material respects, the information set forth therein.
As discussed in Note 2 to the financial statements, effective January 1, 2006, the Company adopted SFAS No. 123(R), “Share-Based Payments” using the prospective method of adoption.
We also have audited, in accordance with the standards of the Public Company Accounting Oversight Board (United States), Barrier Therapeutics, Inc.’s internal control over financial reporting as of December 31, 2007, based on criteria established inInternal Control-Integrated Framework issued by the Committee of Sponsoring Organizations of the Treadway Commission and our report dated March 7, 2008 expressed an unqualified opinion thereon.
/s/ Ernst & Young LLP
MetroPark, New Jersey
March 7, 2008
F-2
BARRIER THERAPEUTICS, INC.
CONSOLIDATED BALANCE SHEETS
| | | | | | | | |
| | | Year Ended December 31, | |
| | | 2007 | | | 2006 | |
| | | (Dollars, In Thousands) | |
Assets | | | | | | | | |
Current assets: | | | | | | | | |
Cash and cash equivalents | | $ | 18,895 | | | $ | 11,061 | |
Marketable securities | | | 29,568 | | | | 47,823 | |
Receivables, net of allowances of $262 and $49, respectively | | | 11,792 | | | | 1,892 | |
Finished goods inventories, net | | | 793 | | | | 1,179 | |
Prepaid expenses and other current assets | | | 3,381 | | | | 1,842 | |
| | | | | | | | |
Total current assets | | | 64,429 | | | | 63,797 | |
Property and equipment, net | | | 659 | | | | 873 | |
Product rights, net | | | 2,078 | | | | 2,429 | |
Other assets | | | 250 | | | | 135 | |
| | | | | | | | |
Total assets | | $ | 67,416 | | | $ | 67,234 | |
| | | | | | | | |
Liabilities and stockholders’ equity | | | | | | | | |
Current liabilities: | | | | | | | | |
Notes payable, current portion | | $ | 8,711 | | | $ | 345 | |
Accounts payable | | | 7,864 | | | | 5,618 | |
Accrued expenses | | | 16,802 | | | | 7,339 | |
Deferred revenue | | | — | | | | 430 | |
Other current liabilities | | | 17 | | | | 9 | |
| | | | | | | | |
Total current liabilities | | | 33,394 | | | | 13,741 | |
Notes payable, long-term portion | | | 104 | | | | 280 | |
Commitments and contingencies | | | — | | | | — | |
Stockholders’ equity: | | | | | | | | |
Common stock, $.0001 par value; 80,000,000 authorized, 34,997,292 issued and outstanding at December 31, 2007; and 29,197,974 issued and outstanding at December 31, 2006 | | | 3 | | | | 3 | |
Additional paid-in capital | | | 292,044 | | | | 257,649 | |
Accumulated deficit | | | (257,850 | ) | | | (204,158 | ) |
Accumulated other comprehensive loss | | | (279 | ) | | | (281 | ) |
| | | | | | | | |
Total stockholders’ equity | | | 33,918 | | | | 53,213 | |
| | | | | | | | |
Total liabilities and stockholders’ equity | | $ | 67,416 | | | $ | 67,234 | |
| | | | | | | | |
See accompanying Notes to Consolidated Financial Statements
F-3
BARRIER THERAPEUTICS, INC.
CONSOLIDATED STATEMENTS OF OPERATIONS
| | | | | | | | | | | | |
| | | Year Ended December 31, | |
| | | 2007 | | | 2006 | | | 2005 | |
| | | (In Thousands, except share and per-share amounts) | |
Revenues: | | | | | | | | | | | | |
Net product revenue | | $ | 23,519 | | | $ | 5,853 | | | $ | 792 | |
Other revenue | | | 563 | | | | 885 | | | | 1,748 | |
| | | | | | | | | | | | |
Total net revenue | | | 24,082 | | | | 6,738 | | | | 2,540 | |
| | | | | | | | | | | | |
Costs and Expenses: | | | | | | | | | | | | |
Cost of product revenues | | | 3,192 | | | | 1,431 | | | | 544 | |
Research and development | | | 27,900 | | | | 25,895 | | | | 30,369 | |
Selling, general and administrative | | | 49,630 | | | | 35,795 | | | | 20,280 | |
| | | | | | | | | | | | |
Total operating expenses | | | 80,722 | | | | 63,121 | | | | 51,193 | |
| | | | | | | | | | | | |
Loss from operations | | | (56,640 | ) | | | (56,383 | ) | | | (48,653 | ) |
Interest income | | | 2,127 | | | | 3,015 | | | | 2,929 | |
Interest expense | | | (229 | ) | | | (61 | ) | | | (53 | ) |
| | | | | | | | | | | | |
Loss before income tax benefit and cumulative effect of change in accounting principle | | | (54,742 | ) | | | (53,429 | ) | | | (45,777 | ) |
Income tax benefit | | | 1,050 | | | | 655 | | | | 536 | |
| | | | | | | | | | | | |
Net loss before cumulative effect of change in accounting principle | | | (53,692 | ) | | | (52,774 | ) | | | (45,241 | ) |
Cumulative effect of change in accounting principle | | | — | | | | 57 | | | | — | |
| | | | | | | | | | | | |
Net loss | | $ | (53,692 | ) | | $ | (52,717 | ) | | $ | (45,241 | ) |
| | | | | | | | | | | | |
Basic and diluted net loss per share before and after cumulative effect of change in accounting principle | | $ | (1.74 | ) | | $ | (2.06 | ) | | $ | (1.91 | ) |
Weighted-average shares outstanding—basic and diluted | | | 30,862,594 | | | | 25,583,259 | | | | 23,656,306 | |
See accompanying Notes to Consolidated Financial Statements
F-4
BARRIER THERAPEUTICS, INC.
CONSOLIDATED STATEMENTS OF STOCKHOLDERS’ EQUITY
| | | | | | | | | | | | | | | | | | | | | | | | | |
| | | Common stock | | Additional
Paid-in
Capital | | | Accumulated
Deficit | | | Deferred
Compensation | | | Accumulated
Other
Comprehensive
Loss | | | Total
Stockholders’
Equity | |
| | | Shares | | Amount | | | | | |
| | | (In Thousands, except share amounts) | |
Balance at December 31, 2004 | | 21,894,830 | | | 2 | | | 191,568 | | | | (106,200 | ) | | | (1,510 | ) | | | (290 | ) | | | 83,570 | |
Net loss | | | | | | | | | | | | (45,241 | ) | | | | | | | | | | | (45,241 | ) |
Unrealized gain on available for sale securities | | | | | | | | | | | | | | | | | | | | 64 | | | | 64 | |
Foreign currency translation loss | | | | | | | | | | | | | | | | | | | | (27 | ) | | | (27 | ) |
| | | | | | | | | | | | | | | | | | | | | | | | | |
Total comprehensive loss | | | | | | | | | | | | | | | | | | | | | | | | (45,204 | ) |
| | | | | | | | | | | | | | | | | | | | | | | | | |
Issuance of common stock | | 2,000,000 | | | — | | | 36,043 | | | | | | | | | | | | | | | | 36,043 | |
Stock issued upon exercise of stock options | | 183,521 | | | — | | | 430 | | | | | | | | | | | | | | | | 430 | |
Stock issued under employee stock purchase plan | | 17,524 | | | — | | | 150 | | | | | | | | | | | | | | | | 150 | |
Compensation expense related to options issued to non-employees | | | | | | | | 378 | | | | | | | | | | | | | | | | 378 | |
Restricted stock no longer subject to repurchase | | | | | | | | 10 | | | | | | | | | | | | | | | | 10 | |
Amortization of deferred compensation | | | | | | | | | | | | | | | | 889 | | | | | | | | 889 | |
Reversal of deferred compensation due to employee terminations | | | | | | | | (89 | ) | | | | | | | 89 | | | | | | | | — | |
| | | | | | | | | | | | | | | | | | | | | | | | | |
Balance at December 31, 2005 | | 24,095,875 | | $ | 2 | | $ | 228,490 | | | $ | (151,441 | ) | | $ | (532 | ) | | $ | (253 | ) | | $ | 76,266 | |
| | | | | | | | | | | | | | | | | | | | | | | | | |
Net loss | | | | | | | | | | | | (52,717 | ) | | | | | | | | | | | (52,717 | ) |
Unrealized gain on available for sale securities | | | | | | | | | | | | | | | | | | | | 143 | | | | 143 | |
Foreign currency translation loss | | | | | | | | | | | | | | | | | | | | (171 | ) | | | (171 | ) |
| | | | | | | | | | | | | | | | | | | | | | | | | |
Total comprehensive loss | | | | | | | | | | | | | | | | | | | | | | | | (52,745 | ) |
| | | | | | | | | | | | | | | | | | | | | | | | | |
Issuance of common stock | | 4,820,000 | | | 1 | | | 23,997 | | | | | | | | | | | | | | | | 23,998 | |
Stock issued upon exercise of stock options | | 73,778 | | | — | | | 120 | | | | | | | | | | | | | | | | 120 | |
Stock issued under employee stock purchase plan | | 50,406 | | | — | | | 304 | | | | | | | | | | | | | | | | 304 | |
Elimination of Deferred Compensation as a result of adoption of FAS 123R | | | | | | | | (532 | ) | | | | | | | 532 | | | | | | | | — | |
Stock based compensation | | 157,915 | | | — | | | 5,270 | | | | | | | | | | | | | | | | 5,270 | |
| | | | | | | | | | | | | | | | | | | | | | | | | |
Balance at December 31, 2006 | | 29,197,974 | | $ | 3 | | $ | 257,649 | | | $ | (204,158 | ) | | $ | — | | | $ | (281 | ) | | $ | 53,213 | |
| | | | | | | | | | | | | | | | | | | | | | | | | |
Net loss | | | | | | | | | | | | (53,692 | ) | | | | | | | | | | | (53,692 | ) |
Unrealized gain on available for sale securities | | | | | | | | | | | | | | | | | | | | 53 | | | | 53 | |
Foreign currency translation loss | | | | | | | | | | | | | | | | | | | | (51 | ) | | | (51 | ) |
| | | | | | | | | | | | | | | | | | | | | | | | | |
Total comprehensive loss | | | | | | | | | | | | | | | | | | | | | | | | (53,690 | ) |
| | | | | | | | | | | | | | | | | | | | | | | | | |
Issuance of common stock | | 5,547,870 | | | — | | | 29,441 | | | | | | | | | | | | | | | | 29,441 | |
Stock issued upon exercise of stock options | | 123,088 | | | — | | | 123 | | | | | | | | | | | | | | | | 123 | |
Stock issued under employee stock purchase plan | | 46,412 | | | — | | | 257 | | | | | | | | | | | | | | | | 257 | |
Stock based compensation | | 81,948 | | | — | | | 4,574 | | | | | | | | | | | | | | | | 4,574 | |
| | | | | | | | | | | | | | | | | | | | | | | | | |
Balance at December 31, 2007 | | 34,997,292 | | $ | 3 | | $ | 292,044 | | | $ | (257,850 | ) | | $ | — | | | $ | (279 | ) | | $ | 33,918 | |
| | | | | | | | | | | | | | | | | | | | | | | | | |
See accompanying Notes to Consolidated Financial Statements
F-5
BARRIER THERAPEUTICS, INC.
CONSOLIDATED STATEMENTS OF CASH FLOWS
| | | | | | | | | | | | |
| | | December 31, | |
| | | 2007 | | | 2006 | | | 2005 | |
| | | (In thousands) | |
Operating activities | | | | | | | | | | | | |
Net loss | | $ | (53,692 | ) | | $ | (52,717 | ) | | $ | (45,241 | ) |
Adjustments to reconcile net loss to net cash used in operating activities: | | | | | | | | | | | | |
Depreciation | | | 424 | | | | 533 | | | | 428 | |
Amortization of deferred compensation | | | — | | | | — | | | | 889 | |
Amortization of product rights | | | 351 | | | | 351 | | | | 320 | |
Stock based compensation expense | | | 4,574 | | | | 5,270 | | | | 378 | |
Changes in operating assets and liabilities: | | | | | | | | | | | | |
Prepaid expenses and other current assets | | | (1,539 | ) | | | 140 | | | | 554 | |
Accounts receivable | | | (9,900 | ) | | | (1,290 | ) | | | (597 | ) |
Inventory | | | 386 | | | | (799 | ) | | | (380 | ) |
Accounts payable and accrued expenses | | | 11,709 | | | | 5,692 | | | | (575 | ) |
Deferred revenue | | | (430 | ) | | | (207 | ) | | | (13 | ) |
Other, net | | | (107 | ) | | | (280 | ) | | | (1 | ) |
| | | | | | | | | | | | |
Net cash used in operating activities | | | (48,224 | ) | | | (43,307 | ) | | | (44,238 | ) |
Investing activities | | | | | | | | | | | | |
Purchase of fixed assets | | | (210 | ) | | | (351 | ) | | | (358 | ) |
Purchase of product rights | | | — | | | | — | | | | (3,100 | ) |
Purchase of marketable securities | | | (53,930 | ) | | | (71,741 | ) | | | (94,057 | ) |
Maturities of marketable securities | | | 72,238 | | | | 85,290 | | | | 110,065 | |
| | | | | | | | | | | | |
Net cash provided by investing activities | | | 18,098 | | | | 13,198 | | | | 12,550 | |
Financing activities | | | | | | | | | | | | |
Borrowings under notes payable | | | 20,410 | | | | 220 | | | | 341 | |
Repayment of notes payable | | | (12,220 | ) | | | (379 | ) | | | (261 | ) |
Proceeds from issuance of common stock, net | | | 29,441 | | | | 23,998 | | | | 36,043 | |
Proceeds from exercise of stock options and other benefit plans | | | 380 | | | | 424 | | | | 580 | |
| | | | | | | | | | | | |
Net cash provided by financing activities | | | 38,011 | | | | 24,263 | | | | 36,703 | |
Effect of exchange rate on cash and cash equivalents | | | (51 | ) | | | 16 | | | | (32 | ) |
| | | | | | | | | | | | |
Net increase/(decrease) in cash and cash equivalents | | | 7,834 | | | | (5,830 | ) | | | 4,983 | |
Cash and cash equivalents, beginning of period | | | 11,061 | | | | 16,891 | | | | 11,908 | |
| | | | | | | | | | | | |
Cash and cash equivalents, end of period | | $ | 18,895 | | | $ | 11,061 | | | $ | 16,891 | |
| | | | | | | | | | | | |
Supplemental disclosures of cash flow information | | | | | | | | | | | | |
Cash paid during the period for interest | | $ | 229 | | | $ | 61 | | | $ | 53 | |
| | | | | | | | | | | | |
Non-cash investing and financing activities | | | | | | | | | | | | |
Release of formerly restricted stock | | $ | — | | | $ | 2 | | | $ | 10 | |
| | | | | | | | | | | | |
See accompanying Notes to Consolidated Financial Statements
F-6
BARRIER THERAPEUTICS, INC.
NOTES TO CONSOLIDATED FINANCIAL STATEMENTS
December 31, 2007
1. Organization, Description of Business
Barrier Therapeutics, Inc. (the “Company”) is a pharmaceutical company focused on the development and commercialization of pharmaceutical products in the field of dermatology. The Company’s strategy is to become a leader in the development and commercialization of proprietary innovative products in therapeutic dermatology. Due to pricing pressures on its current product portfolio the Company has discontinued sales and marketing efforts in Canada and the European Union.
The Company currently markets three pharmaceutical products in the United States, Xolegel (ketoconazole, USP) Gel 2%, Vusion (0.25% miconazole nitrate, 15% zinc oxide, and 81.35% white petrolatum) Ointment and Solagé (mequinol 2.0% and tretinoin 0.01%) Topical Solution. The Company markets its products directly to dermatologists and other target physicians through both its own specialty sales force and under a co-promotion agreement with Novartis Consumer Health in the United States.
The Company has other product candidates in various stages of clinical development for the treatment of a range of dermatological conditions, including onychomycosis, psoriasis, acne, skin allergies and superficial fungal infections. In addition, the Company has access to the classes of compounds claimed in the patents licensed to us under our license agreements with affiliates of Johnson & Johnson. The development of each of the product candidates involves significant risks. No assessment of the efficacy or safety of any product candidate can be considered definitive until all clinical trials needed to support a submission for marketing approval are completed.
The Company has financed its operations and internal growth almost entirely through proceeds from private placements of preferred stock, its initial public offering in the second quarter of 2004 and its follow-on public offerings in the first quarter of 2005, the third quarter of 2006 and the third quarter of 2007. In June 2007, the Company entered into a $12 million senior secured credit facility to finance ongoing working capital requirements of its commercial operations.
The Company believes that its existing resources should be sufficient to meet its capital and liquidity requirements for at least the next 12 months. However, the Company’s capital requirements will depend on many factors, including the success of its development and commercialization of the Company’s product candidates. Even if the Company succeeds in developing and commercializing additional product candidates, it may never generate sufficient sales revenue to achieve or maintain profitability. There can be no assurance that the Company will be able to obtain additional capital when needed on acceptable terms, if at all.
2. Summary of Significant Accounting Policies
Consolidation
The financial statements include the accounts of Barrier Therapeutics, Inc. and its wholly-owned subsidiaries, Barrier Therapeutics, NV and Barrier Therapeutics Canada Inc. All significant inter-company transactions and balances are eliminated in consolidation. The Company has no unconsolidated subsidiaries or investments accounted for under the equity method.
Use of Estimates
The preparation of financial statements in conformity with United States generally accepted accounting principles requires management to make estimates and assumptions that affect the amounts reported in the financial statements and accompanying notes. Actual results could differ from those estimates.
F-7
Cash and Cash Equivalents
The Company considers all highly liquid investments with a maturity of three months or less when purchased to be cash equivalents. At December 31, 2007, the Company has substantially all of its cash and cash equivalents deposited with one financial institution.
Marketable Securities
Investments classified as available-for-sale are carried at estimated fair value with unrealized gains and losses recorded as a component of accumulated other comprehensive income. EITF 03-01,The Meaning of Other-Than-Temporary requires disclosures addressing other-than-temporary impairments in a qualitative and quantitative manner. There were no other-than-temporary impairments through December 31, 2007.
Fair Value of Financial Instruments
The carrying amounts of the Company’s financial instruments, which include cash and cash equivalents, marketable securities, accounts receivable, accounts payable, accrued expenses, and notes payable approximate their fair values.
Inventories
Inventory is recorded upon the transfer of title from the Company’s vendors. Inventories are valued at the lower of cost or market and include finished good inventories. Cost is computed on inventories using the first-in, first-out (“FIFO”) method. The Company’s inventories are subject to expiration dating. The Company regularly reviews inventory, including inventory purchase commitments, for short dated or slow moving inventory based on expected revenues and expiration dates of inventories. For those units identified as short dated or slow moving the Company estimates its market value based on current trends. If the projected net realizable value is less than cost, on a product basis, the Company will record a provision to reflect the lower value of inventory. Although every effort is made to reasonably ensure the accuracy of forecasts of future product demand, any significant unanticipated decreases in demand could have a material impact on the carrying value of inventories and reported operating results.
The Company has committed to make future minimum inventory purchases under supply agreements to third parties for certain product inventories. It evaluates its ability to meet these future minimum commitments on a regular basis using current product demand along with estimated future product demand and forecasts. If the Company determines it cannot meet the future minimum, the Company will record a charge to cost of product revenues.
The Company expenses its inventory costs associated with products prior to regulatory approval as research and development expense.
Fixed Assets
Fixed assets include furniture and fixtures, computer and office equipment, software and leasehold improvements. Fixed assets are stated at cost, less accumulated depreciation. Depreciation is provided over the estimated useful lives of the respective assets, generally three to five years, using the straight-line method. Leasehold improvements are amortized over the estimated useful lives of the assets or related initial lease terms, whichever is shorter.
Impairment of Long-Lived Assets
In accordance with SFAS No. 144,Accounting for the Impairment or Disposal of Long-Lived Assets,the Company recognizes impairment losses on long-lived assets when indicators of impairment are present and future undiscounted cash flows are insufficient to support the assets recovery. There were no impairments through December 31, 2007.
F-8
Intangible Assets
Product rights are being amortized on a straight-line basis over the estimated useful life, which is predominately based on the life of the underlying patent, which expires in 2013. The Company continually evaluates the reasonableness of the carrying value of its intangible assets. An impairment may be recognized if an indicator of impairment exists and the expected future undiscounted cash flows are less than their carrying amounts. As of December 31, 2007, no impairment exists.
Revenue Recognition
The Company uses revenue recognition criteria in Staff Accounting Bulletin No. 104, “Revenue Recognition in Financial Statements,” Emerging Issues Task Force (“EITF”) Issue 00-21 “Revenue Arrangements with Multiple Deliverables” (“EITF 00-21”) and Statement of Financial Accounting Standards No 48 (“FAS 48”) “Revenue Recognition When Right of Return Exists.” Revenue arrangements that include multiple deliverables are divided into separate units of accounting if the deliverables meet certain criteria, including whether the fair value of the delivered items can be determined and whether there is evidence of fair value of the undelivered items. In addition, the consideration is allocated among the separate units of accounting based on their fair values, and the applicable revenue recognition criteria are considered separately for each of the separate units of accounting.
Net Product Revenue. The Company sells its products primarily to wholesalers, who, in turn, sell to pharmacies. The following are the Company’s revenue recognition policies.
New Product Launch—At the time of a new product launch, the Company utilizes a pull-through sales method that recognizes revenue based on estimated prescription demand based on third party market research data. Once the Company has established a normal level of wholesale inventory based on a normalized prescription demand, revenue is recognized, net of reserves, upon shipment to the wholesaler. Estimating the amount of returns and discounts for new products is based on specific facts and circumstances including acceptance rates from established products with similar marketing characteristics. At the time of a new product launch, absent the ability to make reliable estimates, the Company defers revenue on sales to wholesalers until the Company can make reliable estimates of returns, discounts and related end user demand. The Company attempts to monitor its inventory levels at wholesalers and pharmacies to ensure these levels remain within normal levels. The Company estimates inventory at wholesalers based on historical sales to wholesalers, inventory data provided by these wholesalers and from third party market research data related to prescription trends and patient demand. Making these determinations involves estimating whether trends in past buying patterns will predict future product sales.
Product Sales Allowances—The Company records product sales net of the following significant categories of product sales allowances: prompt payment discounts, wholesaler fees, returns, coupons, discounts for Medicaid, managed care and governmental contracts. In determining allowances for product returns, coupons and Medicaid rebates, the Company must make significant judgments and estimates. For example, in determining these amounts, the Company estimates prescription demand and the levels of inventory held by wholesalers. Making these determinations involves estimating whether trends in past buying patterns will predict future product sales. Calculating some of these items involves significant estimates and judgments and requires the use of information from external sources.
Returns—Customers can return short-dated or expired product that meets the guidelines set forth in the Company’s return goods policy. Returns are accepted from wholesalers and retail pharmacies. Wholesaler customers can return short dated product with six months or less shelf life remaining and expired product within 12 months following the expiration date. Retail pharmacies are not permitted to return short-dated product but can return full or partial quantities of expired product only within 12 months following the expiration date. The Company bases its estimates of product returns for each of its products on the percentage of returns that it has experienced historically or based on industry data for similar products. Notwithstanding this, the Company may
F-9
adjust its estimate of product returns if the Company is aware of other factors that it believes could meaningfully impact its expected return percentages. These factors could include, among others, estimates of inventory levels of its products in the distribution channel, known sales trends and existing or anticipated competitive market forces such as product entrants and/or pricing changes.
Rebates—Patient Discount/Coupons—From time to time the Company offers patients the opportunity to obtain free or discounted products through a program whereby physicians provide coupons or payment cards to qualified patients for redemption at retail pharmacies. The Company reimburses retail pharmacies for the cost of these products through a third party administrator. The Company recognizes the estimated cost of this reimbursement as a reduction of gross sales when product is sold. As a result of these patient discount and coupon offers, at the time of product shipment, the Company must estimate the likelihood that products sold to wholesalers and pharmacies might be ultimately sold to a patient who redeems a coupon. The Company bases its estimates on the historic coupon redemption rates for similar products it receives from third party administrators, which detail historic patterns. The Company maintains an accrual for unused coupons based on inventory in the distribution channel and historical coupon usage rates and adjusts this accrual whenever changes in such coupon usage rates occur.
Rebates—Medicaid discounts—In some states the Company participates or has applied to participate in the Federal Medicaid rebate program, as well as several state government-managed supplemental Medicaid rebate programs, which were developed to provide assistance to certain vulnerable and needy individuals and families. Under the Medicaid rebate program, the Company pays a rebate to each participating state and local government for its products that their programs reimburse. For purposes of this discussion, discounts and rebates provided through these programs are considered Medicaid rebates and are included in our Medicaid rebate accrual.
The Company records accruals for Medicaid rebates as a reduction of sales when product is sold to its wholesaler distributors. These reductions are based on historical rebate amounts and trends of sales eligible for these governmental programs for a period, as well as any expected changes to the trends of total product sales. In addition, the Company estimates the expected unit rebate amounts to be used and adjusts its rebate accruals based on the expected changes in rebate pricing. Rebate amounts are generally invoiced and paid quarterly in arrears, so that the accrual consists of an estimate of the amount expected to be incurred for the current quarter’s activity, plus an accrual for prior quarters’ unpaid rebates and an accrual for inventory in the distribution channel. The Company analyzes the accrual at least quarterly and will adjust the balance as required.
The Company will adjust its allowances for product returns, Medicaid and coupon rebates based on its actual sales experience, and will likely be required to make adjustments to these allowances in the future. The Company continually monitors its allowances and makes adjustments when it believes actual experience may differ from its estimates.
The following table provides a summary of activity with respect to the Company’s accruals for product revenue reserves and rebates during 2007 (amounts in thousands):
| | | | | | | | | |
| | | Rebates | | Wholesaler
Fees | | Other |
| | | (in thousands) |
Balance at December 31, 2006 | | $ | 630 | | $ | 135 | | $ | 30 |
Provision | | | 15,621 | | | 1,401 | | | 1,931 |
Payments | | | 6,238 | | | 918 | | | 1,513 |
| | | | | | | | | |
Balance at December 31, 2007 | | $ | 10,013 | | $ | 618 | | $ | 448 |
| | | | | | | | | |
Other Revenues. Contract revenues include license fees and other payments associated with collaborations with third parties. Revenue is generally recognized when there is persuasive evidence of an arrangement exists, delivery has occurred or services have been rendered, the price is fixed or determinable, and collectibility is reasonably assured.
F-10
Revenue from non-refundable, upfront license fees where the Company has a continuing involvement is recognized on a straight-line basis over the performance period. The Company periodically re-evaluates its estimates of the performance period and revises its assumptions as appropriate. These changes in assumptions may affect the amount of revenue recorded in its financial statements in future periods.
Grant revenues are recognized when the Company provides the services stipulated in the underlying grant based on the time and materials incurred up to the amount of grant payments received. Amounts received in advance of services provided are recorded as deferred revenue and amortized as revenue when the services are provided.
Research and Development Costs
Costs to develop the Company’s products are expensed as incurred. Assets acquired that are used for research and development and have no future alternative use are expensed as in-process research and development. There were no in-process research and development expenses recorded for the period ended December 31, 2007, 2006 and 2005.
Advertising Fees
Advertising fees are expensed as incurred. Advertising costs were approximately $7.6 million, $0.8 million and $0.4 million for the years ended December 31, 2007, 2006 and 2005 respectively.
Concentration of Credit Risk
The Company’s financial instruments that are exposed to concentration of credit risks consist primarily of cash and cash equivalents and marketable securities. The Company maintains its cash and cash equivalents in bank accounts which, at times, exceed federally insured limits. The Company has not experienced any losses in such accounts. The Company believes it is not exposed to significant credit risk on cash and cash equivalents and marketable securities.
The Company’s trade accounts receivable are reported net of allowances for charge-backs, cash discounts and doubtful accounts. The Company performs ongoing credit evaluations of its customers and generally does not require collateral. The Company maintains reserves for doubtful accounts; the balance at December 31, 2007 was $35,000; at December 31, 2006 was $12,000; and the amount was not material for 2005.
The Company sells products primarily to wholesalers, who, in turn, sell to pharmacies. In the United States, three wholesalers, Cardinal Health, McKesson and AmerisourceBergen make up approximately 85% of total product revenue.
Income Taxes
The Company accounts for income taxes under the asset and liability method whereby deferred tax assets and liabilities are determined based on the difference between the financial statement and tax bases of assets and liabilities using enacted tax rates in effect for the year in which the differences are expected to affect taxable income. Valuation allowances are established when necessary to reduce deferred tax assets to the amounts expected to be realized.
In June 2006, the FASB issued Interpretation No. 48,Accounting for Uncertainty in Income Taxes—an Interpretation of FASB Statement No. 109 (FIN 48). During the year ended December 31, 2007, the Company adopted FIN 48 which clarifies the accounting for income taxes by prescribing the minimum threshold a tax position is required to meet before being recognized in the financial statements as well as guidance on de-recognition, measurement, classification and disclosure of tax positions. The adoption of FIN 48 by the Company did not have a material impact on the Company’s financial condition or results of operation and resulted in no cumulative effect of accounting change being recorded as of January 1, 2007.
F-11
The Company will recognize potential interest and penalties related to income tax positions as a component of the provision for income taxes on the consolidated statements of income in any future periods in which the Company must record a liability.
Foreign Currency Translation
The functional currencies of the Company’s foreign subsidiaries are the local currencies: the Euro and Canadian dollar. Assets and liabilities are translated into U.S. dollars at year-end exchange rates and equity accounts are translated at historical exchange rates. The Company translates income and expense accounts at weighted average rates for each month and records gains and losses from the translation of financial statements in foreign currencies into U.S. dollars in other comprehensive income. Foreign exchange transaction gains and losses are included in the results of operations and are not material to the Company’s consolidated financial statements.
Comprehensive Loss
Statement of Financial Accounting Standards No. 130,Reporting Comprehensive Income, requires components of other comprehensive loss, including unrealized gains and losses on available-for-sale securities and foreign currency translation, to be included as part of total comprehensive loss. The components of comprehensive loss are included in the statements of stockholders’ equity.
Stock Based Compensation
On January 1, 2006, the Company adopted Statement of Financial Accounting Standards No. 123 (revised 2004), “Accounting for Stock-Based Compensation” (FAS 123(R)) using the modified prospective method. FAS 123(R) requires companies to recognize compensation expense in an amount equal to the fair value of all share-based payments granted to employees. The Company commenced the new method of valuing stock-based compensation as prescribed by FAS 123(R) on all stock-based awards granted or vested after the effective date.
For each of the years ended December 31, 2007 and 2006, the Company recorded stock based compensation expense $4.6 million ($0.7 million recorded in research and development expense and $3.9 million recorded in selling, general and administrative expenses) and $5.3 million ($1.4 million recorded in research and development expense and $3.9 million recorded in selling, general and administrative expenses).
Stock options are granted to employees at exercise prices equal to the fair market value of the Company’s stock at date of grant. Stock options generally vest over three to four years and have a term of 10 years. Compensation cost is recognized over the requisite service period for each separately vesting portion of the stock option. The expense is recognized, net of forfeitures, over the vesting period of the options using an accelerated method. The Company has never paid cash dividends and does not currently intend to pay cash dividends, and thus has assumed a 0% dividend yield. Expected volatilities are based on historical volatility of the Company’s stock price, which is compared to the volatility of a peer group of companies for reasonableness. The expected life of stock options is calculated using the “short-cut approach” in developing our estimate of expected term for “plain vanilla” stock options granted by using the mid-point between the vesting date and contractual termination date as allowed by Staff Accounting Bulletin No. 107. The risk-free interest rates are derived from the U.S. Treasury rates. In addition, the Company applies an expected forfeiture rate when amortizing stock-based compensation expenses. The estimate of the forfeiture rate is based primarily upon historical experience of employee turnover. The fair value of the options was estimated using the Black-Scholes pricing model with the following weighted average assumptions:
| | | | | | |
| | | Year Ended December 31, |
| | | 2007 | | 2006 | | 2005 |
Risk-free interest rate | | 3.89% | | 4.75% | | 4.0% |
Dividend yield | | 0% | | 0% | | 0% |
Expected life | | 6.0 years | | 6.0 years | | 6.0 years |
Volatility | | 62% | | 70% | | 75% |
F-12
As a result of adopting FAS 123(R), the Company’s net loss in each of these years is larger than had it continued to account for share-based compensation under Accounting Principles Board Opinion 25 (APB 25). For the years ended December 31, 2007 and 2006, the Company’s net losses were approximately $4.6 and $5.3 million higher, respectively, than if the Company had continued to account for share-based compensation under APB 25.
Prior to January 1, 2006, as allowed by SFAS 123, the Company had applied the intrinsic value-based method of accounting prescribed in APB 25 and its related interpretations, and, accordingly, did not recognize compensation expense for stock option grants made at an exercise price equal to or in excess of the fair market value of the stock at the date of grant. For pro forma purposes, the stock compensation expense was based on an accelerated vesting method. SFAS 123 pro forma information regarding net loss was required by SFAS 123, and had been determined as if the Company had accounted for its stock-based employee compensation under the fair value method prescribed in SFAS 123. The fair value of the options were estimated using the Black-Scholes pricing model. In addition, no compensation expense was recorded in the financial statements for shares purchased under the Company’s Employee Stock Purchase Plan as that plan was considered non-compensatory under APB 25.
In addition, prior to the adoption of FAS 123(R), the Company presented its unamortized portion of deferred compensation cost for nonvested stock options in the statement of changes in shareholders equity with a corresponding credit to additional paid in capital. Under FAS 123(R), an equity instrument is not considered to be issued until the instrument vests. Upon the adoption of FAS 123(R), the deferred compensation balance of $532,000 at December 31, 2005 was netted against additional paid in capital.
Application of APB 25 caused forfeitures to be recognized as incurred. Under FAS 123(R), an estimate of forfeitures must be made for the unvested awards outstanding as of the adoption date. As such, an adjustment to record the cumulative effect of a change in accounting principle is needed to reflect the compensation cost that would not have been recognized in prior periods had forfeitures been estimated during those periods. This adjustment applies only to compensation cost previously recognized in the financial statements for awards that are unvested on the adoption date. As such, the Company recognized a cumulative effect adjustment of $57,000 as of January 1, 2006 related to the accounting change for forfeitures.
Net Loss Per Common Share
The Company computes basic net loss per common share (“Basic EPS”) by dividing net loss by the weighted-average number of common shares outstanding. Diluted net loss per common share (“Diluted EPS”) is computed by dividing net loss by the weighted-average number of common shares and dilutive common shares equivalents then outstanding. Diluted EPS is identical to Basic EPS since common equivalent shares are excluded from the calculations, as their effect is anti-dilutive. The following table summarizes the Company’s calculation of net loss per common share:
| | | | | | | | | | | | |
| | | | | | | | | | |
| | | Year Ended December 31, | |
| | | 2007 | | | 2006 | | | 2005 | |
| | | (In thousands, except share and per-share amounts) | |
Net loss | | $ | (53,692 | ) | | $ | (52,717 | ) | | $ | (45,241 | ) |
| | | | | | | | | | | | |
Basic and diluted: | | | | | | | | | | | | |
Weighted-average shares of common stock outstanding | | | 31,035,259 | | | | 25,671,740 | | | | 23,798,922 | |
Less: weighted-average shares subject to repurchase | | | (172,665 | ) | | | (88,481 | ) | | | (142,616 | ) |
| | | | | | | | | | | | |
Shares used in computing basic and diluted net loss per common share | | | 30,862,594 | | | | 25,583,259 | | | | 23,656,306 | |
| | | | | | | | | | | | |
Basic and diluted net loss per common share | | $ | (1.74 | ) | | $ | (2.06 | ) | | $ | (1.91 | ) |
| | | | | | | | | | | | |
F-13
The following table shows dilutive common share equivalents outstanding, which are not included in the above historical calculation, as the effect of their inclusion is anti-dilutive during each period.
| | | | | | |
| | | Year Ended December 31, |
| | | 2007 | | 2006 | | 2005 |
Options | | 3,125,901 | | 2,638,024 | | 1,819,587 |
Recent Accounting Pronouncements
In September 2006, the FASB issued Statement 157,Fair Value Measurement (“Statement 157”). Statement 157 defines fair value, establishes a framework for measuring fair value in generally accepted accounting principles and establishes a hierarchy that categorizes and prioritizes the sources to be used to estimate fair value. Statement 157 also expands financial statement disclosures about fair value measurements. On February 6, 2008, the FASB issued FASB Staff Position (FSP) 157-b which delays the effective date of Statement 157 for one year for all nonfinancial assets and nonfinancial liabilities, except those that are recognized or disclosed at fair value in the financial statements on a recurring basis (at least annually). Statement 157 and FSP 157-b are effective for financial statements issued for fiscal years beginning after November 15, 2007. The Company is currently assessing the impact this provision may have on its consolidated financial statements; however, it does not believe that its adoption will have a significant impact on its consolidated financial statements.
In February 2007, the FASB issued Statement 159,The Fair Value Option for Financial Assets and Financial Liabilities—Including an Amendment of SFAS 115 (“Statement 159”), which permits but does not require a Company to measure financial instruments and certain other items at fair value. Unrealized gains and losses on items for which the fair value option has been elected are reported in earnings. This statement is effective for financial statements issued for fiscal years beginning after November 15, 2007. The Company is currently assessing the impact this provision may have on its consolidated financial statements; however, it does not believe that its adoption will have a significant impact on its consolidated financial statements.
In June 2007, the FASB issued EITF Issue No. 07-3,Accounting for Nonrefundable Advance Payments for Goods or Services to Be Used in Future Research and Development Activities, (EITF 07-3). EITF 07-3 requires that nonrefundable advance payments for goods or services that will be used or rendered for future research and development activities should be deferred and capitalized. The capitalized amounts should be expensed as the related goods are delivered or the services are performed. EITF 07-3 is effective for new contracts entered into during fiscal years beginning after December 15, 2007. The Company is currently assessing the impact this provision may have on its consolidated financial statements; however, it does not believe that its adoption will have a significant impact on its consolidated financial statements.
In December 2007, the FASB issued Statement No. 141(R),Business Combinations(“Statement 141 (R)”), a replacement of FASB Statement No. 141. Statement 141(R) is effective for fiscal years beginning on or after December 15, 2008 and applies to all business combinations. Statement 141(R) provides that, upon initially obtaining control, an acquirer shall recognize 100 percent of the fair values of acquired assets, including goodwill, and assumed liabilities, with only limited exceptions, even if the acquirer has not acquired 100 percent of its target. As a consequence, the current step acquisition model will be eliminated. Additionally, Statement 141(R) changes current practice, in part, as follows: (1) contingent consideration arrangements will be fair valued at the acquisition date and included on that basis in the purchase price consideration; (2) transaction costs will be expensed as incurred, rather than capitalized as part of the purchase price; (3) pre-acquisition contingencies, such as legal issues, will generally have to be accounted for in purchase accounting at fair value; and (4) in order to accrue for a restructuring plan in purchase accounting, the requirements in FASB Statement No. 146,Accounting for Costs Associated with Exit or Disposal Activities, would have to be met at the acquisition date. The Company is currently assessing the impact this provision may have on its consolidated financial statements; however, it does not believe that its adoption will have a significant impact on its consolidated financial statements.
F-14
In December 2007, the Securities and Exchange Commission (“SEC”) issued Staff Accounting Bulletin No. 110 (“SAB 110”) which amends and replaces Question 6 of Section D.2 of Topic 14,Share-Based Payment. SAB 110 expresses the views of the staff regarding the use of the “simplified” method in developing an estimate of expected term of “plain vanilla” share options in accordance with FASB Statement No. 123(R),Share Based Payment.The use of the “simplified” method was scheduled to expire on December 31, 2007; however, SAB 110 extends the use of the “simplified” method for “plain vanilla” awards in certain situations. The Company currently uses the “simplified” method to estimate the expected term for share option grants since adequate historical experience is not available to provide a reasonable estimate due to the limited period that the Company’s equity shares have been publicly traded. The Company will continue to use the “simplified” method until adequate historical experience is available to provide a reasonable estimate of expected term in accordance with SAB 110. SAB 110 is effective for options granted after December 31, 2007.
3. Available for Sale Investments
The following is a summary of available for sale investments as of December 31, 2007 and December 31, 2006:
| | | | | | | | | | | | | |
| | | Cost | | Gross
Unrealized
Gains | | Gross
Unrealized
Losses | | | Fair
Value |
| | | (In thousands) |
December 31, 2007 | | | | | | | | | | | | | |
Maturities within one year: | | | | | | | | | | | | | |
Corporate notes | | $ | 22,480 | | $ | 62 | | $ | (1 | ) | | $ | 22,541 |
Asset-backed securities | | | 7,020 | | | 7 | | | — | | | | 7,027 |
| | | | | | | | | | | | | |
Total | | $ | 29,500 | | $ | 69 | | $ | (1 | ) | | $ | 29,568 |
| | | | | | | | | | | | | |
December 31, 2006 | | | | | | | | | | | | | |
Maturities within one year: | | | | | | | | | | | | | |
Corporate notes | | $ | 41,317 | | $ | 16 | | $ | (1 | ) | | $ | 41,332 |
Asset-backed securities | | | 6,490 | | | 1 | | | — | | | | 6,491 |
| | | | | | | | | | | | | |
Total | | $ | 47,807 | | $ | 17 | | $ | (1 | ) | | $ | 47,823 |
| | | | | | | | | | | | | |
Unrealized gains and losses are reported as a component of accumulated other comprehensive income (loss) in stockholders’ equity. The amortized cost of debt securities is adjusted for amortization of premiums and discounts from the date of purchase to maturity. Such amortization is included in interest income as an addition to or deduction from the coupon interest earned on the investments. There are no realized gains or losses on marketable securities as the Company has not sold any marketable securities during the periods presented.
4. Property and Equipment
Fixed assets consist of the following:
| | | | | | | | | | |
| | | | | December 31, | |
| | | Estimated Life | | 2007 | | | 2006 | |
| | | | | (in thousands) | |
Furniture and fixtures | | 5 years | | $ | 705 | | | $ | 688 | |
Computer, laboratory and office equipment | | 3 years | | | 1,068 | | | | 911 | |
Computer software | | 3 years | | | 534 | | | | 498 | |
Leasehold improvements | | 5 years | | | 299 | | | | 299 | |
| | | | | | | | | | |
| | | | | 2,606 | | | | 2,396 | |
Less accumulated depreciation | | | | | (1,947 | ) | | | (1,523 | ) |
| | | | | | | | | | |
| | | | $ | 659 | | | $ | 873 | |
| | | | | | | | | | |
F-15
Depreciation expense was approximately $424,000, $533,000, and $428,000 for the years ended December 31, 2007, 2006 and 2005, respectively.
5. Intangible Assets
On February 7, 2005, the Company entered into a Product Acquisition Agreement with Moreland Enterprises, Ltd. (“Moreland”). Under the terms of the Product Acquisition Agreement, the Company acquired the United States and Canadian rights to Solagé (mequinol 2%, tretinoin 0.01%) Topical Solution, and all existing finished goods inventory. The Company was assigned all U. S. and Canadian marketing authorizations, patents, and trademarks for the product. The patent rights include U.S. and Canadian patents covering the pharmaceutical composition of Solagé and methods of use until at least 2013.
The Company acquired the intellectual property and finished goods inventory for $3.1 million and will make future payments totaling up to an additional $2.0 million, if certain sales targets are met. The total initial purchase price was allocated $3.0 million to product rights and $61,000 to inventory. During 2005, the Company recorded a liability and a corresponding increase to the intangible asset product rights of $100,000 for future amounts payable to Moreland based on product sales during the period. Product rights are being amortized on a straight-line basis over the life of the underlying patent, which expires in 2013.
The following information relates to acquired product rights as of December 31, 2007:
| | | | | | | | | | | | |
| | | 2007 | | 2006 |
| | | Gross
Carrying
Amount | | Accumulated
Amortization | | Gross
Carrying
Amount | | Accumulated
Amortization |
| | | (in thousands) |
Product Rights | | $ | 3,100 | | $ | 1,022 | | $ | 3,100 | | $ | 671 |
Total amortization expense for intangible assets was $351,000, $351,000 and $320,000 at December 31, 2007, 2006 and 2005, respectively. As of December 31, 2007, the estimated amortization expense for each of the five succeeding years will be $351,000 per year.
6. Balance Sheet Detail
Accrued liabilities consist of the following as of December 31:
| | | | | | |
| | | December 31, |
| | | 2007 | | 2006 |
| | | (In Thousands) |
Accrued product R&D costs | | $ | 173 | | $ | 1,817 |
Accrued compensation and benefits | | | 2,688 | | | 2,346 |
Product revenue reserves and rebates | | | 11,079 | | | 795 |
Accrued other | | | 2,862 | | | 2,381 |
| | | | | | |
| | $ | 16,802 | | $ | 7,339 |
| | | | | | |
7. Notes Payable
In June 2007, we entered into a $12 million senior secured credit facility to finance ongoing working capital requirements of our commercial operations. The Company will make regular borrowings and payments each month against the credit facility and consider the outstanding amounts to be short-term in nature. Credit available under the three-year revolving loan facility will be a percentage of our accounts receivable due from third-parties plus a percentage of inventory, with an interest rate equal to the one-month LIBOR rate at draw plus 300 basis
F-16
points margin and 100 basis points collateral fee. The Company will also pay a 1% commitment fee of the line on the first anniversary of the closing date. Total fees of $0.2 million are being amortized to interest expense over the three-year term of the credit facility. The Company issued no stock warrants or other dilutive securities in conjunction with the creation of the credit facility. At December 31, 2007, the Company had outstanding borrowings under the facility of approximately $8.5 million.
The Company entered into an equipment and furniture financing arrangement with a third party for up $1,500,000 in 2004, with an interest rate of 6.15% plus the three year Treasury Constant Maturities rates at the time of funding. Each time it received funding, the Company entered into a promissory note with a term of three years, collateralized by the related equipment and furniture. As of December 31, 2007, the line is closed for further drawdowns.
In December 2005, the Company entered into a promissory note for $340,391, payable in 35 monthly installments of $11,067, including interest at 10.52%. In December 31, 2006, the Company entered into a promissory note for $219,633, payable in 35 monthly installments of $7,147, including interest at 10.58%.
Principal payments under notes payable are as follows (in thousands):
| | | |
2008 | | $ | 8,711 |
2009 | | | 104 |
| | | |
| | $ | 8,815 |
| | | |
8. Income Taxes
There is no tax provision for federal income taxes as the Company has incurred operating losses since inception. At December 31, 2007, the Company has net operating loss carryforwards for federal income tax purposes of approximately $186.5 million, which begin to expire in 2021. The Company has research tax credit carryovers for federal income tax purposes at December 31, 2007 of approximately $6.4 million, which begin to expire in 2021.
During 2007, 2006 and 2005, the Company sold a portion of its unused New Jersey State operating loss carryforwards, through a program sponsored by the State of New Jersey and the New Jersey Economic Development Authority. Cash proceeds of approximately $1.1 million, $0.7 million, and $0.5 million, net of fees of $29,000, $18,000, and $63,000, respectively, were received by the Company resulting in the recognition of a tax benefit.
The benefit for income taxes is as follows:
| | | | | | | | | |
| | | 2007 | | 2006 | | 2005 |
| | | (In Thousands) |
Federal income taxes: | | | | | | | | | |
Current expense | | $ | — | | $ | — | | $ | — |
Deferred expense | | | — | | | — | | | — |
State income taxes: | | | | | | | | | |
Current benefit | | | 1,050 | | | 655 | | | 536 |
Deferred expense | | | — | | | — | | | — |
Foreign income taxes: | | | | | | | | | |
Current expense | | | — | | | — | | | — |
Deferred expense | | | — | | | — | | | — |
| | | | | | | | | |
Income tax benefit | | $ | 1,050 | | $ | 655 | | $ | 536 |
| | | | | | | | | |
F-17
In 2005 the Company experienced a change in ownership as defined in Section 382 of the Internal Revenue Code. Section 382 can potentially limit a company’s ability to use net operating losses, tax credits and other tax attributes in periods subsequent to a change in ownership. However, based on the market value of the Company at such date, the Company believes that this ownership changes will not significantly impact its ability to use net operating losses or tax credits in the future to offset taxable income.
Deferred income taxes reflect the net effects of temporary differences between the carrying amounts of assets and liabilities for financial reporting purposes and the amounts used for income tax purposes. The Company’s deferred tax assets relate primarily to its net operating loss carryforwards. At December 31, 2007 and December 31, 2006, a valuation allowance was recorded to fully offset the net deferred tax asset. The change in the valuation allowance for the years ended December 31, 2007 and 2006 was approximately $19.6 million and $20.3 million, respectively. Significant components of the Company’s deferred tax assets at December 31, 2007 and 2006 are as follows:
| | | | | | | | |
| | | 2007 | | | 2006 | |
| | | (In Thousands) | |
Deferred tax assets: | | | | | | | | |
Net operating loss carryforwards | | $ | 72,853 | | | $ | 59,409 | |
Stock-based compensation | | | 2,078 | | | | 734 | |
Research tax credits | | | 7,358 | | | | 6,425 | |
Deferred revenue | | | — | | | | 138 | |
Depreciation | | | 41 | | | | — | |
Other | | | 4,816 | | | | 894 | |
| | | | | | | | |
Total deferred tax asset | | | 87,146 | | | | 67,600 | |
Deferred tax liabilities: | | | | | | | | |
Depreciation | | | — | | | | (15 | ) |
Total gross deferred tax liabilities | | | — | | | | (15 | ) |
Less valuation allowance | | | (87,146 | ) | | | (67,585 | ) |
| | | | | | | | |
Net deferred tax asset | | $ | — | | | $ | — | |
| | | | | | | | |
A reconciliation of the statutory tax rates and the effective tax rates for the years ended December 31, 2007 and 2006 is as follows:
| | | | | | |
| | | Year Ended | |
| | | 2007 | | | 2006 | |
Statutory rate | | (34 | )% | | (34 | )% |
State income tax | | (4 | )% | | (5 | )% |
Research tax credits | | (1 | )% | | (2 | )% |
Other | | 0 | % | | 2 | % |
Change in valuation allowance | | 37 | % | | 38 | % |
| | | | | | |
Benefit for income tax | | (2 | )% | | (1 | )% |
| | | | | | |
F-18
During the year ended December 31, 2007, the Company adopted FIN 48 which clarifies the accounting for income taxes by prescribing the minimum threshold a tax position is required to meet before being recognized in the financial statements as well as guidance on de-recognition, measurement, classification and disclosure of tax positions. The adoption of FIN 48 by the Company did not have a material impact on the Company’s financial condition or results of operation and resulted in no cumulative effect of accounting change being recorded as of January 1, 2007. The Company does not have any net liabilities recorded related to unrecognized tax benefits at December 31, 2007 and January 1, 2007. The Company does have gross liabilities recorded of approximately $1.1 million, as of December 31, 2007 and January 1, 2007. A reconciliation of the beginning and ending amount of gross unrecognized tax benefits is as follows:
| | | |
| | | (in thousands) |
Balance at January 1, 2007 | | $ | 1,132 |
Additions/Reductions related to current or prior year tax positions | | | 0 |
| | | |
Balance at December 31, 2007 | | $ | 1,132 |
| | | |
The Company has not taken any tax benefits related to this liability due to the recognition of a tax valuation allowance on its balance sheet. The Company will recognize potential interest and penalties related to income tax positions as a component of the provision for income taxes on the consolidated statements of income in any future periods in which the Company must record a liability. The Company is no longer subject to federal, state, or foreign income tax assessments for years prior to 2003.
9. Stockholders’ Equity and Capital Structure
Preferred Stock
Pursuant to the Company’s Amended and Restated Certificate of Incorporation filed on May 3, 2004, the Company has 5,000,000 shares of authorized “blank-check” preferred stock none of which are issued. The Board of Directors is authorized to issue these shares in one or more series without stockholder approval. The Board of Directors has the discretion to determine the rights, preferences, privileges and restrictions, including voting rights, dividend rights, conversion rights, redemption privileges and liquidation preferences of each series of preferred stock.
Common Stock
The Company is authorized to issue 80,000,000 shares of common stock. The Company is required to, at all times, reserve and keep available out of its authorized but unissued shares of common stock sufficient shares to effect the conversion of the shares of the redeemable convertible preferred stock and stock options.
Employee Stock Purchase Plan
The Company established an Employee Stock Purchase Plan (the “ESPP”). The plan allows eligible employees the opportunity to acquire shares of Barrier’s common stock (the “common stock”) at periodic intervals through accumulated payroll deductions. These deductions will be applied at semi-annual intervals to purchase shares of common stock at a discount from the then current market price. The purchase price per share will be equal to 85% of the fair market value per share on the date in which the participant is enrolled, or, if lower, 85% of the fair market value per share on the semi-annual purchase date. Semi-annual purchase dates are the last business day of January and July each year. Under FAS 123(R), the Company records compensation expense related to its ESPP.
Initially 200,000 shares were reserved for issuance. The number of shares reserved for the plan will be automatically increased each year on the first trading day in January by an amount equal to .5% of the total number of outstanding shares of common stock on the last trading day of December in the prior year, not to
F-19
exceed 150,000 shares. There is a 1,500 share purchase limitation per participant and 75,000 aggregate purchase limitation per purchase date.
As of December 31, 2007, a total of 118,392 shares of common stock were purchased under this plan; 4,050 shares were purchased at $8.94 per share, 7,354 shares were purchased at $9.35 per share, 10,170 shares were purchased at $7.97 per share, 23,147 were purchased at $6.77 per share, 27,259 shares were purchased at $5.70 per share, 45,085 shares were purchased at $5.53 per share and 1,327 were purchased at $5.72.
Stock Option Plan
On April 26, 2002, the Company’s Board of Directors and stockholders approved the Company’s 2002 Equity Compensation Plan (the “2002 Plan”). In March 2004, the Company’s Board of Directors and stockholders approved the Company’s 2004 Stock Incentive Plan (the “2004” Plan). On that date, the outstanding options under the 2002 Plan were transferred to the 2004 Plan. No further options may be granted under the 2002 Plan. The 2002 Plan options will continue to be governed by their existing terms, unless the Board or its committee elects to extend one or more features of the 2004 Plan to these options. The options granted under the 2004 Plan and the 2002 Plan have substantially the same terms.
The 2004 Plan allows the Company to offer shares of its common stock to key employees, Directors, advisors and consultants pursuant to option grants, stand-alone stock appreciation rights, direct stock issuances and other stock based awards. All stock based awards under the 2004 Plan are made at not less than the fair market value on the date of grant. The number of shares of common stock reserved for issuance under the 2004 Plan will automatically increase each year on the first trading day in January of each calendar year by an amount equal to 5% of the total number of shares of common stock outstanding on the last trading day in December, not in excess of 1,000,000 shares.
The 2004 Plan is intended to encourage ownership of stock by employees, Directors, advisors and consultants of the Company and to provide additional incentives for them to promote the success of the Company’s business and is administered by the Board of Directors or committee consisting of members of the Board. Options granted pursuant to the 2004 Plan generally vest 25% after the first year, and the remaining 75% vest monthly over the next three years.
Stock Based Compensation
For the years ended December 31, 2007 and 2006, the Company recorded stock based compensation expense of $4.6 million and $5.3 million, respectively. The following table summarizes the components and classification of stock-based compensation expense for the year ended December 31, 2007 and 2006:
| | | | | | |
| | | 2007 | | 2006 |
Included in: | | | | | | |
Research and development | | | 728 | | | 1,411 |
Selling, general and administrative | | | 3,846 | | | 3,859 |
| | | | | | |
Total stock-based compensation expense | | $ | 4,574 | | $ | 5,270 |
| | | | | | |
F-20
The following table illustrates the effect on net income and earnings per share for the year ended December 31, 2005, had the Company applied the fair value recognition provisions of SFAS 123 to all of its stock-based compensation plans.
| | | | |
| | | (In thousands,
except per-share
amounts) | |
Net loss | | $ | (45,241 | ) |
Add non-cash employee compensation as reported | | | 889 | |
Deduct total stock-based employee compensation expense determined under fair value based method for all awards | | | (5,095 | ) |
| | | | |
SFAS 123 pro forma net loss | | $ | (49,447 | ) |
| | | | |
Basic and diluted loss attributable per common share | | $ | (1.91 | ) |
| | | | |
Basic and diluted loss attributable to common stockholders per share, SFAS 123 pro forma | | $ | (2.09 | ) |
| | | | |
The following table summarizes information about stock options outstanding at December 31, 2007:
| | | | | | |
| | | Options Outstanding |
| | | Number
of
Shares | | Option
Price
Per Share
Range | | Weighted-
Average
Exercise
Price |
Balance at December 31, 2004 | | 1,438,937 | | 0.60-17.70 | | 4.52 |
Shares authorized | | — | | — | | — |
Options granted | | 713,800 | | 7.05-19.98 | | 14.12 |
Options exercised | | (183,521) | | 0.60-14.74 | | 2.35 |
Options forfeited | | (149,629) | | 0.60-18.56 | | 6.70 |
| | | | | | |
Balance at December 31, 2005 | | 1,819,587 | | $0.60-19.98 | | 8.32 |
Shares authorized | | — | | — | | — |
Options granted | | 1,067,000 | | 5.40-11.23 | | 7.85 |
Options exercised | | (73,778) | | 0.60-8.60 | | 1.62 |
Options forfeited | | (174,785) | | 0.60-17.76 | | 10.54 |
| | | | | | |
Balance at December 31, 2006 | | 2,638,024 | | $0.60-19.98 | | 8.17 |
Shares authorized | | — | | — | | — |
Options granted | | 868,200 | | 3.38-7.96 | | 6.67 |
Options exercised | | (123,088) | | 0.60-7.05 | | 1.00 |
Options forfeited | | (257,235) | | 1.00-19.98 | | 9.78 |
| | | | | | |
Balance at December 31, 2007 | | 3,125,901 | | $0.60-19.98 | | $7.91 |
| | | | | | |
The following table summarizes information about vested stock options outstanding:
| | | | | | | | | |
| | | December 31, |
| | | 2007 | | 2006 | | 2005 |
Vested stock options | | | 1,773,042 | | | 1,275,178 | | | 696,010 |
Weighted-average exercise price | | $ | 7.83 | | $ | 7.00 | | $ | 4.68 |
F-21
The following table summarizes information about stock options outstanding at December 31, 2007:
| | | | | | | | | | | | |
| | | Outstanding | | Exercisable |
Exercise Price | | Number of
Options | | Weighted-
Average
Exercise
Price | | Weighted-
Average
Remaining
Contractual
Life (years) | | Number of
Options | | Weighted-
Average
Exercise
Price |
$0.60 – $1.50 | | 358,938 | | $ | 0.89 | | 5.2 | | 358,938 | | $ | 0.89 |
3.00 – 4.00 | | 120,510 | | | 3.65 | | 6.2 | | 115,285 | | | 3.64 |
4.01 – 8.00 | | 1,600,791 | | | 7.01 | | 8.8 | | 608,955 | | | 7.28 |
8.01 – 10.00 | | 456,762 | | | 9.05 | | 8.1 | | 268,604 | | | 9.05 |
10.01 – 14.00 | | 246,900 | | | 12.39 | | 6.8 | | 219,206 | | | 12.36 |
14.01 – 20.00 | | 342,000 | | | 16.23 | | 7.2 | | 250,054 | | | 16.16 |
| | | | | | | | | | | | |
| | 3,125,901 | | | 7.91 | | 7.8 | | 1,821,042 | | | 7.88 |
The difference between the number of vested stock options and the number of options exercisable relate to options granted to non-employee members of the Board of Directors. Stock options granted to Board members under the 2004 Plan are immediately exercisable, but not immediately vested. Since the adoption of the 2004 Plan, no unvested options have been exercised.
The weighted-average fair value of stock options granted for the years ended December 31, 2007, 2006 and 2005, was $6.67, $7.85, and $14.12, respectively. The intrinsic value of stock options exercised was approximately $0.7 million, $0.5 million, and $2,5 million for the years ended December 31, 2007, 2006 and 2005, respectively. The total fair value of shares vested during the years ended December 31, 2007, 2006 and 2005 was $4.4 million, $3.7 million, and $2.7 million, respectively. The intrinsic value of options outstanding and exercisable at December 31, 2007 was $1.1 million and $1.1 million respectively. Aggregate intrinsic value is the sum of the amounts be which the quoted market price of the Company’s common stock exceeded the exercise price of the options at December 31, 2007, for those options for which the quoted market price was in excess of the exercise price.
The total remaining unrecognized compensation costs related to unvested stock options was $3.4 million as of December 31, 2007 and will be amortized over the weighted-average remaining service period of 1.2 years.
Awards of Restricted Stock
The following is a summary of restricted stock awards issued for the year ended December 31, 2007 under the 2004 Plan:
| | | | | | |
| | | Shares | | | Wtd. Avg. Value
Per Share |
Unvested, December 31, 2006 | | 126,330 | | | $ | 7.43 |
Granted, net of forfeitures | | 81,948 | | | $ | 6.81 |
Vested | | (57,887 | ) | | $ | 7.17 |
| | | | | | |
Unvested, December 31, 2007 | | 150,391 | | | $ | 7.19 |
The Company recognized $0.8 million and $0.2 million in expense related to awards granted in 2007 and 2006, respectively. The Company did not issue any shares of restricted stock prior to 2006.
The total remaining unrecognized compensation costs related to unvested restricted stock shares was $0.7 million as of December 31, 2007 and will be amortized over the weighted-average remaining service period of 1.7 years.
No other share-based awards are outstanding under any of the Plans. At December 31, 2007, there were 1,073,967 shares available for grant under the Plans. At December 31, 2006, there were 766,880 shares available for grant under the Plans.
F-22
The Company accounts for options issued to non-employees under SFAS No. 123 and EITF Issue No. 96-18, “Accounting for Equity Instruments That Are Issued to Other Than Employees for Acquiring, or in Conjunction with Selling, Goods or Services.” As such, the value of such options is periodically re-measured and income or expense is recognized during their vesting terms. The Company recorded $69,000, $133,000 and $378,000 for the years ended December 31, 2007, 2006 and 2005, respectively.
10. Commitments and Contingencies
Commitments
Notes payable and operating lease obligations are discussed in Notes 7 and 13, respectively. Other commitments totaled $36.1 million and related to purchase of product and product candidate materials contingent on the delivery of the materials and to fund various clinical trials contingent on the performance of services. These obligations also include long-term obligations, including milestone payments that may arise under agreements that the Company may terminate prior to the milestone payments being due. The Company excludes contingent royalty payments that it may be obligated to pay in the future. Of these total other commitments, $25.2 million is non-cancellable.
Johnson & Johnson
In addition to the Series A exchanged for the acquisition of in-process research and development, Janssen Pharmaceutica Products, L.P., Johnson & Johnson Consumer Companies, Inc., and Ortho-McNeil Pharmaceutical, Inc., received certain rights of first negotiation for the marketing and sales of those drugs which the Company successfully develops from that portfolio. The most significant terms of the license provide the following:
(a) the licenses are subject to a right of first negotiation for the marketing and sale of those drugs which the Company elects not to market itself or through contract sales organizations on a territory-by- territory basis, and
(b) the licenses are royalty-free, except for the so-called “itraconazole melt extrusion”, Hyphanox, which will require the payment of a royalty with respect to those sales of a licensee or sublicense of the Company (other than a contract sales organization) or by the Company after a change of control.
11. Geographic Segments
The Company manages its business and operations as one segment and is focused on the development and commercialization of its product candidates and approved products for marketing. Due to pricing pressures on its current product portfolio the Company has discontinued sales and marketing efforts in Canada and the EU.
The following table presents financial information by product for the years ended December 31, 2007 and 2006:
| | | | | | |
| | | Year ended
December 31, |
| | | 2007 | | 2006 |
| | | (in thousands) |
Net product revenues | | | | | | |
Vusion | | $ | 18,154 | | $ | 3,785 |
Xolegel | | | 3,928 | | | 130 |
Solagé | | | 1,086 | | | 1,595 |
Other products | | | 351 | | | 343 |
| | | | | | |
Total net product revenues | | $ | 23,519 | | $ | 5,853 |
| | | | | | |
F-23
The following tables present financial information based on the geographic location of the facilities of the Company and for the years ended December 31, 2007 and 2006:
| | | | | | | | |
| | | Year Ended
December 31, | |
| | | 2007 | | | 2006 | |
| | | (in thousands) | |
Net product revenue | | | | | | | | |
U.S. | | $ | 23,055 | | | $ | 5,331 | |
International | | | 464 | | | | 522 | |
| | | | | | | | |
Total net product revenue | | $ | 23,519 | | | $ | 5,853 | |
| | | | | | | | |
| |
| | | Year Ended
December 31, | |
| | | 2007 | | | 2006 | |
| | | (in thousands) | |
Loss before income tax benefit | | | | | | | | |
U.S. | | $ | (47,373 | ) | | $ | (44,509 | ) |
International | | | (7,369 | ) | | | (8,920 | ) |
| | | | | | | | |
Total loss before income tax benefit | | $ | (54,742 | ) | | $ | (53,429 | ) |
| | | | | | | | |
| |
| | | Year Ended
December 31, | |
| | | 2007 | | | 2006 | |
| | | (in thousands) | |
Total assets | | | | | | | | |
U.S. | | $ | 66,649 | | | $ | 65,696 | |
International | | | 767 | | | | 1,538 | |
| | | | | | | | |
Total assets | | $ | 67,416 | | | $ | 67,234 | |
| | | | | | | | |
| |
| | | Year Ended
December 31, | |
| | | 2007 | | | 2006 | |
| | | (in thousands) | |
Property and equipment, net | | | | | | | | |
U.S. | | $ | 490 | | | $ | 674 | |
International | | | 169 | | | | 199 | |
| | | | | | | | |
Total property and equipment, net | | $ | 659 | | | $ | 873 | |
| | | | | | | | |
12. Related Party Transactions
In July 2004, the Company entered into an agreement with Janssen Pharmaceutica, NV under which the Company committed to purchase € 1,000,000 (approximately $1,473,000) of inventory within the two-year period ending July 2008. The Company evaluates its ability to meet these future minimum commitments on a regular basis using current product demand along with estimated future product demand and forecasts. If the Company determines it can not meet the future minimum a charge is recorded to cost of product revenues. In 2007, the Company recorded a charge of $0.6 million related to this inventory commitment.
F-24
13. Leases
The Company leases its U.S. corporate facilities in Princeton, New Jersey under a lease which expires in September 2010. The Company leases space in Geel, Belgium under a short-term service agreement with a monthly fee of approximately $13,800. Future minimum lease commitments are as follows (in thousands):
| | | |
2008 | | $ | 636 |
2009 | | | 647 |
2010 | | | 484 |
| | | |
| | $ | 1,767 |
| | | |
Total rent expense was $0.6 million in 2007, $0.7 million in 2006, and $0.7 million in 2005.
14. Benefit Plan
In July 2002, the Company established a 401(k) plan (the “Plan”) covering all eligible employees. Beginning January 1, 2005, the Company elected to match a portion of the employee’s contribution. The Company’s contributions for 2007, 2006 and 2005 were approximately $0.1 million each year.
15. Subsequent Events
In January 2008, the Company announced that Mr. Alfred Altomari, the Chief Operating Officer of the Company, will succeed Dr. Geert Cauwenbergh, Founder and Chief Executive Officer of the Company, on March 31, 2008. Dr. Cauwenbergh will continue to serve on the Board of Directors of the Company. Mr. Altomari also became a member of the Board at the time of the announcement. In connection with Dr. Cauwenbergh’s separation, the Company anticipates entering into a separation agreement consistent with the terms of Dr. Cauwenbergh’s employment agreement. The Company anticipates Dr. Cauwenbergh will receive cash separation payments totaling approximately $0.7 million in 2008.
16. Selected Quarterly Financial Data (Unaudited)
| | | | | | | | | | | | | | | | |
| | | Quarter Ended | |
| | | March 31, | | | June 30, | | | September 30, | | | December 31, | |
| | | (In Thousands except per share amounts) | |
2007 | | | | | | | | | | | | | | | | |
Net revenue | | $ | 2,722 | | | $ | 4,122 | | | $ | 7,525 | | | $ | 9,713 | |
Cost of product revenues | | | (459 | ) | | | (646 | ) | | | (622 | ) | | | (1,465 | ) |
Total operating expenses | | | 18,757 | | | | 20,353 | | | | 20,244 | | | | 21,368 | |
Net loss(2) | | | (15,365 | ) | | | (15,737 | ) | | | (12,497 | ) | | | (10,093 | ) |
Basic and diluted net loss per common share(1) | | $ | (0.53 | ) | | $ | (0.54 | ) | | $ | (0.41 | ) | | $ | (0.29 | ) |
| | | | | | | | | | | | | | | | |
| | | Quarter Ended | |
| | | March 31, | | | June 30, | | | September 30, | | | December 31, | |
2006 | | | | | | | | | | | | | | | | |
Net revenue | | $ | 472 | | | $ | 1,081 | | | $ | 2,116 | | | $ | 3,069 | |
Cost of product revenues | | | (215 | ) | | | (483 | ) | | | (351 | ) | | | (382 | ) |
Total operating expenses | | | 12,679 | | | | 15,719 | | | | 15,509 | | | | 19,214 | |
Net loss | | | (11,374 | ) | | | (13,913 | ) | | | (12,658 | ) | | | (14,772 | ) |
Basic and diluted net loss per common share(1) | | $ | (0.47 | ) | | $ | (0.58 | ) | | $ | (0.50 | ) | | $ | (0.51 | ) |
| (1) | Per common share amounts for the quarters and full years have been calculated separately. Accordingly, quarterly amounts do not add to the annual amount because of differences in the weighted-average common shares outstanding during each period principally due to the effect of the Company’s issuing shares of its common stock during the year. |
| (2) | Quarter ended December 31, 2007, includes an adjustment related to forfeitures to true-up actual expense reported in financial statements in 2006 and 2007. This adjustment was not material to either the current or prior periods. |
F-25
Schedule II
Valuation and Qualifying Accounts
Year ended December 31, 2007 and 2006
| | | | | | | | | | | |
| | | | | Additions | | | | | |
Description | | Balance at
Beginning
of Period | | Charged to
Costs and
Expenses
or
Deductions
to Revenue | | Charged to
Other
Accounts -
Describe | | Deductions -
Describe | | | Balance at End
of Period |
Year ended December 31, 2007 | | | | | | | | | | | |
Deducted from asset accounts: | | | | | | | | | | | |
Cash Discounts | | 37 | | 809 | | | | 619 | A | | 227 |
Inventory | | 174 | | 318 | | | | 174 | D | | 318 |
Other | | 12 | | 26 | | | | 3 | B | | 35 |
| | | | | | | | | | | |
Total | | 223 | | 1,153 | | | | 796 | | | 580 |
Year ended December 31, 2006 | | | | | | | | | | | |
Deducted from asset accounts: | | | | | | | | | | | |
Cash Discounts | | 4 | | 148 | | | | 115 | A | | 37 |
Inventory | | — | | 174 | | | | — | | | 174 |
Other | | 1 | | 11 | | | | | | | 12 |
| | | | | | | | | | | |
Total | | 5 | | 333 | | | | 115 | | | 223 |
Year ended December 31, 2007 | | | | | | | | | | | |
Included in liability accounts: | | | | | | | | | | | |
Medicaid and coupon reserve | | 630 | | 15,621 | | | | 6,238 | C | | 10,013 |
Wholesaler Fees | | 135 | | 1,401 | | | | 918 | C | | 618 |
Other | | 30 | | 1,122 | | | | 704 | C | | 448 |
| | | | | | | | | | | |
Total | | 795 | | 18,144 | | | | 7,860 | | | 11,079 |
Year ended December 31, 2006 | | | | | | | | | | | |
Included in liability accounts: | | | | | | | | | | | |
Medicaid and coupon reserve | | — | | 706 | | | | 76 | C | | 630 |
Wholesaler Fees | | — | | 200 | | | | 65 | C | | 135 |
Other | | 5 | | 245 | | | | 220 | C | | 30 |
| | | | | | | | | | | |
Total | | 5 | | 1,151 | | | | 361 | | | 795 |
A - Discounts taken by customers during year
B - Uncollectable accounts written off
C - Payments
D - Obsolete inventory written off
F-26
INDEX OF EXHIBITS
| | |
Exhibit No. | | Description |
| 1.1 | | Underwriting Agreement dated September 14, 2006 entered into by and between the Registrant and Pacific Growth Equities, LLC, filed as Exhibit 1.1 to Form 8-K filed on September 15, 2006 |
| |
| 3.1 | | Amended and Restated Certificate of Incorporation, filed as Exhibit 3.2 to the Company’s Registration Statement on Form S-1 (File No. 333-112539) |
| |
| 3.2 | | Third Amended and Restated Bylaws of the Registrant, filed as Exhibit 3.1 to the Company’s current report on 8-K on December 5, 2007 |
| |
| 4.1 | | Specimen copy of stock certificate for shares of common stock of the Registrant, filed as Exhibit 4.1 to the Company’s Registration Statement on Form S-1 (File No. 333-112539) |
| |
| 4.2 | | Amended and Restated Investors Rights Agreement, dated as of April 20, 2004, by and among the Registrant and the Investors listed therein, filed as Exhibit 4.2 to the Company’s Registration Statement on Form S-1 (File No. 333-112539) |
| |
| 10.1† | | 2002 Equity Compensation Plan, filed as Exhibit 10.1 to the Company’s Registration Statement on Form S-1 (File No. 333-112539) |
| |
| 10.2(1) | | Intellectual Property Transfer and License Agreement, dated as of May 6, 2002, by and between the Registrant and Johnson & Johnson Consumer Companies, Inc., filed as Exhibit 10.2 to the Company’s Registration Statement on Form S-1 (File No. 333-112539) |
| |
| 10.3 | | Amendment No. 1 to the Intellectual Property Transfer and License Agreement dated as of September 7, 2004, by and between Barrier Therapeutics, Inc. and Johnson & Johnson Consumer Companies, Inc., filed as Exhibit 10.1 to the Company’s Current Report on Form 8-K filed on September 10, 2004 |
| |
| 10.4(1) | | Intellectual Property Transfer and License Agreement, dated as of May 6, 2002, by and among the Registrant and Janssen Pharmaceutica Products, L.P. and Ortho-McNeil Pharmaceutical, Inc., filed as Exhibit 10.3 to the Company’s Registration Statement on Form S-1 (File No. 333-112539) |
| |
| 10.5 | | Amendment No. 1 to the Intellectual Property Transfer and License Agreement, dated as of September 7, 2004, by and between Barrier Therapeutics, Inc. and Janssen Pharmaceutica Products, L.P. , filed as Exhibit 10.2 to the Company’s Current Report on Form 8-K filed on September 10, 2004 |
| |
| 10.6† | | Restricted Stock Purchase Agreement, dated as of October 31, 2001, by and between the Registrant and Geert Cauwenbergh, Ph.D., filed as Exhibit 10.7 to the Company’s Registration Statement on Form S-1 (File No. 333-112539) |
| |
| 10.7† | | Amendment No. 1 to Restricted Stock Purchase Agreement, dated as of May 7, 2002, by and between the Registrant and Geert Cauwenbergh, Ph.D., filed as Exhibit 10.8 to the Company’s Registration Statement on Form S-1 (File No. 333-112539) |
| |
| 10.8† | | Amendment No. 2 to Restricted Stock Purchase Agreement, dated as of April 1, 2004, by and between the Registrant and Geert Cauwenbergh, Ph.D., filed as Exhibit 10.18 to the Company’s Registration Statement on Form S-1 (File No. 333-112539) |
| |
| 10.9† | | Restricted Stock Purchase Agreement, dated as of February 20, 2002, by and between the Registrant and Charles Nomides, filed as Exhibit 10.9 to the Company’s Registration Statement on Form S-1 (File No. 333-112539) |
| |
| 10.10† | | Amendment No. 1 to Restricted Stock Purchase Agreement, dated May 7, 2002, by and between the Registrant and Charles Nomides, filed as Exhibit 10.10 to the Company’s Registration Statement on Form S-1 (File No. 333-112539) |
F-27
| | |
Exhibit No. | | Description |
| 10.11† | | Amendment No. 2 to Restricted Stock Purchase Agreement, dated as of April 1, 2004, by and between the Registrant and Charles Nomides, filed as Exhibit 10.19 to the Company’s Registration Statement on Form S-1 (File No. 333-112539) |
| |
| 10.12† | | Restricted Stock Purchase Agreement, dated as of August 1, 2002, by and between the Registrant and Anne M. VanLent, filed as Exhibit 10.11 to the Company’s Registration Statement on Form S-1 (File No. 333-112539) |
| |
| 10.13† | | Amendment No. 1 to Restricted Stock Purchase Agreement, dated as of April 1, 2004, by and between the Registrant and Anne M. VanLent, filed as Exhibit 10.20 to the Company’s Registration Statement on Form S-1 (File No. 333-112539) |
| |
| 10.14 | | Lease Agreement, dated May 28, 2003, between the Registrant and Peregrine Investment Partners-I relating to property located at 600 College Road East, Princeton Forrestal Center, New Jersey, filed as Exhibit 10.12 to the Company’s Registration Statement on Form S-1 (File No. 333-112539) |
| |
| 10.15 | | Amendment No. 1 dated November 6, 2003, to Lease Agreement, dated May 28, 2003, between the Registrant and Peregrine Investment Partners-I relating to property located at 600 College Road East, Princeton Forrestal Center, New Jersey, filed as Exhibit 10.13 to the Company’s Registration Statement on Form S-1 (File No. 333-112539) |
| |
| 10.16 | | Master Security Agreement, dated as of August 21, 2003 and Amendment, dated as of September 3, 2003, between the Registrant and General Electric Capital Corporation, filed as Exhibit 10.14 to the Company’s Registration Statement on Form S-1 (File No. 333-112539) |
| |
| 10.17(1) | | Development and Supply Agreement, dated as of May 16, 2002, between the Registrant and Abbott GmbH & Co. KG, filed as Exhibit 10.15 to the Company’s Registration Statement on Form S-1 (File No. 333-112539) |
| |
| 10.18† | | 2004 Stock Incentive Plan, filed as Exhibit 10.16 to the Company’s Registration Statement on Form S-1 (File No. 333-112539) |
| |
| 10.19† | | Employee Stock Purchase Plan, filed as Exhibit 10.17 to the Company’s Registration Statement on Form S-1 (File No. 333-112539) |
| |
| 10.20 | | Amendment No. 2 dated May 13, 2004, to Lease Agreement, dated May 28, 2003, between the Registrant and Peregrine Investment Partners-I relating to property located at 600 College Road East, Princeton Forrestal Center, New Jersey, filed as Exhibit 10.1 to the Company’s Quarterly Report on Form 10-Q filed on August 11, 2004. |
| |
| 10.21(1) | | Distribution and License Agreement dated November 4, 2004 between the Registrant and Grupo Ferrer Internacional, S.A., filed as Exhibit 10.1 to the Company’s Current Report on Form 8-K filed on November 9, 2004. |
| |
| 10.22 | | Finished Product Supply Agreement dated July 14, 2004 between the Registrant and Janssen Pharmaceutica, NV, filed as Exhibit 10.25 to the Company’s Amendment No. 1 to the Registration Statement on Form S-1 (File No. 333-122261). |
| |
| 10.23 | | Product Acquisition Agreement dated February 5, 2005 between the Registrant and Moreland Enterprises Limited, filed as Exhibit 10.26 to the Company’s Amendment No. 2 to the Registration Statement on Form S-1 (File No. 333-122261). |
| |
| 10.24 | | Amendment No. 2 to the Intellectual Property Transfer and License Agreement, dated as of May 12, 2005, by and between the Registrant and Janssen Pharmaceutica Products, L.P., filed as Exhibit 10.1 to the Company’s Quarterly Report on Form 10-Q filed on August 11, 2005. |
F-28
| | |
Exhibit No. | | Description |
| 10.25 | | Scientific Advisory Board Consulting Agreement dated as of August 1, 2005 by and between the Registrant and Carl W. Ehmann, M.D., filed as Exhibit 10.2 to the Company’s Quarterly Report on Form 10-Q filed on August 11, 2005. |
| |
| 10.26 | | Amendment dated as of August 26, 2005 to the Finished Product Supply Agreement by and between the Registrant and Janssen Pharmaceutica, NV, filed as Exhibit 10.1 to the Company’s Quarterly Report on Form 10-Q filed on November 14, 2005. |
| |
| 10.27(1) | | Pharmaceutical Product Supply Agreement dated as of January 27, 2005 by and between the Registrant and DSM Pharmaceuticals, Inc., filed as Exhibit 10.32 to the Company’s Annual Report on Form 10-K on March 12, 2007. |
| |
| 10.28(1) | | Manufacturing Agreement dated as of March 31, 2005 by and between the Registrant and DPT Laboratories, Ltd., filed as Exhibit 10.33 to the Company’s Annual Report on Form 10-K on March 12, 2007. |
| |
| 10.29(1) | | Amendment No. 1 dated December 6, 2005 to Pharmaceutical Product Supply Agreement dated as of January 27, 2005 by and between the Registrant and DSM Pharmaceuticals, Inc., filed as Exhibit 10.34 to the Company’s Annual Report on Form 10-K on March 12, 2007. |
| |
| 10.30† | | Amended and Restated Employment Agreement, dated as of December 6, 2006, by and between the Registrant and Geert Cauwenbergh, Ph.D., filed as Exhibit 10.35 to the Company’s Annual Report on Form 10-K on March 12, 2007. |
| |
| 10.31† | | Amended and Restated Employment Agreement, dated as of December 6, 2006, by and between the Registrant and Charles Nomides, filed as Exhibit 10.36 to the Company’s Annual Report on Form 10-K on March 12, 2007. |
| |
| 10.32† | | Amended and Restated Employment Agreement, dated as of December 6, 2006, by and between the Registrant and Anne M. VanLent, filed as Exhibit 10.37 to the Company’s Annual Report on Form 10-K on March 12, 2007. |
| |
| 10.33† | | Amended and Restated Employment Agreement, dated as of December 6, 2006, by and between the Registrant and Alfred Altomari, filed as Exhibit 10.38 to the Company’s Annual Report on Form 10-K on March 12, 2007. |
| |
| 10.34† | | Amended and Restated Employment Agreement, dated as of April 1, 2004, by and between the Registrant and Albert Bristow, filed as Exhibit 10.39 to the Company’s Annual Report on Form 10-K on March 12, 2007. |
| |
| 10.35 | | Sales Force Services Agreement, dated as of March 2, 2007, by and between the Registrant and Novartis Consumer Health, Inc., filed as Exhibit 10.40 to the Company’s Annual Report on Form 10-K on March 12, 2007. |
| |
| 10.36(1) | | Supply Agreement, dated as of July 12, 2007, by and between the Registrant and Abbott GmbH & Co., KG, filed as Exhibit 10.1 to the Company’s Quarterly Report on Form 10-Q on August 8, 2007. |
| |
| 10.37 | | Credit and Security Agreement, dated as of June 29, 2007, by and between the Registrant and Merrill Lynch Capital, filed as Exhibit 10.2 to the Company’s Quarterly Report on Form 10-Q on August 8, 2007. |
| |
| 10.38 | | Revolving Loan Note, dated as of June 29, 2007, by and between the Registrant and Merrill Lynch Capital, filed as Exhibit 10.3 to the Company’s Quarterly Report on Form 10-Q on August 8, 2007. |
F-29
| | |
Exhibit No. | | Description |
| 10.39 | | Ownership Pledge, Assignment and Security Agreement, dated as of June 29, 2007, by and between the Registrant and Merrill Lynch Capital, filed as Exhibit 10.4 to the Company’s Quarterly Report on Form 10-Q on August 8, 2007. |
| |
| 10.40† | | Employment Agreement, dated as of May 16, 2007, by and between the Registrant and Dr. Braham Shroot, filed as Exhibit 99.2 to the Company’s current report on Form 8-K on May 16, 2007. |
| |
| 10.41 | | Letter Agreement, dated as of June 14, 2007, by and between the Registrant and Charles T. Nomides, filed as Exhibit 99.1 to the Company’s current report on Form 8-K on June 18, 2007. |
| |
| 10.42 | | Placement Agency Agreement, dated as of September 21, 2007, by and between the Registrant and J.P. Morgan Securities, Inc. filed as Exhibit 1.1 to the Company’s current report on Form 8-K on September 24, 2007. |
| |
| 10.43 | | Engagement Letter, dated as of September 21, 2007, by and between the Registrant and Pacific Growth Equities, LLC, filed as Exhibit 10.1 to the Company’s current report on Form 8-K on September 24, 2007. |
| |
| 10.44*(1) | | Third Party Manufacturing Agreement dated January 8, 2008 by and between the Registrant and Sanico, N.V. |
| |
| *21 | | List of Subsidiaries |
| |
| *23.1 | | Consent of Ernst & Young LLP |
| |
| *23.2 | | Power of Attorney (included on signature page) |
| |
| *31.1 | | Certification of principal executive officer required by Rule 13a-14(a) |
| |
| *31.2 | | Certification of principal financial officer required by Rule 13a-14(a) |
| |
| *31.3 | | Certification of principal accounting officer required by Rule 13a-14(a) |
| |
| ¤32.1 | | Section 1350 Certification of principal executive officer |
| |
| ¤32.2 | | Section 1350 Certification of principal financial officer |
| |
| 32.3 | | Section 1350 Certification of principal accounting officer |
| † | Compensation plans and arrangements for executives and others. |
| (1) | Portions of the Exhibit have been omitted and have been filed separately pursuant to an application for confidential treatment granted by the Securities and Exchange Commission. |
F-30