Management’s Discussion and Analysis
The following Management’s Discussion and Analysis (“MD&A”) of the consolidated operating and financial performance of Claude Resources Inc. (“Claude” or the “Company”) for the three months ended March 31, 2012 with the corresponding period of 2011 is prepared as of May 10, 2012. This discussion is the responsibility of Management and has been prepared using International Financial Reporting Standards (“IFRS”), as issued by the International Accounting Standards Board. This discussion should be read in conjunction with the Company’s March 31, 2012 condensed consolidated financial statements and notes thereto and the Company’s 2011 annual MD&A and 2011 audited consolidated financial statements and notes thereto. The Board of Directors has approved the disclosure presented herein. All amounts referred to in this discussion are expressed in Canadian dollars, except where otherwise indicated.
Overview
Claude Resources Inc., incorporated pursuant to the Canada Business Corporations Act, is a gold producer with shares listed on both the Toronto Stock Exchange (TSX-CRJ) and the NYSE Amex (NYSE Amex-CGR). The Company is also engaged in the exploration and development of gold mineral reserves and mineral resources. The Company’s entire asset base is located in Canada. Its main revenue generating asset is the 100 percent owned Seabee Gold Operation, located in northern Saskatchewan. Claude also owns 100 percent of the Amisk Gold Project in northeastern Saskatchewan and 100 percent of the 10,000 acre Madsen Property located in the Red Lake gold camp of northwestern Ontario.
Production, Exploration, Financial and Corporate Development Highlights
Production
| · | Q1 2012 production of 9,574 ounces of gold (Q1 2011: 9,539 ounces of gold). |
| · | Seabee Central Milling Facility expanded to a peak capacity of 1,050 tonnes. Further expansion is underway to enable a sustained capacity of over 1,000 tonnes. |
| · | Seabee Mine Shaft Extension Project to be completed in second half of 2012. |
| · | Expansion to Seabee Camp Facilities ongoing. |
Exploration
| · | Positive Metallurgical results at the Amisk Gold Project. Initial metallurgical testing indicates that gold and silver mineralization is amenable to conventional cyanide leaching. Results from testing on three composite samples from the Amisk Gold Deposit have returned an average of 89.4 percent recovery for gold, ranging from 85.2 percent to 91.7 percent and an average of 80.8 percent recovery for silver, ranging from 66.4 percent to 92.8 percent. |
| · | Inferred resource base at Seabee Gold Operation increased 236 percent. The inclusion of the L62 Zone and Santoy Gap deposits into Mineral Reserves and Mineral Resources came only six and nine months after their respective discoveries. More importantly, these discoveries are in close proximity to current mining infrastructure and will be integrated into an updated life of mine plan anticipated during the third quarter. The increase in resource ounces in 2011 demonstrates the potential that exists at the Seabee Gold Operation. |
| · | As a follow-up to the Company’s 2011 exploration programs, Claude has budgeted approximately $15.5 million to support the continuation of its extensive exploration programs at the Seabee, Amisk and Madsen Properties during 2012. At the Seabee Gold Operation, the Company plans to drill 130,000 metres (70,000 metres regionally and 60,000 metres underground) during 2012. At Madsen, Claude has approved a 29,000 metre underground and surface exploration program. The program will include two underground rigs and one surface rig, targeting to complete 40 to 50 holes. Exploration will focus on continued testing of the 8 Zone Trend as well as the McVeigh and Austin Tuff depth continuity. Finally, at the 24,350 hectare Amisk Gold Project, Claude will update its National Instrument 43-101 resource calculation, conduct an external Preliminary Economic Assessment and an evaluation of the underground potential. |
Q1 2012 Management’s Discussion and Analysis
(inthousands of CDN dollars, except as otherwise noted) | Page 2 |
Financial
| · | Net loss of $0.5 million, or $0.00 per share, for the three months ended March 31, 2012 (March 31, 2011 – net profit of $1.8 million, or $0.01 per share). |
| · | Cash flow from operations(1) before net changes in non-cash operating working capital of $2.6 million, or $0.02 per share, for the three months ended March 31, 2012, down 28 percent from $3.6 million, or $0.03 per share, for the three months ended March 31, 2011. |
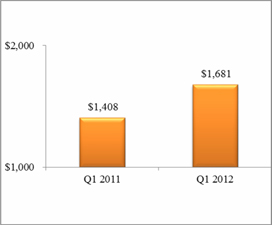
| · | Gold sales during the first quarter of 2012 of 9,547 ounces at an average price of $1,681 (U.S. $1,679) for revenue of $16.1 million, up 21 percent from first quarter 2011 revenue of $13.3 million. This was in line with Management’s forecast for the first quarter. |
| · | $16.4 million of cash, cash equivalents and short term investments and working capital of $16.2 million as at March 31, 2012. |
Corporate Development
| · | During the first quarter of 2012, the Company announced the closing of its acquisition of all of the outstanding shares of St. Eugene Mining Corporation Limited (“St. Eugene”; TSXV: SEM) that it did not already own. The transaction was accomplished pursuant to the terms of a court approved plan of arrangement completed under the Business Corporations Act (British Columbia) (the “Arrangement”). Under the Arrangement, Claude acquired all of the outstanding common shares of St. Eugene in exchange for the issuance of approximately 8.7 million common shares of Claude. In addition to Claude shares, former shareholders of St. Eugene also received 0.25 of a common share of Satori Resources Inc. (“Satori”). As part of the Arrangement, Claude also exchanged all outstanding warrants of St. Eugene for warrants of Claude and reduced its existing net smelter return royalty on the Tartan Lake Mine Project from a sliding scale to 2 percent. Upon closing of the transaction, Claude received the same pro-rata stake in Satori that it had in St. Eugene. |
mission and vision
The Company’s mission is to create and deliver significant stakeholder value through the exploration, development and mining of gold and other precious metals. Its vision is to be valued by all stakeholders for its ability to discover, develop and produce gold and other precious metals in a disciplined, safe, environmentally responsible and profitable manner.
goals and key performance drivers – Measuring the Company’s Results
The Company’s goals and key performance drivers include:
| · | Pursuing best practices in the areas of safety, health and the environment; |
| · | Increasing its resource base through aggressive exploration programs; |
| · | Improving operating margins at the Seabee Gold Operation; |
| · | Strengthening the Balance Sheet and maintaining liquidity in order to reduce financial risk; |
| · | Consider strategically attractive opportunities and accretive transactions; and |
| · | Ensuring that the Company’s share price reflects underlying value. |
Safety, Health and the Environment
The Company strives to protect the safety and health of its employees and the environment it operates in. Claude is continuing to look for ways to improve processes to increase safety, health and environmental performance.
Q1 2012 Management’s Discussion and Analysis
(inthousands of CDN dollars, except as otherwise noted) | Page 3 |
During the first quarter of 2012, the Company continued with pursuing best practices in the areas of safety health and the environment and its stated goal of “Mission Zero” in matters related to Safety, Health and the Environment. Claude has expanded its Safety, Training and Environmental Departments as well as retained external professionals to conduct periodic reviews of its work practices, workplaces and Management Systems. As part of Claude’s commitment towards “Zero Injury” and “Zero Environmental Exceedence”, the Company established operational objectives of reducing these incidents year over year.
To measure its objectives relating to safety, health and the environment, the Company utilizes a Safety, Health and Environment Managements System (“SHEMS”). For Health and Safety, the Company also utilizes the Total Recordable Incident Rate (“TRIR”) metric, a common industry rating that is used to determine the number of serious injuries (medical incidents and higher) that a company has for every 200,000 hours worked. Management utilizes the TRIR metric because it considers all incidents that have caused serious harm to the Company’s workforce, thereby enabling the Company to be more proactive with its policies and procedures designed to improve and maintain safety.
By the end of 2011, the Company’s TRIR was 6.7 per 200,000 hours, an improvement of 40 percent since 2008. Despite this improvement, at March 31, 2012, the Company’s TRIR increased to 8.2 per 200,000 hours, slightly above the Company’s target of 7.0. Systems and processes are being monitored with the intention of improving this statistic.
Management believes having success in these critical areas will place Claude in a position to be recognized as a leader in matters related to Safety, Health and the Environment.
Increasing Claude’s Resource Base Through Aggressive Exploration Programs
During the first quarter of 2012, the Company continued with its objective of increasing its resource base through aggressive exploration programs at its Seabee Gold Operation, Amisk Gold Project and Madsen Property.
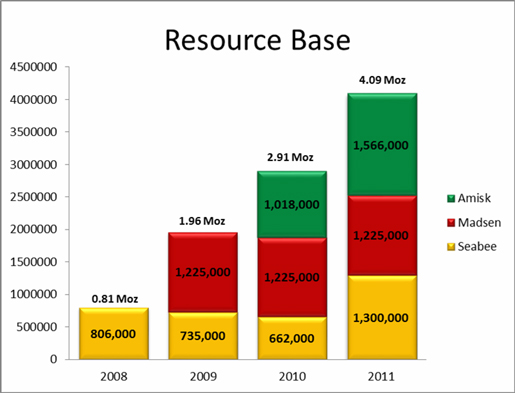
Since 2008, the Company’s NI 43-101 Resource Base has increased over 400 percent. This increase is attributable to the discovery and delineation of the L62 and Santoy Gap deposits, which increased Mineral Reserves and Mineral Resources at the Seabee Gold Operation from 662,000 ounces to 1,300,000 ounces. Results from exploration at the Company’s Amisk (1,566,000 gold equivalent ounces) and Madsen (1,255,000 ounces) projects have also contributed to this increase.
As a follow-up to the Company’s 2011 exploration programs, Claude has budgeted approximately $15.5 million to support the continuation of its extensive exploration programs at the Seabee, Amisk and Madsen Properties during 2012. At the Seabee Gold Operation, the Company plans to drill 130,000 metres (70,000 metres regionally and 60,000 metres underground) during 2012. At Madsen, Claude has approved a 29,000 metre underground and surface exploration program. The program will include two underground rigs and one surface rig, targeting to complete 40 to 50 holes. Exploration will focus on continued testing of the 8 Zone Trend as well as the McVeigh and Austin Tuff depth continuity. Finally, at the 24,350 hectare Amisk Gold Project, Claude will update its National Instrument 43-101 resource calculation, conduct an external Preliminary Economic Assessment and an evaluation of the underground potential.
Looking forward, the Company is focused on expanding its exploration program to continue to add to its ounces in inventory in politically safe Canada.
Seabee Gold Operation
At the Seabee Gold Operation, exploration targets include the Seabee Gold Mine, Santoy 8 Gold Mine, Santoy Gap, L62 Zone and Neptune. During 2011, the Company focused its gold exploration efforts on drilling at Seabee Deep, at L62, at the Santoy Gap and on continued development of satellite ore bodies.
The newly discovered L62 Zone is located approximately 200 metres from existing development and operations on multiple levels in the hanging wall of the Seabee Mine. High grade results from the L62 Zone will have a positive impact on the Seabee Mine’s production profile during 2012.
Q1 2012 Management’s Discussion and Analysis
(inthousands of CDN dollars, except as otherwise noted) | Page 4 |
The Santoy Gap drill program has intercepted multiple high-grade intervals, significantly expanding the strike length and width of the mineralized system. Drilling has intercepted multiple high-grade intervals, significantly expanding the strike length and width of the mineralized system and has expanded the Santoy Gap and Santoy 8 system to in excess of 1.8 kilometres long.
As a follow-up to the successful 2011 drill program at the Seabee Gold Operation, the Company has planned a 130,000 metre program for 2012.
Amisk Gold Project
The Amisk Gold Property is located 20 kilometres southwest of Flin Flon, Manitoba and hosts the Amisk Gold Deposit, the past-producing Monarch Mine, as well as a large number of gold occurrences and prospects. At 24,350 hectares, this gold and silver exploration property is one of the largest land positions in the Flin Flon mineral district.
In 2010, SRK Consulting (Canada) Inc. (“SRK”) was engaged to prepare an independent mineral resource evaluation and Technical Report for the Amisk Gold Project. The independent mineral resource statement was released in the first quarter of 2011 and outlined an Indicated Resource of 921,000 ounces of 0.95 grams of gold equivalent (“Au Eq”) per tonne and an Inferred Resource of 645,000 ounces at 0.70 grams of Au Eq per tonne. This geological model and open pit resource estimate was generated through the successful integration of the Company’s 2010 exploration program with historic drilling and was the culmination of an aggressive 12 month exploration program and is a major milestone for the Amisk Gold Project and Claude.
During the second half of 2011, positive metallurgical and engineering results were reported from the Amisk Gold Project. Initial metallurgical testing indicates that gold and silver mineralization is amenable to conventional cyanide leaching. Results from testing on three composite samples from the Amisk Gold Deposit have returned an average of 89.4 percent recovery for gold, ranging from 85.2 percent to 91.7 percent and an average of 80.8 percent recovery for silver, ranging from 66.4 percent to 92.8 percent. In addition to positive metallurgical testing, a total of 20 holes and 6,480 metres were drilled during 2011. The program tested from surface to in excess of 700 metres depth and was designed to expand the limits of the Amisk Gold Deposit as well as infill within the northern and eastern portion of the deposit. The 20 drill holes successfully confirmed continuity of gold mineralization within the northern and eastern portion of the deposit as well as demonstrated the potential for expansion to the east and southeast.
During 2012, the Company will update Amisk’s National Instrument 43-101 resource calculation, conduct an external Preliminary Economic Assessment and will plan further exploration programs on the property, including further evaluation of the underground potential.
Madsen Property
During 2012, the Company has budgeted a 29,000 metre, underground and surface-based drill program. The program will include two underground rigs and one surface rig, targeting to complete 40 to 50 holes.
At the Madsen Property, the system remains open in all directions and shows strong similarities to high grade mineralization characteristic of the Red Lake Belt. Claude’s objective is to fully assess the potential for high grade gold mineralization while continuing to de-water the Madsen shaft to provide additional underground exploration access. Phase I underground drilling of the 8 Zone program, from the 10th level, confirmed high grade mineralization 450 feet(2) down plunge of the historic stopes within the 8 Zone as well as confirming the existence of a sub-parallel footwall target. Phase I underground drilling demonstrated that the 8 Zone is a series of high-grade, quartz-vein systems and silicification associated with a complexly-folded package of mafic and ultramafic lithologies.
Q1 2012 Management’s Discussion and Analysis
(inthousands of CDN dollars, except as otherwise noted) | Page 5 |
At Madsen, the Company believes that success from the Phase II drill program has the potential to significantly grow the Company’s existing resource base at the fully-permitted and infrastructure-rich Madsen property. Phase II of the underground 8 Zone drill program continued to be a top priority for Management. Underground 8 Zone drilling from the 16th level commenced early in the second quarter of 2011 and was ongoing throughout the first quarter of 2012 with two rigs active underground exploring the 8 Zone Trend. An additional surface rig at surface was exploring the Austin Deep target.
De-watering was ongoing throughout the first quarter of 2012 with water levels below the 17th level (there are a total of 24 levels in the Madsen Shaft).
2012 Exploration Program
Continued success from the Company’s exploration programs should serve to:
| · | further extend the mine life at Seabee; |
| · | potentially improve the project economics at the Company’s Amisk and Madsen Projects; and |
| · | further increase the Company’s total resource base. |
As a follow-up to the Company’s 2011 exploration programs, Claude has budgeted approximately $15.5 million to support the continuation of its extensive exploration programs at the Seabee, Amisk and Madsen Properties during 2012. At the Seabee Gold Operation, the Company plans to drill 130,000 metres (70,000 metres regionally and 60,000 metres underground) during 2012. At Madsen, Claude has approved a 29,000 metre underground and surface exploration program. The program will include two underground rigs and one surface rig, targeting to complete 40 to 50 holes. Exploration will focus on continued testing of the 8 Zone Trend as well as the McVeigh and Austin Tuff depth continuity. Finally, at the 24,350 hectare Amisk Gold Project, Claude will update its National Instrument 43-101 resource calculation, conduct an external Preliminary Economic Assessment and an evaluation of the underground potential.
Improving Operating Margins at the Seabee Gold Operation
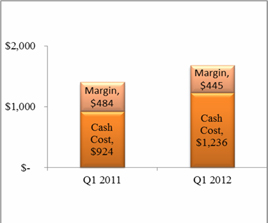
The combination of strong average realized gold prices per ounce during the first quarter of 2012 offset by increased mine operating costs, period over period, has contributed to a decrease in operating margins for the Company. During the first quarter of 2012, net cash margin(3) decreased to $445 per ounce from $484 per ounce in the first quarter of 2011.
For the three months ended March 31, 2012, Claude realized a gold price of $1,681 (U.S. $1,679); March 31, 2011 - $1,408 (U.S. $1,428). For the quarter ended March 31, 2012, total cash cost per ounce(4) was CDN $1,236 (U.S. $1,234), up 34 percent from the cash cost per ounce of CDN $924 (U.S. $937).
 | |  |
| | | |
| Figure 1: Average Gold Price Realized (CDN$) | | Figure 2: Cash Cost and Margin Realized (CDN$) |
| Per Ounce Sold | | Per Ounce Sold |
Q1 2012 Management’s Discussion and Analysis
(inthousands of CDN dollars, except as otherwise noted) | Page 6 |
| Table 1: Calculation of Net Cash Margin per Ounce |
| | | March 31 | | | March 31 | |
| | | 2012 | | | 2011 | |
| | | | | | | |
| Revenue (thousands) | | $ | 16,052 | | | $ | 13,322 | |
| Divided by ounces sold | | | 9,547 | | | | 9,461 | |
| Average Realized Price per Ounce | | $ | 1,681 | | | $ | 1,408 | |
| | | | | | | | | |
| Production costs (thousands) | | $ | 11,796 | | | $ | 8,746 | |
| Divided by ounces sold | | | 9,547 | | | | 9,461 | |
| Total cash costs per ounce | | $ | 1,236 | | | $ | 924 | |
| | | | | | | | | |
| Net Cash Margin per Ounce Sold | | $ | 445 | | | $ | 484 | |
During 2012, the Company will focus on improving profitability of the Seabee Gold Operation through a combination of improved grade control, cost controls and developing the production profile at lower cost satellite ore bodies, including Santoy 8.
The Santoy Region is located approximately 14 kilometres east of the Seabee Gold Operation’s central Milling Facility and is accessed via an all-weather road. The Company anticipates the Santoy 8 Project to provide up to 50 percent of the overall feedstock to the Seabee Gold Operation’s central Milling Facility and anticipates this contribution to be a positive catalyst in improving production and lowering overall unit operating costs at the Seabee Gold Operation.The Santoy 8 Gold Project achieved commercial production during the first quarter of 2011. This accomplishment is a major milestone for the Company and represents a real opportunity for the Seabee Gold Operation to grow its production profile.
Financial Capacity and Highlights
At March 31, 2012, the Company had total Cash and cash equivalents of $8.4 million and short-term investments of $8.0 million.Working capital at March 31, 2012 was $16.2 million (December 31, 2011 - $42.4 million). Working capital decreased from December 31, 2011 due to the successful completion of the Company’s annual winter resupply at the Seabee Gold Operation, where mobile production equipment and consumable inventory required for the upcoming production year are trucked in to site via a winter ice road.
For the three months ended March 31, 2012, net cash provided by operating activities was $3.3 million (March 31, 2012 - $3.8 million). For the quarter ended March 31, 2012, cash flow from operations(1) before net changes in non-cash operating working capital decreased 28 percent to $2.6 million, or $0.02 per common share, from $3.6 million, or $0.03 per common share, for the quarter ended March 31, 2011.
Strategically Attractive and Accretive Transactions
Early in the third quarter of 2011, the Company announced that it had approached the Board of Directors of St. Eugene with a proposal to enter into a letter of intent for a share exchange transaction for 100 percent of St. Eugene at a significant premium to its trading price. On October 25, 2011, Claude and St. Eugene jointly announced that they had entered into a definitive agreement pursuant to which Claude would acquire, by way of a court-approved plan of arrangement, all of the shares of St. Eugene that it did not already own. The acquisition closed on February 1, 2012 and is the logical consolidation of the Amisk Gold Project. Claude issued 8.7 million shares as consideration for the purchase of 100 percent of the shares.
Looking forward, Management remains focused on executing strategically attractive and accretive transactions that are consistent with the strategic plan and focus of the Company.
Q1 2012 Management’s Discussion and Analysis
(inthousands of CDN dollars, except as otherwise noted) | Page 7 |
Shareholder Value
Notwithstanding Claude’s share price performance in recent months, Management believes that shareholder value has been created by: (1) significantly increasing the Company’s resource base; and (2) taking steps to complete accretive and strategically attractive transactions. Management is confident that the combination of the Company’s Seabee, Amisk and Madsen properties are a strong production and asset base in the politically safe jurisdiction of Canada. During 2012 and beyond, the Company will continue to advance these projects in order to further develop shareholder value.
The Company intends to further build shareholder value by:
| · | advancing the Company's exploration programs at its Seabee (L62, Santoy Gap, Neptune), Amisk and Madsen properties; |
| · | investing in capital infrastructure development programs at the Seabee Gold Operation including an extension of the Seabee Mine shaft, an expansion to the Seabee Central Milling Facility, an expansion to Camp Facilities and additional production equipment; and |
| · | continuing dewatering and rehabilitation programs at the Company's Madsen Project. |
Mining Operations Results
Seabee Gold Operation
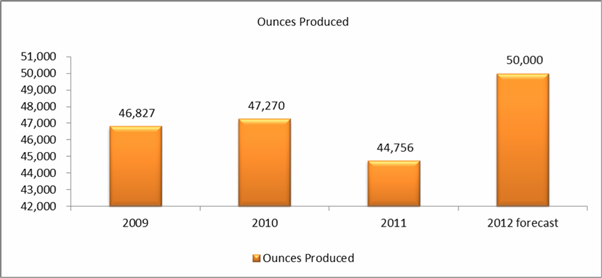
For 2012, forecast gold production at the Seabee Operation is estimated to range between 50,000 and 52,000 ounces of gold. When taking into consideration the Company’s Mill Expansion Project, Shaft Extension Project and contribution of higher grade ore from the L62 Zone, Management forecasts that production will be highest in the second and fourth quarters. Unit costs for 2012 are estimated to be similar to 2011.
Figure 3: Seabee Gold Operation Annual Production and 2012 Forecast Production
Notes:
| · | 2009 production includes ounces produced and tonnes milled from the Porky Lake bulk sample; and |
| · | 2010 production includes ounces produced and tonnes milled from the Santoy 8 Project prior to it achieving commercial production. |
During the three months ended March 31, 2012, throughput originated from the Seabee Mine and the Santoy 8 Mine.
Q1 2012 Management’s Discussion and Analysis
(inthousands of CDN dollars, except as otherwise noted) | Page 8 |
For the three months ended March 31, 2012, Claude milled 66,556 tonnes at a grade of 4.74 grams of gold per tonne (three months ended March 31, 2011 – 50,501 tonnes at 6.20 grams of gold per tonne).
During the first quarter of 2012, produced ounces were relatively unchanged period over period (March 31, 2012 - 9,574; March 31, 2011 – 9,539 ounces); these results were consistent with Management’s guidance for the quarter. Mill recoveries were relatively unchanged period over period.
| Table 2: Seabee Gold Operation Quarterly Production and Cost Statistics |
| | | March 31 | | | March 31 | |
| | | 2012 | | | 2011 | |
| | | | | | | |
| Tonnes Milled | | | 66,556 | | | | 50,501 | |
| Head Grade (grams per tonne) | | | 4.74 | | | | 6.20 | |
| Recovery (%) | | | 94.4 | % | | | 94.8 | % |
| Gold Produced (ounces) | | | 9,574 | | | | 9,539 | |
| Gold Sold (ounces) | | | 9,547 | | | | 9,461 | |
| Production Costs (CDN$ million) | | $ | 11.8 | | | $ | 8.7 | |
| Cash Cost per Ounce (CDN$/oz)(4) | | $ | 1,236 | | | $ | 924 | |
| Cash Cost per Ounce (US$/oz)(4) | | $ | 1,234 | | | $ | 937 | |
Seabee Mine
During the first quarter of 2012, 7,106 ounces were produced from ore extracted from the Seabee Mine (March 31, 2011 – 7,448 ounces). This decrease was attributable to a 17 percent decrease in grade partially offset by increased throughput period over period to the Seabee Gold Operation’s Central Milling Facility.
| Table 3: Seabee Mine Production Statistics |
| | | March 31 | | | March 31 | |
| | | 2012 | | | 2011 | |
| | | | | | | |
| Tonnes Milled | | | 40,143 | | | | 35,765 | |
| Tonnes per Day | | | 441 | | | | 397 | |
| Head Grade (grams per tonne) | | | 5.81 | | | | 6.83 | |
| Gold Produced (ounces) | | | 7,106 | | | | 7,448 | |
At the L62 Zone, the series of intercepts with above average true widths and economic gold grades represent a near term opportunity to improve operating margins at the Seabee Operation. These intercepts are near existing underground infrastructure and underground development towards the L62 Zone commenced in October 2011. The Company anticipates incorporating the L62 Zone into Seabee’s production profile in the second half of 2012.
Santoy 8 Mine
Claude views the Santoy 8 Mine, which achieved commercial production during the first quarter of 2011, as a key driver in the expansion of the Seabee Gold Operation and in lowering unit operating costs and increasing production over the life of mine plan.
Feedstock from the Santoy 8 Mine produced 2,468 ounces of gold (March 31, 2011 – 2,091 ounces). This result was attributable to increased tonnes per day from Santoy 8 partially offset by a decrease in grade period over period. Santoy 8 tonnes per day were in line with Management’s expectation for the first quarter.
Q1 2012 Management’s Discussion and Analysis
(inthousands of CDN dollars, except as otherwise noted) | Page 9 |
| Table 4: Santoy 8 Mine Production Statistics |
| | | March 31 | | | March 31 | |
| | | 2012 | | | 2011 | |
| | | | | | | |
| Tonnes Milled | | | 26,413 | | | | 14,736 | |
| Tonnes per Day | | | 290 | | | | 164 | |
| Head Grade (grams per tonne) | | | 3.12 | | | | 4.67 | |
| Gold Produced (ounces) | | | 2,468 | | | | 2,091 | |
During 2012 and beyond, Claude is well positioned to execute on the expansion of its production profile and lowering unit costs over the next several years by maximizing gold output from the near surface Santoy 8 and Santoy Gap deposits as well as increasing margins at the Seabee Mine via a shaft extension project. Forecast production from the Santoy 8 Mine is expected to gradually increase to 500 tonnes per day by 2013.
Annual Winter Road
Access to the Seabee Gold Operation is by fixed wing aircraft to an airstrip located on the property. Equipment and bulky or heavier supplies are trucked to the site via a 60 kilometre annual winter road from Brabant Lake on Highway 102. The winter road is typically in use from January through March. Beginning early in the first quarter, preparation of the winter road was completed and over 500 semi-trailer loads of equipment and supplies were transported to the Seabee Gold Operation over the remainder of the quarter (2011 winter road – over 400 semi-trailer loads).
Mill Expansion
The Seabee Gold Operation’s Central Milling Facility consists of a three stage crushing circuit, a three stage grinding circuit, followed by leaching. The Central Milling Facility was recently expanded to a peak capacity of 1,050 tonnes, with the operation budgeted to sustain approximately 800 tonnes per day on average under the Seabee Gold Operation’s current Life of Mine Plan. During the first quarter, major upgrade work on the #1 regrind ball mill was completed and an upgrade to the CIP tanks is targeted for completion in mid to late second quarter.
Further expansions to the Central Milling Facility are being evaluated to accommodate future sustained capacity and production increases.
Shaft Extension
During 2011, the Company commenced a shaft extension at the Seabee Mine which will see the shaft deepened from 600 metres to 980 metres. The shaft extension project was undertaken to provide more efficient transportation of ore and waste from underground to surface. With higher grade ore at Seabee Deep and the L62 Zone, it is anticipated that the shaft extension will provide a reduction in unit cash costs.
All of the capital acquisitions relating to the shaft extension (including a new rock breaker, loading pocket, electrical drive with hoist controls and control centre) have been brought to the Seabee Gold Operation on the annual winter road for installation after the shaft has been completed.
On the vertical development portion of the extension, the Company has completed mining and timbering two out of three legs. Approximately 75 percent of the final leg has been completed. Vertical development is running on schedule and anticipated to be completed during the third quarter.
On the horizontal development, the Company has completed 620L, 720L, 860L 1000L shaft bottom, the loading pocket access and 50 percent of the rock breaker infrastructure. It is planned that in the next two months infrastructure for the rock breaker will be complete for third quarter commissioning.
Q1 2012 Management’s Discussion and Analysis
(inthousands of CDN dollars, except as otherwise noted) | Page 10 |
The next phase of the shaft extension project will be the construction phase which is going to involve the rock breaker set up, the loading pocket set up, the electrical drives installation, the rope change, the electrical cable installations and the plug removal.
In order to mitigate against reduced tonnage throughput as a result of the shaft tie-in, the Company is investigating the possibility of developing remnant stopes within the Seabee Mine at higher levels so that ore can be trucked to the surface. Also during this time, additional ore will be trucked from the Company’s Santoy 8 Mine.
Camp Expansion
In order to accommodate the increased workforce at the Seabee Gold Operation, the Company’s Board of Directors approved an expansion to Seabee’s camp facilities. On site construction of new accommodations began during the first quarter. Also, additional modular facilities were purchased and transported to the Seabee Gold Operation over the annual winter road. The installation of the modular facilities was completed early in the second quarter.
Exploration Results
Claude continued to advance its exploration and development strategy during the first quarter of 2012. Exploration at the Seabee Gold Operation focused on expanding and delineating the newly discovered L62 and Santoy Gap deposits and drill testing the Neptune target. At the Amisk Gold Project, exploration drilling continued to expand and confirm the National Instrument 43-101 open-pit resource estimate. At Madsen, the Company initiated a three-rig, 29,000 metre, surface and underground drill program. The program is focused on evaluating the 8 Zone Trend, the Austin and McVeigh Tuff and the Main Madsen Trend below the 4,000 foot level.
All exploration activities were carried out under the direction of Qualified Person, Brian Skanderbeg, P. Geo., Vice President Exploration.
Seabee Gold Operation
The Seabee Gold Operation includes 14,400 hectares and is comprised of five mineral leases and extensive surface infrastructure.
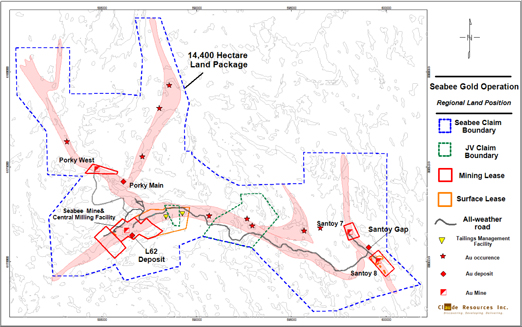
Figure 4: Seabee Property regional map showing significant gold deposits and occurrences.
Q1 2012 Management’s Discussion and Analysis
(inthousands of CDN dollars, except as otherwise noted) | Page 11 |
L62 Zone
The L62 Zone is located approximately 200 metres from existing Seabee Underground infrastructure on multiple levels. Highlights of recent drilling of the L62 results include:
| · | 27.06 grams of gold per tonne over 4.83 metres true width (U11-382); |
| · | 12.81 grams of gold per tonne over 6.70 metres true width (U11-649); |
| · | 14.83 grams of gold per tonne over 5.19 metres true width (U11-650); |
| · | 195.06 grams of gold per tonne over 2.29 metres true width (U11-651); |
| · | 22.03 grams of gold per tonne over 4.41 metres true width (U11-661); and |
| · | 24.16 grams of gold per tonne over 5.71 metres true width (U11-663). |
Drilling intercepted economic grades and widths approximately 25 metres along strike and 125 metres up-dip from previous high grade intercepts. The L62 Zone is now interpreted to have an estimated strike length of up to 85 metres and a dip length of 400 metres. Drilling immediately down plunge encountered sporadic economic grades, with the geological structure considered open in all directions.
| Table 5: Highlights of L62 Discovery |
| | | MIDPOINT | | | Au | | | TRUE | |
| | | COORDINATES | | | GRADE g/T | | | WIDTH | |
| HOLE # | | NORTH | | | EAST | | | ELEV | | | (uncut) | | | (m) | |
| | | | | | | | | | | | | | | | |
| U11-345 | | | 937 | | | | 1086 | | | | -555 | | | | 6.13 | | | | 4.8 | |
| U11-347 | | | 935 | | | | 1080 | | | | -538 | | | | 4.11 | | | | 3.3 | |
| U11-348 | | | 936 | | | | 1083 | | | | -493 | | | | 4.31 | | | | 2.5 | |
| U11-349 | | | 951 | | | | 1055 | | | | -513 | | | | 8.81 | | | | 4.9 | |
| U11-350 | | | 949 | | | | 1057 | | | | -559 | | | | 5.33 | | | | 4.8 | |
| U11-351 | | | 913 | | | | 1111 | | | | -514 | | | | 0.09 | | | | 4.6 | |
| U11-352 | | | 918 | | | | 1118 | | | | -549 | | | | 0.14 | | | | 4.8 | |
| U11-629 | | | 942 | | | | 1057 | | | | -399 | | | | 39.75 | | | | 10.0 | |
| including | | | | | | | | | | | | | | | 528.10 | | | | 0.7 | |
| U11-630 | | | 929 | | | | 1080 | | | | -403 | | | | 0.34 | | | | 3.9 | |
| U11-631 | | | 928 | | | | 1082 | | | | -423 | | | | 0.46 | | | | 4.2 | |
| U11-632 | | | 932 | | | | 1091 | | | | -476 | | | | 1.78 | | | | 5.3 | |
| U11-642 | | | 973.7 | | | | 1020.2 | | | | -326.1 | | | | 5.59 | | | | 4.0 | |
| U11-649 | | | 955.0 | | | | 1032.2 | | | | -356.4 | | | | 12.81 | | | | 6.7 | |
| U11-650 | | | 954.6 | | | | 1030.8 | | | | -330.2 | | | | 14.83 | | | | 5.2 | |
| U11-651 | | | 953.0 | | | | 1025.7 | | | | -306.1 | | | | 195.06 | | | | 2.3 | |
| including | | | | | | | | | | | | | | | 567.34 | | | | 0.8 | |
| U11-652 | | | 940.2 | | | | 1051.5 | | | | -350.6 | | | | 18.52 | | | | 3.7 | |
| U11-654 | | | 939.3 | | | | 1055.3 | | | | -373.1 | | | | 30.35 | | | | 2.4 | |
| U11-655 | | | 947.1 | | | | 1066.6 | | | | -437.2 | | | | 15.39 | | | | 2.7 | |
| U11-657 | | | 946.5 | | | | 1065.6 | | | | -528.9 | | | | 10.49 | | | | 5.5 | |
| including | | | | | | | | | | | | | | | 108.13 | | | | 0.5 | |
| U11-660 | | | 919.7 | | | | 1109.9 | | | | -415.1 | | | | 4.66 | | | | 4.5 | |
| U11-661 | | | 923.3 | | | | 1109.6 | | | | -446.0 | | | | 22.03 | | | | 4.4 | |
| including | | | | | | | | | | | | | | | 100.40 | | | | 0.9 | |
| U11-663 | | | 964.1 | | | | 1044.1 | | | | -446.2 | | | | 24.16 | | | | 5.7 | |
| including | | | | | | | | | | | | | | | 96.13 | | | | 0.9 | |
| U11-665 | | | 959.9 | | | | 1041.4 | | | | -509.1 | | | | 5.60 | | | | 1.8 | |
| U11-666 | | | 972.0 | | | | 1028.8 | | | | -428.3 | | | | 5.88 | | | | 4.7 | |
| U11-364 | | | 941.5 | | | | 1064.8 | | | | -667.2 | | | | 10.96 | | | | 1.9 | |
| U11-380 | | | 953.8 | | | | 1041.8 | | | | -230.0 | | | | 7.47 | | | | 1.6 | |
| U11-382 | | | 938.8 | | | | 1060.6 | | | | -360.3 | | | | 27.06 | | | | 4.8 | |
Note: Intervals noted are true width, have been composited across the entire structure and are uncut. Composites presented herein meet a minimum 10 gram-metre product and 3 g/T gold. Locations referenced are midpoint of the composite.
Q1 2012 Management’s Discussion and Analysis
(inthousands of CDN dollars, except as otherwise noted) | Page 12 |
Since discovery during the second quarter of 2011, the L62 Zone has been the focus of an aggressive exploration program and has grown rapidly.
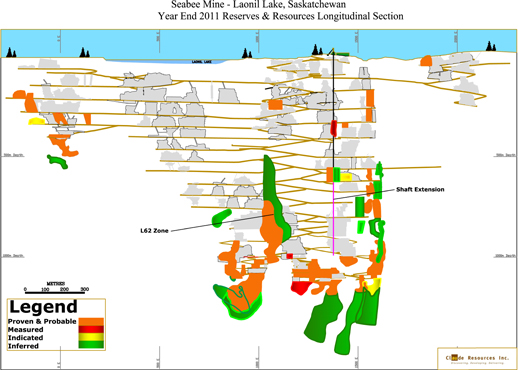
Figure 5: Seabee Mine Composite Longitudinal Section (L62 Zone Discovery)
Santoy Region
Gold mineralization at the Santoy Region is hosted in siliceous, shear structures with sulfide-chlorite-quartz veins and in silicified granitoid sills. The mineralized lenses dip moderately to steeply eastward and are interpreted to be amenable to bulk mining techniques. Gold mineralization of the Santoy 8 ore lens occurs over a strike length of 600 metres, a depth of 600 metres and remains open along strike and down plunge to the north. The Santoy 8E ore lens has been intercepted over a strike length of 200 metres, depth of 250 metres and remains open along strike and down plunge to the north. The true thickness of the Santoy 8 deposits varies from 1.5 metres to 15 metres. Underground infill and exploration drilling continues to confirm and expand the Santoy 8 system.
The Santoy Gap target is located 300 to 900 metres north of underground infrastructure, immediately on strike and adjacent to the Santoy 8 Mine. During 2011, 33,000 metres of drilling was completed in 82 holes. Drilling intercepted multiple high-grade intervals, significantly expanding the strike length and width of the mineralized system and has expanded the Santoy Gap and Santoy 8 system to in excess of 1.8 kilometres long. Significant assays from the 2011 program are highlighted below in Table 6.
Q1 2012 Management’s Discussion and Analysis
(inthousands of CDN dollars, except as otherwise noted) | Page 13 |
| Table 6: Highlights from 2011 Santoy Gap Drilling |
| Hole ID | | Easting | | | Northing | | | From (m) | | | To (m) | | | Au Grade
(g/t) | | | Width
(m) | |
| | | | | | | | | | | | | | | | | | | |
| JOY-11-565* | | | 599043 | | | | 6170888 | | | | 396.22 | | | | 397.68 | | | | 27.65 | | | | 1.46 | |
| JOY-11-588 | | | 599021 | | | | 6170706 | | | | 222.16 | | | | 231.94 | | | | 35.00 | | | | 9.78 | |
| | | | | | | | Incl | | | | 231.44 | | | | 231.94 | | | | 533.00 | | | | 0.50 | |
| JOY-11-589 | | | 599237 | | | | 6170826 | | | | 468.66 | | | | 470.63 | | | | 46.44 | | | | 1.97 | |
| JOY-11-594 | | | 598995 | | | | 6170771 | | | | 289.42 | | | | 291.70 | | | | 14.75 | | | | 2.28 | |
| | | | | | | | And | | | | 301.17 | | | | 305.21 | | | | 16.14 | | | | 4.04 | |
| JOY-11-600 | | | 598968 | | | | 6170808 | | | | 290.36 | | | | 291.77 | | | | 56.23 | | | | 1.41 | |
| JOY-11-606 | | | 599247 | | | | 6170665 | | | | 395.33 | | | | 403.13 | | | | 12.95 | | | | 7.80 | |
| | | | | | | | Incl | | | | 397.08 | | | | 400.14 | | | | 23.44 | | | | 3.06 | |
| JOY-11-611 | | | 599292 | | | | 6170777 | | | | 455.13 | | | | 458.95 | | | | 9.74 | | | | 3.82 | |
| | | | | | | | Incl | | | | 456.67 | | | | 457.81 | | | | 23.24 | | | | 1.14 | |
| JOY-11-535 | | | 599349 | | | | 6170487 | | | | 310.57 | | | | 316.00 | | | | 10.30 | | | | 5.43 | |
| JOY-11-549 | | | 599178 | | | | 6170745 | | | | 330.38 | | | | 336.62 | | | | 6.73 | | | | 6.24 | |
| JOY-11-551 | | | 599205 | | | | 6170769 | | | | 405.77 | | | | 408.59 | | | | 22.06 | | | | 2.82 | |
| JOY-11-554 | | | 599146 | | | | 6170803 | | | | 413.20 | | | | 415.44 | | | | 41.94 | | | | 2.24 | |
| JOY-11-555 | | | 599146 | | | | 6170803 | | | | 377.40 | | | | 397.65 | | | | 12.79 | | | | 20.25 | |
| | | | | | | | Incl | | | | 377.40 | | | | 378.40 | | | | 144.00 | | | | 1.00 | |
| JOY-11-556 | | | 599146 | | | | 6170803 | | | | 323.00 | �� | | | 343.48 | | | | 19.10 | | | | 20.48 | |
| | | | | | | | Incl | | | | 331.00 | | | | 331.59 | | | | 524.00 | | | | 0.59 | |
| JOY-11-580 | | | 599097 | | | | 6170891 | | | | 364.06 | | | | 365.78 | | | | 36.51 | | | | 1.72 | |
Note:* Partial result, certain assays within zone are pending. Composites calculated at 3.0 g/t cut-off and may include internal dilution. True width is interpreted to range from 70 to 95 percent drilled width..
The Santoy Gap drill program has expanded the gold-bearing structure to a strike length of over 600 metres, to depths in excess of 600 metres and has expanded the Company's National Instrument 43-101 resource base at the Seabee Project.
Based on the encouraging results from Santoy Gap, the Company has approved the 2012 Seabee exploration program to include 70,000 metres from surface, focusing largely on the Santoy Gap. The three to four rig program will focus on aggressively exploring the Santoy Gap target and its relationship to the Santoy 8 ore body to depths in excess of 750 metres.
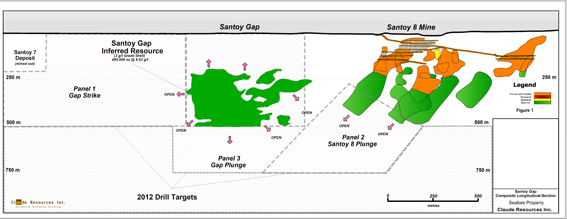
Figure 6: Santoy Region Composite Longitudinal Section.
Q1 2012 Management’s Discussion and Analysis
(inthousands of CDN dollars, except as otherwise noted) | Page 14 |
Neptune
The Neptune target is approximately six kilometres north of the Seabee Minesite. Exploration in this area is focused on the Pigeon Lake region utilizing geological, geochemical and geophysical surveys and historical drill data. The gold-in-soil anomaly exists along three sub-parallel trends spanning a width of at least 200 metres. Peak soil values of 111 parts per billion were obtained from minus 80 mesh soil samples obtained over and adjacent to outcropping mineralization. Prospector channel and grab samples from outcropping quartz vein-hosted mineralization returned values of up to 18.23 grams per tonne(please see Claude news release “Claude Resources Inc. Drills 13.6 Grams of Gold per Tonne Over 3.0 Metres at Neptune Target” dated March 23, 2011).
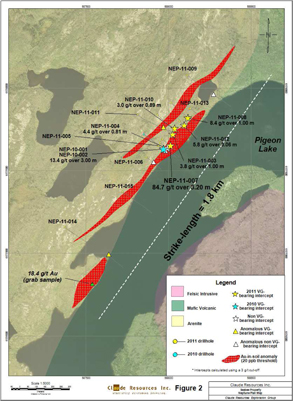
Figure 7: Neptune target showing significant gold intercepts and soil anomaly.
Initial drilling revealed high gold grades associated with sheeted quartz veins within several prospective zones of alteration and veining hosted within both arenite and basalt-derived, biotite-chlorite schist. The 2011 drill program confirmed the gold-bearing structure over a strike length of 1,200 metres to depths in excess of 250 metres and intersected high-grade gold within multiple structures with assay results of up to 84.66 grams of gold per tonne across 3.20 metres.Results from the 2011 winter drill program are presented in Table 7 below.
Q1 2012 Management’s Discussion and Analysis
(inthousands of CDN dollars, except as otherwise noted) | Page 15 |
| Table 7: Neptune Target Drill Results from 2011 Winter Drill Program |
| Hole ID | | Easting | | | Northing | | | Az/dip | | | From
(m) | | | Grade
(g/t) | | | Width
(m) | | | Visible
Gold |
| | | | | | | | | | | | | | | | | | | | | |
| NEP-11-003 | | | 587984 | | | | 6177748 | | | | 130/-45 | | | | 60.00 | | | | 3.78 | | | | 1.00 | | | YES |
| | | | | | | | And | | | | | | | | 112.00 | | | | Anomalous | | | | 2.90 | | | YES |
| | | | | | | | And | | | | | | | | 124.00 | | | | Anomalous | | | | 1.00 | | | YES |
| NEP-11-004 | | | 587950 | | | | 6177671 | | | | 130/-45 | | | | 108.81 | | | | 4.37 | | | | 0.81 | | | |
| NEP-11-005 | | | 587938 | | | | 6177652 | | | | 130/-45 | | | | 114.00 | | | | Anomalous | | | | 4.00 | | | |
| NEP-11-006 | | | 587865 | | | | 6177584 | | | | 130/-45 | | | | 90.39 | | | | Anomalous | | | | 0.61 | | | YES |
| NEP-11-007 | | | 587963 | | | | 6177692 | | | | 130/-45 | | | | 4.05 | | | | Anomalous | | | | 2.95 | | | YES |
| | | | | | | | And | | | | | | | | 48.30 | | | | 10.65 | | | | 0.50 | | | YES |
| | | | | | | | And | | | | | | | | 84.80 | | | | 84.66 | | | | 3.20 | | | YES |
| | | | | | | | Incl. | | | | | | | | 84.80 | | | | 218.00 | | | | 1.20 | | | YES |
| | | | | | | | And | | | | | | | | 111.11 | | | | 24.70 | | | | 0.82 | | | YES |
| NEP-11-008 | | | 588016 | | | | 6177912 | | | | 130/-45 | | | | 159.00 | | | | 8.38 | | | | 1.00 | | | YES |
| NEP-11-009 | | | 588113 | | | | 6178080 | | | | 130/-45 | | | | 290.65 | | | | Anomalous | | | | 2.35 | | | |
| NEP-11-010 | | | 587933 | | | | 6177839 | | | | 130/-45 | | | | 181.00 | | | | 3.01 | | | | 0.89 | | | YES |
| NEP-11-011 | | | 587812 | | | | 6177841 | | | | 130/-58 | | | | 308.82 | | | | Anomalous | | | | 2.00 | | | YES |
| NEP-11-012 | | | 588067 | | | | 6177801 | | | | 130/-45 | | | | 39.94 | | | | 5.82 | | | | 3.06 | | | YES |
| NEP-11-013 | | | 588131 | | | | 6177878 | | | | 130/-45 | | | | | | | | NSI | | | | | | | |
| NEP-11-014 | | | 587374 | | | | 6177159 | | | | 130/-45 | | | | 419.91 | | | | Anomalous | | | | 1.00 | | | YES |
| NEP-11-015 | | | 587722 | | | | 6177373 | | | | 130/-45 | | | | | | | | NSI | | | | | | | |
| Note: Intercepts calculated using a 3 g/t Au cut-off, Anomalous (0.1-3 g/t Au), No Significant Intercepts (“NSI”) |
To date, the Neptune target has only been tested on widely spaced centres, the limits of which are yet to be determined. These results demonstrate the potential for significant new discoveries and resource definition at the Seabee Operation. At Neptune, exploration efforts in 2011 included the completion of a 28 hole, 9,550 metre drill program designed to test the 1.8 kilometre strike length of the soil anomaly to vertical depths of up to 250 metres. Based on these encouraging results from Neptune, Claude completed further drilling in the first quarter of 2012.
Amisk Gold Project
The 24,350 hectare Amisk Gold Project (Figure 8) is located in the Flin Flon-Snow Lake Greenstone Belt. The project is host to the Amisk Gold Deposit, the past-producing Monarch Mine as well as a large number of gold occurrences and prospects. Extensive historic exploration from 1983 through 1998, including significant surface and underground drilling and bulk sampling, was completed by Saskatchewan Mining Development Corporation, Hudson Bay Mining and Smelting, Husky Oil and Claude. The property remained largely dormant from 1998 through 2009.
Q1 2012 Management’s Discussion and Analysis
(inthousands of CDN dollars, except as otherwise noted) | Page 16 |
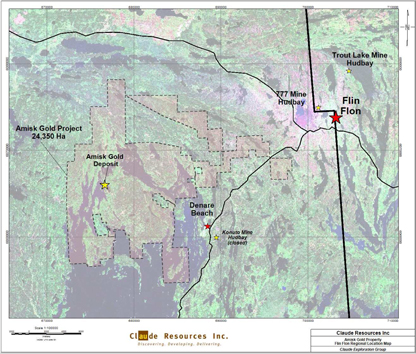
Figure 8: Amisk Gold Project
Results from a summer historic core sampling program and 2011 drilling expanded the mineralized system and confirmed grade continuity of the resource model. Gold and silver mineralization is associated with a sequence of quartz porphyritic, rhyolitic lapilli tuffs and flows hosting disseminations and stringers of pyrite, sphalerite, galena, tetrahedrite and chalcopyrite. Drilling has intercepted the mineralized system over a strike length of 1,200 metres, width of 400 metres and depths of in excess of 600 metres. The system remains open to the southwest, southeast, northwest and at depth.
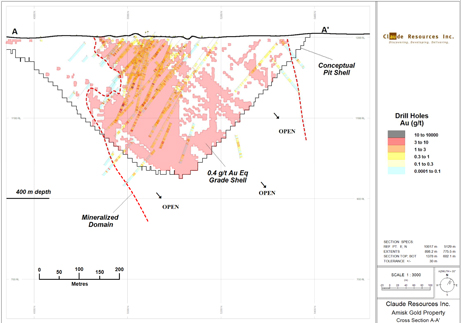
Figure 9: Cross Section A-A’ of the Amisk Gold Property
Q1 2012 Management’s Discussion and Analysis
(inthousands of CDN dollars, except as otherwise noted) | Page 17 |
During the third quarter of 2011, the Company reported positive metallurgical testwork results at the Amisk Gold Project. Initial metallurgical testing indicates that gold and silver mineralization is amenable to conventional cyanide leaching. Results from testing on three composite samples from the Amisk Gold Deposit have returned an average of 89.4 percent recovery for gold, ranging from 85.2 percent to 91.7 percent and an average of 80.8 percent recovery for silver, ranging from 66.4 percent to 92.8 percent. Detailed results are presented in the table below.
| Table 8: Metallurgical Testwork Results, Amisk Gold Project |
| | | Grade | | | Recovery
(Cyanidation) | | | Size
Fraction | |
| Composite ID | | Au
(g/T) | | | Ag
(g/T) | | | Au (%) | | | Ag (%) | | | P 80 (um)* | |
| Low Grade | | | 0.50 | | | | 7.4 | | | | 89.8 | | | | 70.9 | | | | 72 | |
| Medium Grade | | | 0.85 | | | | 9.2 | | | | 85.2 | | | | 88.9 | | | | 146 | |
| Medium Grade | | | 0.85 | | | | 9.2 | | | | 89.1 | | | | 84.8 | | | | 117 | |
| Medium Grade | | | 0.85 | | | | 9.2 | | | | 91.0 | | | | 92.8 | | | | 72 | |
| High Grade | | | 1.68 | | | | 8.4 | | | | 91.7 | | | | 66.4 | | | | 92 | |
| * Denotes size fraction of grind that 80 percent of material passed. | |
Based on the Metallurgical testwork work completed thus far, it is recommended that Amisk ore should be treated by conventional SAG and ball mill grinding to achieve a final grind not finer than 80 percent passing 75 microns. Further economic studies and tests need to be done to optimize the grind required. It is suggested that this optimized grind will lie between 72 and 117 microns. The correct process to recover gold and silver is direct whole ore cyanidation with carbon-in-pulp technology used to recover the leached gold and silver values. Reagent consumption in cyanidation was reasonable. Approximately 1 kilogram per tonne of NaCN (sodium cyanide) and 0.5 kilogram per tonne of lime will be required. Further cyanidation test work was recommended to identify optimum operating conditions.
The initial metallurgical and grinding mill engineering tests were conducted on 215 kg collected from half split core. Representative core intervals from eight drill holes were combined to create low, medium and high grade composites that assayed 0.50, 0.85 and 1.68 grams of gold per tonne and 7.4, 9.2 and 8.4 grams of silver per tonne. This mineralization is representative of the Amisk Gold Deposit and consists of trace to 10 percent disseminated pyrite and stringers with minor sphalerite, chalcopyrite, galena and tetrahedrite hosted in a sericitized quartz porphyry.
During 2011, a 20 hole, 6,480 metre drill program was completed on the Amisk Gold Project. This program focused specifically on testing the limits of the mineralized footprint north of the current pit outline, targeting depth extension below the pit bottom and infill drilling to evaluate potential upgrade of categories in the resource estimate completed by SRK. Twenty drill holes successfully confirmed continuity of gold mineralization within the northern and eastern portion of the deposit as well as demonstrated the potential for expansion to the east and southeast.
Q1 2012 Management’s Discussion and Analysis
(inthousands of CDN dollars, except as otherwise noted) | Page 18 |
| Table 9: 2011 summer and fall drill results from the Amisk Gold Project. |
| Hole | | Easting | | | Northing | | | Az/Dip | | | From
(m) | | | To (m) | | | Length
(m) | | | Au
(g/t) | | | Ag
(g/t) | |
| | | | | | | | | | | | | | | | | | | | | | | | | |
| AL-11-300 | | | 676827 | | | | 6066224 | | | | 80/-45 | | | | 50.00 | | | | 59.00 | | | | 9.00 | | | | 1.50 | | | | 9.2 | |
| and | | | | | | | | | | | | | | | 188.00 | | | | 244.50 | | | | 56.50 | | | | 0.58 | | | | 3.5 | |
| AL-11-301 | | | 676875 | | | | 6066233 | | | | 80/-45 | | | | 150.00 | | | | 171.00 | | | | 21.00 | | | | 1.15 | | | | 6.7 | |
| and | | | | | | | | | | | | | | | 205.00 | | | | 229.61 | | | | 24.61 | | | | 1.88 | | | | 12.4 | |
| AL-11-302 | | | 676910 | | | | 6066380 | | | | 80/-45 | | | | 96.00 | | | | 104.51 | | | | 8.51 | | | | 1.14 | | | | 4.5 | |
| AL-11-303 | | | 676910 | | | | 6066380 | | | | 283/-45 | | | | 18.00 | | | | 44.00 | | | | 26.00 | | | | 1.02 | | | | 4.3 | |
| AL-11-304 | | | 676910 | | | | 6066380 | | | | 0/-90 | | | | 93.41 | | | | 131.00 | | | | 37.59 | | | | 0.55 | | | | 2.8 | |
| AL-11-305 | | | 676900 | | | | 6066330 | | | | 80/-45 | | | | 175.47 | | | | 183.50 | | | | 8.03 | | | | 1.16 | | | | 6.2 | |
| AL-11-306 | | | 676885 | | | | 6066283 | | | | 80/-45 | | | | 40.25 | | | | 130.00 | | | | 89.75 | | | | 0.51 | | | | 2.5 | |
| AL-11-307 | | | 676921 | | | | 6066430 | | | | 80/-45 | | | | NSI | | | | | | | | | | | | | | | | | |
| AL-11-308 | | | 676921 | | | | 6066430 | | | | 285/-45 | | | | NSI | | | | | | | | | | | | | | | | | |
| AL-11-309 | | | 676900 | | | | 6066480 | | | | 283/-45 | | | | 18.92 | | | | 19.92 | | | | 1.00 | | | | 5.31 | | | | 13.1 | |
| AL-11-310 | | | 676900 | | | | 6066480 | | | | 0/-90 | | | | NSI | | | | | | | | | | | | | | | | | |
| AL-11-311 | | | 676900 | | | | 6066480 | | | | 283/-60 | | | | NSI | | | | | | | | | | | | | | | | | |
| AL-11-312 | | | 676877 | | | | 6066141 | | | | 70/-45 | | | | 69.50 | | | | 96.00 | | | | 26.50 | | | | 0.44 | | | | 1.5 | |
| and | | | | | | | | | | | | | | | 108.00 | | | | 132.00 | | | | 24.00 | | | | 0.51 | | | | 0.9 | |
| and | | | | | | | | | | | | | | | 191.15 | | | | 220.00 | | | | 28.85 | | | | 0.67 | | | | 2.8 | |
| AL-11-313 | | | 676838 | | | | 6066035 | | | | 105/-45 | | | | 37.85 | | | | 54.00 | | | | 16.15 | | | | 1.02 | | | | 7.4 | |
| and | | | | | | | | | | | | | | | 125.00 | | | | 147.00 | | | | 22.00 | | | | 0.54 | | | | 7.6 | |
| and | | | | | | | | | | | | | | | 185.00 | | | | 204.50 | | | | 19.50 | | | | 0.65 | | | | 2.3 | |
| and | | | | | | | | | | | | | | | 239.47 | | | | 276.00 | | | | 36.53 | | | | 0.61 | | | | 2.9 | |
| AL-11-314 | | | 676835 | | | | 6066052 | | | | 90/-45 | | | | 141.00 | | | | 164.00 | | | | 23.00 | | | | 0.76 | | | | 2.8 | |
| | | | | | | | | | | | | | | | | | | | | | | | | | | | | | | | | |
| Note: Intervals noted are intercepted width not true width, have been calculated using a 0.3 g/tonne cut-off and are uncut. True width is variable between 80 and 100 percent of drilled width. They may include internal dilution intervals of up to 6 metres. No significant Intercepts (“NSI”). |
Mineralization intercepted in the drilling is consistent with the current resource model and is associated with a sequence of quartz porphyritic, rhyolitic lapilli tuffs and basaltic tuffs hosting disseminations and stringers of pyrite, sphalerite, galena, tetrahedrite and chalcopyrite. The remaining holes are presented in Table 10 below. The program tested from surface to in excess of 700 metres depth and was designed to expand the limits of the Amisk Gold deposit as well as infill within the northern and eastern portion of the deposit.
Highlights of the drilling include: 6.24 grams of gold per tonne and 23.5 grams of silver per tonne over 12.00 metres and 3.39 percent zinc and 0.91 percent lead over 1.81 metres in hole AL-11-318, and 1.95 grams of gold per tonne and 14.9 grams of silver per tonne over 18.95 metres in AL-11-319. Mineralization intercepted in the drilling is consistent with the current resource model and is associated with a sequence of quartz porphyritic, rhyolitic lapilli tuffs and basaltic tuffs and argillite hosting disseminations, stringers and semi-massive intervals of pyrite, sphalerite, galena, tetrahedrite, pyrrhotite and chalcopyrite.
Drill hole AL-11-319 confirmed continuity of gold mineralization within the southeastern portion of the deposit as well as demonstrated the potential for expansion to the east and southeast. Four holes were completed evaluating the continuity of the system to depths in excess of 700 metres.
Q1 2012 Management’s Discussion and Analysis
(inthousands of CDN dollars, except as otherwise noted) | Page 19 |
| Table 10: 2011 Amisk Gold Project Fall Drill Results |
| Hole | | Easting | | | Northing | | | Az/Dip | | | From
(m) | | | Length
(m) | | | Au (g/t) | | | Ag (g/t) | | | Zn (%) | | | Pb (%) | |
| | | | | | | | | | | | | | | | | | | | | | | | | | | | |
| AL-11-315 | | | 676999 | | | | 6066416 | | | | 184/-62 | | | | 87.94 | | | | 12.22 | | | | 1.32 | | | | 6.7 | | | | - | | | | - | |
| Incl | | | | | | | | | | | | | | | 95.08 | | | | 1.92 | | | | 5.42 | | | | 30.8 | | | | - | | | | - | |
| AL-11-316 | | | 676868 | | | | 6066443 | | | | 177/-58 | | | | 92.00 | | | | 37.00 | | | | 0.49 | | | | 2.2 | | | | - | | | | - | |
| AL-11-317 | | | 676769 | | | | 6066515 | | | | 178/-58 | | | | 256.00 | | | | 16.50 | | | | 1.37 | | | | 5.7 | | | | - | | | | - | |
| Incl | | | | | | | | | | | | | | | 257.00 | | | | 3.00 | | | | 5.28 | | | | 22.4 | | | | - | | | | - | |
| AL-11-318 | | | 676444 | | | | 6066436 | | | | 166/-66 | | | | 69.00 | | | | 1.81 | | | | 0.17 | | | | 11.5 | | | | 3.39 | | | | 0.91 | |
| And | | | | | | | | | | | | | | | 311.00 | | | | 12.00 | | | | 6.24 | | | | 23.5 | | | | - | | | | - | |
| Incl | | | | | | | | | | | | | | | 313.85 | | | | 1.15 | | | | 62.00 | | | | 224 | | | | - | | | | - | |
| And | | | | | | | | | | | | | | | 643.5 | | | | 71.74 | | | | 0.6 | | | | 4.0 | | | | - | | | | - | |
| Incl | | | | | | | | | | | | | | | 699.5 | | | | 14.00 | | | | 1.64 | | | | 11.8 | | | | - | | | | - | |
| And | | | | | | | | | | | | | | | 728.00 | | | | 37.00 | | | | 0.61 | | | | 2.2 | | | | - | | | | - | |
| Incl | | | | | | | | | | | | | | | 763.00 | | | | 2.00 | | | | 5.71 | | | | 22.0 | | | | - | | | | - | |
| And | | | | | | | | | | | | | | | 809.39 | | | | 10.61 | | | | 1.65 | | | | 2.6 | | | | - | | | | - | |
| Incl | | | | | | | | | | | | | | | 809.39 | | | | 2.21 | | | | 6.06 | | | | 8.5 | | | | - | | | | - | |
| AL-11-319 | | | 676744 | | | | 6065948 | | | | 97/-47 | | | | 53.00 | | | | 32.00 | | | | 0.98 | | | | 7.1 | | | | - | | | | - | |
| Incl | | | | | | | | | | | | | | | 68.00 | | | | 1.00 | | | | 8.95 | | | | 39.7 | | | | - | | | | - | |
| And | | | | | | | | | | | | | | | 159.5 | | | | 29.00 | | | | 0.59 | | | | 5.6 | | | | - | | | | - | |
| And | | | | | | | | | | | | | | | 206.5 | | | | 21.00 | | | | 1.28 | | | | 8.5 | | | | - | | | | - | |
| Incl | | | | | | | | | | | | | | | 223.00 | | | | 1.50 | | | | 11.3 | | | | 45.3 | | | | - | | | | - | |
| And | | | | | | | | | | | | | | | 339.00 | | | | 18.95 | | | | 1.95 | | | | 14.9 | | | | - | | | | - | |
| Incl | | | | | | | | | | | | | | | 348.00 | | | | 3.01 | | | | 7.38 | | | | 57.7 | | | | - | | | | - | |
| AL-11-320 | | | 676709 | | | | 6065787 | | | | 105/-47 | | | | | | | | NSI | | | | | | | | | | | | - | | | | - | |
Note: Intervals noted are intercepted width not true width, have been calculated using a 0.3 g/tonne cut-off and are uncut. True width is variable between 60 and 100 percent of drilled width. They may include internal dilution intervals of up to 10 metres. No Significant Intercepts (“NSI”).
The 2011 Amisk drill program confirmed mineralization within the current resource model and to depths of 700 metres. In addition to focusing on growth of the gold and silver resource base, the presence of significant grades of zinc and lead in the hangingwall will be evaluated during 2012.
Looking forward at Amisk, exploration will focus on expansion of the open pit resource, completion of preliminary economic studies and further evaluation of the underground potential.
Madsen Project
The Madsen Project comprises over 10,000 acres (4,000 hectares) and, having produced in excess of 2.4 million ounces, is the third largest gold producer in the Red Lake camp in Ontario, Canada. Infrastructure includes a fully functional 500 ton per day mill, a 4,125 foot deep shaft and permitted tailings facility.
Initiated from the 10th level in December of 2008, the Phase I underground program included testing of the plunge extension of the 8 Zone as well as conceptual targets along the 8 Zone shear system. Results from Phase I deep drilling of the 8 Zone Trend demonstrated down plunge continuity to 450 feet below the 27th level with multiple holes returning strong visible gold associated with intensely silicified, biotite-altered basalt. See Table 11 for highlights of Phase I of the 8 Zone drill program. Step-out drilling to the east and west confirmed the development of favorable 8 Zone structure and stratigraphy. The system remains open down plunge and along strike to the east and west.
| Table 11: Highlights from Phase I of the 8 Zone drill program at the Madsen Mine, Ontario. |
| Hole ID | | From
(m) | | | To
(m) | | | Au
(g/t) | | | Length
(m) | | | Au
(oz/ton) | | | Length
(ft) | | | Visible
Gold
Noted |
| | | | | | | | | | | | | | | | | | | | | |
| MUG-08-01 | | | 883.00 | | | | 883.75 | | | | 127.12 | | | | 0.75 | | | | 3.71 | | | | 2.46 | | | ü |
| MUG-09-02b | | | 891.25 | | | | 891.70 | | | | 21.52 | | | | 0.45 | | | | 0.63 | | | | 1.48 | | | ü |
| MUG-09-03 | | | 915.40 | | | | 917.89 | | | | 33.39 | | | | 2.49 | | | | 0.97 | | | | 8.17 | | | ü |
| (incl) | | | | | | | | | | | 58.18 | | | | 1.25 | | | | 1.70 | | | | 4.10 | | | ü |
| MUG-09-04 | | | 909.55 | | | | 917.45 | | | | 25.77 | | | | 7.90 | | | | 0.75 | | | | 25.92 | | | ü |
| (incl) | | | | | | | | | | | 141.80 | | | | 0.95 | | | | 4.14 | | | | 3.12 | | | ü |
| MUG-09-05 | | | 943.51 | | | | 946.90 | | | | 24.30 | | | | 3.39 | | | | 0.71 | | | | 11.45 | | | ü |
| (incl) | | | | | | | | | | | 62.09 | | | | 1.22 | | | | 1.81 | | | | 4.00 | | | ü |
Q1 2012 Management’s Discussion and Analysis
(inthousands of CDN dollars, except as otherwise noted) | Page 20 |
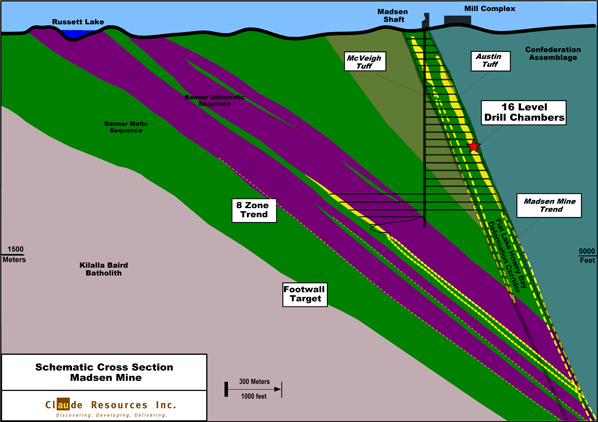
Figure 10: Madsen Mine Cross Section
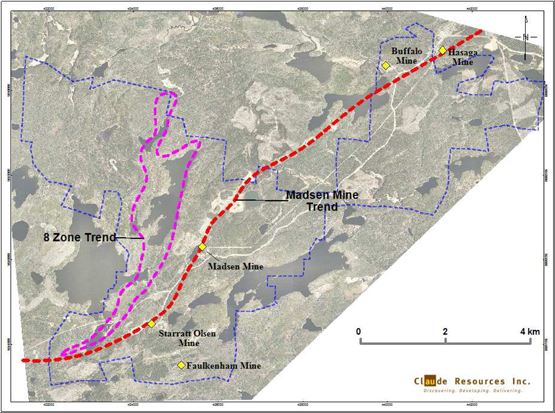
Figure 11: Madsen Property Overview
Q1 2012 Management’s Discussion and Analysis
(inthousands of CDN dollars, except as otherwise noted) | Page 21 |
In the second quarter of 2011, rehabilitation of the 16th level was completed and the second drill chamber to support Phase II drilling was completed. The 8 Zone Trend hosts the past-producing 8 Zone and is highly prospective for future high grade discoveries. The 16th level provides the ideal drill platform to explore both at depth as well as the strike potential of this 8 Zone Trend.
During 2011, Phase II underground drilling completed 14,800 metres and 9 holes, targeting the 8 zone plunge and strike continuity as well as sub-parallel footwall structures. Drill holes targeting the plunge continuity of the 8 Zone include MUG-11-12, 14 (14b) and 16. Drill hole 14b and drill hole 16, the deepest hole ever completed on the Madsen property, intercepted silicified and visible gold-bearing, basalt and returned 8.06 grams of gold per tonne over 2.02 metres and 5.69 grams of gold per tonne over 2.14 metres, respectively. These intercepts extend the 8 Zone system 250 metres down plunge from previous drilling to approximately 1,600 metres below surface. The system continues to remain open down plunge and will be the target of future drilling.
Drill holes targeting the strike continuity of the 8 Zone include MUG-11-10, 11, 13, 15, 17 and 19. Drill hole 13 and drill hole 17 intercepted silicified, biotite-altered basalt and returned 15.70 grams of gold per tonne over 2.00 metres and 53.70 grams of gold per tonne over 0.70 metres, approximately 950 metres below surface. These intercepts are in the hanging-wall of the 8 Zone system and interpreted to correlate with and be an extension of the McVeigh Tuff, located approximately 650 metres up-dip. The McVeigh Tuff hosts a current Indicated Resource of 115,000 ounces at 9.59 grams of gold per tonne and has seen very limited drill testing below 350 metres. In addition to the McVeigh mineralization, the 8 Zone structure is developed in all holes completed along strike and is characterized by anomalous gold associated with biotite-altered, variably silicified basaltic and ultramafic lithologies.
| Table 12: Highlights from Phase II of the Madsen Underground 8 Zone Drill Program |
| Hole ID | | Width (m) | | | Au (g/t) | | | Elevation * | | | Zone |
| | | | | | | | | | | | |
| MUG-11-13 | | | 2.00 | | | | 15.70 | | | | 927 | | | McVeigh |
| MUG-11-14 | | | 2.00 | | | | 6.27 | | | | 1,051 | | | McVeigh |
| MUG-11-14b | | | 2.02 | | | | 8.06 | | | | 1,543 | | | 8 Zone |
| MUG-11-16 | | | 2.14 | | | | 5.69 | | | | 1,595 | | | 8 Zone FW |
| MUG-11-17 | | | 0.70 | | | | 53.70 | | | | 927 | | | McVeigh |
| and | | | 2.00 | | | | 5.64 | | | | 1,079 | | | McVeigh |
| * | Elevation presented as metres below surface. Composites calculated using a 3 grams per tonne Au cut-off grade. Reported width is drilled length and interpreted to represent 75 - 85 percent of true width. Note, hole MUG-11-14 was lost with hole MUG-11-14b wedged off and completed. |

Figure 12: Madsen Longitudinal Section
Q1 2012 Management’s Discussion and Analysis
(inthousands of CDN dollars, except as otherwise noted) | Page 22 |
These latest results provide encouragement for the Company’s 2012 program and continue to demonstrate that the 8 Zone is a high grade gold system that has strong vertical continuity and remains open at depth and along strike to the northeast. Furthermore, the discovery of economic grades and widths hosted within the depth continuity of the McVeigh Tuff opens up significant exploration potential.
Quality Assurance and Quality Control Procedures
Rigorous quality assurance and quality control procedures have been implemented including the use of blanks, standards and duplicates. Geochemical analyses were submitted to ALS Chemex in Vancouver, British Columbia and or the Seabee minesite lab. The former laboratory is ISO approved. Core samples were analyzed by a 30 gram gold fire assay with an atomic absorption and gravimetric and or screen fire finish.
Mineral Reserves and Mineral Resources
The Mineral Reserves and Mineral Resources estimates are conducted under the direction of Qualified Persons Brian Skanderbeg, P.Geo., Vice President Exploration and Peter Longo, P.Eng., Vice President Operations.
Since 2008, the Company’s NI 43-101 Resource Base has increased over 400 percent. The increase noted is attributable to the discovery and delineation of the L62 and Santoy Gap deposits in 2011, which increased Mineral Reserves and Mineral Resources at the Seabee Gold Operation from 662,000 ounces to 1,300,000 ounces. Results from exploration at the Company’s Amisk (1,566,000 gold equivalent ounces) and Madsen (1,255,000 ounces) projects have also contributed to this increase.
Seabee Gold Operation
During 2011, Claude completed over 60,000 metres of underground drilling to sustain Mineral Reserves at the Seabee Gold Mine.
Q1 2012 Management’s Discussion and Analysis
(inthousands of CDN dollars, except as otherwise noted) | Page 23 |
Since discovery during the second quarter of 2011, the L62 Zone has been the focus of an aggressive exploration program and has grown rapidly. The L62’s high grade results obtained from drilling completed between September and December 2011 were incorporated into and had a material impact on the Seabee Mine’s updated National Instrument 43-101 resource calculation as at December 31, 2011 (Please see Claude news release “Claude Resources Inc. Increases Inferred Resource Base 236 Percent at Seabee Gold Operation” dated March 14, 2012).
At December 31, 2011, proven and probable reserves in the Seabee Gold Operation were 2,059,000 tonnes, grading 5.37 grams per tonne or 355,600 ounces of gold. Compared to December 31, 2010, this represents a five percent increase in reserve tonnage and one percent increase in reserve ounces. This modest increase is attributable to L62 resource growth into the probable reserve classification offset by production activities.
The Company’s mineral resources at its Seabee Gold Operation included Measured and Indicated Mineral Resources of 70,700 ounces and Inferred Mineral Resources totalling 873,400 ounces. Compared to December 31, 2010, this represents a 206 percent increase in contained gold within the Company’s mineral resources which is mainly attributable to inferred growth relating to further drilling and discovery at Seabee, Santoy Gap and Santoy 8.
| Table 13: Seabee Gold Operation Mineral Reserves and Mineral Resources |
| Proven and Probable Reserves |
| | | December 31, 2011 | | | December 31, 2010 | |
| Projects | | Tonnes | | | Grade (g/t) | | | Ozs | | | Tonnes | | | Grade (g/t) | | | Ozs | |
| Seabee | | | 1,062,900 | | | | 6.58 | | | | 224,900 | | | | 887,100 | | | | 6.69 | | | | 190,800 | |
| Santoy 8 | | | 997,100 | | | | 4.08 | | | | 130,600 | | | | 1,079,900 | | | | 4.66 | | | | 161,900 | |
| Totals | | | 2,059,900 | | | | 5.37 | | | | 355,600 | | | | 1,967,100 | | | | 5.58 | | | | 352,600 | |
| Measured and Indicated Mineral Resources |
| Projects | | | Tonnes | | | Grade (g/t) | | | Ozs | | | Tonnes | | | Grade (g/t) | | | Ozs | |
| Seabee | | | 127,400 | | | | 4.65 | | | | 19,000 | | | | - | | | | - | | | | - | |
| Santoy 8 | | | 12,600 | | | | 5.04 | | | | 2,000 | | | | - | | | | - | | | | - | |
| Porky Main | | | 160,000 | | | | 7.50 | | | | 38,600 | | | | 160,000 | | | | 7.50 | | | | 38,600 | |
| Porky West | | | 111,000 | | | | 3.10 | | | | 11,000 | | | | 111,000 | | | | 3.10 | | | | 11,000 | |
| Totals | | | 410,900 | | | | 5.35 | | | | 70,700 | | | | 271,000 | | | | 5.70 | | | | 49,600 | |
| Inferred Mineral Resources |
| Projects | | Tonnes | | | Grade (g/t) | | | Ozs | | | | Tonnes | | | Grade (g/t) | | | Ozs | |
| Santoy Gap | | | 2,321,000 | | | | 6.63 | | | | 495,000 | | | | - | | | | - | | | | - | |
| Seabee | | | 813,900 | | | | 6.83 | | | | 178,800 | | | | 705,500 | | | | 6.33 | | | | 143,600 | |
| Santoy 8 | | | 850,000 | | | | 5.46 | | | | 149,300 | | | | 384,800 | | | | 5.35 | | | | 66,200 | |
| Porky Main | | | 70,000 | | | | 10.43 | | | | 23,500 | | | | 70,000 | | | | 10.43 | | | | 23,500 | |
| Porky West | | | 138,300 | | | | 6.03 | | | | 26,800 | | | | 138,300 | | | | 6.03 | | | | 26,800 | |
| Totals | | | 4,193,200 | | | | 6.48 | | | | 873,400 | | | | 1,298,600 | | | | 6.23 | | | | 260,100 | |
For the above table of reserves, the following mining and economic factors have been applied:
| · | Mineral reserves and mineral resources were estimated by Claude personnel and audited by SRK in 2011. |
| · | Mineral reserves and mineral resources estimates have been completed in accordance with CIM Standards and are reported in accordance with Canadian Securities Administrators’ National Instrument 43-101. Mineral resources are exclusive of mineral reserves. |
| · | Seabee reserves and resources are estimated at a cut-off grade of 4.57 grams of gold per tonne and Santoy 8 and Santoy Gap reserves and resources are estimated at a cut-off grade of 3.0 grams of gold per tonne. |
| · | Cut-off grades were calculated using a two year trailing price of Can. $1,400 per ounce of gold, a U.S./CDN$ exchange rate of 1:1 and overall ore mining and processing costs based on actual historical operating costs. |
| · | All figures are rounded to reflect the relative accuracy of the estimates. Totals may not represent the sum of the parts due to rounding. |
| · | Mineral resources are not mineral reserves and do not have demonstrated economic viability. |
| · | L62 mineral reserves and mineral resources are included in the Seabee totals. |
Q1 2012 Management’s Discussion and Analysis
(inthousands of CDN dollars, except as otherwise noted) | Page 24 |
Claude is planning approximately 60,000 metres of underground drilling to replace 2012 production and to replace Mineral Reserves and Mineral Resources at the Seabee Gold Mine.
Amisk Gold Project
On February 17, 2011, Claude completed a National Instrument 43-101 compliant resource calculation which included results of all drilling to date, inclusive of historic core. The independent mineral resource statement was released in the first quarter of 2011 and outlined an Indicated Resource of 921,000 ounces of 0.95 grams of Au Eq per tonne and an Inferred Resource of 645,000 ounces at 0.70 grams of Au Eq per tonne.
| Table 14: Amisk Gold Project Consolidated Mineral Resource Statement* |
| Resource Class | | Quantity | | | Grade (g/tonne) | | | Contained Ounces (000’s) | |
| | | (000’s tonnes) | | | Au | | | Ag | | | Au Eq | | | Au | | | Ag | | | Au Eq | |
| | | | | | | | | | | | | | | | | | | | | | |
| Indicated | | | 30,150 | | | | 0.85 | | | | 6.17 | | | | 0.95 | | | | 827 | | | | 5,978 | | | | 921 | |
| Inferred | | | 28,653 | | | | 0.64 | | | | 4.01 | | | | 0.70 | | | | 589 | | | | 3,692 | | | | 645 | |
* Reported at a cut-off of 0.40 grams of gold equivalent (Au Eq) per tonne using a price of U.S. $1,100 per ounce of gold and U.S. $16 per ounce of silver inside a conceptual pit shell optimized using metallurgical and process recovery of 87 percent, overall ore mining and processing costs of U.S. $15 per tonne and overall pit slope of 50 degrees. All figures are rounded to reflect the relative accuracy of the estimates. Mineral resources are not mineral reserves and do not have demonstrated economic viability.
An updated NI 43-101 resource statement, inclusive of all drilling completed to the end of 2011, is anticipated to be completed during the second quarter. This resource model will serve as the basis for the Preliminary Economic Assessment at the Amisk Gold Project.
Madsen Exploration Project
During 2010, SRK finalized an independent National Instrument 43-101 mineral resource evaluation for the Madsen Mine. This mineral resource evaluation was based on historical exploration and mining data, Phase I underground drilling results up to September 27, 2009 and geological and resource modeling. The resource evaluation was undertaken on the four separate zones, Austin, South Austin, McVeigh and 8 Zone that comprise the Madsen Gold Mine. The National Instrument 43-101 Technical Report was filed on January 20, 2010.
| Table 15: Consolidated Mineral Resource Statement(1) for the Madsen Mine, Ontario |
Resource
Class | | Zone | | | | Tonnes | | | Grade
(g/tonne) | | | Grade
(oz/ton) | | | Contained
Gold (oz) | |
| | | | | | | | | | | | | | | | |
| Indicated | | Austin | | | | 1,677,000 | | | 7.92 | | | 0.23 | | | 427,000 | |
| | | South Austin | | | | | 850,000 | | | | 9.32 | | | | 0.27 | | | | 254,000 | |
| | | McVeigh | | | | | 374,000 | | | | 9.59 | | | | 0.28 | | | | 115,000 | |
| | | 8 Zone | | | | | 335,000 | | | | 12.21 | | | | 0.36 | | | | 132,000 | |
| | | | | Total | | | 3,236,000 | | | | 8.93 | | | | 0.26 | | | | 928,000 | |
| Inferred | | Austin | | | | | 108,000 | | | | 6.30 | | | | 0.18 | | | | 22,000 | |
| | | South Austin | | | | | 259,000 | | | | 8.45 | | | | 0.25 | | | | 70,000 | |
| | | McVeigh | | | | | 104,000 | | | | 6.11 | | | | 0.18 | | | | 20,000 | |
| | | 8 Zone | | | | | 317,000 | | | | 18.14 | | | | 0.53 | | | | 185,000 | |
| | | | Total | | | 788,000 | | | | 11.74 | | | | 0.34 | | | | 297,000 | |
Note:mineral resources are not mineral reserves and do not have demonstrated economic viability. All figures have been rounded to reflect the relative accuracy of the estimates. Reported at a cut-off grade of 5.0 g/t gold based on U.S. $1,000 per troy ounce of gold and gold metallurgical recoveries of 94 percent.
Q1 2012 Management’s Discussion and Analysis
(inthousands of CDN dollars, except as otherwise noted) | Page 25 |
Financial Results of Operations
Highlights
| Thousands of CDN$ | | March 31 | | | March 31 | | | Percent | |
| (except per share amounts) | | 2012 | | | 2011 | | | Change | |
| | | | | | | | | | |
| Revenue | | $ | 16,052 | | | $ | 13,322 | | | | 20 | |
| Profit from mining operations | | | 996 | | | | 2,665 | | | | (63 | ) |
| Net profit (loss) | | | (491 | ) | | | 1,829 | | | | (127 | ) |
| Earnings (loss) per share (basic and diluted) | | | (0.00 | ) | | | 0.01 | | | | - | |
Revenue
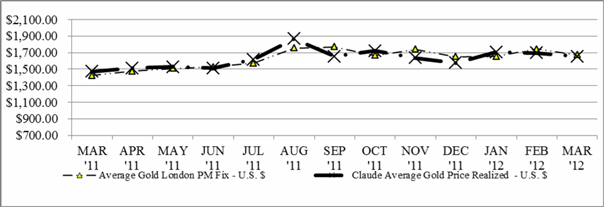
Gold revenue from the Company’s Seabee Gold Operation for the three months ended March 31, 2012 increased 21 percent to $16.1 million from $13.3 million reported for the three months ended March 31, 2011. The increase in gold revenue period over period was attributable to a 19 percent improvement in Canadian dollar gold prices realized (Q1 2012 - $1,681 (U.S. $1,679); Q1 2011 - $1,408 (U.S. $1,428)) and slightly higher gold sales volume (Q1 2012 – 9,547 ounces; Q1 2011 – 9,461 ounces).
Figure 13: Average Gold Price (London PM Fix – US$)
Net Profit (loss)
For the three months ended March 31, 2012, the Company recorded a net loss of $0.5 million, or $0.00 per share. This compares to a net profit of $1.8 million, or $0.01 per share, for the three months ended March 31, 2011.
Production Costs
For the three months ended March 31, 2012, mine production costs of $11.8 million (three months ended March 31, 2011 - $8.7 million) were 36 percent higher period over period. This increase was attributable to increased spending on consumable supplies and labour.
Total Canadian dollar cash cost per ounce of gold(4) for the first quarter of 2012 increased 34 percent to CDN $1,236 (U.S. $1,234) per ounce from CDN $924 (U.S. $937) during the first quarter of 2011, principally as a result of higher operating costs due to increased tonnes processed.
Q1 2012 Management’s Discussion and Analysis
(inthousands of CDN dollars, except as otherwise noted) | Page 26 |
Depreciation and Depletion
For the three months ended March 31, 2012, depreciation and depletion was $3.3 million (March 31, 2011 - $1.9 million), up 74 percent period over period. This result is attributable to a 32 percent increase in tonnes throughput and an increase in property plant and equipment period over period.
General and Administrative Expense
General and administrative expense in the first three months of 2012 increased to $2.7 million, up 93 percent from the $1.4 million reported for the first three months of 2011. This variance primarily relates to increased stock compensation expense resulting from a greater number of options granted period over period and the granting of deferred share units to Directors of the Company.
Finance Expense
Finance expense includes interest, accretion expense and derivative gains or losses (if any). For the three months ended March 31, 2012, Finance expense of $0.3 million was relatively unchanged period over period
Finance and Other Income
Finance and other income consists of interest income, production royalties pursuant to the Red Mile transactions and other income. For the three months ended March 31, 2012, finance and other income of $0.7 million was relatively unchanged period over period.
Deferred Income Tax Expense
Deferred income tax expense was relatively unchanged period over period.
Liquidity and Financial Resources
The Company monitors its spending plans, repayment obligations and cash resources on a continuous basis with the objective of ensuring that there is sufficient capital within the Company to meet business requirements, after taking into account cash flows from operations and the Company’s holdings of cash and cash equivalents and short-term investments. The Company’s typical cash requirement over the first and second quarters of each year is significant because of the Seabee Gold Operation’s winter ice road resupply, which includes restocking diesel, propane and other large consumables as well as the continued upgrading of the mining fleet and mine infrastructure.
The Company had cash and cash equivalents of $8.4 million and short-term investments of $8.0 million at March 31, 2012 (December 31, 2011 - $2.5 million of cash and cash equivalents and short-term investments of $33.2 million). The Company monitors its positions with, and the credit quality of, the financial institutions and government instruments in which it invests its excess cash and cash equivalents. Other than balances maintained in various bank operating accounts, the Company’s investment policy limits investments to government-backed financial instruments, bank certificates of deposit and bankers acceptances.
At March 31, 2012, the Company had working capital of $16.2 million (December 31, 2011 - $42.4 million). Included in the working capital calculation at March 31, 2012 are demand loans of $7.3 million; these loans have been classified as current liabilities due to their demand feature.
Q1 2012 Management’s Discussion and Analysis
(inthousands of CDN dollars, except as otherwise noted) | Page 27 |
| | | March 31 | | | December 31 | | | Percent | |
| | | 2012 | | | 2011 | | | Change | |
| | | | | | | | | | | | | |
| Current assets | | $ | 52,244 | | | $ | 52,004 | | | | - | |
| Current liabilities | | $ | 36,012 | | | $ | 9,606 | | | | 275 | |
| Working capital | | $ | 16,232 | | | $ | 42,398 | | | | (62 | ) |
| Current ratio | | | 1.5 | | | | 5.4 | | | | (72 | ) |
Investing
Mineral property expenditures during the three months ended March 31, 2012 were $28.3 million, an $11.3 million increase from the comparable period in 2011. Expenditures during 2012 were comprised of Seabee Mine and Shaft development of $6.5 million, exploration costs (focusing on the Santoy Gap, Seabee North, Amisk and Madsen exploration projects) of $7.6 million and property, plant and equipment additions of $14.2 million. Property, plant and equipment additions include mining equipment, camp infrastructure and tailings management facility expansion. The Company utilized its cash on hand and short-term investments to fund these additions.
Financing
Financing activities during the first quarter of 2012 included the issuance of 338,676 common shares (Q1 2011 – 235,614) and 40,000 common shares (Q1 2011 – 56,667) pursuant to the Company’s Employee Share Purchase Plan and the Company’s Stock Option Plan, respectively.
During the first quarter of 2012, the Company repaid $1.1 million of its demand loans and capital leases outstanding. The proceeds and repayments of demand loans relate to production equipment at the Seabee Gold Operation.
Capital Structure
The Company’s objective when managing capital is to safeguard its ability to continue as a going concern so that it can continue to provide adequate returns to shareholders and benefits to other stakeholders. The Company manages the capital structure and makes adjustments to it in light of changes in economic conditions and the risk characteristics of the underlying assets. In order to maintain or adjust the capital structure, the Company may issue new shares, sell assets or incur debt. The Company is not subject to externally imposed capital requirements.
The Company utilizes a combination of short-term and long-term debt and equity to finance its operations and exploration.
The Capital structure of the Company is as follows:
| Table 16: Schedule of Capital Structure of the Company |
| Capital Structure | | | | | | March 31 | | | December 31 | |
| | | Interest | | Maturity | | 2011 | | | 2011 | |
| | | | | | | | | | | |
| Demand loan | | 4.575 | % | Nov/2012 | | $ | 656 | | | $ | 896 | |
| Demand Loans | | Prime + 1.50 | % | Jan-Apr/2012 | | | 6,611 | | | | - | |
| Debenture | | 12.00 | % | May/2013 | | | 9,500 | | | | 9,452 | |
| Total debt | | | | | | $ | 16,767 | | | $ | 10,348 | |
| | | | | | | | | | | | | |
| Shareholders’ equity | | | | | | | 184,552 | | | | 172,895 | |
| | | | | | | | | | | | | |
| Debt to equity | | | | | | | 9.09 | % | | | 5.99 | % |
Q1 2012 Management’s Discussion and Analysis
(inthousands of CDN dollars, except as otherwise noted) | Page 28 |
Financial and Other Instruments
In the normal course of its operations, the Company is exposed to gold price, foreign exchange, interest rate, liquidity, equity price and counterparty risks. The overall financial risk management program focuses on preservation of capital and protecting current and future Company assets and cash flows by reducing exposure to risks posed by the uncertainties and volatilities of financial markets.
The Company may use derivative financial instruments to hedge some of its exposure to fluctuations in gold prices and foreign exchange rates. The Company does not acquire, hold or issue derivatives for trading purposes. The Company’s management of financial risks is aimed at ensuring that net cash flows are sufficient to meet all its financial commitments as and when they fall due and to maintain the capacity to fund its forecast project development and exploration strategies.
The value of the Company’s mineral resources is related to the price of gold and the outlook for this mineral. Gold and precious metal prices historically have fluctuated widely and are affected by numerous factors outside of the Company’s control, including, but not limited to, industrial and retail demand, central bank lending, forward sales by producers and speculators, levels of worldwide production, short-term changes in supply and demand because of speculative hedging activities and certain other factors related specifically to gold. The profitability of the Company’s operations is highly correlated to the market price of gold. If the gold price declines below the cost of production at the Company’s operations, for a prolonged period of time, it may not be economically feasible to continue production.
The Company’s revenues from the production and sale of gold are denominated in U.S. dollars. However, the Company’s operating expenses are primarily incurred in Canadian dollars and its liabilities are primarily denominated in Canadian dollars. The results of the Company’s operations are subject to currency risks. The operating results and financial position of the Company are reported in Canadian dollars in the Company’s consolidated financial statements.
The Company did not have any derivative instruments outstanding at March 31, 2012 or March 31, 2011.
The Company’s main interest rate risk arises from interest earning cash deposits that expose the Company to interest rate risk. No hedging programs were implemented by the Company to manage interest rate risk during the quarter. The Company invests its cash and cash equivalents and short term investments with the Government of Canada and major banks according to its investment policy.
The Company’s liquidity position is managed to ensure sufficient liquid funds are available to meet its financial obligations in a timely manner. The Company manages liquidity risk by continuously monitoring forecast and actual cash flows and ensuring that the Company has the ability to access required funding.
The Company is exposed to equity securities price risk arising from investments classified on the balance sheet as available-for-sale. Investments in equity securities are approved by the Board on a case-by-case basis. All of the Company’s available-for-sale equity investments are in junior resource companies listed on the TSX Venture Exchange.
The Company is exposed to counterparty risk which is the risk that a counterparty will not complete its obligations under a financial instrument resulting in a financial loss for the Company. The Company does not generally obtain collateral or other security to support financial instruments subject to credit risk; however, the Company only deals with credit worthy counterparties. Accounts receivable comprise institutions purchasing gold under normal settlement terms of two working days. Counterparty risk under derivative financial instruments is to reputable institutions. All significant cash balances are on deposit with high-rated banking institutions. The carrying amount of financial assets recorded in the financial statements represents the Company’s maximum exposure to credit risk without taking account of the value of any collateral or other security obtained.
Q1 2012 Management’s Discussion and Analysis
(inthousands of CDN dollars, except as otherwise noted) | Page 29 |
Contractual Obligations
At March 31, 2012, with the exception of the increase in the Company’s demand loans, there were no significant changes to the Company’s contractual obligations from those reported in the Management’s Discussion and Analysis for the year ended December 31, 2011.
Statements of Financial Position
| | | March 31 | | | December 31 | | | Percent | |
| | | 2011 | | | 2011 | | | Change | |
| | | | | | | | | | |
| Total assets | | $ | 245,018 | | | $ | 207,887 | | | | 18 | |
| Long-term financial liabilities | | $ | 24,454 | | | $ | 25,386 | | | | (4 | ) |
The Company’s total assets were $245.0 million at March 31, 2012, compared to $207.9 million at December 31, 2011. The $37.1 million net increase was comprised primarily of increases of: $3.5 million of accounts receivable, attributable to the timing of gold sales and receipt of funds; $16.0 million in Inventories, attributable to the Company’s annual winter road resupply at the Seabee Gold Operation; and $38.4 million in Mineral properties attributable to Seabee Mine development and Shaft extension, exploration costs (focusing on the Santoy Gap, Seabee North, Amisk and Madsen exploration projects) and additions to property, plant and equipment. These increases were offset by decreases of: $19.3 million in cash and cash equivalents and short term investments, attributable to the Company’s annual winter road resupply; and $1.5 million in Investments due to the disposition of certain of the Company’s available for sale securities.
Total liabilities were $60.5 million at March 31, 2011, up $25.5 million from December 31, 2011. This result was attributable to a decrease of $0.9 of non-current liabilities offset by: a $20.2 million increase in accounts payable and accrued liabilities, attributable to the timing of payments associated with the Company’s annual winter road for the Seabee Gold Operation; and a $6.1 million increase in loans and borrowings attributable to demand loans obtained to fund a portion of the Company’s capital equipment resupply at the Seabee Gold Operation.
Shareholders’ equity increased by $11.7 million to $184.6 million at March 31, 2012, from $172.9 million at December 31, 2011. This variance is attributable to an increase in Share capital of $12.3 million due to the issuance of Company stock pursuant to the acquisition of St. Eugene, an increase of $0.5 million to contributed surplus, a $0.5 million increase to Accumulated deficit; and a $0.7 million decrease to Accumulated other comprehensive income.
Comprehensive income consists of net income, together with certain other economic gains and losses that are collectively referred to as “other comprehensive income (loss)” or “OCI” and are excluded from the income statement. During the period ended March 31, 2012, other comprehensive income decreased to a loss of $0.1 million (December 31, 2011 – comprehensive income of $0.6 million) due to the Company’s disposition of certain available-for-sale securities.
Key Sensitivities
Earnings from Claude’s gold operation are sensitive to fluctuations in both commodity and currency prices. The key factors and their approximate effect on earnings, earnings per share and cash flow, based on assumptions comparable to first quarter 2012 actuals, are as follows:
Gold
For a U.S. $10 movement in gold price per ounce, earnings and cash flow will have a corresponding movement of CDN $0.4 million, or $0.00 per share. For a $0.01 movement in the US$/CDN$ exchange rate, earnings and cash flow will have a corresponding movement of $0.6 million, or 0.00$ per share.
Q1 2012 Management’s Discussion and Analysis
(inthousands of CDN dollars, except as otherwise noted) | Page 30 |
Selected Quarterly Financial Data
| Table 17: Summary financial and operating data for the Company’s last eight quarters |
| | | Mar 31 | | | Dec 31 | | | Sept 30 | | | Jun 30 | | | Mar 31 | | | Dec 31 | | | Sept 30 | | | Jun 30 | |
| | | 2012 | | | 2011 | | | 2011 | | | 2011 | | | 2011 | | | 2010 | | | 2010 | | | 2010 | |
| | | | | | | | | | | | | | | | | | | | | | | | | |
| Gold sales ($ millions) | | | 16.1 | | | | 19.9 | | | | 18.2 | | | | 18.2 | | | | 13.3 | | | | 14.9 | | | | 15.7 | | | | 15.2 | |
| Net profit (loss) ($ millions) | | | (0.5 | ) | | | (0.2 | ) | | | 2.6 | | | | 5.2 | | | | 1.8 | | | | 4.1 | | | | 5.6 | | | | 2.2 | |
| Net profit (loss) per share(a) | | | (0.00 | ) | | | 0.00 | | | | 0.02 | | | | 0.03 | | | | 0.01 | | | | 0.03 | | | | 0.04 | | | | 0.02 | |
| Average realized gold price (CDN$ per ounce) | | | 1,681 | | | | 1,678 | | | | 1,670 | | | | 1,469 | | | | 1,408 | | | | 1,378 | | | | 1,296 | | | | 1,247 | |
| Average realized gold price (US$ per ounce) | | | 1,679 | | | | 1,641 | | | | 1,704 | | | | 1,518 | | | | 1,428 | | | | 1,361 | | | | 1,247 | | | | 1,213 | |
| Ounces sold(b) | | | 9,500 | | | | 11,900 | | | | 10,900 | | | | 12,400 | | | | 9,500 | | | | 10,800 | | | | 12,100 | | | | 12,200 | |
| Tonnes milled(c) | | | 66,556 | | | | 74,456 | | | | 66,722 | | | | 65,502 | | | | 50,501 | | | | 57,155 | | | | 62,242 | | | | 46,071 | |
| Ounces produced(c) | | | 9,600 | | | | 11,300 | | | | 11,300 | | | | 12,600 | | | | 9,500 | | | | 13,200 | | | | 12,900 | | | | 11,900 | |
| Grade processed (grams per tonne) | | | 4.74 | | | | 4.97 | | | | 5.51 | | | | 6.26 | | | | 6.20 | | | | 7.54 | | | | 6.76 | | | | 8.44 | |
| Cash cost per ounce(d) (CDN$ per ounce) | | | 1,236 | | | | 1,130 | | | | 871 | | | | 717 | | | | 924 | | | | 597 | | | | 642 | | | | 704 | |
| Cash cost per ounce(d) (US$ per ounce) | | | 1,234 | | | | 1,105 | | | | 888 | | | | 741 | | | | 938 | | | | 589 | | | | 618 | | | | 685 | |
| Cash flow from operations ($ millions)(d) | | | 2.6 | | | | 7.2 | | | | 5.7 | | | | 8.3 | | | | 3.6 | | | | 7.7 | | | | 7.6 | | | | 5.0 | |
| Cash flow from operations per share | | | 0.02 | | | | 0.04 | | | | 0. 03 | | | | 0.05 | | | | 0.03 | | | | 0.06 | | | | 0.06 | | | | 0.04 | |
| | | | | | | | | | | | | | | | | | | | | | | | | | | | | | | | | |
| Weighted average shares outstanding (basic) | | | 170,481 | | | | 164,351 | | | | 163,911 | | | | 155,275 | | | | 140,361 | | | | 136,081 | | | | 131,245 | | | | 130,925 | |
| | | | | | | | | | | | | | | | | | | | | | | | | | | | | | | | | |
| CDN$/US$ Exchange | | | 1.0012 | | | | 1.0230 | | | | 0.9804 | | | | 0.9676 | | | | 0.9861 | | | | 1.0128 | | | | 1.0391 | | | | 1.0276 | |
(a) Basic and diluted, calculated based on the number of shares issued and outstanding during the quarter.
(b) Statistics in 2010 exclude ounces sold from the Santoy 8 Project, which was not yet in commercial production.
(c)Includes ounces produced and tonnes milled from the Santoy 8 Project in 2010.
(d)Denotes a non-IFRS performance measure. For an explanation of non-IFRS performance measures, refer to the “Non-IFRS Performance Measures” section of this MD&A.
The financial results for the last eight quarters reflect the following general trends: improved average realized gold price (which has improved gold revenue and net profit (loss)); lower grade attributable to more feedstock from the Santoy 8 ore body; and increasing cash cost per ounce.
Outlook
For the remainder of 2012, and looking forward, the Company will continue to:
| i) | Pursue best practices in the areas of safety, health and the environment; |
| ii) | Increase production and improve unit operating costs at the Seabee Gold Operation by investing in capital projects and equipment to further develop satellite deposits; |
| iii) | Sustain or increase reserves and resources at the Seabee Gold Operation through further exploration and development; |
| iv) | Advance surface and underground exploration drill programs at the Company's 100 percent owned Madsen Exploration Project with continuation of Phase II of underground drilling from the 16th level drill platform; and |
| v) | Expand the scope of the Amisk Gold Project, and complete a preliminary economic assessment. |
Operating Outlook for 2012
For 2012, forecast gold production at the Seabee Operation is estimated to range from 50,000 to 52,000 ounces of gold. Unit costs for 2012 are estimated to be similar to 2011. Quarterly operating results are expected to fluctuate throughout 2012; as such, they will not necessarily be reflective of the full year average.
Q1 2012 Management’s Discussion and Analysis
(inthousands of CDN dollars, except as otherwise noted) | Page 31 |
The following key parameters form the basis of the 2012 production guidance and operating cost estimate:
| · | Ore grades between 5.0 and 6.0 grams per tonne |
| · | Total tonnes 283,200 (Seabee: 138,500; Santoy: 144,700) |
| · | Annual average ore throughput of 775 tonnes per day |
| · | Mill recoveries of 95.5 percent |
| · | Canadian dollar at par against the U.S. dollar |
Forecast and capital outlook for 2012
Capital expenditures are expected to increase significantly with continued investment at Madsen and expected upgrades at the Seabee Gold Operation, including expansion to the Seabee Central Milling Facility, extension of the Seabee Shaft and expansion of the Seabee Gold Operation’s Camp Facilities.
Capital expenditures at the Seabee Gold Operation in 2012 are estimated to total $48.4 million, funded from a combination of cash on hand, operating cash flow and demand loans. For the balance of 2012, the Company has flexibility to address its capital expenditures.
These expenditures are comprised of the following (in millions):
| Development | | $ | 18.0 | |
| Mill Expansion | | | 1.8 | |
| Shaft deepening | | | 5.8 | |
| Property, plant and equipment | | | 18.9 | |
| Camp Expansion | | | 2.7 | |
| Other | | | 1.2 | |
| | | $ | 48.4 | |
During the first half of each year, the Company’s cash outflow is significant because of the Seabee Gold Operation’s annual winter ice road resupply which includes restocking diesel, propane and other large consumables as well as the continued upgrading of the mining fleet and mine infrastructure. At current gold prices and forecast production, Management believes that, when combined with cash on hand and short-term investments, operating cash flows should be sufficient to fund the continued exploration at the Seabee, Amisk and Madsen Properties over the next 12 months. In May 2013, the Company’s debenture matures at which point it is expected that operating cash flows combined with a debt or equity financing will provide sufficient funding for 2013.
Exploration outlook for 2012
As a follow-up to the Company’s 2011 exploration programs, Claude has budgeted approximately $15.5 million to support the continuation of its extensive exploration programs at the Seabee, Amisk and Madsen Properties during 2012. At the Seabee Gold Operation, the Company plans to drill 130,000 metres (70,000 metres regionally and 60,000 metres underground) during 2012. At Madsen, Claude has approved a 29,000 metre underground and surface exploration program. The program will include two underground rigs and one surface rig, targeting to complete 40 to 50 holes. Exploration will focus on continued testing of the 8 Zone Trend as well as the McVeigh and Austin Tuff depth continuity. Finally, at the 24,350 hectare Amisk Gold Project, Claude will update its National Instrument 43-101 resource calculation, conduct an external Preliminary Economic Assessment and an evaluation of the underground potential.
Continued success from the Company’s exploration programs should serve to:
| · | further extend the mine life at Seabee; |
| · | potentially improve the project economics at the Company’s Amisk and Madsen Projects; and |
Q1 2012 Management’s Discussion and Analysis
(inthousands of CDN dollars, except as otherwise noted) | Page 32 |
| · | further increase the Company’s total resource base. |
Accounting Estimates
Certain of the Company’s accounting policies require that Management make decisions with respect to the formulation of estimates and assumptions that affect the reported amounts of assets, liabilities, revenues and expenses. For a discussion of those estimates, please refer to the Company’s Management’s Discussion and Analysis for the year ended December 31, 2011, available atwww.sedar.com.
Future Accounting Pronouncements
Certain new accounting standards and interpretations have been published that are not mandatory for the March 31, 2012 reporting period:
| · | IFRS 9,Financial Instruments: effective for accounting periods commencing on or after January 1, 2015. The Company does not expect the adoption of this standard to have a material impact on its consolidated financial statements. |
| · | IFRS 10,Consolidated Financial Statements, was issued by the IASB in May 2011 and is effective for annual periods beginning on or after January 1, 2013 with early adoption permitted. The Company does not expect the adoption of this standard to have a material impact on its financial statements. |
| · | IFRS 11,Joint Arrangements, was issued by the IASB in May 2011 and is effective for annual periods beginning on or after January 1, 2013 with early adoption permitted. The extent of the impact of adoption of IFRS 11 has not yet been determined by the Company. |
| · | IFRS 12,Disclosure of Interests in Other Entities, was issued by the IASB in May 2011 and is effective for the Company beginning on January 1, 2013. It is expected that IFRS 12 will increase the current level of disclosure related to the Company’s interests in other entities upon adoption. |
| · | In May 2011, the IASB published IFRS 13,Fair Value Measurement, which is effective prospectively for annual periods beginning on or after January 1, 2013. The extent of the impact of adoption of IFRS 13 has not yet been determined. |
| · | In June 2011, the IASB issued IAS 1,Presentation of Items of OCI: Amendments to IAS 1 Presentation of Financial Statements. Amendments to IAS 1 are effective for the Company beginning on January 1, 2012 with retrospective application and early adoption permitted. The Company does not expect the adoption of the amendments to this standard to have a material impact on its financial statements. |
| · | In May 2011, the IASB issued amendments to IAS 28,Investments in Associates and Joint Ventures, which are effective for annual periods beginning on or after January 1, 2013 with early adoption permitted. The Company does not expect the amendments to IAS 28 to have a material impact on the financial statements. |
| · | In December 2011, the IASB publishedOffsetting Financial Assets and Financial Liabilities and issued new disclosure requirements in IFRS 7,Financial Instruments: Disclosures. The amendments to IAS 32 clarify that if an entity currently has a legally enforceable right to set-off if that right is not contingent on a future event, and enforceable both in the normal course of business and in the event of default, insolvency or bankruptcy of the entity and all counterparties. The amendments to IAS 32 also clarify when a settlement mechanism provides for net settlement or gross settlement that is equivalent to net settlement. The amendments to IFRS 7 contain new disclosure requirements for financial assets and liabilities that are offset in the statement of financial position, or subject to master netting arrangements or similar arrangements. The effective date for the amendments to IAS 32 is annual periods beginning on or after January 1, 2014. The effective date for the amendments to IFRS 7 is annual periods beginning on or after January 1, 2013. These amendments are to be applied retrospectively. The Company does not expect the amendments to have a material impact on the financial statements. |
Q1 2012 Management’s Discussion and Analysis
(inthousands of CDN dollars, except as otherwise noted) | Page 33 |
Business Risks
Risks and uncertainties related to economic and industry factors are described in detail in the Company’s Annual Information Form (availableatwww.sedar.com) and remain substantially unchanged.
Outstanding Share Data
The authorized share capital of the Company consists of an unlimited number of common shares and two classes of unlimited preferred shares issuable in series. At March 31, 2012, there were 173,710,162 common shares outstanding. This compares to 164,630,231 common shares outstanding at December 31, 2011.
During the first quarter of 2012, the Company issued 378,676 common shares pursuant to the Company’s Employee Share Purchase Plan and the Company’s Stock Option plan. An additional 8,701,255 shares were issued as consideration for Claude’s acquisition of St. Eugene. At May 10, 2012, there were 173,745,564 common shares of the Company issued and outstanding.
Outstanding Stock Options and Warrants
At March 31, 2012, there were 6.3 million director, officer and key employee stock options outstanding with exercise prices ranging from $0.50 to $2.38 per share. This compares to 5.5 million director, officer and key employee stock options outstanding at December 31, 2011 with exercise prices ranging from $0.50 to $2.38 per share. This increase was mainly attributable to issuances to executive and directors of the Company.
| Table 18: Schedule of Outstanding Stock Options and Weighted Average Exercise Price |
| | | March 31, 2012 | | | December 31, 2011 | |
| | | Number | | | Weighted
Average
Exercise Price | | | Number | | | Weighted
Average
Exercise Price | |
| | | | | | | | | | | | | |
| Beginning of period | | | 5,484,250 | | | $ | 1.57 | | | | 3,916,737 | | | $ | 1.15 | |
| Options granted | | | 917,945 | | | | 1.34 | | | | 2,478,768 | | | | 2.06 | |
| Options exercised | | | (40,000 | ) | | | 0.78 | | | | (648,667 | ) | | | 0.75 | |
| Options forfeited | | | (26,749 | ) | | | 2.28 | | | | (241,876 | ) | | | 1.86 | |
| Options expired | | | (4,000 | ) | | | - | | | | (20,712 | ) | | | 1.04 | |
| End of period | | | 6,331,446 | | | | 1.54 | | | | 5,484,250 | | | $ | 1.57 | |
For options outstanding at March 31, 2012, the range of exercise prices, the number vested, the weighted average exercise price and the weighted average remaining contractual life are as follows:
| Table 19: Schedule of Outstanding Stock Options by Price Range |
| | | Options Outstanding | | | Options Exercisable | |
Option Price Per
Share | | Quantity | | | Weighted
Average
Remaining
Life | | | Weighted
Average
Exercise
Price | | | Quantity | | | Weighted
Average
Remaining
Life | | | Weighted
Average
Exercise
Price | |
| $0.50 - $0.99 | | | 650,247 | | | | 6.49 | | | $ | 0.79 | | | | 650,247 | | | | 6.49 | | | $ | 0.79 | |
| $1.00 - $1.50 | | | 2,470,387 | | | | 6.62 | | | | 1.21 | | | | 2,107,959 | | | | 6.55 | | | | 1.20 | |
| $1.51 - $2.00 | | | 2,589,000 | | | | 7.79 | | | | 1.86 | | | | 1,248,000 | | | | 6.26 | | | | 1.76 | |
| $2.01 - $2.38 | | | 621,812 | | | | 8.62 | | | | 2.28 | | | | 330,205 | | | | 8.25 | | | | 2.27 | |
| | | | 6,331,446 | | | | 7.28 | | | $ | 1.54 | | | | 4,336,411 | | | | 6.59 | | | $ | 1.37 | |
Q1 2012 Management’s Discussion and Analysis
(inthousands of CDN dollars, except as otherwise noted) | Page 34 |
At March 31, 2012, there were 3.6 million common share purchase warrants outstanding. The increase in outstanding warrants from December 31, 2011 is attributable to the Company replacing the outstanding warrants of St. Eugene pursuant to the Company’s acquisition of St. Eugene. Each common share purchase warrant entitles the holder to acquire one common share of the Company at prices determined at the time of issue. The range of exercise prices and dates of expiration of the warrants outstanding are as follows:
| Table 20: Schedule of Warrants Outstanding | |
| | | | | | Number | | | | | | | | | Number | |
| Exercise | | | | | Outstanding at | | | | | | | | | Outstanding at | |
| Price | | | Expiry Date | | December 31, 2011 | | | Granted | | | Expired | | | March 31, 2012 | |
| | | | | | | | | | | | | | | | |
| $ | 1.60 | | | May 22, 2013 | | | 1,693,200 | | | | - | | | | - | | | | 1,693,200 | |
| $ | 0.90 | | | November 16, 2012 | | | 1,023,000 | | | | - | | | | - | | | | 1,023,000 | |
| $ | 1.77 | | | April 7, 2012 | | | - | | | | 319,545 | | | | - | | | | 319,545 | |
| $ | 1.77 | | | April 12, 2012 | | | - | | | | 10,257 | | | | - | | | | 10,257 | |
| $ | 3.17 | | | March 31, 2012 | | | - | | | | 79,980 | | | | - | | | | 79,980 | |
| $ | 4.44 | | | March 31, 2012 | | | - | | | | 443,812 | | | | - | | | | 443,812 | |
| | | | | | | | 2,716,200 | | | | 853,594 | | | | - | | | | 3,569,794 | |
Footnotes
| (1) | Cash flow from operations before net changes in non-cash operating working capital is a non-IFRS performance measure. For an explanation of non-IFRS performance measures, refer to the “Non-IFRS Performance Measures” section of this MD&A. |
| (2) | Historically, Madsen results have been reported in ounces per ton and feet (Imperial). |
| (3) | Net cash margin is a non-IFRS performance measure. For an explanation of non-IFRS performance measures refer to the “Non-IFRS Performance Measures” section of this MD&A. |
| (4) | Cash cost per ounce is a non-IFRS performance measure. For an explanation of non-IFRS performance measures refer to the “Non-IFRS Performance Measures” section of this MD&A. |
Non-IFRS Performance Measures
The Company utilizes non-IFRS financial measures as supplemental indicators of operating performance and financial position. These non-IFRS financial measures are used internally by the Company for comparing actual results from one period to another. The Company believes that, in addition to conventional measures prepared in accordance with IFRS, certain investors use this information to evaluate the Company’s performance and ability to generate cash flow. Accordingly, such information is intended to provide additional information and should not be considered in isolation or as a substitute for measures of performance prepared in accordance with IFRS.
Cash Flow from Operations before Net Changes in Non-Cash Operating Working Capital
The Company uses Cash Flow from Operations before Net Changes in Non-Cash Operating Working Capital as a supplemental measure of its financial performance. The Company uses this measure to analyze the cash generated by its operations. These measures are not necessarily indicative of operating profit or cash flow from operations as determined under IFRS. Investors are cautioned that the above measures may not be comparable to similarly titled measures of other companies.
Q1 2012 Management’s Discussion and Analysis
(inthousands of CDN dollars, except as otherwise noted) | Page 35 |
| Table 21: Calculation of Cash Flow from Operations before Net Changes in Non-Cash Operating Working Capital |
| | | March 31 | | | March 31 | |
| | | 2012 | | | 2011 | |
| | | | | | | |
| Cash flows from operating activities | | | | | | | | |
| Net (loss) profit | | $ | (491 | ) | | $ | 1,829 | |
| Adjustments for non-cash items: | | | | | | | | |
| Depreciation and depletion | | | 3,260 | | | | 1,911 | |
| Finance expense | | | 93 | | | | 84 | |
| Finance and other income | | | (360 | ) | | | (382 | ) |
| (Gain) on investments | | | (794 | ) | | | (109 | ) |
| Stock-based compensation | | | 846 | | | | 276 | |
| Deferred income tax expense | | | 33 | | | | - | |
| Total Cash Flow from Operations before Net Changes in Non-Cash Operating Working Capital | | $ | 2,587 | | | $ | 3,609 | |
| Weighted Average shares outstanding (basic) | | | 170,481 | | | | 140,361 | |
| Weighted Average shares outstanding (diluted) | | | 170,481 | | | | 144,926 | |
| Per share cash flows from operating activities (basic and diluted) | | $ | 0.02 | | | $ | 0.03 | |
Cash Cost Per Ounce
The Company reports its cash costs on a per-ounce basis, based on uniform standards developed by the Gold Institute, an independent researcher and evaluator of the gold market and gold industry. Management uses this measure to analyze the profitability, compared to average realized gold prices, of the Seabee Gold Operation. Investors are cautioned that the above measures may not be comparable to similarly titled measures of other companies, should these companies not follow Gold Institute standards.
| Table 22: Total Cash Cost per Gold Ounce Sold |
| | | March 31 | | | March 31 | |
| | | 2012 | | | 2011 | |
| | | | | | | |
| Production cost (CDN$) | | $ | 11,796 | | | $ | 8,746 | |
| Divided by ounces sold | | | 9,547 | | | | 9,461 | |
| Total cash cost per ounce (CDN$) | | $ | 1,236 | | | $ | 924 | |
| | | | | | | | | |
| CDN$ Exchange Rate | | $ | 1.0012 | | | $ | 0.9861 | |
| Total cash cost per ounce (US$) | | $ | 1,234 | | | $ | 937 | |
Net Cash Margin
The Company uses net cash margin, which represents realized price per ounce less net cash costs per ounce. This measure is used by Management to analyze profitability trends and to assess the cash-generating capability from the sale of gold on a consolidated basis in each reporting period, expressed on a unit basis. Management believes that this measurement illustrates the performance of the Company’s business on a consolidated basis and enables investors to better understand Claude’s performance in comparison to other gold producers who present results on a similar basis and is an important indicator of expected performance in future periods.
The Company’s net cash margin is intended to provide additional information, does not have any standardized meaning prescribed by IFRS and should not be considered in isolation or as a substitute for measures of performance prepared in accordance with IFRS. This measure is not necessarily indicative of operating profit or cash flow from operations as determined under IFRS. Other companies may calculate net cash margin differently. This non-IFRS measure is calculated from realized gold price per ounce and total cash costs per ounce, as determined in the net cash cost reconciliation. Net cash margin could also be derived from realized price per ounce and net cash costs per ounce.
Q1 2012 Management’s Discussion and Analysis
(inthousands of CDN dollars, except as otherwise noted) | Page 36 |
Disclosure Controls and Internal Controls over Financial Reporting
As at March 31, 2012, we evaluated our disclosure controls and procedures as defined in the rules of the U.S. Securities and Exchange Commission (“SEC”) and the Canadian Securities Administrators. This evaluation was carried out under the supervision and participation of Management, including the President and Chief Executive Officer and the Chief Financial Officer. Based on that evaluation, the President and Chief Executive Officer and Chief Financial Officer concluded that the design and operation of these disclosure controls and procedures were effective.
Management is responsible for establishing and maintaining adequate internal control over financial reporting. Internal control over financial reporting, no matter how well designed, has inherent limitations and can only provide reasonable assurance with respect to the preparation and fair presentation of published financial statements. Under the supervision and with the participation of the President and Chief Executive Officer and the Chief Financial Officer, management conducted an evaluation of the effectiveness of its internal control over financial reporting based on the framework in Internal Control – Integrated Framework issued by the Committee of Sponsoring Organizations of the Treadway Commission. Based on this evaluation, the President and Chief Executive Officer and the Chief Financial Officer concluded that internal control over financial reporting is effective as at March 31, 2012.
We have assessed the impact of the IFRS transition on our internal control over financial reporting and on our disclosure controls and procedures. Changes in accounting policies or business processes may require additional controls or procedures to ensure the integrity of our financial disclosures. The transition to IFRS has not required any changes in our internal controls over financial reporting or our disclosure controls and procedures that have materially affected them or are reasonably likely to materially affect them.
No significant changes were made in our internal controls over financial reporting during the period ended March 31, 2012 that have materially affected, or are reasonably likely to materially affect, our internal control over financial reporting.
Cautionary Note to U.S. Investors Concerning Resource Estimates
Resource Estimates
The resource estimates in this Management’s Discussion and Analysis were prepared in accordance with National Instrument 43-101, adopted by the Canadian Securities Administrators. The requirements of National Instrument 43-101 differ significantly from the requirements of the SEC. In this Management’s Discussion and Analysis, the Company uses certain terms such as “measured”, “indicated” and “inferred” resources. Although these terms are recognized and required in Canada, the SEC does not recognize them. The SEC permits U.S. mining companies, in their filings with the SEC, to disclose only those mineral deposits that constitute “reserves”. Under U.S. standards, mineralization may not be classified as a reserve unless the determination has been made that the mineralization could be economically and legally extracted at the time the determination is made. U.S. investors should not assume that all or any portion of a measured or indicated resource will ever be converted into “reserves”. Further, “inferred resources” have a great amount of uncertainty as to their existence and whether they can be mined economically or legally, and U.S. investors should not assume that “inferred resources” exist or can be legally or economically mined, or that they will ever be upgraded to a more certain category.
Compliance with Canadian Securities Regulations
This quarterly report is intended to comply with the requirements of the Toronto Stock Exchange and applicable Canadian securities legislation, which differ in certain respects from the rules and regulations promulgated under the United States Securities Exchange Act of 1934, as amended (“Exchange Act”), as promulgated by the SEC.
Q1 2012 Management’s Discussion and Analysis
(inthousands of CDN dollars, except as otherwise noted) | Page 37 |
U.S. investors are urged to consider the disclosure in our Annual Report on Form 40-F, File No. 001-31956, as filed with the SEC under the Exchange Act, which may be obtained from the Company (without cost) or from the SEC’s Web site:http://sec.gov/edgar.shtml.
Caution Regarding Forward-Looking Information
All statements, other than statements of historical fact, contained or incorporated by reference in this MD&A and constitute “forward-looking information” within the meaning of applicable Canadian securities laws and “forward-looking statements” within the meaning of the United States Private Securities Litigation Reform Act of 1995 (referred to herein as “forward-looking statements”). Forward-looking statements include, but are not limited to, statements with respect to the future price of gold, the estimation of mineral reserves and resources, the realization of mineral reserve estimates, the timing and amount of estimated future production, costs of production, capital expenditures, costs and timing of the development of new deposits, success of exploration activities, permitting time lines, currency exchange rate fluctuations, requirements for additional capital, government regulation of mining operations, environmental risks, unanticipated reclamation expenses, title disputes or claims and limitations on insurance coverage. Generally, these forward-looking statements can be identified by the use of forward-looking terminology such as “plans”, “expects” or “does not expect”, “is expected”, “budget”, “scheduled”, “estimates”, “forecasts”, “intends”, “anticipates” or “does not anticipate” or “believes”, or the negative connotation thereof or variations of such words and phrases or state that certain actions, events or results, “may”, “could”, “would”, “might” or “will be taken”, “occur” or “be achieved” or the negative connotation thereof.
All forward-looking statements are based on various assumptions, including, without limitation, the expectations and beliefs of management, the assumed long-term price of gold, that the Company will receive required permits and access to surface rights, that the Company can access financing, appropriate equipment and sufficient labour, and that the political environment within Canada will continue to support the development of mining projects in Canada.
Forward-looking statements are subject to known and unknown risks, uncertainties and other factors that may cause the actual results, level of activity, performance or achievements of Claude to be materially different from those expressed or implied by such forward-looking statements, including but not limited to: actual results of current exploration activities; environmental risks; future prices of gold; possible variations in ore reserves, grade or recovery rates; mine development and operating risks; accidents, labour issues and other risks of the mining industry; delays in obtaining government approvals or financing or in the completion of development or construction activities; and other risks and uncertainties, including but not limited to those discussed in the section entitled “Business Risk” in this MD&A. These risks and uncertainties are not, and should not be construed as being, exhaustive.
Although Claude has attempted to identify important factors that could cause actual results to differ materially from those contained in forward-looking statements, there may be other factors that cause results not to be as anticipated, estimated or intended. There can be no assurance that such statements will prove to be accurate, as actual results and future events could differ materially from those anticipated in such statements. Accordingly, readers should not place undue reliance on forward-looking statements.
Forward-looking statements in this MD&A are made as of the date of this MD&A, being May 10, 2012 and, accordingly, are subject to change after such date. Except as otherwise indicated by Claude, these statements do not reflect the potential impact of any non-recurring or other special items that may occur after the date hereof. Forward-looking statements are provided for the purpose of providing information about management’s current expectations and plans and allowing investors and others to get a better understanding of our operating environment.
Claude does not undertake to update any forward-looking statements that are incorporated by reference herein, except in accordance with applicable securities laws.
Q1 2012 Management’s Discussion and Analysis
(inthousands of CDN dollars, except as otherwise noted) | Page 38 |
The forward-looking statements contained in this Management’s Discussion and Analysis are expressly qualified by these cautionary statements.
Additional Information
Additional information related to the Company, including its Annual Information Form (Form 40-F in the U.S.), is available on Canadian (www.sedar.com) and U.S. (www.sec.gov) securities regulatory authorities’ websites. Certain documents are also available on the Company’s website atwww.clauderesources.com.
Q1 2012 Management’s Discussion and Analysis
(inthousands of CDN dollars, except as otherwise noted) | Page 39 |
Conversion Multiples
For ease of reference, the following factors for converting metric measurements into imperial equivalents are provided:
| To Convert from Metric | | To Imperial | | Multiply Metric Units by |
| Metres | | Feet (ft.) | | 3.281 |
| Kilometres (km) | | Miles | | 0.621 |
| Tonnes | | Tons (2,000 pounds) | | 1.102 |
| Grams | | Troy Ounces | | 0.032 |
| Hectares | | Acres | | 2.471 |
Glossary of Financial Terms
Current ratio = (current asset / current liabilities)
Debt to capital= (total debt – cash and cash equivalents) / (total debt – cash and cash equivalents + total shareholders’ equity)
Working capital = (current asset – current liabilities)
Glossary of Technical Terms
Alteration –any change in the mineral composition of a rock brought about by physical or chemical means.
Assaying- laboratory examination that determines the content or proportion of a specific metal (i.e.: silver) contained within a sample. Technique usually involves firing/smelting.
Au Eq (“gold equivalent”) –a measure of contained metal expressed in equivalent gold grade.
Biotite – a widely distributed and important rock-forming mineral of the mica group.
Brecciated – broken into sharp-angled fragments surrounded by finer-grained material.
Bulk Sample – a collection of representative mineralized material whose location, geologic character and metal assay content can be determined and then used for metallurgical or geotechnical testing purposes.
Chalcopyrite - a sulphide mineral of copper and iron.
Chlorite – a group of platy, monoclinic, usually greenish minerals.
Chloritic alteration – the replacement by, conversion into, or introduction of chlorite into a rock.
Core Samples- the cylindrical form of rock called “core” that is extracted from a diamond drill hole. Mineralized sections are separated and these samples are sent to a laboratory for analysis.
Cross-cut- a horizontal opening driven from a shaft or haulage drift at an oblique or right angle to the strike of a vein or other orebody.
Cut-off Grade - the lowest grade of mineralized material that qualifies as a reserve in a deposit (i.e.: contributing material of the lowest assay that is included in a reserve estimate).
Q1 2012 Management’s Discussion and Analysis
(inthousands of CDN dollars, except as otherwise noted) | Page 40 |
Diamond Drilling – a type of rotary drilling in which diamond bits are used as the rock-cutting tool to produce a recoverable drill core sample of rock for observation and analysis.
Dip – the angle that a structural surface, a bedding or fault plane makes with the horizontal, measured perpendicular to the strike of the structure.
Drift - a horizontal underground opening that follows along the length of a vein or rock formation.
Duty to Consult - governments in Canada may have a duty to consult with and potentially accommodate Aboriginal groups prior to making decisions which may impact lands and resources subject to established or potential treaty or Aboriginal rights, title or other claims. These governments, in turn, may delegate procedural aspects of this duty to industry.
Exploration– work involved in searching for ore, from prospecting to diamond drilling or driving a drift.
Fault – a fracture or break in rock along which there has been movement.
Feasibility Study – a comprehensive technical and economic study of the selected development option for a mineral project that includes appropriately detailed assessments of realistically assumed mining, processing, metallurgical, economic, marketing, legal, environmental, social and governmental considerations together with any other relevant operational factors and detailed financial analysis, that are necessary to demonstrate at the time of reporting that extraction is reasonably justified (economically mineable). The results of the study may reasonably serve as the basis for a final decision by a proponent or financial institution to proceed with, or finance, the development of the project. The confidence level of the study will be higher than that of a Prefeasibility Study.
Fire Assay - the assaying of metallic minerals by use of a miniature smelting procedure with various agents.
Footwall - the rock on the underside of a vein or ore structure.
Fracture – a break or crack in rock.
Geophysical Survey - a scientific method of prospecting that measures the physical properties of rock formations. Common properties investigated include magnetism, specific gravity, electrical conductivity and radioactivity.
Grade – the metal content of rock with precious metals, grade can be expressed as troy ounces or grams per tonne of rock.
Granitoid – a light-coloured, plutonic rock with quartz between 20 and 60 percent.
Head Grade – the average grade of ore fed into a mill.
Hydrothermal– the products or the actions of heated waters in a rock mass such as a mineral deposit precipitating from a hot solution.
Igneous– a primary type of rock formed by the cooling of molten material.
Indicated Mineral Resource – is that part of a Mineral Resource for which quantity, grade or quality, densities, shape and physical characteristics, can be estimated with a level of confidence sufficient to allow the appropriate application of technical and economic parameters, to support mine planning and evaluation of the economic viability of the deposit. The estimate is based on detailed and reliable exploration and testing information gathered through appropriate techniques from locations such as outcrops, trenches, pits, workings and drill holes that are spaced closely enough for geological and grade continuity to be reasonably assumed.
Q1 2012 Management’s Discussion and Analysis
(inthousands of CDN dollars, except as otherwise noted) | Page 41 |
Inferred Mineral Resource – is that part of a Mineral Resource for which quantity and grade or quality can be estimated on the basis of geological evidence and limited sampling and reasonably assumed, but not verified, geological and grade continuity. The estimate is based on limited information and sampling gathered through appropriate techniques from locations such as outcrops, trenches, pits, workings and drill holes.
Lens - a body of ore that is thick in the middle and tapers towards the ends.
Lithostructural– an assemblage of rocks that is unified on the basis of structural and lithological features.
Mafic - igneous rocks composed mostly of dark, iron and magnesium-rich minerals.
Measured Mineral Resource -is that part of a Mineral Resource for which quantity, grade or quality, densities, shape, and physical characteristics are so well established that they can be estimated with confidence sufficient to allow the appropriate application of technical and economic parameters, to support production planning and evaluation of the economic viability of the deposit. The estimate is based on detailed and reliable exploration, sampling and testing information gathered through appropriate techniques from locations such as outcrops, trenches, pits, workings and drill holes that are spaced closely enough to confirm both geological and grade continuity.
Metallurgy– the study of the extractive processes which produce minerals from their host rocks.
Mill - A processing facility where ore is finely ground and thereafter undergoes physical or chemical treatment to extract the valuable metals.
Mineral– a naturally formed chemical element or compound having a definitive chemical composition and usually a characteristic crystal form.
Mineralization– a natural concentration in rocks or soil of one or more minerals.
Mineral Reserve – the economically mineable part of a Measured or Indicated Mineral Resource demonstrated by at least a Prefeasibility Study. This study must include adequate information on mining, processing, metallurgical, economic and other relevant factors that demonstrate, at the time of reporting, that economic extraction can be justified. A Mineral Reserve includes diluting materials and allowances for losses that may occur when material is mined.
Mineral Resource – a concentration or occurrence of natural, solid, inorganic, or fossilized organic material in or on the Earth’s crust in such form and quantity and of such a grade or quality that it has reasonable prospects for economic extraction. The location, quantity, grade, geological characteristics, and continuity of a Mineral Resource are known, estimated or interpreted from specific geological evidence and knowledge.
Ounces - Troy ounces of a fineness of 999.9 parts per 1,000 parts.
Ore - Rock, generally containing metallic or non-metallic minerals, which can be mined and processed at a profit.
Ore Body - A sufficiently large amount of ore that can be mined economically.
Plunge - the vertical angle a linear geological feature makes with the horizontal plane.
Porphyry - any igneous rock in which relatively large crystals are set in a fine-grained groundmass.
Prefeasibility Study – a comprehensive study of the viability of a mineral project that has advanced to a stage where the mining method, in the case of underground mining, or the pit configuration, in the case of an open pit, has been established, and where an effective method of mineral processing has been determined. This study must include a financial analysis based on reasonable assumptions of technical engineering, operating, and economic factors, which are sufficient for a Qualified Person acting reasonably, to determine if all or part of the Mineral Resource may be classified as a Mineral Reserve.
Q1 2012 Management’s Discussion and Analysis
(inthousands of CDN dollars, except as otherwise noted) | Page 42 |
Probable Mineral Reserve – the economically mineable part of an Indicated, and in some circumstances, a Measured Mineral Resource, demonstrated by at least a Prefeasibility Study. This study must include adequate information on mining, processing, metallurgical, economic and other relevant factors that demonstrate, at the time of reporting, that economic extraction can be justified.
Proven Mineral Reserve – the economically mineable part of a Measured Mineral Resource demonstrated by at least a Prefeasibility Study. This study must include adequate information on mining, processing, metallurgical, economic and other relevant factors that demonstrate, at the time of reporting, that economic extraction is justified.
Pulp - a mixture of ground ore and water.
Pyrite - an iron sulphide mineral (FeS2), the most common naturally occurring sulphide mineral.
Pyrrhotite - a bronze-colored, often magnetic iron sulphide mineral.
Qualified Person – an individual who is an engineer or geoscientist with at least five (5) years of experience in mineral exploration, mine development, mine operation, project assessment or any combination of these; has experience relevant to the subject matter of the mineral project and technical report; and is a member in good standing of a professional association.
Quartz – crystalline silica; often forming veins in fractures and faults within older rocks.
Raise -a vertical or inclined underground working that has been excavated from the bottom upward.
Sericite – a fine-grained potassium mica found in various metamorphic rocks.
Shear Zone - a zone in which shearing has occurred on a large scale so that the rock is crushed and brecciated.
Showing - surface occurrence of mineral.
Shrinkage Stoping – any mining method in which broken ore is temporarily retained in the stope to provide a working platform and/or to offer temporary support to the stope walls during active mining.
Sill - an intrusive sheet of igneous rock of roughly uniform thickness that has been forced between the bedding planes of existing rock; the initial horizontal drift along the strike of the ore vein.
Specific Gravity - the ratio between the weight of a unit volume of a substance and that of a unit volume of water.
Stope - an underground excavation from which ore has been extracted, either above or below a level. Access to stopes is usually by way of adjacent raises.
Stratigraphy – the sequence of bedded rocks in a particular area.
Tailings - Tailings consist of ground rock and process effluents that are generated in a mine processing plant or mill. Mechanical and chemical processes are used to extract gold from mine ore and produce a waste stream known as tailings. This process of product extraction is never 100 percent efficient, nor is it possible to reclaim all reusable and expended processing reagents and chemicals. The unrecoverable and uneconomic metals, minerals, chemicals, organics and process water are discharged, normally as slurry, to a final storage area commonly known as a Tailings Management Facility (TMF) or Tailings Storage Facility (TSF).
Q1 2012 Management’s Discussion and Analysis
(inthousands of CDN dollars, except as otherwise noted) | Page 43 |
Till - is unsorted glacial sediment. Its content may vary from clays to mixtures of clay, sand, gravel and boulders. This material is typically derived from the subglacial erosion and incorporated by the moving ice of the glaciers of previously available unconsolidated sediments.
Tonne – a metric ton or 2,204 pounds.
Trenching -the process of exploration by which till is removed from a trench cut from the earth’s surface.
Vein– a thin, sheet-like, cross-cutting body of hydrothermal mineralization, principally quartz.
Waste – barren rock in a mine, or mineralized material that is too low in grade to be mined and milled at a profit.
Working interestorWI - means the interest held by Claude in property. This interest normally bears its proportionate share of capital and operating costs as well as royalties or other production burdens. The working interest percentage is expressed before royalty interests.