Management’s Discussion and Analysis
The following Management’s Discussion and Analysis (“MD&A”) of the consolidated operating and financial performance of Claude Resources Inc. (“Claude” or the “Company”) for the years ended December 31, 2013 and 2012 is prepared as of March 28, 2014. This discussion is the responsibility of Management and has been prepared using International Financial Reporting Standards (“IFRS”), as issued by the International Accounting Standards Board. This discussion should be read in conjunction with the Company’s audited consolidated financial statements and notes thereto. The Board of Directors has approved the disclosure presented herein. All amounts referred to in this discussion are expressed in Canadian dollars, except where otherwise indicated.
Overview
Claude Resources Inc., incorporated pursuant to the Canada Business Corporations Act, is a gold producer with shares listed on both the Toronto Stock Exchange (TSX-CRJ) and OTCQB (OTCQB – CLGRF). The Company is also engaged in the exploration and development of gold Mineral Reserves and Mineral Resources. The Company’s entire asset base is located in Canada.
The Company’s revenue generating asset is the 100 percent owned Seabee Gold Operation, located in northern Saskatchewan, which includes 42,500 acres (17,200 hectares) and is comprised of five mineral leases and extensive surface infrastructure. Claude also owns 100 percent of the Amisk Gold Project in northeastern Saskatchewan. The Amisk Gold Project is located 20 kilometres southwest of Flin Flon, Manitoba and hosts the Amisk Gold Deposit and a large number of gold occurrences and prospects. At 99,800 acres (40,400 hectares), this gold and silver exploration property is one of the largest land positions in the Flin Flon mineral district.
The Company’s Seabee and Amisk properties contain large, long life Mineral Resources in the politically safe jurisdiction of Canada. These properties, and their related deposits, each contain over one million ounces of gold in the ground inventory and have significant leverage to the price of gold and provide valuable opportunities for the Company and its shareholders. Management intends to monitor the attractiveness of these projects and evaluate alternatives to optimize value.
Corporate Developments
Madsen Sale
During the first quarter of 2014, the Company completed the sale of the Madsen Gold Project to Laurentian Goldfields Ltd. (“Laurentian”). Claude received $6.25 million cash and will receive $2.5 million of cash or equity (at Laurentian’s option) payable six months following the close of the transaction. Cash proceeds were utilized to reduce bank debt and for working capital purposes. In addition, Claude received 9,776,885 shares of Laurentian. The sale of the Madsen Gold Project aligns with Claude’s strategic plan to focus on improving the Company’s cash flow, margins and Balance Sheet. Laurentian’s Management has a proven track record in exploration and development of gold assets and have significant experience and knowledge of the Red Lake gold camp. With Laurentian’s strong technical team, Claude remains confident in the opportunity that exists at the Madsen asset and are pleased that its shareholders, through the Company’s equity ownership in Laurentian, will retain exposure to the potential upside in its advancement.
CEO Retirement
Also during the first quarter of 2014, Claude announced the retirement of the Company’s long-time President and Chief Executive Officer Neil McMillan, effective March 31, 2014. Mr. McMillan’s retirement will bring to a close a remarkable 18-year career at Claude. During his tenure, Neil had a tireless commitment, steadfast loyalty and the ability to lead the Company through difficult gold environments. In addition, Claude reached a production milestone of one million ounces at the Seabee Gold Operation, expanded its asset portfolio and built a strong management team capable of advancing the Company through these challenging times in the gold sector.
2013 Annual Management’s Discussion and Analysis
(in thousands of CDN dollars, except as otherwise noted) |
Page 2 |
Effective April 1, 2014, Mike Sylvestre, a Director of Claude, will assume the role of President and Chief Executive Officer on an interim basis while the search for a permanent candidate is ongoing. Mr. Sylvestre is currently the President and Chief Executive Officer for Castle Resources Inc., an exploration and mine development company based in Toronto, Canada. Mr. Sylvestre holds an MSc and a BSc in Mining Engineering from McGill University and Queen’s University, respectively. He is also a member of the Professional Engineers of Ontario and the Canadian Institute of Mining. For most of his career, Mr. Sylvestre worked at Inco Ltd. where he most recently held senior management positions domestically and internationally. Most notably, he was the CEO of Vale Inco, New Caledonia, President Vale Inco, Manitoba Operations and Vice President of Operations PT Inco, Indonesia. Mr. Sylvestre brings over 35 years of mining experience to Claude, is Chairman of the Board of Wellgreen Platinum and also serves on the Board of James Bay Resources.
Term Loan Amendment Agreement
At December 31, 2013, the Company was not in compliance with a financial covenant requirement of the Term Loan as at December 31, 2013. This financial covenant requirement was not waived by CCP prior to December 31, 2013; as such, the amortized cost of the Term Loan has been re-classed as current for financial statement presentation purposes. Based on the Company's projections at December 31, 2013, the Company believed it would be unlikely that it will be in compliance with these certain existing covenants during fiscal 2014 without an amendment or waiver of certain covenants by CCP. Subsequent to December 31, 2013, the Company executed a Waiver and Credit Amendment Agreement (“Amendment Agreement”) which renegotiated the terms of its $25.0 million term loan (the “Loan”) with Crown Capital Partners Inc. (“CCP”). The Amendment Agreement has modified certain covenants within the original Term loan with CCP. In addition, the 5,750,000 common share purchase warrants pursuant to the original agreement were cancelled in conjunction with the waiver of the covenant breach for consideration of $1.0 million, which was paid with 4,545,454 common shares of Claude.
Royalty
Subsequent to December 31, 2013, the Company sold a Net Smelter Return (“NSR”) royalty agreement on the Seabee Gold Operation. Pursuant to this transaction, proceeds of U.S. $12.0 million were received by the Company in exchange for a three (3) percent NSR. Under the terms of the NSR, the Company has the right to re-purchase 50 percent of the NSR for U.S. $12.0 million, expiring on December 31, 2016. The NSR payments will be paid quarterly in cash or in physical gold at the average price of gold in each calendar month. Proceeds from the NSR will be used for further development and for general working capital purposes primarily related to the Seabee Gold Operation.
Gold Price Environment
During the second quarter of 2013, the price of gold witnessed its biggest plunge since 1980 (dropping below U.S. $1,200 an ounce). As of the date of this MD&A, the Company’s realized gold prices remain depressed from levels observed during the first half of 2013. Management is continuing its goal to improve unit operating costs at the Seabee Gold Operation with the implementation of its cash flow optimization plan, designed to maximize cash flow, while further developing satellite deposits including the Company’s Santoy Gap deposit.
De-listing from NYSE MKT
Based on the general tone of the resource sector and the Company’s ongoing pursuit to minimize its corporate expenditures, the Company voluntarily delisted its common shares from the NYSE MKT (Please see Claude news release “Claude Resources Inc. Announces to Voluntarily Delist Common Shares from the NYSE MKT,” dated October 9, 2013 and Claude news release “Claude Resources Inc. Shares Begin Trading on the OTCQB Under the Symbol CLGRF,” dated November 1, 2013). The Company’s shares continue to trade on the Toronto Stock Exchange (“TSX”).
Following its delisting of the Shares from the NYSE MKT, Claude will continue to file or furnish reports with the SEC. However, the Company also announced that it intends at a future date, when permitted under SEC rules, to terminate its registration of its common shares with the SEC.
2013 Annual Management’s Discussion and Analysis
(in thousands of CDN dollars, except as otherwise noted) |
Page 3 |
Strategic Review
The Company has engaged a strategic and financial advisor to undertake a strategic review of Claude’s business plan and capital structure and to explore alternatives with the objective to maximize value for all shareholders.
The Company has not established a definitive timeline to complete its review and there can be no assurance that this process will result in any specific strategic or financial or other value-creating transaction. The Company does not currently intend to disclose further developments with respect to this process, unless and until the Company approves a specific transaction, concludes its review of the strategic alternatives or otherwise determines there is material information to communicate.
GOING CONCERN
The Company’s consolidated financial statements have been prepared on the assumption that the Company will continue as a going concern and realize its assets and discharge its liabilities in the normal course of business. As at December 31, 2013, the Company has a working capital deficiency of $11.9 million, was in violation of certain financial covenants on its term loan and incurred a loss of $73.4 million for the year ended December 31, 2013. These factors result in a material uncertainty and therefore cast substantial doubt as to the Company’s ability to continue as a going concern.
The Company’s plans to address this material uncertainty include selling certain assets (Note 24(a)) obtaining a waiver of the above covenant violation (Note 24(b)), completing a royalty agreement financing for gross cash proceeds of U.S. $12.0 million (Note 24(c)) and implementing operational cost savings measures. As a condition of obtaining the covenant waiver, the Company agreed to exercise commercially reasonable efforts to effect a sale or other transaction of all or a portion of its assets by July 31, 2014. The Company has engaged a financial advisor to assist with this process. If the Company’s plans are unsuccessful, it would be required to request additional waivers for potential covenant violations from its lenders and seek additional sources of financing (debt or equity). The ability of the Company to continue as a going concern and to realize the carrying value of its assets and discharge its liabilities when due is dependent on continued support from its lenders and the successful completion of the actions taken or planned, some of which are described above, which management believes may mitigate the adverse conditions and events which raise substantial doubt about the validity of the going concern assumption used in preparing these consolidated financial statements. There is no certainty that these and other strategies will be sufficient to permit the Company to continue as a going concern.
The consolidated financial statements do not reflect adjustments that would be necessary if the going concern assumption were not appropriate. If the going concern basis was not appropriate for these consolidated financial statements, adjustments would be necessary to the carrying value of assets and liabilities, the reported revenues and expenses, and the statement of financial position classifications used.
Production, Financial and Exploration Highlights
Seabee Gold Operation Production
| · | Production: 43,850 ounces produced (2012 - 49,570 ounces produced) was short of expectation and due to lower than anticipated grade. |
| · | Claude has effected a significant reduction in total Company expenditures during 2013 which was largely attributable to improved planning and procurement practices, increased productivity and a decrease in labour costs and major capital expenditures. |
2013 Annual Management’s Discussion and Analysis
(in thousands of CDN dollars, except as otherwise noted) |
Page 4 |
| · | Seabee Mine Shaft Extension Project: Seabee successfully completed the shaft extension project after a 25 day shutdown in January 2013. Halting operations was required to excavate and furnish the final segment of the shaft separating out the upper (existing) portion of the shaft and the new extension at depth. Following completion of the shaft, commissioning of the new hoisting system, rock breaker and loading pocket facilities was completed. The shaft resumed hoisting ore from the 980 metre level following the shutdown. The reduction of trucking distance and ore handling has resulted in lower operating costs (including labour, diesel consumption and maintenance) and improved ventilation. Overall, Seabee mining costs have improved from $210 per tonne to $175 per tonne. |
| · | Tonnes Milled: achieved record mill throughput of 280,000 tonnes during 2013. |
Financial
| · | Revenue:Sales of 44,823 ounces (2012 - 48,672 ounces) at an average price of CDN $1,423 (U.S. $1,382) generated revenue of $63.8 million, a 21 percent decrease from 2012 revenue of $80.8 million at an average price of $1,660 (U.S. $1,661), reflecting an eight percent decrease in ounces sold and 14 percent decrease in average realized price. |
| · | Cash cost per ounce of gold(1): CDN $983 (U.S. $954) per ounce for the year ended December 31, 2013 was comparable to the CDN $997 (U.S. $998) per ounce for the year ended December 31, 2012. |
| · | Net cash margin: CDN $440 per ounce (2012 - CDN $663 per ounce), largely impacted by the drop in average realized gold price year over year. |
| · | Net (loss) profit: Net loss of $73.4 million, or $0.42 per share (2012 – net profit of $5.6 million, or $0.03 per share), after impairment charges of $63.8 million offset by a $1.4 million deferred income tax recovery. |
| · | Impairment:Impairment charges of $63.8 million (2012 – nil), $22.2 of which related to the Company’s Seabee Gold Operation and $41.6 million of which related to the Company’s Madsen Project, which was classified as held for sale during the third quarter, and reflects re-measurement (required by this classification) of this asset at the lower of its carrying amount and fair value less costs to sell. |
| · | Deferred Income Tax (Recovery) Expense:Deferred income tax recovery of $1.4 million (2012 - deferred income tax expense of $3.0 million). The variance, year over year, is due to an increase in the loss before taxes primarily due to the impairment charges on the Madsen Project and Seabee Gold Operation. |
| · | Adjusted Net (loss) profit(1): After adjusting for deferred income tax (recovery) expense and non-recurring items such as impairment charges and loss on investments, the Company’s adjusted net loss was $10.7 million, or $0.06 per share (2012 – adjusted net profit of $8.7 million, or $0.05 per share). |
| · | Cash flow from operations before net changes in non-cash operating working capital(2): $13.8 million, or $0.08 per share (2012 – $25.8 million, or $0.15 per share). |
Exploration
Mineral Reserves and Mineral Resources:
| · | Proven and Probable Mineral Reserves at November 15, 2013 were 422,900 ounces of gold. The Santoy Gap deposit contributed 266,100 ounces of this total. Measured and Indicated (“M&I”) Mineral Resources at November 15, 2013 were 175,200 ounces of contained gold. The Santoy Gap deposit contributed 83,900 ounces of this total. |
| · | The Santoy Gap deposit, part of the Santoy Mine Complex, represents an opportunity for the Company to grow production due to Santoy Gap’s proximity to permitted mine infrastructure, low development cost and near-term production potential. |
Seabee Gold Operation:
| · | Drill results from the Santoy Mine Complex included 18.80 grams of gold per tonne over 13.86 metres and 330.35 grams of gold per tonne over 1.55 metres, inclusive of a bonanza grade interval of 602.00 grams of gold per tonne over 0.84 metres. |
2013 Annual Management’s Discussion and Analysis
(in thousands of CDN dollars, except as otherwise noted) |
Page 5 |
| · | Over 50,000 metres of underground drilling was completed during 2013. The Company’s focus was on Seabee Deep, L62 and the Santoy Mine Complex. |
| · | Exploration at the Seabee Gold Operation focused on surface drilling at the Santoy Mine Complex and testing near the Seabee Mine. |
| · | The 2013 summer regional target program was completed during the third quarter and successfully outlined significant extensions to the Santoy 8 and Santoy Gap ore bodies and discovered a number of new showings and structures that have the potential to develop into new near mine targets in the Seabee and Santoy regions during 2014. |
| · | During 2014, exploration at the Seabee Gold Operation, exploration expenditures will focus on low cost per ounce targets, proximal to infrastructure with the potential to materially impact near-term production, drive resource growth and to positively impact the Company’s Mineral Reserves and Mineral Resources. |
Amisk Gold Project:
| · | During 2013, planned expenditures at the Amisk Gold Project were deferred due to the low gold price environment; as such, exploration activities at the Amisk Gold Project have been minimal. |
Madsen:
| · | During 2013, as part of its strategy to minimize corporate expenditures and to focus on its core producing asset, the Seabee Gold Operation, Claude adopted a plan to sell its Madsen Property. The sale of Madsen was completed in the first quarter of 2014. |
Outlook
The Company has aggressively taken steps to reduce corporate expenditures, has identified and implemented annualized savings during 2013 of approximating 20 percent and will continue to review and adjust expenditures during 2014 and beyond.
Operating and Financial Outlook
The Company completed its shaft extension project at the Seabee Mine and was able to reach full production from the L62 deposit. In addition, it achieved record mill throughput of 280,000 tonnes during full year 2013. During 2014, the Company will see the completion of many milestones including:
| · | the continuation of access development to the Santoy Gap for infill drilling of the deposit; excavation of the 300 metre Santoy Gap vent raise to surface; |
| · | expansion of the electrical distribution system to accommodate operational growth; and |
| · | initial development ore from Santoy Gap. |
For 2014, forecast gold production at the Seabee Operation is estimated to range from 47,000 to 51,000 ounces of gold. Unit costs for 2014 are expected to be comparable to 2013’s unit cash costs of $983 CDN per ounce. Quarterly operating results are expected to fluctuate throughout 2013; as such, they will not necessarily be reflective of the full year average.
Access to the Seabee Gold Operation is by fixed wing aircraft to an airstrip located on the property. Large consumables (including diesel and propane) and items related to the upgrading of the mining fleet and mine infrastructure are trucked to the site via a 60 kilometre annual winter ice road from Brabant Lake on Highway 102. The winter ice road is typically in use from January through March. This seasonal trend of purchasing and delivering inventories to the Seabee Gold Operation results in significant cash outflows during the first quarter of the year.
During 2014, the Company expects 300 to 400 semi-trailer loads (2013 – 450 semi-trailer loads), a result of improved operating effectiveness and fewer capital projects in 2014. The Company will also benefit from lower prices on several of its consumable inventory items, year over year.
2013 Annual Management’s Discussion and Analysis
(in thousands of CDN dollars, except as otherwise noted) |
Page 6 |
At current gold prices and forecast production, Management believes that operating cash flows, proceeds from the sale of Madsen and proceeds from the sale of the NSR royalty on the Seabee Gold Operation will be sufficient to fund the 2014 Winter Ice Road resupply requirements and further development opportunities at the Seabee Gold Operation. In addition, the Company is investigating various external financing options, including the divestiture of non-core assets, to ensure sufficient funding is in place.
Forecast and Capital Outlook
During 2014, capital expenditures are expected to include continued investment and expected upgrades at the Seabee Gold Operation.
Capital expenditures at the Seabee Gold Operation in 2014 are expected to include continued investment and upgrades that are estimated to total approximately $22.0 million, funded from a combination of operating cash flow, the sale of the Madsen Gold Project and the sale of the NSR royalty on the Seabee Gold Operation. This 39 percent reduction from 2013 expenditures of $30.6 million is due to the completion of several major projects, including the shaft extension.
| Table 1: Capital Expenditures (CDN$ million) |
| | | 2014
Estimate | | | 2013
Actual | |
| Capital | | | | | | | | |
| Development | | $ | 11.0 | | | $ | 18.1 | |
| Sustaining | | | 5.5 | | | | 7.9 | |
| Expansion | | | 5.5 | | | | 4.6 | |
| | | $ | 22.0 | | | $ | 30.6 | |
Development expenditures are expected to be prioritized at Santoy Gap. Sustaining capital costs include expenditures on equipment replacement and tailings management facilities. Expansion capital is expected to focus in the Santoy Gap area to support the Company’s Life of Mine Plan and to generate future returns for the Company as the Santoy Gap deposit represents one of the Company’s best opportunities to build shareholder value.
Exploration Outlook
Exploration spending during 2014 is forecast to be approximately $0.2 million (2013 - $1.6 million).
At the Seabee Gold Operation, exploration expenditures will focus on low cost per ounce targets, proximal to infrastructure with the potential to materially impact near-term production, drive resource growth and to positively impact the Company’s Mineral Reserves and Mineral Resources. Drilling at Seabee is anticipated to consist of the following:
| Table 2: Summary of Estimated 2014 Drilling at Seabee |
| Area | | Target | | Metres | |
| Seabee Operations | | Seabee underground | | | 18,000 | |
| Santoy Mine Complex | | Santoy 8 and Gap underground | | | 34,000 | |
| Total: | | | | | 52,000 | |
Corporate Outlook
In the future, Claude will continue to:
| i) | Pursue best practices in the areas of safety, health and the environment in our operations; |
| ii) | Reduce capital and operating expenditures and improve unit operating costs at the Seabee Gold Operation by continuing to focus on the Company’s cash flow optimization plan designed to maximize cash flow while developing lower cost and higher grade satellite deposits including the Santoy Gap deposit; and |
2013 Annual Management’s Discussion and Analysis
(in thousands of CDN dollars, except as otherwise noted) |
Page 7 |
| iii) | Sustain or increase reserves and resources at the Seabee Gold Operation through targeted exploration and development. |
mission and vision
The Company’s mission is to create and deliver outstanding stakeholder value through the exploration, development and mining of gold and other precious metals. Its vision is to be valued by all stakeholders for its ability to discover, develop and produce gold and other precious metals in a disciplined, safe, environmentally responsible and profitable manner.
goals and key performance drivers – Measuring the Company’s Results
The Company’s goals and key performance drivers include:
| · | Pursuing best practices in the areas of safety, health and the environment in all of our operations; |
| · | Improving operating margins at the Seabee Gold Operation; |
| · | Sustaining reserves and resources at the Seabee Gold Operation through targeted exploration and development; |
| · | Maintaining financial capacity and liquidity in order to reduce financial risk; |
| · | Considering strategically attractive opportunities and accretive transactions; and |
| · | Ensuring that the Company’s share price reflects underlying value. |
Safety, Health and the Environment
The Company strives to protect the safety and health of its employees and the environment it operates in. Claude is continuing to look for ways to improve processes to increase Safety, Health and Environmental performance.
To measure its objectives relating to the Environment, the Company utilizes a Safety, Health and Environment Managements System (“SHEMS”). For Safety and Health, the Company utilizes the Total Recordable Incident Rate (“TRIR”) metric, a common industry rating that is used to determine the number of serious injuries (medical incidents and higher) that a company has for every 200,000 hours worked. Management utilizes the TRIR metric because it considers all incidents that have caused serious harm to the Company’s workforce, thereby enabling the Company to be more proactive with its policies and procedures designed to improve and maintain safety. During 2013, Claude made great progress with this metric and achieved a Company record of 3.6 per 200,000 hours (2012 – 8.2 per 200,000 hours; 2011 – 6.7 per 200,000 hours). The Company is not happy to have any injuries; as such, systems and processes are being monitored with the intention of improving this statistic while striving for zero injuries.
During 2013, a diesel spill occurred at the Company’s mining operations. The spill occurred through a failed fitting connection on the diesel line feeding the mine air heaters. Upon detecting the spill the Company immediately notified regulatory authorities and implemented actions to clean-up the impacted areas. Both activities continued throughout 2013 until winter conditions forced cessation. In the future, the Company expects regular but non-intensive clean-up efforts will be required into the foreseeable future. In February 2014, the Company received notification of provincial charges related to the event. Notwithstanding this incident, the Company has made great strides with respect to its Environment Management System. Including this event, reportable incidents decreased by 40 percent year over year.
Production, Gold Price Realized and Unit Operating Costs at the Seabee Gold Operation
During 2013, underground operations and the Central Milling Facility at the Seabee Gold Operation mined and processed record tonnes; in addition, development rates also increased by 25 percent over 2012, despite a 10 percent reduction in the Company’s workforce. In addition to several operational records during 2013, the Company safely and successfully completed the shaft extension project in 25 days versus the 42 originally scheduled. This capital project has provided more efficient transportation of ore and waste from the Seabee Deep and L62 Deposits and has positively impacted unit operating costs at the Seabee Mine.
2013 Annual Management’s Discussion and Analysis
(in thousands of CDN dollars, except as otherwise noted) |
Page 8 |
Notwithstanding the several successes achieved at the Seabee Gold Operation, the combination of decreased average realized gold prices per ounce during 2013, augmented by lower than anticipated grade (resulting in lower gold production) and offset by decreased mine operating costs, year over year, has resulted in decreased operating margins for the Company.
During 2013, the Company observed a 13 percent decrease in Canadian dollar gold prices realized (2013 - $1,423 (U.S. $1,382); 2012 - $1,660 (U.S. $1,661)) and decreased gold sales volume (2013 – 44,823 ounces; 2012 – 48,672 ounces).
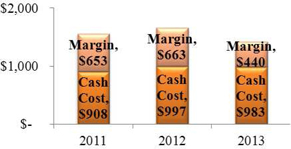
Total Canadian dollar cash cost per ounce of gold(1) for 2013 decreased one percent to CDN $983 (U.S. $954) per ounce from CDN $997 (U.S. $998) in 2012, a result of a nine percent decrease in production costs offset by an eight percent decrease in ounces sold.
During 2013, net cash margin(1) decreased to $440 per ounce from $663 per ounce in 2012.
During 2014, the Company will continue to focus on the profitability of the Seabee Gold Operation through a combination of improved grade control, cost controls and developing the production profile at higher grade ore bodies, including the L62 and Santoy Gap deposits. In addition, at the Seabee Mine, the Company is evaluating changing its mining method to Alimak mining and has observed encouraging results in initial test stopes.
Resource Base
Results obtained from drilling completed during 2013 from the Santoy Gap deposit were incorporated into, and continued to have a positive impact on, the Seabee Mine’s updated NI 43-101 resource calculation as at November 15, 2013. At November 15, 2013, Proven and Probable reserves in the Seabee Gold Operation were 2,308,800 tonnes, grading 5.70 grams per tonne or 422,900 ounces of gold. Mineral Resources at the Seabee Gold Operation included Measured and Indicated Mineral Resources of 175,200 ounces and Inferred Mineral Resources totalling 582,900 ounces.
Financial Capacity
During the first quarter of 2013, the Company expanded its current debt facilities with its existing bank and executed a Term Loan with Crown Capital Partners Inc. (“CCP”) for an additional debt facility of $25.0 million (see financing section below). The new debt facilitated the retirement of the Company’s outstanding debentures (which matured in May 2013) and allowed for the necessary expansion capital at Santoy Gap to support the Company’s Life of Mine Plan.
During 2013, included in the Company’s debt facilities with its bank was a $5.0 million revolving loan, all of which was drawn at December 31, 2013. The Company’s revolving loan was initially due in December 2013; however, upon mutual agreement with its lender, this agreement was extended and the full amount of this facility was repaid in March 2014 in conjunction with the sale of the Madsen Gold Project. Furthermore, subsequent to December 31, 2013, the Company completed an NSR royalty agreement on the Seabee Gold Operation for gross proceeds of U.S. $12.0 million in exchange for a three percent NSR. The combination of the sale of the Madsen Gold Project and the sale of the royalty provide the Company with additional financial strength.
Strategically Attractive and Accretive Transactions
The sale of the Madsen Gold Project aligns with Claude’s strategic plan to focus on improving the Company’s cash flow, margins and Balance Sheet. Laurentian’s Management have a proven track record in exploration and development of gold assets and have significant experience and knowledge of the Red Lake gold camp. The closing of the transaction has provided Claude short term benefits through cash considerations, and through the Company’s equity ownership in Laurentian, provided its shareholders with exposure to the Madsen project.
2013 Annual Management’s Discussion and Analysis
(in thousands of CDN dollars, except as otherwise noted) |
Page 9 |
Shareholder Value
Management believes that, with current market conditions and share performance, the Company is undervalued. However, the Company continues to make what it believes to be the best decisions to maximize shareholder value. These decisions include:
| · | the completion of the debt restructuring in the first half of 2013; |
| · | the Amendment Agreement to the Company’s Term Loan in the first quarter of 2014; |
| · | closing the sale of Madsen and closing the sale of an NSR royalty on the Seabee Gold Operation in the first quarter of 2014; |
| · | developing an updated Life of Mine Plan at Seabee which forecasts an increase to annual production; and |
| · | taking steps to complete accretive and strategically attractive transactions. |
During 2014 and beyond, the Company will continue to develop shareholder value by rationalizing the application of capital and further implementing cost control programs as well as systems and processes intended to reduce overall operating costs at the Seabee Gold Operation. In addition, the Seabee deposit has good near-mine potential and the Company has observed a continued shift in ounce distribution with 68 percent of its contained Mineral Reserves and Mineral Resources in the Santoy Region. Furthermore, Santoy Gap, Santoy 8 and the Santoy Hanging Wall are all likely to continue to grow in the future. As such, the Santoy Gap deposit within the Santoy Mine Complex represents an opportunity for the Company due to its:
| · | proximity to permitted mine infrastructure; |
| · | low development cost; and |
| · | near-term production potential. |
Furthermore, based on its high-grade ore and size, the Santoy Gap deposit demonstrates the potential that exists to grow production at the Seabee Gold Operation and the ability to find high grade ounces near current mine infrastructure.
Mining Operations Results
Seabee Gold Operation
At the Seabee Gold Operation, Claude is focused on improving profit margins and executing its mine plan. Profit margins will be increased by targeting higher grades zones (L62, Santoy Gap), with continued focus on cost control for materials and supplies as well as controlling labour costs.
The Company is also continuing with its review of operating processes and procedures to identify and implement efficiencies designed to increase production and lower operating costs.
During 2013, the Company milled 280,054 tonnes at a grade of 5.11 grams of gold per tonne (2012 – 275,235 tonnes at a grade of 5.86 grams of gold per tonne) for total production of 43,850 ounces of gold (2012 – production of 49,570 ounces of gold). This decrease in ounces produced is attributable to the 13 percent decrease in grade year over year.
2013 Annual Management’s Discussion and Analysis
(in thousands of CDN dollars, except as otherwise noted) |
Page 10 |
| Table 3: Seabee Gold Operation Annual Production and Cost Statistics |
| December 31 | | 2013 | | | 2012 | | | Change | |
| | | | | | | | | | |
| Operating Data | | | | | | | | | | | | |
| Tonnes Milled | | | 280,054 | | | | 275,235 | | | | 2 | % |
| Head Grade (grams per tonne) | | | 5.11 | | | | 5.86 | | | | (13 | )% |
| Recovery (%) | | | 95.3 | % | | | 95.6 | % | | | (0.3 | )% |
| Gold Ounces | | | | | | | | | | | | |
| Produced | | | 43,850 | | | | 49,570 | | | | (12 | )% |
| Sold | | | 44,823 | | | | 48,672 | | | | (8 | )% |
| Financial Data | | | | | | | | | | | | |
| Revenues (CDN$ million) | | $ | 63.8 | | | $ | 80.8 | | | | (21 | )% |
| Production Costs (CDN$ million) | | $ | 44.1 | | | $ | 48.5 | | | | (9 | )% |
| Cash Operating Costs (CDN$/oz)(1) | | $ | 983 | | | $ | 997 | | | | (1 | )% |
| Cash Operating Costs (U.S.$/oz)(1) | | $ | 954 | | | $ | 998 | | | | (4 | )% |
Seabee Mine
During 2013, the Seabee Mine produced 26,132 ounces of gold (2012 – 32,626 ounces). This decrease was attributable to a four percent decrease in tonnes milled and a 16 percent decrease in grade.
| Table 4: Seabee Mine Annual Production Statistics |
| December 31 | | 2013 | | | 2012 | | | Change | |
| | | | | | | | | | |
| Tonnes Milled | | | 140,550 | | | | 147,051 | | | | (4 | )% |
| Tonnes per Day | | | 385 | | | | 402 | | | | (4 | )% |
| Head Grade (grams per tonne) | | | 6.07 | | | | 7.21 | | | | (16 | )% |
| Gold Produced (ounces) | | | 26,132 | | | | 32,626 | | | | (20 | )% |
Santoy Mine Complex
During 2013, the Santoy Mine Complex produced 17,718 ounces of gold (2012 – 16,944 ounces). Year over year, this result is attributable to a nine percent increase in tonnes offset by a four percent decrease in grade.
| Table 5: Santoy Mine Complex Annual Production Statistics |
| December 31 | | 2013 | | | 2012 | | | Change | |
| | | | | | | | | | |
| Tonnes Milled | | | 139,504 | | | | 128,184 | | | | 9 | % |
| Tonnes per Day | | | 382 | | | | 350 | | | | 9 | % |
| Head Grade (grams per tonne) | | | 4.15 | | | | 4.31 | | | | (4 | )% |
| Gold Produced (ounces) | | | 17,718 | | | | 16,944 | | | | 5 | % |
Capital Projects
Shaft Extension
The Company’s shaft extension project at the Seabee Mine deepened the shaft from 550 metres to 980 metres. After a 25 day shutdown to commission the final stage of this project, the shaft extension was completed early in the first quarter of 2013. The shaft extension project was undertaken to provide more efficient transportation of ore and waste from underground to surface. Upon completion of this project, the Company has experienced increased reliability and efficiency gains including reduced trucking distance, lower diesel consumption, decreased labour and equipment usage, and improved ventilation associated with the shaft extension.
2013 Annual Management’s Discussion and Analysis
(in thousands of CDN dollars, except as otherwise noted) |
Page 11 |
Tailings Facility
The company continues with annual upgrades to its tailings facilities to ensure adequate storage capacity and treatment of Mill effluent. In 2013, work continued on upgrades to the dykes and dams on the Triangle lake tailings facility. When completed in 2014, this facility will be permitted up to 460 metre elevation which will support a minimum of four years of operations. As well in 2013, upgrades were completed to the East Lake tailings facility including the application and construction of a test dyke on top of the existing tailings. The test dyke was constructed and settlement monitored to provide better data to support stability calculations for the full dyke. Completion of the permitting process and construction of the full dyke (stage one) will be complete in 2014 which will allow for the deposition of tailings into the facility. Following this annual upgrades to the dyke will be completed which will provide, approximately, four years of additional operations.
Santoy Water Treatment Plant
With the Seabee Gold Operation’s Life of Mine Plan bringing Santoy Gap into production, the Company commissioned the design of a specialized water treatment plant and completed upgrades to its tailings facilities during 2013. The Santoy Water Treatment plant is designed to remove ammonia from mine water to minimize the impact on the environment. Construction was completed during the fourth quarter of 2013 and was on plan and under budget.
Santoy Gap
The Company has completed the ramp from Santoy 8 to the Santoy Gap deposit as well as two drill chambers for infill and definition drilling. In addition, the first cross cut into the ore body for mining purposes has been completed. Finally, work on a 300 metre ventilation raise has commenced, of which approximately 100 metres has been completed.
In 2014, the Company expects to see development ore from Santoy Gap and production ore during the second half of 2014 following the completion of the ventilation raise and further development. Based on its high-grade nature and size, the Santoy Gap deposit demonstrates the potential that exists to grow production at the Seabee Gold Operation and is a key component of the Company’s capital projects during 2014.
Financial Results of Operations
Highlights
| Table 6: Highlights of Financial Results of Operations |
| December 31 | | 2013 | | | 2012 | | | 2011 | | | Change
from 2012
to 2013 | |
| | | | | | | | | | | | | |
| Revenue | | $ | 63,794 | | | $ | 80,808 | | | $ | 69,659 | | | | (21 | )% |
| Divided by ounces sold | | | 44,823 | | | | 48,672 | | | | 44,632 | | | | (8 | )% |
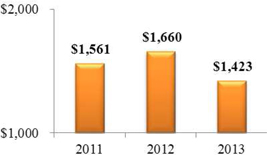
| Average Realized Price per Ounce (CDN$) | | $ | 1,423 | | | $ | 1,660 | | | $ | 1,561 | | | | (14 | )% |
| | | | | | | | | | | | | | | | | |
| Production costs | | $ | 44,051 | | | $ | 48,535 | | | $ | 40,542 | | | | (9 | )% |
| Divided by ounces sold | | | 44,823 | | | | 48,672 | | | | 44,632 | | | | (8 | )% |
| Total cash costs per ounce (CDN$) | | $ | 983 | | | $ | 997 | | | $ | 908 | | | | (2 | )% |
| | | | | | | | | | | | | | | | | |
| Net Cash Margin per Ounce Sold (CDN$) | | $ | 440 | | | $ | 663 | | | $ | 653 | | | | (33 | )% |
| | | | | | | | | | | | | | | | | |
| Depreciation and depletion | | $ | 22,949 | | | $ | 15,681 | | | $ | 11,407 | | | | | |
| Gross (loss) profit | | $ | (3,206 | ) | | $ | 16,592 | | | $ | 17,710 | | | | | |
| Net (loss) profit * | | $ | (73,423 | ) | | $ | 5,569 | | | $ | 9,454 | | | | | |
| (Loss) earnings per share (basic and diluted) * | | $ | (0.42 | ) | | $ | 0.03 | | | $ | 0.06 | | | | | |
*2013 results reflect: impairment charges of $22.2 million on the Company’s Seabee Gold Operation; and impairment charges of $41.6 million on the Company’s Madsen Property.
2013 Annual Management’s Discussion and Analysis
(in thousands of CDN dollars, except as otherwise noted) |
Page 12 |
During 2013, the decrease in ounces sold and in average realized price per ounce, partially offset by decreased production costs, has negatively impacted net cash margin per ounce sold period over period. The Company continued various initiatives intended to improve profitability at the Seabee Gold Operation through a combination of cost controls and expediting the developing of production profiles at lower cost satellite ore bodies, including Santoy 8 and eventually the Santoy Gap deposit. Also, the Company anticipates that the continued contribution of the Santoy Mine Complex (includes the Santoy 8 and Santoy Gap deposits), contribution of ore from the L62 Zone and completion of the shaft extension will be positive catalysts in lowering overall unit operating costs at the Seabee Gold Operation during 2014 and beyond.
 | |  |
| | | |
| Figure 1: Average Gold Price Realized (CDN$) Per Ounce Sold | | Figure 2: Cash Cost and Margin Realized (CDN$)Per Ounce Sold |
Net Profit (Loss)
For the year ended December 31, 2013, the Company recorded a net loss of $73.4 million, or $0.42 per share, after $63.8 million of impairment charges which were offset by a $1.4 million deferred income tax recovery. This compares to net profit of $5.6 million, or $0.03 per share, after a deferred tax expense of $3.0 million for the year ended December 31, 2012 (2011 – net profit of $9.5 million, or $0.06 per share, after a $0.4 million deferred income tax expense). Loss from operations before income tax in 2013 was $74.8 million, or $0.43 per share (2012 – Profit of $8.5 million, or $0.05 per share; 2011 – Profit of $9.8 million, or $0.06 per share), reflecting impairment charges incurred during 2013 and a change in the Company’s deferred tax base year over year.
Three-year trend
The Company’s profit trends with changes in revenue, which has been significantly impacted by the price of gold. Management is focused on continuing to pursue best practices intended to stabilize unit production costs and has engaged external consultants to provide additional feedback and recommendations on improving operational efficiencies.
Revenue
Gold revenue from the Company’s Seabee Gold Operation for the year ended December 31, 2013 decreased 21 percent to $63.8 million from $80.8 million reported for the year ended December 31, 2012 (December 31, 2011 - $69.7 million).
Three-year trend
The decrease in gold revenue in 2013 was attributable to a 14 percent decrease in Canadian dollar gold prices realized (2013 - $1,423 (U.S. $1,382); 2012 - $1,660 (U.S. $1,661); and 2011 - $1,561 (U.S. $1,578)) and by decreased gold sales volume (2013 – 44,823 ounces; 2012 – 48,672 ounces; and 2011 – 44,632 ounces). The decrease in realized price for the year ended December 31, 2013 reflects the decrease in market gold prices which averaged U.S. $1,411 per ounce during 2013 compared to market gold prices of U.S. $1,669 per ounce during 2012 (2011 – U.S. $1,572).
2013 Annual Management’s Discussion and Analysis
(in thousands of CDN dollars, except as otherwise noted) |
Page 13 |
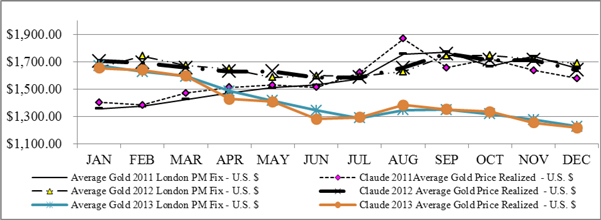
Figure 3: Average Gold Price (London PM Fix – US$)
Production Costs
For the year ended December 31, 2013, mine production costs of $44.1 million (2012 - $48.5 million) were nine percent lower year over year. This decrease is attributable to efficiencies associated with the shaft extension, improved planning and procurement practices, increased productivities and reduced labour costs. Total cash cost per ounce of gold(1) for 2013 decreased one percent to CDN $983 (U.S. $954) per ounce from CDN $997 (U.S. $998) in 2012, a result of a nine percent decrease in production costs offset by an eight percent decrease in ounces sold. The Company is continuing to pursue initiatives intended to lower these costs during 2014 and beyond.
Depreciation and Depletion
For 2013, depreciation and depletion was $22.9 million (2012 - $15.7 million), up 46 percent year over year. These results are attributable to an increase in the Seabee Gold Operation’s asset base and a decrease in the Seabee Gold Operations reserves.
General and Administrative Expense
General and administrative expense for the year ended December 31, 2013 decreased to $7.1 million, down 11 percent from the $7.9 million reported in 2012 and attributable to a reduction in direct administration costs.
| Table 7: Corporate General and Administrative Expense |
| December 31 | | 2013 | | | 2012 | | | Change | |
| | | | | | | | | | |
| Direct administration | | $ | 4,715 | | | $ | 5,464 | | | | (14 | )% |
| Stock-based compensation | | | 2,274 | | | | 2,280 | | | | - | % |
| Deferred share units | | | 68 | | | | 153 | | | | (56 | )% |
| Total General and Administrative | | $ | 7,057 | | | $ | 7,897 | | | | (11 | )% |
Finance Expense
Finance expense includes interest expense, accretion expense and derivative losses (if any). For the year ended December 31, 2013, Finance expense was $3.2 million (2012 - $1.5 million). The increase is attributable to increased interest expense associated with the Company’s $25.0 million debt facility (which closed at the beginning of the second quarter of 2013) and the Company’s $5.0 million revolving loan facility (which was retired in the first quarter of 2014).
2013 Annual Management’s Discussion and Analysis
(in thousands of CDN dollars, except as otherwise noted) |
Page 14 |
Finance and Other Income
Finance and other income consists of interest income, production royalties pursuant to the Red Mile transactions, derivative gains (if any) and other miscellaneous income. For the year ended December 31, 2013, Finance and other income was $2.7 million (2012 - $1.5 million). This result is attributable to a $1.2 million mark-to-market derivative gain as well as consistent interest and miscellaneous revenue, year over year.
Impairment Charges
The Company’s accounting policy requires assessment whether any indication of impairment exists at each of its mineral properties at the end of each reporting period. During 2013, the Company had Impairment charges of $63.8 million (2012 - nil).
During 2013, it was determined that there were indicators of impairment and an estimate of the recoverable amount of the Company’s mineral properties was completed. This assessment was done at the Cash Generating Unit (“CGU”) level, which is the lowest level for which identifiable cash flows are largely independent of the cash flows of other assets. Fair value less cost to sell (“FVLCS”) of the Company’s CGU was determined by calculating the net present value of the future cash flows expected to be generated by the CGU. Determining the recoverable amount required the use of estimates and assumptions such as long-term commodity prices, discount rates, future capital requirements, exploration potential and operating performance. The estimates of future cash flows were derived from the Company’s most recent Life of Mine Plan (“LOMP”) utilizing an average estimated long-term gold price CDN $1,435 per ounce to estimate future revenues. The future cash flows of the Company’s CGU were discounted using a real weighted average cost of capital (“WACC”) 7.75 percent after taking into account the location, market risk and various other factors deemed applicable to the project. Based on the Company’s estimate of FVLCS, impairment losses totalling $22.2 million were recognized during 2013 because the carrying amount of the Company’s CGU exceeded its recoverable amount; as such, the Company’s Mineral properties balance was reduced by the amount of the impairment with a corresponding charge recognized in profit (loss).
During 2013, as part of its strategy to minimize corporate expenditures and to focus on the Seabee Gold Operation, Claude adopted a plan to sell its Madsen Property. Under IFRS, non-current assets, that are expected to be recovered primarily through sale rather than through continuing use, are classified as held for sale. Immediately before classification as held for sale, Madsen was re-measured at the lower of its carrying amount and its FVLCS. Total impairment charges on the Madsen Property during 2013 were $41.6 million (2012 – nil).
Deferred Income Tax (Recovery) Expense
For 2013, the Company had a deferred income tax recovery of $1.4 million (2012 - deferred income tax expense of $3.0 million). The variance noted is attributable to an increase in the loss before taxes primarily due to the impairment charges on the Seabee Gold Operation and Madsen Project.
Liquidity, Financial Resources and Capital Structure
The Company monitors its spending plans, repayment obligations and cash resources on a continuous basis with the objective of ensuring that there is sufficient capital within the Company to meet business requirements, after taking into account cash flows from operations and the Company’s holdings of cash and cash equivalents and short-term investments. The Company’s typical cash requirement over the first and second quarters of each year is significant because of the Seabee Gold Operation’s winter ice road resupply, which includes restocking diesel, propane and other large consumables as well as the continued investment in maintenance and growth capital relating to the mining fleet and mine infrastructure.
The Company’s objective when managing capital is to safeguard its ability to continue as a going concern so that it can continue to provide adequate returns to shareholders and benefits to other stakeholders. The Company manages the capital structure and makes adjustments to it in light of changes in economic conditions and the risk characteristics of the underlying assets. In order to maintain or adjust the capital structure, the Company may issue new shares, sell assets or incur debt. The Company is not subject to externally imposed capital requirements.
2013 Annual Management’s Discussion and Analysis
(in thousands of CDN dollars, except as otherwise noted) |
Page 15 |
The Company’s capital structure is comprised of a combination of short-term and long-term debt and shareholders’ equity.
The Capital structure of the Company is as follows:
| Table 8: Schedule of Capital Structure of the Company |
| December 31 | | 2013 | | | 2012 | |
| | | Interest | | | Maturity | | | | | | |
| Demand loans | | | P + 1.50% | | | Jan-Apr/2015 | | $ | 2,950 | | | $ | 5,337 | |
| Revolving loan | | | P + 1.75% | | | May 2014 | | | 5,000 | | | | - | |
| Finance lease liabilities | | | 5.40%-5.50% | | | Jan-Mar/2014 | | | 291 | | | | 1,495 | |
| Term loan* | | | 10.00 | % | | April/2018 | | | 23,628 | | | | - | |
| Debenture * | | | 12.00 | % | | May/2013 | | | - | | | | 9,665 | |
| Total debt * | | | | | | | | $ | 31,869 | | | $ | 16,497 | |
| | | | | | | | | | | | | | | |
| Shareholders’ equity | | | | | | | | | 122,596 | | | | 192,364 | |
| | | | | | | | | | | | | | | |
| Debt * to equity | | | | | | | | | 26.0 | % | | | 8.6 | % |
*For accounting purposes, closing costs associated with the Company’s Term loan and debenture are netted against the principal balance owing, thereby reducing the carrying value of the Company’s debt on the Statement of Financial Position. Amounts presented in the above table are the amortized cost of balances owing. At December 31, 2013, the principal balance owing on the Company’s Term loan was $25.0 million and at December 31, 2012, the principal balance owing on the Company’s Debenture was $9.8 million. A reconciliation between the principal balance owing and the amortized cost (carrying amount) presented on the Company’s Statement of Financial Position is included in the “Other Measures and Reconciliations” section of this MD&A.
Cash, cash equivalents and cash flow
The Company had bank indebtedness of $8.6 million at December 31, 2013 (December 31, 2012 - bank indebtedness of $3.5 million). Short-term investments at December 31, 2013 were $1.6 million (December 31, 2012 – nil).
Operating Activities
Operating cash flow is the Company’s primary source of liquidity. As required, the Company may enhance its liquidity and supplement operating cash flow through a combination of equity issuances, securing debt financing and sale of non-core assets. The principal use of operating cash flow is to fund the Company’s: operating and capital expenditures at the Seabee Gold Operation; General and Administrative costs; and principal and interest payments.
During 2013, the Company generated $13.6 million in operating cash flows, a $6.9 million decrease from 2012; this decrease reflects lower net profit. The most significant driver of the change in operating cash flow year over year is the lower gold sales year over year and the significant decrease in the market price of gold. Whether favorable or unfavorable, future changes in the price of gold will continue to have a material impact on the cash flow and liquidity of the Company.
For the year ended December 31, 2013, the Company’s cash flow from operations before net changes in non-cash operating working capital(2) was $13.8 million, or $0.08 per share (2012 - $25.8 million, or $0.15 per share).
2013 Annual Management’s Discussion and Analysis
(in thousands of CDN dollars, except as otherwise noted) |
Page 16 |
At December 31, 2013, the Company had a working capital deficiency of $11.9 million (December 31, 2012 – working capital deficiency of $4.1 million); of that amount, $11.1 million (net) relates to the Company’s Madsen Property, which was classified as held for sale due to Management’s adoption of a plan to sell this non-core asset. Also included in the working capital calculation at December 31, 2013 are demand loans totaling $3.0 million (which have been classified as current liabilities due to their demand feature) and a revolving loan totaling $5.0 million. In addition, the Company was not in compliance with certain financial covenant requirements of the Term Loan (see Financial Statement Note 14(c)); as such, the amortized cost of that facility has been re-classified to current liabilities. Subsequent to December 31, 2013, the Company obtained a waiver from CCP and entered into a Term Loan Amending agreement (“Amending Agreement”) for the financial covenant requirements of the Term Loan (see Financial Statement Note 24(b)).
The decrease in working capital is attributable to an increase in current liabilities (attributable to the accounting presentation of the Company’s Term Loan) offset by an increase in current assets.
| Table 9: Working Capital and Current Ratio |
| December 31 | | 2013 | | | 2012 | | | Change | |
| | | | | | | | | | |
| Current assets | | | | | | | | | | | | |
| Short-term investments | | $ | 1,643 | | | $ | - | | | | - | |
| Accounts receivable | | | 2,873 | | | | 4,845 | | | | (41 | )% |
| Inventories | | | | | | | | | | | | |
| Gold in-circuit | | | 2,522 | | | | 3,616 | | | | (30 | )% |
| Stockpiled ore | | | 1,838 | | | | 1,191 | | | | 54 | % |
| Materials and supplies | | | 16,205 | | | | 14,371 | | | | 13 | % |
| Assets held for sale | | | 13,423 | | | | - | | | | - | |
| Other current assets | | | 390 | | | | 277 | | | | 41 | % |
| Total Current assets | | $ | 38,894 | | | $ | 24,300 | | | | | |
| | | | | | | | | | | | | |
| Current liabilities | | | | | | | | | | | | |
| Bank indebtedness | | $ | 8,623 | | | $ | 3,531 | | | | 144 | % |
| Accounts payable and accrued liabilities | | | 6,997 | | | | 7,533 | | | | (7 | )% |
| Loans and borrowings | | | | | | | | | | | | |
| Demand loans | | | 2,950 | | | | 5,337 | | | | (45 | )% |
| Current portion of finance lease liabilities | | | 291 | | | | 1,495 | | | | (81 | )% |
| Current portion of term loan * | | | 23,628 | | | | - | | | | - | |
| Revolving loan | | | 5,000 | | | | - | | | | | |
| Debenture ** | | | - | | | | 9,665 | | | | (100 | )% |
| Liabilities related to assets held for sale | | | 2,316 | | | | - | | | | - | |
| Other current liabilities | | | 1,001 | | | | 836 | | | | 20 | % |
| Current liabilities | | $ | 50,806 | | | $ | 28,397 | | | | | |
| | | | | | | | | | | | | |
| Working capital (deficiency) | | $ | (11,912 | ) | | $ | (4,097 | ) | | | 191 | % |
| Current ratio | | | 0.77 | | | | 0.86 | | | | (10 | )% |
* Amortized cost; principal outstanding on Term Loan is $25.0 million.
** Amortized cost. Principal outstanding on Debenture at December 31, 2012 was $9.8 million.
Investing Activities
Cash used in investing activities amounted to $33.4 million for the year ended December 31, 2013. Mineral property expenditures during 2013 were $31.9 million, a $30.6 million decrease year over year. During 2013, expenditures were comprised of Seabee Mine and shaft development of $23.0 million, exploration costs (focusing primarily on the Santoy Gap deposit, with minimal expenditures on the Seabee Regional and Amisk projects) of $1.3 million and property, plant and equipment additions of $7.6 million. Property, plant and equipment additions include mining equipment, camp infrastructure and tailings management facility expansion. The Company utilized its cash flow from operations and debt to fund these additions.
2013 Annual Management’s Discussion and Analysis
(in thousands of CDN dollars, except as otherwise noted) |
Page 17 |
Financing Activities
The Company’s financing activities during 2013 included proceeds of $0.7 million received from the issuance of common shares pursuant to the Company’s Employee Share Purchase Program, proceeds received from a five year $25.0 million term loan and proceeds received from a $5.0 million revolving loan. These were offset by the repayment of the $9.8 million debenture and $3.9 million of demand loans and capital leases repayments, resulting in a net financing cash inflow of $16.4 million. This compares to a net financing cash inflow of $2.7 million during 2012, which consisted of $0.4 million in funding received from the Company’s Employees Share Purchase Plan (“ESPP”) and demand loan proceeds of $7.2 million, offset by demand loan and capital lease repayments totaling $4.9 million.
During 2013, a total of 2,065,812 common shares (2012 – 338,676) were issued pursuant to the Company’s ESPP; distribution of these shares pursuant to the ESPP occurs during the first quarter of the year. Subsequent to December 31, 2013, the Company issued 7,799,148 shares pursuant to 2013 participation in the plan. No common shares were issued pursuant to the Company’s Stock Option Plan during 2013 (2012 – 75,402).
In January 2013, the Company expanded its current debt facilities with its bank and early in the second quarter of 2013 the Company executed an agreement with Crown Capital Partners Inc. (“CCP”) for a long-term debt facility of $25.0 million. The new debt facilities enabled the successful retirement of the Company’s outstanding debentures (which matured in May 2013) and enabled the Company to maintain operations during the lower gold price environment experienced during 2013. During 2013, the Company was only required to make interest payments on the $25.0 million facility. At December 31, 2013, the Company was not in compliance with certain financial covenant requirements relating to its Term Loan (see Financial Statement Note 14(c)); as such, the amortized cost of the Term Loan was been re-classified to current liabilities. Subsequent to December 31, 2013, the Company obtained a waiver from its lender and entered into an Amendment Agreement for the financial covenant requirements of the Term Loan (see Financial Statement Note 25(b)). There were no changes to principal repayment or interest terms as a result of this Amendment Agreement; the maturity date remains 60 months from closing and interest on the Term Loan remains fixed at 10 percent, compounds monthly and is payable monthly. During 2014, in addition to interest payments, monthly principal payments of $0.3 million will begin in May 2014.
| Table 10: Terms of CCP Term Loan Agreement |
| Period | | Monthly Amount | | | Annual Amount | |
| Months 1 – 12 | | | NIL | | | | NIL | |
| Months 13 – 59 | | $ | 300,000 | | | $ | 3,600,000 | |
| Due at Maturity (April 2018) | | | | | | $ | 10,900,000 | |
The Term loan remains subordinate to all of the Company’s other short-term and long-term loans and borrowings. Upon mutual agreement with CCP, prepayment fees pursuant to the original agreement have been waived. In addition, the 5,750,000 common share purchase warrants pursuant to the original agreement have been cancelled for consideration of $1.0 million; consideration was paid with 4,545,454 common shares of Claude.
Demand loans and Obligations under finance lease
During 2013, the Company repaid $2.4 million of its demand loans and $1.5 million of its capital leases outstanding. The proceeds and repayments of demand loans and capital leases relate to production equipment at the Seabee Gold Operation.
Financial and Other Instruments
In the normal course of its operations, the Company is exposed to gold price, foreign exchange, interest rate, liquidity, equity price and counterparty risks. The overall financial risk management program focuses on preservation of capital and protecting current and future Company assets and cash flows by reducing exposure to risks posed by the uncertainties and volatilities of financial markets.
2013 Annual Management’s Discussion and Analysis
(in thousands of CDN dollars, except as otherwise noted) |
Page 18 |
The Company may use derivative financial instruments to hedge some of its exposure to fluctuations in gold prices and foreign exchange rates. The Company does not acquire, hold or issue derivatives for trading purposes. The Company’s management of financial risks is aimed at ensuring that net cash flows are sufficient to meet all its financial commitments as and when they fall due and to maintain the capacity to fund its forecast project development and exploration strategies.
The value of the Company’s mineral resources is related to the price of gold and the outlook for this mineral. Gold and precious metal prices historically have fluctuated widely and are affected by numerous factors outside of the Company’s control, including, but not limited to, industrial and retail demand, central bank lending, forward sales by producers and speculators, levels of worldwide production, short-term changes in supply and demand because of speculative hedging activities and certain other factors related specifically to gold. The profitability of the Company’s operations is highly correlated to the market price of gold. If the gold price declines below the cost of production at the Company’s operations, for a prolonged period of time, it may not be economically feasible to continue production.
The Company’s revenues from the production and sale of gold are denominated in U.S. dollars. However, the Company’s operating expenses are primarily incurred in Canadian dollars and its liabilities are primarily denominated in Canadian dollars. The results of the Company’s operations are subject to currency risks. The operating results and financial position of the Company are reported in Canadian dollars in the Company’s consolidated financial statements.
To mitigate the effects of price fluctuations in revenue, the Company may enter into derivative instrument transactions, from time to time, in respect of the price of gold and foreign exchange rates. Such transactions can expose the Company to credit, liquidity and interest rate risk. The Company did not have any derivative instruments outstanding at December 31, 2013 or December 31, 2012. The Company’s main interest rate risk arises from interest earning cash deposits that expose the Company to interest rate risk.
The Company’s liquidity position is managed to ensure sufficient liquid funds are available to meet its financial obligations in a timely manner. The Company manages liquidity risk by continuously monitoring forecast and actual cash flows and ensuring that the Company has the ability to access required funding.
The Company is exposed to equity securities market price risk, arising from investments classified on the balance sheet as available-for-sale. Investments in equity securities are approved by the Board on a case-by-case basis. All of the Company’s available-for-sale equity investments are in junior resource companies listed on the TSX Venture Exchange.
The Company is exposed to counterparty risk which is the risk that a counterparty will not complete its obligations under a financial instrument resulting in a financial loss for the Company. The Company does not generally obtain collateral or other security to support financial instruments subject to credit risk; however, the Company only deals with credit worthy counterparties. Accounts receivable comprise institutions purchasing gold under normal settlement terms of two working days. Counterparty risk under derivative financial instruments is to reputable institutions. All significant cash balances are on deposit with high-rated banking institutions. The carrying amount of financial assets recorded in the financial statements represents the Company’s maximum exposure to credit risk without taking account of the value of any collateral or other security obtained.
2013 Annual Management’s Discussion and Analysis
(in thousands of CDN dollars, except as otherwise noted) |
Page 19 |
Contractual Obligations
The Company’s contractual and other obligations as at December 31, 2013 are summarized as follows:
| Table 11: Schedule of Payments / Commitments due by Period |
| | | Total | | | Less than
1 year | | | 2-3
Years | | | 4-5
Years | | | More than
5 years | |
| Contractual Obligation | | | | | | | | | | | | | | | | | | | | |
| | | | | | | | | | | | | | | | | | | | | |
| Demand loans | | | 2,950 | | | | 2,497 | | | | 453 | | | | - | | | | - | |
| Interest on demand loans | | | 85 | | | | 82 | | | | 3 | | | | - | | | | - | |
| Revolving loan | | | 5,000 | | | | 5,000 | | | | - | | | | - | | | | - | |
| Interest on revolving loan | | | 40 | | | | 40 | | | | - | | | | - | | | | - | |
| Capital lease obligations | | | 291 | | | | 291 | | | | - | | | | - | | | | - | |
| Interest on capital leases | | | 2 | | | | 2 | | | | - | | | | - | | | | - | |
| Office lease | | | 74 | | | | 74 | | | | - | | | | - | | | | - | |
| Term loan | | | 25,000 | | | | 2,400 | | | | 7,200 | | | | 15,400 | | | | - | |
| Interest on term loan | | | 8,023 | | | | 2,430 | | | | 3,830 | | | | 1,763 | | | | - | |
| | | | 41,465 | | | | 12,816 | | | | 11,486 | | | | 17,163 | | | | - | |
During 2013 (and subsequent to December 31, 2013), the Company continued updating its decommissioning and reclamation plans. As filed with the Government of Saskatchewan’s Ministry of Environment, the Company estimated in its 2013 Mine Closure Plan the closure costs at the cessation of mining at its Seabee Mine at $6.1million. Actual costs of completing the reclamation of the mine site may be higher than those estimated. The Company has issued letters of credit in favor of the Ministry of Environment in the amount of $1.6 million in support of its obligations. The letters of credit are secured by investment certificates. The Company has received approval to incrementally fund its remaining closure cost obligations over the next five years as follows: 2014 - $0.5 million; 2015 - $0.5 million; 2016 - $1.0 million; 2017 - $1.0 million; and 2018 - $1.5 million.
Statements of Financial Position
Highlights
| Table 12: Summary Statements of Financial Position Data |
| | | | | | | | | | | | Change from | |
| December 31 | | 2013* | | | 2012 | | | 2011 | | | 2012 to 2013 | |
| | | | | | | | | | | | | |
| Total assets | | $ | 181,675 | | | $ | 234,517 | | | $ | 207,887 | | | | (23 | )% |
| Non-current liabilities | | $ | 8,273 | | | $ | 13,756 | | | $ | 25,386 | | | | (40 | )% |
*Total assets at December 31, 2013 reflect: $22.2 million of impairment charges on the Company’s Seabee Gold Operation and $41.6 million of impairment charges on the Company’s Madsen Property.
Assets
The Company’s total assets were $181.7 million at December 31, 2013, compared to $234.5 million at December 31, 2012; Claude’s asset base primarily consists of non-current assets comprising mineral properties, reflecting the capital intensive nature of the exploration and mining business and the impact of the significant capital expenditures relating to its operations and exploration projects. The $52.8 million net decrease resulted from increases of: $1.6 million in Short-term investments; $1.4 million in Inventories; and a $13.4 million in Assets held for sale (relating to the classification of the Madsen Property as held for sale). These increases were offset by decreases of: $2.0 million in Accounts receivable, attributable to the timing of gold sales and receipt of funds; $67.1 million in Mineral properties, attributable to the reclassification of the Company’s Madsen assets to Assets held for sale and impairment charges; and $0.4 million to Investments.
2013 Annual Management’s Discussion and Analysis
(in thousands of CDN dollars, except as otherwise noted) |
Page 20 |
Liabilities
Total Current and Non-current liabilities were $59.1 million at December 31, 2013, up $16.9 million from December 31, 2012. This result was attributable to a $5.1 million increase in bank indebtedness; an increase of $2.4 million in Liabilities related to assets held for sale, attributable to the Madsen Property being classified as held for sale; a net increase of $24.7 million in the Company’s current and non-current Loans and borrowings attributable to certain debt obtained to fund the Company’s second quarter debenture redemption and expansion capital at the Seabee Gold Operation. These increases were offset by a decrease of $0.5 million in Accounts payable and accrued liabilities, attributable to the timing and payment of expenditures relating to consumables (associated with the annual winter road resupply) at the Seabee Gold Operation; $1.1 million in the Company’s Deferred income tax liability; a net decrease of $1.2 million in the Company's current and long-term Net royalty obligation; a decrease of $2.7 million in the Company’s decommissioning and reclamation accrual, attributable to amounts reclassified to Liabilities related to assets held for sale; and the retirement of the Company’s debenture during the second quarter for $9.8 million.
Shareholders’ Equity
Shareholders’ equity decreased by $69.8 million to $122.6 million at December 31, 2013, from $192.4 million at December 31, 2012. This variance is attributable to an increase in Share capital of $2.1 million due to the issuance of common shares pursuant to the Company’s ESPP; an increase of $1.6 million to Contributed surplus; and a $73.4 million increase to Accumulated deficit, a result of the net loss (inclusive of $22.2 and $41.6 million of impairment charges on the Seabee Gold Operation and Madsen property, respectively, offset by $1.4 million of deferred income tax recoveries) for 2013.
Comprehensive income consists of net profit (loss), together with certain other economic gains and losses that are collectively referred to as “other comprehensive income (loss)” or “OCI” and are excluded from the Income Statement.
Key Sensitivities
Earnings from Claude’s gold operation are sensitive to fluctuations in both commodity and currency prices. The key factors and their approximate effect on earnings, earnings per share and cash flow, based on assumptions comparable to 2013 actuals, are as follows:
Gold
For a U.S. $10 movement in gold price per ounce, earnings and cash flow will have a corresponding movement of CDN $0.5 million, or $0.00 per share. For a $0.01 movement in the US$/CDN$ exchange rate, earnings and cash flow will have a corresponding movement of $0.7 million, or $0.00 per share.
Grade
For a 0.25 gram per tonne movement in grade, earnings and cash flow will have a corresponding movement of CDN $3.1 million, or $0.02 per share.
Selected Quarterly Production and Financial Data
For the quarter ended December 31, 2013, the Company recorded a net loss of $27.1 million, or $0.15 per share, compared to a net profit of $2.4 million, or $0.01 per share, for the comparable period in 2012.
Gold revenue generated during the fourth quarter was $17.5 million, a 17 percent decrease over the $21.2 million reported for the same period in 2012. This was a result of increased gold sales volume compared to the fourth quarter of 2013 (Q4 2013 – 13,209 ounces; Q4 2012 – 12,732 ounces) offset by lower Canadian dollar gold prices realized Q4 2013 - $1,323 (U.S. $1,260); Q4 2012 - $1,668 (U.S. $1,683).
2013 Annual Management’s Discussion and Analysis
(in thousands of CDN dollars, except as otherwise noted) |
Page 21 |
For the three months ended December 31, 2013, total mine operating costs were $12.5 million, up $2.0 million period over period. Canadian dollar cash operating cost per ounce was up 12 percent period over period (Q4 2013 – CDN $944 (U.S. $899); Q4 2012 – CDN $822 (U.S. $829)).
During the fourth quarter of 2013, depreciation, depletion and accretion of the Company’s gold assets of $7.2 million represented a 64 percent increase compared to the $4.4 million reported during the comparable period in 2012. These results are attributable to a larger asset base being depreciated period over period.
| Table 13: Selected Quarterly Production and Financial Data |
| | | Dec 31 | | | Sept 30 | | | June 30 | | | Mar 31 | | | Dec 31 | | | Sept 30 | | | June 30 | | | Mar 31 | |
| | | 2013 | | | 2013 | | | 2013 | | | 2013 | | | 2012 | | | 2012 | | | 2012 | | | 2012 | |
| | | | | | | | | | | | | | | | | | | | | | | | | |
| Tonnes milled | | | 74,458 | | | | 64,642 | | | | 79,077 | | | | 61,877 | | | | 69,698 | | | | 66,173 | | | | 72,808 | | | | 66,556 | |
| Grade processed (grams per tonne) | | | 5.61 | | | | 5.30 | | | | 5.13 | | | | 4.31 | | | | 5.94 | | | | 7.34 | | | | 5.45 | | | | 4.74 | |
| Gold Ounces | | | | | | | | | | | | | | | | | | | | | | | | | | | | | | | | |
| Produced | | | 12,800 | | | | 10,500 | | | | 12,400 | | | | 8,100 | | | | 12,700 | | | | 15,100 | | | | 12,200 | | | | 9,600 | |
| Sold | | | 13,200 | | | | 10,800 | | | | 11,500 | | | | 9,300 | | | | 12,700 | | | | 14,100 | | | | 12,300 | | | | 9,500 | |
| Gold sales ($ millions) | | | 17.5 | | | | 15.0 | | | | 16.1 | | | | 15.3 | | | | 21.2 | | | | 23.4 | | | | 20.1 | | | | 16.1 | |
| Net profit (loss) ($ millions)(a) | | | (27.1 | ) | | | (33.9 | ) | | | (9.9 | ) | | | (2.5 | ) | | | 2.4 | | | | 3.0 | | | | 0.7 | | | | (0.5 | ) |
| Net profit (loss) per share(a) | | | (0.15 | ) | | | (0.19 | ) | | | (0.06 | ) | | | (0.01 | ) | | | 0.01 | | | | 0.02 | | | | 0.00 | | | | (0.00 | ) |
| Average realized gold price (CDN$ per ounce) | | | 1,323 | | | | 1,389 | | | | 1,393 | | | | 1,643 | | | | 1,668 | | | | 1,663 | | | | 1,633 | | | | 1,681 | |
| Average realized gold price (US$ per ounce) | | | 1,260 | | | | 1,338 | | | | 1,361 | | | | 1,629 | | | | 1,683 | | | | 1,671 | | | | 1,616 | | | | 1,679 | |
| Cash cost per ounce(b)(CDN$ per ounce) | | | 944 | | | | 919 | | | | 875 | | | | 1,245 | | | | 822 | | | | 920 | | | | 1,082 | | | | 1,236 | |
| Cash cost per ounce(b)(US$ per ounce) | | | 899 | | | | 885 | | | | 855 | | | | 1,235 | | | | 829 | | | | 924 | | | | 1,071 | | | | 1,234 | |
| Cash flow from operations before net changes in non-cash operating working capital ($ millions)(c) | | | 4.5 | | | | 4.3 | | | | 3.7 | | | | 1.4 | | | | 9.4 | | | | 8.6 | | | | 5.3 | | | | 2.6 | |
| Cash flow from operations per share | | | 0.03 | | | | 0.02 | | | | 0.02 | | | | 0.01 | | | | 0.05 | | | | 0.05 | | | | 0.03 | | | | 0.02 | |
| | | | | | | | | | | | | | | | | | | | | | | | | | | | | | | | | |
| Weighted average shares outstanding (basic) | | | 175,811 | | | | 175,811 | | | | 175,811 | | | | 174,801 | | | | 173,746 | | | | 173,746 | | | | 173,741 | | | | 170,481 | |
| | | | | | | | | | | | | | | | | | | | | | | | | | | | | | | | | |
| CDN$/US$ Exchange | | | 1.0498 | | | | 1.0383 | | | | 1.0235 | | | | 1.0086 | | | | 0.9914 | | | | 0.9949 | | | | 1.0101 | | | | 1.0012 | |
(a) Basic and diluted, calculated based on the number of shares issued and outstanding during the quarter. Q4 2013 reflects the impact of a $3.5 million impairment charge on the Seabee Gold Operation and a $4.3 million impairment charge on the Madsen Property. Q3 2013 reflects the impact of a $7.9 million impairment charge on the Seabee Gold Operation and a $37.3 million impairment charge on the Madsen Property. Q2 2013 results reflect the impact of a $10.8 million impairment charge on the Seabee Gold Operation.
(b)Denotes a non-IFRS measure. For an explanation and reconciliation of non-IFRS measures, refer to the “Non-IFRS Financial Measures” section of this MD&A.
(c)For an explanation of this performance measure, refer to the “Other Performance Measures” section of this MD&A.
The financial results for the last eight quarters reflect the following general trends: consistent average realized gold price notwithstanding Q2 2013 to Q4 2013; declining gold sales attributable lower realized gold price; and variable cash cost per ounce.
Accounting Estimates
Certain of the Company’s accounting policies require that Management make decisions with respect to the formulation of estimates and assumptions that affect the reported amounts of assets, liabilities, revenues and expenses. Claude’s significant accounting policies are contained in Note 3 to the consolidated financial statements. The following is a discussion of the accounting estimates that are critical in determining the Company’s financial results.
2013 Annual Management’s Discussion and Analysis
(in thousands of CDN dollars, except as otherwise noted) |
Page 22 |
Reserves
Estimation of reserves involves the exercise of judgment. Forecasts are based on geological, geophysical, engineering and economic data, all of which are subject to many uncertainties and interpretations. The Company expects that, over time, reserve estimates may be revised upward or downward based on updated information. Such information may include revisions to geological data or assumptions, a change in economic data, and the results of drilling and exploration activities. Reserve estimates can have a significant impact on net earnings, as they are a key component in the calculation of depreciation and depletion. In addition, changes in reserve estimates, commodity prices and future operating and capital costs can have a significant impact on the impairment assessments of the applicable assets.
Valuation of Properties
Claude assesses the carrying values of its properties at the end of each reporting period, or more frequently if warranted by a change in circumstances, to determine whether any indication of impairment exists. If it is determined that carrying values of assets cannot be recovered, the unrecoverable amounts are written off against current earnings. Recoverability is dependent upon assumptions and judgments regarding future prices, costs of production, sustaining capital requirements and economically recoverable ore reserves. A change in assumptions may materially impact the potential impairment of these assets.
Decommissioning and Reclamation
Claude’s mining, exploration and development activities are subject to various levels of Federal and Provincial Law as well as environmental regulations, including requirements for closure and reclamation. Management’s judgment and estimates are used when estimating reclamation and closure costs. In some cases, these costs will be incurred many years from the date of estimate. Estimates may be revised as a result of changes in government regulations or assumptions.
New Accounting Pronouncements
The Company has adopted the following new standards, along with any consequential amendments, effective January 1, 2013. These changes were made in accordance with the applicable transitional provisions.
Consolidated Financial Statements
In May 2011, the IASB issued IFRS 10,Consolidated Financial Statements. This new standard defines the principle of control and establishes control as the basis for determining which entities are included in consolidated financial statements. The principle of control is based on three criteria: power over the investee; exposure to variable returns from involvement in the investee; and the ability of the investor to use its power to affect the amount of its returns. The standard requires control of an investee to be reassessed when the facts and circumstances indicate that there have been changes to one or more of the criteria for determining control. This new standard supersedes the requirements relating to consolidated financial statements in IAS 27,Consolidated and Separate Financial Statements (as amended in 2009) and SIC-12,Consolidation – Special Purpose Entities. The adoption of IFRS 10 did not result in any change in the consolidation status of any of the Company’s subsidiaries.
Joint Arrangements
IFRS 11,Joint Arrangements, was issued to replace IAS 31,Interests in Joint Ventures. Under IFRS 11, joint arrangements are classified as either joint operations or joint ventures. Parties to a joint operation retain the rights and obligations to individual assets and liabilities of the operation, while parties to a joint venture have rights to the net assets of the venture. Any arrangement which is not structured through a separate entity or is structured through a separate entity but such separation is ineffective such that the parties to the arrangement have rights to the assets and obligations for the liabilities will be classified as a joint operation. Joint operations shall be accounted for in a manner consistent with jointly controlled assets and operations whereby the Company’s contractual share of the arrangement’s assets, liabilities, revenues and expenses are included in the consolidated financial statements. Any arrangement structured through a separate vehicle that does effectively result in separation between the Company and the arrangement shall be classified as a joint venture and accounted for using the equity method of accounting. The adoption of this standard did not have an impact on the Company’s consolidated financial statements.
2013 Annual Management’s Discussion and Analysis
(in thousands of CDN dollars, except as otherwise noted) |
Page 23 |
Disclosure of Interests in Other Entities
In May 2011, the IASB issued IFRS 12,Disclosure of Interests in Other Entities. This new standard requires enhanced disclosures about an entity’s interest in subsidiaries, joint arrangements, associates and unconsolidated structured entities. IFRS 12 contains new disclosure requirements for interests the Company has in subsidiaries, joint arrangements, associates and unconsolidated structured entities. Required disclosures aim to provide readers of the financial statements with information to evaluate the nature of and risks associated with the Company’s interests in other entities and the effects of those interests on the Company’s financial statements. The adoption of IFRS 12 resulted in incremental disclosures in the Company’s annual consolidated financial statements.
Fair Value Measurement
In May 2011, the IASB published IFRS 13,Fair Value Measurement. IFRS 13 replaces fair value measurement guidance contained in individual IFRSs, providing a single source of fair value measurement guidance. The standard provides a framework for measuring fair value and establishes new disclosure requirements to enable readers to assess the methods and inputs used to develop fair value measurements and for recurring valuations that are subject to measurement uncertainty, the effect of those measurements on the financial statements. The Company has adopted IFRS 13 on a prospective basis and has added additional disclosures on fair value measurement in Note 22.
Presentation of Financial Statements
In June 2011, the IASB issued an amendment to IAS 1,Presentation of Items of OCI: Amendments to IAS 1 Presentation of Financial Statements. The amendments stipulate the presentation of net profit and OCI and also require the Company to group items within OCI based on whether the items may be subsequently reclassified to profit or loss. Amendments to IAS 1 are effective for annual periods beginning on or after July 1, 2012. As a result of the adoption of the amendments to this standard, the Company has modified the presentation of items in OCI in its statement of profit or loss and OCI, to present separately items that would be reclassified to profit or loss from those that would never be. Comparative information has been re-presented accordingly.
Investments in Associates and Joint Ventures
In May 2011, the IASB issued amendments to IAS 28,Investments in Associates and Joint Ventures. Amendments to IAS 28 provide additional guidance applicable to accounting for interests in joint ventures or associates when a portion of an interest is classified as held for sale or when the Company ceases to have joint control or significant influence over an associate or joint venture. When joint control or significant influence over an associate or joint venture ceases, the Company will no longer be required to re-measure the investment at that date. When a portion of an interest in a joint venture or associate is classified as held for sale, the portion not classified as held for sale shall be accounted for using the equity method of accounting until the sale is completed at which time the interest is reassessed for prospective accounting treatment. The adoption of the amendments to IAS 28 did not have a material impact on the Company’s consolidated financial statements.
Financial Instruments: Disclosures
In December 2011, the IASB publishedOffsetting Financial Assets and Financial Liabilitiesand issued new disclosure requirements in IFRS 7Financial Instruments: Disclosures. The amendments to IFRS 7 contain new disclosure requirements for financial assets and liabilities that are offset in the statement of financial position, or subject to master netting arrangements or similar arrangements. The effective date for the amendments to IFRS 7 is annual periods beginning on or after January 1, 2013. These amendments are to be applied retrospectively. The amendments to IFRS 7 did not have a material impact on the Company’s consolidated financial statements.
2013 Annual Management’s Discussion and Analysis
(in thousands of CDN dollars, except as otherwise noted) |
Page 24 |
Future Accounting Pronouncements
The standards and interpretations that are issued, but not yet effective, up to the date of issuance of the Company’s financial statements are disclosed below. These are the changes that the Company reasonably expects will have an impact on its disclosures, financial position or performance when applied at a future date. The Company intends to adopt these standards, if applicable, when they become effective.
Offsetting Financial Assets and Liabilities
In December 2011, the IASB publishedOffsetting Financial Assets and Financial Liabilitiesand issued new disclosure requirements in IFRS 7Financial Instruments: Disclosures. The amendments to IAS 32 clarify that an entity currently has a legally enforceable right to set-off if that right is not contingent on a future event, and enforceable both in the normal course of business and in the event of default, insolvency or bankruptcy of the entity and all counterparties. The amendments to IAS 32 also clarify when a settlement mechanism provides for net settlement or gross settlement that is equivalent to net settlement. The effective date for the amendments to IAS 32 is annual periods beginning on or after January 1, 2014. These amendments are to be applied retrospectively. The amendments to IAS 32 are not anticipated to have a material impact on the Company’s consolidated financial statements.
Financial Instruments
IFRS 9,Financial Instruments (“IFRS 9”), was issued by the IASB on November 12, 2009 and will replace IAS 39,Financial Instruments: Recognition and Measurement (“IAS 39”). IFRS 9 uses a single approach to determine whether a financial asset is measured at amortized cost or fair value, replacing the multiple rules in IAS 39. The approach in IFRS 9 is based on how an entity manages its financial instruments in the context of its business model and the contractual cash flow characteristics of the financial assets. The new standard also requires a single impairment method to be used, replacing the multiple impairment methods in IAS 39. IFRS 9 is effective for annual periods beginning on or after January 1, 2015. The Company is currently evaluating the impact of IFRS 9 on its financial statements.
IFRIC 21Levies
IFRIC 21,Levies (“IFRIC 21”), clarifies that an entity recognizes a liability for a levy when the activity that triggers payment, as identified by the relevant legislation, occurs. For a levy that is triggered upon reaching a minimum threshold, the Interpretation clarifies that no liability should be anticipated before the specified minimum threshold is reached. IFRIC 21 is effective for annual periods beginning on or after 1 January 2014, with early application permitted. The adoption of IFRIC 21 may have an impact on the Company’s accounting for production and similar taxes, which do not meet the definition of an income tax in IAS 12. The Company is still assessing and quantifying the effect.
Exploration Results
Claude elected to reduce its exploration spending during 2013 to $1.6 million, excluding Madsen dewatering charges, from the $2.7 million budgeted and the $14.2 million incurred in 2012. Further reductions will occur in 2014.
During 2013, the Company’s exploration department focused on:
| · | execution of the winter drill program at the Seabee Mine and the Santoy Mine Complex (which was completed in mid-April) was able to demonstrate significant resource and grade upside at the Santoy Mine Complex; |
2013 Annual Management’s Discussion and Analysis
(in thousands of CDN dollars, except as otherwise noted) |
Page 25 |
| · | continued development and compilation of near-mine targets at the Seabee Gold Operation during the 2013 summer exploration program; and |
| · | supporting the internal scoping analysis at Madsen. |
All exploration activities were carried out under the direction of Qualified Person, Brian Skanderbeg, P. Geo., Senior Vice President and Chief Operating Officer.
Seabee Gold Operation
The Seabee Gold Operation is located northeast of La Ronge, Saskatchewan and is host to the producing Seabee Mine and Santoy Mine Complex as well as the L62 Zone, Santoy Gap and regional exploration targets.
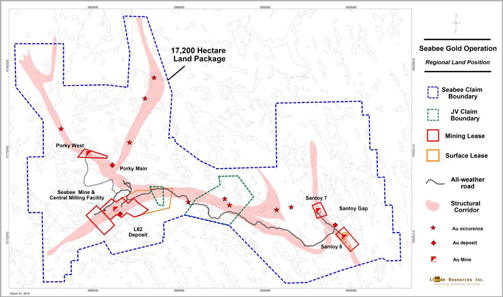
Figure 4: Seabee Property regional map showing significant gold deposits and occurrences.
Overview
At the Seabee Gold Operation, exploration expenditures during 2013 focused on targets proximal to infrastructure with the potential to materially impact near-term production, drive resource growth and to positively impact the Company’s Mineral Reserves and Mineral Resources. The 2013 program included significant semi-detailed mapping near Seabee, drilling of 4,300 metres, development, compilation and prospecting of a number of near-mine targets in the Seabee and Santoy regions. Through application of an updated structural model for Seabee and Santoy regions, the Company’s Exploration Department generated a number of targets for evaluation during 2013. A number of these targets were advanced through sampling, stripping and mapping with a goal of advancing towards a drill ready target for 2014. Results from the 2013 program continue to support the potential for further discovery within the northern strike extension or hanging wall of the Santoy system as well as in the Seabee footwall environment.
Exploration during 2014 will be very limited due to expenditure cutbacks, with a focus on targets directly proximal to the mine footprint.
Santoy Region
The Santoy Region includes the Santoy 8 and Santoy Gap deposits, which are part of the Santoy Mine Complex. During the first nine months of 2013, exploration focused on evaluating the down-plunge extension of the Santoy Gap and Santoy 8A deposits, expanding recently discovered parallel zones near the Santoy Region and on initial drill testing of several near-Seabee targets. During the remainder of 2013, exploration will focus on the development and advancement of a number of near-mine targets. Infill drilling at the Santoy Gap deposit will also be prioritized to convert additional ounces from the Inferred to Indicated category.
2013 Annual Management’s Discussion and Analysis
(in thousands of CDN dollars, except as otherwise noted) |
Page 26 |
Gold mineralization at the Santoy Region is hosted in siliceous, shear structures with sulfide-chlorite-quartz veins and in silicified granitoid sills. The mineralized lenses dip moderately to steeply eastward and are amenable to bulk mining techniques. Gold mineralization of the Santoy 8 ore lens occurs over a strike length of 600 metres, a depth of 500 metres and remains open along strike and down plunge to the north. The Santoy 8E ore lens has been intercepted over a strike length of 200 metres, depth of 250 metres and remains open along strike and down plunge to the north. The true thickness of the Santoy 8 deposits varies from 1.5 metres to 15 metres.
The Santoy Gap deposit is located 400 to 900 metres north of underground infrastructure, immediately on strike and adjacent to the Santoy 8 deposit within the Santoy Mine Complex. Infill and exploration drilling continues to confirm and expand the Santoy Gap system.
Historical drilling completed in and around the Santoy Gap and along the Santoy regional shear zone has extended the mineralized system, discovered a sub-parallel lens to the Santoy Gap approximately 150 metres to the east and affirmed the high prospectivity of the Santoy Regional Shear Zone, hosting multiple deposits over a three kilometre strike length. The Santoy Gap system remains open down plunge to the north, along strike to the south and at depth. These recent intercepts at depth may link with the existing Santoy 8 resource 300 metres to the south.
The 2013 surface drill program consisted of three step-out drill holes targeting the down-plunge extension of the Santoy Gap and Santoy 8 deposits. Of these, two drill holes returned high grade intercepts, interpreted to represent extensions of the mineralized system. Down-plunge drilling tested the extension of Santoy 8 and intercepted a vein system hosted in a thick package of highly altered shear zone.
Drilling at Santoy Gap has extended the mineralized system down-plunge to 650 metres depth and at Santoy 8 has extended the system 400 metres below the base of the existing inferred resource. These step-out drill intercepts significantly expand the footprint of the Santoy Mine Complex and are of a materially higher grade than the current reserve and resource base. Santoy Gap results are highlighted by drill hole JOY-13-690 that returned 330.35 grams of gold per tonne over 1.55 metres, inclusive of a bonanza grade interval of 602.00 grams of gold per tonne over 0.84 metres. This is the highest grade interval drilled to date at the Santoy Gap. Drill hole JOY-13-692 returned 18.80 grams of gold per tonne over 13.86 metres in the final hole of the program. The intercept is located 400 metres down plunge from existing Santoy 8 inferred resources and 200 metres along strike from the Santoy Gap inferred resources. Drill hole JOY-13-692 is of particular significance as it confirms continuity at depth between the Santoy Gap and Santoy 8 deposits.
| Table 14: Highlights from 2013 Santoy Mine Complex Drilling | |
| Hole ID | | Easting | | Northing | | From (m) | | | To (m) | | | Grade (g/t) | | | Width
(m) | | | Zone | |
| JOY-13-690 | | 599175 | | 6171150 | | | 684.27 | | | | 685.82 | | | | 330.35 | | | | 1.55 | | | GAP | |
| | | | | Incl | | | 684.98 | | | | 685.82 | | | | 602.00 | | | | 0.84 | | | GAP | |
| JOY-13-692 | | 599721 | | 6170539 | | | 632.85 | | | | 646.71 | | | | 18.80 | | | | 13.86 | | | Santoy 8 | |
| | | | | Incl | | | 632.85 | | | | 635.85 | | | | 73.49 | | | | 3.00 | | | Santoy 8 | |
Note: Composites were calculated using a 3.0 g/t Au cut-off grade and may include internal dilution. True widths are interpreted to be 75 to 95 percent of drilled width. Assay results are uncut.
With a relatively limited surface drill program, the Company was able to demonstrate significant resource and grade upside at the Santoy Mine Complex. Furthermore, these holes demonstrate the prospectivity of the regional Santoy system and they also highlight the potential for near term resource growth. With the advancement of the Company’s exploration ramp from Santoy 8 to Santoy Gap, Claude’s exploration group has initiated underground infill drilling to aid in the development of a detailed mine design for the Santoy Gap as it is moved towards production.
2013 Annual Management’s Discussion and Analysis
(in thousands of CDN dollars, except as otherwise noted) |
Page 27 |
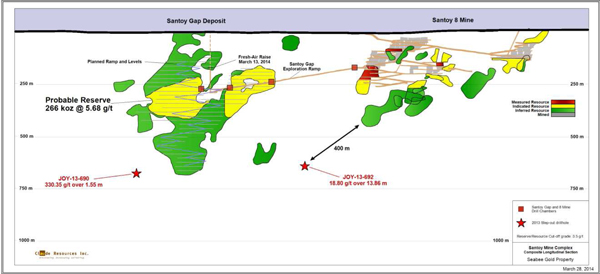
Figure 5: Santoy Region Composite Longitudinal Section.
Seabee Regional
Exploration of the Seabee Regional area has included work in the Pine, Pigeon and Laonil Lake areas. Grass roots work has focused on examining these prospective regional structures.
Drilling near the Seabee Mine during the first quarter consisted of four drill holes totaling 2,000 metres; no surface drilling is budgeted for the remainder of the year. The program was designed to evaluate four distinct Seabee parallel structures and their intersection with a prospective regional corridor beneath Laonil Lake. Assays for these holes have been received and will be integrated into future exploration programs in the area.

Figure 6: Seabee Mine Composite Longitudinal Section (L62 Zone Discovery)
2013 Annual Management’s Discussion and Analysis
(in thousands of CDN dollars, except as otherwise noted) |
Page 28 |
Amisk Gold Project
The potential of the Amisk Gold Project continues to be critically evaluated by the Company. The Amisk Gold Project is located in the Flin Flon-Snow Lake Greenstone Belt and is host to the Amisk Gold Deposit as well as a large number of gold occurrences and prospects.
At the Amisk Gold Project, regional potential remains high and exploration maturity low. Field work and extensive compilation have resulted in the emergence of an extensive list of exploration targets that are currently being prioritized for future assessment. During 2013, the Amisk PEA was completed.
At the Amisk Gold Project, Claude did not complete any drilling in 2013; however, the Company has completed target development (with the goal of identifying targets with similarities to Amisk’s historical geology), ranking and ground-base reconnaissance in areas which host potential for Amisk-style gold-silver (“Au-Ag”) mineralization as well as conventional base-metal deposits typical of the Flin Flon belt.
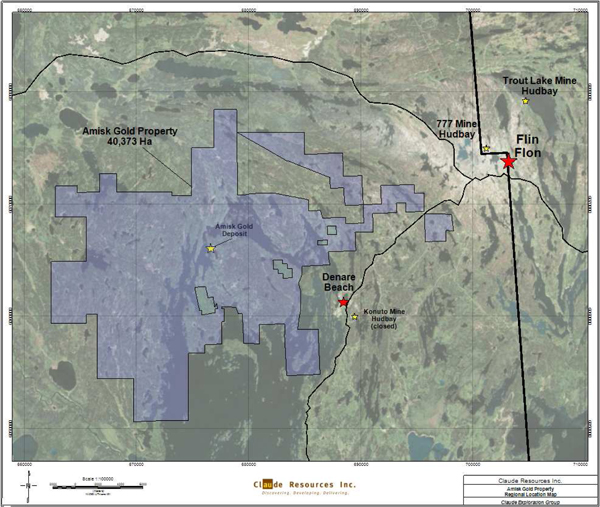
Figure 7: Amisk Gold Project
Drilling from the Company’s historical drill programs successfully confirmed continuity of gold mineralization within the northern and eastern portion of the deposit as well as demonstrated the potential for expansion to the east and southeast. Gold and silver mineralization at the Amisk Gold Project is associated with a sequence of quartz porphyritic, rhyolitic lapilli tuffs and flows hosting disseminations and stringers of pyrite, sphalerite, galena, tetrahedrite and chalcopyrite. Drilling has intercepted the mineralized system over a strike length of 1,200 metres, width of 400 metres and depths of in excess of 600 metres. The system remains open to the southwest, southeast, northwest and at depth.
2013 Annual Management’s Discussion and Analysis
(in thousands of CDN dollars, except as otherwise noted) |
Page 29 |
| 2013 Annual Management’s Discussion and Analysis | |
| (in thousands of CDN dollars, except as otherwise noted) | Page 29 |
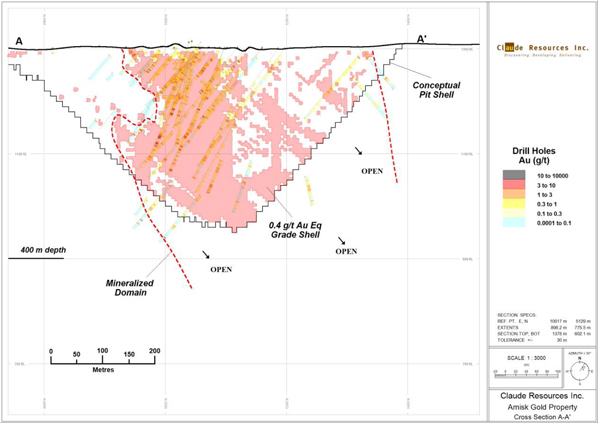
Figure 8: Cross Section A-A’ of the Amisk Gold Property
Madsen Project
During 2013, following the four year advanced exploration program, Claude advanced the Madsen project to an internal scoping level study and further evaluated surface exploration targets. In response to completion of the Company’s underground drilling, completion and results from the internal scoping level study and the intention to reduce expenditures due to the low gold price, Management terminated its underground dewatering program and evaluated a number of strategic opportunities for this asset. During the third quarter of 2013, as part of its strategy to minimize corporate expenditures and to focus on the Seabee Gold Operation, Claude adopted a plan to sell its Madsen property. The divestiture of Madsen was completed early in the first quarter of 2014 to Laurentian Goldfields Ltd.
The sale of the Madsen Gold Project aligns with Claude’s strategic plan to focus on improving the Company’s cash flow, margins and Balance Sheet. Laurentian’s Management have a proven track record in exploration and development of gold assets and have significant experience and knowledge of the Red Lake gold camp.
Quality Assurance and Quality Control Procedures
Rigorous quality assurance and quality control procedures have been implemented including the use of blanks, standards and duplicates. Geochemical analyses were submitted to ALS Chemex in Vancouver, British Columbia, TSL Laboratories in Saskatoon, Saskatchewan and or the Seabee minesite lab. ALS Chemex and TSL Laboratories are ISO approved. Core samples were analyzed by a 30 gram gold fire assay with an atomic absorption and gravimetric and or screen fire finish.
2013 Annual Management’s Discussion and Analysis
(in thousands of CDN dollars, except as otherwise noted) |
Page 30 |
| 2013 Annual Management’s Discussion and Analysis | |
| (in thousands of CDN dollars, except as otherwise noted) | Page 30 |
Mineral Reserves and Mineral Resources
The Company’s Mineral Resources were estimated by Claude personnel. SRK Consulting (Canada) Inc. prepared the Company’s Mineral Reserves as at November 15, 2013. Estimates of Mineral Resources as at November 15, 2013 were conducted under the direction of Qualified Person Brian Skanderbeg, P.Geo., Senior Vice President and Chief Operating Officer. Mineral Reserves were conducted under the direction of Qualified Person Stephen Taylor, P.Eng. (SRK Consulting (Canada) Inc.).
Seabee Gold Operation
At November 15, 2013, Proven and Probable Reserves in the Seabee Gold Operation were 2,308,800 tonnes, grading 5.70 grams per tonne or 422,900 ounces of gold. The Company’s Mineral Resources at its Seabee Gold Operation included Measured and Indicated Mineral Resources of 175,200 ounces and Inferred Mineral Resources totalling 582,900 ounces.
| Table 15: Seabee Gold Operation Mineral Reserves and Mineral Resources | |
| Proven and Probable Reserves | |
| | | November 15, 2013 | | | December 31, 2012 | |
| Projects | | Tonnes | | | Grade (g/t) | | | Ozs | | | Tonnes | | | Grade (g/t) | | | Ozs | |
| Seabee | | | 490,000 | | | | 6.67 | | | | 105,000 | | | | 947,100 | | | | 7.26 | | | | 221,100 | |
| Santoy 8 | | | 362,100 | | | | 4.45 | | | | 51,800 | | | | 628,100 | | | | 4.45 | | | | 89,900 | |
| Santoy Gap | | | 1,456,700 | | | | 5.68 | | | | 266,100 | | | | 1,210,000 | | | | 6.24 | | | | 243,000 | |
| Totals | | | 2,308,800 | | | | 5.70 | | | | 422,900 | | | | 2,785,200 | | | | 6.19 | | | | 554,100 | |
| Measured and Indicated Mineral Resources | |
| Projects | | Tonnes | | | Grade (g/t) | | | Ozs | | | Tonnes | | | Grade (g/t) | | | Ozs | |
| Seabee | | | 151,000 | | | | 6.42 | | | | 31,200 | | | | 45,400 | | | | 4.86 | | | | 7,100 | |
| Santoy 8 | | | 68,000 | | | | 4.55 | | | | 9,900 | | | | 59,300 | | | | 3.28 | | | | 6,200 | |
| Santoy Gap | | | 309,400 | | | | 8.44 | | | | 83,900 | | | | 94,000 | | | | 4.65 | | | | 14,000 | |
| Porky Main | | | 160,000 | | | | 7.50 | | | | 38,600 | | | | 160,000 | | | | 7.50 | | | | 38,600 | |
| Porky West | | | 100,700 | | | | 3.57 | | | | 11,600 | | | | 111,000 | | | | 3.10 | | | | 11,000 | |
| Totals | | | 789,100 | | | | 6.91 | | | | 175,200 | | | | 469,600 | | | | 5.10 | | | | 77,000 | |
| Inferred Mineral Resources | |
| Projects | | Tonnes | | | Grade (g/t) | | | Ozs | | | Tonnes | | | Grade (g/t) | | | Ozs | |
| Seabee | | | 421,600 | | | | 9.78 | | | | 132,600 | | | | 355,600 | | | | 8.55 | | | | 97,700 | |
| Santoy 8 | | | 640,100 | | | | 6.09 | | | | 125,300 | | | | 518,700 | | | | 5.91 | | | | 98,600 | |
| Santoy Gap | | | 1,210,000 | | | | 6.96 | | | | 270,800 | | | | 1,875,000 | | | | 5.92 | | | | 356,900 | |
| Porky Main | | | 70,000 | | | | 10.43 | | | | 23,500 | | | | 70,000 | | | | 10.43 | | | | 23,500 | |
| Porky West | | | 174,800 | | | | 5.48 | | | | 30,800 | | | | 138,300 | | | | 6.03 | | | | 26,800 | |
| Totals | | | 2,516,500 | | | | 7.21 | | | | 582,900 | | | | 2,957,600 | | | | 6.35 | | | | 603,400 | |
Footnotes to the Mineral Resource Statement:
| 1. | At November 15, 2013, Mineral Resources were estimated by Claude personnel. SRK Consulting (Canada) Inc. prepared the Company’s Mineral Reserves as at November 15, 2013. The Mineral Resource evaluation work was completed by a team of geologists and engineers under the supervision of Brian Skanderbeg, P.Geo., Senior Vice President and Chief Operating Officer, a full time employee of Claude. Mr. Skanderbeg has sufficient experience, which is relevant to the style of mineralization and type of deposit under consideration and to the activities undertaken to qualify as a Qualified Person as defined by NI 43-101. Mineral Reserves were conducted under the direction of Qualified Person Stephen Taylor, P.Eng (SRK Consulting (Canada) Inc.). |
| 2. | In 2012, Mineral Reserves and Mineral Resources estimates were conducted under the direction of Qualified Persons Brian Skanderbeg, P.Geo., Senior Vice President and Chief Operating Officer and Peter Longo, P.Eng., Vice President, Operations. |
| 3. | The Mineral Resources and reserves reported herein have been estimated in conformity with generally accepted CIM “Estimation of Mineral Resource and Mineral Reserves Best Practices” guidelines and are reported in accordance with Canadian Securities Administrators’ National Instrument 43-101. |
| 4. | Mineral Reserves and Mineral Resources for the Seabee deposit are reported at a cut-off of 4.6 grams of gold per tonne. Santoy 8 and Santoy Gap Mineral Reserves and Mineral Resources are reported at a cut-off of 3.5 grams of gold per tonne. Porky Main and Porky West Mineral Resources are reported at a cut-off grade of 3.0 grams of gold per tonne. Assumptions include a price of CDN $1,350 per ounce of gold using metallurgical and process recovery of 95.2 percent and overall ore mining and processing costs derived from 2013 realized costs. |
2013 Annual Management’s Discussion and Analysis
(in thousands of CDN dollars, except as otherwise noted) |
Page 31 |
| 5. | All figures are rounded to reflect the relative accuracy of the estimates. Summation of individual columns may not add-up due to rounding. |
| 6. | Mineral Resources are not Mineral Reserves and do not have demonstrated economic viability. There is no certainty that all or any part of the Mineral Resource will be converted into Mineral Reserves. |
At the Seabee Gold Operation, year over year, there was a 24 percent decrease in Mineral Reserves (131,200 ounces) and a 128 percent increase in Mineral Resources (98,200 ounces). Year over year, changes in the Seabee Gold Operations Mineral Reserves and Mineral Resources were driven by:
| · | a decrease in gold price which increased cut-off grade; |
| · | reduced drilling meterage focused on grade definition; |
| · | higher dilution assumptions. |
The Mineral Reserves and Mineral Resources of the Santoy Gap deposit are growing in importance and represent an opportunity for the Company due to their proximity to permitted mine infrastructure, low development cost and near-term production potential. Furthermore, based on its high-grade nature and size, the Santoy Gap deposit demonstrates the potential that exists to grow production at the Seabee Gold Operation.
Amisk Gold Project
At the Amisk Gold Project, Claude’s independent NI 43-101 compliant resource calculation outlines an Indicated Resource of 921,000 ounces of 0.95 grams of Au Eq per tonne and an Inferred Resource of 645,000 ounces at 0.70 grams of Au Eq per tonne.
| Table 16: Amisk Gold Project Consolidated Mineral Resource Statement* | |
| | | Quantity | | | Grade (g/tonne) | | | Contained Ounces (000’s) | |
| Resource Class | | (000’s tonnes) | | | Au | | | Ag | | | Au Eq | | | Au | | | Ag | | | Au Eq | |
| | | | | | | | | | | | | | | | | | | | | | |
| Indicated | | | 30,150 | | | | 0.85 | | | | 6.17 | | | | 0.95 | | | | 827 | | | | 5,978 | | | | 921 | |
| Inferred | | | 28,653 | | | | 0.64 | | | | 4.01 | | | | 0.70 | | | | 589 | | | | 3,692 | | | | 645 | |
* Reported at a cut-off of 0.40 grams of gold equivalent (Au Eq) per tonne using a price of U.S. $1,100 per ounce of gold and U.S. $16 per ounce of silver inside a conceptual pit shell optimized using metallurgical and process recovery of 87 percent, overall ore mining and processing costs of U.S. $15 per tonne and overall pit slope of 50 degrees. All figures are rounded to reflect the relative accuracy of the estimates. Mineral Resources are not Mineral Reserves and do not have demonstrated economic viability.
The mineral resources for the Amisk Gold Project are sensitive to the selection of cut-off grade. The table below presents the quantity and grade estimates at a range of cut-off grades inside the conceptual pit shell considered for reporting the Mineral Resource Statement. A cut-off value of 0.4 grams of gold equivalent per tonne was selected based on optimization results and benchmarking against similar deposits.
| Table 17: Global Block Model Quantity and Grade Estimates, Amisk Lake Gold Project at Various Cut-off Grades. | |
| Grade | | | Indicated | | | Inferred | |
Au Eq
(gpt) | | | Quantity
(tonnes) | | | Au Eq
(gpt) | | | Ounces
Au Eq | | | Quantity
(tonnes) | | | Au Eq
(gpt) | | | Ounces
Au Eq | |
| | 0.40 | | | | 30,150,090 | | | | 0.95 | | | | 920,881 | | | | 28,653,135 | | | | 0.70 | | | | 644,854 | |
| | 0.50 | | | | 23,533,117 | | | | 1.09 | | | | 824,702 | | | | 19,446,358 | | | | 0.82 | | | | 512,676 | |
| | 0.60 | | | | 18,322,858 | | | | 1.25 | | | | 736,367 | | | | 13,665,490 | | | | 0.94 | | | | 412,994 | |
| | 0.70 | | | | 14,359,129 | | | | 1.41 | | | | 650,936 | | | | 9,491,034 | | | | 1.07 | | | | 326,504 | |
| | 0.80 | | | | 11,418,785 | | | | 1.58 | | | | 580,054 | | | | 6,659,786 | | | | 1.20 | | | | 256,941 | |
| | 0.90 | | | | 9,206,976 | | | | 1.76 | | | | 520,980 | | | | 4,825,758 | | | | 1.34 | | | | 207,903 | |
| | 1.00 | | | | 7,606,617 | | | | 1.93 | | | | 471,998 | | | | 3,589,543 | | | | 1.48 | | | | 170,802 | |
| | 1.50 | | | | 3,472,946 | | | | 2.80 | | | | 312,642 | | | | 1,078,945 | | | | 2.16 | | | | 74,928 | |
Note: The reader is cautioned that the figures in this table should not be misconstrued with a Mineral Resource Statement. The figures are only presented to show the sensitivity of the block model estimates to the selection of cut-off grade.
2013 Annual Management’s Discussion and Analysis
(in thousands of CDN dollars, except as otherwise noted) |
Page 32 |
For the Amisk Gold Project, an updated NI 43-101 resource statement, inclusive of all 2012 drilling, was completed in conjunction with the external Amisk PEA for the Amisk Gold Project.
Business Risks
The profitability and operating cash flow of the Company is dependent on several factors: the quantity of gold produced, related gold prices, foreign exchange, operating costs, capital expenditures, exploration levels and environmental, health and safety regulations. These and other risk factors listed below relate to the mining industry in general while others are specific to Claude. A complete list of risk factors is contained within the Company’s Annual Information Form. Whenever possible, the Company seeks to mitigate these risk factors.
Gold Price Volatility
The economics of developing gold and other metal properties are affected by many factors, including the cost of operations, variations in the grade of ore mined and the price of gold or other metals. Depending on the price of gold, the Company may determine that it is impractical to commence or continue commercial production. The price of gold has fluctuated in recent years. During the year ended December 31, 2013, the market price per ounce for gold ranged from a low of U.S. $1,192 to a high of U.S. $1,694, with an average price of U.S. $1,411.
Any significant drop in the price of gold adversely impacts the Company’s revenues, profitability and cash flows. Also, sustained low gold prices can:
| 1. | Reduce production revenues as a result of cutbacks caused by the cessation of mining operations involving deposits or portions of deposits that have become uneconomic at the prevailing price of gold; |
| 2. | Cause the cessation or deferral of new mining projects; |
| 3. | Decrease the amount of capital available for exploration activities; |
| 4. | Reduce existing reserves by removing ore from reserves that cannot be economically mined at prevailing prices; or, |
| 5. | Cause the write-off of an asset whose value is impaired by the low price of gold. |
Gold prices may fluctuate widely and are affected by numerous industry factors, such as demand for precious metals, forward selling by producers and central bank sales and purchases of gold. Moreover, gold prices are also affected by macro-economic factors such as expectations for inflation, interest rates, currency exchange rates and global or regional political and economic situations. The current demand for and supply of gold affects gold prices, but not necessarily in the same manner as current demand and supply affects the price of other commodities. The potential supply of gold consists of new mine production plus existing stocks of bullion and fabricated gold held by governments, financial institutions, industrial organizations and individuals. If gold prices remain at low market levels for a sustained period, the Company could determine that it is not economically feasible to continue mining operations or exploration activities.
There can be no assurance that the price of gold will remain stable or that such price will be at a level that will prove feasible to continue the Company’s exploration activities, or if applicable, begin development of its properties, commence or, if commenced, continue commercial production.
Inherent Exploration and Mining Risks
The exploration for and development of mineral deposits involves significant risks, which even the combination of careful evaluation, experience and knowledge may not eliminate. It is impossible to guarantee that current or future exploration programs on existing mineral properties will establish reserves.
2013 Annual Management’s Discussion and Analysis
(in thousands of CDN dollars, except as otherwise noted) |
Page 33 |
The level of profitability of the Company in future years will depend mainly on gold prices, the cost of production at the Seabee Operation and whether any of the Company’s exploration stage properties can be brought into production. Whether an ore body will continue to be commercially viable depends on a number of factors, some of which are the particular attributes of the deposit such as: size, grade and proximity to infrastructure; precious metal prices, which cannot be predicted and which have been highly volatile in the past; mining costs; and government regulations, including regulations relating to prices, taxes, royalties, land tenure, land use, importing and exporting of minerals, environmental protection and reclamation and closure obligations. The effect of these factors cannot be accurately predicted, but the combination of these factors may cause a mineral deposit that has been mined profitably in the past, such as the Seabee Operation, to become unprofitable. The Company is subject to the risks normally encountered in the mining industry, such as unusual or unexpected geological formations, cave-ins or flooding. The Company may become subject to liability for pollution, cave-ins or other hazards against which it cannot insure or against which it may elect not to insure.
The development of gold and other mineral properties is affected by many factors, including the cost of operations, variations in the grade of ore, fluctuations in commodity markets, costs of processing equipment and other factors such as government regulations, including regulations relating to royalties, fluctuations in the U.S. dollar versus Canadian dollar exchange rate, allowable production, importing and exporting of minerals and environmental protection.
Production Estimates
The Company’s gold production may fall below estimated levels as a result of mining accidents such as cave-ins, rock falls, rock bursts or as a result of other operational difficulties. In addition, production may be unexpectedly reduced if, during the course of mining, mineral grades are lower than expected, the physical or metallurgical characteristics of the minerals are less amenable than expected to mining or treatment, or dilution increases. Accordingly, there can be no assurance that the Company will achieve current or future production estimates.
Foreign Exchange Risk
The price of gold is denominated in U.S. dollars and, accordingly, the Company’s proceeds from gold sales will be denominated and received in U.S. dollars. As a result, fluctuations in the U.S. dollar against the Canadian dollar could result in unanticipated fluctuations in the Company’s financial results, which are reported in Canadian dollars. During the year ended December 31, 2013, the CDN$/US$ exchange rate ranged from a low of $0.9838 to a high of $1.0704, with an average of $1.0298.
Limitations under Credit Facilities
The Company’s secured credit facilities may limit, among other things, the Company’s ability to permit the creation of certain liens, make investments or dispose of the Company’s material assets. In addition, these credit facilities may limit the Company’s ability to incur additional indebtedness and requires the Company to maintain specified financial ratios and meet financial condition covenants. Events beyond the Company’s control, including changes in general economic and business conditions, may affect the Company’s ability to satisfy these covenants, which could result in a default under one or both of the credit facilities. If an event of default under the credit facility occurs, the lenders could elect to declare all principal amounts outstanding thereunder at such time, together with accrued interest, to be immediately due. In such an event, the Company may not have sufficient funds to repay amounts owing under the facility.
Access to Funding
The Company’s ability to continue its production, exploration and development activities depends in part on its ability to generate revenues from its operations or to obtain financing through joint ventures, debt financing, equity financing and production sharing arrangements or other means.
The failure of the Company to meet its ongoing obligations on a timely basis could result in the loss or substantial dilution of its interest (as existing or as proposed to be acquired) in its properties and materially impact the Company’s business and financial condition.
2013 Annual Management’s Discussion and Analysis
(in thousands of CDN dollars, except as otherwise noted) |
Page 34 |
Fluctuations in External Factors Affecting Costs
The Corporation’s production costs are dependent on a number of factors, including refining charges, and the cost of inputs used in mining operations, including, but not limited to, equipment, labour (including contractors), petroleum, chemical reagents, tires and electricity. All of these factors are beyond the Company’s control. If the Company’s total production costs per ounce of gold rise above the market price of gold and remain so for any sustained period, the Company may experience losses and may curtail or suspend some or all of its exploration, development and mining activities.
Unfavourable Government Regulatory Changes
The Company’s exploration activities and mining operations are affected to varying degrees by government regulations relating to mining operations, the acquisition of land, pollution control and environmental protection, safety, production and expropriation of property. Changes in these regulations or in their application are beyond the control of the Company and may adversely affect its operations, business and results of operations. Failure to comply with the conditions set out in any permit or failure to comply with applicable statutes and regulations may result in orders to cease or curtail operations or to install additional equipment. The Company may be required to compensate those suffering loss or damage by reason of its operating or exploration activities.
Currently, all of the Company’s properties are subject to the federal laws of Canada and, depending upon the location of the Company’s properties, may be subject to the provincial laws of Saskatchewan and Ontario as well as local municipal laws. Mineral exploration and mining may be affected in varying degrees by government regulations relating to the mining industry. Any changes in regulations or shifts in political conditions are beyond the control of the Company and may adversely affect its business.
Operations may be affected in varying degrees by government regulations with respect to price controls, export controls, foreign exchange controls, income taxes, expropriation of property, environmental and mine safety legislation.
Aboriginal Rights, Title Claims and the Duty to Consult May Delay Projects
Exploration, development and mining activities at the Company’s Saskatchewan and Ontario properties may affect established or potential treaty or Aboriginal rights, title or other claims held by Aboriginal groups, in these circumstances, First Nation and Métis, with related duty to consult issues. The Company is committed to effectively managing any impacts to such rights, title and claims and any resulting consultation requirements that may arise. However, there is no assurance that the Company will not face material adverse consequences because of the legal and factual uncertainties associated with these issues.
Failure to Effectively Manage the Company’s Tailings Facilities could Negatively Impact Gold Production
The Company’s Seabee Mill produces tailings. Managing these tailings is integral to gold production. The Seabee Operation’s East Lake and Triangle Lake tailings management facilities have the capacity to store tailings from milling ore from the Seabee Mill until approximately 2016. The Company is currently in the process of planning tailings capacity expansion beyond 2016. This will support the extension of Seabee’s mine life and provide additional tailings capacity to process ore from the Santoy 8 deposit and other potential sources such as Santoy Gap deposit within the Santoy Mine Complex. If the Company does not receive regulatory approval for new or expanded tailings facilities, gold production could be constrained.
2013 Annual Management’s Discussion and Analysis
(in thousands of CDN dollars, except as otherwise noted) |
Page 35 |
Changes to Safety, Health and Environmental Regulations Could Have a Material Adverse Effect on Future Operations
Safety, health and environmental legislation affects nearly all aspects of the Company’s operations including exploration, mine development, working conditions, waste disposal, emission controls and protection of endangered and protected species. Compliance with safety, health and environmental legislation can require significant expenditures and failure to comply with such safety, health and environmental legislation may result in the imposition of fines and penalties, the temporary or permanent suspension of operations, clean-up costs resulting from contaminated properties, damages and the loss of important permits. Exposure to these liabilities arises not only from the Company’s existing operations, but from operations that have been closed or sold to third parties. Generally, the Company is required to reclaim properties after mining is completed and specific requirements vary among jurisdictions. The Company is required to provide financial assurances as security for reclamation costs, which may exceed the Company’s estimates for such costs. The Company could also be held liable for worker exposure to hazardous substances and for accidents causing injury or death. There can be no assurances that the Company will at all times be in compliance with all safety, health and environmental regulations or that steps to achieve compliance would not materially adversely affect the Company’s business.
Safety, health and environmental laws and regulations are evolving in all jurisdictions where the Company has activities. The Company is not able to determine the specific impact that future changes in safety, health and environmental laws and regulations may have on its operations and activities, and its resulting financial position; however, the Company anticipates that capital expenditures and operating expenses will increase in the future as a result of the implementation of new and increasingly stringent safety, health and environmental regulation. For example, emissions standards are poised to become increasingly stringent. Further changes in safety, health and environmental laws, new information on existing safety, health and environmental conditions or other events, including legal proceedings based upon such conditions or an inability to obtain necessary permits, may require increased financial reserves or compliance expenditures or otherwise have a material adverse effect on the Company.
Environmental and regulatory review is a long and complex process that can delay the opening, modification or expansion of a mine, extend decommissioning at a closed mine, or restrict areas where exploration activities may take place.
Decommissioning and Reclamation Obligations May Constrain Production
Environmental regulators are demanding more and more financial assurances so that the parties involved, and not the government, bear the costs of decommissioning and reclaiming sites. Decommissioning plans have been filed for the Seabee and Madsen properties. These plans are reviewed, as necessary, or at the time of an amendment or renewal of an operating license. Regulators may conduct a further review of the detailed decommissioning plans, and this can lead to additional requirements, costs and financial assurances. It is not possible to predict what level of decommissioning and reclamation and financial assurances regulators may require in the future.
As filed with the Government of Saskatchewan’s Ministry of Environment, the Company estimated in its 2013 Mine Closure Plan the closure costs at the cessation of mining at its Seabee Mine at $6.1million. Actual costs of completing the reclamation of the mine site may be higher than those estimated. The Company has issued letters of credit in favour of the Ministry of Environment in the amount of $1.6 million in support of its obligations. The letters of credit are secured by investment certificates. The Company has received approval to incrementally fund its remaining closure cost obligations over the next five years as follows: 2014 - $0.5 million; 2015 - $0.5 million; 2016 - $1.0 million; 2017 - $1.0 million; and, 2018 - $1.5 million.
Imprecise Ore Reserves and Ore Grade Estimates May Negatively Impact Gold Production and Operating Profitability
Although the Company has assessed the Mineral Reserve and Mineral Resource estimates contained in this document and believes that the methods used to estimate such Mineral Reserves and Mineral Resources are appropriate, such figures are estimates. Estimates of Mineral Reserves and Mineral Resources are inherently imprecise and depend to some extent on statistical inferences drawn from limited drilling, which may prove unreliable. Furthermore, the indicated level of recovery of gold may not be realized. Market price fluctuations of gold may render reserves and deposits containing relatively lower grades of mineralization uneconomic. Moreover, short-term operating factors relating to Mineral Reserves, such as the need for orderly development of the deposits or the processing of new or different grades, may cause mining operations to be unprofitable in any particular period. Until Mineral Reserves or Mineral Resources are actually mined and processed, Mineral Reserve and Mineral Resource grades must be considered as estimates only.
2013 Annual Management’s Discussion and Analysis
(in thousands of CDN dollars, except as otherwise noted) |
Page 36 |
Potential Shareholder Dilution Could Impact Share Price and New Equity Issues
As of December 31, 2013, there were stock options outstanding to purchase 7,936,361 common shares and share purchase warrants outstanding to purchase 5,750,000 common shares (subsequent to December 31, 2013, the share purchase warrants were cancelled pursuant to terms of a Waiver Agreement with Crown Capital). The common shares issuable under these options and warrants, if fully exercised, would constitute approximately 7.2 percent of the Company’s resulting share capital. The exercise of such options or warrants and the subsequent resale of such shares in the public market could adversely affect the prevailing share market price and the Company’s ability to raise equity capital in the future at a time and price which it deems appropriate. The Company may also enter into commitments in the future which would require the issuance of additional common shares and the Company may grant additional share purchase warrants and stock options. Any share issuances from the Company’s treasury could result in immediate dilution to existing shareholders.
Industry Competition May Hinder Corporate Growth
The Company’s business is intensely competitive and the Company competes with other mining companies, some of which have greater resources and experience. Competition in the precious metals mining industry is primarily for mineral rich properties which can be developed and produced economically, the technical expertise to find, develop and produce such properties, the labour to operate the properties and the capital for the purpose of financing development of such properties. Many competitors not only explore for and mine precious metals, but also conduct refining and marketing operations on a worldwide basis and some of these companies have much greater financial and technical resources than the Company. Such competition may result in the Company being unable to acquire desired properties, to recruit or retain qualified employees or to acquire the capital necessary to fund its operations and develop its properties. The Company’s inability to compete with other mining companies could have a material adverse effect on the Company’s results of operations and its business.
Impairment of Assets may Impact Operational Performance
In accordance with IFRS, the Company capitalizes certain expenditures and advances relating to its mineral projects. From time to time the carrying amounts of mining properties and plant and equipment are reviewed for impairment if events or changes in circumstances indicate that the carrying value may not be recoverable. If there are indicators of impairment, an exercise is undertaken to determine whether the carrying values are in excess of their recoverable amount. Such review is undertaken on an asset by asset basis, except where such assets do not generate cash flows independent of other assets, and then the review is undertaken at the cash generating unit level.
Events that could, in some circumstances, lead to an impairment include, but are not limited to, changes to gold price or cost assumptions, changes to Mineral Reserve or Mineral Resource grades or the Company’s market capitalization being less than the carrying amounts of its mining properties and plant and equipment.
The assessment requires the use of estimates and assumptions such as, but not limited to, long-term gold prices, foreign exchange rates, discount rates, future capital requirements, Mineral Reserve and Mineral Resource estimates, operating performance as well as the definition of cash generating units. It is possible that the actual fair value could be significantly different from those assumptions, and changes in the assumptions will affect the recoverable amount. In the absence of any mitigating valuation factors, the Company’s failure to achieve its valuation assumptions or a decline in the fair value of its cash generating unit or other assets may, over time, result in impairment charges.
2013 Annual Management’s Discussion and Analysis
(in thousands of CDN dollars, except as otherwise noted) |
Page 37 |
If the Company determines that an asset is impaired, the Company will charge against earnings any difference between the carrying amount of the assets and the estimated fair value less cost to sell of those assets. Any such charges could have a material adverse effect on the Company’s results of operations.
Extreme and Persistent Weather Conditions Could Cause Operating and Exploration Difficulties
The Company’s mining and exploration properties are all located in the northern portions of Saskatchewan and Ontario. Access to these properties and the ability to conduct work on them can be affected by adverse weather conditions. Adverse weather conditions can also increase the costs of both access and work on the Company’s properties.
Title to Company Properties Could be Challenged with Potential Loss of Ownership
Acquisition of title to mineral properties is a very detailed and time-consuming process. The Company believes it has investigated title to all of its mineral properties and has obtained title opinions with respect to its most significant properties. To the best of the Company’s knowledge, titles to all such properties are in good standing. For the Madsen property, Claude has searched title records for any and all encumbrances. For the Seabee and Amisk properties, the Company has examined property search abstracts from the Saskatchewan Ministry of the Economy as well as made inquiries and reviewed lease files from the Ministry. It has also received confirmation of title from Saskatchewan Environment.
The title to the Company’s properties could be challenged or impugned. The properties may have been acquired in error from parties who did not possess transferable title, may be subject to prior unregistered agreements or transfers and title may be affected by undetected defects.
We May Not be Able to Hire Enough Skilled Employees to Support Operations
Many of the projects undertaken by the Company rely on the availability of skilled labour and the capital outlays required to employ such labour. The Company employs full and part time employees, contractors and consultants to assist in executing operations and providing technical guidance. In the event of a skilled labour shortage, various projects of the Company may not become operational due to increased capital outlays associated with labour. Further, a skilled labour shortage could result in operational issues such as production shortfalls and higher mining costs.
Uninsured Risks could Negatively Impact Profitability
In the course of exploration, development and production of mineral properties, certain risks and in particular, unexpected or unusual geological operating conditions including rock bursts, cave-ins, fire and flooding and earthquakes may occur. It is not always possible to fully insure against such risks and the Company may decide not to take out insurance against such risks as a result of high premiums or other reasons. Should such liabilities arise, they could reduce or eliminate any future profitability and result in increased costs and a decline in the value of the securities of the Company.
The Company is Subject to Evolving Corporate Governance and Public Disclosure Regulations that have Increased the Cost of Compliance and the Risk of Non-compliance
The Company is subject to changing rules and regulations promulgated by a number of Canadian and United States governmental and self-regulating organizations, including the Canadian Securities Administrators, the Toronto Stock Exchange, the U.S. Securities and Exchange Commission and the International Accounting Standards Board. These rules and regulations continue to evolve in scope and complexity making compliance more difficult and uncertain. Efforts to comply with new regulations have resulted, and are likely to continue to result in, increased general and administrative expenses and a diversion of Management time and attention from revenue-generating activities to compliance activities.
2013 Annual Management’s Discussion and Analysis
(in thousands of CDN dollars, except as otherwise noted) |
Page 38 |
Due to the Company’s Canadian Jurisdiction, Investors may be Deterred from Trading Company Stock as it may be Difficult for United States (“U.S.”) Investors to Effect Service of Process Against the Company
The Company is incorporated under the laws of Canada. All of the Company’s directors and officers are residents of Canada and all of the Company’s assets and its subsidiaries are located in Canada. Consequently, it may be difficult for U.S. investors to affect service of process in the U.S. upon the Company’s directors or officers or to realize in the U.S. upon judgments of U.S. courts predicated upon civil liabilities under the United States Securities Exchange Act of 1934, as amended. A judgment of a U.S. court predicated solely upon such civil liabilities may be enforceable in Canada by a Canadian court if the U.S. court in which the judgment was obtained had jurisdiction, as determined by the Canadian court, in the matter. There is substantial doubt whether an original action could be brought successfully in Canada against any of such persons or the Company predicated solely upon such civil liabilities.
Internal Controls Provide No Absolute Assurances as to Reliability of Financial Reporting
The Company has invested resources to document and assess its system of internal controls over financial reporting and it is continuing its evaluation of such internal controls. Internal controls over financial reporting are procedures designed to provide reasonable assurance that transactions are properly authorized, assets are safeguarded against unauthorized or improper use, and transactions are properly recorded and reported. A control system, no matter how well designed and operated, can provide only reasonable, not absolute, assurance with respect to the reliability of financial reporting and financial statement preparation.
The Company is required to satisfy the requirement of Section 404 of the U.S. Sarbanes-Oxley Act of 2002 (the “Sarbanes-Oxley Act”), which requires an annual assessment by management of the effectiveness of the Company’s internal control over financial reporting.
If the Company fails to maintain the adequacy of its internal control over financial reporting, as such standards are modified, supplemented, or amended from time to time, the Company may not be able to ensure that it can conclude on an ongoing basis that it has effective internal controls over financial reporting in accordance with Section 404 of the Sarbanes-Oxley Act. The Company’s failure to satisfy the requirement of Section 404 of the Sarbanes-Oxley Act on an ongoing, timely basis could result in the loss of investor confidence in the reality of its financial statements, which in turn could harm the Company’s business and negatively impact the trading price of its common shares. In addition, any failure to implement required new or improved controls, or difficulties encountered in their implementation, could harm the Company’s operating results or cause it to fail to meet its reporting obligations.
Although the Company intends to devote substantial time and incur substantial costs, as necessary, to ensure ongoing compliance, the Company cannot be certain that it will be successful in complying with Section 404 of the Sarbanes-Oxley Act.
The Company is Subject to Certain Legal Proceedings and may be Subject to Additional Litigation in the Future
All industries, including the mining industry, are subject to legal claims, with and without merit. The Company is currently involved in litigation of a non-material nature and may become involved in legal disputes in the future. Defense and settlement costs can be substantial, even with respect to claims that have no merit. Due to the inherent uncertainty of the litigation process, there can be no assurance that the resolution of any particular legal proceedings will not have a material adverse effect on the Company’s financial position or results of operations.
Conflicts of Interest
Certain of the directors of the Company are also directors and officers of other companies engaged in mineral exploration and development and mineral property acquisitions. As such, situations may arise where such directors are in a conflict of interest with the Company. The Company will resolve any actual conflicts of interest if and when the same arise in accordance with the Company’s Code of Ethics Policy.
2013 Annual Management’s Discussion and Analysis
(in thousands of CDN dollars, except as otherwise noted) |
Page 39 |
Common Share Data
The authorized share capital of the Company consists of an unlimited number of common shares and two classes of unlimited preferred shares issuable in series. At December 31, 2013, there were 175,811,376 common shares outstanding. This compares to 173,745,564 common shares outstanding at December 31, 2012.
During 2013, the Company issued 2,065,812 common shares pursuant to the Company’s ESPP. Subsequent to December 31, 2013, the Company issued 7,799,148 shares pursuant to 2013 participation in the ESPP.
On March 28, 2014, Claude completed a private placement (the "Private Placement") of common shares in the capital of the Company ("Common Shares"). The Private Placement consisted of the issuance of 4,545,454 Common Shares at a price of CDN $0.22 per Common Share, being the market price of the Common Shares within the meaning of the Toronto Stock Exchange Company Manual, to CCP. The Common Shares have been issued to CCP as payment for a waiver being granted by CCP in connection with a Credit Agreement dated as of April 5, 2013 as a result of a covenant breach at December 31, 2013, as well as the modification of certain covenants. Concurrently with satisfaction of this one-time payment, the 5.75 million common share purchase warrants pursuant to the original agreement were cancelled in conjunction with the waiver.
At March 28, 2014, there were 188,155,978 common shares of the Company issued and outstanding.
Stock Options, Warrants and Deferred Share Units Outstanding
Stock Options
At December 31, 2013, there were 7.9 million director, officer and key employee stock options outstanding with exercise prices ranging from $0.14 to $2.38 per share. This compares to 6.9 million director, officer and key employee stock options outstanding at December 31, 2012 ranging from $0.50 to $2.38 per share.
| Table 18: Schedule of Stock Options Outstanding and Weighted Average Exercise Price | |
| | | December 31, 2013 | | | December 31, 2012 | |
| | | Number | | | Weighted
Average
Exercise Price | | | Number | | | Weighted
Average
Exercise Price | |
| | | | | | | | | | | | | |
| Beginning of period | | | 6,948,527 | | | $ | 1.43 | | | | 5,484,250 | | | $ | 1.57 | |
| Options granted | | | 1,937,268 | | | | 0.43 | | | | 1,896,290 | | | | 1.04 | |
| Options exercised | | | - | | | | - | | | | (75,402 | ) | | | 0.78 | |
| Options forfeited | | | (934,434 | ) | | | 1.35 | | | | (316,611 | ) | | | 1.82 | |
| Options expired | | | (15,000 | ) | | | 1.79 | | | | (40,000 | ) | | | 1.51 | |
| End of period | | | 7,936,361 | | | $ | 1.19 | | | | 6,948,527 | | | $ | 1.43 | |
2013 Annual Management’s Discussion and Analysis
(in thousands of CDN dollars, except as otherwise noted) |
Page 40 |
For options outstanding at December 31, 2013, the range of exercise prices, the number vested, the weighted average exercise price and the weighted average remaining contractual life are as follows:
| Table 19: Schedule of Stock Options Outstanding by Price Range | |
| | | Options Outstanding | | | Options Exercisable | |
Option Price Per
Share | | Quantity | | | Weighted
Average
Remaining
Life | | | Weighted
Average
Exercise
Price | | | Quantity | | | Weighted
Average
Remaining
Life | | | Weighted
Average
Exercise
Price | |
| $0.14 - $0.50 | | | 1,883,765 | | | | 6.32 | | | $ | 0.43 | | | | 30,000 | | | | 5.01 | | | $ | 0.50 | |
| $0.51 - $1.00 | | | 1,114,845 | | | | 5.21 | | | | 0.73 | | | | 964,844 | | | | 5.14 | | | | 0.74 | |
| $1.01 - $1.50 | | | 2,453,006 | | | | 4.79 | | | | 1.21 | | | | 2,236,090 | | | | 4.75 | | | | 1.20 | |
| $1.51 - $2.00 | | | 1,988,000 | | | | 6.23 | | | | 1.87 | | | | 1,502,000 | | | | 5.83 | | | | 1.84 | |
| $2.01 - $2.38 | | | 496,745 | | | | 6.90 | | | | 2.31 | | | | 354,048 | | | | 6.76 | | | | 2.29 | |
| | | | 7,936,361 | | | | 5.70 | | | $ | 1.19 | | | | 5,086,982 | | | | 5.29 | | | $ | 1.37 | |
The foregoing options have expiry dates ranging from January 12, 2014 to December 8, 2021.
Warrants
At December 31, 2013, there were 5.8 million common share purchase warrants outstanding. Each common share purchase warrant entitles the holder to acquire one common share of the Company at prices determined at the time of issue. The exercise price and date of expiration of the warrants outstanding are as follows:
| Table 20: Schedule of Warrants Outstanding | |
| | | | | | Number | | | | | | | | | Number | |
| Exercise | | | | | Outstanding at | | | | | | | | | Outstanding at | |
| Price | | | Expiry Date | | December 31, 2012 | | | Granted | | | Expired | | | December 31, 2013 | |
| $ | 1.60 | | | May 22, 2013 | | | 1,693,200 | | | | - | | | | 1,693,200 | | | | - | |
| $ | 0.70 | | | April 5, 2018 | | | - | | | | 5,750,000 | | | | - | | | | 5,750,000 | |
| | | | | | | | 1,693,200 | | | | 5,750,000 | | | | 1,693,200 | | | | 5,750,000 | |
Subsequent to December 31, 2013, the Company entered into an Amending Agreement pursuant to its long-term debt arrangement with CCP whereby the 5,750,000 warrants held by CCP were cancelled in conjunction with the waiver of covenant breach for consideration of $1.0 million, which was paid in 4,545,454 common shares of Claude. At March 28, 2014, there were no common share purchase warrants outstanding.
Deferred Share Units
The Company offers a Deferred Share Unit (“DSU”) plan to non-employee Directors. A DSU is a notional unit that reflects the market value of a single common share of Claude. A portion of each Director’s annual retainer is paid in DSUs. Each DSU fully vests upon award and are redeemable for cash upon a director leaving the Company’s Board of Directors. The redemption amount will be based upon the weighted average of the closing prices of the common shares of Claude on the TSX for the last 20 trading days prior to the redemption date multiplied by the number of DSUs held by the Director.
During 2013, the Company granted 1,296,295 DSUs to participating Directors (2012 – 283,791). At December 31, 2013, total DSUs held by participating Directors was 1,580,086 (December 31, 2012 – 283,791).
2013 Annual Management’s Discussion and Analysis
(in thousands of CDN dollars, except as otherwise noted) |
Page 41 |
Footnotes
| (1) | See description and reconciliation of non-IFRS measures in the “Non-IFRS Financial Measures and Reconciliations” section of this MD&A. |
| (2) | See description and reconciliation of this performance measure in the “Other Performance Measures and Reconciliations” section of this MD&A. |
Non-IFRS Financial Measures and Reconciliations
The Company utilizes non-IFRS financial measures as supplemental indicators of operating performance and financial position. These non-IFRS financial measures are used internally by the Company for comparing actual results from one period to another. The Company believes that, in addition to conventional measures prepared in accordance with IFRS, certain investors use this information to evaluate the Company’s performance and ability to generate cash flow. Accordingly, such information is intended to provide additional information and should not be considered in isolation or as a substitute for measures of performance prepared in accordance with IFRS.
Adjusted Net Profit
Adjusted net profit is a measure that does not have a standardized meaning or a consistent basis of calculation under IFRS (non-IFRS measure). The Company uses this measure (which represents the Company’s net profit (loss) calculated under IFRS adjusted for deferred income tax (recovery) expense and non-recurring items such as impairment charges and loss on investments), in addition to conventional measures prepared in accordance with IFRS, as a more meaningful way to compare the Company’s financial performance from period to period. Furthermore, Management believes that certain investors and other stakeholders use this information to evaluate the Company’s performance.
Adjusted net profit is non-standard supplemental information and should not be considered in isolation or as a substitute for financial information prepared according to accounting standards. Other companies may calculate this measure differently, so you may not be able to make a direct comparison to similar measures presented by other companies. Investors are cautioned that the above measures may not be comparable to similarly titled measures of other companies.
The table below reconciles adjusted net (loss) profit with the Company’s net (loss) profit, as determined under IFRS.
| Table 21: Adjusted Net (loss) Profit | |
| | | 2013 | | | 2012 | |
| | | | | | | |
| Net (loss) profit | | $ | (73,423 | ) | | $ | 5,569 | |
| Adjustments: | | | | | | | | |
| Impairment charges | | | 63,835 | | | | - | |
| Loss on investments | | | 262 | | | | 199 | |
| Deferred income tax (recovery) expense | | | (1,420 | ) | | | 2,972 | |
| Adjusted Net (loss) Profit | | $ | (10,746 | ) | | $ | 8,740 | |
| Weighted Average shares outstanding (basic) | | | 175,562 | | | | 172,933 | |
| Weighted Average shares outstanding (diluted) | | | 175,562 | | | | 173,232 | |
| Per share adjusted net (loss) profit (basic and diluted) | | $ | (0.06 | ) | | $ | 0.05 | |
Cash Cost Per Ounce
The Company reports its cash costs on a per-ounce basis, based on uniform standards developed by the Gold Institute, an independent researcher and evaluator of the gold market and gold industry. Management uses this measure to analyze the profitability, compared to average realized gold prices, of the Seabee Gold Operation. Investors are cautioned that the above measures may not be comparable to similarly titled measures of other companies, should these companies not follow Gold Institute standards.
2013 Annual Management’s Discussion and Analysis
(in thousands of CDN dollars, except as otherwise noted) |
Page 42 |
| Table 22: Total Cash Cost per Gold Ounce Sold | |
| December 31 | | 2013 | | | 2012 | | | Change | |
| | | | | | | | | | |
| Production cost (CDN$) | | $ | 44,051 | | | $ | 48,535 | | | | (9 | )% |
| Divided by ounces sold | | | 44,823 | | | | 48,672 | | | | (8 | )% |
| Total cash cost per ounce (CDN$) | | $ | 983 | | | | 997 | | | | (1 | )% |
| | | | | | | | | | | | | |
| CDN$ Exchange Rate | | | 1.0302 | | | | 0.9994 | | | | | |
| Total cash cost per ounce (US$) | | $ | 954 | | | $ | 998 | | | | (4 | )% |
Net Cash Margin
The Company uses net cash margin, which represents realized price per ounce less net cash costs per ounce. This measure is used by Management to analyze profitability trends and to assess the cash-generating capability from the sale of gold on a consolidated basis in each reporting period, expressed on a unit basis. Management believes that this measurement illustrates the performance of the Company’s business on a consolidated basis and enables investors to better understand Claude’s performance in comparison to other gold producers who present results on a similar basis and is an important indicator of expected performance in future periods.
The Company’s net cash margin is intended to provide additional information, does not have any standardized meaning prescribed by IFRS and should not be considered in isolation or as a substitute for measures of performance prepared in accordance with IFRS. This measure is not necessarily indicative of operating profit or cash flow from operations as determined under IFRS. Other companies may calculate net cash margin differently. This non-IFRS measure is calculated from realized gold price per ounce and total cash costs per ounce, as determined in the net cash cost reconciliation. Net cash margin could also be derived from realized price per ounce and net cash costs per ounce.
| Table 23: Net Cash Margin | |
| December 31 | | 2013 | | | 2012 | | | Change | |
| | | | | | | | | | |
| Revenue | | $ | 63,794 | | | $ | 80,808 | | | | (21 | )% |
| Divided by ounces sold | | | 44,823 | | | | 48,672 | | | | (8 | )% |
| Average Realized Price per Ounce (CDN$) | | $ | 1,423 | | | $ | 1,660 | | | | (14 | )% |
| | | | | | | | | | | | | |
| Production costs | | $ | 44,051 | | | $ | 48,535 | | | | (9 | )% |
| Divided by ounces sold | | | 44,823 | | | | 48,672 | | | | (8 | )% |
| Total cash costs per ounce (CDN$) | | $ | 983 | | | $ | 997 | | | | (1 | )% |
| | | | | | | | | | | | | |
| Net Cash Margin per Ounce Sold (CDN$) | | $ | 440 | | | $ | 663 | | | | (34 | )% |
Other Financial Measures and Reconciliations
Cash Flow from Operations before Net Changes in Non-Cash Operating Working Capital
The Company uses Cash Flow from Operations before Net Changes in Non-Cash Operating Working Capital as a supplemental measure of its financial performance. The Company uses this measure to analyze the cash generated by its operations. These measures are not necessarily indicative of operating profit or cash flow from operations as determined under IFRS. Investors are cautioned that the above measures may not be comparable to similarly titled measures of other companies.
2013 Annual Management’s Discussion and Analysis
(in thousands of CDN dollars, except as otherwise noted) |
Page 43 |
| Table 24: Calculation of Cash Flow from Operations before Net Changes in Non-Cash Operating Working Capital | |
| December 31 | | 2013 | | | 2012 | | | Change | |
| | | | | | | | | | |
| Net (loss) profit | | $ | (73,423 | ) | | $ | 5,569 | | | | (1,418 | )% |
| Adjustments for non-cash items: | | | | | | | | | | | | |
| Depreciation and depletion | | | 22,949 | | | | 15,681 | | | | 46 | % |
| Finance expense | | | 522 | | | | 388 | | | | 35 | % |
| Finance and other income | | | (1,214 | ) | | | (1,248 | ) | | | (3 | )% |
| Impairment charges | | | 63,835 | | | | - | | | | - | |
| Loss on investments | | | 262 | | | | 199 | | | | 32 | % |
| Stock-based compensation | | | 2,274 | | | | 2,280 | | | | -% | |
| Deferred income tax (recovery) expense | | | (1,420 | ) | | | 2,972 | | | | (148 | )% |
| | | $ | 13,785 | | | $ | 25,841 | | | | (47 | )% |
| Weighted Average shares outstanding (basic) | | | 175,562 | | | | 172,993 | | | | | |
| Weighted Average shares outstanding (diluted) | | | 175,562 | | | | 173,232 | | | | | |
| Per share cash flows from operating activities (basic and diluted) | | $ | 0.08 | | | $ | 0.15 | | | | (47 | )% |
Reconciliation Principal Balance Owing on Debt
Pursuant to Company policy, closing costs associated with the Company’s long-term debt are netted against the face value of the debt, thereby reducing the carrying value of the Term Loan on the Statement of Financial Position. These costs are amortized using the effective interest rate method over the life of the debt facility.
Claude utilizes adjusted debt, which represents the Company’s total long-term debt obligation, as it is more indicative of how the Company manages its debt levels internally than the IFRS measure. Management believes that this measure is a more meaningful measure for investors and analysts to evaluate the overall debt capacity, liquidity and capital structure of the Company. Adjusted debt is intended to provide additional information, does not have any standardized definition under IFRS and should not be considered in isolation or as a substitute for measures of performance prepared in accordance with IFRS.
To calculate adjusted debt, the Company adjusts its long-term loans and borrowings to exclude the impact of fair value and other adjustments in order to reflect the actual settlement amount (principal balance owing) in relation to the debt instrument.
| Table 25: Principal Balance of Debt | |
| December 31 | | 2013 | | | 2012 | |
| | | | | | | |
| Term loan (amortized cost) | | $ | 23,628 | | | $ | - | |
| Debenture (amortized cost) | | | - | | | | 9,665 | |
| Add: | | | | | | | | |
| Closing costs to be amortized | | | 417 | | | | 86 | |
| Warrant valuation | | | 955 | | | | - | |
| Debt (principal balance owing) | | $ | 25,000 | | | $ | 9,751 | |
Disclosure Controls and Internal Controls over Financial Reporting
Disclosure Controls and Procedures
As at December 31, 2013, we evaluated our disclosure controls and procedures as defined in the rules of the U.S. Securities and Exchange Commission (“SEC”) and the Canadian Securities Administrators. This evaluation was carried out under the supervision and with the participation of Management, including the President and Chief Executive Officer and the Chief Financial Officer. Based on that evaluation, the President and Chief Executive Officer and Chief Financial Officer concluded that the design and operation of these disclosure controls and procedures were not effective due to the material weakness in internal control over financial reporting (“ICFR”) described below.
2013 Annual Management’s Discussion and Analysis
(in thousands of CDN dollars, except as otherwise noted) |
Page 44 |
Internal Control Over Financial Reporting
Management is responsible for establishing and maintaining adequate ICFR. ICFR, no matter how well designed, has inherent limitations and can only provide reasonable assurance with respect to the preparation and fair presentation of published financial statements. Under the supervision and with the participation of the President and Chief Executive Officer and the Chief Financial Officer, management conducted an evaluation of the effectiveness of its internal control over financial reporting based on the criteria set forth in the Internal Control-Integrated Framework (1992) issued by the Committee of Sponsoring Organizations of the Treadway Commission (“COSO”). Based on this assessment, Management has concluded that, as a result of the material weakness in ICFR discussed below, ICFR was not effective as at December 31, 2013.
Management noted that as at December 31, 2013:
| · | Income taxes – there was a lack of review and monitoring controls of the income tax function relating to complex, non-routine transactions and provisions. This control deficiency resulted in the Company recording adjustments to deferred income tax assets, deferred income tax liabilities and deferred income tax expense. This control deficiency relating to complex, non-routine transactions and provisions creates a reasonable possibility that material misstatements of the consolidated financial statements including disclosures will not be prevented or detected on a timely basis as a result. |
Changes in Internal Control Over Financial Reporting
Other than the material weakness identified above, there were no changes in ICFR that occurred during the most recent interim period that has materially affected, or is reasonably likely to materially affect, ICFR.
Management is currently considering the necessary changes required to remediate the material weakness described above.
Limitations of Controls and Procedures
The Company’s Management, including the President and Chief Executive Officer and Vice President and Chief Financial Officer, believes that any disclosure controls and procedures or internal control over financial reporting, no matter how well conceived and operated, can provide only reasonable, not absolute, assurance that the objectives of the control system are met. Further, the design of a control system must reflect the fact that there are resource constraints, and the benefits of controls must be considered relative to their costs. Because of the inherent limitations in all control systems, they cannot provide absolute assurance that all control issues and instances of fraud, if any, within the Company have been prevented or detected. These inherent limitations include the realities that judgments in decision-making can be faulty, and that breakdowns can occur because of simple error or mistake. Additionally, controls can be circumvented by the individual acts of some persons, by collusion of two or more people, or by unauthorized override of the control. The design of any control system also is based in part upon certain assumptions about the likelihood of future events, and there can be no assurance that any design will succeed in achieving its stated goals under all potential future conditions. Accordingly, because of the inherent limitations in a cost effective control system, misstatements due to error or fraud may occur and not be detected.
2013 Annual Management’s Discussion and Analysis
(in thousands of CDN dollars, except as otherwise noted) |
Page 45 |
Cautionary Note to U.S. Investors Concerning Resource Estimates
Resource Estimates
The resource estimates in this Management’s Discussion and Analysis were prepared in accordance with National Instrument 43-101, adopted by the Canadian Securities Administrators. The requirements of National Instrument 43-101 differ significantly from the requirements of the SEC. In this Management’s Discussion and Analysis, the Company uses certain terms such as “measured”, “indicated” and “inferred” resources. Although these terms are recognized and required in Canada, the SEC does not recognize them. The SEC permits U.S. mining companies, in their filings with the SEC, to disclose only those mineral deposits that constitute “reserves”. Under U.S. standards, mineralization may not be classified as a reserve unless the determination has been made that the mineralization could be economically and legally extracted at the time the determination is made. U.S. investors should not assume that all or any portion of a measured or indicated resource will ever be converted into “reserves”. Further, “inferred resources” have a great amount of uncertainty as to their existence and whether they can be mined economically or legally, and U.S. investors should not assume that “inferred resources” exist or can be legally or economically mined, or that they will ever be upgraded to a more certain category.
Compliance with Canadian Securities Regulations
This annual report is intended to comply with the requirements of the Toronto Stock Exchange and applicable Canadian securities legislation, which differ in certain respects from the rules and regulations promulgated under the United States Securities Exchange Act of 1934, as amended (“Exchange Act”), as promulgated by the SEC.
U.S. investors are urged to consider the disclosure in our Annual Report on Form 20-F, File No. 001-31956, which will be filed with the SEC under the Exchange Act, which may be obtained from the Company (without cost) or from the SEC’s Web site:http://sec.gov/edgar.shtml.
Caution Regarding Forward-Looking Information
All statements, other than statements of historical fact, contained or incorporated by reference in this MD&A constitute “forward-looking information” within the meaning of applicable Canadian securities laws and “forward-looking statements” within the meaning of the United States Private Securities Litigation Reform Act of 1995 (referred to herein as “forward-looking statements”). Forward-looking statements include, but are not limited to, statements with respect to the future price of gold, the estimation of mineral reserves and resources, the realization of mineral reserve estimates, the timing and amount of estimated future production, costs of production, capital expenditures, costs and timing of the development of new deposits, success of exploration activities, permitting time lines, currency exchange rate fluctuations, requirements for additional capital, government regulation of mining operations, environmental risks, unanticipated reclamation expenses, title disputes or claims and limitations on insurance coverage. Generally, these forward-looking statements can be identified by the use of forward-looking terminology such as “plans”, “expects” or “does not expect”, “is expected”, “budget”, “scheduled”, “estimates”, “forecasts”, “intends”, “anticipates” or “does not anticipate” or “believes”, or the negative connotation thereof or variations of such words and phrases or state that certain actions, events or results, “may”, “could”, “would”, “might” or “will be taken”, “occur” or “be achieved” or the negative connotation thereof.
All forward-looking statements are based on various assumptions, including, without limitation, the expectations and beliefs of management, the assumed long-term price of gold, that the Company will receive required permits and access to surface rights, that the Company can access financing, appropriate equipment and sufficient labour, and that the political environment within Canada will continue to support the development of mining projects in Canada.
2013 Annual Management’s Discussion and Analysis
(in thousands of CDN dollars, except as otherwise noted) |
Page 46 |
Forward-looking statements are subject to known and unknown risks, uncertainties and other factors that may cause the actual results, level of activity, performance or achievements of Claude to be materially different from those expressed or implied by such forward-looking statements, including but not limited to: actual results of current exploration activities; environmental risks; future prices of gold; possible variations in ore reserves, grade or recovery rates; mine development and operating risks; accidents, labour issues and other risks of the mining industry; delays in obtaining government approvals or financing or in the completion of development or construction activities; and other risks and uncertainties, including but not limited to those discussed in the section entitled “Business Risk” in this MD&A. These risks and uncertainties are not, and should not be construed as being, exhaustive.
Although Claude has attempted to identify important factors that could cause actual results to differ materially from those contained in forward-looking statements, there may be other factors that cause results not to be as anticipated, estimated or intended. There can be no assurance that such statements will prove to be accurate, as actual results and future events could differ materially from those anticipated in such statements. Accordingly, readers should not place undue reliance on forward-looking statements.
Forward-looking statements in this MD&A are made as of the date of this MD&A, being March 28, 2014 and, accordingly, are subject to change after such date. Except as otherwise indicated by Claude, these statements do not reflect the potential impact of any non-recurring or other special items that may occur after the date hereof. Forward-looking statements are provided for the purpose of providing information about management’s current expectations and plans and allowing investors and others to get a better understanding of our operating environment.
Claude does not undertake to update any forward-looking statements that are incorporated by reference herein, except in accordance with applicable securities laws.
The forward-looking statements contained in this Management’s Discussion and Analysis are expressly qualified by these cautionary statements.
Additional Information
Additional information related to the Company, including its Annual Information Form, is available on Canadian (www.sedar.com) securities regulatory authorities’ websites. Certain documents are also available on the Company’s website atwww.clauderesources.com.
2013 Annual Management’s Discussion and Analysis
(in thousands of CDN dollars, except as otherwise noted) |
Page 47 |
Conversion Multiples
For ease of reference, the following factors for converting metric measurements into imperial equivalents are provided:
| To Convert from Metric | | To Imperial | | Multiply Metric Units by | |
| Metres | | Feet (ft.) | | | 3.281 | |
| Kilometres (km) | | Miles | | | 0.621 | |
| Tonnes | | Tons (2,000 pounds) | | | 1.102 | |
| Grams | | Troy Ounces | | | 0.032 | |
| Hectares | | Acres | | | 2.471 | |
Glossary of Financial Terms
Current ratio = (current asset / current liabilities)
Debt to capital= (total debt – cash and cash equivalents) / (total debt – cash and cash equivalents + total shareholders’ equity)
Working capital = (current asset – current liabilities)
Glossary of Technical Terms
Alteration –any change in the mineral composition of a rock brought about by physical or chemical means.
Assaying- laboratory examination that determines the content or proportion of a specific metal (i.e.: silver) contained within a sample. Technique usually involves firing/smelting.
Au Eq (“gold equivalent”) –a measure of contained metal expressed in equivalent gold grade.
Biotite – a widely distributed and important rock-forming mineral of the mica group.
Brecciated – broken into sharp-angled fragments surrounded by finer-grained material.
Bulk Sample – a collection of representative mineralized material whose location, geologic character and metal assay content can be determined and then used for metallurgical or geotechnical testing purposes.
Chalcopyrite - a sulphide mineral of copper and iron.
Chlorite – a group of platy, monoclinic, usually greenish minerals.
Chloritic alteration – the replacement by, conversion into, or introduction of chlorite into a rock.
Core Samples- the cylindrical form of rock called “core” that is extracted from a diamond drill hole. Mineralized sections are separated and these samples are sent to a laboratory for analysis.
Cross-cut- a horizontal opening driven from a shaft or haulage drift at an oblique or right angle to the strike of a vein or other orebody.
Cut-off Grade - the lowest grade of mineralized material that qualifies as a reserve in a deposit (i.e.: contributing material of the lowest assay that is included in a reserve estimate).
2013 Annual Management’s Discussion and Analysis
(in thousands of CDN dollars, except as otherwise noted) |
Page 48 |
Diamond Drilling – a type of rotary drilling in which diamond bits are used as the rock-cutting tool to produce a recoverable drill core sample of rock for observation and analysis.
Dip – the angle that a structural surface, a bedding or fault plane makes with the horizontal, measured perpendicular to the strike of the structure.
Drift - a horizontal underground opening that follows along the length of a vein or rock formation.
Duty to Consult - governments in Canada may have a duty to consult with and potentially accommodate Aboriginal groups prior to making decisions which may impact lands and resources subject to established or potential treaty or Aboriginal rights, title or other claims. These governments, in turn, may delegate procedural aspects of this duty to industry.
Exploration– work involved in searching for ore, from prospecting to diamond drilling or driving a drift.
Fault – a fracture or break in rock along which there has been movement.
Feasibility Study – a comprehensive technical and economic study of the selected development option for a mineral project that includes appropriately detailed assessments of realistically assumed mining, processing, metallurgical, economic, marketing, legal, environmental, social and governmental considerations together with any other relevant operational factors and detailed financial analysis, that are necessary to demonstrate at the time of reporting that extraction is reasonably justified (economically mineable). The results of the study may reasonably serve as the basis for a final decision by a proponent or financial institution to proceed with, or finance, the development of the project. The confidence level of the study will be higher than that of a Prefeasibility Study.
Fire Assay - the assaying of metallic minerals by use of a miniature smelting procedure with various agents.
Footwall - the rock on the underside of a vein or ore structure.
Fracture – a break or crack in rock.
Geophysical Survey - a scientific method of prospecting that measures the physical properties of rock formations. Common properties investigated include magnetism, specific gravity, electrical conductivity and radioactivity.
Grade – the metal content of rock with precious metals, grade can be expressed as troy ounces or grams per tonne of rock.
Granitoid – a light-coloured, plutonic rock with quartz between 20 and 60 percent.
Head Grade – the average grade of ore fed into a mill.
Hydrothermal– the products or the actions of heated waters in a rock mass such as a mineral deposit precipitating from a hot solution.
Igneous– a primary type of rock formed by the cooling of molten material.
Indicated Mineral Resource – is that part of a Mineral Resource for which quantity, grade or quality, densities, shape and physical characteristics, can be estimated with a level of confidence sufficient to allow the appropriate application of technical and economic parameters, to support mine planning and evaluation of the economic viability of the deposit. The estimate is based on detailed and reliable exploration and testing information gathered through appropriate techniques from locations such as outcrops, trenches, pits, workings and drill holes that are spaced closely enough for geological and grade continuity to be reasonably assumed.
2013 Annual Management’s Discussion and Analysis
(in thousands of CDN dollars, except as otherwise noted) |
Page 49 |
Inferred Mineral Resource – is that part of a Mineral Resource for which quantity and grade or quality can be estimated on the basis of geological evidence and limited sampling and reasonably assumed, but not verified, geological and grade continuity. The estimate is based on limited information and sampling gathered through appropriate techniques from locations such as outcrops, trenches, pits, workings and drill holes.
Lens - a body of ore that is thick in the middle and tapers towards the ends.
Lithostructural– an assemblage of rocks that is unified on the basis of structural and lithological features.
Mafic - igneous rocks composed mostly of dark, iron and magnesium-rich minerals.
Measured Mineral Resource - is that part of a Mineral Resource for which quantity, grade or quality, densities, shape, and physical characteristics are so well established that they can be estimated with confidence sufficient to allow the appropriate application of technical and economic parameters, to support production planning and evaluation of the economic viability of the deposit. The estimate is based on detailed and reliable exploration, sampling and testing information gathered through appropriate techniques from locations such as outcrops, trenches, pits, workings and drill holes that are spaced closely enough to confirm both geological and grade continuity.
Metallurgy– the study of the extractive processes which produce minerals from their host rocks.
Mill - a processing facility where ore is finely ground and thereafter undergoes physical or chemical treatment to extract the valuable metals.
Mineral– a naturally formed chemical element or compound having a definitive chemical composition and usually a characteristic crystal form.
Mineralization– a natural concentration in rocks or soil of one or more minerals.
Mineral Reserve – the economically mineable part of a Measured or Indicated Mineral Resource demonstrated by at least a Prefeasibility Study. This study must include adequate information on mining, processing, metallurgical, economic and other relevant factors that demonstrate, at the time of reporting, that economic extraction can be justified. A Mineral Reserve includes diluting materials and allowances for losses that may occur when material is mined.
Mineral Resource – a concentration or occurrence of natural, solid, inorganic, or fossilized organic material in or on the Earth’s crust in such form and quantity and of such a grade or quality that it has reasonable prospects for economic extraction. The location, quantity, grade, geological characteristics, and continuity of a Mineral Resource are known, estimated or interpreted from specific geological evidence and knowledge.
National Instrument 43-101 or NI 43-101 – National Instrument 43-101 Standards of Disclosure for Mineral Projects of the Canadian Securities Administrators.
Ounces - troy ounces of a fineness of 999.9 parts per 1,000 parts.
Ore - rock, generally containing metallic or non-metallic minerals, which can be mined and processed at a profit.
Ore Body - a sufficiently large amount of ore that can be mined economically.
Plunge - the vertical angle a linear geological feature makes with the horizontal plane.
Porphyry - any igneous rock in which relatively large crystals are set in a fine-grained groundmass.
2013 Annual Management’s Discussion and Analysis
(in thousands of CDN dollars, except as otherwise noted) |
Page 50 |
Prefeasibility Study – a comprehensive study of the viability of a mineral project that has advanced to a stage where the mining method, in the case of underground mining, or the pit configuration, in the case of an open pit, has been established, and where an effective method of mineral processing has been determined. This study must include a financial analysis based on reasonable assumptions of technical engineering, operating, and economic factors, which are sufficient for a Qualified Person acting reasonably, to determine if all or part of the Mineral Resource may be classified as a Mineral Reserve.
Probable Mineral Reserve – the economically mineable part of an Indicated, and in some circumstances, a Measured Mineral Resource, demonstrated by at least a Prefeasibility Study. This study must include adequate information on mining, processing, metallurgical, economic and other relevant factors that demonstrate, at the time of reporting, that economic extraction can be justified.
Proven Mineral Reserve – the economically mineable part of a Measured Mineral Resource demonstrated by at least a Prefeasibility Study. This study must include adequate information on mining, processing, metallurgical, economic and other relevant factors that demonstrate, at the time of reporting, that economic extraction is justified.
Pulp - a mixture of ground ore and water.
Pyrite - an iron sulphide mineral (FeS2), the most common naturally occurring sulphide mineral.
Pyrrhotite - a bronze-colored, often magnetic iron sulphide mineral.
Qualified Person – an individual who is an engineer or geoscientist with at least five (5) years of experience in mineral exploration, mine development, mine operation, project assessment or any combination of these; has experience relevant to the subject matter of the mineral project and technical report; and is a member in good standing of a professional association.
Quartz – crystalline silica; often forming veins in fractures and faults within older rocks.
Raise -a vertical or inclined underground working that has been excavated from the bottom upward.
Ramp - an inclined underground opening.
Sericite – a fine-grained potassium mica found in various metamorphic rocks.
Shear Zone - a zone in which shearing has occurred on a large scale so that the rock is crushed and brecciated.
Showing - surface occurrence of mineral.
Sill - an intrusive sheet of igneous rock of roughly uniform thickness that has been forced between the bedding planes of existing rock; the initial horizontal drift along the strike of the ore vein.
Specific Gravity - the ratio between the weight of a unit volume of a substance and that of a unit volume of water.
Stope - an underground excavation from which ore has been extracted, either above or below a level. Access to stopes is usually by way of adjacent raises.
Stratigraphy – the sequence of bedded rocks in a particular area.
Tailings - Tailings consist of ground rock and process effluents that are generated in a mine processing plant or mill. Mechanical and chemical processes are used to extract gold from mine ore and produce a waste stream known as tailings. This process of product extraction is never 100 percent efficient, nor is it possible to reclaim all reusable and expended processing reagents and chemicals. The unrecoverable and uneconomic metals, minerals, chemicals, organics and process water are discharged, normally as slurry, to a final storage area commonly known as a Tailings Management Facility (TMF) or Tailings Storage Facility (TSF).
2013 Annual Management’s Discussion and Analysis
(in thousands of CDN dollars, except as otherwise noted) |
Page 51 |
Till - is unsorted glacial sediment. Its content may vary from clays to mixtures of clay, sand, gravel and boulders. This material is typically derived from the subglacial erosion and incorporated by the moving ice of the glaciers of previously available unconsolidated sediments.
Tonne – a metric ton or 2,204 pounds.
Trenching -the process of exploration by which till is removed from a trench cut from the earth’s surface.
Vein– a thin, sheet-like, cross-cutting body of hydrothermal mineralization, principally quartz.
Waste – barren rock in a mine, or mineralized material that is too low in grade to be mined and milled at a profit.
Working interestorWI - means the interest held by Claude in property. This interest normally bears its proportionate share of capital and operating costs as well as royalties or other production burdens. The working interest percentage is expressed before royalty interests.