Exhibit 99.2
Management’s Discussion and Analysis
The following Management’s Discussion and Analysis (“MD&A”) of the consolidated operating and financial performance of Claude Resources Inc. (“Claude” or the “Company”) for the three and nine months ended September 30, 2015 with the corresponding period of 2014 is prepared as of November 4, 2015. This discussion is the responsibility of Management and has been prepared using International Financial Reporting Standards (“IFRS”), as issued by the International Accounting Standards Board. This discussion should be read in conjunction with the Company’s September 30, 2015 condensed consolidated interim financial statements and notes thereto (unaudited) and the Company’s 2014 audited consolidated financial statements and notes thereto. The Board of Directors has approved the disclosure presented herein. All amounts referred to in this discussion are expressed in thousands of Canadian dollars, except where otherwise indicated.
Overview
Claude Resources Inc. is a gold producer with shares listed on both the Toronto Stock Exchange (TSX-CRJ) and OTCQB marketplace (OTCQB – CLGRF). The Company also engages in the exploration and development of gold Mineral Reserves and Mineral Resources.
The Company’s revenue generating asset is the 100 percent owned 47,940 acre (19,400 hectare) Seabee Gold Operation located in northern Saskatchewan which has two operating mines (the Seabee Mine and Santoy Mine Complex), a central milling facility, camp facilities and various regional exploration targets. Claude also owns 100 percent of the 99,800 acre (40,400 hectares) Amisk Gold Project in northeastern Saskatchewan. The Amisk Gold Project is located 20 kilometres southwest of Flin Flon, Manitoba and hosts the Amisk Gold Deposit and a large number of gold occurrences and prospects.
Third Quarter 2015 Highlights
| | | Three Months Ended Sept 30 | | | Nine Months Ended Sept 30 | |
| | | 2015 | | | 2014 | | | Change | | | 2015 | | | 2014 | | | Change | |
| Financial Data | | | | | | | | | | | | | | | | | | | | | | | | |
| Revenue | | $ | 24,549 | | | $ | 24,323 | | | | 1 | % | | $ | 80,471 | | | $ | 64,665 | | | | 24 | % |
| Production costs | | $ | 11,183 | | | $ | 12,021 | | | | (7 | %) | | $ | 33,823 | | | $ | 35,243 | | | | (4 | %) |
| Cash flow from operations(1) (2) | | $ | 11,397 | | | $ | 10,368 | | | | 10 | % | | $ | 36,310 | | | $ | 22,015 | | | | 65 | % |
| Cash flow from operations per share(1) (2) | | $ | 0.06 | | | $ | 0.06 | | | | - | | | $ | 0.19 | | | $ | 0.12 | | | | 58 | % |
| Net earnings | | $ | 5,662 | | | $ | 6,852 | | | | (17 | %) | | $ | 21,029 | | | $ | 5,068 | | | | 315 | % |
| Earnings per share (basic and diluted) | | $ | 0.03 | | | $ | 0.04 | | | | (25 | %) | | $ | 0.11 | | | $ | 0.03 | | | | 267 | % |
| | | | | | | | | | | | | | | | | | | | | | | | | |
| Average realized price (CDN$/oz) | | $ | 1,485 | | | $ | 1,384 | | | | 7 | % | | $ | 1,480 | | | $ | 1,402 | | | | 6 | % |
| Average realized price (U.S.$/oz) | | $ | 1,135 | | | $ | 1,270 | | | | (11 | %) | | $ | 1,174 | | | $ | 1,281 | | | | (8 | %) |
| Cash cost (CDN$/oz)(1) | | $ | 721 | | | $ | 735 | | | | (2 | %) | | $ | 669 | | | $ | 801 | | | | (16 | %) |
| Cash cost (U.S.$/oz)(1) | | $ | 551 | | | $ | 675 | | | | (18 | %) | | $ | 531 | | | $ | 732 | | | | (27 | %) |
| All-in sustaining cost (CDN$/oz)(1) | | $ | 1,089 | | | $ | 1,063 | | | | 2 | % | | $ | 1,129 | | | $ | 1,265 | | | | (11 | %) |
| All-in sustaining cost (U.S.$/oz)(1) | | $ | 832 | | | $ | 976 | | | | (15 | %) | | $ | 896 | | | $ | 1,156 | | | | (22 | %) |
| | | | | | | | | | | | | | | | | | | | | | | | | |
| Operating Data | | | | | | | | | | | | | | | | | | | | | | | | |
| Tonnes Milled | | | 69,388 | | | | 74,930 | | | | (7 | %) | | | 211,418 | | | | 219,046 | | | | (3 | %) |
| Tonnes per Day | | | 754 | | | | 814 | | | | (7 | %) | | | 774 | | | | 802 | | | | (3 | %) |
| Head Grade (grams per tonne) | | | 7.29 | | | | 8.88 | | | | (18 | %) | | | 8.77 | | | | 7.53 | | | | 16 | % |
| Gold Produced (ounces) | | | 15,722 | | | | 20,614 | | | | (24 | %) | | | 57,408 | | | | 50,700 | | | | 13 | % |
| Gold Sold (ounces) | | | 16,528 | | | | 17,578 | | | | (6 | %) | | | 54,388 | | | | 46,133 | | | | 18 | % |
| (1) | See description and reconciliation of non-IFRS measures in the “Non-IFRS Financial Measures and Reconciliations” and “Other Performance Measures and Reconciliations” sections of this MD&A. |
| (2) | Before net changes in non-cash operating working capital. |
| Q3 2015 Management’s Discussion and Analysis | |
| (in thousands of CDN dollars, except as otherwise noted) | Page 2 |
| · | 2015 gold production guidance increased to 70,000 to 75,000 ounces (previously 68,000 to 72,000 ounces) due to the record operating performance of the first nine months of 2015. |
| · | Year to date gold production of 57,408 ounces, a 13 percent increase over the first nine months of 2014 and a new nine month record. |
| · | Cash and bullion increased by $6.1 million to $27.0 million during the third quarter. |
| · | Secured a three year $25.0 million credit facility with Scotiabank to replace the Term loan managed by Crown Capital Partners Inc. (“CCP”), decreasing the Company’s current cost of debt from 10 percent to approximately 4.8 percent. |
| · | Santoy Gap Deposit ramp up ahead of schedule, achieving an average mill throughput of 584 tonnes per day (77 percent of mill throughput) during the third quarter. |
| · | Successful drilling results from Santoy Gap indicating extensions and growth up dip and down dip of current resources and initiated 6,000 metre deep drill program at Santoy Mine Complex. |
Outlook
Operating and Financial Outlook
Based on continued strong operating performance at the Seabee Gold Operation during the first nine months of 2015, the Company has increased its 2015 production forecast to 70,000 to 75,000 ounces of gold (previously 68,000 to 72,000 ounces of gold). Due to this increased production forecast, total unit cash and all-in sustaining costs are estimated to be six percent and three percent lower than previous guidance.
| | | Revised 2015
Forecast | | Previous 2015
Forecast | | Variance
(oz)(3) | | Variance
(%)(3) |
| Gold production | | 70,000 to 75,000 | | 68,000 to 72,000 | | 2,500 | | 4% |
| Total cash cost per ounce | | $685 to $750 | | $730 to $800 | | ($48) | | (6%) |
| Total cash cost per ounce (U.S.$)(4) | | $535 to $600 | | $580 to $635 | | ($40) | | (7%) |
| All-in sustaining cost per ounce | | $1,065 to $1,175 | | $1,100 to $1,200 | | ($30) | | (3%) |
| All-in sustaining cost per ounce (U.S.$)(4) | | $830 to $920 | | $875 to $950 | | ($38) | | (4%) |
| (3) | At mid-point of guidance. |
| (4) | Forecast uses a foreign exchange rate assumption of $1.28 CDN$/U.S.$. |
At the Seabee Gold Operation, Claude is focused on improving profit margins and executing its mine plan. Profit margins have been increased by developing deposits of higher grades and margins (L62, Santoy Gap), with continued focus on cost control. The Company is also continuing with its review of operating processes and procedures to identify and implement efficiencies designed to increase production and lower operating costs.The Santoy Gap deposit (part of the Santoy Mine Complex) is expected to continue to decrease production risk with the addition of multiple long-hole mining fronts. The Santoy Gap deposit is significant within the Seabee Gold Operation as it contains approximately 2,000 ounces of gold per vertical metre, whereas the Company has historically mined approximately 1,000 ounces of gold per vertical metre at the Seabee Mine. Santoy Gap’s endowment, in addition to its proximity to permitted mine infrastructure, low development cost and near-term production potential, provides the opportunity to displace low margin ounces, increase production and optimize the Company’s mine plan for improved margins and cash flow. The Company expects to continue to build cash reserves to further development opportunities at the Seabee Gold Operation, service debt and fund the Company’s annual Winter Ice Road resupply requirements.
Capital Outlook
During 2015, capital expenditures will be $22.0 million and will be funded from operating cash flows generated during 2015. This five percent reduction from 2014 expenditures is due to reduced underground development costs attributable to the transition to the Alimak mining method at the L62 Deposit and the lower development capital development requirements of the Santoy Gap Deposit.
| Q3 2015 Management’s Discussion and Analysis | |
| (in thousands of CDN dollars, except as otherwise noted) | Page 3 |
| Capital Expenditures |
| | | 2015
Forecast | | | 2015 9 months
Actual | | | 2014
9 months
Actual | | | 2014
Full Year
Actual | |
| Capital Development ($ millions) | | $ | 15.0 | | | $ | 12.3 | | | $ | 12.5 | | | $ | 17.0 | |
| Property, Plant and Equipment ($ millions) | | | 7.0 | | | | 5.7 | | | | 3.3 | | | | 5.0 | |
| | | $ | 22.0 | | | $ | 18.0 | | | $ | 15.8 | | | $ | 22.0 | |
Development expenditures continue to be prioritized at Santoy Gap. To date, the Company has completed three mining fronts; this should drive increased production and stope availability and reduce production risk. Ramp and sill development are currently ahead of plan. Infrastructure upgrades are ongoing to achieve a scheduled ramp up of 600 to 700 tonnes per day in 2016. Capital requirements to fund this and production growth are minimal and will be funded with internal cash flow. Forecast property, plant and equipment costs, which include expenditures on equipment replacement and tailings management facilities, have increased by approximately $0.9 million from original guidance as a result of an expanded scope of work on the East Lake and Triangle Lake Tailings Facilities.
Exploration, Mineral Reserves and Mineral Resources Outlook
Exploration spending during 2015 is forecast to be approximately $0.7 million (2014 - $0.2 million). Surface drilling of 4,000 metres has been completed and underground drilling of approximately 16,000 metres (Seabee: 10,000 metres; Santoy: 6,000 metres) is ongoing and will test various priority targets. One of the key targets will be to follow-up on the result from drill hole JOY-13-692, an exploration intercept from 2013 that graded 18.80 grams per tonne over 13.86 metres (including 30.08 (uncut) or 22.89 (cut) grams per tonne over 5.90 metres). To support this follow-up, a drill chamber has been completed in the hanging wall at Santoy 8 and drilling has commenced. This program is of particular significance as drill testing of the continuity between the Santoy Gap and Santoy 8 deposits is limited and the inferred resources remain open along strike, down dip and down plunge.
During 2015, approximately 65,000 metres (Seabee Mine – 30,000 metres; Santoy Mine Complex – 35,000 metres) of underground infill and definition drilling will focus on targets that have the potential to materially impact near-term production, positively impact the Company’s Mineral Reserves and Mineral Resources and optimize mine design at the Santoy Gap. The deepest hole to date at Santoy Gap returned 43.28 (uncut) or 30.54 (cut) grams of gold per sonne over 1.15 metres true width at 675 metres below surface (Please see Claude news release “Claude Provides Exploration Update and Initiates Deep Drill Program at the Santoy Mine Complex” dated October 19, 2015). At the Seabee Mine, underground drilling will target the very prospective near-mine environment which is under-explored and cost effective to test.
Corporate Outlook
Claude will continue to:
| i) | Seek improvements in all areas of safety, health and the environment in operations; |
| ii) | Focus on cost containment, improving margins and sustaining a production profile of approximately 70,000 ounces of gold per year at the Seabee Gold Operation; |
| iii) | Reduce debt and strengthen the Balance Sheet; and |
| iv) | Sustain or increase Mineral Reserves and Mineral Resources at the Seabee Gold Operation through targeted exploration and development. |
| Q3 2015 Management’s Discussion and Analysis | |
| (in thousands of CDN dollars, except as otherwise noted) | Page 4 |
Mining Operation Results
Seabee Gold Operation
Production Statistics |
| | | Three Months Ended Sept 30 | | | Nine Months Ended Sept 30 | |
| | | 2015 | | | 2014 | | | Change | | | 2015 | | | 2014 | | | Change | |
| | | | | | | | | | | | | | | | | | | |
| Santoy Mine Complex | | | | | | | | | | | | | | | | | | | | | | | | |
| Tonnes milled | | | 53,747 | | | | 33,221 | | | | 62 | % | | | 134,361 | | | | 88,005 | | | | 53 | % |
| Tonnes per day | | | 584 | | | | 361 | | | | 62 | % | | | 492 | | | | 322 | | | | 53 | % |
| Head grade (grams per tonne) | | | 6.92 | | | | 6.75 | | | | 3 | % | | | 7.96 | | | | 5.45 | | | | 46 | % |
| Ounces produced | | | 11,575 | | | | 6,957 | | | | 66 | % | | | 33,160 | | | | 14,758 | | | | 125 | % |
| | | | | | | | | | | | | | | | | | | | | | | | | |
| Seabee Mine | | | | | | | | | | | | | | | | | | | | | | | | |
| Tonnes milled | | | 15,641 | | | | 41,709 | | | | (62 | %) | | | 77,057 | | | | 131,041 | | | | (41 | %) |
| Tonnes per day | | | 170 | | | | 453 | | | | (62 | %) | | | 282 | | | | 480 | | | | (41 | %) |
| Head grade (grams per tonne) | | | 8.56 | | | | 10.57 | | | | (19 | %) | | | 10.18 | | | | 8.93 | | | | 14 | % |
| Ounces produced | | | 4,147 | | | | 13,657 | | | | (70 | %) | | | 24,248 | | | | 35,942 | | | | (33 | %) |
| | | | | | | | | | | | | | | | | | | | | | | | | |
| Total tonnes milled | | | 69,388 | | | | 74,930 | | | | (7 | %) | | | 211,418 | | | | 219,046 | | | | (3 | %) |
| Average head grade (grams per tonne) | | | 7.29 | | | | 8.88 | | | | (18 | %) | | | 8.77 | | | | 7.53 | | | | 16 | % |
| Recovery (%) | | | 96.7 | % | | | 96.4 | % | | | - | | | | 96.3 | % | | | 95.6 | % | | | 1 | % |
| Total gold produced (ounces) | | | 15,722 | | | | 20,614 | | | | (24 | %) | | | 57,408 | | | | 50,700 | | | | 13 | % |
| Total gold sold (ounces) | | | 16,528 | | | | 17,578 | | | | (6 | %) | | | 54,388 | | | | 46,133 | | | | 18 | % |
Third quarter gold production of 15,722 ounces was 24 percent lower period over period; this was attributable to lower mill throughput attributable to the loss of approximately 10 days of underground mine production due to local forest fires and lower ore grades (which averaged 7.29 grams of gold per tonne), offset by improved recovery rates of 96.7 percent. Year to date, total gold production of 57,408 ounces was a new nine month production record; these strong production results were driven by a 16 percent increase in grade which was attributable to positive reconciliation on grade compared to mine plan and ounces from both the L62 and Santoy Gap deposits. The Santoy Gap deposit has continued to advance ahead of schedule by averaging 584 tonnes per day for the quarter and 492 tonnes per day for the year. During the remainder of 2015, mill throughput is expected to average approximately 800 tonnes per day while grades are expected to reflect Q3 actuals.
Santoy Mine Complex
During the third quarter of 2015, the Santoy Mine Complex produced 11,575 ounces of gold (Q3 2014 – 6,957 ounces) from the Santoy Gap deposit; year to date, 33,160 ounces were produced (YTD 2014 – 14,758 ounces). Period over period, the increase in ounces produced is attributable to a three percent increase in grade and a 62 percent increase in tonnage throughput. Year to date, this increase is attributable to a 46 percent increase in grade, a 53 percent increase in tonnes milled and a mine schedule which focused on the Santoy Gap deposit. Production has reconciled above the Mineral Reserve and Mineral Resource on ounces and below it on tonnage.
During the remainder of 2015, the Company will continue to move from one mining front to three, driving increased production and stope availability while reducing production risk. Ramp-up at the Santoy Gap deposit is ahead of schedule, achieving an average mill throughput of 584 tonnes per day or 77 percent of total mill throughput during the third quarter.
Updates on components of the Santoy Gap mine plan (with a focus on mine design, ventilation and future power requirements) have continued during 2015. Infrastructure upgrades are ongoing to further increase the production rate to 600 to 700 tonnes per day in 2016. Capital expenditures required to achieve future production objectives are expected to be funded through internal cash flows.
| Q3 2015 Management’s Discussion and Analysis | |
| (in thousands of CDN dollars, except as otherwise noted) | Page 5 |
Seabee Mine
During the third quarter of 2015, the Seabee Mine produced 4,147 ounces of gold (Q3 2014 – 13,657 ounces of gold). Period over period, the decrease in ounces produced from the Seabee Mine was attributable to a 19 percent decrease in grade and a 62 percent decrease in tonnes milled, a result of planned mine sequencing.
Year to date, production of 24,248 ounces of gold (YTD 2014 – 35,942 ounces of gold) at the Seabee Mine was attributable to a 14 percent increase in grade offset by 41 percent decrease in tonnes. The key driver of the improved grade has been the increased contribution from the L62 where there has been a positive reconciliation on grade and ounces. For the remainder of 2015, the average head grade is expected to reconcile higher than mineral reserve grades.
Capital Projects
Tailings Facility
The Company has continued with upgrades to its tailings facilities to ensure adequate storage capacity and treatment of mill effluent. When completed in 2016, this facility will be permitted up to 463 metre elevation and will have the capacity to store mill tailings from the Seabee Mill until approximately 2021. The Company is in the process of planning tailings capacity expansion beyond 2021.
Financial Results of Operations
Net Earnings
For the three months ended September 30, 2015, net earnings of $5.7 million ($0.03 per share) were $1.2 million lower than net earnings of $6.9 million ($0.04 per share) for the same period in 2014. Period over period, earnings were impacted by fewer ounces produced and sold, offset by higher Canadian dollar realized gold prices. In addition, earnings were also impacted by expensing $0.8 million of unamortized debt issue costs due to the early retirement of the Term loan held by CCP. In Q3 2014, earnings were positively impacted by a $1.0 million gain on sale of certain securities.
Year to date, net earnings of $21.0 million ($0.11 per share) were a $15.9 million improvement over net earnings of $5.1 million ($0.03 per share) reported for the first nine months of 2014. Year to date, the weakening of the $CDN / U.S. exchange rate, which has resulted in higher Canadian gold prices, has had a positive $10.6 million impact on earnings and cash flow.
Revenue
Gold revenue for the three months ended September 30, 2015 was relatively unchanged period over period. For the quarter, the seven percent increase in Canadian dollar gold prices realized per ounce (Q3 2015 – $1,485 (U.S. $1,135); Q3 2014 – $1,384 (U.S. $1,270)) was offset by a six percent decrease in gold sales volume (Q3 2015 – 16,528 ounces; Q3 2014 – 17,578 ounces).
Year to date, gold revenue increased 24 percent to $80.5 million from the $64.7 million reported in the first nine months of 2014. This increase was attributable to a sales volume increase of 18 percent (YTD 2015 – 54,388 ounces; YTD 2014 – 46,133 ounces) and a six percent increase in Canadian dollar gold prices realized per ounce (YTD 2015 - $1,480 (U.S. $1,174); YTD 2014 - $1,402 (U.S. $1,281)) aided by a weakening Canadian dollar (YTD 2015 - CDN$/U.S.$ Exchange 1.2598; YTD 2014 - CDN$/U.S.$ Exchange 1.0943). Year to date, the weakening $CDN / U.S. Exchange rate had a positive $10.6 million impact on earnings and cash flow.
| Q3 2015 Management’s Discussion and Analysis | |
| (in thousands of CDN dollars, except as otherwise noted) | Page 6 |
Production Costs
For the three months ended September 30, 2015, mine production costs of $11.2 million (Q3 2014 - $12.0 million) decreased seven percent period over period. For the third quarter of 2015, total cash cost per ounce of gold sold of $721 (U.S. $551), inclusive of the Net Smelter Return (“NSR”) Royalty costs, decreased two percent from the comparable period in 2014 (Q3 2014 - $735 (U.S. $675)) due primarily to increased sales volumes.
Year to date, mine production costs were $33.8 million (YTD 2014 - $35.2 million), a four percent improvement. Total cash cost per ounce of $669 (U.S. $531) for the first nine months of 2015 was 16 percent lower than the cash cost per ounce of $801 (U.S. $732) reported during the first nine months of 2014. Notwithstanding a three percent decrease in tonnage throughput, these results are attributable to an 18 percent increase in the number of ounces of gold sold, a reflection of the higher grade ore throughput from the Santoy Gap and L62 deposits and better than budgeted dilution rates from effective ground support on the L62 deposit.
All-in sustaining costs during the third quarter of 2015 were $18.0 million, or $1,089 (U.S. $832) per ounce of gold sold (Q3 2014 - $18.7 million, or $1,063 (U.S. $976) per ounce). During the first nine months of 2015, all-in sustaining costs were $61.4 million, or $1,129 (U.S. $896) per ounce of gold sold (YTD 2014 - $58.4 million, or $1,265 (U.S. $1,156) per ounce of gold sold). All-in sustaining costs have benefitted from similar drivers to cash costs noted above along with lower development costs associated with the Alimak mining method.
Production Royalty
Production at the Seabee Gold Operation is subject to a three percent NSR Royalty. For the three months ended September 30, 2015, royalties incurred were $0.7 million (Q3 2014 - $0.9 million). Period over period, this decrease is attributable to six percent fewer ounces sold. Year to date, the NSR Royalty was $2.6 million (YTD 2014 - $1.7 million); this increase is attributable to 18 percent more ounces sold and to the NSR Royalty only being in effect since March of 2014.
Depreciation and Depletion
For the three months ended September 30, 2015, depreciation and depletion of $4.9 million was up seven percent period over period (Q3 2014 - $4.6 million); this result was attributable to an increase in broken tonnes, an increase in the Seabee Gold Operation’s asset base and offset by a decrease in the Seabee Gold Operation’s reserve base. Year to date, depreciation and depletion was $13.5 million, a 20 percent decrease from the $16.8 million reported for the first nine months of 2014.
Year to date, these results are attributable to a decrease in broken tonnes as well as an increase in the Seabee Gold Operation’s reserve base, which were offset by an increase in the Seabee Gold Operation’s asset base.
General and Administrative Expense
General and administrative expense of $1.2 million for the three months ended September 30, 2015 was consistent with the comparable period in 2014. Year to date, General and administrative expenses of $6.0 million were 15 percent higher than those reported for the first nine months of 2014. Year to date, these variances are attributable to increased compensation costs associated with deferred and restricted share units and increased stock-based compensation costs.
| General and Administrative Expense |
| | | Three Months Ended Sept 30 | | | Nine Months Ended Sept 30 | |
| | | 2015 | | | 2014 | | | 2015 | | | 2014 | |
| | | | | | | | | | | | | |
| Direct administration | | $ | 984 | | | $ | 980 | | | $ | 3,248 | | | $ | 3,858 | |
| Stock-based compensation | | | 238 | | | | 153 | | | | 1,017 | | | | 438 | |
| Deferred share unit plan | | | (85 | ) | | | 99 | | | | 1,381 | | | | 803 | |
| Restricted share unit plan | | | 16 | | | | 26 | | | | 341 | | | | 102 | |
| Total General and Administrative | | $ | 1,153 | | | $ | 1,258 | | | $ | 5,987 | | | $ | 5,201 | |
| Q3 2015 Management’s Discussion and Analysis | |
| (in thousands of CDN dollars, except as otherwise noted) | Page 7 |
Finance Expense
Finance expense includes interest expense, accretion expense and derivative losses, if any. For the three months ended September 30, 2015, Finance expense was $1.6 million (Q3 2014 - $0.8 million). Period over period, this increase was attributable to the expensing of unamortized debt costs (in conjunction with the retirement of the Term Loan with Crown Capital Partners Inc. (“CCP”)) and due to higher derivative losses. Year to date, finance expense was $5.8 million (YTD 2014 – $4.0 million); this increase is attributable to higher derivative losses which were somewhat offset by lower interest expense. Also in 2014, the Company incurred $0.8 million of expense related to the value of the shares issued as payment for a waiver granted by CCP in connection with a credit agreement.
Finance and Other Income
Finance and other income consists of interest income, production royalties pursuant to the Red Mile Royalty transactions, derivative gains and other miscellaneous income, if any. For the three months ended September 30, 2015, finance and other income was $0.7 million (Q3 2015 - $1.1 million); this result is attributable to decreased derivative gains period over period. Year to date, finance and other income of $2.7 million was consistent with the comparable period of 2014.
Loss (Gain) on Investments
The Company has an equity portfolio of publicly listed companies that are classified as available-for-sale on the Statements of Financial Position. Year to date, the loss of $0.4 million was attributable to the write-down of certain of the Company’s available-for sale securities which had a fair value below cost and had shown objective evidence of impairment. During the first nine months of 2014, the $1.3 million gain was attributable to the disposition of certain securities.
Liquidity and Capital Resources
At September 30, 2015, cash and cash equivalents of $24.5 million (December 31, 2014 - $11.2 million) and bullion (valued at market) of $2.5 million exceeded the principal balance owing of $20.3 million on the Company’s Senior Secured Credit Facility with Scotiabank.At September 30, 2015, working capital was $37.9 million (December 31, 2014-$23.9 million) with negative net debt of $4.2 million (December 31, 2014 - net debt of $11.4 million). Management believes that operating cash flows (at current gold prices and forecast production) will be sufficient to further development opportunities at the Seabee Gold Operation, service debt and fund the 2016 Winter Ice Road resupply requirements.
| | | Three Months Ended Sept 30 | | | Nine Months Ended Sept 30 | |
| | | 2015 | | | 2014 | | | 2015 | | | 2014 | |
| | | | | | | | | | | | | |
| Cash flow provided by (used in): | | | | | | | | | | | | | | | | |
| Operating activities | | $ | 13,855 | | | $ | 20,778 | | | $ | 34,671 | | | $ | 18,645 | |
| Investment activities | | | (4,873 | ) | | | (1,939 | ) | | | (19,171 | ) | | | 9,682 | |
| Financing activities | | | (1,305 | ) | | | (2,615 | ) | | | (2,207 | ) | | | (9,030 | ) |
| Increase in cash | | | 7,677 | | | | 16,224 | | | | 13,293 | | | | 19,297 | |
| Decrease in cash related to assets held for sale | | | - | | | | - | | | | - | | | | (88 | ) |
| Cash (bank indebtedness), beginning of period | | $ | 16,788 | | | $ | (5,638 | ) | | $ | 11,172 | | | $ | (8,623 | ) |
| Cash, end of period | | $ | 24,465 | | | $ | 10,586 | | | $ | 24,465 | | | $ | 10,586 | |
Operating Activities
Operating cash flow is the Company’s primary source of liquidity. During the first nine months of 2015, the Company’s cash flow from operations before net changes in non-cash operating working capital was $36.3 million, or $0.19 per share (YTD Q3 2014 - $22.0 million, or $0.12 per share). Cash provided by operating activities was $34.7 million, a $16.1 million increase compared to the first nine months of 2014; this was due to improved net earnings, a result of increased gold revenue which were higher due to improved gold prices and grade. Whether favorable or unfavorable, future changes in the Canadian dollar price of gold will continue to have a material impact on the cash flow and liquidity of the Company. If necessary, the Company may enhance its liquidity and supplement operating cash flow through a combination of equity issuances, securing debt financing and sale of non-core assets. The principal use of operating cash flow is to fund the Company’s: operating and capital expenditures at the Seabee Gold Operation; general and administrative costs; and debt service payments.
| Q3 2015 Management’s Discussion and Analysis | |
| (in thousands of CDN dollars, except as otherwise noted) | Page 8 |
Investing Activities
Cash used in investing activities was $19.2 million for the nine months ended September 30, 2015. Expenditures were comprised of: underground development of $12.3 million; property, plant and equipment additions of $5.7 million; exploration of $0.9 million; and reclamation deposits of $0.3 million. Property, plant and equipment additions include mining equipment, camp infrastructure and tailings management facility expansion. This compares to cash provided by investing activities of $9.7 million for the nine months ended September 30, 2014 which included the proceeds from the sale of an NSR Royalty, the sale of the Madsen Property, the sale of certain investments and the redemption of certain reclamation deposits (collectively providing $25.8 million); these were offset by Mineral property expenditures of $16.1 million during the first nine months of 2014.
Financing Activities
The Company’s financing activities during the first nine months of 2015 included proceeds of $0.9 million received from the issuance of common shares pursuant to the Company’s Employee Share Purchase Program (“ESPP”) and Stock Option Plan. This was offset by $3.1 million of Term loan principal repayments, resulting in a net financing cash outflow of $2.2 million. This compares to a net financing cash outflow of $9.0 million during the first nine months of 2014, which consisted of $0.7 million in funding received from the Company’s ESPP offset by $9.7 million of debt and capital lease repayments.
Liquidity
The Company has sufficient cash on hand to meet its current financial obligations as they come due. Liquidity is primarily influenced by the operational performance of its Seabee Gold Operation, the level of spending on exploration, development and capital programs, the ability to obtain external sources of financing, and movements in the price of gold.
The Company monitors its liquidity on a continuous basis to ensure there is sufficient capital to meet business requirements and to provide adequate returns to shareholders and benefits to other stakeholders. The Company manages the capital structure and makes adjustments to it in light of changes in economic conditions and the risk characteristics of the underlying assets. In order to maintain or adjust the capital structure, the Company may, where necessary, control the amount of working capital, pursue financing, manage the timing of it capital and exploration expenditures, or sell assets. The Company is not subject to externally imposed capital requirements.
The Company’s typical cash requirement over the first and second quarters of each year is significant because of the Seabee Gold Operation’s Winter Ice Road resupply, which includes restocking diesel, propane and other large consumables as well as the continued investment in maintenance and growth capital relating to the mining fleet and mine infrastructure.
The Company’s capital structure is comprised of a combination of debt and shareholders’ equity.
| Schedule of Capital Structure of the Company |
| | | Sept 30 | | | Dec 31 | | | Sept 30 | |
| | | 2015 | | | 2014 | | | 2014 | |
| | | | | | | | | | |
| Debt * | | $ | 19,499 | | | $ | 21,581 | | | $ | 22,399 | |
| Shareholders’ equity | | | 152,043 | | | | 129,425 | | | | 130,018 | |
| Debt to equity | | | 13 | % | | | 17 | % | | | 17 | % |
| Q3 2015 Management’s Discussion and Analysis | |
| (in thousands of CDN dollars, except as otherwise noted) | Page 9 |
*For accounting purposes, closing costs associated with the Company’s Senior Secured Credit Facility were netted against the principal balance owing, thereby reducing the carrying value of the Company’s debt on the Statements of Financial Position. The amount presented in the above table is the amortized cost of the balance owing. At September 30, 2015, the principal balance owing on the Company’s Senior Secured Credit Facility was $20.3 million (December 31, 2014 - Term Loan of $22.6 million). A reconciliation between the principal balance owing and the amortized cost (carrying amount) presented on the Company’s Statements of Financial Position is included in the “Other Financial Measures and Reconciliations” section of this MD&A.
Financial and Other Instruments
In the normal course of its operations, the Company is exposed to gold price, foreign exchange, interest rate, liquidity, equity price and counterparty risks. The overall financial risk management program focuses on preservation of capital and protecting current and future Company assets and cash flows by reducing exposure to risks posed by the uncertainties and volatilities of financial markets. The Company’s management of financial risks is aimed at ensuring that net cash flows are sufficient to meet all its financial commitments as and when they fall due and to maintain the capacity to fund its forecast project development and exploration strategies. A more detailed discussion on the financial instrument risk exposure is reported in the Management’s Discussion and Analysis for the year ended December 31, 2014.
The value of the Company’s mineral resources is related to the price of gold and the outlook for this mineral. Gold and precious metal prices historically have fluctuated widely and are affected by numerous factors outside of the Company’s control, including, but not limited to, industrial and retail demand, central bank lending, forward sales by producers and speculators, levels of worldwide production, short-term changes in supply and demand because of speculative hedging activities and certain other factors related specifically to gold. The profitability of the Company’s operations is highly correlated to the market price of gold. If the gold price declines below the cost of production at the Company’s operations, for a prolonged period of time, it may not be economically feasible to continue production.
The Company’s revenues from the production and sale of gold are priced in U.S. dollars. However, the Company’s operating expenses are primarily incurred in Canadian dollars and its liabilities are primarily denominated in Canadian dollars. The results of the Company’s operations are subject to currency risks. The operating results and financial position of the Company are reported in Canadian dollars in the Company’s consolidated financial statements.
The Company may use derivative financial instruments to hedge some of its exposure to fluctuations in gold prices and foreign exchange rates. Such transactions can expose the Company to credit, liquidity and interest rate risk. The Company does not acquire, hold or issue derivatives for speculative purposes. At September 30, 2015, the Company had derivative instruments outstanding in the form of forward sales contracts relating to 2015 production totaling 5,800 ounces of gold; at September 30, 2014, the Company had derivative instruments outstanding in the form of forward sales contracts relating to 2014 production totaling 12,500 ounces of gold. The market value loss inherent in these contracts at September 30, 2015 was $0.2 million (Q3 2014 - market value gain of $0.9 million).
The Company is exposed to counterparty risk which is the risk that a counterparty will not complete its obligations under a financial instrument resulting in a financial loss for the Company. The Company does not generally obtain collateral or other security to support financial instruments subject to credit risk; however, the Company only deals with credit worthy counterparties. Accounts receivable comprise institutions purchasing gold under normal settlement terms of two working days. Counterparty risk under derivative financial instruments is to reputable institutions. All significant cash balances are on deposit with high-rated banking institutions. The carrying amount of financial assets recorded in the financial statements represents the Company’s maximum exposure to credit risk without taking account of the value of any collateral or other security obtained.
Key Sensitivities
Earnings from Claude’s gold operation are sensitive to fluctuations in both commodity and currency prices. The key factors and their approximate effect on earnings, earnings per share and cash flow, based on assumptions comparable to forecast 2015 actuals, are as follows:
| Q3 2015 Management’s Discussion and Analysis | |
| (in thousands of CDN dollars, except as otherwise noted) | Page 10 |
| · | For a U.S. $10 movement in gold price per ounce, earnings and cash flow will have a corresponding movement of CDN $0.9 million, or $0.00 per share. For a $0.01 movement in the U.S.$/CDN$ exchange rate, earnings and cash flow will have a corresponding movement of CDN $1.3 million, or $0.01 per share. |
| · | For a 0.25 gram per tonne movement in grade, earnings and cash flow will have a corresponding movement of CDN $3.2 million, or $0.02 per share. |
Contractual Obligations
At September 30, 2015, other than the Company’s new debt facility with Scotiabank, there were no significant changes to the Company’s contractual obligations from those reported in the Management’s Discussion and Analysis for the year ended December 31, 2014.
Statements of Financial Position
Highlights
| Select Statements of Financial Position Data |
| | | Sept 30 | | | Dec 31 | | | | |
| | | 2015 | | | 2014 | | | Change | |
| | | | | | | | | | |
| Total assets | | $ | 186,663 | | | $ | 167,512 | | | | 11 | % |
| Non-current liabilities | | $ | 21,601 | | | $ | 25,433 | | | | (15 | %) |
Assets
Claude’s asset base primarily consists of non-current assets comprising mineral properties, reflecting the capital intensive nature of the exploration and mining business and the impact of the significant capital expenditures relating to its operations and exploration projects. The $19.2 million net increase resulted largely from increases of: $13.3 million in cash and cash equivalents, a result of higher gold sales (attributable to improved production and grade at the Seabee Gold Operation); $5.3 million in inventories, largely attributable to the Company’s annual Winter Ice Road resupply at the Seabee Gold Operation and increased gold bullion and in-circuit inventory on hand; and $4.5 million in mineral properties attributable to development and sustaining capital expenditures. These increases were partially offset by a $3.1 million decrease in account receivable attributable to the timing of gold sales and receipt of funds.
Liabilities
Total Current and Non-current liabilities were $34.6 million at September 30, 2015, a decrease of $3.5 million from December 31, 2014. This result was largely attributable toprincipal repayments on the Company’s long-term debt.
Shareholders’ Equity
Shareholders’ equity increased by $22.6 million to $152.0 million at September 30, 2015, from $129.4 million at December 31, 2014. This result is mainly attributable to a $21.0 million decrease to Accumulated deficit, a result of the net earnings for the first nine months of 2015, and an increase in Share capital of $1.3 million due to the issuance of common shares pursuant to the Company’s ESPP and Stock Option programs.
Comprehensive income consists of net earnings (loss), together with certain other economic gains and losses that are collectively referred to as “other comprehensive income (loss)” or “OCI” and are excluded from the Income Statement.
| Q3 2015 Management’s Discussion and Analysis | |
| (in thousands of CDN dollars, except as otherwise noted) | Page 11 |
Selected Quarterly Production and Financial Data
| | | Sept 30 | | | Jun 30 | | | Mar 31 | | | Dec 31 | | | Sept 30 | | | Jun 30 | | | Mar 31 | | | Dec 31 | |
| | | 2015 | | | 2015 | | | 2015 | | | 2014 | | | 2014 | | | 2014 | | | 2014 | | | 2013 | |
| | | | | | | | | | | | | | | | | | | | | | | | | | | | | | | | | |
| Tonnes milled | | | 69,388 | | | | 74,781 | | | | 67,249 | | | | 60,551 | | | | 74,930 | | | | 79,746 | | | | 64,370 | | | | 74,458 | |
| Grade processed (grams of gold per tonne) | | | 7.29 | | | | 8.88 | | | | 10.17 | | | | 6.57 | | | | 8.88 | | | | 7.70 | | | | 5.76 | | | | 5.61 | |
| Gold ounces | | | | | | | | | | | | | | | | | | | | | | | | | | | | | | | | |
| Produced | | | 15,722 | | | | 20,619 | | | | 21,067 | | | | 12,284 | | | | 20,614 | | | | 18,742 | | | | 11,344 | | | | 12,789 | |
| Sold | | | 16,528 | | | | 20,534 | | | | 17,326 | | | | 16,639 | | | | 17,578 | | | | 17,690 | | | | 10,865 | | | | 13,209 | |
| Revenue ($ millions) | | | 24.5 | | | | 29.7 | | | | 26.2 | | | | 22.7 | | | | 24.3 | | | | 24.7 | | | | 15.6 | | | | 17.5 | |
| Production costs ($ millions) | | | 11.2 | | | | 11.9 | | | | 10.7 | | | | 15.0 | | | | 12.0 | | | | 12.6 | | | | 10.6 | | | | 12.5 | |
| Capital expenditures ($ millions) | | | 4.8 | | | | 4.9 | | | | 9.2 | | | | 6.2 | | | | 4.4 | | | | 3.8 | | | | 7.8 | | | | 6.7 | |
| Cash flow from operations before net changes in non-cash operating working capital ($ millions)(c) | | | 11.4 | | | | 15.6 | | | | 9.3 | | | | 4.5 | | | | 10.4 | | | | 9.9 | | | | 1.8 | | | | 4.5 | |
| Cash flow from operations before net changes in non-cash operating working capital(c) per share | | | 0.06 | | | | 0.08 | | | | 0.05 | | | | 0.02 | | | | 0.06 | | | | 0.05 | | | | 0.01 | | | | 0.03 | |
| Net earnings (loss) ($ millions)(a) | | | 5.7 | | | | 10.2 | | | | 5.1 | | | | (0.5 | ) | | | 6.9 | | | | 3.3 | | | | (5.1 | ) | | | (27.1 | ) |
| Net earnings (loss) per share(a) (d) | | | 0.03 | | | | 0.05 | | | | 0.03 | | | | (0.00 | ) | | | 0.04 | | | | 0.02 | | | | (0.03 | ) | | | (0.15 | ) |
| Average realized gold price (CDN$ per ounce) | | | 1,485 | | | | 1,448 | | | | 1,511 | | | | 1,365 | | | | 1,384 | | | | 1,397 | | | | 1,438 | | | | 1,323 | |
| Average realized gold price (U.S.$ per ounce) | | | 1,135 | | | | 1,178 | | | | 1,218 | | | | 1,201 | | | | 1,270 | | | | 1,282 | | | | 1,303 | | | | 1,260 | |
| Cash cost per ounce(b) (CDN$ per ounce) | | | 721 | | | | 623 | | | | 675 | | | | 934 | | | | 735 | | | | 753 | | | | 983 | | | | 944 | |
| Cash cost per ounce(b)(U.S.$ per ounce) | | | 551 | | | | 507 | | | | 544 | | | | 822 | | | | 675 | | | | 691 | | | | 891 | | | | 899 | |
| All-in sustaining(b) (CDN$ per ounce) | | | 1,089 | | | | 954 | | | | 1,374 | | | | 1,434 | | | | 1,063 | | | | 1,065 | | | | 1,919 | | | | 1,609 | |
| All-in sustaining(b) (U.S.$ per ounce) | | | 832 | | | | 776 | | | | 1,107 | | | | 1,262 | | | | 976 | | | | 977 | | | | 1,738 | | | | 1,533 | |
| | | | | | | | | | | | | | | | | | | | | | | | | | | | | | | | | |
| Weighted average shares outstanding (basic) | | | 194,875 | | | | 194,642 | | | | 192,928 | | | | 188,156 | | | | 188,156 | | | | 188,156 | | | | 182,029 | | | | 175,811 | |
| | | | | | | | | | | | | | | | | | | | | | | | | | | | | | | | | |
| CDN$/U.S.$ Exchange | | | 1.3091 | | | | 1.2291 | | | | 1.2408 | | | | 1.1361 | | | | 1.0892 | | | | 1.0902 | | | | 1.1038 | | | | 1.0498 | |
(a) Basic and diluted, calculated based on the number of shares issued and outstanding during the quarter. Q4 2013 reflects the impact of a $3.5 million impairment charge on the Seabee Gold Operation, a $4.3 million impairment charge on the Madsen Property and a deferred income tax expense of $15.4 million. Excluding the impairment charges and deferred income tax expense (recovery), net loss in Q4 2013 totaled $4.2 million
(b)Denotes a non-IFRS measure. For an explanation and reconciliation of non-IFRS measures, refer to the “Non-IFRS Financial Measures” section of this MD&A.
(c)For an explanation of this performance measure, refer to the “Other Performance Measures” section of this MD&A.
(d) Net earnings (loss) per share for each quarter has been calculated based on the weighted average number of shares outstanding for the quarter. As such, quarterly amounts may not add to the annual total.
Trends
| · | Improving gold production (69,692 ounces of gold produced over the last four quarters and 133,181 ounces of gold production over the last eight quarters) and steady production costs attributable to replacing lower grade Santoy 8 ore with higher grade Santoy Gap ore, mine sequencing and positive reconciliation on grade at both the Seabee mine and Santoy Mine Complex. |
| · | Canadian average gold price realized has been trending modestly upward over the last eight quarters. |
| · | Improving sales and profit, a result of improving grade and higher Canadian gold prices. |
| · | Improving cash cost per ounce (which has improved nearly $300 over the last eight quarters) and all-in sustaining cost per ounce attributable to an increase in the number ounces of gold sold (a reflection of the higher grade mined from the Santoy Gap and L62 deposits) and reduced production costs. |
| · | The weakening of the Canadian dollar versus the United States dollar, which has decreased 25 percent over the last eight quarters. |
| Q3 2015 Management’s Discussion and Analysis | |
| (in thousands of CDN dollars, except as otherwise noted) | Page 12 |
Accounting Estimates
Certain of the Company’s accounting policies require that Management make decisions with respect to the formulation of estimates and assumptions that affect the reported amounts of assets, liabilities, revenues and expenses. For a discussion of those estimates, please refer to the Company’s Management’s Discussion and Analysis for the year ended December 31, 2014, available atwww.sedar.com.
Future Accounting Pronouncements
The standards and interpretations that are issued, but not yet effective, up to the date of issuance of the Company’s financial statements are disclosed below. These are the changes that the Company reasonably expects will have an impact on its disclosures, financial position or performance when applied at a future date. The Company intends to adopt these standards, if applicable, when they become effective.
Financial Instruments
IFRS 9,Financial Instruments (“IFRS 9”), was issued by the IASB on November 12, 2009 and will replace IAS 39,Financial Instruments: Recognition and Measurement (“IAS 39”). IFRS 9 uses a single approach to determine whether a financial asset is measured at amortized cost or fair value, replacing the multiple rules in IAS 39. The approach in IFRS 9 is based on how an entity manages its financial instruments in the context of its business model and the contractual cash flow characteristics of the financial assets. The new standard also requires a single impairment method to be used, replacing the multiple impairment methods in IAS 39. IFRS 9 is effective for annual periods beginning on or after January 1, 2018 (tentative). The Company is currently evaluating the impact of IFRS 9 on its financial statements, if any.
Revenue
IFRS 15,Revenue from Contracts with Customers (“IFRS 15”), was issued by the IASB in May 2014 and clarifies the principles for recognizing revenue from contracts with customers. In July 2015, IASB deferred the effective date of the standard to annual reporting periods beginning on or after January 1, 2018, with earlier application permitted. The Company intends to adopt IFRS 15 in its financial statements for the annual period beginning January 1, 2018. The Company is currently evaluating the impact of IFRS 15 on its financial statements, if any.
Exploration
During 2015, exploration at the Seabee Gold Operation is focused on targets proximal to infrastructure with the potential to materially impact near-term production, drive resource growth, improve costs and positively impact the Company’s Mineral Reserves and Mineral Resources.
All exploration activities are carried out under the direction of Qualified Person, Brian Skanderbeg, P. Geo., President and Chief Executive Officer.
Seabee Gold Operation
The Seabee Gold Operation is located northeast of La Ronge, Saskatchewan and consists of two producing mines, the Seabee Mine (which includes the L62 deposit) and the Santoy Mine Complex (which includes the Santoy 8 and Santoy Gap deposits). In addition, the Seabee Gold Operation is host to various regional exploration targets and is relatively underexplored.
During the second quarter of 2015, the Company increased its land position to 47,940 acres (19,400 hectares) from 42,500 acres (17,200 hectares) to expand continuity of the north east portion of its land position. The Company plans to complete compilation and reconnaissance work on the newly acquired claims to the east and north of Santoy as well as compile and review the historic work completed.
| Q3 2015 Management’s Discussion and Analysis | |
| (in thousands of CDN dollars, except as otherwise noted) | Page 13 |

Figure 1: Seabee Property regional map showing significant gold deposits and occurrences.
Santoy Mine Complex
The Santoy Region includes the Santoy 8 and Santoy Gap deposits, which are part of the Santoy Mine Complex.
The primary focus of the 2015 underground drill program has been on the infill and expansion of the Santoy Gap resource and reserve. The program has had positive results to date and has expanded economic mineralization up-dip to the southeast and at depth. Hole SUG-15-048 graded 43.28 (uncut) or 30.54 (cut) grams of gold per tonne over 1.15 metres and, at 675 metres depth, is the deepest hole ever drilled at the Santoy Mine Complex. This intercept is important as it confirms continuity and demonstrates that grades remain robust at depth; follow-up drilling in the immediate area is on-going.
Hole SUG-15-315 targeted the up-dip continuity at 140 metres elevation and returned 31.10 (uncut) or 11.08 (cut) grams of gold per tonne of 7.06 metres true width. This high grade, wide intercept is approximately 75 metres up-plunge from current development and links to near-surface inferred resources. Results from drilling of the up-dip extension at Santoy Gap are consistent with underground development sampling and will be included in the year-end resource and reserve update.
Recent highlights from the underground program are outlined in the table below.
| Highlights of Drill Holes Intercepting Multiple Vein Systems Within the Santoy Gap Deposit |
| HOLE ID | ZONE | FROM | UNCUT (g/t) | CUT (g/t) | TRUE WIDTH
(m) |
| JOY-13-690* | 9C | 684.27 | 200.92 | 27.32 | 1.95 |
| Including | | 684.98 | 602.00 | | 0.33 |
| JOY-13-692* | 8A | 632.85 | 30.08 | 22.89 | 5.90 |
| SUG-15-048 | 9C | 372.40 | 43.28 | 30.54 | 1.15 |
| Including | | 373.20 | 107.28 | | 0.54 |
| SUG-15-051 | 9A | 188.20 | 13.58 | 13.58 | 2.93 |
| SUG-15-309 | 9A | 191.70 | 152.94 | 21.93 | 1.10 |
| Including | | 191.70 | 561.63 | | 0.30 |
| SUG-15-310 | 9A | 132.00 | 19.68 | 19.68 | 2.08 |
| SUG-15-312 | 9A | 216.30 | 27.65 | 27.65 | 0.43 |
| SUG-15-314 | 9A | 125.60 | 22.79 | 18.18 | 3.30 |
| SUG-15-315 | 9A | 162.60 | 31.33 | 11.08 | 7.06 |
| Including | | 182.00 | 495.27 | | 0.33 |
Note: Composites were calculated using a 3.5 g/t Au cut-off grade and may include internal dilution. Assays are top cut to 75.0 g/t Au.
* Previously released drill intercepts.
| Q3 2015 Management’s Discussion and Analysis | |
| (in thousands of CDN dollars, except as otherwise noted) | Page 14 |
In addition to the on-going 2015 program at Santoy Gap, the Company has completed a drill chamber and begun an additional 6,000 metre drill program to target the plunge continuity of the Santoy 8 Deposit proximal to hole JOY-13-692, which graded 30.08 (uncut) or 22.89 (cut) grams of gold per tonne over 5.90 metres true width (See news release May 22, 2013, “Claude Discovers Significant Extensions at the Santoy Gap and Santoy 8 Deposits”). This intercept hosted strong visible gold and telluride mineralization within a vein system of significant true width and is associated with intense footwall alteration. The Santoy 8 system appears to be improving with depth and the Company now has the ideal platform to test this system. It is located 400 metres down plunge from existing Santoy 8 infrastructure and 250 metres from the Santoy Gap inferred resources. Drilling will test from 450 metres to 800 metres below surface with drill spacing between 50 and 100 metres. This program is of particular significance as drill testing of the continuity between the Santoy Gap and Santoy 8 deposits is limited and the inferred resources remain open along strike, down dip and down plunge.
Historic drilling at Santoy Gap has extended the mineralized system down-plunge to 650 metres depth and at Santoy 8 has extended the system 400 metres below the base of the existing inferred resource. These step-out drill intercepts significantly expand the footprint of the Santoy Mine Complex and are materially higher grade than the current reserve and resource base. Results from the underground drill program during 2014 have shown high grade and excellent widths that are hosted within three distinct vein systems (Santoy Gap 9A, 9B and 9C). Select highlight holes that have intercepted multiple vein systems are presented in the table below.
| Highlights of Drill Holes Intercepting Multiple Vein Systems Within the Santoy Gap Deposit | |
| Hole ID | VEIN SYSTEM | |
| 9A | 9B | 9C | |
Grade g/t
Au (cut) | True width
(m) | Grade g/t
Au (cut) | True width
(m) | Grade g/t
Au (cut) | True width
(m) | |
| |
| SUG-14-027 | 33.56 | 4.57 | 7.71 | 2.52 | 4.28 | 10.21 | |
| SUG-14-028 | 15.35 | 7.51 | 4.84 | 3.42 | 6.71 | 7.13 | |
| SUG-14-029 | 50.00 | 1.88 | 10.91 | 10.47 | 15.17 | 4.80 | |
| SUG-14-034 | 13.29 | 2.58 | 22.54 | 9.62 | 4.93 | 1.72 | |
| SUG-14-038 | 9.87 | 8.22 | 20.20 | 0.87 | 28.36 | 2.02 | |
| SUG-14-044 | 8.03 | 3.39 | - | - | 11.33 | 7.63 | |
| SUG-14-048 | 6.06 | 6.34 | 6.23 | 4.69 | 26.77 | 8.70 | |
Note: Composites were calculated using a 3.5 g/t Au cut-off grade and a 50.0 g/t top-cut and may include internal dilution.
These results are significant because all three structures hosted within the Santoy Gap continue to demonstrate economic grades and widths. Furthermore, the Santoy Gap deposit contains more gold ounces per vertical metre than other ore bodies within the Seabee Gold Operation; as such, the Company has the opportunity to improve productivity and margins.
Results during 2013 were highlighted by drill hole JOY-13-690 that returned 330.35 grams of gold per tonne over 1.55 metres, inclusive of a bonanza grade interval of 602.00 grams of gold per tonne over 0.84 metres. This is the highest grade interval drilled to date at the Santoy Gap deposit. Drill hole JOY-13-692 returned 18.80 grams of gold per tonne over 13.86 metres and is significant because it confirms continuity at depth between the Santoy Gap and Santoy 8 deposits.
| Q3 2015 Management’s Discussion and Analysis | |
| (in thousands of CDN dollars, except as otherwise noted) | Page 15 |
| Highlights from 2013 Santoy Mine Complex Drilling |
| Hole ID | Easting | Northing | From (m) | To (m) | Grade Au (g/t) | Width (m) | Zone |
| JOY-13-690 | 599175 | 6171150 | 684.27 | 685.82 | 330.35 | 1.55 | GAP |
| | | Incl | 684.98 | 685.82 | 602.00 | 0.84 | GAP |
| JOY-13-692 | 599721 | 6170539 | 632.85 | 646.71 | 18.80 | 13.86 | Santoy 8 |
Note: Composites were calculated using a 3.0 g/t Au cut-off grade and may include internal dilution. True widths are interpreted to be 75 to 95 percent of drilled width. Assay results are uncut.

Figure 2: Santoy Region Composite Longitudinal Section.
Seabee Region
During 2015, a 4,000 metre surface exploration program focused on evaluating the most prospective near-Seabee mine targets that could not be tested from underground. Results are being compiled with a view to re-rank near-surface targets for 2016.
A 10,000 metre underground drill program coordinated by the Exploration department will focus on high-priority near-mine targets, which have the potential to result in new discoveries proximal to Seabee’s mine infrastructure and thereby expanding the current resource and reserve base. This program ramped-up early in the second quarter and will continue during the remainder of the year. The first targets to be tested include the 3 vein and the up-dip L62 areas, followed by the 15 and 18 veins in the eastern sections of the mine.The first of these targets have been completed with some follow-up work planned for the first half of 2016. Underground drill programs exploring the 15 and 18 veins are slated to begin in the first quarter of 2016.
| Q3 2015 Management’s Discussion and Analysis | |
| (in thousands of CDN dollars, except as otherwise noted) | Page 16 |
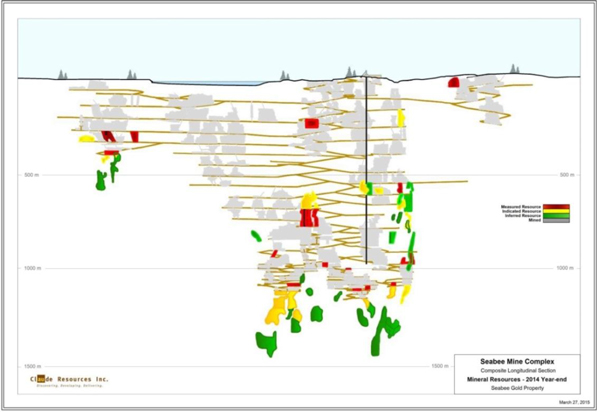
Figure 3: Seabee Mine Composite Longitudinal Section
Amisk Gold Project
No exploration expenditures are planned for the Amisk Gold Project during 2015.
The Amisk Gold Project is located in the Flin Flon-Snow Lake Greenstone Belt and is host to the Amisk Gold deposit as well as a large number of gold occurrences and prospects. Regional potential remains high and exploration maturity low. Historical field work and extensive compilation resulted in the emergence of an extensive list of exploration targets that have been prioritized for future assessment. The Company has also completed target development, ranking and ground-base reconnaissance in areas which host potential for Amisk-style gold-silver (“Au-Ag”) mineralization as well as conventional base-metal deposits typical of the Flin Flon belt.
Drilling from the Company’s historical drill programs successfully confirmed continuity of gold mineralization within the northern and eastern portion of the deposit as well as demonstrated the potential for expansion to the east and southeast. Gold and silver mineralization at the Amisk Gold Project is associated with a sequence of quartz porphyritic, rhyolitic lapilli tuffs and flows hosting disseminations and stringers of pyrite, sphalerite, galena, tetrahedrite and chalcopyrite. Drilling has intercepted the mineralized system over a strike length of 1,200 metres, width of 400 metres and depths of in excess of 600 metres. The system remains open to the southwest, southeast, northwest and at depth.
| Q3 2015 Management’s Discussion and Analysis | |
| (in thousands of CDN dollars, except as otherwise noted) | Page 17 |
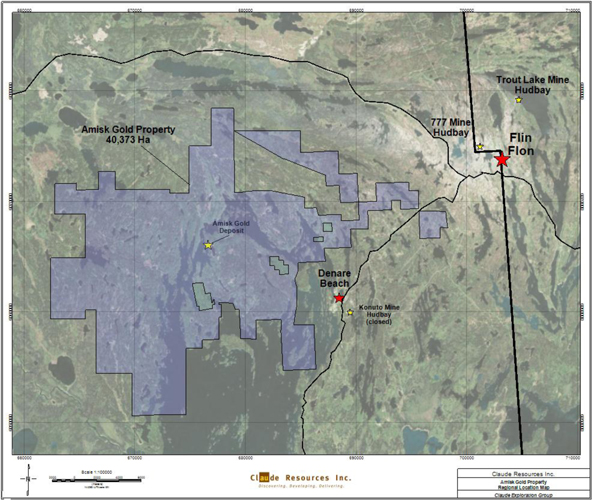
Figure 4: Amisk Gold Project Land Package
Quality Assurance and Quality Control Procedures
Rigorous quality assurance and quality control procedures have been implemented including the use of blanks, standards and duplicates. Geochemical analyses were submitted to ALS Chemex in Vancouver, British Columbia, TSL Laboratories in Saskatoon, Saskatchewan and or the Seabee mine site lab. ALS Chemex and TSL Laboratories are ISO approved. Core samples were analyzed by a 30 gram gold fire assay with an atomic absorption and gravimetric and or screen fire finish.
Mineral Reserves and Mineral Resources
Seabee Gold Operation
At November 30, 2014, Proven and Probable Mineral Reserves at the Seabee Gold Operation were 1,323,100 tonnes, grading at 7.03 grams of gold per tonne or 299,000 ounces of gold. The increase in reserve grade was driven by a 35 percent increase in grade year over year at the Santoy Gap (7.64 grams of gold per tonne from 5.68 grams of gold per tonne). The increase in grade and reduction in reserve ounces at Santoy Gap was largely the result of a revision to the mining method from the pre-feasibility study. Based on information from the Company’s 2014 infill drilling program that demonstrated better vein continuity and improved pillar configuration, Transverse mining was replaced with Long-hole mining. Furthermore, based on its high-grade nature and size, the Santoy Gap deposit demonstrates the potential that exists to grow production at the Seabee Gold Operation.
| Q3 2015 Management’s Discussion and Analysis | |
| (in thousands of CDN dollars, except as otherwise noted) | Page 18 |
Measured and Indicated Mineral Resources were 651,000 tonnes, grading at 5.98 grams of gold per tonne or 125,200 ounces of gold. Inferred Mineral Resources were 3,311,400 tonnes, grading at 7.96 grams of gold per tonne or 847,300 ounces of gold. The increase of inferred ounces year over year came from significantly expanding the Santoy 8 ore body at depth. This extension is significant in size and grade and provides for a great opportunity to expand the life of mine at the Santoy Mine Complex.
| Seabee Gold Operation Mineral Reserves and Mineral Resources |
| | November 30, 2014 |
| | Tonnes | Grade (Au g/t) | Ozs Au |
| Seabee Gold mine |
| Proven Reserves | 217,700 | 6.05 | 42,400 |
| Probable Reserves | 192,600 | 6.91 | 42,800 |
| Measured Resources | 17,400 | 8.26 | 4,600 |
| Indicated Resources | 88,500 | 6.49 | 18,500 |
| Inferred Resources | 403,300 | 8.09 | 104,900 |
| Santoy Gap |
| Proven Reserves | 105,000 | 5.49 | 18,500 |
| Probable Reserves | 694,600 | 7.96 | 177,800 |
| Measured Resources | 34,800 | 5.85 | 6,500 |
| Indicated Resources | 147,900 | 5.65 | 26,900 |
| Inferred Resources | 1,319,100 | 7.50 | 318,100 |
| Santoy 8 |
| Proven Reserves | 15,300 | 4.91 | 2,400 |
| Probable Reserves | 97,900 | 4.79 | 15,100 |
| Measured Resources | 34,700 | 8.71 | 9,700 |
| Indicated Resources | 67,000 | 4.13 | 8,900 |
| Inferred Resources | 1,344,300 | 8.56 | 369,900 |
| Porky Main |
| Indicated Resources | 160,000 | 7.50 | 38,600 |
| Inferred Resources | 70,000 | 10.43 | 23,500 |
| Porky West |
| Indicated Resources | 100,700 | 3.57 | 11,600 |
| Inferred Resources | 174,800 | 5.48 | 30,800 |
| Total Gold |
| Proven & Probable Reserves | 1,323,100 | 7.03 | 299,000 |
| Measured & Indicated Resources | 651,000 | 5.98 | 125,200 |
| Inferred Resources | 3,311,400 | 7.96 | 847,300 |
Footnotes to the Mineral Resource Statement:
| 1. | At November 30, 2014, Mineral Reserves and Mineral Resources were estimated by Claude personnel. The Mineral Resource evaluation work was completed by a team of geologists and engineers under the supervision of Brian Skanderbeg, P.Geo., President and Chief Executive Officer. Mineral Reserves were conducted under the direction of Qualified Person Gordon Reed, P.Eng., Seabee Gold Operation General Manager. Mr. Skanderbeg and Mr. Reed have sufficient experience, which is relevant to the style of mineralization and type of deposit under consideration and to the activities undertaken to qualify as Qualified Persons as defined by NI 43-101. |
| 2. | The Mineral Resources and reserves reported herein have been estimated in conformity with generally accepted CIM “Estimation of Mineral Resource and Mineral Reserves Best Practices” guidelines and are reported in accordance with Canadian Securities Administrators’ National Instrument 43-101. |
| 3. | Mineral Reserves and Mineral Resources for the Seabee deposit are reported at a cut-off of 4.5 grams of gold per tonne. Santoy 8 and Santoy Gap Mineral Reserves and Mineral Resources are reported at a cut-off of 3.6 grams of gold per tonne. Porky Main and Porky West Mineral Resources are reported at a cut-off grade of 3.0 grams of gold per tonne. Assumptions include a price of CDN $1,375 per ounce of gold using metallurgical and process recovery of 95.2 percent and overall ore mining and processing costs derived from 2014 realized costs. |
| 4. | All figures are rounded to reflect the relative accuracy of the estimates. Summation of individual columns may not add-up due to rounding. |
| 5. | Mineral Resources are not Mineral Reserves and do not have demonstrated economic viability. There is no certainty that all or any part of the Mineral Resource will be converted into Mineral Reserves. |
| 6. | Proven and Probable Mineral Reserves are exclusive of Measured and Indicated Mineral Resources. |
| Q3 2015 Management’s Discussion and Analysis | |
| (in thousands of CDN dollars, except as otherwise noted) | Page 19 |
Amisk Gold Project
At the Amisk Gold Project, Claude’s independent NI 43-101 compliant resource calculation outlines an Indicated Resource of 921,000 ounces of 0.95 grams of gold equivalent (“Au Eq”) per tonne and an Inferred Resource of 645,000 ounces at 0.70 grams of Au Eq per tonne.
| Amisk Gold Project Consolidated Mineral Resource Statement* |
| Resource Class | Quantity | Grade (g/tonne) | Contained Ounces (000’s) |
| (000’s tonnes) | Au | Ag | Au Eq | Au | Ag | Au Eq |
| | | | | | | | |
| Indicated | 30,150 | 0.85 | 6.17 | 0.95 | 827 | 5,978 | 921 |
| Inferred | 28,653 | 0.64 | 4.01 | 0.70 | 589 | 3,692 | 645 |
* Reported at a cut-off of 0.40 grams of Au Eq per tonne using a price of U.S. $1,100 per ounce of gold and U.S. $16 per ounce of silver inside a conceptual pit shell optimized using metallurgical and process recovery of 87 percent, overall ore mining and processing costs of U.S. $15 per tonne and overall pit slope of 50 degrees. All figures are rounded to reflect the relative accuracy of the estimates. Mineral Resources are not Mineral Reserves and do not have demonstrated economic viability. Brian Skanderbeg, P.Geo., is the Qualified Person for Claude Resources for the Amisk Gold Project.
The mineral resources for the Amisk Gold Project are sensitive to the selection of cut-off grade. The table below presents the quantity and grade estimates at a range of cut-off grades inside the conceptual pit shell considered for reporting the Mineral Resource Statement. A cut-off value of 0.4 grams of gold equivalent per tonne was selected based on optimization results and benchmarking against similar deposits.
| Global Block Model Quantity and Grade Estimates, Amisk Lake Gold Project at Various Cut-off Grades |
| Grade | Indicated | Inferred |
Au Eq (gpt) | Quantity (tonnes) | Au Eq (gpt) | Ounces Au Eq | Quantity (tonnes) | Au Eq (gpt) | Ounces Au Eq |
| 0.40 | 30,150,090 | 0.95 | 920,881 | 28,653,135 | 0.70 | 644,854 |
| 0.60 | 18,322,858 | 1.25 | 736,367 | 13,665,490 | 0.94 | 412,994 |
| 0.80 | 11,418,785 | 1.58 | 580,054 | 6,659,786 | 1.20 | 256,941 |
| 1.00 | 7,606,617 | 1.93 | 471,998 | 3,589,543 | 1.48 | 170,802 |
| Note: The reader is cautioned that the figures in this table should not be misconstrued with a Mineral Resource Statement. The figures are only presented to show the sensitivity of the block model estimates to the selection of cut-off grade. |
Common Share Data
The authorized share capital of the Company consists of an unlimited number of common shares and two classes of unlimited preferred shares issuable in series. At September 30, 2015, there were 194,881,829 common shares outstanding (December 31, 2014 – 188,155,978 common shares).
During the first nine months of 2015, the Company issued 6,105,093 common shares pursuant to the Company’s ESPP (2014 - 7,799,148 common shares), 412,565 common shares pursuant to the Company’s Stock Option Plan (2014 – nil) and a total of 208,193 common shares pursuant to the repurchase of two joint ventures on the Seabee Property. At November 4, 2015, there were 194,973,705 common shares of the Company issued and outstanding.
Stock Options, Deferred Share Units and Restricted Share Units
For further discussion of the Company’s share-based payments, please refer to the Company’s September 30, 2015 condensed consolidated interim financial statements and notes thereto (unaudited) and the Company’s December 31, 2014 audited consolidated financial statements and notes thereto, available atwww.sedar.com.
| Q3 2015 Management’s Discussion and Analysis | |
| (in thousands of CDN dollars, except as otherwise noted) | Page 20 |
Stock Options
At September 30, 2015, there were 9.3 million stock options outstanding with exercise prices ranging from $0.17 to $2.38 per share and expiration dates ranging from January 1, 2016 to May 6, 2022. This compares to 8.5 million stock options outstanding at December 31, 2014 ranging from $0.17 to $2.38 per share.
Deferred Share Units
During the first nine months of 2015, the Company granted646,777 DSUs to participating Directors and settled2,247,996 DSUs (YTD Q3 2014 – 3,043,481 DSUs granted, 1,320,582 DSUs settled). At September 30, 2015, total DSUs held by participating Directors was1,701,766 (December 31, 2014 – 3,302,985). For DSUs, the Company records compensation expense with an offsetting credit to accounts payable to reflect the estimated fair value of DSUs granted to participants.
Restricted Share Units
During the first nine months of 2015, 466,520 RSUs were granted to eligible participants and 259,421 RSUs were settled in accordance with plan details (YTD Q3 2014 – 1,058,696 RSUs granted, 280,435 RSUs settled). At September 30, 2015, total RSUs held by participants was 985,360 (December 31, 2014 – 778,261). For RSUs, the Company records compensation expense with an offsetting credit to accounts payable to reflect the estimated fair value of RSUs granted to participants.
Business Risks
Risks and uncertainties related to economic and industry factors are described in detail in the Company’s Annual Information Form, available atwww.sedar.com,and remain substantially unchanged.
Non-IFRS Financial Measures and Reconciliations
The Company utilizes non-IFRS financial measures as supplemental indicators of operating performance and financial position. These non-IFRS financial measures are used internally by the Company for comparing actual results from one period to another. The Company believes that, in addition to conventional measures prepared in accordance with IFRS, certain investors use this information to evaluate the Company’s performance and ability to generate cash flow. Accordingly, such information is intended to provide additional information and should not be considered in isolation or as a substitute for measures of performance prepared in accordance with IFRS.
Cash Cost Per Ounce
The Company reports its cash costs on a per-ounce basis, based on uniform standards developed by the Gold Institute, an independent researcher and evaluator of the gold market and gold industry. Management uses this measure because it has been used in the past and Management and certain stakeholders use it to analyze the Company’s historical and future performance, and its ability to generate cash flow in future periods. Investors are cautioned that the above measures may not be comparable to similarly titled measures of other companies, should these companies not follow World Gold Council.
All-In Sustaining Cost Per Ounce
All-in sustaining costs (“AISC”) and AISC cost per ounce are Non-IFRS measures. These measures are intended to assist readers in evaluating the total costs of producing gold from current operations. While there is no standardized meaning across the industry for this measure, the Company’s definition conforms to the definition of AISC as set out by the World Gold Council, which became effective January 1, 2014. The Company defines AISC as the sum of production costs, sustaining capital (capital required to maintain current operations at existing levels), corporate general and administrative expenses, exploration expenses and reclamation cost accretion related to current operations. AISC exclude expansion capital, reclamation cost accretion not related to current operations, interest expense, debt repayment and income taxes. The costs included in the calculation of AISC are divided by gold ounces sold; U.S.$ AISC per ounce sold are translated to Canadian dollars using the average Bank of Canada CDN$/U.S.$ exchange rate.
| Q3 2015 Management’s Discussion and Analysis | |
| (in thousands of CDN dollars, except as otherwise noted) | Page 21 |
AISC and AISC cost per ounce are reconciled to the amounts included in the Consolidated Statements Income as follows:
| | | Three Months Ended Sept 30 | | | Nine Months Ended Sept 30 | |
| | | 2015 | | | 2014 | | | Change | | | 2015 | | | 2014 | | | Change | |
| | | | | | | | | | | | | | | | | | | |
| Production cost | | $ | 11,183 | | | $ | 12,021 | | | | (7 | %) | | $ | 33,823 | | | $ | 35,243 | | | | (4 | %) |
| Production royalty | | | 736 | | | | 902 | | | | (18 | %) | | | 2,588 | | | | 1,694 | | | | 53 | % |
| Cash costs of gold sold | | $ | 11,919 | | | $ | 12,923 | | | | (8 | %) | | $ | 36,411 | | | $ | 36,937 | | | | (1 | %) |
| Smelting, refining, freight | | | 49 | | | | 64 | | | | (23 | %) | | | 158 | | | | 172 | | | | (8 | %) |
| By-product credits | | | (11 | ) | | | (14 | ) | | | (21 | %) | | | (44 | ) | | | (63 | ) | | | (30 | %) |
| General and administrative | | | 1,153 | | | | 1,258 | | | | (8 | %) | | | 5,987 | | | | 5,201 | | | | 15 | % |
| Accretion | | | 27 | | | | 35 | | | | (23 | %) | | | 77 | | | | 114 | | | | (32 | %) |
| Development | | | 4,377 | | | | 2,727 | | | | 61 | % | | | 12,325 | | | | 12,453 | | | | (1 | %) |
| Property, plant and equipment | | | 343 | | | | 1,626 | | | | (79 | %) | | | 5,720 | | | | 3,351 | | | | 71 | % |
| Exploration | | | 148 | | | | 65 | | | | 128 | % | | | 764 | | | | 201 | | | | 280 | % |
| All-in sustaining costs | | $ | 18,005 | | | $ | 18,684 | | | | (4 | %) | | $ | 61,398 | | | $ | 58,366 | | | | 5 | % |
| | | | | | | | | | | | | | | | | | | | | | | | | |
| Divided by ounces sold | | | 16,528 | | | | 17,578 | | | | (6 | %) | | | 54,388 | | | | 46,133 | | | | 18 | % |
| Total cash cost per ounce | | $ | 721 | | | $ | 735 | | | | (2 | %) | | $ | 669 | | | $ | 801 | | | | (16 | %) |
| AISC per ounce | | $ | 1,089 | | | $ | 1,063 | | | | 2 | % | | $ | 1,129 | | | $ | 1,265 | | | | (11 | %) |
| CDN$ Exchange rate | | | 1.3091 | | | | 1.0892 | | | | 20 | % | | | 1.2598 | | | | 1.0943 | | | | 15 | % |
| Total cash cost per ounce (U.S.$) | | $ | 551 | | | $ | 675 | | | | (18 | %) | | $ | 531 | | | $ | 732 | | | | (27 | %) |
| AISC (U.S.$) | | $ | 832 | | | | 976 | | | | (15 | %) | | $ | 896 | | | $ | 1,156 | | | | (22 | %) |
Other Financial Measures and Reconciliations
Cash Flow from Operations before Net Changes in Non-Cash Operating Working Capital
The Company uses Cash Flow from Operations before Net Changes in Non-Cash Operating Working Capital as a supplemental measure of its financial performance. The Company uses this measure to analyze the cash generated by its operations. These measures are not necessarily indicative of operating profit or cash flow from operations as determined under IFRS. Investors are cautioned these may not be comparable to similarly titled measures of other companies.
| Calculation of Cash Flow from Operations before Net Changes in Non-Cash Operating Working Capital |
| | | Three Months Ended Sept 30 | | | Nine Months Ended Sept 30 | |
| | | 2015 | | | 2014 | | | 2015 | | | 2014 | |
| | | | | | | | | | | | | |
| Net earnings | | $ | 5,662 | | | $ | 6,852 | | | $ | 21,029 | | | $ | 5,068 | |
| Adjustments for non-cash items: | | | | | | | | | | | | | | | | |
| Depreciation and depletion | | | 4,876 | | | | 4,604 | | | | 13,490 | | | | 16,841 | |
| Finance expense | | | 868 | | | | 126 | | | | 1,096 | | | | 1,176 | |
| Finance and other income | | | (247 | ) | | | (320 | ) | | | (747 | ) | | | (833 | ) |
| Loss on sale of assets | | | - | | | | - | | | | - | | | | 642 | |
| Loss (gain) on investments | | | - | | | | (1,047 | ) | | | 425 | | | | (1,317 | ) |
| Stock-based compensation | | | 238 | | | | 153 | | | | 1,017 | | | | 438 | |
| | | $ | 11,397 | | | $ | 10,368 | | | $ | 36,310 | | | $ | 22,015 | |
| Weighted average shares outstanding (basic) | | | 194,875 | | | | 188,156 | | | | 194,156 | | | | 186,136 | |
| Weighted average shares outstanding (diluted) | | | 196,194 | | | | 188,459 | | | | 195,301 | | | | 186,313 | |
| Per share cash flows from operating activities (basic and diluted) | | $ | 0.06 | | | $ | 0.06 | | | $ | 0.19 | | | $ | 0.12 | |
| Q3 2015 Management’s Discussion and Analysis | |
| (in thousands of CDN dollars, except as otherwise noted) | Page 22 |
Reconciliation Principal Balance Owing on Debt and Calculation of Net Debt
Pursuant to Company accounting policy, closing costs associated with the Company’s long-term debt are netted against the face value of the debt, thereby reducing the carrying value of the Term Loan on the Statement of Financial Position. These costs are amortized using the effective interest rate method over the life of the debt facility. A reconciliation of the amortized cost of the Company’s Term loan versus the principal balance owing, and a reconciliation of net debt, is outlined below.
| Principal Balance of Debt and Net Debt |
| | | Sept 30 | | | Dec 31 | |
| | | 2015 | | | 2014 | |
| | | | | | | |
| Term loan (amortized cost) | | $ | 19,499 | | | $ | 21,581 | |
| Add: Remaining closing costs to be amortized | | | 801 | | | | 1,019 | |
| Debt (principal balance owing) | | $ | 20,300 | | | $ | 22,600 | |
| | | | | | | | | |
| Less: Cash and cash equivalents | | | 24,465 | | | | 11,172 | |
| Net debt | | $ | (4,165 | ) | | $ | 11,428 | |
Disclosure Controls and Internal Controls over Financial Reporting
Disclosure Controls and Procedures
As at September 30, 2015, we evaluated our disclosure controls and procedures as defined in the rules of the U.S. Securities and Exchange Commission (“SEC”) and the Canadian Securities Administrators. This evaluation was carried out under the supervision and with the participation of Management, including the President and Chief Executive Officer and the Chief Financial Officer. Based on that evaluation, the President and Chief Executive Officer and Chief Financial Officer concluded that the design and operation of these disclosure controls and procedures were effective.
Internal Control Over Financial Reporting
Management is responsible for establishing and maintaining adequate Internal Control Over Financial Reporting (“ICFR”). ICFR, no matter how well designed, has inherent limitations and can only provide reasonable assurance with respect to the preparation and fair presentation of published financial statements. Under the supervision and with the participation of the President and Chief Executive Officer and the Chief Financial Officer, management conducted an evaluation of the effectiveness of its internal control over financial reporting based on the criteria set forth in the Internal Control-Integrated Framework (2013) issued by the Committee of Sponsoring Organizations of the Treadway Commission (“COSO”). Based on this evaluation, the President and Chief Executive Officer and the Chief Financial Officer concluded that internal control over financial reporting was effective as at September 30, 2015
Changes in Internal Control Over Financial Reporting
During the three and nine months ended September 30, 2015, there have been no significant changes made to the Company’s internal controls over financial reporting that have materially affected, or are reasonably likely to materially affect, the Company’s internal control over financial reporting.
Limitations of Controls and Procedures
The Company’s Management, including the President and Chief Executive Officer and Vice President and Chief Financial Officer, believes that any disclosure controls and procedures or internal control over financial reporting, no matter how well conceived and operated, can provide only reasonable, not absolute, assurance that the objectives of the control system are met. Further, the design of a control system must reflect the fact that there are resource constraints, and the benefits of controls must be considered relative to their costs. Because of the inherent limitations in all control systems, they cannot provide absolute assurance that all control issues and instances of fraud, if any, within the Company have been prevented or detected. These inherent limitations include the realities that judgments in decision-making can be faulty, and that breakdowns can occur because of simple error or mistake. Additionally, controls can be circumvented by the individual acts of some persons, by collusion of two or more people, or by unauthorized override of the control. The design of any control system also is based in part upon certain assumptions about the likelihood of future events, and there can be no assurance that any design will succeed in achieving its stated goals under all potential future conditions. Accordingly, because of the inherent limitations in a cost effective control system, misstatements due to error or fraud may occur and not be detected.
| Q3 2015 Management’s Discussion and Analysis | |
| (in thousands of CDN dollars, except as otherwise noted) | Page 23 |
Cautionary Note to U.S. Investors Concerning Resource Estimates
Resource Estimates
The resource estimates in this Management’s Discussion and Analysis were prepared in accordance with National Instrument 43-101, adopted by the Canadian Securities Administrators. The requirements of National Instrument 43-101 differ significantly from the requirements of the SEC. In this Management’s Discussion and Analysis, the Company uses certain terms such as “measured”, “indicated” and “inferred” resources. Although these terms are recognized and required in Canada, the SEC does not recognize them. The SEC permits U.S. mining companies, in their filings with the SEC, to disclose only those mineral deposits that constitute “reserves”. Under U.S. standards, mineralization may not be classified as a reserve unless the determination has been made that the mineralization could be economically and legally extracted at the time the determination is made. U.S. investors should not assume that all or any portion of a measured or indicated resource will ever be converted into “reserves”. Further, “inferred resources” have a great amount of uncertainty as to their existence and whether they can be mined economically or legally, and U.S. investors should not assume that “inferred resources” exist or can be legally or economically mined, or that they will ever be upgraded to a more certain category.
Compliance with Canadian Securities Regulations
This annual report is intended to comply with the requirements of the Toronto Stock Exchange and applicable Canadian securities legislation, which differ in certain respects from the rules and regulations promulgated under the United States Securities Exchange Act of 1934, as amended (“Exchange Act”), as promulgated by the SEC.
U.S. investors are urged to consider the disclosure in our Annual Report on Form 40-F, File No. 001-31956, filed with the SEC under the Exchange Act, which may be obtained from the Company (without cost) or from the SEC’s Web site:http://sec.gov/edgar.shtml.
Caution Regarding Forward-Looking Information
All statements, other than statements of historical fact, contained or incorporated by reference in this MD&A constitute “forward-looking information” within the meaning of applicable Canadian securities laws and “forward-looking statements” within the meaning of the United States Private Securities Litigation Reform Act of 1995 (referred to herein as “forward-looking statements”). Forward-looking statements include, but are not limited to, statements with respect to the future price of gold, the estimation of mineral reserves and resources, the realization of mineral reserve estimates, the timing and amount of estimated future production, costs of production, capital expenditures, costs and timing of the development of new deposits, success of exploration activities, permitting time lines, currency exchange rate fluctuations, requirements for additional capital, government regulation of mining operations, environmental risks, unanticipated reclamation expenses, title disputes or claims and limitations on insurance coverage. Generally, these forward-looking statements can be identified by the use of forward-looking terminology such as “plans”, “expects” or “does not expect”, “is expected”, “budget”, “scheduled”, “estimates”, “forecasts”, “intends”, “anticipates” or “does not anticipate” or “believes”, or the negative connotation thereof or variations of such words and phrases or state that certain actions, events or results, “may”, “could”, “would”, “might” or “will be taken”, “occur” or “be achieved” or the negative connotation thereof.
| Q3 2015 Management’s Discussion and Analysis | |
| (in thousands of CDN dollars, except as otherwise noted) | Page 24 |
All forward-looking statements are based on various assumptions, including, without limitation, the expectations and beliefs of management, the assumed long-term price of gold, that the Company will receive required permits and access to surface rights, that the Company can access financing, appropriate equipment and sufficient labour, and that the political environment within Canada will continue to support the development of mining projects in Canada.
Forward-looking statements are subject to known and unknown risks, uncertainties and other factors that may cause the actual results, level of activity, performance or achievements of Claude to be materially different from those expressed or implied by such forward-looking statements, including but not limited to: actual results of current exploration activities; environmental risks; future prices of gold; possible variations in ore reserves, grade or recovery rates; mine development and operating risks; accidents, labour issues and other risks of the mining industry; delays in obtaining government approvals or financing or in the completion of development or construction activities; and other risks and uncertainties, including but not limited to those discussed in the section entitled “Business Risk” in this MD&A. These risks and uncertainties are not, and should not be construed as being, exhaustive.
Although Claude has attempted to identify important factors that could cause actual results to differ materially from those contained in forward-looking statements, there may be other factors that cause results not to be as anticipated, estimated or intended. There can be no assurance that such statements will prove to be accurate, as actual results and future events could differ materially from those anticipated in such statements. Accordingly, readers should not place undue reliance on forward-looking statements.
Forward-looking statements in this MD&A are made as of the date of this MD&A, being November 4, 2015 and, accordingly, are subject to change after such date. Except as otherwise indicated by Claude, these statements do not reflect the potential impact of any non-recurring or other special items that may occur after the date hereof. Forward-looking statements are provided for the purpose of providing information about management’s current expectations and plans and allowing investors and others to get a better understanding of our operating environment.
Claude does not undertake to update any forward-looking statements that are incorporated by reference herein, except in accordance with applicable securities laws.
The forward-looking statements contained in this Management’s Discussion and Analysis are expressly qualified by these cautionary statements.
Additional Information
Additional information related to the Company, including its Annual Information Form (Form 40-F in the U.S.), is available on Canadian (www.sedar.com) and U.S. (www.sec.gov) securities regulatory authorities’ websites. Certain documents are also available on the Company’s website atwww.clauderesources.com.