Pioneer Multi-Asset Ultrashort Income Fund
Semiannual Report | September 30, 2020
| | | | | |
| A: MAFRX | C: MCFRX | C2: MAUCX | K: MAUKX | Y: MYFRX |
Beginning in or after March 2021, as permitted by regulations adopted by the Securities and Exchange Commission, paper copies of the Fund’s shareholder reports like this one will no longer be sent by mail, unless you specifically request paper copies of the reports from the Fund or from your financial intermediary, such as a broker-dealer, bank or insurance company. Instead, the reports will be made available on the Fund’s website, and you will be notified by mail each time a report is posted and provided with a website link to access the report.
If you already elected to receive shareholder reports electronically, you will not be affected by this change and you need not take any action. You may elect to receive shareholder reports and other communications electronically by contacting your financial intermediary or, if you invest directly with the Fund, by calling 1-800-225-6292.
You may elect to receive all future reports in paper free of charge. If you invest directly with the Fund, you can inform the Fund that you wish to continue receiving paper copies of your shareholder reports by calling 1-800-225-6292. If you invest through a financial intermediary, you can contact your financial intermediary to request that you continue to receive paper copies of your shareholder reports. Your election to receive reports in paper will apply to all funds held in your account if you invest through your financial intermediary or all funds held within the Pioneer Fund complex if you invest directly.
visit us: www.amundipioneer.com/us
Pioneer Multi-Asset Ultrashort Income Fund | Semiannual Report | 9/30/20 1
President’s LetterDear Shareholders,
The new decade has arrived delivering a calendar year that will go down in the history books. The beginning of 2020 seemed to extend the positive market environment of 2019. Then, March roared in like a lion and the COVID-19 pandemic became a global crisis impacting lives and life as we know it. As the fourth quarter of 2020 got underway, it appeared that the long-anticipated “second wave” of COVID-19 cases was occurring, both in some U.S. states and in Europe. In response, some governments began retightening restrictions on both business and personal activities, likely assuring that the “new normal” conditions created by the pandemic will continue well into 2021.
The long-term impact on the global economy from the COVID-19 virus pandemic, while currently unknown, is likely to be considerable. It is clear that several industries have already felt greater effects than others. And the markets, which do not thrive on uncertainty, have been volatile, delivering significantly negative performance in the first quarter, and then recovering most of those losses throughout the rest of the spring and summer. Despite the rebound, volatility has remained elevated, with momentum rising and falling on seemingly every bit of positive or negative news regarding potential COVID-19 vaccines as well as headlines surrounding the U.S. elections.
Our business continuity plan was implemented given the new COVID-19 guidelines, and most of our employees are working remotely. To date, our operating environment has faced no interruption. I am proud of the careful planning that has taken place and confident we can maintain this environment for as long as is prudent. History in the making for a company that first opened its doors way back in 1928.
Since 1928, Amundi’s investment process has been built on a foundation of fundamental research and active management, principles which have guided our investment decisions for more than 90 years. We believe active management – that is, making active investment decisions – can help mitigate the risks during periods of market volatility. As the first several months of 2020 have reminded us, investment risk can arise from a number of factors in today’s global economy, including slower or stagnating growth, changing U.S. Federal Reserve policy, oil price shocks, political and geopolitical factors and, unfortunately, major public health concerns such as a viral pandemic.
2 Pioneer Multi-Asset Ultrashort Income Fund | Semiannual Report | 9/30/20
At Amundi, active management begins with our own fundamental, bottom-up research process. Our team of dedicated research analysts and portfolio managers analyzes each security under consideration, communicating directly with the management teams of the companies issuing the securities and working together to identify those securities that best meet our investment criteria for our family of funds. Our risk management approach begins with each and every security, as we strive to carefully understand the potential opportunity, while considering any and all risk factors.
Today, as investors, we have many options. It is our view that active management can serve shareholders well, not only when markets are thriving, but also during periods of market stress. As you consider your long-term investment goals, we encourage you to work with your financial professional to develop an investment plan that paves the way for you to pursue both your short-term and long-term goals.
We remain confident that the current crisis, like others in human history, will pass, and we greatly appreciate the trust you have placed in us and look forward to continuing to serve you in the future.
Sincerely,
Lisa M. Jones
Head of the Americas, President and CEO of U.S.
Amundi Pioneer Asset Management USA, Inc.
September 30, 2020
Any information in this shareowner report regarding market or economic trends or the factors influencing the Fund’s historical or future performance are statements of opinion as of the date of this report. Past performance is no guarantee of future results.
Pioneer Multi-Asset Ultrashort Income Fund | Semiannual Report | 9/30/20 3
Portfolio Management Discussion |
9/30/20 In the following interview, portfolio managers Seth Roman, Jonathan Sharkey, Noah Funderburk, and Nicolas Pauwels discuss the factors that influenced the performance of Pioneer Multi-Asset Ultrashort Income Fund during the six-month period ended September 30, 2020. Mr. Roman, a vice president and a portfolio manager at Amundi Pioneer Asset Management, Inc. (Amundi*); Mr. Sharkey, a senior vice president and a portfolio manager at Amundi; Mr. Funderburk, a vice president and a portfolio manager at Amundi; and Mr. Pauwels, a vice president and a portfolio manager at Amundi, are responsible for the day-to-day management of the Fund.
Q How did the Fund perform during the six-month period ended September 30, 2020?
A Pioneer Multi-Asset Ultrashort Income Fund’s Class A shares returned 4.67% at net asset value (NAV) during the six-month period ended September 30, 2020, while the Fund’s benchmark, the ICE Bank of America 3-Month U.S. Dollar LIBOR Index (the ICE BofA Index), returned 0.52%. During the same period, the average return of the 212 mutual funds in Morningstar’s Ultrashort Bond category was 2.88%.
Q Could you describe the market environment for fixed-income investors over the six-month period ended September 30, 2020?
A Entering the period, which began on April 1, 2020, social-distancing and shelter-in-place measures enacted to help curb the spread of COVID-19 had profound economic effects and resulted in significant reductions in services consumption, manufacturing activity, construction, and labor demand. The unprecedented decision to shut down much of the U.S. economy due to COVID-19 necessitated unprecedented monetary and fiscal policy responses. March saw the Federal Reserve (Fed) jump into action by dusting off its 2008/2009 policy “playbook” and rapidly rolling out a raft of programs aimed at restoring market liquidity, facilitating credit availability, and bolstering investors’ confidence. The measures included reducing the benchmark federal funds target range to near zero and committing to making unlimited purchases of U.S. Treasuries and agency mortgage-backed securities (MBS), as well as providing support for commercial paper issuance, mutual fund liquidity needs, and the issuance of asset-backed securities (ABS). The Fed also enacted brand-new measures with the announcement on March 23 of purchasing programs aimed at supporting both the new-issue and secondary investment-grade corporate bond markets. The end of March also saw the
* See Notes to Financial Statements Note 7.
4 Pioneer Multi-Asset Ultrashort Income Fund | Semiannual Report | 9/30/20
U.S. Congress and the White House agree on a $2.2 trillion stimulus package to help individuals and businesses weather the economic hardships caused by the pandemic.
Investors met the extraordinary support from policy makers in the wake of the pandemic with enthusiasm entering the second quarter of 2020. Market participants sought to put money to work at the now much wider credit spreads in anticipation of receiving fair compensation for taking on the increased risk. (Credit spreads are commonly defined as the differences in yield between Treasuries and other types of fixed-income securities with similar maturities.) As the second quarter progressed, investors became increasingly optimistic that steps toward re-opening the economy would support something resembling a “V-shaped” recovery (a sharp, quick rise). That optimism resulted in a resurgence in investors’ appetite for riskier assets that allowed credit-sensitive areas of the bond market to recover much of their earlier losses over the second quarter, even as rising numbers of COVID-19 cases in a number of states raised concerns.
The relatively benign backdrop carried over into much of the third quarter of 2020 and through the end of the six-month period. However, macroeconomic uncertainty bubbled over during September, weighing on investor sentiment and the performance of riskier assets. The market’s focus on heightened macro risks revolved around three key areas: the status of negotiations in Washington over additional fiscal stimulus from the U.S. government, the trajectory of COVID-19 cases, and the November U.S. elections. With respect to the prospects for a second round of stimulus, a partisan dispute over when to appoint Supreme Court Justice Ginsburg’s replacement further hardened the negotiating positions of both parties and lowered the odds of broad fiscal support coming to fruition prior to the November election. Regarding COVID-19 risks, a notable uptick in European cases of the virus reignited concerns that the U.S. remains at risk for a “second wave” of infections as cooler fall temperatures start to drive people back indoors. Aside from the obvious health and safety concerns of a second wave of COVID-19, there also existed the potential for a new round of economic lockdowns looming on the horizon. Lastly, the November elections not only presented the typical uncertainties over the potential outcome, but also featured concerns about a protracted dispute over the election results.
Pioneer Multi-Asset Ultrashort Income Fund | Semiannual Report | 9/30/20 5
Q Can you review the factors that affected the Fund’s benchmark-relative performance during the six-month period ended September 30, 2020?
A Investments in securitized sectors led the positive contributors to the Fund’s benchmark-relative returns during the six-month period, with allocations to collateralized mortgage obligations (CMOs), ABS, and commercial mortgage-backed securities (CMBS) the top performers. The Fund had an overweight to securitized assets versus its peers over the six-month period.
Within CMOs, the Fund’s exposures to credit-risk-transfer (CRT) securities, which transfer some of the risk of non-payment on residential mortgages from government-sponsored entities to the private sector, had the greatest positive effect on relative performance over the six-month period. The CRT market has continued to benefit from declining forbearance rates and delinquencies, a relatively rapid recovery by the consumer in the wake of COVID-19, strong home sales data, and prepayment rates that could remain very high for the foreseeable future, based on current expectations. Home demand has remained strong and mortgage rates have been at historic lows, which could further support home sales.
Outperformance of the Fund’s CMBS holdings during the six-month period primarily reflected the continued narrowing of spreads. CMBS have continued to gain traction in the market, with buyers encouraged by increased price discovery and improving liquidity. Importantly, with every month that passes showing lower forbearance rates, declining spread duration has been taking place in the sector. (Duration is a measure of the sensitivity of the price, or the value of principal, of a fixed-income investment to a change in interest rates, expressed as a number of years.) The CMBS holdings within the portfolio have represented positions high in the capital structure, with a focus on single-asset, single-borrower exposures. Those positions further break down between single-asset positions, typically a marquis hotel or office property, and single-borrower securities, where any single asset is cross-collateralized by the other properties in the pool, with all assets under common ownership. In the case of a single-asset position, the loan-to-value ratio has typically been very low (often less than 40%), so that even if there is a short-term decline in revenues from the effects of COVID-19, the senior position of the Fund’s holding may protect it against any loss. In addition, sponsors of those structures have tended to be well-capitalized entities who, we believe, would likely lend support in the event of any short-term cash shortfall. For cross-collateralized properties, sponsors may also be inclined to support the structures in order to maintain their ownership position across the assets.
6 Pioneer Multi-Asset Ultrashort Income Fund | Semiannual Report | 9/30/20
The Fund’s ABS exposure also contributed positively to relative performance during the six-month period, as that segment of the securitized market has continued to benefit from demand for yield, particularly deeper in the capital structure. Price discovery has continued within the sector in the lower rated tranches, as evidenced by the strong performance of ABS in the “AA” and “BBB” ratings categories. In addition, consumer demand has remained strong, and new car production has yet to catch up with demand, which has benefited the Fund’s sub-prime ABS allocations, as used car prices have remained elevated. Finally, the better-than-expected decline in the unemployment rate to 8.4% in August was good news for more consumer-focused credit sectors, such as ABS and non-agency MBS.
Other sector allocations that had positive effects on the Fund’s benchmark-relative performance during the six-month period included exposures to financials and industrials within corporate credit. The corporate market has benefited from lower levels of new issuance, strong international demand, better-than-expected corporate earnings results, and continued, albeit lower, participation by the Fed with its corporate purchase program. In addition, short-term, high-quality corporate spreads have reverted to near pre-COVID-19 levels.
Additional positive contributors to the Fund’s benchmark-relative performance during the six-month period included allocations to bank loans and collateralized loan obligations (CLOs). The bank-loan market enjoyed narrowing spreads over the period, benefiting from strong CLO demand and the “risk-on” investment environment. Bank loans also benefited from a smaller new-issue calendar and high cash levels resulting from loan paydowns and refinancings, partly due to greater demand for CLOs.
During a six-month period that saw the Fund outperform its benchmark by a fairly wide margin, there were no notable detractors from benchmark-relative returns.
Q Can you discuss the factors that affected the Fund’s income-generation, or distributions* to shareholders, either positively or negatively, during the six-month period ended September 30, 2020?
A Throughout the six-month period, we had invested the Fund in floating-rate issues with interest rates tied to either the London Inter-bank Offered Rate (LIBOR) or other short-term reference rates. The decline in
* Distributions are not guaranteed.
Pioneer Multi-Asset Ultrashort Income Fund | Semiannual Report | 9/30/20 7
LIBOR rates over the period resulted in a decline in the Fund’s distribution yield. Historically, changes to the Fund’s distribution yield have tended to lag changes in LIBOR rates.
Q Did the Fund have any exposure to derivative securities during the six-month period ended September 30, 2020, and did the use of derivatives have an effect on performance?
A No, the Fund had no exposure to derivatives during the period.
Q What is your assessment of the current investment environment in the fixed-income markets?
A The government’s first estimate of the third-quarter U.S. gross domestic product growth rate released after the end of the six-month period showed that domestic economic activity rebounded by more than 30% (annualized) during the quarter. Meanwhile, the economy has recovered more than 75% of the output drawdown recorded during the first half of 2020 while the COVID-19 lockdowns were in full force. Though it seems likely that the U.S. economic growth rate may slow from the third quarter to the fourth, we believe economic activity may continue to expand. History has shown that expansions have tended to be self-sustaining unless derailed by an exogenous shock. While additional fiscal stimulus from the federal government could accelerate the pace of economic activity, we anticipate growth continuing even without the government’s assistance, as personal savings balances have remained above normal. Although an increase in COVID-19 infections seems likely to occur during the winter months, another round of widespread lockdowns may not be necessary given the improvements in patient-treatment methods seen since the virus first arrived in this country.
Our outlook for spread-asset performance has remained positive, and balances out both near-term and medium-term considerations. We appreciate the near-term risks surrounding the uncertainties about the U.S. elections, a potential seasonal increase in COVID-19 infections, and unexpected delays in finding and distributing a safe and effective vaccine for the virus; however, we have framed those risks against asset spreads that, as of quarter-end, generally resided above early-2020 levels. In addition, we believe the medium-term fundamental outlook has remained positive, given continued improvement in COVID-19 treatments, developments regarding the possible approval of a vaccine, and accommodative financial conditions, with the latter currently facing little risk of reversal from tighter monetary policy. Additionally, 12-month forward-looking default forecasts have come down
8 Pioneer Multi-Asset Ultrashort Income Fund | Semiannual Report | 9/30/20
from the levels witnessed entering the second quarter of 2020. We have continued to deploy any current pay downs within the Fund at higher spreads (income levels).
Finally, we believe that the options available for the investment of short-term cash have become more limited. Yields on longer-maturity tax-exempt bonds have dropped to record lows as investors have sought stability and incremental yield.
We continue to believe that the Fund offers a compelling option for investors seeking a strategic short-term alternative.
Please refer to the Schedule of Investments on pages 21–91 for a full listing of Fund securities.
All investments are subject to risk, including the possible loss of principal. In the past several years, financial markets have experienced increased volatility and heightened uncertainty. The market prices of securities may go up or down, sometimes rapidly or unpredictably, due to general market conditions, such as real or perceived adverse economic, political, or regulatory conditions, recessions, inflation, changes in interest or currency rates, lack of liquidity in the bond markets, the spread of infectious illness or other public health issues or adverse investor sentiment. These conditions may continue, recur, worsen or spread.
The Fund has the ability to invest in a wide variety of debt securities.
The Fund’s investments, payment obligations and financing terms may be based on floating rates, such as LIBOR (London Interbank Offered Rate). Plans are underway to phase out the use of LIBOR by the end of 2021. There remains uncertainty regarding the nature of any replacement rate and the impact of the transition from LIBOR on the Fund, issuers of instruments in which the Fund invests, and financial markets generally.
The Fund may invest in underlying funds (including ETFs). In addition to the Fund’s operating expenses, you will indirectly bear the operating expenses of investments in any underlying funds.
The Fund and some of the underlying funds may utilize strategies that have a leveraging effect on the Fund, which increases the volatility of investment returns and subjects the Fund to magnified losses if the Fund’s or an underlying fund’s investments decline in value.
The Fund and some of the underlying funds may use derivatives, such as options and futures, which can be illiquid, may disproportionately increase losses, and have a potentially large impact on Fund performance.
Pioneer Multi-Asset Ultrashort Income Fund | Semiannual Report | 9/30/20 9
The Fund may invest in inflation-linked securities. As inflationary expectations increase, inflation-linked securities may become more attractive, because they protect future interest payments against inflation. Conversely, as inflationary concerns decrease, inflation-linked securities will become less attractive and less valuable.
The Fund may invest in credit default swaps, which may in some cases be illiquid, and they increase credit risk since the Fund has exposure to both the issuer of the referenced obligation and the counterparty to the credit default swap.
The Fund may invest in subordinated securities which may be disproportionately adversely affected by a default or even a perceived decline in creditworthiness of the issuer.
The Fund may invest in floating-rate loans. The value of collateral, if any, securing a floating-rate loan can decline or may be insufficient to meet the issuer’s obligations or may be difficult to liquidate.
The Fund may invest in insurance-linked securities. The return of principal and the payment of interest and/or dividends on insurance-linked securities are contingent on the non-occurrence of a pre-defined “trigger” event, such as a hurricane or an earthquake of a specific magnitude.
The Fund may invest in zero-coupon bonds and payment-in-kind securities, which may be more speculative and fluctuate more in value than other fixed income securities. The accrual of income from these securities are payable as taxable annual dividends to shareholders.
Investments in equity securities are subject to price fluctuation.
International investments are subject to special risks including currency fluctuations, social, economic and political uncertainties, which could increase volatility. These risks are magnified in emerging markets.
Investments in fixed-income securities involve interest rate, credit, inflation, and reinvestment risks. As interest rates rise, the value of fixed income securities generally falls.
The Fund may invest in mortgage-backed securities, which during times of fluctuating interest rates may increase or decrease more than other fixed-income securities. Mortgage-backed securities are also subject to pre-payments.
Prepayment risk is the chance that an issuer may exercise its right to prepay its security, if falling interest rates prompt the issuer to do so. Forced to reinvest the unanticipated proceeds at lower interest rates, the Fund would experience a decline in income and lose the opportunity for additional price appreciation.
High yield bonds possess greater price volatility, illiquidity, and possibility of default.
10 Pioneer Multi-Asset Ultrashort Income Fund | Semiannual Report | 9/30/20
There may be insufficient or illiquid collateral securing the floating rate loans held within the Fund. This may reduce the future redemption or recovery value of such loans.
The Fund may have disadvantaged access to confidential information that could be used to assess a loan issuer, as Amundi normally seeks to avoid receiving material, non-public information.
The Fund is not a money market fund.
These risks may increase share price volatility.
There is no assurance that these and other strategies used by the Fund or underlying funds will be successful.
Please see the prospectus for a more complete discussion of the Fund’s risks.
Before investing, consider the product’s investment objectives, risks, charges and expenses. Contact your advisor or Amundi Pioneer Asset Management, Inc., for a prospectus or summary prospectus containing this information. Read it carefully.
Any information in this shareholder report regarding market or economic trends or the factors influencing the Fund’s historical or future performance are statements of opinion as of the date of this report. Past performance is no guarantee of future results.
Pioneer Multi-Asset Ultrashort Income Fund | Semiannual Report | 9/30/20 11
Portfolio Summary | 9/30/20Portfolio Diversification
(As a percentage of total investments)*
† Amount rounds to less than 0.1%.
10 Largest Holdings
(As a percentage of total investments)*| | | |
| 1. | U.S. Treasury Floating Rate Notes, 0.4% (3 Month U.S. Treasury Bill | |
| Money Market Yield + 30 bps), 10/31/21 | 2.61% |
| 2. | Tidewater Auto Receivables Trust, Series 2020-AA, Class A2, 1.39%, | |
| 8/15/24 (144A) | 0.69 |
| 3. | PFS Financing Corp., Series 2019-B, Class A, 0.702% (1 Month USD LIBOR + | |
| 55 bps), 9/15/23 (144A) | 0.66 |
| 4. | Verizon Owner Trust, Series 2020-A, Class A1B, 0.426% (1 Month USD LIBOR + | |
| 27 bps), 7/22/24 | 0.59 |
| 5. | Mitsubishi UFJ Financial Group, Inc., 1.035% (3 Month USD LIBOR + | |
| 79 bps), 7/25/22 | 0.56 |
| 6. | Truist Bank, 0.87% (3 Month USD LIBOR + 59 bps), 5/17/22 | 0.55 |
| 7. | Federal National Mortgage Association, 0.29% (SOFRRATE + 22 bps), 3/16/22 | 0.55 |
| 8. | U.S. Treasury Floating Rate Notes, 0.32% (3 Month U.S. Treasury Bill Money | |
| Market Yield + 22 bps), 7/31/21 | 0.55 |
| 9. | U.S. Treasury Floating Rate Notes, 0.254% (3 Month U.S. Treasury Bill Money | |
| Market Yield + 15 bps), 1/31/22 | 0.55 |
| 10. | LSTAR Securities Investment, Ltd., Series 2019-4, Class A1, 1.655% (1 Month | |
| USD LIBOR + 150 bps), 5/1/24 (144A) | 0.53 |
* Excludes temporary cash investments and all derivative contracts except for options purchased. The Fund is actively managed, and current holdings may be different. The holdings listed should not be considered recommendations to buy or sell any securities.
12 Pioneer Multi-Asset Ultrashort Income Fund | Semiannual Report | 9/30/20
Prices and Distributions |
9/30/20 Net Asset Value per Share
| | | |
| Class | 9/30/20 | 3/31/20 |
A | $9.61 | $9.26 |
C | $9.62 | $9.26 |
C2 | $9.62 | $9.27 |
K | $9.64 | $9.29 |
Y | $9.63 | $9.27 |
Distributions per Share: 4/1/20–9/30/20
| | | | |
| Net Investment | Short-Term | Long-Term |
| Class | Income | Capital Gains | Capital Gains |
A | $0.0815 | $ — | $ — |
C | $0.0670 | $ — | $ — |
C2 | $0.0675 | $ — | $ — |
K | $0.0923 | $ — | $ — |
Y | $0.0879 | $ — | $ — |
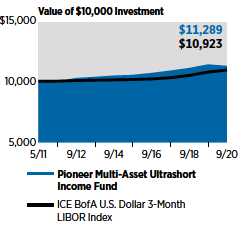
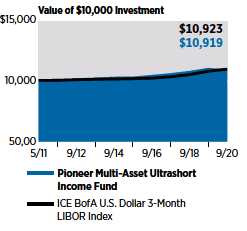
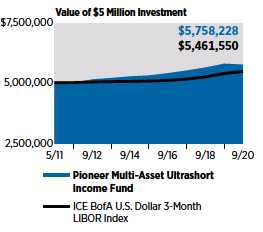
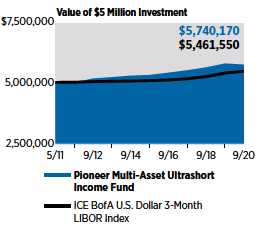
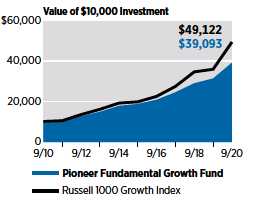
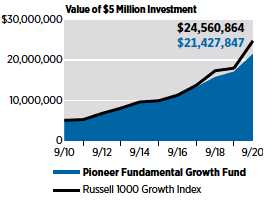
The ICE Bank of America U.S. Dollar 3-Month LIBOR Index is an unmanaged index that tracks the performance of a synthetic asset paying the London Interbank Offered Rate (LIBOR), with a constant 3-month average maturity. The index is based on the assumed purchase at par value of a synthetic instrument having exactly its stated maturity and with a coupon equal to that day’s 3-month LIBOR rate. Index returns assume reinvestment of dividends and, unlike Fund returns, do not reflect any fees, expenses or sales charges. It is not possible to invest directly in an index.
The index defined here pertains to the “Value of $10,000 Investment” and “Value of $5 Million Investment” charts on pages 14–18.
Pioneer Multi-Asset Ultrashort Income Fund | Semiannual Report | 9/30/20 13
| | |
Performance Update | 9/30/20 | Class A Shares |
Investment Returns
The mountain chart on the right shows the change in value of a $10,000 investment made in Class A shares of Pioneer Multi-Asset Ultrashort Income Fund at public offering price during the periods shown, compared to that of the ICE Bank of America (BofA) U.S. Dollar 3-Month LIBOR Index.
| | | | |
| Average Annual Total Returns |
(As of September 30, 2020) |
| | | ICE BofA |
| | | U.S. |
| Net | Public | Dollar |
| Asset | Offering | 3-Month
|
| Value | Price | LIBOR |
| Period | (NAV) | (POP)* | Index |
Life-of-Class | | | |
(4/29/11) | 1.30% | 1.02% | 0.94% |
5 years | 1.36 | 0.85 | 1.50 |
1 year | -1.07 | -1.07 | 1.57 |
|
| Expense Ratio | | |
(Per prospectus dated August 1, 2020) |
| Gross | | | |
0.58% | | | |
Call 1-800-225-6292 or visit www.amundipioneer.com/us for the most recent month-end performance results. Current performance may be lower or higher than the performance data quoted.
The performance data quoted represents past performance, which is no guarantee of future results. Investment return and principal value will fluctuate, and shares, when redeemed, may be worth more or less than their original cost.
NAV results represent the percent change in net asset value per share.
* POP returns shown above reflect the deduction of the maximum 2.50% front-end sales charge on Class A shares purchased prior to February 5, 2018.
All results are historical and assume the reinvestment of dividends and capital gains. Other share classes are available for which performance and expenses will differ.
Performance results reflect any applicable expense waivers in effect during the periods shown. Without such waivers Fund performance would be lower. Waivers may not be in effect for all funds. Certain fee waivers are contractual through a specified period. Otherwise, fee waivers can be rescinded at any time. See the prospectus and financial statements for more information.
The performance table and graph do not reflect the deduction of fees and taxes that a shareowner would pay on Fund distributions or the redemption of Fund shares.
Please refer to the financial highlights for a more current expense ratio.
14 Pioneer Multi-Asset Ultrashort Income Fund | Semiannual Report | 9/30/20
| | |
Performance Update | 9/30/20 | Class C Shares |
Investment Returns
The mountain chart on the right shows the change in value of a $10,000 investment made in Class C shares of Pioneer Multi-Asset Ultrashort Income Fund during the periods shown, compared to that of the ICE Bank of America (BofA) U.S. Dollar 3-Month LIBOR Index.
| | | |
| Average Annual Total Returns |
(As of September 30, 2020) |
| | ICE BofA |
| | U.S. |
| Net | Dollar |
| Asset | 3-Month |
| Value | LIBOR |
| Period | (NAV) | Index |
Life-of-Class | | |
(4/29/11) | 0.94% | 0.94% |
5 years | 1.08 | 1.50 |
1 year | -1.18 | 1.57 |
|
| Expense Ratio | | |
(Per prospectus dated August 1, 2020) |
| Gross | | |
0.89% | | |
Call 1-800-225-6292 or visit www.amundipioneer.com/us for the most recent month-end performance results. Current performance may be lower or higher than the performance data quoted.
The performance data quoted represents past performance, which is no guarantee of future results. Investment return and principal value will fluctuate, and shares, when redeemed, may be worth more or less than their original cost.
NAV results represent the percent change in net asset value per share. All results are historical and assume the reinvestment of dividends and capital gains. Other share classes are available for which performance and expenses will differ.
Performance results reflect any applicable expense waivers in effect during the periods shown. Without such waivers Fund performance would be lower. Waivers may not be in effect for all funds. Certain fee waivers are contractual through a specified period. Otherwise, fee waivers can be rescinded at any time. See the prospectus and financial statements for more information.
The performance table and graph do not reflect the deduction of fees and taxes that a shareowner would pay on Fund distributions or the redemption of Fund shares.
Please refer to the financial highlights for a more current expense ratio.
Pioneer Multi-Asset Ultrashort Income Fund | Semiannual Report | 9/30/20 15
| | |
Performance Update | 9/30/20 | Class C2 Shares |
Investment Returns
The mountain chart on the right shows the change in value of a $10,000 investment made in Class C2 shares of Pioneer Multi-Asset Ultrashort Income Fund during the periods shown, compared to that of the ICE Bank of America (BofA) U.S. Dollar 3-Month LIBOR Index.
| | | | |
| Average Annual Total Returns |
(As of September 30, 2020) |
| | | ICE BofA |
| | | U.S. |
| | | Dollar |
| | | 3-Month |
| If | If | LIBOR |
| Period | Held | Redeemed | Index
|
Life-of-Fund | | | |
(4/29/11) | 0.94% | 0.94% | 0.94% |
5 years | 1.10 | 1.10 | 1.50 |
1 year | -1.17 | -1.17 | 1.57 |
|
| Expense Ratio | | |
(Per prospectus dated August 1, 2020) |
| Gross | | | |
0.88% | | | |
Call 1-800-225-6292 or visit www.amundipioneer.com/us for the most recent month-end performance results. Current performance may be lower or higher than the performance data quoted.
The performance data quoted represents past performance, which is no guarantee of future results. Investment return and principal value will fluctuate, and shares, when redeemed, may be worth more or less than their original cost.
Class C2 shares held for less than 1 year are subject to a 1% contingent deferred sales charge (CDSC). “If Held” results represent the percentage change in net asset value per share. “If Redeemed” returns would have been lower had sales charges been reflected. All results are historical and assume the reinvestment of dividends and capital gains. Other share classes are available for which performance and expenses will differ.
The performance shown for periods prior to the commencement of operations of Class C2 shares on August 1, 2013, is the net asset value performance of the Fund’s Class C shares, which has not been restated to reflect any differences in expenses. For the period beginning August 1, 2013, the actual performance of Class C2 shares is reflected.
Performance results reflect any applicable expense waivers in effect during the periods shown. Without such waivers Fund performance would be lower. Waivers may not be in effect for all funds. Certain fee waivers are contractual through a specified period. Otherwise, fee waivers can be rescinded at any time. See the prospectus and financial statements for more information.
The performance table and graph do not reflect the deduction of fees and taxes that a shareowner would pay on Fund distributions or the redemption of Fund shares.
Please refer to the financial highlights for a more current expense ratio.
16 Pioneer Multi-Asset Ultrashort Income Fund | Semiannual Report | 9/30/20
| | |
Performance Update | 9/30/20 | Class K Shares |
Investment Returns
The mountain chart on the right shows the change in value of a $5 million investment made in Class K shares of Pioneer Multi-Asset Ultrashort Income Fund during the periods shown, compared to that of the ICE Bank of America (BofA) U.S. Dollar 3-Month LIBOR Index.
| | | |
| Average Annual Total Returns |
(As of September 30, 2020) |
| | ICE BofA |
| | U.S. |
| Net | Dollar |
| Asset | 3-Month |
| Value | LIBOR |
| Period | (NAV) | Index |
Life-of-Fund | | |
(4/29/11) | 1.51% | 0.94% |
5 years | 1.63 | 1.50 |
1 year | -0.65 | 1.57 |
|
| Expense Ratio | | |
(Per prospectus dated August 1, 2020) |
| Gross | | |
0.36% | | |
Call 1-800-225-6292 or visit www.amundipioneer.com/us for the most recent month-end performance results. Current performance may be lower or higher than the performance data quoted.
The performance data quoted represents past performance, which is no guarantee of future results. Investment return and principal value will fluctuate, and shares, when redeemed, may be worth more or less than their original cost.
The performance shown for Class K shares for the period prior to the commencement of operations of Class K shares on December 20, 2012, is the net asset value performance of the Fund’s Class A shares, which has not been restated to reflect any differences in expenses, including Rule 12b-1 fees applicable to Class A shares. Since fees for Class A shares generally are higher than those of Class K shares, the performance of Class K shares prior to their inception would have been higher than the performance shown. For the period beginning on December 20, 2012, the actual performance of Class K shares is reflected. Class K shares are not subject to sales charges and are available for limited groups of eligible investors, including institutional investors. All results are historical and assume the reinvestment of dividends and capital gains. Other share classes are available for which performance and expenses will differ.
Performance results reflect any applicable expense waivers in effect during the periods shown. Without such waivers Fund performance would be lower. Waivers may not be in effect for all funds. Certain fee waivers are contractual through a specified period. Otherwise, fee waivers can be rescinded at any time. See the prospectus and financial statements for more information.
The performance table and graph do not reflect the deduction of fees and taxes that a shareowner would pay on Fund distributions or the redemption of Fund shares.
Please refer to the financial highlights for a more current expense ratio.
Pioneer Multi-Asset Ultrashort Income Fund | Semiannual Report | 9/30/20 17
| | |
Performance Update | 9/30/20 | Class Y Shares |
Investment Returns
The mountain chart on the right shows the change in value of a $5 million investment made in Class Y shares of Pioneer Multi-Asset Ultrashort Income Fund during the periods shown, compared to that of the ICE Bank of America (BofA) U.S. Dollar 3-Month LIBOR Index.
| | | |
| Average Annual Total Returns |
(As of September 30, 2020) |
| | ICE BofA |
| | U.S. |
| Net | Dollar |
| Asset | 3-Month |
| Value | LIBOR |
| Period | (NAV) | Index |
Life-of-Class | | |
(4/29/11) | 1.48% | 0.94% |
5 years | 1.55 | 1.50 |
1 year | -0.83 | 1.57 |
|
| Expense Ratio | | |
(Per prospectus dated August 1, 2020) |
| Gross | | |
0.44% | | |
Call 1-800-225-6292 or visit www.amundipioneer.com/us for the most recent month-end performance results. Current performance may be lower or higher than the performance data quoted.
The performance data quoted represents past performance, which is no guarantee of future results. Investment return and principal value will fluctuate, and shares, when redeemed, may be worth more or less than their original cost.
Class Y shares are not subject to sales charges and are available for limited groups of eligible investors, including institutional investors. All results are historical and assume the reinvestment of dividends and capital gains. Other share classes are available for which performance and expenses will differ.
Performance results reflect any applicable expense waivers in effect during the periods shown. Without such waivers Fund performance would be lower. Waivers may not be in effect for all funds. Certain fee waivers are contractual through a specified period. Otherwise, fee waivers can be rescinded at any time. See the prospectus and financial statements for more information.
The performance table and graph do not reflect the deduction of fees and taxes that a shareowner would pay on Fund distributions or the redemption of Fund shares.
Please refer to the financial highlights for a more current expense ratio.
18 Pioneer Multi-Asset Ultrashort Income Fund | Semiannual Report | 9/30/20
Comparing Ongoing Fund Expenses
As a shareowner in the Fund, you incur two types of costs:
(1) ongoing costs, including management fees, distribution and/or service (12b-1) fees, and other Fund expenses; and
(2) transaction costs, including sales charges (loads) on purchase payments.
This example is intended to help you understand your ongoing expenses (in dollars) of investing in the Fund and to compare these costs with the ongoing costs of investing in other mutual funds. The example is based on an investment of $1,000 at the beginning of the Fund’s latest six-month period and held throughout the six months.
Using the Tables
Actual Expenses
The first table below provides information about actual account values and actual expenses. You may use the information in this table, together with the amount you invested, to estimate the expenses that you paid over the period as follows:
(1) Divide your account value by $1,000
Example: an $8,600 account value ÷ $1,000 = 8.6
(2) Multiply the result in (1) above by the corresponding share class’s number in the third row under the heading entitled “Expenses Paid During Period” to estimate the expenses you paid on your account during this period.
Expenses Paid on a $1,000 Investment in Pioneer Multi-Asset Ultrashort Income Fund
Based on actual returns from April 1, 2020 through September 30, 2020.
| | | | | | |
| Share Class | A | C | C2 | K | Y |
Beginning Account | $1,000.00 | $1,000.00 | $1,000.00 | $1,000.00 | $1,000.00 |
Value on 4/1/20 | | | | | |
Ending Account Value | $1,046.70 | $1,046.20 | $1,045.20 | $1,047.80 | $1,048.50 |
(after expenses) | | | | | |
on 9/30/20 | | | | | |
Expenses Paid | $3.03 | $4.62 | $4.72 | $1.90 | $2.26 |
During Period* | | | | | |
* Expenses are equal to the Fund’s annualized expense ratio of 0.59%, 0.90%, 0.92%, 0.37% and 0.44% for class A, C, C2, K, and Y respectively, multiplied by the average account value over the period, multiplied by 183/365 (to reflect the partial year period).
Pioneer Multi-Asset Ultrashort Income Fund | Semiannual Report | 9/30/20 19
Hypothetical Example for Comparison Purposes
The table below provides information about hypothetical account values and hypothetical expenses based on the Fund’s actual expense ratio and an assumed rate of return of 5% per year before expenses, which is not the Fund’s actual return. The hypothetical account values and expenses may not be used to estimate the actual ending account balance or expenses you paid for the period.
You may use this information to compare the ongoing costs of investing in the Fund and other funds. To do so, compare this 5% hypothetical example with the 5% hypothetical examples that appear in the shareholder reports of the other funds.
Please note that the expenses shown in the tables are meant to highlight your ongoing costs only and do not reflect any transaction costs, such as sales charges (loads) that are charged at the time of the transaction. Therefore, the table below is useful in comparing ongoing costs only and will not help you determine the relative total costs of owning different funds. In addition, if these transaction costs were included, your costs would have been higher.
Expenses Paid on a $1,000 Investment in Pioneer Multi-Asset Ultrashort Income Fund
Based on a hypothetical 5% return per year before expenses, reflecting the period from April 1, 2020 through September 30, 2020.
| | | | | | |
| Share Class | A | C | C2 | K | Y |
Beginning Account | $1,000.00 | $1,000.00 | $1,000.00 | $1,000.00 | $1,000.00 |
Value on 4/1/20 | | | | | |
Ending Account Value | $1,022.11 | $1,020.56 | $1,020.46 | $1,023.21 | $1,022.86 |
(after expenses) | | | | | |
on 9/30/20 | | | | | |
Expenses Paid | $2.99 | $4.56 | $4.66 | $1.88 | $2.23 |
During Period* | | | | | |
* Expenses are equal to the Fund’s annualized expense ratio of 0.59%, 0.90%, 0.92%, 0.37% and 0.44% for class A, C, C2, K, and Y respectively, multiplied by the average account value over the period, multiplied by 183/365 (to reflect the partial year period).
20 Pioneer Multi-Asset Ultrashort Income Fund | Semiannual Report | 9/30/20
Schedule of Investments |
9/30/20 (unaudited)
| | | | |
| Principal | | | |
| Amount | | | |
| USD ($) | | | Value |
| | UNAFFILIATED ISSUERS — 100.5% | |
| | ASSET BACKED SECURITIES — 32.9% | |
| | of Net Assets | |
| 202,372(a) | | 321 Henderson Receivables I LLC, Series 2004-A, | |
| | Class A1, 0.502% (1 Month USD LIBOR + | |
| | 35 bps), 9/15/45 (144A) | $ 197,864 |
| 285,989(a) | | 321 Henderson Receivables I LLC, Series 2006-1A, | |
| | Class A1, 0.352% (1 Month USD LIBOR + | |
| | 20 bps), 3/15/41 (144A) | 281,358 |
| 796,435(a) | | 321 Henderson Receivables I LLC, Series 2006-2A, | |
| | Class A1, 0.352% (1 Month USD LIBOR + | |
| | 20 bps), 6/15/41 (144A) | 770,189 |
| 1,148,793(a) | | 321 Henderson Receivables I LLC, Series 2006-3A, | |
| | Class A1, 0.352% (1 Month USD LIBOR + | |
| | 20 bps), 9/15/41 (144A) | 1,108,815 |
| 1,002,419(a) | | 321 Henderson Receivables I LLC, Series 2006-4A, | |
| | Class A1, 0.352% (1 Month USD LIBOR + | |
| | 20 bps), 12/15/41 (144A) | 990,808 |
| 351,422(a) | | 321 Henderson Receivables I LLC, Series 2007-1A, | |
| | Class A1, 0.352% (1 Month USD LIBOR + | |
| | 20 bps), 3/15/42 (144A) | 331,873 |
| 1,874,071(a) | | 321 Henderson Receivables LLC, Series 2005-1A, | |
| | Class A1, 0.382% (1 Month USD LIBOR + 23 bps), | |
| | 11/15/40 (144A) | 1,806,380 |
| 552,857(a) | | 522 Funding Clo I, Ltd., Series 2018-3A, Class X, 0.972% | |
| | (3 Month USD LIBOR + 70 bps), 10/20/31 (144A) | 552,869 |
| 1,460,330(a) | | ABFC Trust, Series 2004-OPT2, Class M1, 0.973% | |
| | (1 Month USD LIBOR + 83 bps), 8/25/33 | 1,449,762 |
| 202,410(a) | | ABFC Trust, Series 2005-WMC1, Class M2, 0.823% | |
| | (1 Month USD LIBOR + 68 bps), 6/25/35 | 204,263 |
| 5,216,151 | | ACC Trust, Series 2019-2, Class A, 2.82%, | |
| | 2/21/23 (144A) | 5,247,190 |
| 503,135(a) | | ACE Securities Corp. Home Equity Loan Trust, Series | |
| | 2005-WF1, Class M2, 0.808% (1 Month USD LIBOR + | |
| | 66 bps), 5/25/35 | 512,084 |
| 1,703,260(a) | | ACIS CLO, Ltd., Series 2015-6A, Class A1, 1.841% | |
| | (3 Month USD LIBOR + 159 bps), 5/1/27 (144A) | 1,701,543 |
| 2,250,366(a) | | Aegis Asset Backed Securities Trust Mortgage | |
| | Pass-Through Ctfs, Series 2004-4, Class M1, 1.048% | |
| | (1 Month USD LIBOR + 90 bps), 10/25/34 | 2,223,830 |
| 7,100,000(a) | | Aimco CLO 11, Ltd., Series 2020-11A, Class A1, 1.605% | |
| | (3 Month USD LIBOR + 138 bps), 10/15/31 (144A) | 7,100,000 |
| 135,002(a) | | Allegro CLO I, Ltd., Series 2013-1A, Class A2R, 1.918% | |
| | (3 Month USD LIBOR + 165 bps), 1/30/26 (144A) | 134,913 |
| 8,000,000 | | American Credit Acceptance Receivables Trust, Series | |
| | 2020-1, Class B, 2.08%, 12/13/23 (144A) | 8,078,283 |
| 4,188,345 | | American Credit Acceptance Receivables Trust, Series | |
| | 2020-2, Class A, 1.65%, 12/13/23 (144A) | 4,218,617 |
The accompanying notes are an integral part of these financial statements.
Pioneer Multi-Asset Ultrashort Income Fund | Semiannual Report | 9/30/20 21
Schedule of Investments | 9/30/20
(unaudited) (continued)
| | | | |
| Principal | | | |
| Amount | | | |
| USD ($) | | | Value |
| | ASSET BACKED SECURITIES — (continued) | |
| 56,762(a) | | Amortizing Residential Collateral Trust, Series | |
| | 2002-BC5, Class M1, 1.183% (1 Month USD LIBOR + | |
| | 104 bps), 7/25/32 | $ 56,554 |
| 3,877,187 | | Amur Equipment Finance Receivables V LLC, Series | |
| | 2018-1A, Class A2, 3.24%, 12/20/23 (144A) | 3,906,100 |
| 4,917,245 | | Amur Equipment Finance Receivables VI LLC, Series | |
| | 2018-2A, Class A2, 3.89%, 7/20/22 (144A) | 5,000,866 |
| 4,000,000 | | Amur Equipment Finance Receivables VII LLC, Series | |
| | 2019-1A, Class B, 2.8%, 3/20/25 (144A) | 4,022,605 |
| 206,250(a) | | Annisa CLO, Ltd., Series 2016-2A, Class X, 0.872% | |
| | (3 Month USD LIBOR + 60 bps), 7/20/31 (144A) | 206,248 |
| 321,429(a) | | Apidos CLO XXIX, Series 2018-29A, Class X, 0.795% | |
| | (3 Month USD LIBOR + 55 bps), 7/25/30 (144A) | 321,428 |
| 2,600,000(a) | | Apidos CLO XXXII, Series 2019-32A, Class X, 0.922% | |
| | (3 Month USD LIBOR + 65 bps), 1/20/33 (144A) | 2,599,997 |
| 3,067,288(a) | | Apres Static CLO, Ltd., Series 2019-1A, Class A1, | |
| | 1.445% (3 Month USD LIBOR + 117 bps), 1/15/27 (144A) | 3,059,120 |
| 11,419,857 | | Aqua Finance Trust, Series 2019-A, Class A, 3.14%, | |
| | 7/16/40 (144A) | 11,689,244 |
| 10,000,000 | | Aqua Finance Trust, Series 2020-AA, Class A, 1.9%, | |
| | 7/17/46 (144A) | 10,036,596 |
| 848,794(a) | | Argent Securities, Inc. Asset-Backed Pass-Through | |
| | Certificates, Series 2004-W11, Class M2, 1.198% | |
| | (1 Month USD LIBOR + 105 bps), 11/25/34 | 849,853 |
| 70,930(a) | | Argent Securities, Inc. Asset-Backed Pass-Through | |
| | Certificates, Series 2005-W3, Class A2D, 0.488% | |
| | (1 Month USD LIBOR + 34 bps), 11/25/35 | 70,716 |
| 6,552,470 | | Arivo Acceptance Auto Loan Receivables Trust, Series | |
| | 2019-1, Class A, 2.99%, 7/15/24 (144A) | 6,663,814 |
| 19,651,783 | | Ascentium Equipment Receivables, Series 2019-2A, | |
| | Class A2, 2.24%, 6/10/22 (144A) | 19,801,828 |
| 122,779(a) | | Asset Backed Securities Corp. Home Equity Loan | |
| | Trust, Series 2005-HE4, Class M4, 1.093% (1 Month | |
| | USD LIBOR + 95 bps), 5/25/35 | 122,778 |
| 14,817(a) | | Asset-Backed Pass-Through Certificates, Series | |
| | 2004-R2, Class A1A, 0.838% (1 Month USD LIBOR + | |
| | 69 bps), 4/25/34 | 14,787 |
| 156,004(a) | | Asset-Backed Pass-Through Certificates, Series | |
| | 2004-R2, Class A1B, 0.768% (1 Month USD LIBOR + | |
| | 62 bps), 4/25/34 | 155,693 |
| 14,095,111(a) | | Atlas Senior Loan Fund III, Ltd., Series 2013-1A, | |
| | Class AR, 1.11% (3 Month USD LIBOR + | |
| | 83 bps), 11/17/27 (144A) | 13,898,724 |
| 745,791(a) | | Atlas Senior Loan Fund XII, Ltd., Series 2018-12A, | |
| | Class X, 1.014% (3 Month USD LIBOR + | |
| | 75 bps), 10/24/31 (144A) | 745,765 |
| 697,037 | | Avant Loans Funding Trust, Series 2019-A, Class A, | |
| | 3.48%, 7/15/22 (144A) | 697,797 |
The accompanying notes are an integral part of these financial statements.
22 Pioneer Multi-Asset Ultrashort Income Fund | Semiannual Report | 9/30/20
| | | | |
| Principal | | | |
| Amount | | | |
| USD ($) | | | Value |
| | ASSET BACKED SECURITIES — (continued) | |
| 2,919,418 | | Avant Loans Funding Trust, Series 2019-B, Class A, | |
| | 2.72%, 10/15/26 (144A) | $ 2,930,673 |
| 290,009 | | Avid Automobile Receivables Trust, Series 2018-1, | |
| | Class A, 2.84%, 8/15/23 (144A) | 290,449 |
| 4,672,074 | | Avid Automobile Receivables Trust, Series 2019-1, | |
| | Class A, 2.62%, 2/15/24 (144A) | 4,720,688 |
| 633,333(a) | | Babson CLO, Ltd., Series 2015-IA, Class XR, 0.822% | |
| | (3 Month USD LIBOR + 55 bps), 1/20/31 (144A) | 633,330 |
| 50,000(a) | | Barings CLO, Ltd., Series 2018-2A, Class X, 0.875% | |
| | (3 Month USD LIBOR + 60 bps), 4/15/30 (144A) | 50,000 |
| 833,332(a) | | Barings CLO, Ltd., Series 2019-1A, Class X, 1.025% | |
| | (3 Month USD LIBOR + 75 bps), 4/15/31 (144A) | 833,331 |
| 6,250,000(a) | | Barings Middle Market CLO, Ltd., Series 2018-IA, | |
| | Class A1, 1.805% (3 Month USD LIBOR + | |
| | 153 bps), 1/15/31 (144A) | 6,086,244 |
| 1,125,000(a) | | Battery Park CLO, Ltd., Series 2019-1A, Class X, 0.925% | |
| | (3 Month USD LIBOR + 65 bps), 7/15/32 (144A) | 1,124,999 |
| 2,375,324 | | BCC Funding XIV LLC, Series 2018-1A, Class A2, 2.96%, | |
| | 6/20/23 (144A) | 2,384,205 |
| 2,500,000(a) | | BDS, Ltd., Series 2020-FL5, Class C, 2.2% (1 Month USD | |
| | LIBOR + 205 bps), 2/16/37 (144A) | 2,427,742 |
| 1,203,125(a) | | Bean Creek CLO, Ltd., Series 2015-1A, Class XR, 0.872% | |
| | (3 Month USD LIBOR + 60 bps), 4/20/31 (144A) | 1,203,102 |
| 70,823(a) | | Bear Stearns Asset Backed Securities I Trust, Series | |
| | 2005-TC1, Class M1, 0.808% (1 Month USD LIBOR | |
| | + 66 bps), 5/25/35 | 70,790 |
| 314,525(a) | | Bear Stearns Asset Backed Securities Trust, Series | |
| | 2001-3, Class A1, 1.048% (1 Month USD LIBOR + | |
| | 90 bps), 10/27/32 | 308,675 |
| 391,248(a) | | BlueMountain CLO, Ltd., Series 2013-2A, Class X, 0.908% | |
| | (3 Month USD LIBOR + 65 bps), 10/22/30 (144A) | 391,238 |
| 252,517(a) | | BlueMountain CLO, Ltd., Series 2018-2A, Class X, 0.93% | |
| | (3 Month USD LIBOR + 65 bps), 8/15/31 (144A) | 252,510 |
| 2,250,000(a) | | California Street CLO IX LP, Series 2012-9A, Class XR2, | |
| | 0.971% (3 Month USD LIBOR + 70 bps), 7/16/32 (144A) | 2,249,858 |
| 508,962(a) | | Carlyle US CLO, Ltd., Series 2019-4A, Class M, 0.925% | |
| | (3 Month USD LIBOR + 65 bps), 1/15/33 (144A) | 508,912 |
| 7,513,901 | | Carnow Auto Receivables Trust, Series 2019-1A, | |
| | Class A, 2.72%, 11/15/22 (144A) | 7,570,566 |
| 1,564,570 | | Carvana Auto Receivables Trust, Series 2019-4A, | |
| | Class A2, 2.2%, 7/15/22 (144A) | 1,571,018 |
| 8,000,000 | | Carvana Auto Receivables Trust, Series 2020-N1A, | |
| | Class B, 2.01%, 3/17/25 (144A) | 8,163,799 |
| 5,000,000 | | Carvana Auto Receivables Trust, Series 2020-N1A, | |
| | Class D, 3.43%, 1/15/26 (144A) | 5,188,816 |
| 627,089 | | Cazenovia Creek Funding II LLC, Series 2018-1A, | |
| | Class B, 3.984%, 7/15/30 (144A) | 623,371 |
The accompanying notes are an integral part of these financial statements.
Pioneer Multi-Asset Ultrashort Income Fund | Semiannual Report | 9/30/20 23
Schedule of Investments | 9/30/20
(unaudited) (continued)
| | | | |
| Principal | | | |
| Amount | | | |
| USD ($) | | | Value |
| | ASSET BACKED SECURITIES — (continued) | |
| 5,000,000(a) | | CBAM, Ltd., Series 2017-3A, Class A, 1.503% | |
| | (3 Month USD LIBOR + 123 bps), 10/17/29 (144A) | $ 4,975,385 |
| 687,500(a) | | Cent CLO 21, Ltd., Series 2014-21A, Class XR2, | |
| | 0.895% (3 Month USD LIBOR + 65 bps), | |
| | 7/27/30 (144A) | 687,499 |
| 29,619(b) | | Centex Home Equity Loan Trust, Series 2003-A, | |
| | Class AF6, 3.654%, 3/25/33 | 29,676 |
| 1,500,000(a) | | Cerberus Loan Funding XXVIII LP, Series 2020-1A, | |
| | Class A, 0.0% (3 Month USD LIBOR + | |
| | 185 bps), 10/15/31 (144A) | 1,500,000 |
| 93,750(a) | | CFIP CLO, Ltd., Series 2018-1A, Class X, 1.022% | |
| | (3 Month USD LIBOR + 75 bps), 7/18/31 (144A) | 93,750 |
| 4,699,013(b) | | CFMT LLC, Series 2020-HB3, Class A, 2.812%, 5/25/30 | |
| | (144A) | 4,739,458 |
| 5,750,000 | | Chase Auto Credit Linked Notes, Series 2020-1, Class B, | |
| | 0.991%, 1/25/28 (144A) | 5,758,470 |
| 304,323 | | Chesapeake Funding II LLC, Series 2017-2A, Class A1, | |
| | 1.99%, 5/15/29 (144A) | 305,067 |
| 666,467(a) | | Chesapeake Funding II LLC, Series 2017-2A, Class A2, | |
| | 0.602% (1 Month USD LIBOR + 45 bps), 5/15/29 | |
| | (144A) | 666,427 |
| 1,352,096(a) | | Chesapeake Funding II LLC, Series 2017-3A, Class A2, | |
| | 0.492% (1 Month USD LIBOR + 34 bps), 8/15/29 | |
| | (144A) | 1,351,360 |
| 2,794,743(a) | | Chesapeake Funding II LLC, Series 2018-1A, Class A2, | |
| | 0.602% (1 Month USD LIBOR + 45 bps), 4/15/30 | |
| | (144A) | 2,801,511 |
| 16,315,000(a) | | CIFC Funding Ltd., Series 2015-3A, Class AR, 1.142% | |
| | (3 Month USD LIBOR + 87 bps), 4/19/29 (144A) | 16,121,227 |
| 714,286(a) | | CIFC Funding, Ltd., Series 2014-4RA, Class X, 0.823% | |
| | (3 Month USD LIBOR + 55 bps), 10/17/30 (144A) | 714,285 |
| 4,711,523 | | CIG Auto Receivables Trust, Series 2019-1A, Class A, | |
| | 3.33%, 8/15/24 (144A) | 4,767,363 |
| 3,200,000 | | CIG Auto Receivables Trust, Series 2020-1A, Class A, | |
| | 0.68%, 10/12/23 (144A) | 3,200,303 |
| 2,375,342(a) | | CIM Small Business Loan Trust, Series 2018-1A, | |
| | Class A, 1.558% (1 Month USD LIBOR + 140 bps), | |
| | 3/20/43 (144A) | 2,324,183 |
| 10,000,000(a) | | Citibank Credit Card Issuance Trust, Series 2017-A7, | |
| | Class A7, 0.524% (1 Month USD LIBOR + | |
| | 37 bps), 8/8/24 | 10,037,606 |
| 1,178,291(a) | | Citigroup Mortgage Loan Trust, Inc., Series 2006-WFH1, | |
| | Class M3, 0.748% (1 Month USD LIBOR + | |
| | 60 bps), 1/25/36 | 1,176,951 |
| 312,500(a) | | Clear Creek CLO, Series 2015-1A, Class X, 1.272% | |
| | (3 Month USD LIBOR + 100 bps), 10/20/30 (144A) | 312,492 |
| 3,250,000(a) | | Cole Park CLO, Ltd., Series 2015-1A, Class AR, 1.322% | |
| | (3 Month USD LIBOR + 105 bps), 10/20/28 (144A) | 3,232,469 |
The accompanying notes are an integral part of these financial statements.
24 Pioneer Multi-Asset Ultrashort Income Fund | Semiannual Report | 9/30/20
| | | | |
| Principal | | | |
| Amount | | | |
| USD ($) | | | Value |
| | ASSET BACKED SECURITIES — (continued) | |
| 875,000(a) | | Columbia Cent CLO 28, Ltd., Series 2018-28A, Class X, | |
| | | 0.892% (3 Month USD LIBOR + 65 bps), | |
| | | 11/7/30 (144A) | $ 874,998 |
| 1,347,777 | | Commonbond Student Loan Trust, Series 2016-B, | |
| | | Class A1, 2.73%, 10/25/40 (144A) | 1,367,382 |
| 201,398(a) | | Commonbond Student Loan Trust, Series 2016-B, | |
| | | Class A2, 1.598% (1 Month USD LIBOR + 145 bps), | |
| | | 10/25/40 (144A) | 201,795 |
| 1,849,523(a) | | Commonbond Student Loan Trust, Series 2017-AGS, | |
| | | Class A2, 0.998% (1 Month USD LIBOR + | |
| | | 85 bps), 5/25/41 (144A) | 1,839,171 |
| 3,548,309(a) | | Commonbond Student Loan Trust, Series 2017-BGS, | |
| | | Class A2, 0.798% (1 Month USD LIBOR + | |
| | | 65 bps), 9/25/42 (144A) | 3,524,636 |
| 2,890,916(a) | | Commonbond Student Loan Trust, Series 2018-AGS, | |
| | | Class A2, 0.648% (1 Month USD LIBOR + | |
| | | 50 bps), 2/25/44 (144A) | 2,847,554 |
| 5,891,004(a) | | Commonbond Student Loan Trust, Series 2018-BGS, | |
| | | Class A2, 0.718% (1 Month USD LIBOR + | |
| | | 57 bps), 9/25/45 (144A) | 5,819,258 |
| 4,196,638(a) | | Commonbond Student Loan Trust, Series 2018-CGS, | |
| | | Class A2, 0.948% (1 Month USD LIBOR + | |
| | | 80 bps), 2/25/46 (144A) | 4,152,102 |
| 7,294,106(a) | | Commonbond Student Loan Trust, Series 2019-AGS, | |
| | | Class A2, 1.048% (1 Month USD LIBOR + | |
| | | 90 bps), 1/25/47 (144A) | 7,273,866 |
| 99,333 | | Conn’s Receivables Funding LLC, Series 2018-A, | |
| | | Class A, 3.25%, 1/15/23 (144A) | 99,357 |
| 157,606 | | Conn’s Receivables Funding LLC, Series 2018-A, | |
| | | Class B, 4.65%, 1/15/23 (144A) | 157,497 |
| 995,319 | | Conn’s Receivables Funding LLC, Series 2019-A, | |
| | | Class A, 3.4%, 10/16/23 (144A) | 997,226 |
| 3,110,529 | | Conn’s Receivables Funding LLC, Series 2019-A, | |
| | | Class B, 4.36%, 10/16/23 (144A) | 3,111,002 |
| 3,334,388 | | Conn’s Receivables Funding LLC, Series 2019-B, | |
| | | Class A, 2.66%, 6/17/24 (144A) | 3,333,389 |
| 80,945(a) | | Conseco Finance Home Equity Loan Trust, Series | |
| | | 2002-C, Class MV1, 1.652% (1 Month USD LIBOR + | |
| | | 150 bps), 5/15/32 | 80,754 |
| 1,753,939 | | Consumer Lending Receivables Trust, Series 2019-A, | |
| | | Class A, 3.52%, 4/15/26 (144A) | 1,757,145 |
| 17,880,392 | | Consumer Loan Underlying Bond Club Certificate | |
| | Issuer Trust, Series 2019-HP1, Class A, 2.59%, | |
| | | 12/15/26 (144A) | 18,083,196 |
| 6,437,763 | | Consumer Loan Underlying Bond CLUB Credit Trust, | |
| | | Series 2020-P1, Class A, 2.26%, 3/15/28 (144A) | 6,486,436 |
| 531,539 | | Consumer Loan Underlying Bond Credit Trust, Series | |
| | | 2018-P2, Class A, 3.47%, 10/15/25 (144A) | 532,659 |
The accompanying notes are an integral part of these financial statements.
Pioneer Multi-Asset Ultrashort Income Fund | Semiannual Report | 9/30/20 25
Schedule of Investments | 9/30/20
(unaudited) (continued)
| | | | |
| Principal | | | |
| Amount | | | |
| USD ($) | | | Value |
| | ASSET BACKED SECURITIES — (continued) | |
| 2,268,594 | | Consumer Loan Underlying Bond Credit Trust, Series | |
| | 2019-P1, Class A, 2.94%, 7/15/26 (144A) | $ 2,285,685 |
| 82,288(a) | | Countrywide Asset-Backed Certificates, Series 2005-9, | |
| | Class M1, 0.668% (1 Month USD LIBOR + | |
| | 52 bps), 1/25/36 | 82,215 |
| 87,498(a) | | Countrywide Asset-Backed Certificates, Series 2006-3, | |
| | Class 2A3, 0.438% (1 Month USD LIBOR + | |
| | 29 bps), 6/25/36 | 87,420 |
| 2,792,309(a) | | Countrywide Asset-Backed Certificates, Series 2006-4, | |
| | Class 2A3, 0.438% (1 Month USD LIBOR + | |
| | 29 bps), 7/25/36 | 2,784,834 |
| 5,000,000 | | Credit Acceptance Auto Loan Trust, Series 2020-1A, | |
| | Class C, 2.59%, 6/15/29 (144A) | 5,063,265 |
| 1,020,919(a) | | Credit Suisse Seasoned Loan Trust, Series 2006-1, | |
| | Class A, 0.388% (1 Month USD LIBOR + | |
| | 24 bps), 10/25/34 (144A) | 1,020,055 |
| 57,526(a) | | Credit-Based Asset Servicing & Securitization LLC, | |
| | Series 2005-CB3, Class M2, 1.078% (1 Month USD | |
| | LIBOR + 93 bps), 6/25/35 | 57,526 |
| 294,348(a) | | CSFB Mortgage-Backed Pass-Through Certificates, | |
| | Series 2005-AGE1, Class M3, 0.798% (1 Month USD | |
| | LIBOR + 65 bps), 2/25/32 | 294,241 |
| 46,662(a) | | CWABS Asset-Backed Certificates Trust, Series | |
| | 2005-17, Class 3AV2, 0.488% (1 Month USD LIBOR + | |
| | 34 bps), 5/25/36 | 46,606 |
| 335,982(a) | | CWABS Asset-Backed Certificates Trust, Series | |
| | 2005-AB1, Class M1, 0.778% (1 Month USD LIBOR + | |
| | 63 bps), 8/25/35 | 335,637 |
| 1,612,232(a) | | CWHEQ Revolving Home Equity Loan Resuritization | |
| | Trust, Series 2006-RES, Class 4M1A, 0.432% (1 Month | |
| | USD LIBOR + 28 bps), 2/15/34 (144A) | 1,581,218 |
| 2,314,925(a) | | CWHEQ Revolving Home Equity Loan Resuritization | |
| | Trust, Series 2006-RES, Class 4N1A, 0.432% (1 Month | |
| | USD LIBOR + 28 bps), 2/15/34 (144A) | 2,257,045 |
| 157,636 | | Dell Equipment Finance Trust, Series 2018-2, Class A3, | |
| | 3.37%, 10/22/23 (144A) | 159,165 |
| 3,781,738 | | Dell Equipment Finance Trust, Series 2020-1, Class A1, | |
| | 1.983%, 5/21/21 (144A) | 3,794,234 |
| 2,000,000 | | Dell Equipment Finance Trust, Series 2020-1, Class A2, | |
| | 2.26%, 6/22/22 (144A) | 2,032,948 |
| 120 | | Delta Funding Home Equity Loan Trust, Series 1997-2, | |
| | Class A6, 7.04%, 6/25/27 | 114 |
| 3,189,734 | | Diamond Resorts Owner Trust, Series 2016-1, Class B, | |
| | 3.37%, 11/20/28 (144A) | 3,188,618 |
| 5,927,945 | | DLL LLC, Series 2018-ST2, Class A3, 3.46%, | |
| | 1/20/22 (144A) | 5,980,173 |
| 448,336(a) | | DRB Prime Student Loan Trust, Series 2015-D, | |
| | Class A1, 1.848% (1 Month USD LIBOR + 170 bps), | |
| | 1/25/40 (144A) | 449,731 |
The accompanying notes are an integral part of these financial statements.
26 Pioneer Multi-Asset Ultrashort Income Fund | Semiannual Report | 9/30/20
| | | | |
| Principal | | | |
| Amount | | | |
| USD ($) | | | Value |
| | ASSET BACKED SECURITIES — (continued) | |
| 227,914(a) | | DRB Prime Student Loan Trust, Series 2016-B, | |
| | Class A1, 1.948% (1 Month USD LIBOR + 180 bps), | |
| | 6/25/40 (144A) | $ 229,531 |
| 85,227 | | DRB Prime Student Loan Trust, Series 2016-B, | |
| | Class A3, 2.23%, 6/25/36 (144A) | 85,369 |
| 1,337,348(a) | | DRB Prime Student Loan Trust, Series 2017-A, | |
| | Class A1, 0.998% (1 Month USD LIBOR + 85 bps), | |
| | 5/27/42 (144A) | 1,335,910 |
| 1,991,674 | | Drive Auto Receivables Trust, Series 2020-2, Class A2A, | |
| | 0.85%, 7/17/23 | 1,995,114 |
| 1,903,687(a) | | Drug Royalty III LP 1, Series 2017-1A, Class A1, 2.775% | |
| | (3 Month USD LIBOR + 250 bps), 4/15/27 (144A) | 1,902,370 |
| 1,883,304(a) | | Drug Royalty III LP 1, Series 2018-1A, Class A1, 1.875% | |
| | (3 Month USD LIBOR + 160 bps), 10/15/31 (144A) | 1,853,474 |
| 1,499,540(a) | | Dryden 33 Senior Loan Fund, Series 2014-33A, | |
| | Class AR2, 1.505% (3 Month USD LIBOR + 123 bps), | |
| | 4/15/29 (144A) | 1,493,921 |
| 1,406,250(a) | | Dryden 80 CLO, Ltd., Series 2019-80A, Class X, 1.173% | |
| | (3 Month USD LIBOR + 90 bps), 1/17/33 (144A) | 1,406,247 |
| 5,589,974 | | DT Auto Owner Trust, Series 2020-1A, Class A, 1.94%, | |
| | 9/15/23 (144A) | 5,624,897 |
| 253,365(a) | | Earnest Student Loan Program LLC, Series 2016-C, | |
| | Class A1, 1.998% (1 Month USD LIBOR + | |
| | 185 bps), 10/27/36 (144A) | 254,273 |
| 236,244(a) | | Earnest Student Loan Program LLC, Series 2016-D, | |
| | Class A1, 1.548% (1 Month USD LIBOR + | |
| | 140 bps), 1/25/41 (144A) | 236,779 |
| 800,082(a) | | Earnest Student Loan Program LLC, Series 2017-A, | |
| | Class A1, 1.148% (1 Month USD LIBOR + | |
| | 100 bps), 1/25/41 (144A) | 799,539 |
| 15,950,000(a) | | Elevation CLO, Ltd., Series 2015-4A, Class CR, 2.472% | |
| | (3 Month USD LIBOR + 220 bps), 4/18/27 (144A) | 15,809,959 |
| 2,000,000(a) | | Elm CLO, Ltd., Series 2014-1A, Class BRR, 2.023% | |
| | (3 Month USD LIBOR + 175 bps), 1/17/29 (144A) | 1,984,046 |
| 2,000,000(a) | | Elmwood CLO IV, Ltd., Series 2020-1A, Class X, | |
| | 1.882% (3 Month USD LIBOR + 70 bps), 4/15/33 (144A) | 1,973,170 |
| 1,000,000(a) | | Evergreen Credit Card Trust, Series 2019-1, Class A, | |
| | 0.632% (1 Month USD LIBOR + 48 bps), 1/15/23 | |
| | (144A) | 1,001,099 |
| 1,904,365 | | FCI Funding LLC, Series 2019-1A, Class A, 3.63%, | |
| | 2/18/31 (144A) | 1,937,634 |
| 12,015,791 | | FHF Trust, Series 2020-1A, Class A, 2.59%, 12/15/23 | |
| | (144A) | 12,066,699 |
| 16,915,943(b) | | Finance of America HECM Buyout, Series 2020-HB1, | |
| | Class A, 2.012%, 2/25/30 (144A) | 17,024,171 |
| 35,149(a) | | First Franklin Mortgage Loan Trust, Series 2004-FF4, | |
| | Class M1, 1.003% (1 Month USD LIBOR + | |
| | 86 bps), 6/25/34 | 35,050 |
The accompanying notes are an integral part of these financial statements.
Pioneer Multi-Asset Ultrashort Income Fund | Semiannual Report | 9/30/20 27
Schedule of Investments | 9/30/20
(unaudited) (continued)
| | | | |
| Principal | | | |
| Amount | | | |
| USD ($) | | | Value |
| | ASSET BACKED SECURITIES — (continued) | |
| 128,019(a) | | First Franklin Mortgage Loan Trust, Series 2005-FFH2, | |
| | | Class M2, 0.958% (1 Month USD LIBOR + | |
| | | 81 bps), 4/25/35 (144A) | $ 127,993 |
| 2,534,882 | | First Investors Auto Owner Trust, Series 2019-1A, | |
| | | Class A, 2.89%, 3/15/24 (144A) | 2,567,086 |
| 20,033,423 | | First Investors Auto Owner Trust, Series 2020-1A, | |
| | | Class A, 1.49%, 1/15/25 (144A) | 20,201,802 |
| 6,510,000 | | First Investors Auto Owner Trust, Series 2020-1A, | |
| | | Class B, 1.85%, 2/17/26 (144A) | 6,648,870 |
| 9,000,000(a) | | First National Master Note Trust, Series 2017-2, | |
| | | Class A, 0.592% (1 Month USD LIBOR + | |
| | | 44 bps), 10/16/23 | 8,999,845 |
| 2,000,000 | | Ford Credit Auto Owner Trust, Series 2016-2, Class A, | |
| | | 2.03%, 12/15/27 (144A) | 2,023,121 |
| 12,975,000(a) | | Fort CRE LLC, Series 2018-1A, Class A1, 1.502% | |
| | | (1 Month USD LIBOR + 135 bps), 11/16/35 (144A) | 12,713,556 |
| 500,000(a) | | Fort Washington CLO, Series 2019-1A, Class A, 1.692% | |
| | | (3 Month USD LIBOR + 142 bps), 10/20/32 (144A) | 489,526 |
| 3,600,000(a) | | Fortress Credit Opportunities IX CLO, Ltd., Series | |
| | | 2017-9A, Class A1T, 1.83% (3 Month USD LIBOR + | |
| | | 155 bps), 11/15/29 (144A) | 3,576,622 |
| 3,000,000(a) | | Fortress Credit Opportunities IX CLO, Ltd., Series | |
| | | 2020-13A, Class A, 2.518% (3 Month USD LIBOR + | |
| | | 225 bps), 7/15/28 (144A) | 3,000,891 |
| 2,750,000(a) | | Fortress Credit Opportunities VI CLO, Ltd., Series | |
| | | 2015-6A, Class A1TR, 1.633% (3 Month USD LIBOR + | |
| | | 136 bps), 7/10/30 (144A) | 2,667,987 |
| 2,924,447 | | Foursight Capital Automobile Receivables Trust, Series | |
| | | 2019-1, Class A2, 2.58%, 3/15/23 (144A) | 2,943,514 |
| 5,939,030 | | Foursight Capital Automobile Receivables Trust, Series | |
| | | 2020-1, Class A2, 1.97%, 9/15/23 (144A) | 5,989,154 |
| 2,500,000 | | Foursight Capital Automobile Receivables Trust, Series | |
| | | 2020-1, Class B, 2.27%, 2/18/25 (144A) | 2,570,460 |
| 3,584,692 | | Freed ABS Trust, Series 2020-2CP, Class A, 4.52%, | |
| | | 6/18/27 (144A) | 3,628,374 |
| 4,883,220 | | Freed ABS Trust, Series 2020-FP1, Class A, 2.52%, | |
| | | 3/18/27 (144A) | 4,885,174 |
| 1,835,494(a) | | Fremont Home Loan Trust, Series 2005-E, Class 1A1, | |
| | | 0.378% (1 Month USD LIBOR + 23 bps), 1/25/36 | 1,829,799 |
| 4,892,125(a) | | Fremont Home Loan Trust, Series 2006-2, Class 1A1, | |
| | | 0.308% (1 Month USD LIBOR + 16 bps), 2/25/36 | 4,840,698 |
| 6,647,615 | | Genesis Private Label Amortizing Trust, Series 2020-1, | |
| | | Class A, 2.08%, 7/20/30 (144A) | 6,655,685 |
| 411,540(a) | | GE-WMC Asset-Backed Pass-Through Certificates, | |
| | | Series 2005-2, Class A1, 0.598% (1 Month USD LIBOR + | |
| | | 45 bps), 12/25/35 | 411,553 |
| 1,588,749 | | GLS Auto Receivables Issuer Trust, Series 2019-1A, | |
| | | Class A, 3.37%, 1/17/23 (144A) | 1,599,589 |
The accompanying notes are an integral part of these financial statements.
28 Pioneer Multi-Asset Ultrashort Income Fund | Semiannual Report | 9/30/20
| | | | |
| Principal | | | |
| Amount | | | |
| USD ($) | | | Value |
| | ASSET BACKED SECURITIES — (continued) | |
| 5,162,780 | | GLS Auto Receivables Issuer Trust, Series 2019-3A, | |
| | | Class A, 2.58%, 7/17/23 (144A) | $ 5,213,511 |
| 3,000,000 | | GLS Auto Receivables Issuer Trust, Series 2019-3A, | |
| | | Class B, 2.72%, 6/17/24 (144A) | 3,072,379 |
| 5,182,030 | | GLS Auto Receivables Issuer Trust, Series 2019-4A, | |
| | | Class A, 2.47%, 11/15/23 (144A) | 5,244,758 |
| 5,231,408 | | GLS Auto Receivables Issuer Trust, Series 2020-2A, | |
| | | Class A, 1.58%, 8/15/24 (144A) | 5,281,743 |
| 800,000 | | GLS Auto Receivables Trust, Series 2018-1A, Class B, | |
| | | 3.52%, 8/15/23 (144A) | 812,423 |
| 595,756 | | GLS Auto Receivables Trust, Series 2018-3A, Class A, | |
| | | 3.35%, 8/15/22 (144A) | 597,078 |
| 3,800,318(a) | | GM Financial Automobile Leasing Trust, Series 2019-3, | |
| | | Class A2B, 0.426% (1 Month USD LIBOR + | |
| | | 27 bps), 10/20/21 | 3,801,276 |
| 2,756,992 | | Gold Key Resorts LLC, Series 2014-A, Class B, 3.72%, | |
| | | 3/17/31 (144A) | 2,771,066 |
| 312,500(a) | | Goldentree Loan Management US CLO 3, Ltd., Series | |
| | | 2018-3A, Class X, 0.822% (3 Month USD LIBOR + | |
| | | 55 bps), 4/20/30 (144A) | 312,500 |
| 933,333(a) | | Goldentree Loan Management US CLO 5, Ltd., Series | |
| | | 2019-5A, Class X, 0.772% (3 Month USD LIBOR + | |
| | | 50 bps), 10/20/32 (144A) | 933,332 |
| 700,000(a) | | Goldentree Loan Management US Clo 8 Ltd., Series | |
| | | 2020-8A, Class X, 1.053% (3 Month USD LIBOR + | |
| | | 85 bps), 7/20/31 (144A) | 699,996 |
| 3,000,000(a) | | Golub Capital Partners CLO 24M-R, Ltd., Series | |
| | | 2015-24A, Class AR, 1.849% (3 Month USD LIBOR + | |
| | | 160 bps), 11/5/29 (144A) | 2,922,888 |
| 1,821,000(a) | | Golub Capital Partners CLO 25M, Ltd., Series 2015-25A, | |
| | | Class AR, 1.629% (3 Month USD LIBOR + | |
| | | 138 bps), 5/5/30 (144A) | 1,759,610 |
| 10,000,000(a) | | Golub Capital Partners CLO 34M, Ltd., Series 2017-34A, | |
| | | Class AR, 1.949% (3 Month USD LIBOR + | |
| | | 170 bps), 3/14/31 (144A) | 9,806,360 |
| 5,000,000(a) | | Golub Capital Partners CLO 46M, Ltd., Series 2019-46A, | |
| | | Class A1A, 2.935% (3 Month USD LIBOR + | |
| | | 180 bps), 4/20/32 (144A) | 4,886,215 |
| 1,512,751 | | GreatAmerica Leasing Receivables Funding LLC, Series | |
| | | 2019-1, Class A2, 2.97%, 6/15/21 (144A) | 1,516,694 |
| 1,827,778(a) | | Greywolf CLO III, Ltd., Series 2020-3RA, Class XR, | |
| | | 0.758% (3 Month USD LIBOR + 50 bps), 4/15/33 (144A) | 1,812,183 |
| 24,313(a) | | GSRPM Mortgage Loan Trust, Series 2006-1, Class A1, | |
| | | 0.448% (1 Month USD LIBOR + 30 bps), 3/25/35 (144A) | 24,268 |
| 4,133,716(a) | | HANA SBA LOAN TRUST, Series 2019-1, Class A, | |
| | | 2.185% (1 Month USD LIBOR + 200 bps), | |
| | | 8/25/45 (144A) | 3,976,947 |
| 833,333(a) | | Harbor Park CLO, Ltd., Series 2018-1A, Class X, 1.172% | |
| | | (3 Month USD LIBOR + 90 bps), 1/20/31 (144A) | 833,332 |
The accompanying notes are an integral part of these financial statements.
Pioneer Multi-Asset Ultrashort Income Fund | Semiannual Report | 9/30/20 29
Schedule of Investments | 9/30/20
(unaudited) (continued)
| | | | |
| Principal | | | |
| Amount | | | |
| USD ($) | | | Value |
| | ASSET BACKED SECURITIES — (continued) | |
| 30,819 | | Hero Residual Funding, Series 2016-1R, Class A1, | |
| | | 4.5%, 9/21/42 (144A) | $ 30,938 |
| 587,853(a) | | Hertz Fleet Lease Funding LP, Series 2017-1, Class A1, | |
| | | 0.806% (1 Month USD LIBOR + 65 bps), 4/10/31 (144A) | 587,674 |
| 3,310,031(a) | | Hertz Fleet Lease Funding LP, Series 2018-1, Class A1, | |
| | | 0.656% (1 Month USD LIBOR + 50 bps), 5/10/32 (144A) | 3,298,739 |
| 275,598(a) | | Hertz Fleet Lease Funding LP, Series 2019-1, Class A1, | |
| | | 0.626% (1 Month USD LIBOR + 47 bps), 1/10/33 (144A) | 276,229 |
| 4,000,000 | | HOA Funding LLC, Series 2015-1A, Class B, 9.0%, | |
| | | 8/20/44 (144A) | 3,705,786 |
| 86,511(a) | | Home Equity Asset Trust, Series 2004-8, Class M1, | |
| | | 1.018% (1 Month USD LIBOR + 87 bps), 3/25/35 | 86,460 |
| 1,903,461(a) | | Home Equity Asset Trust, Series 2005-3, Class M4, | |
| | | 0.788% (1 Month USD LIBOR + 64 bps), 8/25/35 | 1,903,093 |
| 78,600(a) | | Home Equity Asset Trust, Series 2005-7, Class M1, | |
| | | 0.598% (1 Month USD LIBOR + 45 bps), 1/25/36 | 78,312 |
| 2,239,760(a) | | Home Equity Asset Trust, Series 2006-3, Class 2A4, | |
| | | 0.458% (1 Month USD LIBOR + 31 bps), 7/25/36 | 2,237,803 |
| 3,000,000(a) | | Home Partners of America Trust, Series 2017-1, | |
| | | Class C, 1.701% (1 Month USD LIBOR + 155 bps), | |
| | | 7/17/34 (144A) | 2,997,514 |
| 2,500,000(a) | | Home Partners of America Trust, Series 2017-1, Class D, | |
| | | 2.051% (1 Month USD LIBOR + 190 bps), | |
| | | 7/17/34 (144A) | 2,498,625 |
| 2,000,000(a) | | Home Partners of America Trust, Series 2018-1, Class C, | |
| | | 1.401% (1 Month USD LIBOR + 125 bps), | |
| | | 7/17/37 (144A) | 1,998,749 |
| 6,848,604 | | HPEFS Equipment Trust, Series 2019-1A, Class A2, | |
| | | 2.19%, 9/20/29 (144A) | 6,888,268 |
| 528,427(a) | | HSI Asset Securitization Corp. Trust, Series 2006-OPT1, | |
| | | Class 2A4, 0.448% (1 Month USD LIBOR + | |
| | | 30 bps), 12/25/35 | 527,867 |
| 156,988(a) | | HSI Asset Securitization Corp. Trust, Series 2006-OPT2, | |
| | | Class M1, 0.518% (1 Month USD LIBOR + | |
| | | 37 bps), 1/25/36 | 157,269 |
| 2,067,000(a) | | Invitation Homes Trust, Series 2017-SFR2, Class C, | |
| | | 1.601% (1 Month USD LIBOR + 145 bps), | |
| | | 12/17/36 (144A) | 2,072,142 |
| 10,981,389(a) | | Invitation Homes Trust, Series 2018-SFR1, Class A, | |
| | | 0.851% (1 Month USD LIBOR + 70 bps), | |
| | | 3/17/37 (144A) | 10,865,342 |
| 4,000,000(a) | | Invitation Homes Trust, Series 2018-SFR1, Class B, | |
| | | 1.101% (1 Month USD LIBOR + 95 bps), | |
| | | 3/17/37 (144A) | 3,961,454 |
| 7,165,000(a) | | Invitation Homes Trust, Series 2018-SFR1, Class D, | |
| | | 1.601% (1 Month USD LIBOR + 145 bps), | |
| | | 3/17/37 (144A) | 7,156,115 |
The accompanying notes are an integral part of these financial statements.
30 Pioneer Multi-Asset Ultrashort Income Fund | Semiannual Report | 9/30/20
| | | | |
| Principal | | | |
| Amount | | | |
| USD ($) | | | Value |
| | ASSET BACKED SECURITIES — (continued) | |
| 5,479,251(a) | | Invitation Homes Trust, Series 2018-SFR1, Class E, | |
| | 2.151% (1 Month USD LIBOR + 200 bps), | |
| | 3/17/37 (144A) | $ 5,485,232 |
| 1,750,000(a) | | Invitation Homes Trust, Series 2018-SFR2, Class C, | |
| | 1.432% (1 Month USD LIBOR + 128 bps), | |
| | 6/17/37 (144A) | 1,748,063 |
| 10,000,000(a) | | Invitation Homes Trust, Series 2018-SFR2, Class D, | |
| | 1.602% (1 Month USD LIBOR + 145 bps), | |
| | 6/17/37 (144A) | 9,981,284 |
| 6,856,743(a) | | Invitation Homes Trust, Series 2018-SFR3, Class E, | |
| | 2.151% (1 Month USD LIBOR + 200 bps), | |
| | 7/17/37 (144A) | 6,861,298 |
| 13,821,000(a) | | Invitation Homes Trust, Series 2018-SFR4, Class E, | |
| | 2.101% (1 Month USD LIBOR + 195 bps), | |
| | 1/17/38 (144A) | 13,790,663 |
| 5,900,000(a) | | Ivy Hill Middle Market Credit Fund X, Ltd., Series 10A, | |
| | Class A1AR, 1.522% (3 Month USD LIBOR + | |
| | 125 bps), 7/18/30 (144A) | 5,691,046 |
| 71,205(a) | | Jefferson Mill CLO, Ltd., Series 2015-1I, Class XR, | |
| | 0.872% (3 Month USD LIBOR + 60 bps), 10/20/31 | 71,204 |
| 1,400,000 | | Kabbage Funding LLC, Series 2019-1, Class C, 4.611%, | |
| | 3/15/24 (144A) | 1,323,280 |
| 478,567(a) | | KVK CLO, Ltd., Series 2018-1A, Class A, 1.183% | |
| | (3 Month USD LIBOR + 93 bps), 5/20/29 (144A) | 473,727 |
| 15,000,000(a) | | KVK CLO, Ltd., Series 2018-1A, Class B, 1.903% | |
| | (3 Month USD LIBOR + 165 bps), 5/20/29 (144A) | 14,846,340 |
| 5,500,000(a) | | Lake Shore MM CLO III LLC, Series 2020-1A, Class A, | |
| | 0.0% (3 Month USD LIBOR + 230 bps), 10/15/29 (144A) | 5,500,000 |
| 3,777,028(a) | | Laurel Road Prime Student Loan Trust, Series 2017-C, | |
| | Class A1, 0.698% (1 Month USD LIBOR + | |
| | 55 bps), 11/25/42 (144A) | 3,752,703 |
| 2,100,000 | | Laurel Road Prime Student Loan Trust, Series 2020-A, | |
| | Class A1FX, 0.72%, 11/25/50 (144A) | 2,100,209 |
| 350,000(a) | | LCM 28, Ltd., Series 28A, Class X, 1.172% (3 Month USD | |
| | LIBOR + 90 bps), 10/20/30 (144A) | 349,994 |
| 8,000,000(a) | | LCM XVIII LP, Series 18A, Class A1R, 1.292% (3 Month | |
| | USD LIBOR + 102 bps), 4/20/31 (144A) | 7,872,504 |
| 612,763(a) | | Lehman XS Trust, Series 2005-4, Class 1A3, 0.948% (1 | |
| | Month USD LIBOR + 80 bps), 10/25/35 | 610,829 |
| 1,230,407 | | Lendingpoint Asset Securitization Trust, Series 2019-1, | |
| | Class A, 3.154%, 8/15/25 (144A) | 1,231,196 |
| 2,500,000 | | Lendingpoint Asset Securitization Trust, Series 2019-1, | |
| | Class B, 3.613%, 8/15/25 (144A) | 2,503,921 |
| 6,407,964 | | Lendingpoint Asset Securitization Trust, Series 2020-1, | |
| | Class A, 2.512%, 2/10/26 (144A) | 6,411,764 |
| 5,912,753 | | LL ABS Trust, Series 2019-1A, Class A, 2.87%, | |
| | 3/15/27 (144A) | 5,938,041 |
The accompanying notes are an integral part of these financial statements.
Pioneer Multi-Asset Ultrashort Income Fund | Semiannual Report | 9/30/20 31
Schedule of Investments | 9/30/20
(unaudited) (continued)
| | | | |
| Principal | | | |
| Amount | | | |
| USD ($) | | | Value |
| | ASSET BACKED SECURITIES — (continued) | |
| 5,000,000 | | LL ABS Trust, Series 2020-1A, Class A, 2.33%, | |
| | | 1/17/28 (144A) | $ 5,000,676 |
| 7,500,000(a) | | LoanCore Issuer, Ltd., Series 2019-CRE2, Class A, | |
| | | 1.282% (1 Month USD LIBOR + 113 bps), | |
| | | 5/15/36 (144A) | 7,367,015 |
| 8,300,000(a) | | M360 LLC, Series 2019-CRE2, Class A, 1.552% | |
| | | (1 Month USD LIBOR + 140 bps), 9/15/34 (144A) | 8,082,784 |
| 1,000,000(a) | | Madison Park Funding XII, Ltd., Series 2014-12A, | |
| | | Class CR, 2.622% (3 Month USD LIBOR + | |
| | | 235 bps), 7/20/26 (144A) | 1,000,014 |
| 250,000(a) | | Magnetite VII Ltd., Series 2012-7A, Class A1R2, 1.075% | |
| | | (3 Month USD LIBOR + 80 bps), 1/15/28 (144A) | 247,880 |
| 8,629,000(a) | | Magnetite XVIII Ltd., Series 2016-18A, Class AR, 1.36% | |
| | | (3 Month USD LIBOR + 108 bps), 11/15/28 (144A) | 8,580,669 |
| 1,662,969 | | Marlette Funding Trust, Series 2017-1A, Class C, 6.658%, | |
| | | 3/15/24 (144A) | 1,664,237 |
| 5,745,514 | | Marlette Funding Trust, Series 2020-1A, Class A, 2.24%, | |
| | | 3/15/30 (144A) | 5,789,089 |
| 6,138,049 | | Marlin Receivables LLC, Series 2018-1A, Class A3, 3.36%, | |
| | | 4/20/23 (144A) | 6,157,184 |
| 15,500,000(a) | | Master Credit Card Trust, Series 2019-1A, Class A, | |
| | | 0.636% (1 Month USD LIBOR + 48 bps), 7/21/22 | |
| | | (144A) | 15,513,871 |
| 12,000,000(a) | | Master Credit Card Trust II, Series 2019-2A, Class A, | |
| | | 0.546% (1 Month USD LIBOR + 39 bps), 1/21/23 | |
| | | (144A) | 12,015,359 |
| 242,204(a) | | Merrill Lynch Mortgage Investors Trust, Series | |
| | | 2004-OPT1, Class A1B, 1.008% (1 Month USD LIBOR + | |
| | | 86 bps), 6/25/35 | 239,926 |
| 1,764,106(a) | | Merrill Lynch Mortgage Investors Trust, Series | |
| | | 2005-AR1, Class M1, 0.898% (1 Month USD LIBOR + | |
| | | 75 bps), 6/25/36 | 1,759,196 |
| 4,701,420(c) | | MFA LLC, Series 2017-NPL1, Class A1, 3.352%, | |
| | | 11/25/47 (144A) | 4,714,492 |
| 4,884,540 | | MMAF Equipment Finance LLC, Series 2019-B, | |
| | | Class A2, 2.07%, 10/12/22 (144A) | 4,929,499 |
| 4,500,000(a) | | Monroe Capital Mml CLO, Ltd., Series 2017-1A, | |
| | | Class A, 1.858% (3 Month USD LIBOR + 160 bps), | |
| | | 4/22/29 (144A) | 4,381,839 |
| 1,628,989(a) | | Morgan Stanley Capital I, Inc. Trust, Series 2006-NC2, | |
| | | Class A2D, 0.438% (1 Month USD LIBOR + | |
| | | 29 bps), 2/25/36 | 1,598,811 |
| 529,261(a) | | Morgan Stanley Home Equity Loan Trust, Series | |
| | | 2006-2, Class A4, 0.428% (1 Month USD LIBOR + | |
| | | 28 bps), 2/25/36 | 522,104 |
| 2,484,434(a) | | National Collegiate Trust, Series 2007-A, Class A, | |
| | | 0.443% (1 Month USD LIBOR + 30 bps), | |
| | | 5/25/31 (144A) | 2,410,817 |
The accompanying notes are an integral part of these financial statements.
32 Pioneer Multi-Asset Ultrashort Income Fund | Semiannual Report | 9/30/20
| | | | |
| Principal | | | |
| Amount | | | |
| USD ($) | | | Value |
| | ASSET BACKED SECURITIES — (continued) | |
| 4,823,575(b) | | Nationstar HECM Loan Trust, Series 2019-1A, Class A, | |
| | | 2.651%, 6/25/29 (144A) | $ 4,839,833 |
| 4,000,000(b) | | Nationstar HECM Loan Trust, Series 2020-1A, Class A1, | |
| | | 1.269%, 9/25/30 (144A) | 3,999,998 |
| 5,633,287(a) | | Nationstar Home Equity Loan Trust, Series 2006-B, | |
| | | Class AV4, 0.428% (1 Month USD LIBOR + | |
| | | 28 bps), 9/25/36 | 5,605,931 |
| 4,000,000(a) | | Navistar Financial Dealer Note Master Trust, Series | |
| | 2020-1, Class A, 1.098% (1 Month USD LIBOR + | |
| | | 95 bps), 7/25/25 (144A) | 4,023,199 |
| 2,041,722 | | Nelnet Private Education Loan Trust, Series 2016-A, | |
| | | Class A1B, 3.6%, 12/26/40 (144A) | 2,080,798 |
| 8,172,491(a) | | Nelnet Student Loan Trust, Series 2005-2, Class A5, | |
| | | 0.325% (3 Month USD LIBOR + 10 bps), 3/23/37 | 7,890,674 |
| 6,873,304(a) | | Neuberger Berman CLO XX, Ltd., Series 2015-20A, | |
| | | Class AR, 1.075% (3 Month USD LIBOR + | |
| | | 80 bps), 1/15/28 (144A) | 6,822,112 |
| 2,750,000(a) | | Neuberger Berman CLO XXII, Ltd., Series 2016-22A, | |
| | | Class XR, 1.173% (3 Month USD LIBOR + | |
| | | 90 bps), 10/17/30 (144A) | 2,749,994 |
| 685,680(a) | | Newtek Small Business Loan Trust, Series 2016-1A, | |
| | | Class A, 3.148% (1 Month USD LIBOR + | |
| | | 300 bps), 2/25/42 (144A) | 684,535 |
| 3,730,378(a) | | Newtek Small Business Loan Trust, Series 2017-1, | |
| | | Class A, 2.148% (1 Month USD LIBOR + | |
| | | 200 bps), 2/25/43 (144A) | 3,647,701 |
| 4,577,601(a) | | Newtek Small Business Loan Trust, Series 2018-1, | |
| | | Class A, 1.848% (1 Month USD LIBOR + | |
| | | 170 bps), 2/25/44 (144A) | 4,463,282 |
| 3,521,232(a) | | Newtek Small Business Loan Trust, Series 2018-1, | |
| | | Class B, 3.148% (1 Month USD LIBOR + | |
| | | 300 bps), 2/25/44 (144A) | 3,200,332 |
| 11,215,109(a) | | Newtek Small Business Loan Trust, Series 2019-1, | |
| | | Class A, 2.35% (PRIME + -90 bps), 12/25/44 (144A) | 11,088,345 |
| 2,392,557(a) | | Newtek Small Business Loan Trust, Series 2019-1, | |
| | | Class B, 2.648% (1 Month USD LIBOR + | |
| | | 250 bps), 12/25/44 (144A) | 2,219,335 |
| 18,300,000(a) | | NextGear Floorplan Master Owner Trust, Series | |
| | | 2019-2A, Class A1, 0.852% (1 Month USD LIBOR + | |
| | | 70 bps), 10/15/24 (144A) | 17,910,995 |
| 19,500,000(a) | | NextGear Floorplan Master Owner Trust, Series | |
| | | 2020-1A, Class A1, 0.952% (1 Month USD LIBOR + | |
| | | 80 bps), 2/15/25 (144A) | 19,292,298 |
| 8,767,839 | | NMEF Funding LLC, Series 2019-A, Class A, 2.73%, | |
| | | 8/17/26 (144A) | 8,811,225 |
| 154,238(a) | | NovaStar Mortgage Funding Trust, Series 2003-1, | |
| | | Class A2, 0.928% (1 Month USD LIBOR + | |
| | | 78 bps), 5/25/33 | 152,067 |
The accompanying notes are an integral part of these financial statements.
Pioneer Multi-Asset Ultrashort Income Fund | Semiannual Report | 9/30/20 33
Schedule of Investments | 9/30/20
(unaudited) (continued)
| | | | |
| Principal | | | |
| Amount | | | |
| USD ($) | | | Value |
| | ASSET BACKED SECURITIES — (continued) | |
| 12,498,516 | | Oasis LLC, Series 2020-1A, Class A, 3.82%, | |
| | 1/15/32 (144A) | $ 12,541,733 |
| 7,692,541 | | Oasis LLC, Series 2020-2A, Class A, 4.262%, | |
| | 5/15/32 (144A) | 7,706,519 |
| 500,000(a) | | Octagon Investment Partners XVI, Ltd., Series | |
| | 2013-1A, Class XR, 0.823% (3 Month USD LIBOR + | |
| | 55 bps), 7/17/30 (144A) | 499,996 |
| 2,625,000(a) | | Octagon Investment Partners XXI, Ltd., Series | |
| | 2014-1A, Class XRR, 1.015% (3 Month USD LIBOR + | |
| | 75 bps), 2/14/31 (144A) | 2,624,858 |
| 2,843,750(a) | | Octagon Investment Partners XXII, Ltd., Series | |
| | 2014-1A, Class XRR, 0.908% (3 Month USD LIBOR + | |
| | 65 bps), 1/22/30 (144A) | 2,843,687 |
| 9,250,000 | | Octane Receivables Trust, Series 2020-1A, Class A, | |
| | 1.71%, 2/20/25 (144A) | 9,250,361 |
| 1,607,143(a) | | OHA Credit Funding 3, Ltd., Series 2019-3A, Class X, | |
| | 0.922% (3 Month USD LIBOR + 65 bps), | |
| | 7/20/32 (144A) | 1,607,141 |
| 2,750,000(a) | | OHA Credit Funding 5, Ltd., Series 2020-5A, Class X, | |
| | 1.856% (3 Month USD LIBOR + 55 bps), | |
| | 4/18/33 (144A) | 2,707,614 |
| 2,098,767(a) | | OneMain Financial Issuance Trust, Series 2017-1A, | |
| | Class A2, 0.951% (1 Month USD LIBOR + | |
| | 80 bps), 9/14/32 (144A) | 2,100,439 |
| 1,475,000 | | OneMain Financial Issuance Trust, Series 2019-1A, | |
| | Class A, 3.48%, 2/14/31 (144A) | 1,512,170 |
| 170,000 | | OneMain Financial Issuance Trust, Series 2019-1A, | |
| | Class B, 3.79%, 2/14/31 (144A) | 176,568 |
| 5,126,356(a) | | Option One Mortgage Loan Trust, Series 2005-3, | |
| | Class M2, 0.883% (1 Month USD LIBOR + | |
| | 74 bps), 8/25/35 | 5,074,556 |
| 1,209,852(a) | | Option One Mortgage Loan Trust, Series 2005-4, | |
| | Class M1, 0.808% (1 Month USD LIBOR + | |
| | 66 bps), 11/25/35 | 1,207,707 |
| 12,950,000(a) | | Orec, Ltd., Series 2018-CRE1, Class A, 1.332% | |
| | (1 Month USD LIBOR + 118 bps), 6/15/36 (144A) | 12,760,242 |
| 13,500,000(a) | | Owl Rock CLO II, Ltd., Series 2019-2A, Class A1L, | |
| | 2.022% (3 Month USD LIBOR + 175 bps), | |
| | 1/20/31 (144A) | 13,346,060 |
| 2,000,000(a) | | Owl Rock CLO IV, Ltd., Series 2020-4A, Class A1, 3.17% | |
| | (3 Month USD LIBOR + 262 bps), 5/20/29 (144A) | 2,002,326 |
| 18,327 | | Oxford Finance Funding LLC, Series 2016-1A, Class A, | |
| | 3.968%, 6/17/24 (144A) | 18,334 |
| 875,000(a) | | OZLM VIII, Ltd., Series 2014-8A, Class XRR, 0.973% | |
| | (3 Month USD LIBOR + 70 bps), 10/17/29 (144A) | 874,998 |
| 4,250,000(a) | | Palmer Square Loan Funding, Ltd., Series 2018-1A, | |
| | Class A2, 1.325% (3 Month USD LIBOR + | |
| | 105 bps), 4/15/26 (144A) | 4,162,327 |
The accompanying notes are an integral part of these financial statements.
34 Pioneer Multi-Asset Ultrashort Income Fund | Semiannual Report | 9/30/20
| | | | |
| Principal | | | |
| Amount | | | |
| USD ($) | | | Value |
| | ASSET BACKED SECURITIES — (continued) | |
| 1,000,000(a) | | Palmer Square Loan Funding, Ltd., Series 2018-2A, | |
| | Class D, 4.225% (3 Month USD LIBOR + | |
| | 395 bps), 7/15/26 (144A) | $ 937,218 |
| 4,000,000(a) | | Palmer Square Loan Funding, Ltd., Series 2020-4A, | |
| | Class C, 0.0% (3 Month USD LIBOR + | |
| | 360 bps), 11/25/28 (144A) | 4,000,000 |
| 700,504(a) | | PARTS Student Loan Trust, Series 2007-CT1, Class A, | |
| | 0.44% (3 Month USD LIBOR + 19 bps), 2/25/33 (144A) | 684,283 |
| 8,889,584 | | Pawnee Equipment Receivables LLC, Series 2019-1, | |
| | Class A2, 2.29%, 10/15/24 (144A) | 8,973,255 |
| 4,250,000 | | Pawnee Equipment Receivables LLC, Series 2020-1, | |
| | Class A, 1.37%, 11/17/25 (144A) | 4,242,988 |
| 30,000,000(a) | | PFS Financing Corp., Series 2019-B, Class A, 0.702% | |
| | (1 Month USD LIBOR + 55 bps), 9/15/23 (144A) | 30,046,947 |
| 33,154(a) | | Popular ABS Mortgage Pass-Through Trust, Series | |
| | 2005-A, Class M1, 0.578% (1 Month USD LIBOR + | |
| | 43 bps), 6/25/35 | 33,134 |
| 50,047 | | Prosper Marketplace Issuance Trust, Series 2019-1A, | |
| | Class A, 3.54%, 4/15/25 (144A) | 50,074 |
| 2,852,315 | | Prosper Marketplace Issuance Trust, Series 2019-4A, | |
| | Class A, 2.48%, 2/17/26 (144A) | 2,864,755 |
| 482,901 | | Purchasing Power Funding LLC, Series 2018-A, | |
| | Class A, 3.34%, 8/15/22 (144A) | 483,088 |
| 2,600,000 | | Purchasing Power Funding LLC, Series 2018-A, | |
| | Class B, 3.58%, 8/15/22 (144A) | 2,598,217 |
| 6,333,904(a) | | RAAC Trust, Series 2006-RP1, Class M2, 1.348% | |
| | (1 Month USD LIBOR + 120 bps), 10/25/45 (144A) | 6,363,221 |
| 551,394(a) | | RAMP Trust, Series 2005-EFC6, Class M2, 0.793% | |
| | (1 Month USD LIBOR + 65 bps), 11/25/35 | 549,496 |
| 4,615(a) | | RAMP Trust, Series 2006-EFC2, Class A3, 0.308% | |
| | (1 Month USD LIBOR + 16 bps), 12/25/36 | 4,613 |
| 1,743(a) | | RAMP Trust, Series 2006-RZ3, Class A3, 0.438% | |
| | (1 Month USD LIBOR + 29 bps), 8/25/36 | 1,742 |
| 2,779,300(a) | | RAMP Trust, Series 2006-RZ4, Class A3, 0.418% | |
| | (1 Month USD LIBOR + 27 bps), 10/25/36 | 2,749,396 |
| 402,619(a) | | RASC Trust, Series 2005-EMX4, Class M2, 0.808% | |
| | (1 Month USD LIBOR + 66 bps), 11/25/35 | 402,380 |
| 921,797(a) | | RASC Trust, Series 2005-KS1, Class M1, 0.823% | |
| | (1 Month USD LIBOR + 68 bps), 2/25/35 | 918,889 |
| 202,547(a) | | RASC Trust, Series 2005-KS7, Class M4, 1.018% | |
| | (1 Month USD LIBOR + 87 bps), 8/25/35 | 202,508 |
| 4,000,000(a) | | RASC Trust, Series 2005-KS7, Class M5, 1.063% | |
| | (1 Month USD LIBOR + 92 bps), 8/25/35 | 3,970,434 |
| 254,989(a) | | RASC Trust, Series 2005-KS8, Class M3, 0.628% | |
| | (1 Month USD LIBOR + 48 bps), 8/25/35 | 254,845 |
| 1,802(a) | | RASC Trust, Series 2005-KS11, Class M1, 0.548% | |
| | (1 Month USD LIBOR + 40 bps), 12/25/35 | 1,802 |
The accompanying notes are an integral part of these financial statements.
Pioneer Multi-Asset Ultrashort Income Fund | Semiannual Report | 9/30/20 35
Schedule of Investments | 9/30/20
(unaudited) (continued)
| | | | |
| Principal | | | |
| Amount | | | |
| USD ($) | | | Value |
| | ASSET BACKED SECURITIES — (continued) | |
| 9,941,784(a) | | ReadyCap Lending Small Business Loan Trust, Series | |
| | 2019-2, Class A, 2.75% (PRIME + -50 bps), | |
| | | 12/27/44 (144A) | $ 9,264,251 |
| 250,000(a) | | Regatta VI Funding Ltd., Series 2016-1A, Class AR, | |
| | | 1.352% (3 Month USD LIBOR + 108 bps), | |
| | | 7/20/28 (144A) | 248,720 |
| 6,400,000 | | Republic FInance Issuance Trust, Series 2019-A, | |
| | | Class A, 3.43%, 11/22/27 (144A) | 6,506,394 |
| 7,500,000(a) | | Rosy, Series 2018-1, Class A2, 3.402% (1 Month USD | |
| | | LIBOR + 325 bps), 12/15/25 (144A) | 7,200,000 |
| 30,290(a) | | Salomon Mortgage Loan Trust, Series 2001-CB4, | |
| | | Class 1A1, 1.048% (1 Month USD LIBOR + | |
| | | 90 bps), 11/25/33 | 30,014 |
| 9,292,957(a) | | Santander Drive Auto Receivables Trust, Series 2020-1, | |
| | | Class A2B, 1.702% (1 Month USD LIBOR + | |
| | | 155 bps), 1/17/23 | 9,340,171 |
| 2,111,603(a) | | Saxon Asset Securities Trust, Series 2006-2, Class A3C, | |
| | | 0.298% (1 Month USD LIBOR + 15 bps), 9/25/36 | 2,103,079 |
| 255,468 | | SCF Equipment Leasing LLC, Series 2017-1A, Class A, | |
| | | 3.77%, 1/20/23 (144A) | 256,114 |
| 1,263,626 | | SCF Equipment Leasing LLC, Series 2017-2A, Class A, | |
| | | 3.41%, 12/20/23 (144A) | 1,267,165 |
| 255,443 | | SCF Equipment Leasing LLC, Series 2018-1A, Class A2, | |
| | | 3.63%, 10/20/24 (144A) | 257,350 |
| 2,943,352 | | SCF Equipment Leasing LLC, Series 2019-1A, Class A1, | |
| | | 3.04%, 3/20/23 (144A) | 2,947,535 |
| 11,069,185 | | SCF Equipment Leasing LLC, Series 2019-2A, Class A1, | |
| | | 2.22%, 6/20/24 (144A) | 11,124,293 |
| 17,629(a) | | Securitized Asset Backed Receivables LLC Trust, Series | |
| | | 2005-OP2, Class M1, 0.578% (1 Month USD LIBOR + | |
| | | 43 bps), 10/25/35 | 17,567 |
| 492,637(a) | | Security National Mortgage Loan Trust, Series 2007-1A, | |
| | | Class 2A, 0.498% (1 Month USD LIBOR + | |
| | | 35 bps), 4/25/37 (144A) | 491,162 |
| 2,022,999(a) | | SG Mortgage Securities Trust, Series 2005-OPT1, | |
| | | Class M1, 0.578% (1 Month USD LIBOR + | |
| | | 43 bps), 10/25/35 | 2,018,596 |
| 7,537,558(a) | | SLM Private Credit Student Loan Trust, Series 2007-A, | |
| | | Class A4A, 0.553% (3 Month USD LIBOR + | |
| | | 24 bps), 12/16/41 | 7,245,941 |
| 13,964,140(a) | | SLM Student Loan Trust, Series 2006-10, Class A6, | |
| | | 0.395% (3 Month USD LIBOR + 15 bps), 3/25/44 | 13,222,119 |
| 4,336,669 | | Small Business Lending Trust, Series 2019-A, Class A, | |
| | | 2.85%, 7/15/26 (144A) | 4,266,458 |
| 6,897,191 | | Small Business Lending Trust, Series 2020-A, Class A, | |
| | | 2.62%, 12/15/26 (144A) | 6,847,658 |
| 1,000,000 | | Small Business Lending Trust, Series 2020-A, Class C, | |
| | | 5.01%, 12/15/26 (144A) | 701,920 |
The accompanying notes are an integral part of these financial statements.
36 Pioneer Multi-Asset Ultrashort Income Fund | Semiannual Report | 9/30/20
| | | | |
| Principal | | | |
| Amount | | | |
| USD ($) | | | Value |
| | ASSET BACKED SECURITIES — (continued) | |
| 6,289,464 | | Sofi Consumer Loan Program LLC, Series 2016-1, | |
| | Class A, 3.26%, 8/25/25 (144A) | $ 6,330,720 |
| 91,815 | | Sofi Consumer Loan Program LLC, Series 2016-4, | |
| | Class A, 3.18%, 11/25/25 (144A) | 91,963 |
| 382,618 | | Sofi Consumer Loan Program LLC, Series 2017-1, | |
| | Class A, 3.28%, 1/26/26 (144A) | 383,287 |
| 309,043 | | Sofi Consumer Loan Program LLC, Series 2017-3, | |
| | Class A, 2.77%, 5/25/26 (144A) | 310,752 |
| 4,300,000 | | Sofi Consumer Loan Program Trust, Series 2018-1, | |
| | Class B, 3.65%, 2/25/27 (144A) | 4,420,079 |
| 2,415,058 | | Sofi Consumer Loan Program Trust, Series 2019-1, | |
| | Class A, 3.24%, 2/25/28 (144A) | 2,439,274 |
| 1,315,641 | | Sofi Consumer Loan Program Trust, Series 2019-2, | |
| | Class A, 3.01%, 4/25/28 (144A) | 1,330,631 |
| 540,701(a) | | Sofi Professional Loan Program LLC, Series 2015-B, | |
| | Class A1, 1.198% (1 Month USD LIBOR + | |
| | 105 bps), 4/25/35 (144A) | 540,827 |
| 671,702(a) | | Sofi Professional Loan Program LLC, Series 2015-C, | |
| | Class A1, 1.198% (1 Month USD LIBOR + | |
| | 105 bps), 8/27/35 (144A) | 672,007 |
| 1,128,956(a) | | Sofi Professional Loan Program LLC, Series 2015-D, | |
| | Class A1, 1.648% (1 Month USD LIBOR + | |
| | 150 bps), 10/27/36 (144A) | 1,135,654 |
| 1,158,734(a) | | Sofi Professional Loan Program LLC, Series 2016-A, | |
| | Class A1, 1.898% (1 Month USD LIBOR + | |
| | 175 bps), 8/25/36 (144A) | 1,167,199 |
| 797,101(a) | | Sofi Professional Loan Program LLC, Series 2016-B, | |
| | Class A1, 1.348% (1 Month USD LIBOR + | |
| | 120 bps), 6/25/33 (144A) | 798,833 |
| 2,126,021(a) | | Sofi Professional Loan Program LLC, Series 2016-C, | |
| | Class A1, 1.248% (1 Month USD LIBOR + | |
| | 110 bps), 10/27/36 (144A) | 2,125,591 |
| 519,890(a) | | Sofi Professional Loan Program LLC, Series 2016-D, | |
| | Class A1, 1.098% (1 Month USD LIBOR + | |
| | 95 bps), 1/25/39 (144A) | 520,089 |
| 1,259,711(a) | | Sofi Professional Loan Program LLC, Series 2016-E, | |
| | Class A1, 0.998% (1 Month USD LIBOR + | |
| | 85 bps), 7/25/39 (144A) | 1,257,059 |
| 360,606(a) | | Sofi Professional Loan Program LLC, Series 2017-A, | |
| | Class A1, 0.848% (1 Month USD LIBOR + | |
| | 70 bps), 3/26/40 (144A) | 360,388 |
| 437,904(a) | | Sofi Professional Loan Program LLC, Series 2017-C, | |
| | Class A1, 0.748% (1 Month USD LIBOR + | |
| | 60 bps), 7/25/40 (144A) | 436,477 |
| 724,374(a) | | Sofi Professional Loan Program LLC, Series 2017-E, | |
| | Class A1, 0.648% (1 Month USD LIBOR + | |
| | 50 bps), 11/26/40 (144A) | 723,249 |
The accompanying notes are an integral part of these financial statements.
Pioneer Multi-Asset Ultrashort Income Fund | Semiannual Report | 9/30/20 37
Schedule of Investments | 9/30/20
(unaudited) (continued)
| | | | |
| Principal | | | |
| Amount | | | |
| USD ($) | | | Value |
| | ASSET BACKED SECURITIES — (continued) | |
| 1,124,409(a) | | Sofi Professional Loan Program LLC, Series 2018-A, | |
| | | Class A1, 0.498% (1 Month USD LIBOR + | |
| | | 35 bps), 2/25/42 (144A) | $ 1,114,408 |
| 11,363 | | Sofi Professional Loan Program LLC, Series 2018-A, | |
| | | Class A2A, 2.39%, 2/25/42 (144A) | 11,370 |
| 4,695,146 | | Sofi Professional Loan Program LLC, Series 2019-C, | |
| | | Class A1FX, 2.13%, 11/16/48 (144A) | 4,729,629 |
| 2,000,000(a) | | Sound Point Clo XIV Ltd., Series 2016-3A, Class AR, | |
| | | 1.406% (3 Month USD LIBOR + 115 bps), | |
| | | 1/23/29 (144A) | 1,980,944 |
| 2,000,000(a) | | Sound Point CLO XXV, Ltd., Series 2019-4A, Class X, | |
| | | 0.925% (3 Month USD LIBOR + 65 bps), | |
| | | 1/15/33 (144A) | 1,999,998 |
| 4,650,000 | | SpringCastle America Funding LLC, Series 2020-AA, | |
| | | Class A, 1.97%, 9/25/37 (144A) | 4,666,688 |
| 10,986,802 | | Springleaf Funding Trust, Series 2015-BA, Class A, | |
| | | 3.48%, 5/15/28 (144A) | 11,033,608 |
| 6,000,000(a) | | Starwood Waypoint Homes Trust, Series 2017-1, | |
| | | Class E, 2.752% (1 Month USD LIBOR + 260 bps), | |
| | | 1/17/35 (144A) | 6,006,758 |
| 77,031(a) | | Structured Asset Investment Loan Trust, Series | |
| | | 2005-HE1, Class M1, 0.618% (1 Month USD LIBOR + | |
| | | 47 bps), 7/25/35 | 77,763 |
| 2,775,856(a) | | Structured Asset Investment Loan Trust, Series | |
| | | 2005-HE3, Class M1, 0.868% (1 Month USD LIBOR + | |
| | | 72 bps), 9/25/35 | 2,757,389 |
| 73,834(a) | | Structured Asset Securities Corp. Mortgage Loan Trust, | |
| | Series 2005-NC2, Class M4, 0.853% (1 Month | |
| | | USD LIBOR + 71 bps), 5/25/35 | 73,337 |
| 3,767,642(a) | | Structured Asset Securities Corp. Mortgage Loan Trust, | |
| | Series 2006-OPT1, Class A1, 0.328% (1 Month | |
| | | USD LIBOR + 18 bps), 4/25/36 | 3,578,541 |
| 1,361,170(a) | | Structured Asset Securities Corp. Mortgage Loan Trust, | |
| | Series 2007-TC1, Class A, 0.448% (1 Month USD | |
| | | LIBOR + 30 bps), 4/25/31 (144A) | 1,352,075 |
| 1,151,202 | | Tax Ease Funding LLC, Series 2016-1A, Class A, 3.131%, | |
| | | 6/15/28 (144A) | 1,153,650 |
| 139,642 | | TCF Auto Receivables Owner Trust, Series 2016-PT1A, | |
| | | Class A, 1.93%, 6/15/22 (144A) | 139,793 |
| 3,954,123(a) | | Terwin Mortgage Trust, Series 2006-3, Class 1A2, 0.378% | |
| | | (1 Month USD LIBOR + 23 bps), 4/25/37 (144A) | 3,924,530 |
| 5,500,000 | | Tesla Auto Lease Trust, Series 2020-A, Class A2, 0.55%, | |
| | | 5/22/23 (144A) | 5,508,466 |
| 2,000,000(a) | | THL Credit Wind River CLO, Ltd., Series 2012-1A, | |
| | | Class BR2, 1.725% (3 Month USD LIBOR + | |
| | | 145 bps), 1/15/26 (144A) | 1,998,488 |
| 375,000(a) | | THL Credit Wind River CLO, Ltd., Series 2015-1A, | |
| | | Class X, 0.922% (3 Month USD LIBOR + | |
| | | 65 bps), 10/20/30 (144A) | 373,973 |
The accompanying notes are an integral part of these financial statements.
38 Pioneer Multi-Asset Ultrashort Income Fund | Semiannual Report | 9/30/20
| | | | |
| Principal | | | |
| Amount | | | |
| USD ($) | | | Value |
| | ASSET BACKED SECURITIES — (continued) | |
| 2,000,000(a) | | THL Credit Wind River CLO, Ltd., Series 2016-1A, | |
| | Class AR, 1.325% (3 Month USD LIBOR + | |
| | 105 bps), 7/15/28 (144A) | $ 1,987,968 |
| 31,182,000 | | Tidewater Auto Receivables Trust, Series 2020-AA, | |
| | Class A2, 1.39%, 8/15/24 (144A) | 31,386,769 |
| 2,750,000 | | Tidewater Auto Receivables Trust, Series 2020-AA, | |
| | Class E, 3.35%, 7/17/28 (144A) | 2,707,846 |
| 2,221,427 | | TLF National Tax Lien Trust, Series 2017-1A, Class A, | |
| | 3.09%, 12/15/29 (144A) | 2,236,076 |
| 11,368,397(a) | | Towd Point Asset Trust, Series 2018-SL1, Class A, | |
| | 0.775% (1 Month USD LIBOR + 60 bps), 1/25/46 (144A) | 11,191,119 |
| 11,000,000(a) | | Towd Point Asset Trust, Series 2018-SL1, Class B, | |
| | 1.225% (1 Month USD LIBOR + 105 bps), | |
| | 1/25/46 (144A) | 10,189,374 |
| 307,957(b) | | Towd Point Mortgage Trust, Series 2015-4, Class A1, | |
| | 3.5%, 4/25/55 (144A) | 311,059 |
| 1,587,045(b) | | Towd Point Mortgage Trust, Series 2015-5, Class A1B, | |
| | 2.75%, 5/25/55 (144A) | 1,600,951 |
| 5,666,686(a) | | Towd Point Mortgage Trust, Series 2017-5, Class A1, | |
| | 0.748% (1 Month USD LIBOR + 60 bps), 2/25/57 (144A) | 5,656,198 |
| 218,703(b) | | Towd Point Mortgage Trust, Series 2017-5, Class XA, | |
| | 3.5%, 2/25/57 (144A) | 218,458 |
| 5,897,887(b) | | Towd Point Mortgage Trust, Series 2018-SJ1, Class XA, | |
| | 5.0%, 10/25/58 (144A) | 6,032,749 |
| 1,072,308(b) | | Towd Point Mortgage Trust, Series 2019-HY1, Class XA, | |
| | 5.0%, 10/25/48 (144A) | 1,069,638 |
| 5,040,386(a) | | Towd Point Mortgage Trust, Series 2019-HY2, | |
| | Class A1, 1.148% (1 Month USD LIBOR + 100 bps), | |
| | 5/25/58 (144A) | 5,040,386 |
| 2,539,129(b) | | Towd Point Mortgage Trust, Series 2019-HY2, | |
| | Class XA, 5.0%, 5/25/58 (144A) | 2,539,857 |
| 866,268(a) | | Towd Point Mortgage Trust, Series 2019-HY3, | |
| | Class A1A, 1.148% (1 Month USD LIBOR + 100 bps), | |
| | 10/25/59 (144A) | 866,268 |
| 7,549,166 | | Towd Point Mortgage Trust, Series 2019-HY3, Class XA, | |
| | 4.5%, 10/25/59 (144A) | 7,481,586 |
| 2,401,184(b) | | Towd Point Mortgage Trust, Series 2019-SJ1, Class XA, | |
| | 5.0%, 11/25/58 (144A) | 2,377,403 |
| 2,197,576(b) | | Towd Point Mortgage Trust, Series 2019-SJ2, Class XA, | |
| | 5.0%, 11/25/58 (144A) | 2,292,570 |
| 12,709,615(b) | | Towd Point Mortgage Trust, Series 2019-SJ3, Class A1, | |
| | 3.0%, 11/25/59 (144A) | 12,926,244 |
| 11,376,710(b) | | Towd Point Mortgage Trust, Series 2019-SJ3, Class XA, | |
| | 4.5%, 11/25/59 (144A) | 11,376,710 |
| 13,750,000(a) | | Trafigura Securitisation Finance Plc, Series 2018-1A, | |
| | Class A1, 0.882% (1 Month USD LIBOR + 73 bps), | |
| | 3/15/22 (144A) | 13,517,969 |
The accompanying notes are an integral part of these financial statements.
Pioneer Multi-Asset Ultrashort Income Fund | Semiannual Report | 9/30/20 39
Schedule of Investments | 9/30/20
(unaudited) (continued)
| | | | |
| Principal | | | |
| Amount | | | |
| USD ($) | | | Value |
| | ASSET BACKED SECURITIES — (continued) | |
| 2,500,000 | | Trafigura Securitisation Finance Plc, Series 2018-1A, | |
| | Class B, 4.29%, 3/15/22 (144A) | $ 2,493,120 |
| 1,884,615(a) | | Tralee CLO V, Ltd., Series 2018-5A, Class AX, 0.972% | |
| | (3 Month USD LIBOR + 70 bps), 10/20/28 (144A) | 1,884,612 |
| 16,400,000(a) | | TRTX Issuer, Ltd., Series 2019-FL3, Class C, 2.251% | |
| | (1 Month USD LIBOR + 210 bps), 10/15/34 (144A) | 15,443,821 |
| 5,602,855 | | TVEST LLC, Series 2020-A, Class A, 4.5%, | |
| | 7/15/32 (144A) | 5,606,690 |
| 12,000,000 | | United Auto Credit Securitization Trust, Series 2018-1, | |
| | Class E, 4.84%, 8/10/23 (144A) | 12,182,116 |
| 4,877,234 | | United Auto Credit Securitization Trust, Series 2019-1, | |
| | Class B, 3.03%, 4/10/24 (144A) | 4,887,679 |
| 6,301,535 | | United Auto Credit Securitization Trust, Series 2020-1, | |
| | Class A, 0.85%, 5/10/22 (144A) | 6,305,668 |
| 7,452,169 | | Upstart Securitization Trust, Series 2019-2, Class A, | |
| | 2.897%, 9/20/29 (144A) | 7,513,449 |
| 11,861,272 | | Upstart Securitization Trust, Series 2019-3, Class A, | |
| | 2.684%, 1/21/30 (144A) | 11,960,721 |
| 20,114,006 | | Upstart Securitization Trust, Series 2020-1, Class A, | |
| | 2.322%, 4/22/30 (144A) | 20,260,230 |
| 3,521,602 | | US Auto Funding LLC, Series 2019-1A, Class A, 3.61%, | |
| | 4/15/22 (144A) | 3,537,074 |
| 11,633,873 | | USASF Receivables LLC, Series 2020-1A, Class A, 2.47%, | |
| | 8/15/23 (144A) | 11,687,704 |
| 157,895(a) | | Venture 32 CLO, Ltd., Series 2018-32RR, Class AX, | |
| | 1.022% (3 Month USD LIBOR + 75 bps), 7/19/31 (144A) | 157,891 |
| 1,190,625(a) | | Venture XXI CLO, Ltd., Series 2015-21A, Class AR, | |
| | 1.155% (3 Month USD LIBOR + 88 bps), 7/15/27 (144A) | 1,179,049 |
| 459,326(a) | | Verizon Owner Trust, Series 2017-3A, Class A1B, | |
| | 0.426% (1 Month USD LIBOR + 27 bps), 4/20/22 (144A) | 459,428 |
| 10,010,000(a) | | Verizon Owner Trust, Series 2019-A, Class A1B, 0.486% | |
| | (1 Month USD LIBOR + 33 bps), 9/20/23 | 10,027,765 |
| 23,500,000(a) | | Verizon Owner Trust, Series 2019-C, Class A1B, 0.576% | |
| | (1 Month USD LIBOR + 42 bps), 4/22/24 | 23,553,479 |
| 27,000,000(a) | | Verizon Owner Trust, Series 2020-A, Class A1B, 0.426% | |
| | (1 Month USD LIBOR + 27 bps), 7/22/24 | 26,990,267 |
| 15,814,788 | | Veros Automobile Receivables Trust, Series 2020-1, | |
| | Class A, 1.67%, 9/15/23 (144A) | 15,859,703 |
| 2,000,000 | | Veros Automobile Receivables Trust, Series 2020-1, | |
| | Class B, 2.19%, 6/16/25 (144A) | 2,006,203 |
| 5,662,615 | | Volvo Financial Equipment LLC, Series 2019-2A, | |
| | Class A2, 2.02%, 8/15/22 (144A) | 5,700,670 |
| 11,250,000(a) | | Volvo Financial Equipment Master Owner Trust, | |
| | Series 2018-A, Class A, 0.672% (1 Month USD LIBOR + | |
| | 52 bps), 7/17/23 (144A) | 11,262,303 |
| 1,201,842 | | Westgate Resorts LLC, Series 2017-1A, Class B, 4.05%, | |
| | 12/20/30 (144A) | 1,188,908 |
The accompanying notes are an integral part of these financial statements.
40 Pioneer Multi-Asset Ultrashort Income Fund | Semiannual Report | 9/30/20
| | | | |
| Principal | | | |
| Amount | | | |
| USD ($) | | | Value |
| | ASSET BACKED SECURITIES — (continued) | |
| 2,821,938 | | Westgate Resorts LLC, Series 2018-1A, Class B, 3.58%, | |
| | 12/20/31 (144A) | $ 2,796,416 |
| 437,510 | | Westgate Resorts LLC, Series 2018-1A, Class C, 4.1%, | |
| | 12/20/31 (144A) | 431,189 |
| 2,404,675 | | Westgate Resorts LLC, Series 2020-1A, Class A, 2.713%, | |
| | 3/20/34 (144A) | 2,445,602 |
| 2,885,611 | | Westgate Resorts LLC, Series 2020-1A, Class C, 6.213%, | |
| | 3/20/34 (144A) | 3,004,969 |
| 9,114(a) | | Wilshire Mortgage Loan Trust, Series 1997-2, Class A6, | |
| | 0.428% (1 Month USD LIBOR + 28 bps), 5/25/28 | 9,017 |
| | TOTAL ASSET BACKED SECURITIES | |
| | (Cost $1,566,949,488) | $1,562,355,864 |
| | COLLATERALIZED MORTGAGE OBLIGATIONS — | |
| | 14.5% of Net Assets | |
| 113,805(a) | | Bear Stearns ALT-A Trust, Series 2004-12, Class 1A2, | |
| | 0.988% (1 Month USD LIBOR + 84 bps), 1/25/35 | $ 113,657 |
| 345,224(a) | | Bear Stearns ALT-A Trust, Series 2004-12, Class 1A3, | |
| | 0.848% (1 Month USD LIBOR + 70 bps), 1/25/35 | 345,316 |
| 170,292(a) | | Bear Stearns ALT-A Trust, Series 2004-12, Class 1A4, | |
| | 0.988% (1 Month USD LIBOR + 84 bps), 1/25/35 | 170,291 |
| 90,732(b) | | Bear Stearns Mortgage Securities, Inc., Series 1997-6, | |
| | Class 3B1, 3.219%, 6/25/30 | 92,066 |
| 8,800,885(a) | | Bellemeade Re, Ltd., Series 2017-1, Class M2, 3.498% | |
| | (1 Month USD LIBOR + 335 bps), 10/25/27 (144A) | 8,598,794 |
| 6,533,876(a) | | Bellemeade Re, Ltd., Series 2018-1A, Class M1B, 1.748% | |
| | (1 Month USD LIBOR + 160 bps), 4/25/28 (144A) | 6,469,584 |
| 2,319,316(a) | | Bellemeade Re, Ltd., Series 2018-3A, Class M1B, 1.998% | |
| | (1 Month USD LIBOR + 185 bps), 10/25/28 (144A) | 2,302,762 |
| 6,125,000(a) | | Bellemeade Re, Ltd., Series 2018-3A, Class M2, 2.898% | |
| | (1 Month USD LIBOR + 275 bps), 10/25/28 (144A) | 5,899,002 |
| 8,448(a) | | Bellemeade Re, Ltd., Series 2019-1A, Class M1A, 1.448% | |
| | (1 Month USD LIBOR + 130 bps), 3/25/29 (144A) | 8,446 |
| 5,290,000(a) | | Bellemeade Re, Ltd., Series 2019-1A, Class M1B, 1.898% | |
| | (1 Month USD LIBOR + 175 bps), 3/25/29 (144A) | 5,283,802 |
| 2,800,000(a) | | Bellemeade Re, Ltd., Series 2019-3A, Class B1, 2.648% | |
| | (1 Month USD LIBOR + 250 bps), 7/25/29 (144A) | 2,482,943 |
| 10,671,000(a) | | Bellemeade Re, Ltd., Series 2019-3A, Class M1B, 1.748% | |
| | (1 Month USD LIBOR + 160 bps), 7/25/29 (144A) | 10,434,725 |
| 10,150,000(a) | | Bellemeade Re, Ltd., Series 2019-4A, Class M1B, 2.175% | |
| | (1 Month USD LIBOR + 200 bps), 10/25/29 (144A) | 9,825,114 |
| 3,250,000(a) | | Bellemeade Re, Ltd., Series 2020-2A, Class M1B, 3.348% | |
| | (1 Month USD LIBOR + 320 bps), 8/26/30 (144A) | 3,274,050 |
| 3,250,000(a) | | Bellemeade Re, Ltd., Series 2020-2A, Class M1C, 4.148% | |
| | (1 Month USD LIBOR + 400 bps), 8/26/30 (144A) | 3,253,872 |
| 6,322,026(a) | | Brass NO 8 Plc, Series 8A, Class A1, 0.98% (3 Month USD | |
| | LIBOR + 70 bps), 11/16/66 (144A) | 6,203,216 |
The accompanying notes are an integral part of these financial statements.
Pioneer Multi-Asset Ultrashort Income Fund | Semiannual Report | 9/30/20 41
Schedule of Investments | 9/30/20
(unaudited) (continued)
| | | | |
| Principal | | | |
| Amount | | | |
| USD ($) | | | Value |
| | | COLLATERALIZED MORTGAGE | |
| | | OBLIGATIONS — (continued) | |
| 628 | | Citicorp Mortgage Securities REMIC Pass-Through | |
| | Certificates Trust, Series 2005-4, Class 2A1, | |
| | | 5.0%, 7/25/20 | $ 642 |
| 19,447,151(a) | | Connecticut Avenue Securities Trust, Series 2019-HRP1, | |
| | | Class M2, 2.298% (1 Month USD LIBOR + | |
| | | 215 bps), 11/25/39 (144A) | 17,413,695 |
| 8,620,653(a) | | Connecticut Avenue Securities Trust, Series 2019-R01, | |
| | | Class 2M2, 2.598% (1 Month USD LIBOR + | |
| | | 245 bps), 7/25/31 (144A) | 8,566,672 |
| 3,302,761(a) | | Connecticut Avenue Securities Trust, Series 2020-R01, | |
| | | Class 1M1, 0.948% (1 Month USD LIBOR + | |
| | | 80 bps), 1/25/40 (144A) | 3,289,055 |
| 704,434(a) | | Connecticut Avenue Securities Trust, Series 2020-R02, | |
| | | Class 2M1, 0.898% (1 Month USD LIBOR + | |
| | | 75 bps), 1/25/40 (144A) | 702,644 |
| 64,888(a) | | CSFB Mortgage-Backed Pass-Through Certificates, | |
| | | Series 2004-AR5, Class 11A2, 0.888% (1 Month USD | |
| | | LIBOR + 74 bps), 6/25/34 | 63,871 |
| 755,465(b) | | Deephaven Residential Mortgage Trust, Series 2018-3A, | |
| | | Class A1, 3.789%, 8/25/58 (144A) | 757,831 |
| 766,664(a) | | Deer Creek CLO, Ltd., Series 2017-1A, Class X, 1.272% | |
| | | (3 Month USD LIBOR + 100 bps), 10/20/30 (144A) | 766,654 |
| 3,451,610(a) | | Eagle Re, Ltd., Series 2018-1, Class M1, 1.875% | |
| | | (1 Month USD LIBOR + 170 bps), 11/25/28 (144A) | 3,444,482 |
| 6,292,367(a) | | Eagle Re, Ltd., Series 2019-1, Class M1B, 1.948% | |
| | | (1 Month USD LIBOR + 180 bps), 4/25/29 (144A) | 6,250,901 |
| 11,364,000(a) | | Eagle Re, Ltd., Series 2020-1, Class M1A, 1.048% | |
| | | (1 Month USD LIBOR + 90 bps), 1/25/30 (144A) | 11,277,177 |
| 4,437,547(a) | | Fannie Mae Connecticut Avenue Securities, Series | |
| | | 2016-C02, Class 1M2, 6.148% (1 Month USD LIBOR + | |
| | | 600 bps), 9/25/28 | 4,696,010 |
| 9,304,664(a) | | Fannie Mae Connecticut Avenue Securities, Series | |
| | | 2016-C03, Class 2M2, 6.048% (1 Month USD LIBOR + | |
| | | 590 bps), 10/25/28 | 9,829,621 |
| 4,610,305(a) | | Fannie Mae Connecticut Avenue Securities, Series | |
| | | 2017-C01, Class 1M2, 3.698% (1 Month USD LIBOR + | |
| | | 355 bps), 7/25/29 | 4,742,653 |
| 3,682,149(a) | | Fannie Mae Connecticut Avenue Securities, Series | |
| | | 2017-C05, Class 1M2, 2.348% (1 Month USD LIBOR + | |
| | | 220 bps), 1/25/30 | 3,631,263 |
| 10,526,604(a) | | Fannie Mae Connecticut Avenue Securities, Series | |
| | | 2017-C05, Class 1M2B, 2.348% (1 Month USD LIBOR + | |
| | | 220 bps), 1/25/30 | 10,441,155 |
| 1,238,764(a) | | Fannie Mae Connecticut Avenue Securities, Series | |
| | | 2017-C07, Class 1M2A, 2.548% (1 Month USD LIBOR + | |
| | | 240 bps), 5/25/30 | 1,238,400 |
| 8,783,028(a) | | Fannie Mae Connecticut Avenue Securities, Series | |
| | | 2018-C04, Class 2M2, 2.698% (1 Month USD LIBOR + | |
| | | 255 bps), 12/25/30 | 8,626,589 |
The accompanying notes are an integral part of these financial statements.
42 Pioneer Multi-Asset Ultrashort Income Fund | Semiannual Report | 9/30/20
| | | | |
| Principal | | | |
| Amount | | | |
| USD ($) | | | Value |
| | COLLATERALIZED MORTGAGE | |
| | OBLIGATIONS — (continued) | |
| 11,106,269(a) | | Fannie Mae Connecticut Avenue Securities, Series | |
| | 2018-C05, Class 1M2, 2.498% (1 Month USD LIBOR + | |
| | 235 bps), 1/25/31 | $ 10,893,647 |
| 5,115,879(a) | | Fannie Mae Connecticut Avenue Securities, Series | |
| | 2018-C06, Class 1M2, 2.148% (1 Month USD LIBOR + | |
| | 200 bps), 3/25/31 | 5,025,219 |
| 250,806(a) | | Federal Home Loan Mortgage Corp. REMICS, Series | |
| | 1695, Class EG, 1.212% (1 Month USD LIBOR + | |
| | 105 bps), 3/15/24 | 252,409 |
| 140,921(a) | | Federal Home Loan Mortgage Corp. REMICS, Series | |
| | 2106, Class F, 0.602% (1 Month USD LIBOR + | |
| | 45 bps), 12/15/28 | 141,220 |
| 86,397(a) | | Federal Home Loan Mortgage Corp. REMICS, Series | |
| | 2122, Class FD, 0.502% (1 Month USD LIBOR + | |
| | 35 bps), 2/15/29 | 84,508 |
| 29,319(a) | | Federal Home Loan Mortgage Corp. REMICS, Series | |
| | 2156, Class FQ, 0.502% (1 Month USD LIBOR + | |
| | 35 bps), 5/15/29 | 28,906 |
| 166,572(a) | | Federal Home Loan Mortgage Corp. REMICS, Series | |
| | 2186, Class FY, 0.752% (1 Month USD LIBOR + | |
| | 60 bps), 4/15/28 | 167,402 |
| 37,486(a) | | Federal Home Loan Mortgage Corp. REMICS, Series | |
| | 2368, Class AF, 1.102% (1 Month USD LIBOR + | |
| | 95 bps), 10/15/31 | 38,159 |
| 40,323(a) | | Federal Home Loan Mortgage Corp. REMICS, Series | |
| | 2377, Class FE, 0.752% (1 Month USD LIBOR + | |
| | 60 bps), 11/15/31 | 40,622 |
| 105,789(a) | | Federal Home Loan Mortgage Corp. REMICS, Series | |
| | 2411, Class FR, 0.752% (1 Month USD LIBOR + | |
| | 60 bps), 6/15/31 | 106,547 |
| 77,991(a) | | Federal Home Loan Mortgage Corp. REMICS, Series | |
| | 2432, Class FH, 0.852% (1 Month USD LIBOR + | |
| | 70 bps), 3/15/32 | 78,889 |
| 219,077(a) | | Federal Home Loan Mortgage Corp. REMICS, Series | |
| | 2439, Class F, 1.152% (1 Month USD LIBOR + | |
| | 100 bps), 3/15/32 | 223,604 |
| 304,847(a) | | Federal Home Loan Mortgage Corp. REMICS, Series | |
| | 2470, Class AF, 1.152% (1 Month USD LIBOR + | |
| | 100 bps), 3/15/32 | 311,114 |
| 185,095(a) | | Federal Home Loan Mortgage Corp. REMICS, Series | |
| | 2471, Class FD, 1.152% (1 Month USD LIBOR + | |
| | 100 bps), 3/15/32 | 188,920 |
| 48,943(a) | | Federal Home Loan Mortgage Corp. REMICS, Series | |
| | 2498, Class FQ, 0.752% (1 Month USD LIBOR + | |
| | 60 bps), 9/15/32 | 49,319 |
| 82,621(a) | | Federal Home Loan Mortgage Corp. REMICS, Series | |
| | 2543, Class EF, 0.502% (1 Month USD LIBOR + | |
| | 35 bps), 12/15/32 | 82,573 |
The accompanying notes are an integral part of these financial statements.
Pioneer Multi-Asset Ultrashort Income Fund | Semiannual Report | 9/30/20 43
Schedule of Investments | 9/30/20
(unaudited) (continued)
| | | | |
| Principal | | | |
| Amount | | | |
| USD ($) | | | Value |
| | COLLATERALIZED MORTGAGE | |
| | OBLIGATIONS — (continued) | |
| 359,385(a) | | Federal Home Loan Mortgage Corp. REMICS, Series | |
| | 2551, Class FD, 0.552% (1 Month USD LIBOR + | |
| | 40 bps), 1/15/33 | $ 361,778 |
| 216,689(a) | | Federal Home Loan Mortgage Corp. REMICS, Series | |
| | 2567, Class FJ, 0.552% (1 Month USD LIBOR + | |
| | 40 bps), 2/15/33 | 216,904 |
| 102,425(a) | | Federal Home Loan Mortgage Corp. REMICS, Series | |
| | 2577, Class FA, 0.702% (1 Month USD LIBOR + | |
| | 55 bps), 2/15/33 | 103,075 |
| 8,199(a) | | Federal Home Loan Mortgage Corp. REMICS, Series | |
| | 2585, Class FD, 0.652% (1 Month USD LIBOR + | |
| | 50 bps), 12/15/32 | 8,236 |
| 114,586(a) | | Federal Home Loan Mortgage Corp. REMICS, Series | |
| | 2614, Class FV, 1.655% (1 Month USD LIBOR + | |
| | 150 bps), 5/15/33 | 118,160 |
| 170,743(a) | | Federal Home Loan Mortgage Corp. REMICS, Series | |
| | 2631, Class FC, 0.552% (1 Month USD LIBOR + | |
| | 40 bps), 6/15/33 | 171,898 |
| 13(a) | | Federal Home Loan Mortgage Corp. REMICS, Series | |
| | 2647, Class XF, 0.402% (1 Month USD LIBOR + | |
| | 25 bps), 7/15/21 | 13 |
| 103,944(a) | | Federal Home Loan Mortgage Corp. REMICS, Series | |
| | 2711, Class FA, 1.152% (1 Month USD LIBOR + | |
| | 100 bps), 11/15/33 | 105,813 |
| 184,776(a) | | Federal Home Loan Mortgage Corp. REMICS, Series | |
| | 2916, Class NF, 0.402% (1 Month USD LIBOR + | |
| | 25 bps), 1/15/35 | 184,873 |
| 335,806(a) | | Federal Home Loan Mortgage Corp. REMICS, Series | |
| | 2976, Class LF, 0.492% (1 Month USD LIBOR + | |
| | 34 bps), 5/15/35 | 337,036 |
| 157,816(a) | | Federal Home Loan Mortgage Corp. REMICS, Series | |
| | 3012, Class FE, 0.402% (1 Month USD LIBOR + | |
| | 25 bps), 8/15/35 | 157,875 |
| 108,090(a) | | Federal Home Loan Mortgage Corp. REMICS, Series | |
| | 3042, Class PF, 0.402% (1 Month USD LIBOR + | |
| | 25 bps), 8/15/35 | 108,155 |
| 63,962(a) | | Federal Home Loan Mortgage Corp. REMICS, Series | |
| | 3067, Class FA, 0.502% (1 Month USD LIBOR + | |
| | 35 bps), 11/15/35 | 64,226 |
| 69,106(a) | | Federal Home Loan Mortgage Corp. REMICS, Series | |
| | 3102, Class FG, 0.452% (1 Month USD LIBOR + | |
| | 30 bps), 1/15/36 | 69,236 |
| 90,092(a) | | Federal Home Loan Mortgage Corp. REMICS, Series | |
| | 3117, Class EF, 0.502% (1 Month USD LIBOR + | |
| | 35 bps), 2/15/36 | 90,373 |
| 292,909(a) | | Federal Home Loan Mortgage Corp. REMICS, Series | |
| | 3117, Class FE, 0.452% (1 Month USD LIBOR + | |
| | 30 bps), 2/15/36 | 293,333 |
The accompanying notes are an integral part of these financial statements.
44 Pioneer Multi-Asset Ultrashort Income Fund | Semiannual Report | 9/30/20
| | | | |
| Principal | | | |
| Amount | | | |
| USD ($) | | | Value |
| | COLLATERALIZED MORTGAGE | |
| | OBLIGATIONS — (continued) | |
| 195,638(a) | | Federal Home Loan Mortgage Corp. REMICS, Series | |
| | 3122, Class FP, 0.452% (1 Month USD LIBOR + | |
| | 30 bps), 3/15/36 | $ 196,047 |
| 120,635(a) | | Federal Home Loan Mortgage Corp. REMICS, Series | |
| | 3147, Class PF, 0.452% (1 Month USD LIBOR + | |
| | 30 bps), 4/15/36 | 120,883 |
| 297,636(a) | | Federal Home Loan Mortgage Corp. REMICS, Series | |
| | 3173, Class FC, 0.572% (1 Month USD LIBOR + | |
| | 42 bps), 6/15/36 | 299,208 |
| 539,168(a) | | Federal Home Loan Mortgage Corp. REMICS, Series | |
| | 3175, Class FE, 0.462% (1 Month USD LIBOR + | |
| | 31 bps), 6/15/36 | 538,563 |
| 350,051(a) | | Federal Home Loan Mortgage Corp. REMICS, Series | |
| | 3181, Class HF, 0.652% (1 Month USD LIBOR + | |
| | 50 bps), 7/15/36 | 353,679 |
| 16,645(a) | | Federal Home Loan Mortgage Corp. REMICS, Series | |
| | 3191, Class FE, 0.552% (1 Month USD LIBOR + | |
| | 40 bps), 7/15/36 | 16,746 |
| 244,553(a) | | Federal Home Loan Mortgage Corp. REMICS, Series | |
| | 3221, Class FW, 0.572% (1 Month USD LIBOR + | |
| | 42 bps), 9/15/36 | 247,168 |
| 73,577(a) | | Federal Home Loan Mortgage Corp. REMICS, Series | |
| | 3222, Class FN, 0.552% (1 Month USD LIBOR + | |
| | 40 bps), 9/15/36 | 73,928 |
| 250,574(a) | | Federal Home Loan Mortgage Corp. REMICS, Series | |
| | 3239, Class EF, 0.502% (1 Month USD LIBOR + | |
| | 35 bps), 11/15/36 | 251,692 |
| 130,820(a) | | Federal Home Loan Mortgage Corp. REMICS, Series | |
| | 3239, Class FB, 0.502% (1 Month USD LIBOR + | |
| | 35 bps), 11/15/36 | 131,405 |
| 210,969(a) | | Federal Home Loan Mortgage Corp. REMICS, Series | |
| | 3247, Class FA, 0.402% (1 Month USD LIBOR + | |
| | 25 bps), 8/15/36 | 211,077 |
| 502,169(a) | | Federal Home Loan Mortgage Corp. REMICS, Series | |
| | 3266, Class F, 0.452% (1 Month USD LIBOR + | |
| | 30 bps), 1/15/37 | 502,577 |
| 184,897(a) | | Federal Home Loan Mortgage Corp. REMICS, Series | |
| | 3307, Class FT, 0.392% (1 Month USD LIBOR + | |
| | 24 bps), 7/15/34 | 184,755 |
| 30,339(a) | | Federal Home Loan Mortgage Corp. REMICS, Series | |
| | 3315, Class F, 0.492% (1 Month USD LIBOR + | |
| | 34 bps), 5/15/37 | 30,461 |
| 435,659(a) | | Federal Home Loan Mortgage Corp. REMICS, Series | |
| | 3373, Class FB, 0.732% (1 Month USD LIBOR + | |
| | 58 bps), 10/15/37 | 441,634 |
| 68,455(a) | | Federal Home Loan Mortgage Corp. REMICS, Series | |
| | 3376, Class FM, 0.772% (1 Month USD LIBOR + | |
| | 62 bps), 10/15/37 | 69,503 |
The accompanying notes are an integral part of these financial statements.
Pioneer Multi-Asset Ultrashort Income Fund | Semiannual Report | 9/30/20 45
Schedule of Investments | 9/30/20
(unaudited) (continued)
| | | | |
| Principal | | | |
| Amount | | | |
| USD ($) | | | Value |
| | | COLLATERALIZED MORTGAGE | |
| | | OBLIGATIONS — (continued) | |
| 22,544(a) | | Federal Home Loan Mortgage Corp. REMICS, Series | |
| | 3560, Class FA, 1.402% (1 Month USD LIBOR + | |
| | | 125 bps), 5/15/37 | $ 23,389 |
| 258,805(a) | | Federal Home Loan Mortgage Corp. REMICS, Series | |
| | 3610, Class FA, 0.852% (1 Month USD LIBOR + | |
| | | 70 bps), 12/15/39 | 262,416 |
| 133,015(a) | | Federal Home Loan Mortgage Corp. REMICS, Series | |
| | 3708, Class PF, 0.502% (1 Month USD LIBOR + | |
| | | 35 bps), 7/15/40 | 133,400 |
| 5,359 | | Federal Home Loan Mortgage Corp. REMICS, Series | |
| | | 3760, Class KH, 2.0%, 11/15/20 | 5,359 |
| 38,998(a) | | Federal Home Loan Mortgage Corp. REMICS, Series | |
| | 3767, Class JF, 0.452% (1 Month USD LIBOR + | |
| | | 30 bps), 2/15/39 | 39,044 |
| 797(a) | | Federal Home Loan Mortgage Corp. REMICS, Series | |
| | 3780, Class FE, 0.552% (1 Month USD LIBOR + | |
| | | 40 bps), 12/15/20 | 797 |
| 73,054(a) | | Federal Home Loan Mortgage Corp. REMICS, Series | |
| | 3784, Class F, 0.552% (1 Month USD LIBOR + | |
| | | 40 bps), 7/15/23 | 72,866 |
| 18,856(a) | | Federal Home Loan Mortgage Corp. REMICS, Series | |
| | 3792, Class DF, 0.552% (1 Month USD LIBOR + | |
| | | 40 bps), 11/15/40 | 18,748 |
| 29,249(a) | | Federal Home Loan Mortgage Corp. REMICS, Series | |
| | 3867, Class FD, 0.502% (1 Month USD LIBOR + | |
| | | 35 bps), 5/15/41 | 29,361 |
| 82,469(a) | | Federal Home Loan Mortgage Corp. REMICS, Series | |
| | 3914, Class LF, 0.352% (1 Month USD LIBOR + | |
| | | 20 bps), 8/15/26 | 82,118 |
| 59,168(a) | | Federal Home Loan Mortgage Corp. REMICS, Series | |
| | 3960, Class FB, 0.452% (1 Month USD LIBOR + | |
| | | 30 bps), 2/15/30 | 59,142 |
| 178,551(a) | | Federal Home Loan Mortgage Corp. REMICS, Series | |
| | 3970, Class GF, 0.452% (1 Month USD LIBOR + | |
| | | 30 bps), 9/15/26 | 178,418 |
| 333,626(a) | | Federal Home Loan Mortgage Corp. REMICS, Series | |
| | 3982, Class FL, 0.702% (1 Month USD LIBOR + | |
| | | 55 bps), 12/15/39 | 335,467 |
| 142,888(a) | | Federal Home Loan Mortgage Corp. REMICS, Series | |
| | 4056, Class QF, 0.502% (1 Month USD LIBOR + | |
| | | 35 bps), 12/15/41 | 143,248 |
| 135,357(a) | | Federal Home Loan Mortgage Corp. Strips, Series 237, | |
| | | Class F14, 0.552% (1 Month USD LIBOR + | |
| | | 40 bps), 5/15/36 | 135,349 |
| 116,687(a) | | Federal Home Loan Mortgage Corp. Strips, Series 239, | |
| | | Class F29, 0.402% (1 Month USD LIBOR + | |
| | | 25 bps), 8/15/36 | 116,625 |
| 504,444(a) | | Federal Home Loan Mortgage Corp. Strips, Series 239, | |
| | | Class F30, 0.452% (1 Month USD LIBOR + | |
| | | 30 bps), 8/15/36 | 501,854 |
The accompanying notes are an integral part of these financial statements.
46 Pioneer Multi-Asset Ultrashort Income Fund | Semiannual Report | 9/30/20
| | | | |
| Principal | | | |
| Amount | | | |
| USD ($) | | | Value |
| | COLLATERALIZED MORTGAGE | |
| | OBLIGATIONS — (continued) | |
| 153,602(a) | | Federal Home Loan Mortgage Corp. Strips, Series 244, | |
| | Class F22, 0.502% (1 Month USD LIBOR + | |
| | 35 bps), 12/15/36 | $ 154,049 |
| 6,434(a) | | Federal National Mortgage Association REMICS, Series | |
| | 1991-124, Class FA, 1.048% (1 Month USD LIBOR + | |
| | 90 bps), 9/25/21 | 6,430 |
| 21,101(a) | | Federal National Mortgage Association REMICS, Series | |
| | 1993-230, Class FA, 0.775% (1 Month USD LIBOR + | |
| | 60 bps), 12/25/23 | 20,996 |
| 55,423(a) | | Federal National Mortgage Association REMICS, Series | |
| | 1993-247, Class FA, 2.053% (11th District | |
| | Cost of Funds Index + 140 bps), 12/25/23 | 56,204 |
| 55,423(a) | | Federal National Mortgage Association REMICS, Series | |
| | 1993-247, Class FE, 1.148% (1 Month USD LIBOR + | |
| | 100 bps), 12/25/23 | 55,847 |
| 109,037(a) | | Federal National Mortgage Association REMICS, Series | |
| | 1994-40, Class FC, 0.648% (1 Month USD LIBOR + | |
| | 50 bps), 3/25/24 | 110,101 |
| 16,868(a) | | Federal National Mortgage Association REMICS, Series | |
| | 1997-46, Class FA, 0.65% (1 Month USD LIBOR + | |
| | 50 bps), 7/18/27 | 16,716 |
| 44,245(a) | | Federal National Mortgage Association REMICS, Series | |
| | 1998-21, Class F, 0.5% (1 Year CMT Index + | |
| | 35 bps), 3/25/28 | 44,012 |
| 2,239(a) | | Federal National Mortgage Association REMICS, Series | |
| | 1999-49, Class FB, 0.648% (1 Month USD LIBOR + | |
| | 50 bps), 3/25/23 | 2,236 |
| 36,109(a) | | Federal National Mortgage Association REMICS, Series | |
| | 2000-47, Class FD, 0.698% (1 Month USD LIBOR + | |
| | 55 bps), 12/25/30 | 36,310 |
| 141,244(a) | | Federal National Mortgage Association REMICS, Series | |
| | 2001-35, Class F, 0.748% (1 Month USD LIBOR + | |
| | 60 bps), 7/25/31 | 142,282 |
| 58,339(a) | | Federal National Mortgage Association REMICS, Series | |
| | 2001-37, Class F, 0.648% (1 Month USD LIBOR + | |
| | 50 bps), 8/25/31 | 58,551 |
| 291,882(a) | | Federal National Mortgage Association REMICS, Series | |
| | 2001-50, Class FQ, 0.748% (1 Month USD LIBOR + | |
| | 60 bps), 11/25/31 | 294,028 |
| 128,428(a) | | Federal National Mortgage Association REMICS, Series | |
| | 2001-65, Class F, 0.748% (1 Month USD LIBOR + | |
| | 60 bps), 11/25/31 | 129,372 |
| 89,437(a) | | Federal National Mortgage Association REMICS, Series | |
| | 2001-69, Class FA, 0.748% (1 Month USD LIBOR + | |
| | 60 bps), 7/25/31 | 90,097 |
| 260,842(a) | | Federal National Mortgage Association REMICS, Series | |
| | 2001-72, Class FB, 1.048% (1 Month USD LIBOR + | |
| | 90 bps), 12/25/31 | 265,254 |
The accompanying notes are an integral part of these financial statements.
Pioneer Multi-Asset Ultrashort Income Fund | Semiannual Report | 9/30/20 47
Schedule of Investments | 9/30/20
(unaudited) (continued)
| | | | |
| Principal | | | |
| Amount | | | |
| USD ($) | | | Value |
| | COLLATERALIZED MORTGAGE | |
| | OBLIGATIONS — (continued) | |
| 67,591(a) | | Federal National Mortgage Association REMICS, Series | |
| | 2001-81, Class FL, 0.8% (1 Month USD LIBOR + | |
| | 65 bps), 1/18/32 | $ 68,100 |
| 116,645(a) | | Federal National Mortgage Association REMICS, Series | |
| | 2002-1, Class FC, 0.848% (1 Month USD LIBOR + | |
| | 70 bps), 1/25/32 | 117,913 |
| 358,697(a) | | Federal National Mortgage Association REMICS, Series | |
| | 2002-13, Class FD, 1.048% (1 Month USD LIBOR + | |
| | 90 bps), 3/25/32 | 363,568 |
| 250,048(a) | | Federal National Mortgage Association REMICS, Series | |
| | 2002-34, Class FA, 0.65% (1 Month USD LIBOR + | |
| | 50 bps), 5/18/32 | 251,615 |
| 180,564(a) | | Federal National Mortgage Association REMICS, Series | |
| | 2002-56, Class FN, 1.148% (1 Month USD LIBOR + | |
| | 100 bps), 7/25/32 | 184,380 |
| 25,296(a) | | Federal National Mortgage Association REMICS, Series | |
| | 2002-58, Class FD, 0.748% (1 Month USD LIBOR + | |
| | 60 bps), 8/25/32 | 25,492 |
| 111,443(a) | | Federal National Mortgage Association REMICS, Series | |
| | 2002-77, Class F, 0.748% (1 Month USD LIBOR + | |
| | 60 bps), 12/25/32 | 112,853 |
| 86,760(a) | | Federal National Mortgage Association REMICS, Series | |
| | 2002-82, Class FB, 0.648% (1 Month USD LIBOR + | |
| | 50 bps), 12/25/32 | 87,143 |
| 110,339(a) | | Federal National Mortgage Association REMICS, Series | |
| | 2002-90, Class FH, 0.648% (1 Month USD LIBOR + | |
| | 50 bps), 9/25/32 | 110,820 |
| 56,485(a) | | Federal National Mortgage Association REMICS, Series | |
| | 2002-92, Class FB, 0.798% (1 Month USD LIBOR + | |
| | 65 bps), 4/25/30 | 56,985 |
| 125,331(a) | | Federal National Mortgage Association REMICS, Series | |
| | 2002-93, Class FH, 0.648% (1 Month USD LIBOR + | |
| | 50 bps), 1/25/33 | 126,615 |
| 102,304(a) | | Federal National Mortgage Association REMICS, Series | |
| | 2003-7, Class FA, 0.898% (1 Month USD LIBOR + | |
| | 75 bps), 2/25/33 | 103,642 |
| 201,212(a) | | Federal National Mortgage Association REMICS, Series | |
| | 2003-8, Class FJ, 0.498% (1 Month USD LIBOR + | |
| | 35 bps), 2/25/33 | 201,125 |
| 308,916(a) | | Federal National Mortgage Association REMICS, Series | |
| | 2003-31, Class FM, 0.648% (1 Month USD LIBOR + | |
| | 50 bps), 4/25/33 | 312,124 |
| 140,882(a) | | Federal National Mortgage Association REMICS, Series | |
| | 2003-42, Class JF, 0.648% (1 Month USD LIBOR + | |
| | 50 bps), 5/25/33 | 141,528 |
| 76,612(a) | | Federal National Mortgage Association REMICS, Series | |
| | 2003-49, Class FY, 0.548% (1 Month USD LIBOR + | |
| | 40 bps), 6/25/23 | 76,570 |
The accompanying notes are an integral part of these financial statements.
48 Pioneer Multi-Asset Ultrashort Income Fund | Semiannual Report | 9/30/20
| | | | |
| Principal | | | |
| Amount | | | |
| USD ($) | | | Value |
| | COLLATERALIZED MORTGAGE | |
| | OBLIGATIONS — (continued) | |
| 210,869(a) | | Federal National Mortgage Association REMICS, Series | |
| | 2003-107, Class FD, 0.648% (1 Month USD LIBOR + | |
| | 50 bps), 11/25/33 | $ 211,959 |
| 185,052(a) | | Federal National Mortgage Association REMICS, Series | |
| | 2004-52, Class FW, 0.548% (1 Month USD LIBOR + | |
| | 40 bps), 7/25/34 | 186,076 |
| 53,346(a) | | Federal National Mortgage Association REMICS, Series | |
| | 2004-54, Class FN, 0.598% (1 Month USD LIBOR + | |
| | 45 bps), 7/25/34 | 53,743 |
| 438,271(a) | | Federal National Mortgage Association REMICS, Series | |
| | 2004-79, Class FM, 0.448% (1 Month USD LIBOR + | |
| | 30 bps), 11/25/24 | 438,026 |
| 38,154(a) | | Federal National Mortgage Association REMICS, Series | |
| | 2004-91, Class HF, 0.448% (1 Month USD LIBOR + | |
| | 30 bps), 11/25/34 | 38,214 |
| 193,857(a) | | Federal National Mortgage Association REMICS, Series | |
| | 2005-83, Class KT, 0.448% (1 Month USD LIBOR + | |
| | 30 bps), 10/25/35 | 194,283 |
| 255,944(a) | | Federal National Mortgage Association REMICS, Series | |
| | 2005-83, Class LF, 0.458% (1 Month USD LIBOR + | |
| | 31 bps), 2/25/35 | 256,401 |
| 38,714(a) | | Federal National Mortgage Association REMICS, Series | |
| | 2006-11, Class FB, 0.448% (1 Month USD LIBOR + | |
| | 30 bps), 3/25/36 | 38,904 |
| 115,522(a) | | Federal National Mortgage Association REMICS, Series | |
| | 2006-33, Class FH, 0.498% (1 Month USD LIBOR + | |
| | 35 bps), 5/25/36 | 115,846 |
| 331,154(a) | | Federal National Mortgage Association REMICS, Series | |
| | 2006-34, Class FA, 0.458% (1 Month USD LIBOR + | |
| | 31 bps), 5/25/36 | 331,910 |
| 229,020(a) | | Federal National Mortgage Association REMICS, Series | |
| | 2006-42, Class CF, 0.598% (1 Month USD LIBOR + | |
| | 45 bps), 6/25/36 | 230,795 |
| 91,414(a) | | Federal National Mortgage Association REMICS, Series | |
| | 2006-56, Class FC, 0.438% (1 Month USD LIBOR + | |
| | 29 bps), 7/25/36 | 91,562 |
| 33,984(a) | | Federal National Mortgage Association REMICS, Series | |
| | 2006-70, Class BF, 0.698% (1 Month USD LIBOR + | |
| | 55 bps), 8/25/36 | 34,355 |
| 72,044(a) | | Federal National Mortgage Association REMICS, Series | |
| | 2006-82, Class F, 0.718% (1 Month USD LIBOR + | |
| | 57 bps), 9/25/36 | 72,977 |
| 111,604(a) | | Federal National Mortgage Association REMICS, Series | |
| | 2006-104, Class GF, 0.468% (1 Month USD LIBOR + | |
| | 32 bps), 11/25/36 | 112,017 |
| 44,711(a) | | Federal National Mortgage Association REMICS, Series | |
| | 2006-115, Class BF, 0.388% (1 Month USD LIBOR + | |
| | 24 bps), 12/25/36 | 44,667 |
The accompanying notes are an integral part of these financial statements.
Pioneer Multi-Asset Ultrashort Income Fund | Semiannual Report | 9/30/20 49
Schedule of Investments | 9/30/20
(unaudited) (continued)
| | | | |
| Principal | | | |
| Amount | | | |
| USD ($) | | | Value |
| | COLLATERALIZED MORTGAGE | |
| | OBLIGATIONS — (continued) | |
| 140,464(a) | | Federal National Mortgage Association REMICS, Series | |
| | 2007-2, Class FT, 0.398% (1 Month USD LIBOR + | |
| | 25 bps), 2/25/37 | $ 141,045 |
| 168,056(a) | | Federal National Mortgage Association REMICS, Series | |
| | 2007-7, Class FJ, 0.348% (1 Month USD LIBOR + | |
| | 20 bps), 2/25/37 | 167,719 |
| 63,993(a) | | Federal National Mortgage Association REMICS, Series | |
| | 2007-13, Class FA, 0.398% (1 Month USD LIBOR + | |
| | 25 bps), 3/25/37 | 63,913 |
| 150,575(a) | | Federal National Mortgage Association REMICS, Series | |
| | 2007-41, Class FA, 0.548% (1 Month USD LIBOR + | |
| | 40 bps), 5/25/37 | 151,315 |
| 270,198(a) | | Federal National Mortgage Association REMICS, Series | |
| | 2007-50, Class FN, 0.388% (1 Month USD LIBOR + | |
| | 24 bps), 6/25/37 | 269,971 |
| 25,243(a) | | Federal National Mortgage Association REMICS, Series | |
| | 2007-57, Class FA, 0.378% (1 Month USD LIBOR + | |
| | 23 bps), 6/25/37 | 25,239 |
| 73,354(a) | | Federal National Mortgage Association REMICS, Series | |
| | 2007-58, Class FA, 0.398% (1 Month USD LIBOR + | |
| | 25 bps), 6/25/37 | 73,267 |
| 72,952(a) | | Federal National Mortgage Association REMICS, Series | |
| | 2007-66, Class FB, 0.548% (1 Month USD LIBOR + | |
| | 40 bps), 7/25/37 | 73,210 |
| 236,008(a) | | Federal National Mortgage Association REMICS, Series | |
| | 2007-85, Class FG, 0.648% (1 Month USD LIBOR + | |
| | 50 bps), 9/25/37 | 238,493 |
| 299,238(a) | | Federal National Mortgage Association REMICS, Series | |
| | 2007-91, Class FB, 0.748% (1 Month USD LIBOR + | |
| | 60 bps), 10/25/37 | 303,567 |
| 112,413(a) | | Federal National Mortgage Association REMICS, Series | |
| | 2007-92, Class OF, 0.718% (1 Month USD LIBOR + | |
| | 57 bps), 9/25/37 | 113,726 |
| 64,196(a) | | Federal National Mortgage Association REMICS, Series | |
| | 2007-93, Class FD, 0.698% (1 Month USD LIBOR + | |
| | 55 bps), 9/25/37 | 64,876 |
| 28,232(a) | | Federal National Mortgage Association REMICS, Series | |
| | 2007-98, Class FD, 0.598% (1 Month USD LIBOR + | |
| | 45 bps), 6/25/37 | 28,427 |
| 39,504(a) | | Federal National Mortgage Association REMICS, Series | |
| | 2007-100, Class YF, 0.698% (1 Month USD LIBOR + | |
| | 55 bps), 10/25/37 | 40,158 |
| 47,767(a) | | Federal National Mortgage Association REMICS, Series | |
| | 2007-103, Class AF, 1.148% (1 Month USD LIBOR + | |
| | 100 bps), 3/25/37 | 49,044 |
| 51,889(a) | | Federal National Mortgage Association REMICS, Series | |
| | 2007-110, Class FA, 0.768% (1 Month USD LIBOR + | |
| | 62 bps), 12/25/37 | 52,607 |
The accompanying notes are an integral part of these financial statements.
50 Pioneer Multi-Asset Ultrashort Income Fund | Semiannual Report | 9/30/20
| | | | |
| Principal | | | |
| Amount | | | |
| USD ($) | | | Value |
| | | COLLATERALIZED MORTGAGE | |
| | | OBLIGATIONS — (continued) | |
| 43,000(a) | | Federal National Mortgage Association REMICS, Series | |
| | | 2008-6, Class FA, 0.848% (1 Month USD LIBOR + | |
| | | 70 bps), 2/25/38 | $ 43,659 |
| 179,012(a) | | Federal National Mortgage Association REMICS, Series | |
| | | 2008-88, Class FA, 1.368% (1 Month USD LIBOR + | |
| | | 122 bps), 10/25/38 | 185,164 |
| 63,573(a) | | Federal National Mortgage Association REMICS, Series | |
| | | 2009-113, Class FB, 0.698% (1 Month USD LIBOR + | |
| | | 55 bps), 1/25/40 | 64,191 |
| 33 | | Federal National Mortgage Association REMICS, Series | |
| | | 2010-17, Class DE, 3.5%, 6/25/21 | 33 |
| 121(a) | | Federal National Mortgage Association REMICS, Series | |
| | 2010-38, Class F, 0.448% (1 Month USD LIBOR + | |
| | | 30 bps), 4/25/25 | 121 |
| 65,803(a) | | Federal National Mortgage Association REMICS, Series | |
| | | 2010-43, Class FD, 0.748% (1 Month USD LIBOR + | |
| | | 60 bps), 5/25/40 | 66,679 |
| 116,506(a) | | Federal National Mortgage Association REMICS, Series | |
| | | 2010-43, Class IF, 0.648% (1 Month USD LIBOR + | |
| | | 50 bps), 5/25/40 | 115,650 |
| 591 | | Federal National Mortgage Association REMICS, Series | |
| | | 2010-112, Class AE, 2.0%, 10/25/25 | 591 |
| 163,636(a) | | Federal National Mortgage Association REMICS, Series | |
| | | 2011-19, Class FM, 0.698% (1 Month USD LIBOR + | |
| | | 55 bps), 5/25/40 | 164,163 |
| 173,298(a) | | Federal National Mortgage Association REMICS, Series | |
| | | 2012-40, Class PF, 0.648% (1 Month USD LIBOR + | |
| | | 50 bps), 4/25/42 | 174,991 |
| 1,473,530(a) | | Federal National Mortgage Association Trust, Series | |
| | | 2003-W6, Class F, 0.525% (1 Month USD LIBOR + | |
| | | 35 bps), 9/25/42 | 1,478,111 |
| 642,944(a) | | Federal National Mortgage Association Trust, Series | |
| | | 2005-W3, Class 2AF, 0.368% (1 Month USD LIBOR + | |
| | | 22 bps), 3/25/45 | 640,509 |
| 49,262(b) | | Federal National Mortgage Association Trust, Series | |
| | | 2005-W3, Class 3A, 3.788%, 4/25/45 | 53,643 |
| 76,095(b) | | Federal National Mortgage Association Trust, Series | |
| | | 2005-W4, Class 3A, 4.382%, 6/25/45 | 81,113 |
| 595,181(a) | | Federal National Mortgage Association Whole Loan, | |
| | | Series 2007-W1, Class 1AF1, 0.408% (1 Month USD | |
| | | LIBOR + 26 bps), 11/25/46 | 587,901 |
| 3,780,000(a) | | Freddie Mac Stacr Remic Trust, Series 2020-DNA4, | |
| | | Class M2, 3.898% (1 Month USD LIBOR + | |
| | | 375 bps), 8/25/50 (144A) | 3,825,589 |
| 3,915,673(a) | | Freddie Mac Stacr Remic Trust, Series 2020-HQA2, | |
| | | Class M1, 1.248% (1 Month USD LIBOR + | |
| | | 110 bps), 3/25/50 (144A) | 3,911,759 |
The accompanying notes are an integral part of these financial statements.
Pioneer Multi-Asset Ultrashort Income Fund | Semiannual Report | 9/30/20 51
Schedule of Investments | 9/30/20
(unaudited) (continued)
| | | | |
| Principal | | | |
| Amount | | | |
| USD ($) | | | Value |
| | COLLATERALIZED MORTGAGE | |
| | OBLIGATIONS — (continued) | |
| 8,470,000(a) | | Freddie Mac Stacr Remic Trust, Series 2020-HQA2, | |
| | Class M2, 3.248% (1 Month USD LIBOR + | |
| | 310 bps), 3/25/50 (144A) | $ 8,342,651 |
| 9,850,000(a) | | Freddie Mac Stacr Remic Trust, Series 2020-HQA3, | |
| | Class M2, 3.748% (1 Month USD LIBOR + | |
| | 360 bps), 7/25/50 (144A) | 9,899,322 |
| 4,090,000(a) | | Freddie Mac Stacr Remic Trust, Series 2020-HQA4, | |
| | Class M2, 3.302% (1 Month USD LIBOR + | |
| | 315 bps), 9/25/50 (144A) | 4,100,948 |
| 14,263,814(a) | | Freddie Mac Stacr Trust, Series 2019-HRP1, Class M2, | |
| | 1.548% (1 Month USD LIBOR + 140 bps), | |
| | 2/25/49 (144A) | 13,264,194 |
| 1,954,772(a) | | Freddie Mac Structured Agency Credit Risk Debt | |
| | Notes, Series 2015-DNA1, Class M3, 3.448% (1 Month | |
| | USD LIBOR + 330 bps), 10/25/27 | 1,989,173 |
| 10,973,928(a) | | Freddie Mac Structured Agency Credit Risk Debt | |
| | Notes, Series 2015-DNA3, Class M3, 4.848% (1 Month | |
| | USD LIBOR + 470 bps), 4/25/28 | 11,413,950 |
| 14,021,936(a) | | Freddie Mac Structured Agency Credit Risk Debt | |
| | Notes, Series 2016-DNA1, Class M3, 5.725% (1 Month | |
| | USD LIBOR + 555 bps), 7/25/28 | 14,861,501 |
| 9,595,001(a) | | Freddie Mac Structured Agency Credit Risk Debt | |
| | Notes, Series 2016-DNA2, Class M3, 4.798% (1 Month | |
| | USD LIBOR + 465 bps), 10/25/28 | 9,967,440 |
| 14,034,877(a) | | Freddie Mac Structured Agency Credit Risk Debt | |
| | Notes, Series 2016-DNA3, Class M3, 5.148% (1 Month | |
| | USD LIBOR + 500 bps), 12/25/28 | 14,475,331 |
| 14,406,074(a) | | Freddie Mac Structured Agency Credit Risk Debt | |
| | Notes, Series 2016-DNA4, Class M3, 3.948% (1 Month | |
| | USD LIBOR + 380 bps), 3/25/29 | 14,911,095 |
| 310,506(a) | | Freddie Mac Structured Agency Credit Risk Debt | |
| | Notes, Series 2016-HQA3, Class M2, 1.498% (1 Month | |
| | USD LIBOR + 135 bps), 3/25/29 | 310,506 |
| 1,400,000(a) | | Freddie Mac Structured Agency Credit Risk Debt | |
| | Notes, Series 2017-DNA2, Class M2, 3.598% (1 Month | |
| | USD LIBOR + 345 bps), 10/25/29 | 1,440,529 |
| 3,360,000(a) | | Freddie Mac Structured Agency Credit Risk Debt | |
| | Notes, Series 2017-DNA3, Class M2, 2.648% (1 Month | |
| | USD LIBOR + 250 bps), 3/25/30 | 3,389,709 |
| 4,296,051(a) | | Freddie Mac Structured Agency Credit Risk Debt | |
| | Notes, Series 2017-HQA1, Class M2, 3.698% (1 Month | |
| | USD LIBOR + 355 bps), 8/25/29 | 4,420,780 |
| 6,258,238(a) | | Freddie Mac Structured Agency Credit Risk Debt | |
| | Notes, Series 2017-HRP1, Class M2, 2.598% (1 Month | |
| | USD LIBOR + 245 bps), 12/25/42 | 5,929,191 |
| 1,030,188(a) | | Freddie Mac Structured Agency Credit Risk Debt | |
| | Notes, Series 2017-HRP1, Class M2D, 1.398% (1 Month | |
| | USD LIBOR + 125 bps), 12/25/42 | 950,230 |
The accompanying notes are an integral part of these financial statements.
52 Pioneer Multi-Asset Ultrashort Income Fund | Semiannual Report | 9/30/20
| | | | |
| Principal | | | |
| Amount | | | |
| USD ($) | | | Value |
| | COLLATERALIZED MORTGAGE | |
| | OBLIGATIONS — (continued) | |
| 7,954,219(a) | | Freddie Mac Structured Agency Credit Risk Debt | |
| | Notes, Series 2018-HQA1, Class M2, 2.448% (1 Month | |
| | USD LIBOR + 230 bps), 9/25/30 | $ 7,824,139 |
| 2,960,733(a) | | Gosforth Funding Plc, Series 2018-1A, Class A1, 0.7% | |
| | (3 Month USD LIBOR + 45 bps), 8/25/60 (144A) | 2,961,900 |
| 100,870(a) | | Government National Mortgage Association, Series | |
| | 2003-7, Class FB, 0.352% (1 Month USD LIBOR + | |
| | 20 bps), 1/16/33 | 100,541 |
| 414,221(a) | | Government National Mortgage Association, Series | |
| | 2005-3, Class FC, 0.402% (1 Month USD LIBOR + | |
| | 25 bps), 1/16/35 | 413,882 |
| 384,950(a) | | Government National Mortgage Association, Series | |
| | 2005-16, Class FA, 0.406% (1 Month USD LIBOR + | |
| | 25 bps), 2/20/35 | 384,631 |
| 130,136(a) | | Government National Mortgage Association, Series | |
| | 2008-69, Class FA, 0.656% (1 Month USD LIBOR + | |
| | 50 bps), 8/20/38 | 130,369 |
| 132,530(a) | | Government National Mortgage Association, Series | |
| | 2009-66, Class UF, 1.152% (1 Month USD LIBOR + | |
| | 100 bps), 8/16/39 | 135,683 |
| 461,082(a) | | Government National Mortgage Association, Series | |
| | 2009-88, Class MF, 0.756% (1 Month USD LIBOR + | |
| | 60 bps), 7/20/39 | 462,038 |
| 100,758(a) | | Government National Mortgage Association, Series | |
| | 2009-92, Class FJ, 0.832% (1 Month USD LIBOR + | |
| | 68 bps), 10/16/39 | 101,971 |
| 2,035,377(a) | | Holmes Master Issuer Plc, Series 2018-2A, Class A2, | |
| | 0.695% (3 Month USD LIBOR + 42 bps), | |
| | 10/15/54 (144A) | 2,033,275 |
| 12,619,800(a) | | Home Partners of America Trust, Series 2017-1, | |
| | Class A, 0.968% (1 Month USD LIBOR + 82 bps), | |
| | 7/17/34 (144A) | 12,573,033 |
| 7,200,000(a) | | Home Partners of America Trust, Series 2017-1, | |
| | Class B, 1.501% (1 Month USD LIBOR + 135 bps), | |
| | 7/17/34 (144A) | 7,200,835 |
| 3,610,408(a) | | Home Re, Ltd., Series 2018-1, Class M1, 1.748% | |
| | (1 Month USD LIBOR + 160 bps), 10/25/28 (144A) | 3,564,331 |
| 4,464,414(a) | | Home Re, Ltd., Series 2019-1, Class M1, 1.798% | |
| | (1 Month USD LIBOR + 165 bps), 5/25/29 (144A) | 4,411,837 |
| 896,212(a) | | HomeBanc Mortgage Trust, Series 2005-3, Class A1, | |
| | 0.388% (1 Month USD LIBOR + 24 bps), 7/25/35 | 896,945 |
| 7,023,906(b) | | JP Morgan Mortgage Trust, Series 2014-IVR6, Class B1, | |
| | 2.532%, 7/25/44 (144A) | 7,099,434 |
| 3,400,935(b) | | JP Morgan Mortgage Trust, Series 2017-4, Class A9, | |
| | 3.5%, 11/25/48 (144A) | 3,513,878 |
| 2,391,441(a) | | JP Morgan Mortgage Trust, Series 2018-7FRB, | |
| | Class A3, 0.898% (1 Month USD LIBOR + 75 bps), | |
| | 4/25/46 (144A) | 2,316,789 |
The accompanying notes are an integral part of these financial statements.
Pioneer Multi-Asset Ultrashort Income Fund | Semiannual Report | 9/30/20 53
Schedule of Investments | 9/30/20
(unaudited) (continued)
| | | | |
| Principal | | | |
| Amount | | | |
| USD ($) | | | Value |
| | COLLATERALIZED MORTGAGE | |
| | OBLIGATIONS — (continued) | |
| 8,325,293(b) | | JP Morgan Mortgage Trust, Series 2018-7FRB, | |
| | Class B1, 2.216%, 4/25/46 (144A) | $ 7,770,946 |
| 7,874,259(b) | | JP Morgan Mortgage Trust, Series 2018-7FRB, | |
| | Class B2, 2.216%, 4/25/46 (144A) | 7,328,534 |
| 1,822,852(a) | | JP Morgan Seasoned Mortgage Trust, Series 2014-1, | |
| | Class AM, 0.648% (1 Month USD LIBOR + | |
| | 50 bps), 5/25/33 (144A) | 1,782,070 |
| 6,807,286(b) | | JP Morgan Seasoned Mortgage Trust, Series 2014-1, | |
| | Class B1, 0.847%, 5/25/33 (144A) | 6,532,458 |
| 6,345,470(b) | | JP Morgan Seasoned Mortgage Trust, Series 2014-1, | |
| | Class B2, 0.847%, 5/25/33 (144A) | 6,011,472 |
| 4,891,799(b) | | JP Morgan Seasoned Mortgage Trust, Series 2014-1, | |
| | Class B3, 0.847%, 5/25/33 (144A) | 4,540,679 |
| 437,127(a) | | JP Morgan Trust, Series 2015-1, Class 1A14, 2.035% | |
| | (1 Month USD LIBOR + 125 bps), 12/25/44 (144A) | 441,035 |
| 21,098,984(a) | | LSTAR Securities Investment Trust, Series 2019-2, | |
| | Class A1, 1.655% (1 Month USD LIBOR + | |
| | 150 bps), 4/1/24 (144A) | 20,903,411 |
| 23,392,238(a) | | LSTAR Securities Investment, Ltd., Series 2019-3, | |
| | Class A1, 1.655% (1 Month USD LIBOR + | |
| | 150 bps), 4/1/24 (144A) | 23,116,184 |
| 24,457,111(a) | | LSTAR Securities Investment, Ltd., Series 2019-4, | |
| | Class A1, 1.655% (1 Month USD LIBOR + | |
| | 150 bps), 5/1/24 (144A) | 24,302,985 |
| 11,788,590(a) | | LSTAR Securities Investment, Ltd., Series 2019-5, | |
| | Class A1, 1.655% (1 Month USD LIBOR + | |
| | 150 bps), 11/1/24 (144A) | 11,660,631 |
| 12,021(b) | | Merrill Lynch Mortgage Investors Trust, Series 2003-G, | |
| | Class A3, 2.695%, 1/25/29 | 11,868 |
| 599,489(a) | | Merrill Lynch Mortgage Investors Trust, Series 2003-H, | |
| | Class A1, 0.788% (1 Month USD LIBOR + | |
| | 64 bps), 1/25/29 | 588,409 |
| 360,132(a) | | Merrill Lynch Mortgage Investors Trust, Series 2004-B, | |
| | Class A2, 1.117% (6 Month USD LIBOR + | |
| | 54 bps), 5/25/29 | 351,652 |
| 27,173(a) | | Merrill Lynch Mortgage Investors Trust, Series 2004-C, | |
| | Class A2B, 1.383% (6 Month USD LIBOR + | |
| | 100 bps), 7/25/29 | 26,378 |
| 100,855(b) | | Merrill Lynch Mortgage Investors Trust, Series 2004-D, | |
| | Class A3, 2.394%, 9/25/29 | 98,339 |
| 3,022,081(b) | | Morgan Stanley Residential Mortgage Loan Trust, Series | |
| | 2014-1A, Class A1, 2.709%, 6/25/44 (144A) | 3,103,990 |
| 2,564,000(b) | | Morgan Stanley Residential Mortgage Loan Trust, Series | |
| | 2014-1A, Class B4, 2.709%, 6/25/44 (144A) | 2,664,200 |
| 5,356,955(a) | | Oaktown Re II, Ltd., Series 2018-1A, Class M1, 1.698% | |
| | (1 Month USD LIBOR + 155 bps), 7/25/28 (144A) | 5,341,062 |
| 3,620,000(a) | | Oaktown Re III, Ltd., Series 2019-1A, Class B1A, 3.648% | |
| | (1 Month USD LIBOR + 350 bps), 7/25/29 (144A) | 3,259,664 |
The accompanying notes are an integral part of these financial statements.
54 Pioneer Multi-Asset Ultrashort Income Fund | Semiannual Report | 9/30/20
| | | | |
| Principal | | | |
| Amount | | | |
| USD ($) | | | Value |
| | | COLLATERALIZED MORTGAGE | |
| | | OBLIGATIONS — (continued) | |
| 13,573,000(a) | | Oaktown Re III, Ltd., Series 2019-1A, Class M1B, | |
| | | 2.098% (1 Month USD LIBOR + 195 bps), | |
| | | 7/25/29 (144A) | $ 13,367,170 |
| 5,680,000(a) | | Oaktown Re IV Ltd., Series 2020-1A, Class M1B, | |
| | | 4.898% (1 Month USD LIBOR + 475 bps), | |
| | | 7/25/30 (144A) | 5,680,066 |
| 3,504,177(a) | | OBX Trust, Series 2019-EXP1, Class 2A1A, 1.098% | |
| | | (1 Month USD LIBOR + 95 bps), 1/25/59 (144A) | 3,497,640 |
| 7,950,000(a) | | Pepper I-Prime Trust, Series 2018-2A, Class A1U2, | |
| | | 0.631% (1 Month USD LIBOR + 48 bps), | |
| | | 10/13/20 (144A) | 7,950,000 |
| 1,734,613(a) | | Pepper Residential Securities Trust, Series 21A, | |
| | | Class A1U, 1.032% (1 Month USD LIBOR + | |
| | | 88 bps), 1/16/60 (144A) | 1,729,253 |
| 4,220,679(a) | | Pepper Residential Securities Trust No. 22, Series 22A, | |
| | | Class A1U, 1.156% (1 Month USD LIBOR + | |
| | | 100 bps), 6/20/60 (144A) | 4,203,081 |
| 8,585,111(a) | | Pepper Residential Securities Trust No. 25, Series 25A, | |
| | | Class A1U, 1.081% (1 Month USD LIBOR + | |
| | | 93 bps), 3/12/61 (144A) | 8,562,223 |
| 1,812,500 | | Permanent Master Issuer Plc, Series 2018-1A, | |
| | | Class 1A1, 0.655% (3 Month USD LIBOR + | |
| | | 38 bps), 7/15/58 | 1,812,261 |
| 741,471(a) | | Radnor Re, Ltd., Series 2018-1, Class M1, 1.548% | |
| | | (1 Month USD LIBOR + 140 bps), 3/25/28 (144A) | 740,111 |
| 4,967,751(a) | | Radnor Re, Ltd., Series 2019-1, Class M1B, 2.098% | |
| | | (1 Month USD LIBOR + 195 bps), 2/25/29 (144A) | 4,889,961 |
| 17,250,000(a) | | Radnor Re, Ltd., Series 2019-2, Class M1B, 1.898% | |
| | | (1 Month USD LIBOR + 175 bps), 6/25/29 (144A) | 17,112,897 |
| 6,000,000(a) | | Radnor Re, Ltd., Series 2020-1, Class M1A, 1.098% | |
| | | (1 Month USD LIBOR + 95 bps), 2/25/30 (144A) | 5,977,835 |
| 7,590,000 | | Radnor Re, Ltd., Series 2020-2, Class M1B, 4.146%, | |
| | | (1 Month USD LIBOR + 400 bps), 10/25/30 (144A) | 7,590,000 |
| 2,740,000 | | Radnor Re, Ltd., Series 2020-2, Class M1C, 4.746%, | |
| | | (1 Month USD LIBOR + 460 bps), 10/25/30 (144A) | 2,740,000 |
| 1,851,430(a) | | RESI Finance LP, Series 2003-CB1, Class B3, 1.606% | |
| | | (1 Month USD LIBOR + 145 bps), 6/10/35 (144A) | 1,525,521 |
| 4,431,095(a) | | Resimac MBS Trust, Series 2018-2A, Class A1A, | |
| | | 1.006% (1 Month USD LIBOR + 85 bps), | |
| | | 4/10/50 (144A) | 4,413,746 |
| 810,239(a) | | Resimac Premier, Series 2017-1A, Class A1A, 1.101% | |
| | | (1 Month USD LIBOR + 95 bps), 9/11/48 (144A) | 810,119 |
| 1,944,983(a) | | Resimac Premier, Series 2018-1A, Class A1, 0.956% | |
| | | (1 Month USD LIBOR + 80 bps), 11/10/49 (144A) | 1,942,384 |
| 9,098,421(a) | | Resimac Premier, Series 2019-2A, Class A1, 1.106% | |
| | | (1 Month USD LIBOR + 95 bps), 2/10/51 (144A) | 9,091,743 |
| 4,000,000(a) | | Resimac Premier, Series 2020-1A, Class A1A, 1.209% | |
| | | (1 Month USD LIBOR + 105 bps), 2/7/52 (144A) | 4,000,380 |
The accompanying notes are an integral part of these financial statements.
Pioneer Multi-Asset Ultrashort Income Fund | Semiannual Report | 9/30/20 55
Schedule of Investments | 9/30/20
(unaudited) (continued)
| | | | |
| Principal | | | |
| Amount | | | |
| USD ($) | | | Value |
| | COLLATERALIZED MORTGAGE | |
| | OBLIGATIONS — (continued) | |
| 4,937,421(b) | | RMF Buyout Issuance Trust, Series 2020-1, Class A, | |
| | 2.158%, 2/25/30 (144A) | $ 4,942,531 |
| 2,000,000(b) | | RMF Buyout Issuance Trust, Series 2020-1, Class M1, | |
| | 2.332%, 2/25/30 (144A) | 2,007,057 |
| 4,515,616(b) | | RMF Buyout Issuance Trust, Series 2020-2, Class A, | |
| | 1.706%, 6/25/30 (144A) | 4,521,211 |
| 7,247,796(a) | | STACR Trust, Series 2018-HRP1, Class B1, 3.898% | |
| | (1 Month USD LIBOR + 375 bps), 4/25/43 (144A) | 6,805,917 |
| 5,312,005(a) | | STACR Trust, Series 2018-HRP1, Class M2, 1.798% | |
| | (1 Month USD LIBOR + 165 bps), 4/25/43 (144A) | 5,115,466 |
| 4,474,951(a) | | STACR Trust, Series 2018-HRP2, Class M2, 1.398% | |
| | (1 Month USD LIBOR + 125 bps), 2/25/47 (144A) | 4,349,716 |
| 17,605,000(a) | | STACR Trust, Series 2018-HRP2, Class M3, 2.548% | |
| | (1 Month USD LIBOR + 240 bps), 2/25/47 (144A) | 16,795,740 |
| 7,500,000(a) | | Starwood Waypoint Homes Trust, Series 2017-1, | |
| | Class B, 1.322% (1 Month USD LIBOR + | |
| | 117 bps), 1/17/35 (144A) | 7,477,679 |
| 10,066,417(a) | | Towd Point HE Trust, Series 2019-HE1, Class A1, | |
| | 1.048% (1 Month USD LIBOR + 90 bps), | |
| | 4/25/48 (144A) | 10,027,884 |
| 6,344,757(a) | | Towd Point HE Trust, Series 2019-HE1, Class M1, | |
| | 1.248% (1 Month USD LIBOR + 110 bps), | |
| | 4/25/48 (144A) | 6,216,675 |
| | TOTAL COLLATERALIZED MORTGAGE OBLIGATIONS | |
| | (Cost $703,886,191) | $ 687,457,356 |
| | COMMERCIAL MORTGAGE-BACKED | |
| | SECURITIES — 11.4% of Net Assets | |
| 1,542,078(a) | | AREIT Trust, Series 2018-CRE2, Class A, 1.132% | |
| | (1 Month USD LIBOR + 98 bps), 11/14/35 (144A) | $ 1,520,988 |
| 12,500,000(a) | | Austin Fairmont Hotel Trust, Series 2019-FAIR, | |
| | Class E, 2.402% (1 Month USD LIBOR + 225 bps), | |
| | 9/15/32 (144A) | 10,900,011 |
| 8,000,000(a) | | BAMLL Commercial Mortgage Securities Trust, | |
| | Series 2019-RLJ, Class C, 1.752% (1 Month USD | |
| | LIBOR + 160 bps), 4/15/36 (144A) | 7,554,882 |
| 978,591(a) | | Bancorp Commercial Mortgage Trust, Series | |
| | 2018-CRE4, Class A, 1.052% (1 Month USD LIBOR + | |
| | 90 bps), 9/15/35 (144A) | 968,596 |
| 13,500,000(a) | | BHP Trust, Series 2019-BXHP, Class D, 1.924% | |
| | (1 Month USD LIBOR + 177 bps), 8/15/36 (144A) | 12,412,259 |
| 7,750,000(a) | | BTH-13 Mortgage Backed Securities Trust, Series | |
| | 2018-13, Class A, 2.655% (1 Month USD LIBOR + | |
| | 250 bps), 8/18/21 (144A) | 7,694,670 |
| 5,700,000(a) | | BTH-16 Mortgage-Backed Securities Trust, Series | |
| | 2018-16, Class A, 2.655% (1 Month USD LIBOR + | |
| | 250 bps), 8/4/21 (144A) | 5,514,174 |
The accompanying notes are an integral part of these financial statements.
56 Pioneer Multi-Asset Ultrashort Income Fund | Semiannual Report | 9/30/20
| | | | |
| Principal | | | |
| Amount | | | |
| USD ($) | | | Value |
| | COMMERCIAL MORTGAGE-BACKED | |
| | SECURITIES — (continued) | |
| 7,625,000(a) | | BTH-21 Mortgage-Backed Securities Trust, Series | |
| | 2018-21, Class A, 2.655% (1 Month USD LIBOR + | |
| | 250 bps), 10/7/21 (144A) | $ 7,571,273 |
| 14,500,000(a) | | BTH-25 Mortgage-Backed Securities Trust, Series | |
| | 2019-25, Class A, 2.656% (1 Month USD LIBOR + | |
| | 250 bps), 2/18/21 (144A) | 14,393,714 |
| 5,884,925(a) | | BTH-3 Mortgage-Backed Securities Trust, Series | |
| | 2018-3, Class A, 2.655% (1 Month USD LIBOR + | |
| | 250 bps), 7/8/21 | 5,682,381 |
| 5,810,000(a) | | BX Commercial Mortgage Trust, Series 2018-IND, | |
| | Class D, 1.452% (1 Month USD LIBOR + 130 bps), | |
| | 11/15/35 (144A) | 5,766,228 |
| 15,483,047(a) | | BX Commercial Mortgage Trust, Series 2019-XL, | |
| | Class G, 2.452% (1 Month USD LIBOR + 230 bps), | |
| | 10/15/36 (144A) | 15,231,409 |
| 9,300,000(a) | | BX Trust, Series 2019-ATL, Class B, 1.539% (1 Month | |
| | USD LIBOR + 139 bps), 10/15/36 (144A) | 8,698,419 |
| 8,000,000(a) | | BXP Trust, Series 2017-CQHP, Class B, 1.252% (1 Month | |
| | USD LIBOR + 110 bps), 11/15/34 (144A) | 7,462,407 |
| 2,171,167(a) | | CG-CCRE Commercial Mortgage Trust, Series 2014-FL1, | |
| | Class B, 1.302% (1 Month USD LIBOR + | |
| | 115 bps), 6/15/31 (144A) | 2,129,443 |
| 722,572(a) | | CG-CCRE Commercial Mortgage Trust, Series 2014-FL2, | |
| | Class A, 2.006% (1 Month USD LIBOR + | |
| | 185 bps), 11/15/31 (144A) | 676,419 |
| 10,000,000(a) | | CGDB Commercial Mortgage Trust, Series 2019-MOB, | |
| | Class C, 1.602% (1 Month USD LIBOR + | |
| | 145 bps), 11/15/36 (144A) | 9,875,453 |
| 5,700,000(a) | | CGMS Commercial Mortgage Trust, Series 2017-MDRC, | |
| | Class C, 1.452% (1 Month USD LIBOR + | |
| | 130 bps), 7/15/30 (144A) | 5,372,079 |
| 14,935,551(a) | | CHC Commercial Mortgage Trust, Series 2019-CHC, | |
| | Class C, 1.902% (1 Month USD LIBOR + 175 bps), | |
| | 6/15/34 (144A) | 13,943,157 |
| 9,500,000(a) | | CHT Mortgage Trust, Series 2017-CSMO, Class C, | |
| | 1.652% (1 Month USD LIBOR + 150 bps), | |
| | 11/15/36 (144A) | 9,071,062 |
| 8,750,000(a) | | Citigroup Commercial Mortgage Trust, Series | |
| | 2019-SST2, Class B, 1.252% (1 Month USD LIBOR + | |
| | 110 bps), 12/15/36 (144A) | 8,518,938 |
| 5,500,000(a) | | Citigroup Commercial Mortgage Trust, Series | |
| | 2019-SST2, Class C, 1.452% (1 Month USD LIBOR + | |
| | 130 bps), 12/15/36 (144A) | 5,302,014 |
| 6,000,000(a) | | CLNY Trust, Series 2019-IKPR, Class B, 1.63% (1 Month | |
| | USD LIBOR + 148 bps), 11/15/38 (144A) | 5,610,724 |
| 2,000,000(a) | | CLNY Trust, Series 2019-IKPR, Class E, 2.873% (1 Month | |
| | USD LIBOR + 272 bps), 11/15/38 (144A) | 1,689,367 |
The accompanying notes are an integral part of these financial statements.
Pioneer Multi-Asset Ultrashort Income Fund | Semiannual Report | 9/30/20 57
Schedule of Investments | 9/30/20
(unaudited) (continued)
| | | | |
| Principal | | | |
| Amount | | | |
| USD ($) | | | Value |
| | COMMERCIAL MORTGAGE-BACKED | |
| | SECURITIES — (continued) | |
| 6,750,000(a) | | Credit Suisse Commercial Mortgage Securities Corp., | |
| | Series 2019-SKLZ, Class B, 2.052% (1 Month USD | |
| | LIBOR + 190 bps), 1/15/34 (144A) | $ 6,447,722 |
| 10,000,000(a) | | Credit Suisse Mortgage Capital Certificates, Series | |
| | 2019-ICE4, Class E, 2.302% (1 Month USD LIBOR + | |
| | 215 bps), 5/15/36 (144A) | 9,861,987 |
| 19,750,000(a) | | Exantas Capital Corp., Series 2020-RSO8, Class A, | |
| | 1.301% (1 Month USD LIBOR + 115 bps), | |
| | 3/15/35 (144A) | 19,487,284 |
| 326,195(a) | | FREMF Mortgage Trust, Series 2014-KF03, Class B, | |
| | 4.657% (1 Month USD LIBOR + 450 bps), | |
| | 1/25/21 (144A) | 325,551 |
| 1,715,812(a) | | FREMF Mortgage Trust, Series 2014-KF05, Class B, | |
| | 4.157% (1 Month USD LIBOR + 400 bps), | |
| | 9/25/22 (144A) | 1,697,616 |
| 2,930,828(a) | | FREMF Mortgage Trust, Series 2014-KS02, Class B, | |
| | 5.157% (1 Month USD LIBOR + 500 bps), | |
| | 8/25/23 (144A) | 2,648,809 |
| 3,907,816(a) | | FREMF Mortgage Trust, Series 2018-KI01, Class B, | |
| | 2.607% (1 Month USD LIBOR + 245 bps), | |
| | 9/25/22 (144A) | 3,869,659 |
| 2,598,010(a) | | GPMT, Ltd., Series 2018-FL1, Class A, 1.056% (1 Month | |
| | USD LIBOR + 90 bps), 11/21/35 (144A) | 2,585,035 |
| 3,250,000(a) | | GPMT, Ltd., Series 2018-FL1, Class AS, 1.356% (1 Month | |
| | USD LIBOR + 120 bps), 11/21/35 (144A) | 3,185,081 |
| 8,000,000(a) | | Great Wolf Trust, Series 2019-WOLF, Class D, 2.085% | |
| | (1 Month USD LIBOR + 193 bps), 12/15/36 (144A) | 7,323,121 |
| 9,400,000(b) | | GS Mortgage Securities Corp. Trust, Series 2016-RENT, | |
| | Class E, 4.202%, 2/10/29 (144A) | 9,300,302 |
| 3,500,000(a) | | GS Mortgage Securities Corp. Trust, Series 2017-STAY, | |
| | Class B, 1.502% (1 Month USD LIBOR + | |
| | 135 bps), 7/15/32 (144A) | 3,437,369 |
| 10,900,000(a) | | GS Mortgage Securities Corp. Trust, Series 2018-TWR, | |
| | Class A, 1.052% (1 Month USD LIBOR + | |
| | 90 bps), 7/15/31 (144A) | 10,656,328 |
| 11,000,000(a) | | GS Mortgage Securities Corp. Trust, Series 2019-70P, | |
| | Class D, 1.902% (1 Month USD LIBOR + | |
| | 175 bps), 10/15/36 (144A) | 10,172,317 |
| 7,400,000(a) | | GS Mortgage Securities Corp. Trust, Series 2019-SMP, | |
| | Class D, 2.102% (1 Month USD LIBOR + | |
| | 195 bps), 8/15/32 (144A) | 6,615,403 |
| 10,000,000(a) | | GS Mortgage Securities Corp. Trust, Series 2020-DUNE, | |
| | Class A, 1.252% (1 Month USD LIBOR + | |
| | 110 bps), 12/15/36 (144A) | 9,647,885 |
| 9,000,000(a) | | GS Mortgage Securities Corp. Trust, Series 2020-DUNE, | |
| | Class E, 2.652% (1 Month USD LIBOR + | |
| | 250 bps), 12/15/36 (144A) | 7,739,721 |
| 4,300,000(a) | | GS Mortgage Securities Trust, Series 2018-HART, | |
| | Class A, 1.242% (1 Month USD LIBOR + 109 bps), | |
| | 10/15/31 (144A) | 4,225,254 |
The accompanying notes are an integral part of these financial statements.
58 Pioneer Multi-Asset Ultrashort Income Fund | Semiannual Report | 9/30/20
| | | | |
| Principal | | | |
| Amount | | | |
| USD ($) | | | Value |
| | | COMMERCIAL MORTGAGE-BACKED | |
| | | SECURITIES — (continued) | |
| 9,729,000(a) | | GS Mortgage Securities Trust, Series 2018-HART, | |
| | | Class B, 1.452% (1 Month USD LIBOR + 130 bps), | |
| | | 10/15/31 (144A) | $ 9,188,703 |
| 8,195,929(a) | | HPLY Trust, Series 2019-HIT, Class C, 1.752% (1 Month | |
| | | USD LIBOR + 160 bps), 11/15/36 (144A) | 7,723,188 |
| 4,665,000(a) | | InTown Hotel Portfolio Trust, Series 2018-STAY, | |
| | Class A, 0.852% (1 Month USD LIBOR + 70 bps), | |
| | | 1/15/33 (144A) | 4,557,423 |
| 4,230,000(a) | | InTown Hotel Portfolio Trust, Series 2018-STAY, | |
| | | Class B, 1.202% (1 Month USD LIBOR + 105 bps), | |
| | | 1/15/33 (144A) | 4,114,016 |
| 11,900,000(a) | | JP Morgan Chase Commercial Mortgage Securities | |
| | | Trust, Series 2017-FL11, Class B, 1.252% (1 Month | |
| | | USD LIBOR + 110 bps), 10/15/32 (144A) | 11,308,869 |
| 7,300,000(a) | | JP Morgan Chase Commercial Mortgage Securities | |
| | | Trust, Series 2018-PHH, Class B, 2.66% (1 Month USD | |
| | | LIBOR + 116 bps), 6/15/35 (144A) | 6,507,063 |
| 2,800,000(a) | | JP Morgan Chase Commercial Mortgage Securities | |
| | | Trust, Series 2018-WPT, Class BFL, 1.409% (1 Month | |
| | | USD LIBOR + 125 bps), 7/5/33 (144A) | 2,747,912 |
| 4,000,000(a) | | JP Morgan Chase Commercial Mortgage Securities | |
| | | Trust, Series 2018-WPT, Class CFL, 1.809% (1 Month | |
| | | USD LIBOR + 165 bps), 7/5/33 (144A) | 3,862,536 |
| 3,600,000(a) | | JP Morgan Chase Commercial Mortgage Securities | |
| | | Trust, Series 2019-BKWD, Class C, 1.752% (1 Month | |
| | | USD LIBOR + 160 bps), 9/15/29 (144A) | 3,435,106 |
| 1,650,000(a) | | JP Morgan Chase Commercial Mortgage Securities | |
| | | Trust, Series 2019-BKWD, Class E, 2.752% (1 Month | |
| | | USD LIBOR + 260 bps), 9/15/29 (144A) | 1,461,410 |
| 10,300,000(a) | | JP Morgan Chase Commercial Mortgage Securities | |
| | | Trust, Series 2019-MFP, Class E, 2.312% (1 Month | |
| | | USD LIBOR + 216 bps), 7/15/36 (144A) | 9,667,526 |
| 194,615 | | JPMBB Commercial Mortgage Securities Trust, Series | |
| | | 2014-C19, Class A2, 3.046%, 4/15/47 | 195,277 |
| 8,050,000(a) | | MBRT, Series 2019-MBR, Class B, 1.302% (1 Month USD | |
| | | LIBOR + 115 bps), 11/15/36 (144A) | 7,609,755 |
| 20,000,000(a) | | MF1, Ltd., Series 2019-FL2, Class A, 1.278% (1 Month | |
| | | USD LIBOR + 113 bps), 12/25/34 (144A) | 19,662,660 |
| 7,286,627(a) | | MMFL Re-REMIC Trust, Series 2019-1, Class A, 1.548% | |
| | | (1 Month USD LIBOR + 140 bps), 1/28/24 (144A) | 6,721,696 |
| 1,757,940(b) | | Morgan Stanley Capital I Trust, Series 2007-T25, | |
| | | Class AJ, 5.574%, 11/12/49 | 1,791,005 |
| 8,500,000(a) | | Morgan Stanley Capital I Trust, Series 2017-ASHF, | |
| | | Class B, 1.402% (1 Month USD LIBOR + | |
| | | 125 bps), 11/15/34 (144A) | 7,979,621 |
| 8,250,000(a) | | Morgan Stanley Capital I Trust, Series 2017-CLS, | |
| | | Class C, 1.152% (1 Month USD LIBOR + | |
| | | 100 bps), 11/15/34 (144A) | 8,209,737 |
The accompanying notes are an integral part of these financial statements.
Pioneer Multi-Asset Ultrashort Income Fund | Semiannual Report | 9/30/20 59
Schedule of Investments | 9/30/20
(unaudited) (continued)
| | | | |
| Principal | | | |
| Amount | | | |
| USD ($) | | | Value |
| | COMMERCIAL MORTGAGE-BACKED | |
| | SECURITIES — (continued) | |
| 9,610,247(a) | | Morgan Stanley Capital I Trust, Series 2018-BOP, | |
| | Class B, 1.402% (1 Month USD LIBOR + | |
| | 125 bps), 8/15/33 (144A) | $ 9,140,237 |
| 7,275,000(a) | | Morgan Stanley Capital I Trust, Series 2019-NUGS, | |
| | Class D, 3.3% (1 Month USD LIBOR + | |
| | 180 bps), 12/15/36 (144A) | 6,825,428 |
| 9,709,619(a) | | Motel 6 Trust, Series 2017-MTL6, Class C, 1.552% | |
| | (1 Month USD LIBOR + 140 bps), 8/15/34 (144A) | 9,465,954 |
| 5,220,000(a) | | MTRO Commercial Mortgage Trust, Series 2019-TECH, | |
| | Class C, 1.452% (1 Month USD LIBOR + | |
| | 130 bps), 12/15/33 (144A) | 5,106,889 |
| 3,662,523(a) | | Natixis Commercial Mortgage Securities Trust, Series | |
| | 2018-FL1, Class MCR1, 2.512% (1 Month USD | |
| | LIBOR + 235 bps), 6/15/35 (144A) | 3,447,383 |
| 11,500,000(a) | | Natixis Commercial Mortgage Securities Trust, Series | |
| | 2019-MILE, Class B, 1.952% (1 Month USD LIBOR | |
| | + 180 bps), 7/15/36 (144A) | 11,157,048 |
| 277,157(a) | | NCUA Guaranteed Notes Trust, Series 2011-C1, | |
| | Class 2A, 0.685% (1 Month USD LIBOR + | |
| | 53 bps), 3/9/21 | 276,983 |
| 1,070,130(a) | | RETL, Series 2019-RVP, Class A, 1.302% (1 Month USD | |
| | LIBOR + 115 bps), 3/15/36 (144A) | 1,070,171 |
| 6,908,048(a) | | SLIDE, Series 2018-FUN, Class B, 1.402% (1 Month USD | |
| | LIBOR + 125 bps), 6/15/31 (144A) | 6,456,642 |
| 1,547,912(b) | | Sutherland Commercial Mortgage Loans, Series | |
| | 2017-SBC6, Class A, 3.192%, 5/25/37 (144A) | 1,537,843 |
| 3,447,172(b) | | Sutherland Commercial Mortgage Loans, Series | |
| | 2018-SBC7, Class A, 4.72%, 5/25/39 (144A) | 3,453,225 |
| 4,374,433(a) | | Tharaldson Hotel Portfolio Trust, Series 2018-THL, | |
| | Class C, 1.509% (1 Month USD LIBOR + | |
| | 135 bps), 11/11/34 (144A) | 4,001,303 |
| 10,150,000(a) | | VMC Finance LLC, Series 2018-FL2, Class B, 1.501% | |
| | (1 Month USD LIBOR + 135 bps), 10/15/35 (144A) | 9,554,944 |
| 2,164,933(b) | | WaMu Commercial Mortgage Securities Trust, Series | |
| | 2006-SL1, Class C, 3.153%, 11/23/43 (144A) | 2,166,813 |
| 12,800,000(a) | | Wells Fargo Commercial Mortgage Trust, Series | |
| | 2017-SMP, Class C, 1.352% (1 Month USD LIBOR + | |
| | 120 bps), 12/15/34 (144A) | 11,185,838 |
| 17,500,000(a) | | XCAL Mortgage Trust, Series 2019-1, Class A, 4.4% | |
| | (1 Month USD LIBOR + 225 bps), 11/6/21 (144A) | 17,249,650 |
| 14,200,000(a) | | XCALI Mortgage Trust, Series 2020-1, Class A, 4.05% | |
| | (1 Month USD LIBOR + 240 bps), 1/22/23 (144A) | 13,999,201 |
| 13,500,000(a) | | XCALI Mortgage Trust, Series 2020-2, Class A, 4.05% | |
| | (1 Month USD LIBOR + 200 bps), 2/7/23 (144A) | 13,217,383 |
| | TOTAL COMMERCIAL MORTGAGE-BACKED SECURITIES | |
| | (Cost $563,533,334) | $ 538,842,949 |
The accompanying notes are an integral part of these financial statements.
60 Pioneer Multi-Asset Ultrashort Income Fund | Semiannual Report | 9/30/20
| | | | |
| Principal | | | |
| Amount | | | |
| USD ($) | | | Value |
| | CORPORATE BONDS — 27.2% of Net Assets | |
| | Auto Manufacturers — 2.0% | |
| 7,775,000(a) | | American Honda Finance Corp., 0.467% (3 Month | |
| | USD LIBOR + 21 bps), 2/12/21 | $ 7,779,144 |
| 3,960,000(a) | | American Honda Finance Corp., 0.613% (3 Month | |
| | USD LIBOR + 37 bps), 5/10/23 | 3,954,159 |
| 9,190,000(a) | | American Honda Finance Corp., 0.773% (3 Month | |
| | USD LIBOR + 54 bps), 6/27/22 | 9,228,587 |
| 2,015,000(a) | | Ford Motor Credit Co. LLC, 1.146% (3 Month USD | |
| | LIBOR + 88 bps), 10/12/21 | 1,935,857 |
| 6,750,000(a) | | Nissan Motor Acceptance Corp., 0.77% (3 Month | |
| | USD LIBOR + 52 bps), 3/15/21 (144A) | 6,718,773 |
| 6,020,000 | | Nissan Motor Acceptance Corp., 2.55%, 3/8/21 (144A) | 6,051,251 |
| 8,889,000(a) | | PACCAR Financial Corp., 0.503% (3 Month USD | |
| | LIBOR + 26 bps), 5/10/21 | 8,899,680 |
| 18,160,000(a) | | Toyota Motor Credit Corp., 0.546% (3 Month USD | |
| | LIBOR + 28 bps), 4/13/21 | 18,183,516 |
| 14,185,000(a) | | Volkswagen Group of America Finance LLC, 1.024% | |
| | (3 Month USD LIBOR + 77 bps), 11/13/20 (144A) | 14,194,173 |
| 14,245,000(a) | | Volkswagen Group of America Finance LLC, 1.083% | |
| | (3 Month USD LIBOR + 86 bps), 9/24/21 (144A) | 14,298,785 |
| 5,550,000(a) | | Volkswagen Group of America Finance LLC, 1.197% | |
| | (3 Month USD LIBOR + 94 bps), 11/12/21 (144A) | 5,577,150 |
| | Total Auto Manufacturers | $ 96,821,075 |
| | Automobiles & Components — 0.2% | |
| 11,520,000 | | General Motors Finland, Inc., 4.375%, 9/25/21 | $ 11,884,844 |
| | Total Automobiles & Components | $ 11,884,844 |
| | Banks — 14.0% | |
| 4,360,000(a) | | ABN AMRO Bank NV, 0.821% (3 Month USD LIBOR + | |
| | 57 bps), 8/27/21 (144A) | $ 4,377,809 |
| 5,650,000 | | ABN AMRO Bank NV, 3.4%, 8/27/21 (144A) | 5,804,556 |
| 23,289,000(a) | | Bank of America Corp., 1.038% (3 Month USD LIBOR + | |
| | 79 bps), 3/5/24 | 23,389,734 |
| 11,209,000(a) | | Bank of America Corp., 1.451% (3 Month USD LIBOR + | |
| | 118 bps), 10/21/22 | 11,325,349 |
| 2,082,000(a) | | Bank of America Corp., 1.692% (3 Month USD LIBOR + | |
| | 142 bps), 4/19/21 | 2,097,592 |
| 3,185,000(a) | | Bank of Montreal, 0.754% (SOFRRATE + | |
| | 68 bps), 3/10/23 | 3,199,842 |
| 3,138,000(a) | | Bank of Nova Scotia, 0.712% (3 Month USD LIBOR + | |
| | 44 bps), 4/20/21 | 3,145,391 |
| 3,069,000 | | Bank of Nova Scotia, 2.5%, 1/8/21 | 3,087,666 |
| 2,620,000(a) | | Banque Federative du Credit Mutuel SA, 1.232% | |
| | (3 Month USD LIBOR + 96 bps), 7/20/23 (144A) | 2,652,185 |
| 12,010,000(a) | | Banque Federative du Credit Mutuel SA, 1.002% | |
| | (3 Month USD LIBOR + 73 bps), 7/20/22 (144A) | 12,106,975 |
The accompanying notes are an integral part of these financial statements.
Pioneer Multi-Asset Ultrashort Income Fund | Semiannual Report | 9/30/20 61
Schedule of Investments | 9/30/20
(unaudited) (continued)
| | | | |
| Principal | | | |
| Amount | | | |
| USD ($) | | | Value |
| | Banks — (continued) | |
| 12,008,000(a) | | Barclays Plc, 1.71% (3 Month USD LIBOR + | |
| | 143 bps), 2/15/23 | $ 12,067,760 |
| 6,050,000(a) | | Barclays Plc, 1.898% (3 Month USD LIBOR + | |
| | 163 bps), 1/10/23 | 6,093,526 |
| 18,956,000(a) | | BPCE SA, 1.476% (3 Month USD LIBOR + 122 bps), | |
| | 5/22/22 (144A) | 19,164,654 |
| 9,550,000(a) | | Capital One NA, 1.063% (3 Month USD LIBOR + | |
| | 82 bps), 8/8/22 | 9,611,954 |
| 5,890,000 | | Capital One NA, 2.95%, 7/23/21 | 6,004,869 |
| 9,095,000(a) | | Citibank NA, 0.607% (3 Month USD LIBOR + | |
| | 35 bps), 2/12/21 | 9,103,304 |
| 16,729,000(a) | | Citigroup, Inc., 1.205% (3 Month USD LIBOR + | |
| | 96 bps), 4/25/22 | 16,891,940 |
| 11,141,000(a) | | Citigroup, Inc., 1.318% (3 Month USD LIBOR + | |
| | 107 bps), 12/8/21 | 11,243,098 |
| 1,620,000(a) | | Citigroup, Inc., 1.441% (3 Month USD LIBOR + | |
| | 119 bps), 8/2/21 | 1,634,036 |
| 12,180,000(a) | | Citigroup, Inc., 1.6% (3 Month USD LIBOR + | |
| | 138 bps), 3/30/21 | 12,255,954 |
| 12,733,000 | | Citigroup, Inc., 2.7%, 3/30/21 | 12,883,504 |
| 2,375,000(a) | | Cooperatieve Rabobank UA, 0.675% (3 Month USD | |
| | LIBOR + 43 bps), 4/26/21 | 2,380,271 |
| 2,350,000(a) | | Cooperatieve Rabobank UA, 0.753% (3 Month USD | |
| | LIBOR + 48 bps), 1/10/23 | 2,362,366 |
| 5,700,000(a) | | Cooperatieve Rabobank UA, 1.103% (3 Month USD | |
| | LIBOR + 83 bps), 1/10/22 | 5,747,361 |
| 9,410,000(a) | | Credit Suisse Group AG, 1.449% (3 Month USD LIBOR + | |
| | 120 bps), 12/14/23 (144A) | 9,492,726 |
| 14,947,000(a) | | Credit Suisse Group Funding Guernsey, Ltd., 2.562% | |
| | (3 Month USD LIBOR + 229 bps), 4/16/21 | 15,120,176 |
| 16,950,000 | | Credit Suisse Group Funding Guernsey, Ltd., | |
| | 3.125%, 12/10/20 | 17,038,140 |
| 4,002,000 | | Danske Bank, Inc., 2.7%, 3/2/22 (144A) | 4,122,158 |
| 1,845,000 | | Discover Bank, 3.2%, 8/9/21 | 1,882,125 |
| 10,300,000(a) | | DNB Bank ASA, 0.861% (3 Month USD LIBOR + | |
| | 62 bps), 12/2/22 (144A) | 10,376,898 |
| 10,265,000(a) | | Federation des Caisses Desjardins du Quebec, 0.598% | |
| | (3 Month USD LIBOR + 33 bps), 10/30/20 (144A) | 10,268,022 |
| 5,000,000(a) | | Goldman Sachs Group, Inc., 1.006% (3 Month USD | |
| | LIBOR + 75 bps), 2/23/23 | 5,016,191 |
| 4,425,000(a) | | Goldman Sachs Group, Inc., 1.355% (3 Month USD | |
| | LIBOR + 111 bps), 4/26/22 | 4,443,304 |
| 1,000,000(a) | | Goldman Sachs Group, Inc., 1.45% (3 Month USD | |
| | LIBOR + 117 bps), 11/15/21 | 1,001,234 |
| 11,230,000(a) | | Goldman Sachs Group, Inc., 1.605% (3 Month USD | |
| | LIBOR + 136 bps), 4/23/21 | 11,294,751 |
The accompanying notes are an integral part of these financial statements.
62 Pioneer Multi-Asset Ultrashort Income Fund | Semiannual Report | 9/30/20
| | | | |
| Principal | | | |
| Amount | | | |
| USD ($) | | | Value |
| | Banks — (continued) | |
| 5,880,000(a) | | Goldman Sachs Group, Inc., 2.02% (3 Month USD | |
| | LIBOR + 177 bps), 2/25/21 | $ 5,920,833 |
| 2,725,000(a) | | JPMorgan Chase & Co., 0.843% (3 Month USD LIBOR + | |
| | 61 bps), 6/18/22 | 2,733,241 |
| 11,800,000(a) | | JPMorgan Chase & Co., 0.986% (3 Month USD LIBOR + | |
| | 73 bps), 4/23/24 | 11,882,004 |
| 18,025,000(a) | | JPMorgan Chase & Co., 1.348% (3 Month USD LIBOR + | |
| | 110 bps), 6/7/21 | 18,140,160 |
| 2,905,000(a) | | KeyBank NA, 0.911% (3 Month USD LIBOR + | |
| | 66 bps), 2/1/22 | 2,923,001 |
| 8,000,000(a) | | Macquarie Bank, Ltd., 0.699% (3 Month USD LIBOR + | |
| | 45 bps), 8/6/21 (144A) | 8,025,266 |
| 2,968,000(a) | | Mitsubishi UFJ Financial Group, Inc., 0.895% (3 Month | |
| | USD LIBOR + 65 bps), 7/26/21 | 2,979,471 |
| 3,000,000(a) | | Mitsubishi UFJ Financial Group, Inc., 0.948% (3 Month | |
| | USD LIBOR + 70 bps), 3/7/22 | 3,019,828 |
| 25,302,000(a) | | Mitsubishi UFJ Financial Group, Inc., 1.035% (3 Month | |
| | USD LIBOR + 79 bps), 7/25/22 | 25,494,457 |
| 6,295,000(a) | | Mizuho Financial Group, Inc., 1.099% (3 Month USD | |
| | LIBOR + 85 bps), 9/13/23 | 6,327,545 |
| 7,505,000(a) | | Mizuho Financial Group, Inc., 1.13% (3 Month USD | |
| | LIBOR + 88 bps), 9/11/22 | 7,576,089 |
| 14,679,000(a) | | Mizuho Financial Group, Inc., 1.196% (3 Month USD | |
| | LIBOR + 94 bps), 2/28/22 | 14,825,069 |
| 12,580,000(a) | | Morgan Stanley, 1.188% (3 Month USD LIBOR + | |
| | 93 bps), 7/22/22 | 12,638,294 |
| 12,403,000(a) | | Morgan Stanley, 1.452% (3 Month USD LIBOR + | |
| | 118 bps), 1/20/22 | 12,439,122 |
| 12,114,000(a) | | PNC Bank NA, 0.708% (3 Month USD LIBOR + | |
| | 45 bps), 7/22/22 | 12,147,315 |
| 4,499,000(a) | | PNC Bank NA, 0.745% (3 Month USD LIBOR + | |
| | 50 bps), 7/27/22 | 4,522,983 |
| 3,175,000 | | PNC Bank NA, 2.45%, 11/5/20 | 3,175,735 |
| 3,878,000 | | PNC Bank NA, 2.5%, 1/22/21 | 3,897,315 |
| 9,000,000(a) | | Royal Bank of Canada, 0.645% (3 Month USD LIBOR + | |
| | 40 bps), 1/25/21 | 9,011,224 |
| 445,000(a) | | Royal Bank of Canada, 0.658% (3 Month USD LIBOR + | |
| | 39 bps), 4/30/21 | 445,948 |
| 12,310,000(a) | | Royal Bank of Canada, 0.74% (3 Month USD LIBOR + | |
| | 47 bps), 4/29/22 | 12,373,470 |
| 5,502,000 | | Royal Bank of Canada, 2.15%, 10/26/20 | 5,509,373 |
| 681,000 | | Royal Bank of Canada, 2.35%, 10/30/20 | 682,126 |
| 4,800,000 | | Royal Bank of Canada, 3.35%, 10/22/21 (144A) | 4,950,048 |
| 15,252,000(a) | | Skandinaviska Enskilda Banken AB, 0.894% (3 Month | |
| | USD LIBOR + 65 bps), 12/12/22 (144A) | 15,375,191 |
| 7,040,000 | | Skandinaviska Enskilda Banken AB, 2.625%, | |
| | 11/17/20 (144A) | 7,060,909 |
The accompanying notes are an integral part of these financial statements.
Pioneer Multi-Asset Ultrashort Income Fund | Semiannual Report | 9/30/20 63
Schedule of Investments | 9/30/20
(unaudited) (continued)
| | | | |
| Principal | | | |
| Amount | | | |
| USD ($) | | | Value |
| | | Banks — (continued) | |
| 13,625,000 | | Skandinaviska Enskilda Banken AB, 3.25%, | |
| | | 5/17/21 (144A) | $ 13,867,334 |
| 4,232,000(a) | | Sumitomo Mitsui Financial Group, Inc., 1.012% | |
| | | (3 Month USD LIBOR + 74 bps), 10/18/22 | 4,260,193 |
| 21,084,000(a) | | Sumitomo Mitsui Financial Group, Inc., 1.046% | |
| | | (3 Month USD LIBOR + 78 bps), 7/12/22 | 21,241,391 |
| 5,265,000(a) | | Toronto-Dominion Bank, 0.776% (3 Month USD | |
| | | LIBOR + 53 bps), 12/1/22 | 5,316,068 |
| 1,000,000(a) | | Toronto-Dominion Bank, 0.912% (3 Month USD | |
| | | LIBOR + 64 bps), 7/19/23 | 1,011,271 |
| 1,035,000(a) | | Toronto-Dominion Bank, 1.276% (3 Month USD | |
| | | LIBOR + 100 bps), 4/7/21 | 1,040,130 |
| 25,014,000(a) | | Truist Bank, 0.87% (3 Month USD LIBOR + | |
| | | 59 bps), 5/17/22 | 25,177,029 |
| 4,870,000(a) | | UBS AG, 0.726% (3 Month USD LIBOR + | |
| | | 48 bps), 12/1/20 (144A) | 4,871,665 |
| 10,670,000(a) | | UBS Group AG, 1.781% (3 Month USD LIBOR + | |
| | | 153 bps), 2/1/22 (144A) | 10,854,139 |
| 2,450,000 | | UBS Group AG, 3.0%, 4/15/21 (144A) | 2,484,476 |
| 2,025,000(a) | | US Bancorp, 0.904% (3 Month USD LIBOR + | |
| | | 64 bps), 1/24/22 | 2,038,780 |
| 1,315,000(a) | | US Bank NA, 0.565% (3 Month USD LIBOR + | |
| | | 32 bps), 4/26/21 | 1,316,584 |
| 12,490,000(a) | | US Bank NA, 0.696% (3 Month USD LIBOR + | |
| | | 44 bps), 5/23/22 | 12,550,144 |
| 15,234,000(a) | | Wells Fargo & Co., 1.183% (3 Month USD LIBOR + | |
| | | 93 bps), 2/11/22 | 15,271,459 |
| 14,665,000(a) | | Wells Fargo & Co., 1.27% (3 Month USD LIBOR + | |
| | | 103 bps), 7/26/21 | 14,772,055 |
| 3,350,000(a) | | Wells Fargo & Co., 1.591% (3 Month USD LIBOR + | |
| | | 134 bps), 3/4/21 | 3,367,394 |
| 9,451,000 | | Wells Fargo & Co., 2.5%, 3/4/21 | 9,538,269 |
| 3,776,000 | | Wells Fargo & Co., 3.0%, 1/22/21 | 3,807,975 |
| 6,430,000 | | Wells Fargo & Co., 4.6%, 4/1/21 | 6,566,556 |
| 6,430,000(a) | | Wells Fargo Bank NA, 0.871% (3 Month USD LIBOR + | |
| | | 62 bps), 5/27/22 | 6,448,872 |
| | | Total Banks | $ 668,565,222 |
| | | Beverages — 0.1% | |
| 2,753,000 | | Constellation Brands, Inc., 3.75%, 5/1/21 | $ 2,802,115 |
| 1,907,000 | | Pernod Ricard SA, 5.75%, 4/7/21 (144A) | 1,958,696 |
| | | Total Beverages | $ 4,760,811 |
| | | Chemicals — 0.5% | |
| 8,788,000(a) | | Albemarle Corp., 1.33% (3 Month USD LIBOR + | |
| | | 105 bps), 11/15/22 | $ 8,756,265 |
The accompanying notes are an integral part of these financial statements.
64 Pioneer Multi-Asset Ultrashort Income Fund | Semiannual Report | 9/30/20
| | | | |
| Principal | | | |
| Amount | | | |
| USD ($) | | | Value |
| | Chemicals — (continued) | |
| 15,830,000(a) | | DuPont de Nemours, Inc., 0.99% (3 Month USD | |
| | LIBOR + 71 bps), 11/15/20 | $ 15,840,883 |
| | Total Chemicals | $ 24,597,148 |
| | Diversified Financial Services — 0.9% | |
| 12,490,000(a) | | American Express Co., 0.861% (3 Month USD LIBOR + | |
| | 61 bps), 8/1/22 | $ 12,568,598 |
| 15,850,000(a) | | Capital One Financial Corp., 0.988% (3 Month USD | |
| | LIBOR + 72 bps), 1/30/23 | 15,857,598 |
| 13,108,000(a) | | Charles Schwab Corp., 0.567% (3 Month USD LIBOR + | |
| | 32 bps), 5/21/21 | 13,127,253 |
| | Total Diversified Financial Services | $ 41,553,449 |
| | Electric — 0.6% | |
| 9,175,000(a) | | Dominion Energy, Inc., 0.774% (3 Month USD LIBOR + | |
| | 53 bps), 9/15/23 | $ 9,189,689 |
| 2,000,000(c) | | Dominion Energy, Inc., 2.715%, 8/15/21 | 2,036,625 |
| 2,803,000(a) | | Duke Energy Corp., 0.765% (3 Month USD LIBOR + | |
| | 50 bps), 5/14/21 (144A) | 2,809,666 |
| 12,000,000(a) | | Florida Power & Light Co., 0.641% (3 Month USD | |
| | LIBOR + 38 bps), 7/28/23 | 12,008,748 |
| | Total Electric | $ 26,044,728 |
| | Electronics — 0.1% | |
| 6,425,000(a) | | Honeywell International, Inc., 0.498% (3 Month USD | |
| | LIBOR + 23 bps), 8/19/22 | $ 6,430,124 |
| | Total Electronics | $ 6,430,124 |
| | Gas — 0.3% | |
| 6,225,000(a) | | Dominion Energy Gas Holdings LLC, 0.85% (3 Month | |
| | USD LIBOR + 60 bps), 6/15/21 | $ 6,245,455 |
| 9,080,000 | | Dominion Energy Gas Holdings LLC, 2.8%, 11/15/20 | 9,089,948 |
| | Total Gas | $ 15,335,403 |
| | Healthcare-Services — 0.4% | |
| 5,945,000(a) | | UnitedHealth Group, Inc., 0.345% (3 Month USD | |
| | LIBOR + 7 bps), 10/15/20 | $ 5,945,213 |
| 13,650,000 | | UnitedHealth Group, Inc., 1.95%, 10/15/20 | 13,658,576 |
| | Total Healthcare-Services | $ 19,603,789 |
| | Insurance — 0.9% | |
| 2,705,000(a) | | Allstate Corp., 0.648% (3 Month USD LIBOR + | |
| | 43 bps), 3/29/21 | $ 2,710,090 |
| 3,129,000(a) | | Allstate Corp., 0.848% (3 Month USD LIBOR + | |
| | 63 bps), 3/29/23 | 3,153,429 |
| 2(a) | | Ambac LSNI LLC, 6.0% (3 Month USD LIBOR + | |
| | 500 bps), 2/12/23 (144A) | 3 |
| 10,500,000 | | American International Group, Inc., 6.4%, 12/15/20 | 10,627,267 |
| 3,000,000 | | Liberty Mutual Group, Inc., 5.0%, 6/1/21 (144A) | 3,091,413 |
The accompanying notes are an integral part of these financial statements.
Pioneer Multi-Asset Ultrashort Income Fund | Semiannual Report | 9/30/20 65
Schedule of Investments | 9/30/20
(unaudited) (continued)
| | | | |
| Principal | | | |
| Amount | | | |
| USD ($) | | | Value |
| | | Insurance — (continued) | |
| 4,380,000(a) | | Metropolitan Life Global Funding I, 0.66% (SOFRRATE + | |
| | | 57 bps), 1/13/23 (144A) | $ 4,395,111 |
| 6,190,000 | | Metropolitan Life Global Funding I, 2.4%, 1/8/21 (144A) | 6,225,481 |
| 4,531,000(a) | | New York Life Global Funding, 0.569% (3 Month USD | |
| | | LIBOR + 32 bps), 8/6/21 (144A) | 4,542,431 |
| 5,733,000 | | New York Life Global Funding, 2.95%, 1/28/21 (144A) | 5,782,707 |
| | | Total Insurance | $ 40,527,932 |
| | Machinery – Construction & Mining — 0.5% | |
| 2,600,000(a) | | Caterpillar Financial Services Corp., 0.528% (3 Month | |
| | | USD LIBOR + 28 bps), 9/7/21 | $ 2,604,964 |
| 9,120,000(a) | | Caterpillar Financial Services Corp., 0.67% (3 Month | |
| | | USD LIBOR + 39 bps), 5/17/21 | 9,137,143 |
| 9,091,000(a) | | Caterpillar Financial Services Corp., 0.989% (3 Month | |
| | | USD LIBOR + 74 bps), 5/13/22 | 9,183,018 |
| | | Total Machinery – Construction & Mining | $ 20,925,125 |
| | | Machinery-Diversified — 0.3% | |
| 5,997,000(a) | | John Deere Capital Corp., 0.51% (3 Month USD | |
| | | LIBOR + 26 bps), 9/10/21 | $ 6,006,519 |
| 5,512,000(a) | | John Deere Capital Corp., 0.628% (3 Month USD | |
| | | LIBOR + 38 bps), 3/7/22 | 5,526,988 |
| 4,500,000(a) | | John Deere Capital Corp., 0.648% (3 Month USD | |
| | | LIBOR + 40 bps), 6/7/21 | 4,509,202 |
| | | Total Machinery-Diversified | $ 16,042,709 |
| | | Media — 0.8% | |
| 5,092,000(a) | | Comcast Corp., 0.665% (3 Month USD LIBOR + | |
| | | 44 bps), 10/1/21 | $ 5,110,469 |
| 7,774,000(a) | | NBCUniversal Enterprise, Inc., 0.625% (3 Month | |
| | | USD LIBOR + 40 bps), 4/1/21 (144A) | 7,787,453 |
| 10,940,000(a) | | Walt Disney Co., 0.496% (3 Month USD LIBOR + | |
| | | 25 bps), 9/1/21 | 10,956,300 |
| 9,910,000(a) | | Walt Disney Co., 0.636% (3 Month USD LIBOR + | |
| | | 39 bps), 9/1/22 | 9,946,809 |
| 3,909,000 | | Walt Disney Co., 4.5%, 2/15/21 | 3,970,237 |
| | | Total Media | $ 37,771,268 |
| | | Oil & Gas — 1.4% | |
| 2,775,000(a) | | BP Capital Markets Plc, 0.877% (3 Month USD LIBOR + | |
| | | 65 bps), 9/19/22 | $ 2,782,718 |
| 5,766,000(a) | | BP Capital Markets Plc, 1.107% (3 Month USD LIBOR + | |
| | | 87 bps), 9/16/21 | 5,800,827 |
| 7,045,000 | | Canadian Natural Resources, Ltd., 3.45%, 11/15/21 | 7,205,258 |
| 2,295,000(a) | | Chevron Corp., 0.781% (3 Month USD LIBOR + | |
| | | 53 bps), 3/3/22 | 2,308,432 |
| 14,000,000(a) | | Chevron Corp., 1.153% (3 Month USD LIBOR + | |
| | | 90 bps), 5/11/23 | 14,259,248 |
The accompanying notes are an integral part of these financial statements.
66 Pioneer Multi-Asset Ultrashort Income Fund | Semiannual Report | 9/30/20
| | | | |
| Principal | | | |
| Amount | | | |
| USD ($) | | | Value |
| | Oil & Gas — (continued) | |
| 14,505,000(a) | | Exxon Mobil Corp., 0.61% (3 Month USD LIBOR + | |
| | 33 bps), 8/16/22 | $ 14,572,912 |
| 8,710,000(a) | | Phillips 66, 0.834% (3 Month USD LIBOR + | |
| | 60 bps), 2/26/21 | 8,710,935 |
| 7,200,000(a) | | Valero Energy Corp., 1.403% (3 Month USD LIBOR + | |
| | 115 bps), 9/15/23 | 7,175,304 |
| | Total Oil & Gas | $ 62,815,634 |
| | Pharmaceuticals — 1.8% | |
| 12,080,000(a) | | AbbVie, Inc., 0.597% (3 Month USD LIBOR + | |
| | 35 bps), 5/21/21 (144A) | $ 12,091,971 |
| 23,942,000(a) | | AbbVie, Inc., 0.897% (3 Month USD LIBOR + | |
| | 65 bps), 11/21/22 (144A) | 24,051,846 |
| 4,670,000(a) | | Bayer US Finance II LLC, 0.855% (3 Month USD LIBOR + | |
| | 63 bps), 6/25/21 (144A) | 4,679,296 |
| 12,890,000(a) | | Becton Dickinson & Co., 1.28% (3 Month USD LIBOR + | |
| | 103 bps), 6/6/22 | 12,979,207 |
| 4,676,000(a) | | Cardinal Health, Inc., 1.02% (3 Month USD LIBOR + | |
| | 77 bps), 6/15/22 | 4,704,288 |
| 6,730,000(a) | | Cigna Corp., 0.896% (3 Month USD LIBOR + | |
| | 65 bps), 9/17/21 | 6,731,324 |
| 15,600,000(a) | | Zoetis, Inc., 0.693% (3 Month USD LIBOR + | |
| | 44 bps), 8/20/21 | 15,629,628 |
| | Total Pharmaceuticals | $ 80,867,560 |
| | Pipelines — 0.7% | |
| 9,000,000 | | Enterprise Products Operating LLC, 2.8%, 2/15/21 | $ 9,081,003 |
| 3,750,000 | | Enterprise Products Operating LLC, 2.85%, 4/15/21 | 3,791,785 |
| 3,453,000 | | Kinder Morgan, Inc., 5.0%, 2/15/21 (144A) | 3,496,340 |
| 15,605,000(a) | | MPLX LP, 1.342% (3 Month USD LIBOR + | |
| | 110 bps), 9/9/22 | 15,605,630 |
| 1,380,000 | | Sunoco Logistics Partners Operations LP, 4.4%, 4/1/21 | 1,400,252 |
| | Total Pipelines | $ 33,375,010 |
| | REITs — 0.2% | |
| 7,910,000 | | Essex Portfolio LP, 5.2%, 3/15/21 | $ 7,979,208 |
| | Total REITs | $ 7,979,208 |
| | Semiconductors — 0.6% | |
| 23,276,000 | | Broadcom Corp./Broadcom Cayman Finance, Ltd., | |
| | 2.2%, 1/15/21 | $ 23,365,305 |
| 4,000,000(a) | | Intel Corp., 0.603% (3 Month USD LIBOR + | |
| | 35 bps), 5/11/22 | 4,018,467 |
| | Total Semiconductors | $ 27,383,772 |
The accompanying notes are an integral part of these financial statements.
Pioneer Multi-Asset Ultrashort Income Fund | Semiannual Report | 9/30/20 67
Schedule of Investments | 9/30/20
(unaudited) (continued)
| | | | |
| Principal | | | |
| Amount | | | |
| USD ($) | | | Value |
| | | Telecommunications — 0.4% | |
| 17,944,000(a) | | AT&T, Inc., 1.225% (3 Month USD LIBOR + | |
| | | 95 bps), 7/15/21 | $ 18,064,054 |
| | | Total Telecommunications | $ 18,064,054 |
| | | Transportation — 0.2% | |
| 10,000,000(a) | | United Parcel Service, Inc., 0.66% (3 Month USD | |
| | | LIBOR + 38 bps), 5/16/22 | $ 10,032,210 |
| | | Total Transportation | $ 10,032,210 |
| | | Trucking & Leasing — 0.3% | |
| 1,400,000(a) | | Aviation Capital Group LLC, 0.938% (3 Month USD | |
| | | LIBOR + 67 bps), 7/30/21 (144A) | $ 1,362,826 |
| 5,010,000(a) | | GATX Corp., 0.969% (3 Month USD LIBOR + | |
| | | 72 bps), 11/5/21 | 5,003,505 |
| 1,000,000 | | Penske Truck Leasing Co. LP/PTL Finance Corp., | |
| | | 3.3%, 4/1/21 (144A) | 1,011,748 |
| 6,350,000 | | Penske Truck Leasing Co. LP/PTL Finance Corp., | |
| | | 3.375%, 2/1/22 | 6,556,852 |
| 2,870,000 | | Penske Truck Leasing Co. LP/PTL Finance Corp., | |
| | | 3.65%, 7/29/21 (144A) | 2,937,053 |
| | | Total Trucking & Leasing | $ 16,871,984 |
| | | TOTAL CORPORATE BONDS | |
| | | (Cost $1,281,256,151) | $1,288,253,059 |
| | FOREIGN GOVERNMENT BOND — 0.5% | |
| | | of Net Assets | |
| | | United States — 0.5% | |
| 25,000,000(a) | | Federal National Mortgage Association, 0.29% | |
| | | (SOFRRATE + 22 bps), 3/16/22 | $ 25,055,751 |
| | | Total United States | $ 25,055,751 |
| | | TOTAL FOREIGN GOVERNMENT BOND | |
| | | (Cost $24,977,539) | $ 25,055,751 |
| | INSURANCE-LINKED SECURITIES — 2.3% | |
| | | of Net Assets# | |
| | | Event Linked Bonds — 1.5% | |
| | | Earthquakes – California — 0.1% | |
| 600,000(a) | | Ursa Re, 4.237% (3 Month U.S. Treasury Bill + | |
| | | 414 bps), 12/10/20 (144A) | $ 599,400 |
| 1,000,000(a) | | Ursa Re, 5.327% (3 Month U.S. Treasury Bill + | |
| | | 523 bps), 9/24/21 (144A) | 998,700 |
| 750,000(a) | | Ursa Re, 5.847% (3 Month U.S. Treasury Bill + | |
| | | 575 bps), 12/10/22 (144A) | 749,550 |
| | | | $ 2,347,650 |
| | | Earthquakes – Chile — 0.1% | |
| 1,800,000(a) | | International Bank for Reconstruction & Development, | |
| | | 2.58% (3 Month USD LIBOR + 250 bps), 2/15/21 (144A) | $ 1,792,800 |
The accompanying notes are an integral part of these financial statements.
68 Pioneer Multi-Asset Ultrashort Income Fund | Semiannual Report | 9/30/20
| | | | |
| Principal | | | |
| Amount | | | |
| USD ($) | | | Value |
| | Earthquakes – Colombia — 0.0%† | |
| 1,300,000(a) | | International Bank for Reconstruction & Development, | |
| | 3.08% (3 Month USD LIBOR + 300 bps), | |
| | 2/15/21 (144A) | $ 1,294,540 |
| | Earthquakes – Japan — 0.0%† | |
| 750,000(a) | | Kizuna Re II, 1.972% (3 Month U.S. Treasury Bill + | |
| | 188 bps), 4/11/23 (144A) | $ 747,900 |
| 250,000(a) | | Kizuna Re II, 2.597% (3 Month U.S. Treasury Bill + | |
| | 250 bps), 4/11/23 (144A) | 249,250 |
| 700,000(a) | | Nakama Re, 2.2% (6 Month USD LIBOR + 220 bps), | |
| | 10/13/21 (144A) | 697,970 |
| | | $ 1,695,120 |
| | Earthquakes – Mexico — 0.0%† | |
| 500,000(a) | | International Bank for Reconstruction & Development, | |
| | 3.669% (3 Month USD LIBOR + 350 bps), | |
| | 3/13/24 (144A) | $ 499,450 |
| | Earthquakes – Peru — 0.0%† | |
| 700,000(a) | | International Bank for Reconstruction & Development, | |
| | 6.08% (3 Month USD LIBOR + 600 bps), | |
| | 2/15/21 (144A) | $ 702,380 |
| | Health – U.S. — 0.1% | |
| 250,000(a) | | Vitality Re VIII, 1.847% (3 Month U.S. Treasury Bill + | |
| | 175 bps), 1/8/21 (144A) | $ 248,500 |
| 1,000,000(a) | | Vitality Re VIII, 2.097% (3 Month U.S. Treasury Bill + | |
| | 200 bps), 1/8/21 (144A) | 991,500 |
| 3,500,000(a) | | Vitality Re X, 1.847% (3 Month U.S. Treasury Bill + | |
| | 175 bps), 1/10/23 (144A) | 3,480,750 |
| 1,750,000(a) | | Vitality Re X, 2.097% (3 Month U.S. Treasury Bill + | |
| | 200 bps), 1/10/23 (144A) | 1,736,875 |
| | | $ 6,457,625 |
| | Inland Flood – U.S. — 0.0%† | |
| 500,000(a) | | FloodSmart Re, 11.927% (1 Month U.S. Treasury Bill + | |
| | 1,183 bps), 3/7/22 (144A) | $ 496,500 |
| | Multiperil – Florida — 0.0%† | |
| 250,000(a) | | Sanders RE II, 5.5% (3 Month U.S. Treasury Bill + | |
| | 550 bps), 6/7/23 (144A) | $ 254,900 |
| | Multiperil – Japan — 0.0%† | |
| 250,000(a) | | Akibare Re, 2.115% (3 Month USD LIBOR + | |
| | 190 bps), 4/7/22 (144A) | $ 247,275 |
| 500,000(a) | | Akibare Re, 2.125% (3 Month USD LIBOR + | |
| | 190 bps), 4/7/22 (144A) | 496,400 |
| | | $ 743,675 |
| | Multiperil – U.S. — 0.5% | |
| 1,500,000(a) | | Bonanza RE, 4.844% (3 Month U.S. Treasury Bill + | |
| | 475 bps), 2/20/24 (144A) | $ 1,500,750 |
The accompanying notes are an integral part of these financial statements.
Pioneer Multi-Asset Ultrashort Income Fund | Semiannual Report | 9/30/20 69
Schedule of Investments | 9/30/20
(unaudited) (continued)
| | | | |
| Principal | | | |
| Amount | | | |
| USD ($) | | | Value |
| | Multiperil – U.S. — (continued) | |
| 250,000(a) | | Bowline Re, Series Series 2018-1, 4.854% (3 Month U.S. | |
| | Treasury Bill + 476 bps), 5/23/22 (144A) | $ 249,575 |
| 625,000(a) | | Caelus Re V, 0.597% (1 Month U.S. Treasury Bill + | |
| | 50 bps), 6/5/24 (144A) | 568,750 |
| 500,000(a) | | Caelus Re V, 3.287% (3 Month U.S. Treasury Bill + | |
| | 319 bps), 6/7/21 (144A) | 499,000 |
| 750,000(a) | | Caelus Re V, 4.127% (3 Month U.S. Treasury Bill + | |
| | 403 bps), 6/7/21 (144A) | 741,675 |
| 750,000(a) | | Caelus Re VI, 5.597% (3 Month U.S. Treasury Bill + | |
| | 550 bps), 6/7/24 (144A) | 749,250 |
| 500,000(a) | | Fortius Re II, 3.42% (6 Month USD LIBOR + | |
| | 342 bps), 7/7/21 (144A) | 500,950 |
| 250,000(a) | | Kilimanjaro Re, 5.044% (3 Month USD LIBOR + | |
| | 494 bps), 5/6/22 (144A) | 251,375 |
| 350,000(a) | | Kilimanjaro II Re, 6.3% (6 Month USD LIBOR + | |
| | 630 bps), 4/20/21 (144A) | 350,350 |
| 1,700,000(a) | | Kilimanjaro II Re, 7.91% (6 Month USD LIBOR + | |
| | 791 bps), 4/21/22 (144A) | 1,698,300 |
| 2,350,000(a) | | Residential Reinsurance 2016, 4.177% (3 Month U.S. | |
| | Treasury Bill + 408 bps), 12/6/20 (144A) | 2,350,470 |
| 1,250,000(a) | | Residential Reinsurance 2016, 5.697% (3 Month U.S. | |
| | Treasury Bill + 560 bps), 12/6/20 (144A) | 1,252,375 |
| 2,100,000(a) | | Residential Reinsurance 2017, 3.367% (3 Month U.S. | |
| | Treasury Bill + 327 bps), 6/6/21 (144A) | 2,104,410 |
| 2,900,000(a) | | Residential Reinsurance 2017, 6.027% (3 Month U.S. | |
| | Treasury Bill + 593 bps), 12/6/21 (144A) | 2,869,550 |
| 1,250,000(a) | | Residential Reinsurance 2018, 3.457% (3 Month U.S. | |
| | Treasury Bill + 336 bps), 6/6/22 (144A) | 1,237,625 |
| 500,000(a) | | Residential Reinsurance 2019, 4.747% (3 Month U.S. | |
| | Treasury Bill + 465 bps), 6/6/23 (144A) | 494,250 |
| 500,000(a) | | Residential Reinsurance 2020, 5.597% (3 Month U.S. | |
| | Treasury Bill + 550 bps), 6/6/24 (144A) | 503,900 |
| 250,000(a) | | Sanders Re, 2.975% (6 Month USD LIBOR + 293 bps), | |
| | 12/6/21 (144A) | 246,600 |
| 1,000,000(a) | | Spectrum Capital, Ltd., 5.965% (6 Month USD LIBOR + | |
| | 575 bps), 6/8/21 (144A) | 1,002,400 |
| 3,350,000(a) | | Tailwind Re, 7.457% (3 Month U.S. Treasury Bill + | |
| | 736 bps), 1/8/22 (144A) | 3,396,900 |
| | | $ 22,568,455 |
| | Multiperil – U.S. & Canada — 0.1% | |
| 2,500,000(a) | | Hypatia Ltd., 6.847% (3 Month U.S. Treasury Bill + | |
| | 675 bps), 6/7/23 (144A) | $ 2,610,750 |
| 1,000,000(a) | | Hypatia Ltd., 9.847% (3 Month U.S. Treasury Bill + | |
| | 975 bps), 6/7/23 (144A) | 1,046,500 |
| | | $ 3,657,250 |
The accompanying notes are an integral part of these financial statements.
70 Pioneer Multi-Asset Ultrashort Income Fund | Semiannual Report | 9/30/20
| | | | |
| Principal | | | |
| Amount | | | |
| USD ($) | | | Value |
| | | Multiperil – U.S. Regional — 0.0%† | |
| 700,000(a) | | First Coast Re II Pte, 5.66% (3 Month U.S. Treasury Bill + | |
| | | 566 bps), 6/7/23 (144A) | $ 701,330 |
| 1,250,000(a) | | Long Point Re III, 2.847% (3 Month U.S. Treasury Bill + | |
| | | 275 bps), 6/1/22 (144A) | 1,250,125 |
| 400,000(a) | | Matterhorn Re, 5.094% (3 Month U.S. Treasury Bill + | |
| | | 500 bps), 1/8/24 (144A) | 401,080 |
| | | | $ 2,352,535 |
| | | Multiperil – Worldwide — 0.1% | |
| 1,250,000(a) | | Galilei Re, 5.174% (6 Month USD LIBOR + 513 bps), | |
| | | 1/8/21 (144A) | $ 1,250,000 |
| 1,150,000(a) | | Galilei Re, 5.724% (6 Month USD LIBOR + 568 bps), | |
| | | 1/8/21 (144A) | 1,150,000 |
| 2,300,000(a) | | Galilei Re, 5.924% (6 Month USD LIBOR + 588 bps), | |
| | | 1/8/21 (144A) | 2,301,150 |
| 500,000(a) | | Kendall Re, 5.339% (3 Month USD LIBOR + 525 bps), | |
| | | 5/6/21 (144A) | 500,500 |
| | | | $ 5,201,650 |
| | | Pandemic – U.S. — 0.1% | |
| 3,000,000(a) | | Vitality Re X, 1.597% (3 Month U.S. Treasury Bill + | |
| | | 150 bps), 1/9/24 (144A) | $ 2,980,500 |
| 1,250,000(a) | | Vitality Re XI, 1.897% (3 Month U.S. Treasury Bill + | |
| | | 180 bps), 1/9/24 (144A) | 1,240,000 |
| | | | $ 4,220,500 |
| | | Pandemic – Worldwide — 0.0%† | |
| 1,750,000(a) | | Vita Capital VI, Ltd., 3.084% (6 Month USD LIBOR + | |
| | | 290 bps), 1/8/21 (144A) | $ 1,487,500 |
| | | Windstorm – Florida — 0.1% | |
| 2,500,000(a) | | Integrity Re, 4.05% (3 Month USD LIBOR + | |
| | | 405 bps), 6/10/22 (144A) | $ 2,453,000 |
| | | Windstorm – Japan — 0.0%† | |
| 1,500,000(a) | | Aozora Re, 3.509% (6 Month USD LIBOR + 200 bps), | |
| | | 4/7/21 (144A) | $ 1,500,000 |
| | | Windstorm – Mexico — 0.0%† | |
| 500,000 | | International Bank for Reconstruction & Development, | |
| | | 6.733%, 3/13/24 | $ 499,450 |
| | | Windstorm – Texas — 0.1% | |
| 2,500,000(a) | | Alamo Re II, 5.844% (1 Month U.S. Treasury Bill + | |
| | | 575 bps), 6/8/23 (144A) | $ 2,582,500 |
| | | Windstorm – U.S. — 0.0%† | |
| 250,000(a) | | Bowline Re, 8.944% (3 Month U.S. Treasury Bill + | |
| | | 885 bps), 3/20/23 (144A) | $ 253,625 |
The accompanying notes are an integral part of these financial statements.
Pioneer Multi-Asset Ultrashort Income Fund | Semiannual Report | 9/30/20 71
Schedule of Investments | 9/30/20
(unaudited) (continued)
| | | | |
| Principal | | | |
| Amount | | | |
| USD ($) | | | Value |
| | | Windstorm – U.S. Regional — 0.2% | |
| 2,500,000(d) | | Matterhorn Re, 12/7/21 (144A) | $ 2,263,000 |
| 1,500,000(a) | | Matterhorn Re, 6.344% (3 Month U.S. Treasury Bill + | |
| | | 625 bps), 12/7/21 (144A) | 1,503,450 |
| 250,000(a) | | Matterhorn Re, 7.094% (3 Month U.S. Treasury Bill + | |
| | | 700 bps), 12/7/21 (144A) | 254,875 |
| 2,250,000(a) | | Matterhorn Re, 10.094% (3 Month U.S. Treasury Bill + | |
| | | 1,000 bps), 12/7/21 (144A) | 2,281,500 |
| 250,000(d) | | Matterhorn Re, 12/7/20 (144A) | 243,125 |
| 500,000(d) | | Matterhorn Re 2019-1, 12/7/20 (144A) | 495,700 |
| 2,000,000(a) | | Matterhorn Re 2020-1, 7.594% (3 Month U.S. Treasury | |
| | | Bill + 750 bps), 12/7/21 (144A) | 2,004,600 |
| | | | $ 9,046,250 |
| | | Total Event Linked Bonds | $ 72,107,355 |
| Face | | | |
| Amount | | | |
| USD ($) | | | |
| | | Collateralized Reinsurance — 0.4% | |
| | | Earthquakes – California — 0.0%† | |
| 2,500,000+(e)(f) | | Adare Re 2020, 1/31/21 | $ 2,606,675 |
| | | Multiperil – Massachusetts — 0.1% | |
| 3,000,000+(e)(f) | | Denning Re 2019, 7/31/21 | $ 3,081,638 |
| | | Multiperil – U.S. — 0.1% | |
| 500,000+(e)(f) | | Dingle Re 2019, 2/1/21 | $ 510,263 |
| 250,000+(e)(f) | | Dingle Re 2020, 1/31/21 | 253,771 |
| 4,000,000+(e)(f) | | Port Royal Re 2019, 5/31/21 | 4,045,158 |
| | | | $ 4,809,192 |
| | | Multiperil – U.S. & Canada — 0.1% | |
| 3,250,000+(e)(f) | | Leven Re 2020, 1/31/21 | $ 3,273,283 |
| | | Multiperil – U.S. Regional — 0.1% | |
| 2,750,000+(e)(f) | | Ailsa Re 2019, 6/30/21 | $ 2,818,475 |
| | | Multiperil – Worldwide — 0.0%† | |
| 1,000,000+(e)(f) | | Cypress Re 2017, 1/10/21 | $ 18,200 |
| 24,000+(e) | | Limestone Re 2016-1, 8/31/21 | 70 |
| 40,000+(e) | | Limestone Re 2016-1, 8/31/21 | 116 |
| 223,000+(e)(f) | | Limestone Re 2019-2, 3/1/23 (144A) | 388,912 |
| 2,500,000+(e)(f) | | Resilience Re, 5/1/21 | 250 |
| 2,000,000+(e)(f) | | Resilience Re, 4/6/21 (144A) | 200 |
| | | | $ 407,748 |
The accompanying notes are an integral part of these financial statements.
72 Pioneer Multi-Asset Ultrashort Income Fund | Semiannual Report | 9/30/20
| | | | |
| Face | | | |
| Amount | | | |
| USD ($) | | | Value |
| | | Windstorm – Florida — 0.0%† | |
| 2,000,000+(e)(f) | | Formby Re 2018, 2/28/21 | $ 353,832 |
| 800,000+(e)(f) | | Portrush Re 2017, 6/15/21 | 510,480 |
| | | | $ 864,312 |
| | | Windstorm – U.S. Regional — 0.0%† | |
| 500,000+(e)(f) | | Oakmont Re 2017, 4/30/21 | $ 14,700 |
| 2,500,000+(e)(f) | | Oakmont Re 2019, 4/30/21 | 1,730,780 |
| | | | $ 1,745,480 |
| | | Total Collateralized Reinsurance | $ 19,606,803 |
| | | Industry Loss Warranties — 0.1% | |
| | | Multiperil – U.S. — 0.1% | |
| 2,250,000+(e)(f) | | Scotscraig Re 2020, 1/31/21 | $ 2,239,890 |
| | | Total Industry Loss Warranties | $ 2,239,890 |
| | | Reinsurance Sidecars — 0.3% | |
| | | Multiperil – U.S. — 0.0%† | |
| 2,000,000+(e)(f) | | Carnoustie Re 2017, 11/30/21 | $ 263,600 |
| 1,100,000+(e) | | Carnoustie Re 2019, 12/31/22 | 2,090 |
| 1,500,000+(e)(f) | | Castle Stuart Re 2018, 12/1/21 | 261,880 |
| 2,000,000+(f)(g) | | Harambee Re 2018, 12/31/21 | 22,400 |
| 4,000,000+(g) | | Harambee Re 2019, 12/31/22 | 46,000 |
| | | | $ 595,970 |
| | | Multiperil – Worldwide — 0.3% | |
| 2,000+(e) | | Alturas Re 2019-1, 3/10/23 (144A) | $ 9,819 |
| 36,448+(e) | | Alturas Re 2019-2, 3/10/22 | 194,498 |
| 2,500,000+(e)(f) | | Artex Sac, Ltd. Bantry Re, 2016, 3/31/21 | 201,500 |
| 2,000,000+(e)(f) | | Bantry Re 2017, 3/31/21 | 472,200 |
| 2,000,000+(e)(f) | | Bantry Re 2018, 12/31/21 | 22,800 |
| 4,000,000+(e) | | Bantry Re 2019, 12/31/22 | 135,855 |
| 1,250,000+(e)(f) | | Berwick Re 2017-1, 2/1/21 | 41,375 |
| 5,120,164+(e)(f) | | Berwick Re 2018-1, 12/31/21 | 623,124 |
| 3,658,035+(e)(f) | | Berwick Re 2019-1, 12/31/22 | 437,135 |
| 1,500,000+(g) | | Blue Lotus Re 2018, 12/31/21 | 65,550 |
| 113,405+(e) | | Eden Re II, 3/22/22 (144A) | 70,950 |
| 4,000+(e)(f) | | Eden Re II, 3/22/23 (144A) | 32,466 |
| 35,797+(e)(f) | | Eden Re II, 3/22/23 (144A) | 298,987 |
| 75,000+(e) | | Eden Re II, 3/22/22 (144A) | 48,741 |
| 1,300,000+(e)(f) | | Gleneagles Re 2016, 11/30/20 | 40,560 |
| 2,118,314+(e)(f) | | Gullane Re 2018, 12/31/21 | 2,168,623 |
| 2,000+(e) | | Limestone Re 2018, 3/1/22 | 68,353 |
| 500,000+(g) | | Lion Rock Re 2019, 1/31/21 | 39,100 |
| 4,000,000+(f)(g) | | Lorenz Re 2018, 7/1/21 | 109,600 |
| 2,744,544+(f)(g) | | Lorenz Re 2019, 6/30/22 | 265,397 |
The accompanying notes are an integral part of these financial statements.
Pioneer Multi-Asset Ultrashort Income Fund | Semiannual Report | 9/30/20 73
Schedule of Investments | 9/30/20
(unaudited) (continued)
| | | | |
| Face | | | |
| Amount | | | |
| USD ($) | | | Value |
| | | Multiperil – Worldwide — (continued) | |
| 3,000,000+(e)(f) | | Merion Re 2018-2, 12/31/21 | $ 3,232,500 |
| 977,820+(g) | | NCM Re 2019, 12/31/22 | 113,623 |
| 1,500,000+(e) | | Pangaea Re 2016-2, 11/30/20 | 2,675 |
| 2,000,000+(e)(f) | | Pangaea Re 2018-1, 12/31/21 | 42,109 |
| 4,000,000+(e)(f) | | Pangaea Re 2018-3, 7/1/22 | 82,974 |
| 2,800,000+(e)(f) | | Pangaea Re 2019-1, 2/1/23 | 58,345 |
| 2,941,254+(e)(f) | | Pangaea Re 2019-3, 7/1/23 | 105,799 |
| 2,400,000+(e)(f) | | Sector Re V, 12/1/23 (144A) | 801,252 |
| 1,600,000+(e)(f) | | Sector Re V, 12/1/24 (144A) | 1,682,001 |
| 800,000+(e)(f) | | Sector Re V, Series 9, Class A, 3/1/24 (144A) | 337,059 |
| 1,861+(e) | | Sector Re V, Series 9, Class G, 3/1/24 (144A) | 49,159 |
| 1,250,000+(e)(f) | | St. Andrews Re 2017-1, 2/1/21 | 84,750 |
| 1,737,984+(e)(f) | | St. Andrews Re 2017-4, 6/1/21 | 171,018 |
| 750,000+(f)(g) | | Thopas Re 2018, 12/31/21 | — |
| 3,000,000+(f)(g) | | Thopas Re 2019, 12/31/22 | 447,600 |
| 2,600,000+(e)(f) | | Versutus Re 2017, 11/30/21 | — |
| 2,000,000+(e)(f) | | Versutus Re 2018, 12/31/21 | 38,000 |
| 1,765,095+(e) | | Versutus Re 2019-A, 12/31/21 | 78,900 |
| 1,434,906+(e) | | Versutus Re 2019-B, 12/31/21 | 64,140 |
| 750,000+(f)(g) | | Viribus Re 2018, 12/31/21 | 27,300 |
| 2,500,000+(g) | | Viribus Re 2019, 12/31/22 | 100,250 |
| 1,724,784+(e)(f) | | Woburn Re 2018, 12/31/21 | 158,914 |
| 809,418+(e)(f) | | Woburn Re 2019, 12/31/22 | 275,802 |
| | | | $ 13,300,803 |
| | | Total Reinsurance Sidecars | $ 13,896,773 |
| | | TOTAL INSURANCE-LINKED SECURITIES | |
| | | (Cost $109,772,139) | $ 107,850,821 |
| Principal | | | |
| Amount | | | |
| USD ($) | | | |
| | | MUNICIPAL BOND — 0.0%† of Net | |
| | | Assets(h) | |
| | | Municipal Student Loan — 0.0%† | |
| 68,864(a) | | Louisiana Public Facilities Authority, Student Loan | |
| | | Backed, Series A, 1.168% (3 Month USD LIBOR + | |
| | | 90 bps), 4/26/27 | $ 68,919 |
| | | Total Municipal Student Loan | $ 68,919 |
| | | TOTAL MUNICIPAL BOND | |
| | | (Cost $69,141) | $ 68,919 |
The accompanying notes are an integral part of these financial statements.
74 Pioneer Multi-Asset Ultrashort Income Fund | Semiannual Report | 9/30/20
| | | | |
| Principal | | | |
| Amount | | | |
| USD ($) | | | Value |
| | | SENIOR SECURED FLOATING RATE LOAN | |
| | INTERESTS — 3.8% of Net Assets*(a) | |
| | | Aerospace & Defense — 0.0%† | |
| 2,400,024 | | American Airlines, Inc., 2018 Replacement Term | |
| | | Loan, 1.895% (LIBOR + 175 bps), 6/27/25 | $ 1,492,681 |
| 1,000,000(i) | | MAG DS Corp., Initial Term Loan, 4/1/27 | 955,625 |
| 740,625 | | MRO Holdings, Inc., Initial Term Loan, 5.22% (LIBOR + | |
| | | 500 bps), 6/4/26 | 592,500 |
| 85,691 | | United Airlines, Inc., Refinanced Term Loan, 1.895% | |
| | | (LIBOR + 175 bps), 4/1/24 | 80,335 |
| | | Total Aerospace & Defense | $ 3,121,141 |
| | | Automobile — 0.2% | |
| 2,000,000 | | American Axle & Manufacturing, Inc., Tranche B | |
| | | Term Loan, 3.0% (LIBOR + 225 bps), 4/6/24 | $ 1,925,714 |
| 156,395 | | CWGS Group LLC (aka Camping World, Inc.), Term | |
| | | Loan, 3.5% (LIBOR + 275 bps), 11/8/23 | 152,681 |
| 2,000,000(i) | | Dana, Inc., 2018 New Term Loan B Advance (LIBOR + | |
| | | 225 bps), 2/27/26 | 1,952,500 |
| 2,000,000 | | Navistar, Inc., Tranche B Term Loan, 3.66% (LIBOR + | |
| | | 350 bps), 11/6/24 | 1,989,062 |
| 291,667 | | Visteon Corp., New Term Loan, 1.912% (LIBOR + | |
| | | 175 bps), 3/25/24 | 284,314 |
| 287,222(i) | | Wabash National Corp., Term Loan B, 9/17/27 | 286,145 |
| | | Total Automobile | $ 6,590,416 |
| | | Beverage, Food & Tobacco — 0.0%† | |
| 990,000 | | US Foods, Inc. (aka U.S. Foodservice, Inc.), Incremental | |
| | | B-2019 Term Loan, 2.147% (LIBOR + | |
| | | 200 bps), 9/13/26 | $ 951,173 |
| | | Total Beverage, Food & Tobacco | $ 951,173 |
| | | Broadcasting & Entertainment — 0.1% | |
| 1,087,297 | | Gray Television, Inc., Term B-2 Loan, 2.405% (LIBOR + | |
| | | 225 bps), 2/7/24 | $ 1,065,551 |
| 4,000,001 | | Gray Television, Inc., Term C Loan, 2.655% (LIBOR + | |
| | | 250 bps), 1/2/26 | 3,936,389 |
| | | Total Broadcasting & Entertainment | $ 5,001,940 |
| | | Building Materials — 0.1% | |
| 1,091,190 | | Circor International, Inc., New Term Loan, 4.25% | |
| | | (LIBOR + 325 bps), 12/11/24 | $ 1,070,730 |
| 2,725,947 | | Summit Materials LLC, New Term Loan, 2.145% | |
| | | (LIBOR + 200 bps), 11/21/24 | 2,705,077 |
| | | Total Building Materials | $ 3,775,807 |
The accompanying notes are an integral part of these financial statements.
Pioneer Multi-Asset Ultrashort Income Fund | Semiannual Report | 9/30/20 75
Schedule of Investments | 9/30/20
(unaudited) (continued)
| | | | |
| Principal | | | |
| Amount | | | |
| USD ($) | | | Value |
| | | Buildings & Real Estate — 0.1% | |
| 2,417,462 | | Beacon Roofing Supply, Inc., Initial Term Loan, 2.397% | |
| | | (LIBOR + 225 bps), 1/2/25 | $ 2,346,449 |
| 2,100,000 | | VICI Properties 1 LLC, Term B Loan, 1.906% (LIBOR + | |
| | | 175 bps), 12/20/24 | 2,034,900 |
| 635,618 | | WireCo WorldGroup, Inc. (WireCo WorldGroup | |
| | | Finance LP), First Lien Initial Term Loan, 6.0% (LIBOR + | |
| | | 500 bps), 9/29/23 | 556,232 |
| | | Total Buildings & Real Estate | $ 4,937,581 |
| | | Chemicals — 0.1% | |
| 2,000,000(i) | | Element Solutions, Inc. (Macdermid, Inc.), Tranche B-1 | |
| | | Term Loan, 1/31/26 | $ 1,960,000 |
| | | Total Chemicals | $ 1,960,000 |
| | | Chemicals, Plastics & Rubber — 0.4% | |
| 2,396,940 | | Axalta Coating Systems Dutch Holding B BV (Axalta | |
| | | Coating Systems U.S. Holdings, Inc.), Term B-3 Dollar | |
| | | Loan, 1.97% (LIBOR + 175 bps), 6/1/24 | $ 2,344,807 |
| 1,994,426 | | Berry Global, Inc. (fka Berry Plastics Corp.), Term X | |
| | | Loan, 2.156% (LIBOR + 200 bps), 1/19/24 | 1,973,028 |
| 4,443,750 | | Berry Global, Inc. (fka Berry Plastics Corp.), Term Y | |
| | | Loan, 2.156% (LIBOR + 200 bps), 7/1/26 | 4,317,534 |
| 1,897,792 | | PQ Corp., Third Amendment Tranche B-1 Term Loan, | |
| | | 2.511% (LIBOR + 225 bps), 2/7/27 | 1,861,734 |
| 751,117 | | Reynolds Group Holdings, Inc., Tranche B-1 US Term | |
| | Loan, 3.979% (LIBOR + 275 bps/PRIME + 175 + | |
| | | 0 bps), 2/5/23 | 745,014 |
| 4,471,317 | | Tronox Finance LLC, First Lien Initial Dollar Term Loan, | |
| | | 3.177% (LIBOR + 300 bps), 9/23/24 | 4,415,425 |
| 97,007 | | Twist Beauty International Holdings SA, Facility B2, | |
| | | 4.0% (LIBOR + 300 bps), 4/22/24 | 93,551 |
| | | Total Chemicals, Plastics & Rubber | $ 15,751,093 |
| | | Computers & Electronics — 0.2% | |
| 700,000 | | Celestica, Inc., Incremental Term B-2 Loan, 2.645% | |
| | | (LIBOR + 250 bps), 6/27/25 | $ 693,000 |
| 1,150,000 | | LogMeIn, Inc., First Lien Initial Term Loan, 4.906% | |
| | | (LIBOR + 475 bps), 8/31/27 | 1,113,583 |
| 3,476,222 | | NCR Corp., Initial Term Loan, 2.65% (LIBOR + | |
| | | 250 bps), 8/28/26 | 3,395,834 |
| 1,974,684 | | Pitney Bowes, Inc., Incremental Tranche B Term Loan, | |
| | | 5.65% (LIBOR + 550 bps), 1/7/25 | 1,925,316 |
| | | Total Computers & Electronics | $ 7,127,733 |
| | | Consumer Services — 0.0%† | |
| 1,030,968 | | Prime Security Services Borrower LLC (aka Protection 1 | |
| | Security Solutions), First Lien 2019 Refinancing | |
| | | Term B-1 Loan, 4.25% (LIBOR + 325 bps), 9/23/26 | $ 1,022,959 |
| | | Total Consumer Services | $ 1,022,959 |
The accompanying notes are an integral part of these financial statements.
76 Pioneer Multi-Asset Ultrashort Income Fund | Semiannual Report | 9/30/20
| | | | |
| Principal | | | |
| Amount | | | |
| USD ($) | | | Value |
| | Diversified & Conglomerate Manufacturing — 0.0%† | |
| 904,422 | | Delos Finance S.a.r.l., New Term Loan, 1.97% (LIBOR + | |
| | 175 bps), 10/6/23 | $ 886,334 |
| | Total Diversified & Conglomerate Manufacturing | $ 886,334 |
| | Diversified & Conglomerate Service — 0.1% | |
| 1,990,799 | | Avis Budget Car Rental LLC, New Tranche B Term | |
| | Loan, 2.4% (LIBOR + 225 bps), 8/6/27 | $ 1,771,811 |
| 1,858,271 | | Bright Horizons Family Solutions LLC (fka Bright | |
| | Horizons Family Solutions, Inc.), Term B Loan, 2.5% | |
| | (LIBOR + 175 bps), 11/7/23 | 1,806,589 |
| 1,024,387 | | Change Healthcare Holdings LLC, Closing Date Term | |
| | Loan, 3.5% (LIBOR + 250 bps), 3/1/24 | 1,005,740 |
| 487,704 | | DG Investment Intermediate Holdings 2, Inc. (aka | |
| | Convergint Technologies Holdings LLC), First Lien | |
| | Initial Term Loan, 3.75% (LIBOR + 300 bps), 2/3/25 | 468,195 |
| 463,691 | | DTI Holdco, Inc., Replacement B-1 Term Loan, 5.75% | |
| | (LIBOR + 475 bps), 9/29/23 | 407,063 |
| 1,900,000 | | DynCorp International, Inc., Term Loan, 7.0% (LIBOR + | |
| | 600 bps), 8/18/25 | 1,890,500 |
| 408,702 | | Intrado Corp., Initial Term B Loan, 5.0% (LIBOR + | |
| | 400 bps), 10/10/24 | 373,816 |
| 1,940,000 | | Iqvia, Inc. (Quintiles IMS), Incremental Term B-2 Dollar | |
| | Loan, 1.897% (LIBOR + 175 bps), 1/17/25 | 1,918,175 |
| 1,475,298 | | Outfront Media Capital LLC (Outfront Media Capital | |
| | Corp.), Extended Term Loan, 1.901% (LIBOR + | |
| | 175 bps), 11/18/26 | 1,443,180 |
| 597,730 | | Tempo Acquisition LLC, Extended Term Loan, 3.75% | |
| | (LIBOR + 325 bps), 11/2/26 | 582,600 |
| | Total Diversified & Conglomerate Service | $ 11,667,669 |
| | Electric & Electrical — 0.1% | |
| 2,000,000 | | Dell International LLC (EMC Corp.), Refinancing Term | |
| | B-1 Loan, 2.75% (LIBOR + 200 bps), 9/19/25 | $ 1,993,942 |
| 389,856 | | Rackspace Technology Global, Inc., First Lien Term B | |
| | Loan, 4.0% (LIBOR + 300 bps), 11/3/23 | 383,642 |
| | Total Electric & Electrical | $ 2,377,584 |
| | Electronics — 0.2% | |
| 698,250 | | BY Crown Parent LLC, Initial B-1 Term Loan, 4.0% | |
| | (LIBOR + 300 bps), 2/2/26 | $ 692,140 |
| 2,681,589 | | Science Applications International Corp., Tranche B2 | |
| | Term Loan, 2.397% (LIBOR + 225 bps), 3/12/27 | 2,651,979 |
| 2,351,962 | | Scientific Games International, Inc., Initial Term B-5 | |
| | Loan, 3.471% (LIBOR + 275 bps), 8/14/24 | 2,224,662 |
| 1,292,415 | | Western Digital Corp., US Term B-4 Loan, 1.906% | |
| | (LIBOR + 175 bps), 4/29/23 | 1,285,146 |
| | Total Electronics | $ 6,853,927 |
The accompanying notes are an integral part of these financial statements.
Pioneer Multi-Asset Ultrashort Income Fund | Semiannual Report | 9/30/20 77
Schedule of Investments | 9/30/20
(unaudited) (continued)
| | | | |
| Principal | | | |
| Amount | | | |
| USD ($) | | | Value |
| | | Entertainment & Leisure — 0.0%† | |
| 1,496,250 | | Carnival Corp., Initial Advance Term Loan, 8.5% | |
| | | (LIBOR + 750 bps), 6/30/25 | $ 1,517,447 |
| | | Total Entertainment & Leisure | $ 1,517,447 |
| | | Environmental Services — 0.1% | |
| 2,085,246 | | GFL Environmental, Inc., Effective Date Incremental | |
| | | Term Loan, 4.0% (LIBOR + 300 bps), 5/30/25 | $ 2,079,084 |
| | | Total Environmental Services | $ 2,079,084 |
| | | Financial Services — 0.1% | |
| 1,995,000 | | Cardtronics USA, Inc., Initial Term Loan, 5.0% (LIBOR + | |
| | | 400 bps), 6/29/27 | $ 1,998,116 |
| 1,500,000(i) | | Citadel Securities LP, 2020 Repriced Term | |
| | | Loan, 2/27/26 | 1,493,445 |
| 500,000(i) | | EFS Cogen Holdings I LLC, Term Loan B, 9/24/27 | 499,062 |
| 997,487 | | Hudson River Trading LLC, 2020 Repriced Term | |
| | | Loan, 3.145% (LIBOR + 300 bps), 2/18/27 | 977,538 |
| | | Total Financial Services | $ 4,968,161 |
| | | Healthcare — 0.0%† | |
| 522,654 | | Grifols Worldwide Operations, Ltd., Dollar Tranche B | |
| | | Term Loan, 2.1% (LIBOR + 200 bps), 11/15/27 | $ 513,018 |
| 358,343 | | Horizon Therapeutics USA, Inc., Seventh Amendment | |
| | | Refinancing Term Loan, 2.188% (LIBOR + | |
| | | 200 bps), 5/22/26 | 355,880 |
| | | Total Healthcare | $ 868,898 |
| | | Healthcare & Pharmaceuticals — 0.1% | |
| 1,259,734 | | Acadia Healthcare Co., Inc., Tranche B-4 Term Loan, | |
| | | 2.647% (LIBOR + 250 bps), 2/16/23 | $ 1,251,991 |
| 1,063,781 | | Alkermes, Inc., 2023 Term Loan, 2.41% (LIBOR + | |
| | | 225 bps), 3/27/23 | 1,055,802 |
| 970,000 | | Alphabet Holding Co., Inc. (aka Nature’s Bounty), | |
| | First Lien Initial Term Loan, 3.647% (LIBOR + | |
| | | 350 bps), 9/26/24 | 946,720 |
| 1,200,000(i) | | Milano Acquisition Corp., Term Loan B, 8/17/27 | 1,190,250 |
| 1,501,318 | | NMN Holdings III Corp., First Lien Closing Date | |
| | | Term Loan, 3.647% (LIBOR + 350 bps), 11/13/25 | 1,441,265 |
| 243,045 | | Prestige Brands, Inc., Term B-4 Loan, 2.147% (LIBOR + | |
| | | 200 bps), 1/26/24 | 241,770 |
| 1,422,850 | | Sotera Health Holdings LLC, First Lien Initial Term | |
| | | Loan, 5.5% (LIBOR + 450 bps), 12/11/26 | 1,419,293 |
| | | Total Healthcare & Pharmaceuticals | $ 7,547,091 |
| | Healthcare, Education & Childcare — 0.3% | |
| 1,024,806 | | ATI Holdings Acquisition, Inc., First Lien Initial Term | |
| | | Loan, 4.5% (LIBOR + 350 bps), 5/10/23 | $ 976,128 |
The accompanying notes are an integral part of these financial statements.
78 Pioneer Multi-Asset Ultrashort Income Fund | Semiannual Report | 9/30/20
| | | | |
| Principal | | | |
| Amount | | | |
| USD ($) | | | Value |
| | Healthcare, Education & Childcare — (continued) | |
| 2,200,000 | | Bausch Health Cos., Inc. (fka Valeant Pharmaceuticals | |
| | International, Inc.), First Incremental Term | |
| | Loan, 2.901% (LIBOR + 275 bps), 11/27/25 | $ 2,154,625 |
| 2,473,870 | | Bausch Health Cos., Inc. (fka Valeant Pharmaceuticals | |
| | International, Inc.), Initial Term Loan, 3.151% | |
| | (LIBOR + 300 bps), 6/2/25 | 2,429,546 |
| 4,844,922 | | LifePoint Health, Inc. (fka Regionalcare Hospital | |
| | Partners Holdings, Inc.), First Lien Term B Loan, 3.897% | |
| | (LIBOR + 375 bps), 11/16/25 | 4,716,726 |
| 1,477,500 | | Vizient, Inc., Term B-6 Loan, 2.147% (LIBOR + | |
| | 200 bps), 5/6/26 | 1,451,644 |
| | Total Healthcare, Education & Childcare | $ 11,728,669 |
| | Hotel, Gaming & Leisure — 0.1% | |
| 1,203,131 | | 1011778 B.C. Unlimited Liability Co. (New Red | |
| | Finance, Inc.) (aka Burger King/Tim Hortons), | |
| | Term B-4 Loan, 1.897% (LIBOR + 175 bps), 11/19/26 | $ 1,158,765 |
| 1,992,446 | | Boyd Gaming Corp., Refinancing Term B Loan, 2.356% | |
| | (LIBOR + 225 bps), 9/15/23 | 1,942,635 |
| 1,989,854 | | Flutter Entertainment Plc, USD Term Loan, 3.72% | |
| | (LIBOR + 350 bps), 7/10/25 | 1,992,755 |
| | Total Hotel, Gaming & Leisure | $ 5,094,155 |
| | Insurance — 0.1% | |
| 987,500 | | Alliant Holdings Intermediate LLC, 2019 New Term | |
| | Loan, 3.401% (LIBOR + 325 bps), 5/9/25 | $ 971,761 |
| 68,909 | | Alliant Holdings Intermediate LLC, Initial Term Loan, | |
| | 2.897% (LIBOR + 275 bps), 5/9/25 | 67,053 |
| 4,246,079 | | Asurion LLC (fka Asurion Corp.), New B-7 Term Loan, | |
| | 3.147% (LIBOR + 300 bps), 11/3/24 | 4,181,628 |
| 382,498 | | Confie Seguros Holding II Co., Term B Loan, 5.75% | |
| | (LIBOR + 475 bps), 4/19/22 | 370,784 |
| 491,583 | | Integro Parent, Inc., First Lien Initial Term Loan, 6.75% | |
| | (LIBOR + 575 bps), 10/31/22 | 484,209 |
| 339,500 | | USI, Inc. (fka Compass Investors, Inc.), 2017 New | |
| | Term Loan, 3.22% (LIBOR + 300 bps), 5/16/24 | 329,103 |
| | Total Insurance | $ 6,404,538 |
| | Leasing — 0.1% | |
| 1,144,959 | | Avolon TLB Borrower 1 (US) LLC, Term B-3 Loan, | |
| | 2.5% (LIBOR + 175 bps), 1/15/25 | $ 1,120,628 |
| 1,378,564 | | Avolon TLB Borrower 1 (US) LLC, Term B-4 Loan, | |
| | 2.25% (LIBOR + 150 bps), 2/12/27 | 1,326,221 |
| 1,084,634 | | Fly Funding II S.a.r.l., Replacement Term Loan, 1.99% | |
| | (LIBOR + 175 bps), 8/11/25 | 962,613 |
| 975,000 | | IBC Capital I, Ltd. (aka Goodpack, Ltd.), First Lien | |
| | Tranche B-1 Term Loan, 3.983% (LIBOR + | |
| | 375 bps), 9/11/23 | 918,937 |
| | Total Leasing | $ 4,328,399 |
The accompanying notes are an integral part of these financial statements.
Pioneer Multi-Asset Ultrashort Income Fund | Semiannual Report | 9/30/20 79
Schedule of Investments | 9/30/20
(unaudited) (continued)
| | | | |
| Principal | | | |
| Amount | | | |
| USD ($) | | | Value |
| | | Leisure & Entertainment — 0.0%† | |
| 982,500(j) | | 24 Hour Fitness Worldwide, Inc., Term Loan, 3.647% | |
| | | (LIBOR + 350 bps), 5/30/25 | $ 82,284 |
| 725,625 | | CityCenter Holdings LLC, Term B Loan, 3.0% (LIBOR + | |
| | | 225 bps), 4/18/24 | 698,505 |
| 1,220,288 | | Fitness International LLC, Term B Loan, 4.25% (LIBOR + | |
| | | 325 bps), 4/18/25 | 757,799 |
| | | Total Leisure & Entertainment | $ 1,538,588 |
| | | Machinery — 0.1% | |
| 96,197 | | Clark Equipment Co. (aka Doosan Bobcat, Inc.), | |
| | Repriced 2019 Term Loan, 1.97% (LIBOR + | |
| | | 175 bps), 5/18/24 | $ 93,406 |
| 1,234,571 | | CTC AcquiCo GmbH, Facility B2, 3.256% (LIBOR + | |
| | | 300 bps), 3/7/25 | 1,172,843 |
| 140,069 | | Gardner Denver, Inc., 2020 GDI Tranche B-2 Dollar | |
| | | Term Loan, 1.897% (LIBOR + 175 bps), 3/1/27 | 135,779 |
| 244,777 | | NN, Inc., Tranche B Term Loan, 6.5% (LIBOR + | |
| | | 575 bps), 10/19/22 | 242,238 |
| 1,540,221 | | Shape Technologies Group, Inc., Initial Term Loan, | |
| | | 3.151% (LIBOR + 300 bps), 4/21/25 | 1,170,568 |
| 2,731,406 | | Terex Corp., 2019 US Term Loan Commitments, | |
| | | 3.5% (LIBOR + 275 bps), 1/31/24 | 2,676,778 |
| 292,000 | | Terex Corp., Incremental US Term Loan, 2.75% | |
| | | (LIBOR + 200 bps), 1/31/24 | 283,240 |
| | | Total Machinery | $ 5,774,852 |
| | | Media — 0.1% | |
| 1,345,553 | | CSC Holdings LLC (fka CSC Holdings, Inc. | |
| | | (Cablevision)), October 2018 Incremental Term Loan, | |
| | | 2.402% (LIBOR + 225 bps), 1/15/26 | $ 1,305,467 |
| 2,175,000 | | Ziggo Financing Partnership, Term Loan I Facility, | |
| | | 2.652% (LIBOR + 250 bps), 4/30/28 | 2,102,198 |
| | | Total Media | $ 3,407,665 |
| | | Metals & Mining — 0.1% | |
| 904,787 | | Atkore International, Inc., First Lien Initial Incremental | |
| | | Term Loan, 3.75% (LIBOR + 275 bps), 12/22/23 | $ 902,751 |
| 772,710 | | BWay Holding Co., Initial Term Loan, 3.523% (LIBOR + | |
| | | 325 bps), 4/3/24 | 731,418 |
| 215,625 | | Oxbow Carbon LLC, First Lien Tranche B Term Loan, | |
| | | 3.897% (LIBOR + 375 bps), 1/4/23 | 212,391 |
| 1,826,944 | | Phoenix Guarantor, Inc. (aka Brightspring), First Lien | |
| | | Tranche B-1 Term Loan, 3.401% (LIBOR + | |
| | | 325 bps), 3/5/26 | 1,787,360 |
| | | Total Metals & Mining | $ 3,633,920 |
The accompanying notes are an integral part of these financial statements.
80 Pioneer Multi-Asset Ultrashort Income Fund | Semiannual Report | 9/30/20
| | | | |
| Principal | | | |
| Amount | | | |
| USD ($) | | | Value |
| | Oil & Gas — 0.1% | |
| 3,570,258 | | Centurion Pipeline Co. LLC (fka Lotus Midstream LLC), | |
| | Initial Term Loan, 3.397% (LIBOR + | |
| | 325 bps), 9/29/25 | $ 3,534,556 |
| | Total Oil & Gas | $ 3,534,556 |
| | Personal, Food & Miscellaneous Services — 0.0%† | |
| 1,215,813 | | Option Care Health, Inc., Term B Loan, 4.647% | |
| | (LIBOR + 450 bps), 8/6/26 | $ 1,207,707 |
| | Total Personal, Food & Miscellaneous Services | $ 1,207,707 |
| | Printing & Publishing — 0.0%† | |
| 1,201,725 | | Red Ventures LLC (New Imagitas, Inc.), First Lien | |
| | Term B-2 Loan, 2.647% (LIBOR + 250 bps), 11/8/24 | $ 1,155,408 |
| | Total Printing & Publishing | $ 1,155,408 |
| | Professional & Business Services — 0.2% | |
| 990,000 | | Clear Channel Outdoor Holdings, Inc., Term B Loan, | |
| | 3.761% (LIBOR + 350 bps), 8/21/26 | $ 905,850 |
| 2,929,825 | | Elanco Animal Health, Inc., Term Loan, 1.905% (LIBOR + | |
| | 175 bps), 8/1/27 | 2,853,702 |
| 1,234,375 | | MYOB US Borrower LLC, First Lien Initial US Term Loan, | |
| | 4.147% (LIBOR + 400 bps), 5/6/26 | 1,211,230 |
| 2,000,000 | | Nielsen Finance LLC, Dollar Term B-5 Loan, 4.75% | |
| | (LIBOR + 375 bps), 6/4/25 | 2,000,000�� |
| 750,000(i) | | Pre-Paid Legal Services, Inc. (aka LegalShield), | |
| | Incremental Term Loan, 5/1/25 | 744,375 |
| 1,000,000 | | Victory Capital Holdings, Inc., Tranche B-1 Term Loan, | |
| | 2.799% (LIBOR + 250 bps), 7/1/26 | 987,500 |
| | Total Professional & Business Services | $ 8,702,657 |
| | Retail — 0.2% | |
| 1,600,000 | | Asplundh Tree Expert LLC, Initial Term Loan, 2.655% | |
| | (LIBOR + 250 bps), 9/7/27 | $ 1,600,333 |
| 727,500 | | Bass Pro Group LLC, Initial Term Loan, 5.75% (LIBOR + | |
| | 500 bps), 9/25/24 | 723,271 |
| 2,450,000 | | HD Supply, Inc., Term B-5 Loan, 1.897% (LIBOR + | |
| | 175 bps), 10/17/23 | 2,446,428 |
| 2,372,514 | | KFC Holding Co. (aka Yum! Brands), 2018 Term B | |
| | Loan, 1.9% (LIBOR + 175 bps), 4/3/25 | 2,334,172 |
| | Total Retail | $ 7,104,204 |
| | Securities & Trusts — 0.0%† | |
| 319,772 | | RPI Intermediate Finance Trust, Term B-1 Term Facility, | |
| | 1.897% (LIBOR + 175 bps), 2/11/27 | $ 319,372 |
| | Total Securities & Trusts | $ 319,372 |
The accompanying notes are an integral part of these financial statements.
Pioneer Multi-Asset Ultrashort Income Fund | Semiannual Report | 9/30/20 81
Schedule of Investments | 9/30/20
(unaudited) (continued)
| | | | |
| Principal | | | |
| Amount | | | |
| USD ($) | | | Value |
| | | Telecommunications — 0.4% | |
| 5,022,100 | | CenturyLink, Inc., Term B Loan, 2.397% (LIBOR + | |
| | | 225 bps), 3/15/27 | $ 4,834,218 |
| 2,487,251 | | Ciena Corp., Refinancing Term Loan, 1.906% (LIBOR + | |
| | | 175 bps), 9/26/25 | 2,475,203 |
| 2,432,003 | | Go Daddy Operating Co. LLC (GD Finance Co., Inc.), | |
| | | Tranche B-2 Term Loan, 1.897% (LIBOR + | |
| | | 175 bps), 2/15/24 | 2,384,883 |
| 1,246,875 | | Go Daddy Operating Co. LLC (GD Finance Co., Inc.), | |
| | | Tranche B-3 Term Loan, 2.647% (LIBOR + | |
| | | 250 bps), 8/10/27 | 1,231,289 |
| 3,990,234 | | Level 3 Financing, Inc., Tranche B 2027 Term Loan, | |
| | | 1.897% (LIBOR + 175 bps), 3/1/27 | 3,869,813 |
| 1,484,673 | | Virgin Media Bristol LLC, N Facility, 2.652% (LIBOR + | |
| | | 250 bps), 1/31/28 | 1,445,700 |
| 1,025,000(i) | | Virgin Media Bristol LLC, Term Loan Q, 1/31/29 | 1,009,991 |
| | | Total Telecommunications | $ 17,251,097 |
| | | Transportation — 0.0%† | |
| 2,407,125 | | Envision Healthcare Corp., Initial Term Loan, 3.897% | |
| | | (LIBOR + 375 bps), 10/10/25 | $ 1,736,139 |
| 63,408(k) | | Syncreon Group BV, Second Out Term Loan, 7.0% | |
| | | (6.0% PIK or 1.0% cash), 4/1/25 | 59,445 |
| | | Total Transportation | $ 1,795,584 |
| | | Utilities — 0.1% | |
| 1,095,013 | | APLP Holdings, Ltd. Partnership, Term Loan, 3.5% | |
| | | (LIBOR + 250 bps), 4/14/25 | $ 1,094,556 |
| 753,688 | | Calpine Construction Finance Co., LP, Term B Loan, | |
| | | 2.147% (LIBOR + 200 bps), 1/15/25 | 731,831 |
| 495,000 | | Calpine Corp., Term Loan, 2.147% (LIBOR + | |
| | | 200 bps), 8/12/26 | 482,183 |
| 1,994,635 | | Compass Power Generation, LLC, Tranche B-1 Term | |
| | | Loan, 4.5% (LIBOR + 350 bps), 12/20/24 | 1,963,469 |
| 471,819 | | Eastern Power LLC (Eastern Covert Midco LLC) (aka | |
| | TPF II LC LLC), Term Loan, 4.75% (LIBOR + | |
| | | 375 bps), 10/2/25 | 469,129 |
| 565,759 | | Vistra Operations Co. LLC (fka Tex Operations Co. | |
| | | LLC), 2018 Incremental Term Loan, 1.897% (LIBOR + | |
| | | 175 bps), 12/31/25 | 558,333 |
| | | Total Utilities | $ 5,299,501 |
| | | TOTAL SENIOR SECURED FLOATING RATE | |
| | | LOAN INTERESTS | |
| | | (Cost $183,630,008) | $ 177,286,910 |
The accompanying notes are an integral part of these financial statements.
82 Pioneer Multi-Asset Ultrashort Income Fund | Semiannual Report | 9/30/20
| | | | |
| Principal | | | |
| Amount | | | |
| USD ($) | | | Value |
| | U.S. GOVERNMENT AND AGENCY | |
| | OBLIGATIONS — 3.8% of Net Assets | |
| 7,317(a) | | Fannie Mae, 3.371% (1 Year CMT Index + | |
| | 210 bps), 9/1/32 | $ 7,487 |
| 179(a) | | Fannie Mae, 3.624% (1 Year CMT Index + | |
| | 232 bps), 11/1/23 | 180 |
| 6,731(a) | | Fannie Mae, 3.733% (2 Month USD LIBOR + | |
| | 168 bps), 1/1/48 | 6,872 |
| 6,915(a) | | Fannie Mae, 3.766% (1 Year CMT Index + | |
| | 219 bps), 10/1/32 | 6,929 |
| 6,132(a) | | Fannie Mae, 3.795% (1 Year CMT Index + | |
| | 217 bps), 2/1/34 | 6,098 |
| 541(a) | | Federal Home Loan Mortgage Corp., 3.07% (1 Year | |
| | CMT Index + 230 bps), 10/1/23 | 541 |
| 3,824(a) | | Federal Home Loan Mortgage Corp., 4.125% (2 Month | |
| | USD LIBOR + 200 bps), 11/1/33 | 3,852 |
| 948(a) | | Federal Home Loan Mortgage Corp., 4.371% (5 Year | |
| | CMT Index + 212 bps), 6/1/35 | 961 |
| 1,153(a) | | Government National Mortgage Association II, 3.0% | |
| | (1 Year CMT Index + 150 bps), 1/20/22 | 1,164 |
| 25,000,000(a) | | U.S. Treasury Floating Rate Notes, 0.254% (3 Month U.S. | |
| | Treasury Bill Money Market Yield + 15 bps), 1/31/22 | 25,040,858 |
| 25,000,000(a) | | U.S. Treasury Floating Rate Notes, 0.32% (3 Month U.S. | |
| | Treasury Bill Money Market Yield + 22 bps), 7/31/21 | 25,045,777 |
| 119,000,000(a) | | U.S. Treasury Floating Rate Notes, 0.4% (3 Month U.S. | |
| | Treasury Bill Money Market Yield + 30 bps), 10/31/21 | 119,384,656 |
| 11,700,000 | | U.S. Treasury Note, 2.25%, 7/31/21 | 11,907,035 |
| | TOTAL U.S. GOVERNMENT AND AGENCY OBLIGATIONS | |
| | (Cost $181,394,860) | $ 181,412,410 |
| | TEMPORARY CASH INVESTMENTS — 4.1% | |
| | of Net Assets | |
| | CERTIFICATES OF DEPOSIT — 0.4% | |
| 6,100,000(a) | | Lloyds Bank Corporate Markets Plc, 0.822% (3 Month | |
| | USD LIBOR + 55 bps), 7/19/21 | $ 6,116,009 |
| 6,375,000 | | Natixis, 1.93%, 11/13/20 | 6,389,124 |
| 9,200,000 | | Skandinaviska Enskilda Banken, 0.24%, 10/1/20 | 9,200,038 |
| | | $ 21,705,171 |
| | COMMERCIAL PAPERS — 2.1% | |
| 2,900,000 | | Bat Capital Co., 0.25%, 10/5/20 | $ 2,899,936 |
| 9,200,000 | | CenterPoint Energy, Inc., 0.12%, 10/1/20 | 9,199,972 |
| 9,200,000 | | Cigna Holding Co., 0.2%, 10/9/20 | 9,199,627 |
| 1,450,000 | | DNB Bank ASA, 0.12%, 10/13/20 | 1,449,948 |
| 9,200,000 | | Enable Midstream Partners, 0.55%, 10/1/20 | 9,199,898 |
| 2,500,000 | | Enel Finance America LLC, 0.28%, 10/6/20 | 2,499,933 |
| 18,400,000 | | Energy Transfer LP, 0.62%, 10/1/20 | 18,399,796 |
The accompanying notes are an integral part of these financial statements.
Pioneer Multi-Asset Ultrashort Income Fund | Semiannual Report | 9/30/20 83
Schedule of Investments | 9/30/20
(unaudited) (continued)
| | | | |
| Principal | | | |
| Amount | | | |
| USD ($) | | | Value |
| | | COMMERCIAL PAPERS — (continued) | |
| 9,200,000 | | Eni Finance USA, Inc., 0.12%, 10/1/20 | $ 9,199,964 |
| 9,210,000 | | General Motors, Inc., 0.5%, 10/1/20 | 9,209,895 |
| 5,600,000 | | LG&E & KU Energy LLC, 0.16%, 10/9/20 | 5,599,769 |
| 18,400,000 | | Prudential Funding LLC, 0.11%, 10/1/20 | 18,399,965 |
| 4,000,000 | | Santander UK, 0.2%, 10/2/20 | 3,999,981 |
| | | | $ 99,258,684 |
| | | REPURCHASE AGREEMENTS — 1.6% | |
| 18,980,000 | | $18,980,000 Merrill Lynch, Pierce, Fenner & Smith, Inc., | |
| | 0.07%, dated 9/30/20 plus accrued interest on | |
| | | 10/1/20 collateralized by $19,359,600 | |
| | Government National Mortgage Association, | |
| | | 2.0%, 9/20/50. | $ 18,980,000 |
| 18,980,000 | | $18,980,000 RBC Capital Markets LLC, 0.08%, | |
| | | dated 9/30/20 plus accrued interest on 10/1/20 | |
| | | collateralized by the following: | |
| | $1,245,165 Freddie Mac Giant, 4.0%, 2/1/47 | |
| | $18,114,478 Government National Mortgage | |
| | | Association, 2.0%-4.0%, 2/20/48-9/20/50. | 18,980,000 |
| 18,980,000 | | $18,980,000 ScotiaBank, 0.07%, dated 9/30/20 | |
| | plus accrued interest on 10/1/20 collateralized | |
| | | by the following: | |
| | $12,120,387 Freddie Mac Giant, 3.5%, 5/1/50 | |
| | | $7,239,364 U.S. Treasury Notes, 2.3, 11/15/27. | 18,980,000 |
| 9,490,000 | | $9,490,000 TD Securities USA LLC, 0.06%, dated | |
| | 9/30/20 plus accrued interest on 10/1/20 | |
| | | collateralized by $9,679,867 U.S. Treasury Notes, | |
| | | 2.0%, 2/15/50. | 9,490,000 |
| 9,490,000 | | $9,490,000 TD Securities USA LLC, 0.08%, | |
| | | dated 9/30/20 plus accrued interest on 10/1/20 | |
| | | collateralized by $9,679,867 U.S. Treasury Notes, | |
| | | 2.0%, 2/15/50. | 9,490,000 |
| | | | $ 75,920,000 |
| | | TOTAL TEMPORARY CASH INVESTMENTS | |
| | | (Cost $196,879,167) | $ 196,883,855 |
| | | TOTAL INVESTMENTS IN UNAFFILIATED ISSUERS — 100.5% | |
| | | (Cost $4,812,348,018) | $4,765,467,894 |
| | | OTHER ASSETS AND LIABILITIES — (0.5)% | $ (21,644,793) |
| | | NET ASSETS — 100.0% | $4,743,823,101 |
The accompanying notes are an integral part of these financial statements.
84 Pioneer Multi-Asset Ultrashort Income Fund | Semiannual Report | 9/30/20
| | |
bps | Basis Points. |
CMT | Constant Maturity Treasury. |
FREMF | Freddie Mac Multifamily Fixed-Rate Mortgage Loans. |
LIBOR | London Interbank Offered Rate. |
PRIME | U.S. Federal Funds Rate. |
REIT | Real Estate Investment Trust. |
REMICS | Real Estate Mortgage Investment Conduits. |
SOFRRATE | Secured Overnight Financing Rate. |
Strips | Separate trading of Registered interest and principal of securities. |
(144A) | Security is exempt from registration under Rule 144A of the Securities Act of 1933. Such securities may be resold normally to qualified institutional buyers in a transaction exempt from registration. At September 30, 2020, the value of these securities amounted to $1,962,033,920, or 41.4% of net assets. |
† | Amount rounds to less than 0.1%. |
* | Senior secured floating rate loan interests in which the Fund invests generally pay interest at rates that are periodically redetermined by reference to a base lending rate plus a premium. These base lending rates are generally (i) the lending rate offered by one or more major European banks, such as LIBOR, (ii) the prime rate offered by one or more major United States banks, (iii) the rate of a certificate of deposit or (iv) other base lending rates used by commercial lenders. The interest rate shown is the rate accruing at September 30, 2020. |
+ | Security that used significant unobservable inputs to determine its value. |
(a) | Floating rate note. Coupon rate, reference index and spread shown at September 30, 2020. |
(b) | The interest rate is subject to change periodically. The interest rate and/or reference index and spread shown at September 30, 2020. |
(c) | Debt obligation initially issued at one coupon which converts to a higher coupon at a specific date. The rate shown is the rate at September 30, 2020. |
(d) | Security issued with a zero coupon. Income is recognized through accretion of discount. |
(e) | Issued as participation notes. |
(f) | Non-income producing security. |
(g) | Issued as preference shares. |
(h) | Consists of Revenue Bonds unless otherwise indicated. |
(i) | This term loan will settle after September 30, 2020, at which time the interest rate will be determined. |
(j) | Security is in default. |
(k) | Payment-in-kind (PIK) security which may pay interest in the form of additional principal amount. |
# | Securities are restricted as to resale. |
The accompanying notes are an integral part of these financial statements.
Pioneer Multi-Asset Ultrashort Income Fund | Semiannual Report | 9/30/20 85
Schedule of Investments | 9/30/20
(unaudited) (continued)
| | | | | | | | |
| Restricted Securities | Acquisition date | | Cost | | | Value | |
| Adare Re 2020 | 12/30/2019 | | $ | 2,511,250 | | | $ | 2,606,675 | |
| Ailsa Re 2019 | 6/7/2019 | | | 2,750,000 | | | | 2,818,475 | |
| Akibare Re | 3/22/2018 | | | 250,000 | | | | 247,275 | |
| Akibare Re | 3/22/2018 | | | 500,000 | | | | 496,400 | |
| Alamo Re II | 5/29/2020 | | | 2,500,000 | | | | 2,582,500 | |
| Alturas Re 2019-1 | 12/20/2018 | | | 2,000 | | | | 9,819 | |
| Alturas Re 2019-2 | 12/19/2018 | | | 36,448 | | | | 194,498 | |
| Aozora Re | 3/20/2017 | | | 1,500,000 | | | | 1,500,000 | |
| Artex Sac, Ltd. Bantry Re, 2016 | 2/6/2019 | | | 201,500 | | | | 201,500 | |
| Bantry Re 2017 | 2/6/2019 | | | 472,246 | | | | 472,200 | |
| Bantry Re 2018 | 2/6/2019 | | | 22,757 | | | | 22,800 | |
| Bantry Re 2019 | 2/1/2019 | | | — | | | | 135,855 | |
| Berwick Re 2017-1 | 1/5/2017 | | | 41,453 | | | | 41,375 | |
| Berwick Re 2018-1 | 1/10/2018 | | | 975,468 | | | | 623,124 | |
| Berwick Re 2019-1 | 12/31/2018 | | | 437,104 | | | | 437,135 | |
| Blue Lotus Re 2018 | 12/20/2017 | | | — | | | | 65,550 | |
| Bonanza RE | 2/13/2020 | | | 1,500,000 | | | | 1,500,750 | |
| Bowline Re | 6/17/2020 | | | 242,878 | | | | 249,575 | |
| Bowline Re | 3/12/2019 | | | 250,000 | | | | 253,625 | |
| Caelus Re V | 5/4/2018 | | | 750,000 | | | | 741,675 | |
| Caelus Re V | 5/4/2018 | | | 500,000 | | | | 499,000 | |
| Caelus Re V | 4/27/2017 | | | 625,000 | | | | 568,750 | |
| Caelus Re VI | 2/20/2020 | | | 750,000 | | | | 749,250 | |
| Carnoustie Re 2017 | 1/3/2017 | | | 475,515 | | | | 263,600 | |
| Carnoustie Re 2019 | 12/31/2018 | | | — | | | | 2,090 | |
| Castle Stuart Re 2018 | 12/20/2017 | | | 496,780 | | | | 261,880 | |
| Cypress Re 2017 | 1/24/2017 | | | 3,361 | | | | 18,200 | |
| Denning Re 2019 | 8/8/2019 | | | 2,941,866 | | | | 3,081,638 | |
| Dingle Re 2019 | 3/4/2019 | | | 455,946 | | | | 510,263 | |
| Dingle Re 2020 | 2/13/2020 | | | 232,875 | | | | 253,771 | |
| Eden Re II | 12/14/2018 | | | 4,000 | | | | 32,466 | |
| Eden Re II | 1/22/2019 | | | 35,797 | | | | 298,987 | |
| Eden Re II | 12/15/2017 | | | 4,482 | | | | 48,741 | |
Eden Re II | 1/23/2018 | | | 2,621 | | | | 70,950 | |
First Coast Re II Pte | 6/15/2020 | | | 680,818 | | | | 701,330 | |
FloodSmart Re | 4/10/2019 | | | 500,000 | | | | 496,500 | |
Formby Re 2018 | 7/9/2018 | | | 296,099 | | | | 353,832 | |
Fortius Re II | 7/13/2017 | | | 500,000 | | | | 500,950 | |
Galilei Re | 1/4/2017 | | | 1,143,994 | | | | 1,150,000 | |
Galilei Re | 1/4/2017 | | | 2,299,292 | | | | 2,301,150 | |
Galilei Re | 1/4/2017 | | | 1,250,000 | | | | 1,250,000 | |
Gleneagles Re 2016 | 1/14/2016 | | | — | | | | 40,560 | |
Gullane Re 2018 | 3/26/2018 | | | 2,018,740 | | | | 2,168,623 | |
Harambee Re 2018 | 12/19/2017 | | | 156,092 | | | | 22,400 | |
Harambee Re 2019 | 12/20/2018 | | | — | | | | 46,000 | |
Hypatia Ltd. | 7/10/2020 | | | 1,000,000 | | | | 1,046,500 | |
Hypatia Ltd. | 7/10/2020 | | | 2,500,000 | | | | 2,610,750 | |
Integrity Re | 4/19/2018 | | | 2,492,626 | | | | 2,453,000 | |
International Bank for | | | | | | | | | |
| Reconstruction & Development | 2/28/2020 | | | 500,000 | | | | 499,450 | |
International Bank for | | | | | | | | | |
| Reconstruction & Development | 2/2/2018 | | | 1,800,000 | | | | 1,792,800 | |
The accompanying notes are an integral part of these financial statements.
86 Pioneer Multi-Asset Ultrashort Income Fund | Semiannual Report | 9/30/20
| | | | | | | | |
| Restricted Securities | Acquisition date | | Cost | | | Value | |
International Bank for | | | | | | | |
| Reconstruction & Development | 2/2/2018 | | $ | 1,300,000 | | | $ | 1,294,540 | |
International Bank for | | | | | | | | | |
| Reconstruction & Development | 2/2/2018 | | | 700,000 | | | | 702,380 | |
International Bank for | | | | | | | | | |
| Reconstruction & Development | 2/28/2020 | | | 500,000 | | | | 499,450 | |
Kendall Re | 6/12/2020 | | | 490,004 | | | | 500,500 | |
Kilimanjaro II Re | 6/12/2020 | | | 342,037 | | | | 350,350 | |
Kilimanjaro II Re | 4/6/2017 | | | 1,700,000 | | | | 1,698,300 | |
Kilimanjaro Re | 6/12/2020 | | | 244,584 | | | | 251,375 | |
Kizuna Re II | 3/16/2018 | | | 746,616 | | | | 747,900 | |
Kizuna Re II | 6/5/2020 | | | 246,812 | | | | 249,250 | |
Leven Re 2020 | 1/29/2020 | | | 3,130,075 | | | | 3,273,283 | |
Limestone Re 2016-1 | 12/15/2016 | | | 1,980 | | | | 70 | |
Limestone Re 2016-1 | 12/15/2016 | | | 3,300 | | | | 116 | |
Limestone Re 2018 | 6/20/2018 | | | 2,000 | | | | 68,353 | |
Limestone Re 2019-2 | 6/20/2018 | | | 223,000 | | | | 388,912 | |
Lion Rock Re 2019 | 12/17/2018 | | | — | | | | 39,100 | |
Long Point Re III | 5/17/2018 | | | 1,250,000 | | | | 1,250,125 | |
Lorenz Re 2018 | 6/26/2018 | | | 1,073,131 | | | | 109,600 | |
Lorenz Re 2019 | 6/26/2019 | | | 892,789 | | | | 265,397 | |
Matterhorn Re | 6/25/2020 | | | 2,213,414 | | | | 2,263,000 | |
Matterhorn Re | 4/30/2020 | | | 242,423 | | | | 243,125 | |
Matterhorn Re | 4/30/2020 | | | 250,000 | | | | 254,875 | |
Matterhorn Re | 1/29/2020 | | | 1,494,179 | | | | 1,503,450 | |
Matterhorn Re | 6/5/2020 | | | 394,638 | | | | 401,080 | |
Matterhorn Re | 6/25/2020 | | | 2,250,000 | | | | 2,281,500 | |
Matterhorn Re 2019-1 | 6/14/2019 | | | 494,541 | | | | 495,700 | |
Matterhorn Re 2020-1 | 12/20/2019 | | | 2,000,000 | | | | 2,004,600 | |
Merion Re 2018-2 | 12/28/2017 | | | 3,000,000 | | | | 3,232,500 | |
Nakama Re | 9/21/2016 | | | 697,068 | | | | 697,970 | |
NCM Re 2019 | 12/27/2018 | | | 5,323 | | | | 113,623 | |
Oakmont Re 2017 | 5/10/2017 | | | — | | | | 14,700 | |
Oakmont Re 2019 | 5/21/2019 | | | 1,454,186 | | | | 1,730,780 | |
Pangaea Re 2016-2 | 5/31/2016 | | | — | | | | 2,675 | |
Pangaea Re 2018-1 | 12/26/2017 | | | 285,564 | | | | 42,109 | |
Pangaea Re 2018-3 | 5/31/2018 | | | 963,444 | | | | 82,974 | |
Pangaea Re 2019-1 | 1/9/2019 | | | 29,397 | | | | 58,345 | |
Pangaea Re 2019-3 | 7/25/2019 | | | 88,238 | | | | 105,799 | |
Port Royal Re 2019 | 5/20/2019 | | | 3,682,624 | | | | 4,045,158 | |
Portrush Re 2017 | 6/12/2017 | | | 613,588 | | | | 510,480 | |
Residential Reinsurance 2016 | 6/12/2020 | | | 1,216,792 | | | | 1,252,375 | |
Residential Reinsurance 2016 | 11/3/2016 | | | 2,347,078 | | | | 2,350,470 | |
Residential Reinsurance 2017 | 4/19/2017 | | | 2,099,929 | | | | 2,104,410 | |
Residential Reinsurance 2017 | 11/3/2017 | | | 2,900,000 | | | | 2,869,550 | |
Residential Reinsurance 2018 | 4/30/2018 | | | 1,250,000 | | | | 1,237,625 | |
Residential Reinsurance 2019 | 5/8/2019 | | | 500,000 | | | | 494,250 | |
Residential Reinsurance 2020 | 5/27/2020 | | | 500,000 | | | | 503,900 | |
Resilience Re | 4/13/2017 | | | 6,535 | | | | 200 | |
Resilience Re | 2/8/2017 | | | 1,209 | | | | 250 | |
Sanders Re | 6/12/2020 | | | 240,308 | | | | 246,600 | |
Sanders RE II Ltd. | 5/20/2020 | | | 250,000 | | | | 254,900 | |
The accompanying notes are an integral part of these financial statements.
Pioneer Multi-Asset Ultrashort Income Fund | Semiannual Report | 9/30/20 87
Schedule of Investments | 9/30/20
(unaudited) (continued)
| | | | | | | | |
| Restricted Securities | Acquisition date | | Cost | | | Value | |
| Scotscraig Re 2020 | 1/29/2020 | | $ | 2,031,469 | | | $ | 2,239,890 | |
| Sector Re V | 1/1/2020 | | | 1,600,000 | | | | 1,682,001 | |
| Sector Re V | 12/4/2018 | | | 1,311,532 | | | | 801,252 | |
| Sector Re V, Series 9, Class A | 4/23/2019 | | | 800,000 | | | | 337,059 | |
| Sector Re V, Series 9, Class G | 5/1/2019 | | | 1,861 | | | | 49,159 | |
| Spectrum Capital, Ltd. | 6/12/2020 | | | 983,598 | | | | 1,002,400 | |
| St. Andrews Re 2017-1 | 1/5/2017 | | | 84,685 | | | | 84,750 | |
| St. Andrews Re 2017-4 | 3/31/2017 | | | — | | | | 171,018 | |
| Tailwind Re | 12/20/2017 | | | 3,349,219 | | | | 3,396,900 | |
| Thopas Re 2018 | 12/12/2017 | | | 120,110 | | | | — | |
| Thopas Re 2019 | 12/21/2018 | | | 511,491 | | | | 447,600 | |
| Ursa Re | 11/21/2017 | | | 600,000 | | | | 599,400 | |
| Ursa Re | 9/7/2018 | | | 992,479 | | | | 998,700 | |
| Ursa Re | 11/20/2019 | | | 744,320 | | | | 749,550 | |
| Versutus Re 2017 | 1/5/2017 | | | 172,227 | | | | — | |
| Versutus Re 2018 | 1/31/2018 | | | 67,925 | | | | 38,000 | |
Versutus Re 2019-A | 1/28/2019 | | | — | | | | 78,900 | |
Versutus Re 2019-B | 12/24/2018 | | | — | | | | 64,140 | |
Viribus Re 2018 | 12/22/2017 | | | 99,253 | | | | 27,300 | |
Viribus Re 2019 | 12/27/2018 | | | — | | | | 100,250 | |
Vita Capital VI, Ltd. | 2/12/2020 | | | 1,747,991 | | | | 1,487,500 | |
Vitality Re VIII | 2/13/2020 | | | 249,605 | | | | 248,500 | |
Vitality Re VIII | 1/31/2020 | | | 999,884 | | | | 991,500 | |
Vitality Re X | 1/23/2020 | | | 3,000,000 | | | | 2,980,500 | |
Vitality Re X | 1/31/2020 | | | 1,748,641 | | | | 1,736,875 | |
Vitality Re X | 2/3/2020 | | | 3,496,603 | | | | 3,480,750 | |
Vitality Re XI | 1/23/2020 | | | 1,242,855 | | | | 1,240,000 | |
Woburn Re 2018 | 3/20/2018 | | | 642,700 | | | | 158,914 | |
Woburn Re 2019 | 1/30/2019 | | | 247,877 | | | | 275,802 | |
| Total Restricted Securities | | | | | | | $ | 107,850,821 | |
| % of Net assets | | | | | | | | 2.3 | % |
Principal amounts are denominated in U.S. dollars (“USD”) unless otherwise noted.
Purchases and sales of securities (excluding temporary cash investments) for the six months ended September 30, 2020 were as follows:
| | | | | | | |
| | Purchases | | | Sales | |
Long-Term U.S. Government Securities | | $ | 50,068,583 | | | $ | 394,060,627 | |
Other Long-Term Securities | | $ | 1,065,469,877 | | | $ | 1,146,988,978 | |
The accompanying notes are an integral part of these financial statements.
88 Pioneer Multi-Asset Ultrashort Income Fund | Semiannual Report | 9/30/20
The Fund is permitted to engage in purchase and sale transactions (“cross trades”) with certain funds and accounts for which Amundi Pioneer Asset Management, Inc. (the “Adviser”) serves as the Fund’s investment adviser, as set forth in Rule 17a-7 under the Investment Company Act of 1940, pursuant to procedures adopted by the Board of Trustees. Under these procedures, cross trades are effected at current market prices. During the six months ended September 30, 2020, the Fund engaged in purchases of $8,903,060 and sales of $194,855 pursuant to these procedures, which resulted in a net realized gain/(loss) of $(11,765).
At September 30, 2020, the net unrealized depreciation on investments based on cost for federal tax purposes of $4,824,779,322 was as follows:
| | | | |
| Aggregate gross unrealized appreciation for all investments in which | | | |
| there is an excess of value over tax cost | | $ | 19,428,422 | |
| Aggregate gross unrealized depreciation for all investments in which | | | | |
| there is an excess of tax cost over value | | | (78,739,850 | ) |
| Net unrealized depreciation | | $ | (59,311,428 | ) |
Various inputs are used in determining the value of the Fund’s investments. These inputs are summarized in the three broad levels below.
Level 1 – quoted prices in active markets for identical securities.
Level 2 – other significant observable inputs (including quoted prices for similar securities, interest rates, prepayment speeds, credit risks, etc.). See Notes to Financial Statements —Note 1A.
Level 3 – significant unobservable inputs (including the Fund’s own assumptions in determining fair value of investments). See Notes to Financial Statements — Note 1A.
The accompanying notes are an integral part of these financial statements.
Pioneer Multi-Asset Ultrashort Income Fund | Semiannual Report | 9/30/20 89
Schedule of Investments | 9/30/20
(unaudited) (continued)
The following is a summary of the inputs used as of September 30, 2020, in valuing the Fund’s investments:
| | | | | | | | | | | | | |
| | Level 1 | | | Level 2 | | | Level 3 | | | Total | |
Asset Backed Securities | | $ | — | | | $ | 1,562,355,864 | | | $ | — | | | $ | 1,562,355,864 | |
Collateralized Mortgage | | | | | | | | | | | | | | | | |
| Obligations | | | — | | | | 687,457,356 | | | | — | | | | 687,457,356 | |
Commercial Mortgage-Backed | | | | | | | | | | | | | | | | |
| | | — | | | | 538,842,949 | | | | — | | | | 538,842,949 | |
Corporate Bonds | | | — | | | | 1,288,253,059 | | | | — | | | | 1,288,253,059 | |
Foreign Government Bond | | | — | | | | 25,055,751 | | | | — | | | | 25,055,751 | |
Insurance-Linked Securities | | | | | | | | | | | | | | | | |
| Collateralized Reinsurance | | | | | | | | | | | | | | | | |
| Earthquakes - California | | | — | | | | — | | | | 2,606,675 | | | | 2,606,675 | |
| Multiperil - Massachusetts | | | — | | | | — | | | | 3,081,638 | | | | 3,081,638 | |
| Multiperil - U.S. | | | — | | | | — | | | | 4,809,192 | | | | 4,809,192 | |
| Multiperil - U.S. & Canada | | | — | | | | — | | | | 3,273,283 | | | | 3,273,283 | |
| Multiperil - U.S. Regional | | | — | | | | — | | | | 2,818,475 | | | | 2,818,475 | |
| Multiperil - Worldwide | | | — | | | | — | | | | 407,748 | | | | 407,748 | |
| Windstorm - Florida | | | — | | | | — | | | | 864,312 | | | | 864,312 | |
| Windstorm - U.S. Regional | | | — | | | | — | | | | 1,745,480 | | | | 1,745,480 | |
| Industry Loss Warranties | | | | | | | | | | | | | | | | |
| Multiperil - U.S. | | | — | | | | — | | | | 2,239,890 | | | | 2,239,890 | |
| Reinsurance Sidecars | | | | | | | | | | | | | | | | |
| Multiperil - U.S. | | | — | | | | — | | | | 595,970 | | | | 595,970 | |
| Multiperil - Worldwide | | | — | | | | — | | | | 13,300,803 | | | | 13,300,803 | |
| All Other Insurance-Linked | | | | | | | | | | | | | | | | |
| Securities | | | — | | | | 72,107,355 | | | | — | | | | 72,107,355 | |
Municipal Bond | | | — | | | | 68,919 | | | | — | | | | 68,919 | |
Senior Secured Floating | | | | | | | | | | | | | | | | |
| Rate Loan Interests | | | — | | | | 177,286,910 | | | | — | | | | 177,286,910 | |
U.S. Government and | | | | | | | | | | | | | | | | |
| Agency Obligations | | | — | | | | 181,412,410 | | | | — | | | | 181,412,410 | |
Certificates of Deposit | | | — | | | | 21,705,171 | | | | — | | | | 21,705,171 | |
Commercial Papers | | | — | | | | 99,258,684 | | | | — | | | | 99,258,684 | |
Repurchase Agreements | | | — | | | | 75,920,000 | | | | — | | | | 75,920,000 | |
| Total Investments in Securities | | $ | — | | | $ | 4,729,724,428 | | | $ | 35,743,466 | | | $ | 4,765,467,894 | |
The accompanying notes are an integral part of these financial statements.
90 Pioneer Multi-Asset Ultrashort Income Fund | Semiannual Report | 9/30/20
The following is a reconciliation of assets valued using significant unobservable inputs (Level 3):
| | | | |
| | Insurance- | |
| | Linked | |
| | Securities | |
Balance as of 3/31/20 | | $ | 61,676,226 | |
Realized gain (loss)(1) | | | (1,493,565 | ) |
Change in unrealized depreciation(2) | | | (332,728 | ) |
Accrued discounts/premiums | | | — | |
Purchases | | | — | |
Sales | | | (23,625,717 | ) |
Transfers in to Level 3* | | | — | |
Transfers out of Level 3* | | | (480,750 | ) |
| Balance as of 9/30/20 | | $ | 35,743,466 | |
| | |
(1) | Realized gain (loss) on these securities is included in the realized gain (loss) from investments on the Statement of Operations. |
(2) | Unrealized appreciation (depreciation) on these securities is included in the change in unrealized appreciation (depreciation) from investments on the Statement of Operations. |
* | Transfers are calculated on the beginning of period value. For the six months ended September 30, 2020, securities with an aggregate market value of $480,750 was transferred from Level 3 to Level 2, due to valuing the security using observable inputs. There were no other transfers between Levels 1, 2 and 3. |
| | | | |
| Net change in unrealized appreciation (depreciation) of Level 3 investments still | | | |
| held and considered Level 3 at September 30, 2020: | | $ | (1,035,419 | ) |
The accompanying notes are an integral part of these financial statements.
Pioneer Multi-Asset Ultrashort Income Fund | Semiannual Report | 9/30/20 91
Statement of Assets and Liabilities |
9/30/20 (unaudited)
| | | | |
| ASSETS: | | | |
| Investments in unaffiliated issuers, at value (cost $4,812,348,018) | | $ | 4,765,467,894 | |
| Cash | | | 32,812,938 | |
| Receivables — | | | | |
| Investment securities sold | | | 22,693,386 | |
| Fund shares sold | | | 22,406,583 | |
| Interest | | | 7,289,931 | |
| Other assets | | | 176,852 | |
| Total assets | | $ | 4,850,847,584 | |
| LIABILITIES: | | | | |
| Payables — | | | | |
| Investment securities purchased | | $ | 80,796,998 | |
| Fund shares repurchased | | | 24,499,026 | |
| Distributions | | | 446,453 | |
| Trustees’ fees | | | 11,885 | |
| Unrealized depreciation on unfunded loan commitments | | | 12,310 | |
| Due to affiliates | | | 277,403 | |
| Accrued expenses | | | 980,408 | |
| Total liabilities | | $ | 107,024,483 | |
| NET ASSETS: | | | | |
| Paid-in capital | | $ | 5,045,282,404 | |
| Distributable earnings (loss) | | | (301,459,303 | ) |
| Net assets | | $ | 4,743,823,101 | |
| NET ASSET VALUE PER SHARE: | | | | |
No par value (unlimited number of shares authorized) | | | | |
| Class A (based on $1,635,492,635/170,177,417 shares) | | $ | 9.61 | |
| Class C (based on $262,256,938/27,275,134 shares) | | $ | 9.62 | |
| Class C2 (based on $20,970,417/2,180,546 shares) | | $ | 9.62 | |
| Class K (based on $265,748,854/27,570,153 shares) | | $ | 9.64 | |
| Class Y (based on $2,559,354,257/265,854,257 shares) | | $ | 9.63 | |
The accompanying notes are an integral part of these financial statements.
92 Pioneer Multi-Asset Ultrashort Income Fund | Semiannual Report | 9/30/20
Statement of Operations (unaudited)
FOR THE SIX MONTHS ENDED 9/30/20
| | | | | | | |
| INVESTMENT INCOME: | | | | | | |
| Interest from unaffiliated issuers | | $ | 46,812,600 | | | | |
| Dividends from unaffiliated issuers | | | 1,942,416 | | | | |
| Total investment income | | | | | | $ | 48,755,016 | |
| EXPENSES: | | | | | | | | |
| Management fees | | $ | 7,610,612 | | | | | |
| Administrative expense | | | 570,568 | | | | | |
| Transfer agent fees | | | | | | | | |
| Class A | | | 202,758 | | | | | |
| Class C | | | 38,051 | | | | | |
| Class C2 | | | 5,313 | | | | | |
| Class K | | | 401 | | | | | |
| Class Y | | | 982,428 | | | | | |
| Distribution fees | | | | | | | | |
| Class A | | | 1,617,815 | | | | | |
| Class C | | | 703,762 | | | | | |
| Class C2 | | | 53,311 | | | | | |
| Shareowner communications expense | | | 76,513 | | | | | |
| Custodian fees | | | 74,418 | | | | | |
| Registration fees | | | 167,838 | | | | | |
| Professional fees | | | 146,150 | | | | | |
| Printing expense | | | 28,331 | | | | | |
| Pricing fees | | | 112,407 | | | | | |
| Trustees’ fees | | | 160,193 | | | | | |
| Insurance expense | | | 8,801 | | | | | |
| Miscellaneous | | | 90,612 | | | | | |
| Total expenses | | | | | | $ | 12,650,282 | |
| Net investment income | | | | | | $ | 36,104,734 | |
| REALIZED AND UNREALIZED GAIN (LOSS) ON INVESTMENTS: | | | | | |
| Net realized gain (loss) on: | | | | | | | | |
| Investments in unaffiliated issuers | | | | | | $ | (31,243,408 | ) |
| Change in net unrealized appreciation (depreciation) on: | | | | | | | | |
| Investments in unaffiliated issuers | | $ | 224,490,423 | | | | | |
| Unfunded loan commitments | | | 110,019 | | | $ | 224,600,442 | |
| Net realized and unrealized gain (loss) on investments | | | | | | $ | 193,357,034 | |
| Net increase in net assets resulting from operations | | | | | | $ | 229,461,768 | |
The accompanying notes are an integral part of these financial statements.
Pioneer Multi-Asset Ultrashort Income Fund | Semiannual Report | 9/30/20 93
Statements of Changes in Net Assets
| | | | | | | |
| | Six Months | | | | |
| | Ended | | | Year | |
| | 9/30/20 | | | Ended | |
| | (unaudited) | | | 3/31/20 | |
| FROM OPERATIONS: | | | | | | |
Net investment income (loss) | | $ | 36,104,734 | | | $ | 161,673,331 | |
Net realized gain (loss) on investments | | | (31,243,408 | ) | | | (167,329,917 | ) |
Change in net unrealized appreciation (depreciation) | | | | | | | | |
| on investments | | | 224,600,442 | | | | (254,161,235 | ) |
| Net increase (decrease) in net assets resulting | | | | | | | | |
| from operations | | $ | 229,461,768 | | | $ | (259,817,821 | ) |
| DISTRIBUTIONS TO SHAREOWNERS: | | | | | | | | |
| Class A ($0.08 and $0.27 per share, respectively) | | $ | (13,856,174 | ) | | $ | (48,393,422 | ) |
| Class C ($0.07 and $0.24 per share, respectively) | | | (2,002,457 | ) | | | (9,350,830 | ) |
| Class C2 ($0.07 and $0.24 per share, respectively) | | | (151,523 | ) | | | (292,948 | ) |
| Class K ($0.09 and $0.30 per share, respectively) | | | (2,598,006 | ) | | | (10,737,706 | ) |
| Class Y ($0.09 and $0.29 per share, respectively) | | | (25,265,911 | ) | | | (105,798,339 | ) |
| Total distributions to shareowners | | $ | (43,874,071 | ) | | $ | (174,573,245 | ) |
| FROM FUND SHARE TRANSACTIONS: | | | | | | | | |
Net proceeds from sales of shares | | $ | 1,108,668,710 | | | $ | 5,510,392,928 | |
Reinvestment of distributions | | | 39,928,797 | | | | 158,619,800 | |
Cost of shares repurchased | | | (1,794,751,386 | ) | | | (5,915,746,371 | ) |
| Net decrease in net assets resulting from | | | | | | | | |
| Fund share transactions | | $ | (646,153,879 | ) | | $ | (246,733,643 | ) |
| Net decrease in net assets | | $ | (460,566,182 | ) | | $ | (681,124,709 | ) |
| NET ASSETS: | | | | | | | | |
Beginning of period | | $ | 5,204,389,283 | | | $ | 5,885,513,992 | |
End of period | | $ | 4,743,823,101 | | | $ | 5,204,389,283 | |
The accompanying notes are an integral part of these financial statements.
94 Pioneer Multi-Asset Ultrashort Income Fund | Semiannual Report | 9/30/20
| | | | | | | | | | | | | |
| | Six Months | | | Six Months | | | | | | | |
| | Ended | | | Ended | | | | | | | |
| | 9/30/20 | | | 9/30/20 | | | Year Ended | | | Year Ended | |
| | Shares | | | Amount | | | 3/31/20 | | | 3/31/20 | |
| | (unaudited) | | | (unaudited) | | | Shares | | | Amount | |
| Class A | | | | | | | | | | | | |
Shares sold | | | 40,555,781 | | | $ | 385,149,078 | | | | 207,659,616 | | | $ | 2,059,762,141 | |
Reinvestment of | | | | | | | | | | | | | | | | |
| distributions | | | 1,413,578 | | | | 13,420,528 | | | | 4,724,639 | | | | 46,618,899 | |
Less shares repurchased | | | (47,635,400 | ) | | | (451,491,755 | ) | | | (188,391,509 | ) | | | (1,839,757,207 | ) |
| Net increase | | | | | | | | | | | | | | | | |
| (decrease) | | | (5,666,041 | ) | | $ | (52,922,149 | ) | | | 23,992,746 | | | $ | 266,623,833 | |
| Class C | | | | | | | | | | | | | | | | |
Shares sold | | | 1,401,407 | | | $ | 13,322,343 | | | | 11,059,054 | | | $ | 109,569,322 | |
Reinvestment of | | | | | | | | | | | | | | | | |
| distributions | | | 209,580 | | | | 1,989,819 | | | | 945,924 | | | | 9,341,514 | |
Less shares repurchased | | | (6,738,547 | ) | | | (63,916,005 | ) | | | (22,585,668 | ) | | | (221,897,172 | ) |
| Net decrease | | | (5,127,560 | ) | | $ | (48,603,843 | ) | | | (10,580,690 | ) | | $ | (102,986,336 | ) |
| Class C2 | | | | | | | | | | | | | | | | |
Shares sold | | | 275,467 | | | $ | 2,620,229 | | | | 1,697,084 | | | $ | 16,812,541 | |
Reinvestment of | | | | | | | | | | | | | | | | |
| distributions | | | 1,566 | | | | 14,873 | | | | 7,983 | | | | 78,821 | |
Less shares repurchased | | | (360,849 | ) | | | (3,448,556 | ) | | | (309,176 | ) | | | (2,999,390 | ) |
| Net increase | | | | | | | | | | | | | | | | |
| (decrease) | | | (83,816 | ) | | $ | (813,454 | ) | | | 1,395,891 | | | $ | 13,891,972 | |
| Class K | | | | | | | | | | | | | | | | |
Shares sold | | | 2,412,091 | | | $ | 22,680,643 | | | | 16,044,359 | | | $ | 159,364,345 | |
Reinvestment of | | | | | | | | | | | | | | | | |
| distributions | | | 270,854 | | | | 2,579,517 | | | | 1,078,075 | | | | 10,665,224 | |
Less shares repurchased | | | (3,587,390 | ) | | | (34,018,593 | ) | | | (16,312,518 | ) | | | (159,929,239 | ) |
| Net increase | | | | | | | | | | | | | | | | |
| (decrease) | | | (904,445 | ) | | $ | (8,758,433 | ) | | | 809,916 | | | $ | 10,100,330 | |
| Class Y | | | | | | | | | | | | | | | | |
Shares sold | | | 72,160,273 | | | $ | 684,896,417 | | | | 319,898,241 | | | $ | 3,164,884,579 | |
Reinvestment of | | | | | | | | | | | | | | | | |
| distributions | | | 2,305,513 | | | | 21,924,060 | | | | 9,300,699 | | | | 91,915,342 | |
Less shares repurchased | | | (131,118,276 | ) | | | (1,241,876,477 | ) | | | (376,494,340 | ) | | | (3,691,163,363 | ) |
| Net decrease | | | (56,652,490 | ) | | $ | (535,056,000 | ) | | | (47,295,400 | ) | | $ | (434,363,442 | ) |
The accompanying notes are an integral part of these financial statements.
Pioneer Multi-Asset Ultrashort Income Fund | Semiannual Report | 9/30/20 95
Financial Highlights
| | | | | | | | | | | | | | | | | | | |
| | Six Months | | | | | | | | | | | | | | | | |
| | Ended | | | Year | | | Year | | | Year | | | Year | | | Year | |
| | 9/30/20 | | | Ended | | | Ended | | | Ended | | | Ended | | | Ended | |
| | (unaudited) | | | 3/31/20 | | | 3/31/19 | | | 3/31/18 | | | 3/31/17* | | | 3/31/16* | |
| Class A | | | | | | | | | | | | | | | | | | |
Net asset value, beginning of period | | $ | 9.26 | | | $ | 9.92 | | | $ | 9.95 | | | $ | 9.99 | | | $ | 9.92 | | | $ | 10.00 | |
Increase (decrease) from investment operations: | | | | | | | | | | | | | | | | | | | | | | | | |
| Net investment income (loss) (a) | | $ | 0.07 | | | $ | 0.25 | | | $ | 0.26 | | | $ | 0.18 | | | $ | 0.16 | | | $ | 0.10 | |
| Net realized and unrealized gain (loss) on investments | | | 0.36 | | | | (0.64 | ) | | | (0.03 | ) | | | (0.03 | ) | | | 0.08 | | | | (0.06 | ) |
| Net increase (decrease) from investment operations | | $ | 0.43 | | | $ | (0.39 | ) | | $ | 0.23 | | | $ | 0.15 | | | $ | 0.24 | | | $ | 0.04 | |
Distributions to shareowners: | | | | | | | | | | | | | | | | | | | | | | | | |
| Net investment income | | $ | (0.08 | ) | | $ | (0.27 | ) | | $ | (0.26 | ) | | $ | (0.19 | ) | | $ | (0.17 | ) | | $ | (0.12 | ) |
| Net increase (decrease) in net asset value | | $ | 0.35 | | | $ | (0.66 | ) | | $ | (0.03 | ) | | $ | (0.04 | ) | | $ | 0.07 | | | $ | (0.08 | ) |
Net asset value, end of period | | $ | 9.61 | | | $ | 9.26 | | | $ | 9.92 | | | $ | 9.95 | | | $ | 9.99 | | | $ | 9.92 | |
| Total return (b) | | | 4.67 | %(c) | | | (4.02 | )% | | | 2.32 | % | | | 1.51 | % | | | 2.43 | % | | | 0.41 | % |
Ratio of net expenses to average net assets | | | 0.59 | %(d) | | | 0.58 | % | | | 0.59 | % | | | 0.60 | % | | | 0.61 | % | | | 0.63 | % |
Ratio of net investment income (loss) to average net assets | | | 1.39 | %(d) | | | 2.52 | % | | | 2.58 | % | | | 1.81 | % | | | 1.59 | % | | | 1.01 | % |
Portfolio turnover rate | | | 26 | %(c) | | | 100 | % | | | 61 | % | | | 54 | % | | | 69 | % | | | 58 | % |
Net assets, end of period (in thousands) | | $ | 1,635,493 | | | $ | 1,628,082 | | | $ | 1,506,433 | | | $ | 1,209,820 | | | $ | 759,455 | | | $ | 673,352 | |
* The Fund was audited by an independent registered public accounting firm other than Ernst & Young LLP.
(a) The per share data presented above is based on the average shares outstanding for the period presented.
(b) Assumes initial investment at net asset value at the beginning of each period, reinvestment of all distributions, the complete redemption of the investment at net asset value at the end of each period and no sales charges. Total return would be reduced if sales charges were taken into account.
(c) Not annualized.
(d) Annualized.
The accompanying notes are an integral part of these financial statements.
96 Pioneer Multi-Asset Ultrashort Income Fund | Semiannual Report | 9/30/20
| | | | | | | | | | | | | | | | | | | |
| | Six Months | | | | | | | | | | | | | | | | |
| | Ended | | | Year | | | Year | | | Year | | | Year | | | Year | |
| | 9/30/20 | | | Ended | | | Ended | | | Ended | | | Ended | | | Ended | |
| | (unaudited) | | | 3/31/20 | | | 3/31/19 | | | 3/31/18 | | | 3/31/17* | | | 3/31/16* | |
| Class C | | | | | | | | | | | | | | | | | | |
Net asset value, beginning of period | | $ | 9.26 | | | $ | 9.91 | | | $ | 9.94 | | | $ | 9.97 | | | $ | 9.91 | | | $ | 9.99 | |
Increase (decrease) from investment operations: | | | | | | | | | | | | | | | | | | | | | | | | |
| Net investment income (loss) (a) | | $ | 0.05 | | | $ | 0.22 | | | $ | 0.22 | | | $ | 0.15 | | | $ | 0.13 | | | $ | 0.07 | |
| Net realized and unrealized gain (loss) on investments | | | 0.38 | | | | (0.63 | ) | | | (0.02 | ) | | | (0.02 | ) | | | 0.07 | | | | (0.06 | ) |
| Net increase (decrease) from investment operations | | $ | 0.43 | | | $ | (0.41 | ) | | $ | 0.20 | | | $ | 0.13 | | | $ | 0.20 | | | $ | 0.01 | |
Distributions to shareowners: | | | | | | | | | | | | | | | | | | | | | | | | |
| Net investment income | | $ | (0.07 | ) | | $ | (0.24 | ) | | $ | (0.23 | ) | | $ | (0.16 | ) | | $ | (0.14 | ) | | $ | (0.09 | ) |
| Net increase (decrease) in net asset value | | $ | 0.36 | | | $ | (0.65 | ) | | $ | (0.03 | ) | | $ | (0.03 | ) | | $ | 0.06 | | | $ | (0.08 | ) |
Net asset value, end of period | | $ | 9.62 | | | $ | 9.26 | | | $ | 9.91 | | | $ | 9.94 | | | $ | 9.97 | | | $ | 9.91 | |
| Total return (b) | | | 4.62 | %(c) | | | (4.24 | )% | | | 1.99 | % | | | 1.28 | % | | | 2.00 | % | | | 0.11 | % |
Ratio of net expenses to average net assets | | | 0.90 | %(d) | | | 0.89 | % | | | 0.91 | % | | | 0.92 | % | | | 0.93 | % | | | 0.94 | % |
Ratio of net investment income (loss) to average net assets | | | 1.10 | %(d) | | | 2.25 | % | | | 2.22 | % | | | 1.48 | % | | | 1.27 | % | | | 0.70 | % |
Portfolio turnover rate | | | 26 | %(c) | | | 100 | % | | | 61 | % | | | 54 | % | | | 69 | % | | | 58 | % |
Net assets, end of period (in thousands) | | $ | 262,257 | | | $ | 300,129 | | | $ | 425,928 | | | $ | 623,642 | | | $ | 568,840 | | | $ | 524,030 | |
* The Fund was audited by an independent registered public accounting firm other than Ernst & Young LLP.
(a) The per share data presented above is based on the average shares outstanding for the period presented.
(b) Assumes initial investment at net asset value at the beginning of each period, reinvestment of all distributions, the complete redemption of the investment at net asset value at the end of each period and no sales charges. Total return would be reduced if sales charges were taken into account.
(c) Not annualized.
(d) Annualized.
The accompanying notes are an integral part of these financial statements.
Pioneer Multi-Asset Ultrashort Income Fund | Semiannual Report | 9/30/20 97
Financial Highlights (continued)
| | | | | | | | | | | | | | | | | | | |
| | Six Months | | | | | | | | | | | | | | | | |
| | Ended | | | Year | | | Year | | | Year | | | Year | | | Year | |
| | 9/30/20 | | | Ended | | | Ended | | | Ended | | | Ended | | | Ended | |
| | (unaudited) | | | 3/31/20 | | | 3/31/19 | | | 3/31/18 | | | 3/31/17* | | | 3/31/16* | |
| Class C2 | | | | | | | | | | | | | | | | | | |
Net asset value, beginning of period | | $ | 9.27 | | | $ | 9.91 | | | $ | 9.94 | | | $ | 9.97 | | | $ | 9.91 | | | $ | 9.99 | |
Increase (decrease) from investment operations: | | | | | | | | | | | | | | | | | | | | | | | | |
| Net investment income (loss) (a) | | $ | 0.05 | | | $ | 0.21 | | | $ | 0.22 | | | $ | 0.15 | | | $ | 0.13 | | | $ | 0.07 | |
| Net realized and unrealized gain (loss) on investments | | | 0.37 | | | | (0.61 | ) | | | (0.02 | ) | | | (0.02 | ) | | | 0.07 | | | | (0.06 | ) |
| Net increase (decrease) from investment operations | | $ | 0.42 | | | $ | (0.40 | ) | | $ | 0.20 | | | $ | 0.13 | | | $ | 0.20 | | | $ | 0.01 | |
Distributions to shareowners: | | | | | | | | | | | | | | | | | | | | | | | | |
| Net investment income | | $ | (0.07 | ) | | $ | (0.24 | ) | | $ | (0.23 | ) | | $ | (0.16 | ) | | $ | (0.14 | ) | | $ | (0.09 | ) |
| Net increase (decrease) in net asset value | | $ | 0.35 | | | $ | (0.64 | ) | | $ | (0.03 | ) | | $ | (0.03 | ) | | $ | 0.06 | | | $ | (0.08 | ) |
Net asset value, end of period | | $ | 9.62 | | | $ | 9.27 | | | $ | 9.91 | | | $ | 9.94 | | | $ | 9.97 | | | $ | 9.91 | |
| Total return (b) | | | 4.52 | %(c) | | | (4.13 | )% | | | 1.98 | % | | | 1.29 | % | | | 2.00 | % | | | 0.11 | % |
Ratio of net expenses to average net assets | | | 0.92 | %(d) | | | 0.88 | % | | | 0.91 | % | | | 0.92 | % | | | 0.93 | % | | | 0.94 | % |
Ratio of net investment income (loss) to average net assets | | | 1.07 | %(d) | | | 2.17 | % | | | 2.25 | % | | | 1.47 | % | | | 1.27 | % | | | 0.69 | % |
Portfolio turnover rate | | | 26 | %(c) | | | 100 | % | | | 61 | % | | | 54 | % | | | 69 | % | | | 58 | % |
Net assets, end of period (in thousands) | | $ | 20,970 | | | $ | 20,982 | | | $ | 8,604 | | | $ | 8,929 | | | $ | 9,834 | | | $ | 10,292 | |
* The Fund was audited by an independent registered public accounting firm other than Ernst & Young LLP.
(a) The per share data presented above is based on the average shares outstanding for the period presented.
(b) Assumes initial investment at net asset value at the beginning of each period, reinvestment of all distributions, the complete redemption of the investment at net asset value at the end of each period and no sales charges. Total return would be reduced if sales charges were taken into account.
(c) Not annualized.
(d) Annualized.
The accompanying notes are an integral part of these financial statements.
98 Pioneer Multi-Asset Ultrashort Income Fund | Semiannual Report | 9/30/20
| | | | | | | | | | | | | | | | | | | |
| | Six Months | | | | | | | | | | | | | | | | |
| | Ended | | | Year | | | Year | | | Year | | | Year | | | Year | |
| | 9/30/20 | | | Ended | | | Ended | | | Ended | | | Ended | | | Ended | |
| | (unaudited) | | | 3/31/20 | | | 3/31/19 | | | 3/31/18 | | | 3/31/17* | | | 3/31/16* | |
| Class K | | | | | | | | | | | | | | | | | | |
Net asset value, beginning of period | | $ | 9.29 | | | $ | 9.93 | | | $ | 9.96 | | | $ | 9.99 | | | $ | 9.93 | | | $ | 10.01 | |
Increase (decrease) from investment operations: | | | | | | | | | | | | | | | | | | | | | | | | |
| Net investment income (loss) (a) | | $ | 0.08 | | | $ | 0.28 | | | $ | 0.28 | | | $ | 0.20 | | | $ | 0.19 | | | $ | 0.12 | |
| Net realized and unrealized gain (loss) on investments | | | 0.36 | | | | (0.62 | ) | | | (0.03 | ) | | | (0.02 | ) | | | 0.06 | | | | (0.06 | ) |
| Net increase (decrease) from investment operations | | $ | 0.44 | | | $ | (0.34 | ) | | $ | 0.25 | | | $ | 0.18 | | | $ | 0.25 | | | $ | 0.06 | |
Distributions to shareowners: | | | | | | | | | | | | | | | | | | | | | | | | |
| Net investment income | | $ | (0.09 | ) | | $ | (0.30 | ) | | $ | (0.28 | ) | | $ | (0.21 | ) | | $ | (0.19 | ) | | $ | (0.14 | ) |
| Net increase (decrease) in net asset value | | $ | 0.35 | | | $ | (0.64 | ) | | $ | (0.03 | ) | | $ | (0.03 | ) | | $ | 0.06 | | | $ | (0.08 | ) |
Net asset value, end of period | | $ | 9.64 | | | $ | 9.29 | | | $ | 9.93 | | | $ | 9.96 | | | $ | 9.99 | | | $ | 9.93 | |
| Total return (b) | | | 4.78 | %(c) | | | (3.60 | )% | | | 2.54 | % | | | 1.83 | % | | | 2.55 | % | | | 0.64 | % |
Ratio of net expenses to average net assets | | | 0.37 | %(d) | | | 0.36 | % | | | 0.37 | % | | | 0.38 | % | | | 0.42 | % | | | 0.42 | % |
Ratio of net investment income (loss) to average net assets | | | 1.62 | %(d) | | | 2.79 | % | | | 2.82 | % | | | 2.03 | % | | | 1.92 | % | | | 1.24 | % |
Portfolio turnover rate | | | 26 | %(c) | | | 100 | % | | | 61 | % | | | 54 | % | | | 69 | % | | | 58 | % |
Net assets, end of period (in thousands) | | $ | 265,749 | | | $ | 264,405 | | | $ | 274,682 | | | $ | 158,443 | | | $ | 91,666 | | | $ | 5,026 | |
* The Fund was audited by an independent registered public accounting firm other than Ernst & Young LLP.
(a) The per share data presented above is based on the average shares outstanding for the period presented.
(b) Assumes initial investment at net asset value at the beginning of each period, reinvestment of all distributions and the complete redemption of the investment at net asset value at the end of each period.
(c) Not annualized.
(d) Annualized.
The accompanying notes are an integral part of these financial statements.
Pioneer Multi-Asset Ultrashort Income Fund | Semiannual Report | 9/30/20 99
Financial Highlights (continued)
| | | | | | | | | | | | | | | | | | | |
| | Six Months | | | | | | | | | | | | | | | | |
| | Ended | | | Year | | | Year | | | Year | | | Year | | | Year | |
| | 9/30/20 | | | Ended | | | Ended | | | Ended | | | Ended | | | Ended | |
| | (unaudited) | | | 3/31/20 | | | 3/31/19 | | | 3/31/18 | | | 3/31/17* | | | 3/31/16* | |
| Class Y | | | | | | | | | | | | | | | | | | |
Net asset value, beginning of period | | $ | 9.27 | | | $ | 9.92 | | | $ | 9.96 | | | $ | 9.99 | | | $ | 9.93 | | | $ | 10.01 | |
Increase (decrease) from investment operations: | | | | | | | | | | | | | | | | | | | | | | | | |
| Net investment income (loss) (a) | | $ | 0.07 | | | $ | 0.27 | | | $ | 0.27 | | | $ | 0.19 | | | $ | 0.17 | | | $ | 0.11 | |
| Net realized and unrealized gain (loss) on investments | | | 0.38 | | | | (0.63 | ) | | | (0.04 | ) | | | (0.01 | ) | | | 0.07 | | | | (0.06 | ) |
| Net increase (decrease) from investment operations | | $ | 0.45 | | | $ | (0.36 | ) | | $ | 0.23 | | | $ | 0.18 | | | $ | 0.24 | | | $ | 0.05 | |
Distributions to shareowners: | | | | | | | | | | | | | | | | | | | | | | | | |
| Net investment income | | $ | (0.09 | ) | | $ | (0.29 | ) | | $ | (0.27 | ) | | $ | (0.21 | ) | | $ | (0.18 | ) | | $ | (0.13 | ) |
| Net increase (decrease) in net asset value | | $ | 0.36 | | | $ | (0.65 | ) | | $ | (0.04 | ) | | $ | (0.03 | ) | | $ | 0.06 | | | $ | (0.08 | ) |
Net asset value, end of period | | $ | 9.63 | | | $ | 9.27 | | | $ | 9.92 | | | $ | 9.96 | | | $ | 9.99 | | | $ | 9.93 | |
| Total return (b) | | | 4.85 | %(c) | | | (3.78 | )% | | | 2.37 | % | | | 1.76 | % | | | 2.46 | % | | | 0.54 | % |
Ratio of net expenses to average net assets | | | 0.44 | %(d) | | | 0.44 | % | | | 0.45 | % | | | 0.46 | % | | | 0.50 | % | | | 0.51 | % |
Ratio of net investment income (loss) to average net assets | | | 1.55 | %(d) | | | 2.69 | % | | | 2.74 | % | | | 1.94 | % | | | 1.70 | % | | | 1.15 | % |
Portfolio turnover rate | | | 26 | %(c) | | | 100 | % | | | 61 | % | | | 54 | % | | | 69 | % | | | 58 | % |
Net assets, end of period (in thousands) | | $ | 2,559,354 | | | $ | 2,990,790 | | | $ | 3,669,866 | | | $ | 2,509,061 | | | $ | 1,768,502 | | | $ | 1,418,468 | |
* The Fund was audited by an independent registered public accounting firm other than Ernst & Young LLP.
(a) The per share data presented above is based on the average shares outstanding for the period presented.
(b) Assumes initial investment at net asset value at the beginning of each period, reinvestment of all distributions and the complete redemption of the investment at net asset value at the end of each period.
(c) Not annualized.
(d) Annualized.
The accompanying notes are an integral part of these financial statements.
100 Pioneer Multi-Asset Ultrashort Income Fund | Semiannual Report | 9/30/20
Notes to Financial Statements |
9/30/20 (unaudited)
1. Organization and Significant Accounting Policies
Pioneer Multi-Asset Ultrashort Income Fund (the “Fund”) is one of three portfolios comprising Pioneer Series Trust X, a Delaware statutory trust. The Fund is registered under the Investment Company Act of 1940 as a diversified, open-end management investment company. The investment objective of the Fund is to seek a high level of current income to the extent consistent with a relatively high level of stability of principal.
The Fund offers five classes of shares designated as Class A, Class C, Class C2, Class K and Class Y shares. Each class of shares represents an interest in the same portfolio of investments of the Fund and has identical rights (based on relative net asset values) to assets and liquidation proceeds. Share classes can bear different rates of class-specific fees and expenses, such as transfer agent and distribution fees. Differences in class-specific fees and expenses will result in differences in net investment income and, therefore, the payment of different dividends from net investment income earned by each class. The Amended and Restated Declaration of Trust of the Fund gives the Board of Trustees the flexibility to specify either per-share voting or dollar-weighted voting when submitting matters for shareholder approval. Under per-share voting, each share of a class of the Fund is entitled to one vote. Under dollar-weighted voting, a shareowner’s voting power is determined not by the number of shares owned, but by the dollar value of the shares on the record date. Each share class has exclusive voting rights with respect to matters affecting only that class, including with respect to the distribution plan for that class. There is no distribution plan for Class K or Class Y shares.
Amundi Pioneer Asset Management, Inc., an indirect, wholly owned subsidiary of Amundi and Amundi’s wholly owned subsidiary, Amundi USA, Inc., serves as the Fund’s investment adviser (the “Adviser”). Amundi Pioneer Distributor, Inc., an affiliate of Amundi Pioneer Asset Management, Inc., serves as the Fund’s distributor (the “Distributor”).
During March 2017, the Financial Accounting Standards Board (FASB) issued an Accounting Standard Update, ASU 2017-08, Receivables-Nonrefundable Fees and Other Costs (Subtopic 310-20), Premium Amortization on Purchased Callable Debt Securities (“ASU 2017-08”), which shortens the amortization period for purchased non-contingently callable debt securities held at a premium. ASU 2017-08 specifies that the premium amortization period ends at the earliest call date, for certain purchased non-contingently callable debt securities. ASU 2017-08 is effective for fiscal years, and interim periods within those fiscal years, beginning after December 15, 2018. The
Pioneer Multi-Asset Ultrashort Income Fund | Semiannual Report | 9/30/20 101
Fund has adopted ASU 2017-08 as of January 1, 2019. The implementation of ASU 2017-08 did not have a material impact on the Fund’s financial statements.
The Fund is an investment company and follows investment company accounting and reporting guidance under U.S. GAAP. U.S. GAAP requires the management of the Fund to make estimates and assumptions that affect the reported amounts of assets and liabilities, the disclosure of contingent assets and liabilities at the date of the financial statements, and the reported amounts of income, expenses and gain or loss on investments during the reporting period. Actual results could differ from those estimates.
The following is a summary of significant accounting policies followed by the Fund in the preparation of its financial statements:
A. Security Valuation
The net asset value of the Fund is computed once daily, on each day the New York Stock Exchange (“NYSE”) is open, as of the close of regular trading on the NYSE.
Fixed-income securities are valued by using prices supplied by independent pricing services, which consider such factors as market prices, market events, quotations from one or more brokers, Treasury spreads, yields, maturities and ratings, or may use a pricing matrix or other fair value methods or techniques to provide an estimated value of the security or instrument. A pricing matrix is a means of valuing a debt security on the basis of current market prices for other debt securities, historical trading patterns in the market for fixed-income securities and/or other factors. Non-U.S. debt securities that are listed on an exchange will be valued at the bid price obtained from an independent third party pricing service. When independent third party pricing services are unable to supply prices, or when prices or market quotations are considered to be unreliable, the value of that security may be determined using quotations from one or more broker-dealers.
Loan interests are valued in accordance with guidelines established by the Board of Trustees at the mean between the last available bid and asked prices from one or more brokers or dealers as obtained from Loan Pricing Corporation, an independent third party pricing service. If price information is not available from Loan Pricing Corporation, or if the price information is deemed to be unreliable, price information will be obtained from an alternative loan interest pricing service. If no reliable price quotes are available from either the primary or alternative pricing service, broker quotes will be solicited.
102 Pioneer Multi-Asset Ultrashort Income Fund | Semiannual Report | 9/30/20
Event-linked bonds are valued at the bid price obtained from an independent third party pricing service. Other insurance-linked securities (including reinsurance sidecars, collateralized reinsurance and industry loss warranties) may be valued at the bid price obtained from an independent pricing service, or through a third party using a pricing matrix, insurance industry valuation models, or other fair value methods or techniques to provide an estimated value of the instrument.
Equity securities that have traded on an exchange are valued by using the last sale price on the principal exchange where they are traded. Equity securities that have not traded on the date of valuation, or securities for which sale prices are not available, generally are valued using the mean between the last bid and asked prices or, if both last bid and asked prices are not available, at the last quoted bid price. Last sale and bid and asked prices are provided by independent third party pricing services. In the case of equity securities not traded on an exchange, prices are typically determined by independent third party pricing services using a variety of techniques and methods.
The value of foreign securities is translated into U.S. dollars based on foreign currency exchange rate quotations supplied by a third party pricing source. Trading in non-U.S. equity securities is substantially completed each day at various times prior to the close of the NYSE. The values of such securities used in computing the net asset value of the Fund’s shares are determined as of such times. The Fund may use a fair value model developed by an independent pricing service to value non-U.S. equity securities.
Repurchase agreements are valued at par. Cash may include overnight time deposits at approved financial institutions.
Securities or loan interests for which independent pricing services or broker-dealers are unable to supply prices or for which market prices and/or quotations are not readily available or are considered to be unreliable are valued by a fair valuation team comprised of certain personnel of the Adviser pursuant to procedures adopted by the Fund’s Board of Trustees. The Adviser’s fair valuation team uses fair value methods approved by the Valuation Committee of the Board of Trustees. The Adviser’s fair valuation team is responsible for monitoring developments that may impact fair valued securities and for discussing and assessing fair values on an ongoing basis, and at least quarterly, with the Valuation Committee of the Board of Trustees.
Pioneer Multi-Asset Ultrashort Income Fund | Semiannual Report | 9/30/20 103
Inputs used when applying fair value methods to value a security may include credit ratings, the financial condition of the company, current market conditions and comparable securities. The Fund may use fair value methods if it is determined that a significant event has occurred after the close of the exchange or market on which the security trades and prior to the determination of the Fund’s net asset value. Examples of a significant event might include political or economic news, corporate restructurings, natural disasters, terrorist activity or trading halts. Thus, the valuation of the Fund’s securities may differ significantly from exchange prices, and such differences could be material.
At September 30, 2020, no securities were valued using fair value methods (other than securities valued using prices supplied by independent pricing services, broker-dealers or using a third party insurance industry pricing model).
B. Investment Income and Transactions
Interest income, including interest on income-bearing cash accounts, is recorded on the accrual basis. Dividend and interest income are reported net of unrecoverable foreign taxes withheld at the applicable country rates and net of income accrued on defaulted securities.
Dividend income is recorded on the ex-dividend date, except that certain dividends from foreign securities where the ex-dividend date may have passed are recorded as soon as the Fund becomes aware of the ex-dividend data in the exercise of reasonable diligence.
Interest and dividend income payable by delivery of additional shares is reclassified as PIK (payment-in-kind) income upon receipt and is included in interest and dividend income, respectively.
Principal amounts of mortgage-backed securities are adjusted for monthly paydowns. Premiums and discounts related to certain mortgage-backed securities are amortized or accreted in proportion to the monthly paydowns. All discounts/premiums on purchase prices of debt securities are accreted/amortized for financial reporting purposes over the life of the respective securities, and such accretion/amortization is included in interest income.
Security transactions are recorded as of trade date. Gains and losses on sales of investments are calculated on the identified cost method for both financial reporting and federal income tax purposes.
104 Pioneer Multi-Asset Ultrashort Income Fund | Semiannual Report | 9/30/20
C. Federal Income Taxes
It is the Fund’s policy to comply with the requirements of the Internal Revenue Code applicable to regulated investment companies and to distribute all of its net taxable income and net realized capital gains, if any, to its shareowners. Therefore, no provision for federal income taxes is required. As of March 31, 2020, the Fund did not accrue any interest or penalties with respect to uncertain tax positions, which, if applicable, would be recorded as an income tax expense on the Statement of Operations. Tax returns filed within the prior three years remain subject to examination by federal and state tax authorities.
The amount and character of income and capital gain distributions to shareowners are determined in accordance with federal income tax rules, which may differ from U.S. GAAP. Distributions in excess of net investment income or net realized gains are temporary over distributions for financial statement purposes resulting from differences in the recognition or classification of income or distributions for financial statement and tax purposes. Capital accounts within the financial statements are adjusted for permanent book/tax differences to reflect tax character, but are not adjusted for temporary differences.
The tax character of current year distributions payable will be determined at the end of the current taxable year. The tax character of distributions paid during the year ended March 31, 2020 was as follows:
| | | | |
| | 2020 | |
| Distributions paid from: | | | |
| Ordinary income | | $ | 174,573,245 | |
| Total | | $ | 174,573,245 | |
The following shows the components of distributable earnings (losses) on a federal income tax basis at March 31, 2020:
| | | | |
| | 2020 | |
| Distributable earnings: | | | |
| Undistributed ordinary income | | $ | 1,050,217 | |
| Capital loss carryforward | | | (203,032,222 | ) |
| Current year dividend payable | | | (1,141,032 | ) |
| Unrealized depreciation | | | (283,923,963 | ) |
| Total | | $ | (487,047,000 | ) |
Pioneer Multi-Asset Ultrashort Income Fund | Semiannual Report | 9/30/20 105
The difference between book-basis and tax-basis unrealized depreciation is attributable to the tax deferral of losses on wash sales, adjustments relating to event-linked bonds and the tax treatment of premium and amortization.
D. Fund Shares
The Fund records sales and repurchases of its shares as of trade date. The Distributor earned $0 in underwriting commissions on the sale of Class A shares during the six months ended September 30, 2020.
E. Class Allocations
Income, common expenses and realized and unrealized gains and losses are calculated at the Fund level and allocated daily to each class of shares based on its respective percentage of adjusted net assets at the beginning of the day.
Distribution fees are calculated based on the average daily net asset value attributable to Class A, Class C and Class C2 shares of the Fund, respectively (see Note 4). Class K and Class Y shares do not pay distribution fees. All expenses and fees paid to the Fund’s transfer agent, for its services are allocated among the classes of shares based on the number of accounts in each class and the ratable allocation of related out-of-pocket expenses (see Note 3).
The Fund declares as daily dividends substantially all of its net investment income. All dividends are paid on a monthly basis. Short-term capital gain distributions, if any, may be declared with the daily dividends. Distributions to shareowners are recorded as of the ex-dividend date. Distributions paid by the Fund with respect to each class of shares are calculated in the same manner and at the same time except that net investment income dividends to Class A, Class C, Class C2, Class K and Class Y shares can reflect different transfer agent and distribution expense rates.
F. Risks
The value of securities held by the Fund may go up or down, sometimes rapidly or unpredictably, due to general market conditions, such as real or perceived adverse economic, political or regulatory conditions, inflation, changes in interest rates, lack of liquidity in the bond markets or adverse investor sentiment. In the past several years, financial markets have experienced increased volatility, depressed valuations, decreased liquidity and heightened uncertainty. These conditions may continue, recur, worsen or spread. A general rise in interest rates could adversely affect the price and liquidity of fixed-income securities and could also result in increased redemptions from the Fund.
106 Pioneer Multi-Asset Ultrashort Income Fund | Semiannual Report | 9/30/20
At times, the Fund’s investments may represent industries or industry sectors that are interrelated or have common risks, making the Fund more susceptible to any economic, political, or regulatory developments or other risks affecting those industries and sectors. The Fund’s investments in foreign markets and countries with limited developing markets may subject the Fund to a greater degree of risk than investments in a developed market. These risks include disruptive political or economic conditions and the imposition of adverse governmental laws or currency exchange restrictions.
The Fund invests in below-investment-grade (high-yield) debt securities and preferred stocks. Some of these high-yield securities may be convertible into equity securities of the issuer. Debt securities rated below-investment-grade are commonly referred to as “junk bonds” and are considered speculative. These securities involve greater risk of loss, are subject to greater price volatility, and are less liquid, especially during periods of economic uncertainty or change, than higher rated debt securities.
The Fund’s investments, payment obligations and financing terms may be based on floating rates, such as LIBOR (London Interbank Offered Rate). Plans are underway to phase out the use of LIBOR by the end of 2021. There remains uncertainty regarding the nature of any replacement rate and the impact of the transition from LIBOR on the fund, issuers of instruments in which the fund invests, and financial markets generally.
With the increased use of technologies such as the Internet to conduct business, the Fund is susceptible to operational, information security and related risks. While the Fund’s Adviser has established business continuity plans in the event of, and risk management systems to prevent, limit or mitigate, such cyber-attacks, there are inherent limitations in such plans and systems, including the possibility that certain risks have not been identified. Furthermore, the Fund cannot control the cybersecurity plans and systems put in place by service providers to the Fund such as Brown Brothers Harriman & Co., the Fund’s custodian and accounting agent, and DST Asset Manager Solutions, Inc., the Fund’s transfer agent. In addition, many beneficial owners of Fund shares hold them through accounts at broker-dealers, retirement platforms and other financial market participants over which neither the Fund nor Amundi exercises control. Each of these may in turn rely on service providers to them, which are also subject to the risk of cyber-attacks. Cybersecurity failures or breaches at Amundi or the Fund’s service providers or intermediaries have the ability to cause disruptions and impact business operations, potentially resulting in financial losses, interference with the Fund’s ability to calculate its net asset value, impediments to trading, the inability of Fund shareowners to effect share purchases, redemptions or exchanges or receive distributions,
Pioneer Multi-Asset Ultrashort Income Fund | Semiannual Report | 9/30/20 107
loss of or unauthorized access to private shareowner information and violations of applicable privacy and other laws, regulatory fines, penalties, reputational damage, or additional compliance costs. Such costs and losses may not be covered under any insurance. In addition, maintaining vigilance against cyber-attacks may involve substantial costs over time, and system enhancements may themselves be subject to cyber-attacks.
COVID-19
The respiratory illness COVID-19 caused by a novel coronavirus has resulted in a global pandemic and major disruption to economies and markets around the world, including the United States. Global financial markets have experienced extreme volatility and severe losses, and trading in many instruments has been disrupted. Liquidity for many instruments has been greatly reduced for periods of time. Some interest rates are very low and in some cases yields are negative. Some sectors of the economy and individual issuers have experienced particularly large losses. These circumstances may continue for an extended period of time, and may continue to affect adversely the value and liquidity of the Fund’s investments. The ultimate economic fallout from the pandemic, and the long-term impact on economies, markets, industries and individual issuers, are not known. Governments and central banks, including the Federal Reserve in the U.S., have taken extraordinary and unprecedented actions to support local and global economies and the financial markets. These actions have resulted in significant expansion of public debt, including in the U.S. The impact of these measures, and whether they will be effective to mitigate the economic and market disruption, will not be known for some time. The consequences of high public debt, including its future impact on the economy and securities markets, likewise may not be known for some time.
The Fund’s prospectus contains unaudited information regarding the Fund’s principal risks. Please refer to that document when considering the Fund’s principal risks.
G. Insurance-Linked Securities (“ILS”)
The Fund invests in ILS. The Fund could lose a portion or all of the principal it has invested in an ILS, and the right to additional interest or dividend payments with respect to the security, upon the occurrence of one or more trigger events, as defined within the terms of an insurance-linked security. Trigger events, generally, are hurricanes, earthquakes, or other natural events of a specific size or magnitude that occur in a designated geographic region during a specified time period, and/or that involve losses or other metrics that exceed a specific amount. There is no way to accurately predict whether a trigger event will occur, and accordingly, ILS carry significant risk. The Fund is entitled to receive principal, and interest and/or dividend
108 Pioneer Multi-Asset Ultrashort Income Fund | Semiannual Report | 9/30/20
payments so long as no trigger event occurs of the description and magnitude specified by the instrument. In addition to the specified trigger events, ILS may expose the Fund to other risks, including but not limited to issuer (credit) default, adverse regulatory or jurisdictional interpretations and adverse tax consequences.
The Fund’s investments in ILS may include event-linked bonds. ILS also may include special purpose vehicles (“SPVs”) or similar instruments structured to comprise a portion of a reinsurer’s catastrophe-oriented business, known as quota share instruments (sometimes referred to as reinsurance sidecars), or to provide reinsurance relating to specific risks to insurance or reinsurance companies through a collateralized instrument, known as collateralized reinsurance. Structured reinsurance investments also may include industry loss warranties (“ILWs”). A traditional ILW takes the form of a bilateral reinsurance contract, but there are also products that take the form of derivatives, collateralized structures, or exchange-traded instruments.
Where the ILS are based on the performance of underlying reinsurance contracts, the Fund has limited transparency into the individual underlying contracts, and therefore must rely upon the risk assessment and sound underwriting practices of the issuer. Accordingly, it may be more difficult for the Adviser to fully evaluate the underlying risk profile of the Fund’s structured reinsurance investments, and therefore the Fund’s assets are placed at greater risk of loss than if the Adviser had more complete information. Structured reinsurance instruments generally will be considered illiquid securities by the Fund. These securities may be difficult to purchase, sell or unwind. Illiquid securities also may be difficult to value. If the Fund is forced to sell an illiquid asset, the Fund may be forced to sell at a loss.
H. Repurchase Agreements
Repurchase agreements are arrangements under which the Fund purchases securities from a broker-dealer or a bank, called the counterparty, upon the agreement of the counterparty to repurchase the securities from the Fund at a later date, and at a specific price, which is typically higher than the purchase price paid by the Fund. The securities purchased serve as the Fund’s collateral for the obligation of the counterparty to repurchase the securities. The value of the collateral, including accrued interest, is required to be equal to or in excess of the repurchase price. The collateral for all repurchase agreements is held in safekeeping in the customer-only account of the Fund’s custodian or a sub-custodian of the Fund. The Adviser is responsible for determining that the value of the collateral remains at least equal to the repurchase price. In the event of a default by the counterparty, the Fund is entitled to sell the securities, but the Fund may not be able to
Pioneer Multi-Asset Ultrashort Income Fund | Semiannual Report | 9/30/20 109
sell them for the price at which they were purchased, thus causing a loss to the Fund. Additionally, if the counterparty becomes insolvent, there is some risk that the Fund will not have a right to the securities, or the immediate right to sell the securities.
Open repurchase agreements at September 30, 2020, are disclosed in the Schedule of Investments.
2. Management Agreement
The Adviser manages the Fund’s portfolio. Management fees are calculated daily and paid monthly at the annual rate of 0.35% of the Fund’s average daily net assets up to $1 billion, 0.30% of the next $4 billion of the Fund’s average daily net assets, 0.25% of the next $2.5 billion of the Fund’s average daily net assets and 0.20% of the Fund’s average daily net assets over $7.5 billion. For the six months ended September 30, 2020, the effective management fee (excluding waivers and/or assumption of expenses) was equivalent to 0.31% (annualized) of the Fund’s average daily net assets.
In addition, under the management and administration agreements, certain other services and costs, including accounting, regulatory reporting and insurance premiums, are paid by the Fund as administrative reimbursements. Included in “Due to affiliates” reflected on the Statement of Assets and Liabilities is $213,242 in management fees, administrative costs and certain other reimbursements payable to the Adviser at September 30, 2020.
3. Transfer Agent
DST Asset Manager Solutions, Inc. serves as the transfer agent to the Fund at negotiated rates. Transfer agent fees and payables shown on the Statement of Operations and the Statement of Assets and Liabilities, respectively, include sub-transfer agent expenses incurred through the Fund’s omnibus relationship contracts.
In addition, the Fund reimbursed the transfer agent for out-of-pocket expenses incurred by the transfer agent related to shareowner communications activities such as proxy and statement mailings, and outgoing phone calls. For the six months ended September 30, 2020, such out-of-pocket expenses by class of shares were as follows:
| | | | |
| Shareowner Communications: | | | |
Class A | | $ | 20,520 | |
Class C | | | 5,262 | |
Class C2 | | | 21 | |
Class K | | | 181 | |
Class Y | | | 50,529 | |
| Total | | $ | 76,513 | |
110 Pioneer Multi-Asset Ultrashort Income Fund | Semiannual Report | 9/30/20
4. Distribution Plan
The Fund has adopted a distribution plan (the “Plan”) pursuant to Rule 12b-1 of the Investment Company Act of 1940 with respect to its Class A, Class C and Class C2 shares. Pursuant to the Plan, the Fund pays the Distributor 0.20% of the average daily net assets attributable to Class A shares as compensation for personal services and/or account maintenance services or distribution services with regard to Class A shares. Pursuant to the Plan, the Fund also pays the Distributor 0.50% of the average daily net assets attributable to Class C and Class C2 shares. The fee for Class C and Class C2 shares consists of a 0.25% service fee and a 0.25% distribution fee paid as compensation for personal services and/or account maintenance services or distribution services with regard to Class C and Class C2 shares. Included in “Due to affiliates” reflected on the Statement of Assets and Liabilities is $64,161 in distribution fees payable to the Distributor at September 30, 2020.
In addition, redemptions of Class A and Class C2 shares may be subject to a contingent deferred sales charge (“CDSC”). A CDSC of 1.00% may be imposed on redemptions of certain net asset value purchases of Class A shares within 12 months of purchase. Redemptions of Class C2 shares redemptions of shares within 12 months of purchase are subject to a CDSC of 1.00%, based on the lower of cost or market value of shares being redeemed. Shares purchased as part of an exchange remain subject to any CDSC that applied to the original purchase of those shares. There is no CDSC for Class C, Class K and Class Y shares. Proceeds from the CDSCs are paid to the Distributor. For the six months ended September 30, 2020, CDSCs in the amount of $9,472 were paid to the Distributor.
5. Line of Credit Facility
The Fund, along with certain other funds in the Pioneer Family of Funds (the “Funds”), participates in a committed, unsecured revolving line of credit. Borrowings are used solely for temporary or emergency purposes. The Fund may borrow up to the lesser of the amount available under the credit facility or the limits set for borrowing by the Fund’s prospectus and the 1940 Act. Effective March 11, 2020, the Fund participates in a facility in the amount of $300 million. Prior to March 11, 2020, the Fund participated in a facility in the amount of $250 million. Under such facility, depending on the type of loan, interest on borrowings is payable at the London Interbank Offered Rate (“LIBOR”) plus a credit spread. The Fund also pays an annual commitment fee to participate in a credit facility. The commitment fee is allocated among participating Funds based on an allocation schedule set forth in the credit agreement. For the six months ended September 30, 2020, the Fund had no borrowings under the credit facility.
Pioneer Multi-Asset Ultrashort Income Fund | Semiannual Report | 9/30/20 111
6. Unfunded Loan Commitments
The Fund may enter into unfunded loan commitments. Unfunded loan commitments may be partially or wholly unfunded. During the contractual period, the Fund is obliged to provide funding to the borrower upon demand. A fee is earned by the Fund on the unfunded loan commitment and is recorded as interest income on the Statement of Operations.
As of September 30, 2020, the Fund had the following unfunded loan commitments outstanding:
| | | | | |
| | | | Unrealized |
| | | | Appreciation/ |
| Loan | Principal | Cost | Value | (Depreciation) |
NMN Holdings III Corp. | $322,381 | $321,795 | $309,485 | $ (12,310) |
| Total Value | $322,381 | $321,795 | $309,485 | $(12,310) |
7. Subsequent Event
On November 19, 2020, Amundi Pioneer Asset Management announced it will be rebranding the US business of Amundi as Amundi US effective January 1, 2021. The new brand identity will replace Amundi Pioneer, which was first adopted in July 2017 following the acquisition of Pioneer Investments by Amundi. In connection with these changes, Amundi Pioneer Asset Management. Inc., the investment adviser to the Pioneer funds, will change its name to Amundi Asset Management US, Inc. In addition, Amundi Pioneer Distributor, Inc., the Pioneer funds’ distributor, will change its name to Amundi Distributor US, Inc. The names of the Pioneer funds will not change in connection with this rebranding.
112 Pioneer Multi-Asset Ultrashort Income Fund | Semiannual Report | 9/30/20
Statement Regarding Liquidity Risk Management Program
As required by law, the Fund has adopted and implemented a liquidity risk management program (the “Program”) that is designed to assess and manage liquidity risk. Liquidity risk is the risk that the Fund could not meet requests to redeem its shares without significant dilution of remaining investors’ interests in the Fund. The Fund’s Board of Trustees designated a liquidity risk management committee (the “Committee”) consisting of employees of Amundi Pioneer Asset Management, Inc. (the “Adviser”) to administer the Program.
The Committee provided the Board of Trustees with a report that addressed the operation of the Program and assessed its adequacy and effectiveness of implementation (the “Report”). The Report covered the period from December 1, 2018 through March 31, 2020 (the “Reporting Period”).
The Report confirmed that, throughout the Reporting Period, the Committee had monitored the Fund’s portfolio liquidity and liquidity risk on an ongoing basis, as described in the Program and in Board reporting throughout the Reporting Period.
The Report discussed the Committee’s annual review of the Program, which addressed, among other things, the following elements of the Program:
The Committee reviewed the Fund’s investment strategy and liquidity of portfolio investments during both normal and reasonably foreseeable stressed conditions. The Committee noted that the Fund’s investment strategy continues to be appropriate for an open-end fund, taking into account, among other things, whether and to what extent the Fund held less liquid and illiquid assets and the extent to which any such investments affected the Fund’s ability to meet redemption requests. In managing and reviewing the Fund’s liquidity risk, the Committee also considered the extent to which the Fund’s investment strategy involves a relatively concentrated portfolio or large positions in particular issuers, the extent to which the Fund uses borrowing for investment purposes, and the extent to which the Fund uses derivatives (including for hedging purposes). The Committee also reviewed the Fund’s short-term and long-term cash flow projections during both normal and reasonably foreseeable stressed conditions. In assessing the Fund’s cash flow projections, the Committee considered, among other factors, historical net redemption activity, redemption policies, ownership concentration, distribution channels, and the degree of certainty associated with the Fund’s short-term and long-term cash flow projections. The Committee also considered the Fund’s
Pioneer Multi-Asset Ultrashort Income Fund | Semiannual Report | 9/30/20 113
holdings of cash and cash equivalents, as well as borrowing arrangements and other funding sources, including, if applicable, the Fund’s participation in a credit facility, as components of the Fund’s ability to meet redemption requests. The Fund has adopted an in-kind redemption policy which may be utilized to meet larger redemption requests.
The Committee reviewed the Program’s liquidity classification methodology for categorizing the Fund’s investments into one of four liquidity buckets. In reviewing the Fund’s investments, the Committee considered, among other factors, whether trading varying portions of a position in a particular portfolio investment or asset class in sizes the Fund would reasonably anticipate trading, would be reasonably expected to significantly affect liquidity.
The Committee performed an analysis to determine whether the Fund is required to maintain a Highly Liquid Investment Minimum, and determined that no such minimum is required because the Fund primarily holds highly liquid investments.
The Report stated that the Committee concluded the Program operates adequately and effectively, in all material respects, to assess and manage the Fund’s liquidity risk throughout the Reporting Period.
114 Pioneer Multi-Asset Ultrashort Income Fund | Semiannual Report | 9/30/20
Approval of Investment Management Agreement
Amundi Pioneer Asset Management, Inc. (“APAM”) serves as the investment adviser to Pioneer Multi-Asset Ultrashort Income Fund (the “Fund”) pursuant to an investment management agreement between APAM and the Fund. In order for APAM to remain the investment adviser of the Fund, the Trustees of the Fund must determine annually whether to renew the investment management agreement for the Fund.
The contract review process began in January 2020 as the Trustees of the Fund agreed on, among other things, an overall approach and timeline for the process. Contract review materials were provided to the Trustees in March 2020, July 2020 and September 2020. In addition, the Trustees reviewed and discussed the Fund’s performance at regularly scheduled meetings throughout the year, and took into account other information related to the Fund provided to the Trustees at regularly scheduled meetings, in connection with the review of the Fund’s investment management agreement.
In March 2020, the Trustees, among other things, discussed the memorandum provided by Fund counsel that summarized the legal standards and other considerations that are relevant to the Trustees in their deliberations regarding the renewal of the investment management agreement, and reviewed and discussed the qualifications of the investment management teams for the Fund, as well as the level of investment by the Fund’s portfolio managers in the Fund. In July 2020, the Trustees, among other things, reviewed the Fund’s management fees and total expense ratios, the financial statements of APAM and its parent companies, profitability analyses provided by APAM, and analyses from APAM as to possible economies of scale. The Trustees also reviewed the profitability of the institutional business of APAM and APAM’s affiliate, Amundi Pioneer Institutional Asset Management, Inc. (“APIAM” and, together with APAM, “Amundi”), as compared to that of APAM’s fund management business, and considered the differences between the fees and expenses of the Fund and the fees and expenses of APAM’s and APIAM’s institutional accounts, as well as the different services provided by APAM to the Fund and by APAM and APIAM to the institutional accounts. The Trustees further considered contract review materials, including additional materials received in response to the Trustees’ request, in September 2020.
Pioneer Multi-Asset Ultrashort Income Fund | Semiannual Report | 9/30/20 115
At a meeting held on September 15, 2020, based on their evaluation of the information provided by APAM and third parties, the Trustees of the Fund, including the Independent Trustees voting separately, unanimously approved the renewal of the investment management agreement for another year. In approving the renewal of the investment management agreement, the Trustees considered various factors that they determined were relevant, including the factors described below. The Trustees did not identify any single factor as the controlling factor in determining to approve the renewal of the agreement.
Nature, Extent and Quality of Services
The Trustees considered the nature, extent and quality of the services that had been provided by APAM to the Fund, taking into account the investment objective and strategy of the Fund. The Trustees also reviewed APAM’s investment approach for the Fund and its research process. The Trustees considered the resources of APAM and the personnel of APAM who provide investment management services to the Fund. They also reviewed the amount of non-Fund assets managed by the portfolio managers of the Fund. They considered the non-investment resources and personnel of APAM that are involved in APAM’s services to the Fund, including APAM’s compliance, risk management, and legal resources and personnel. The Trustees noted the substantial attention and high priority given by APAM’s senior management to the Pioneer Fund complex. The Trustees considered the implementation and effectiveness of APAM’s business continuity plan in response to the COVID-19 pandemic.
The Trustees considered that APAM supervises and monitors the performance of the Fund’s service providers and provides the Fund with personnel (including Fund officers) and other resources that are necessary for the Fund’s business management and operations. The Trustees also considered that, as administrator, APAM is responsible for the administration of the Fund’s business and other affairs. The Trustees considered the fees paid to APAM for the provision of administration services.
Based on these considerations, the Trustees concluded that the nature, extent and quality of services that had been provided by APAM to the Fund were satisfactory and consistent with the terms of the investment management agreement.
116 Pioneer Multi-Asset Ultrashort Income Fund | Semiannual Report | 9/30/20
Performance of the Fund
In considering the Fund’s performance, the Trustees regularly review and discuss throughout the year data prepared by APAM and information comparing the Fund’s performance with the performance of its peer group of funds, as classified by Morningstar, Inc. (Morningstar), and with the performance of the Fund’s benchmark index. They also discuss the Fund’s performance with APAM on a regular basis.
The Trustees discussed the Fund’s performance with the Adviser on a more frequent basis in light of the Fund’s unfavorable performance compared to its benchmark index and peers over certain periods. The Trustees noted APAM’s explanation for the Fund’s relative performance and the steps taken by APAM to address the Fund’s performance, including enhancing the investment process used for the Fund. The Trustees’ regular reviews and discussions were factored into the Trustees’ deliberations concerning the renewal of the investment management agreement.
Management Fee and Expenses
The Trustees considered information showing the fees and expenses of the Fund in comparison to the management fees of its peer group of funds as classified by Morningstar and also to the expense ratios of a peer group of funds selected on the basis of criteria determined by the Independent Trustees for this purpose using data provided by Strategic Insight Mutual Fund Research and Consulting, LLC (Strategic Insight), an independent third party. The peer group comparisons referred to below are organized in quintiles. Each quintile represents one-fifth of the peer group. In all peer group comparisons referred to below, first quintile is most favorable to the Fund’s shareowners. The Trustees noted that they separately review and consider the impact of the Fund’s transfer agency and Fund- and APAM-paid expenses for sub-transfer agency and intermediary arrangements, and that the results of the most recent such review were considered in the consideration of the Fund’s expense ratio.
The Trustees considered that the Fund’s management fee for the most recent fiscal year was in the third quintile relative to the management fees paid by other funds in its Morningstar category for the comparable period. The Trustees also considered the breakpoints in the management fee schedule and the reduced fee rates above certain asset levels. The Trustees considered that the expense ratio of the Fund’s Class A shares for the most recent fiscal year was in the second quintile relative to its Strategic Insight peer group for the comparable period. The Trustees considered that the expense ratio of the Fund’s Class Y shares for the most recent fiscal year was in the fourth quintile relative to its Strategic Insight peer group for the comparable period.
Pioneer Multi-Asset Ultrashort Income Fund | Semiannual Report | 9/30/20 117
The Trustees reviewed management fees charged by APAM and APIAM to institutional and other clients, including publicly offered European funds sponsored by APAM’s affiliates, unaffiliated U.S. registered investment companies (in a sub-advisory capacity), and unaffiliated foreign and domestic separate accounts. The Trustees also considered APAM’s costs in providing services to the Fund and APAM’s and APIAM’s costs in providing services to the other clients and considered the differences in management fees and profit margins for fund and non-fund services. In evaluating the fees associated with APAM’s and APIAM’s client accounts, the Trustees took into account the respective demands, resources and complexity associated with the Fund and other client accounts. The Trustees noted that, in some instances, the fee rates for those clients were lower than the management fee for the Fund and considered that, under the investment management agreement with the Fund, APAM performs additional services for the Fund that it does not provide to those other clients or services that are broader in scope, including oversight of the Fund’s other service providers and activities related to compliance and the extensive regulatory and tax regimes to which the Fund is subject. The Trustees also considered the entrepreneurial risks associated with APAM’s management of the Fund.
The Trustees concluded that the management fee payable by the Fund to APAM was reasonable in relation to the nature and quality of the services provided by APAM.
Profitability
The Trustees considered information provided by APAM regarding the profitability of APAM with respect to the advisory services provided by APAM to the Fund, including the methodology used by APAM in allocating certain of its costs to the management of the Fund. The Trustees also considered APAM’s profit margin in connection with the overall operation of the Fund. They further reviewed the financial results, including the profit margins, realized by APAM and APIAM from non-fund businesses. The Trustees considered APAM’s profit margins in comparison to the limited industry data available and noted that the profitability of any adviser was affected by numerous factors, including its organizational structure and method for allocating expenses. The Trustees concluded that APAM’s profitability with respect to the management of the Fund was not unreasonable.
118 Pioneer Multi-Asset Ultrashort Income Fund | Semiannual Report | 9/30/20
Economies of Scale
The Trustees considered APAM’s views relating to economies of scale in connection with the Pioneer Funds as fund assets grow and the extent to which any such economies of scale are shared with the Fund and Fund shareholders. The Trustees noted the breakpoints in the management fee schedule. The Trustees recognize that economies of scale are difficult to identify and quantify, and that, among other factors that may be relevant, are the following: fee levels, expense subsidization, investment by APAM in research and analytical capabilities and APAM’s commitment and resource allocation to the Fund. The Trustees noted that profitability also may be an indicator of the availability of any economies of scale, although profitability may vary for other reasons including due to reductions in expenses. The Trustees concluded that economies of scale, if any, were being appropriately shared with the Fund.
Other Benefits
The Trustees considered the other benefits that APAM enjoys from its relationship with the Fund. The Trustees considered the character and amount of fees paid or to be paid by the Fund, other than under the investment management agreement, for services provided by APAM and its affiliates. The Trustees further considered the revenues and profitability of APAM’s businesses other than the Fund business. To the extent applicable, the Trustees also considered the benefits to the Fund and to APAM and its affiliates from the use of “soft” commission dollars generated by the Fund to pay for research and brokerage services.
The Trustees considered that Amundi is the principal U.S. asset management business of Amundi, which is one of the largest asset managers globally. Amundi’s worldwide asset management business manages over $1.7 trillion in assets (including the Pioneer Funds). The Trustees considered that APAM’s relationship with Amundi creates potential opportunities for APAM, APIAM and Amundi that derive from APAM’s relationships with the Fund, including Amundi’s ability to market the services of APAM globally. The Trustees noted that APAM has access to additional research and portfolio management capabilities as a result of its relationship with Amundi and Amundi’s enhanced global presence that may contribute to an increase in the resources available to APAM. The Trustees considered that APAM and the Fund receive reciprocal intangible benefits from the relationship, including mutual brand recognition and, for the Fund, direct and indirect access to the resources of a large global asset manager. The Trustees concluded that any such benefits received by APAM as a result of its relationship with the Fund were reasonable.
Pioneer Multi-Asset Ultrashort Income Fund | Semiannual Report | 9/30/20 119
Conclusion
After consideration of the factors described above as well as other factors, the Trustees, including the Independent Trustees, concluded that the investment management agreement for the Fund, including the fees payable thereunder, was fair and reasonable and voted to approve the proposed renewal of the investment management agreement.
120 Pioneer Multi-Asset Ultrashort Income Fund | Semiannual Report | 9/30/20
Trustees, Officers and Service Providers
| | |
| Trustees | Officers |
Thomas J. Perna, Chairman | Lisa M. Jones, President and |
John E. Baumgardner, Jr. | Chief Executive Officer |
Diane Durnin | Mark E. Bradley, Treasurer and |
Benjamin M. Friedman | Chief Financial and |
Lisa M. Jones | Accounting Officer |
Lorraine H. Monchak | Christopher J. Kelley, Secretary and |
Marguerite A. Piret | Chief Legal Officer |
Fred J. Ricciardi | |
Kenneth J. Taubes | |
Investment Adviser and Administrator
Amundi Pioneer Asset Management, Inc.
Custodian and Sub-Administrator
Brown Brothers Harriman & Co.
Principal Underwriter
Amundi Pioneer Distributor, Inc.
Legal Counsel
Morgan, Lewis & Bockius LLP
Transfer Agent
DST Asset Manager Solutions, Inc.
Proxy Voting Policies and Procedures of the Fund are available without charge, upon request, by calling our toll free number (1-800-225-6292). Information regarding how the Fund voted proxies relating to portfolio securities during the most recent 12-month period ended June 30 is publicly available to shareowners at www.amundipioneer.com/us. This information is also available on the Securities and Exchange Commission’s web site at www.sec.gov.
Pioneer Multi-Asset Ultrashort Income Fund | Semiannual Report | 9/30/20 121
This page was intentionally left blank.
122 Pioneer Multi-Asset Ultrashort Income Fund | Semiannual Report | 9/30/20
This page was intentionally left blank.
Pioneer Multi-Asset Ultrashort Income Fund | Semiannual Report | 9/30/20 123
This page was intentionally left blank.
124 Pioneer Multi-Asset Ultrashort Income Fund | Semiannual Report | 9/30/20
How to Contact Amundi
We are pleased to offer a variety of convenient ways for you to contact us for assistance or information.
| | | |
| Call us for: | | |
Account Information, including existing accounts, | |
new accounts, prospectuses, applications | |
and service forms | | 1-800-225-6292 |
| | | |
FactFoneSM for automated fund yields, prices, | |
account information and transactions | 1-800-225-4321 |
| | |
| Retirement plans information | 1-800-622-0176 |
|
| Write to us: | | |
Amundi | | |
P.O. Box 219427 | | |
Kansas City, MO 64121-9427 | | |
| | | |
| Our toll-free fax | | 1-800-225-4240 |
| | | |
| Our internet e-mail address | us.askamundipioneer@amundipioneer.com |
(for general questions about Amundi only) | |
|
| Visit our web site: www.amundipioneer.com/us | |
This report must be preceded or accompanied by a prospectus.
The Fund files a complete schedule of portfolio holdings with the Securities and Exchange Commission for the first and third quarters of each fiscal year as an exhibit to its reports on Form N-PORT. Shareholders may view the filed Form N-PORT by visiting the Commission’s web site at https://www.sec.gov.
Amundi Pioneer Asset Management, Inc.
60 State Street
Boston, MA 02109
www.amundipioneer.com/us
Securities offered through Amundi Pioneer Funds Distributor, Inc.
60 State Street, Boston, MA 02109
Underwriter of Pioneer Mutual Funds, Member SIPC
© 2020 Amundi Pioneer Asset Management 25249-09-1120