Exhibit 99.1
CENTER FINANCIAL
CORPORATION
11th Annual Financial Services Conference
May 7, 2009
Safe Harbor
During the course of this presentation, the Company may make or present forward-looking statements. These forward-looking statements may be subject to the safe-harbor provisions of the Private Securities Litigation Reform Act of 1995. Such statements, including statements related to the Company’s growth, market position and future performance are predictions based on factors as currently known to the Company. Actual events or results may differ materially. You are referred to the documents the Company files from time to time with the U.S. Securities and Exchange Commission, which review the risks and uncertainties that could cause actual results to differ materially from those contained in the Company’s projections or forward-looking statements. The historical results achieved by the company are not necessarily indicative of its future prospects. The Company undertakes no obligation to publicly update or revise any forward-looking statements, whether as a result of new information, future events or otherwise.
2
Corporate Profile
23 years of service as strong commercial franchise
Leading provider of business-oriented products & services
Recipient of the SBA’s 2006 Excellence in Lending Award
20 offices across the nation
19 full-service branches in Southern California, Seattle, Chicago
One loan production office (LPO) in Seattle
Total assets of $2.09 billion (at 3/31/09)
Headquartered in Los Angeles
Largest Korean concentration outside Republic of Korea
3
Community Business Bank
Core customer base
Small to middle-market closely held businesses
Professional associations
Korean-American and other ethnic niche groups
Centered around relationship banking philosophy Areas of expertise
International trade finance
SBA lending
Cash management services
4 |
|
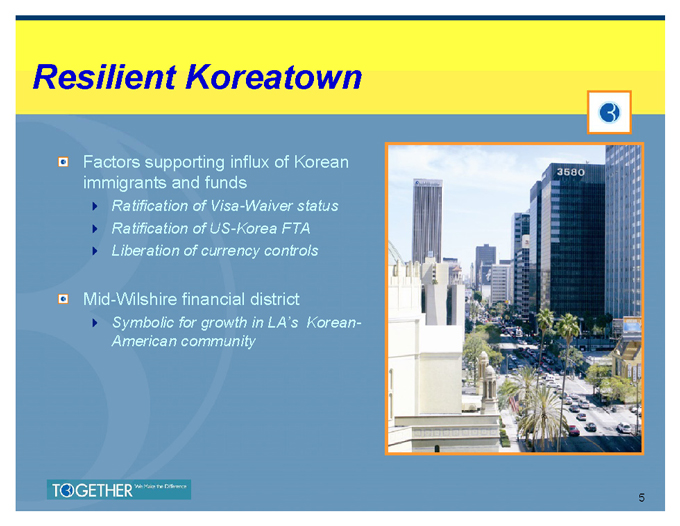
Resilient Koreatown
Factors supporting influx of Korean immigrants and funds
Ratification of Visa-Waiver status
Ratification of US-Korea FTA
Liberation of currency controls
Mid-Wilshire financial district
Symbolic for growth in LA’s Korean-American community
5
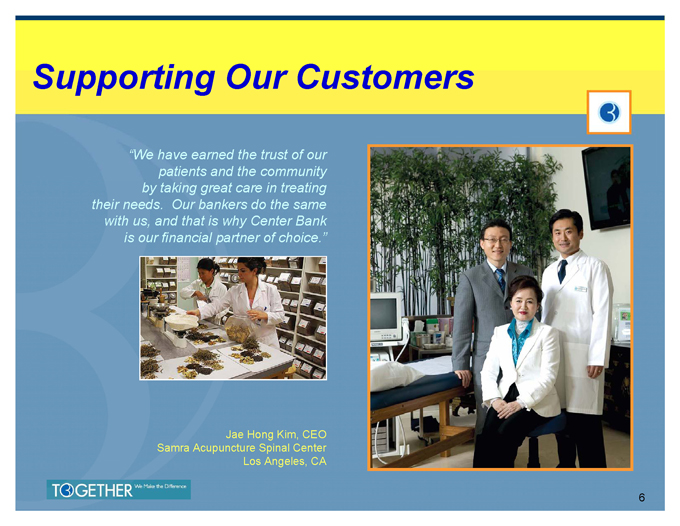
Supporting Our Customers
“We have earned the trust of our patients and the community by taking great care in treating their needs. Our bankers do the same with us, and that is why Center Bank is our financial partner of choice.”
Jae Hong Kim, CEO Samra Acupuncture Spinal Center Los Angeles, CA
6
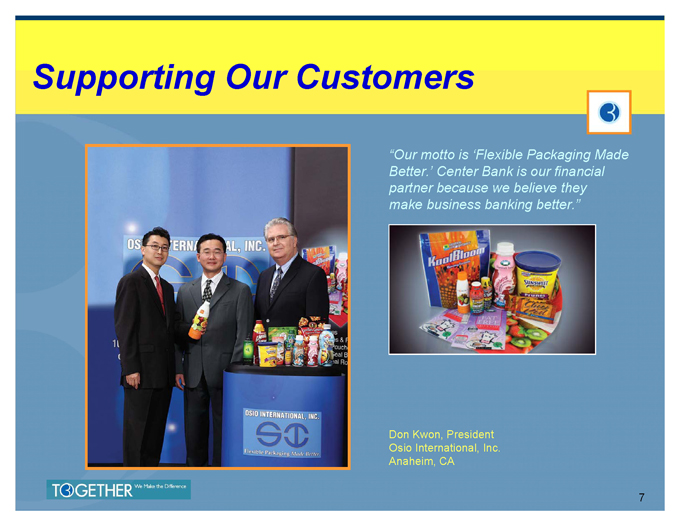
Supporting Our Customers
“Our motto is ‘Flexible Packaging Made Better.’ Center Bank is our financial partner because we believe they make business banking better.”
Don Kwon, President Osio International, Inc. Anaheim, CA
7

Supporting Our Customers
“We are a strong organization:
Think again. Think Hyundai.
We need a strong financial
partner like Center Bank
to support our growth long term.”
John Lim, President
Hyundai Construction
Equipment U.S.A., Inc.
Elk Grove Village, IL
8
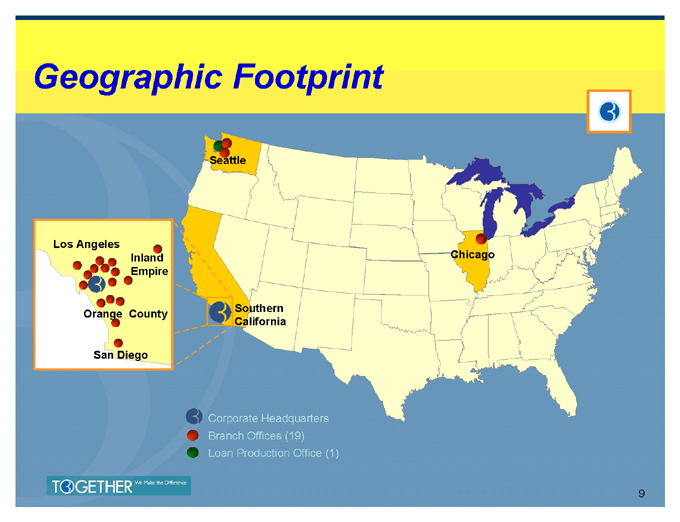
Geographic Footprint
Seattle
Los Angeles Chicago Inland Empire
Southern Orange County California
San Diego
Corporate Headquarters Branch Offices (19) Loan Production Office (1)
9
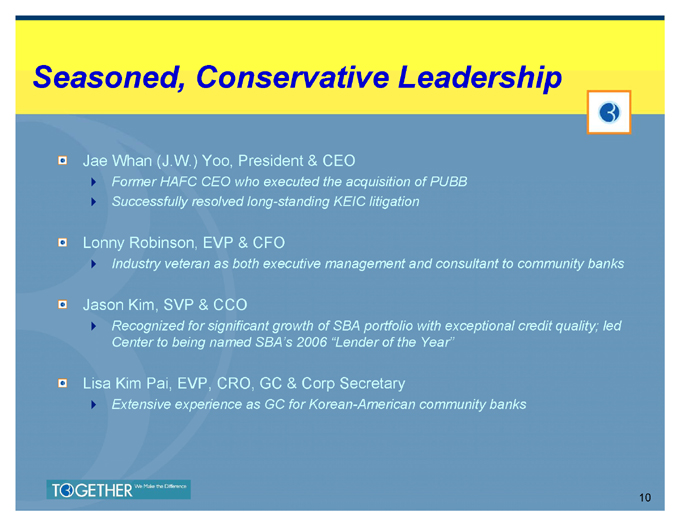
Seasoned, Conservative Leadership
Jae Whan (J.W.) Yoo, President & CEO
Former HAFC CEO who executed the acquisition of PUBB
Successfully resolved long-standing KEIC litigation
Lonny Robinson, EVP & CFO
Industry veteran as both executive management and consultant to community banks
Jason Kim, SVP & CCO
Recognized for significant growth of SBA portfolio with exceptional credit quality; led Center to being named SBA’s 2006 “Lender of the Year”
Lisa Kim Pai, EVP, CRO, GC & Corp Secretary
Extensive experience as GC for Korean-American community banks
10
Strategic Management Initiatives
Enhance operational efficiencies Deleverage balance sheet Reduce potential credit risk Maintain solid capital position Increase liquidity
11
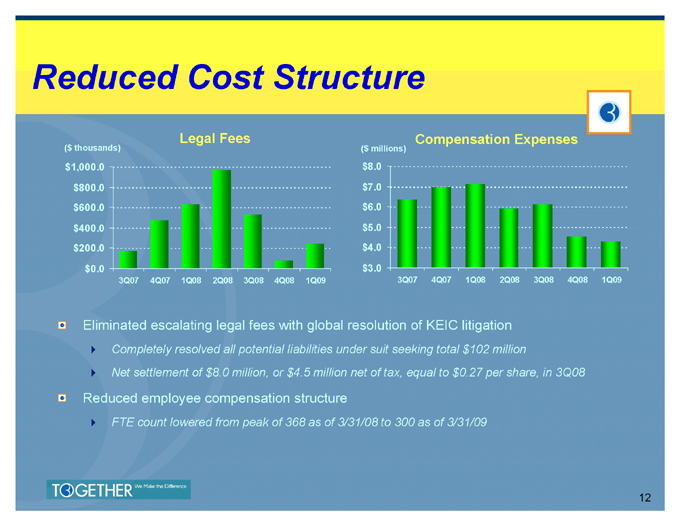
Reduced Cost Structure
($ thousands) Legal Fees Compensation Expenses
($ millions) $1,000.0 $8.0 $800.0 $7.0 $600.0 $6.0 $400.0 $5.0 $200.0 $4.0 $0.0 $3.0
3Q07 4Q07 1Q08 2Q08 3Q08 4Q08 1Q09 3Q07 4Q07 1Q08 2Q08 3Q08 4Q08 1Q09
Eliminated escalating legal fees with global resolution of KEIC litigation
Completely resolved all potential liabilities under suit seeking total $102 million
Net settlement of $8.0 million, or $4.5 million net of tax, equal to $0.27 per share, in 3Q08
Reduced employee compensation structure
FTE count lowered from peak of 368 as of 3/31/08 to 300 as of 3/31/09
12
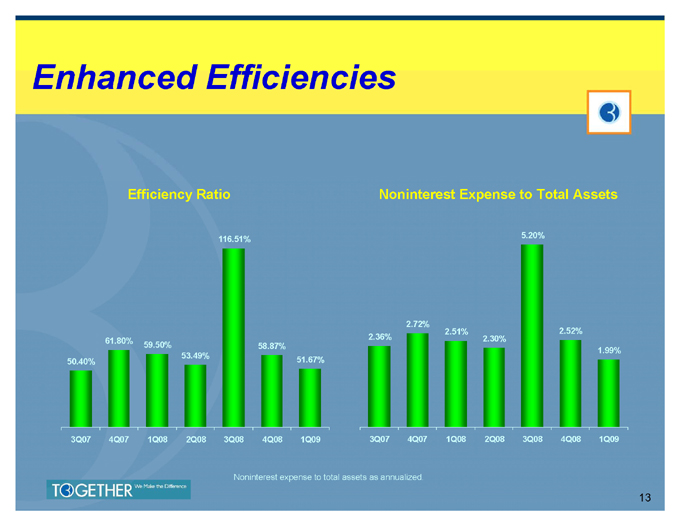
Enhanced Efficiencies
Efficiency Ratio Noninterest Expense to Total Assets
5.20% 116.51%
2.72%
2.51% 2.52% 2.36% 2.30%
61.80%
59.50% 58.87%
1.99%
53.49%
50.40% 51.67%
3Q07 4Q07 1Q08 2Q08 3Q08 4Q08 1Q09 3Q07 4Q07 1Q08 2Q08 3Q08 4Q08 1Q09
Noninterest expense to total assets as annualized.
13
Deleveraged Balance Sheet
Commenced deleveraging strategy at the close of 1Q08
Planned sales of approximately $100 million in loans
Reduce CRE portfolio
Mitigate growing fixed-rate concentration
Forfeit unprofitable growth
Focus on strengthening balance sheet in anticipation of weakening economy
14
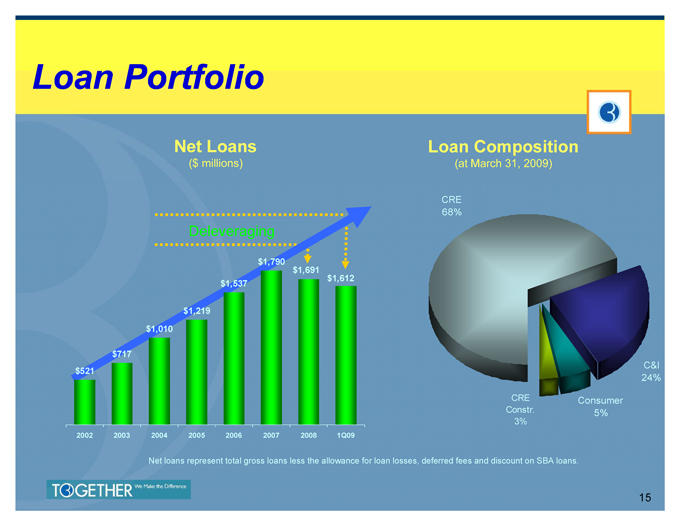
Loan Portfolio
Net Loans Loan Composition
($ millions) (at March 31, 2009)
CRE 68%
Deleveraging
$1,790 $1,691 $1,612 $1,537
$1,219 $1,010
$717
C&I $521
24%
CRE Consumer Constr. 5% 3%
2002 2003 2004 2005 2006 2007 2008 1Q09
Net loans represent total gross loans less the allowance for loan losses, deferred fees and discount on SBA loans.
15
Conservative Credit Management
Stringent underwriting guidelines Proactive loan portfolio management
Semi-annual external loan review Annual internal stress testing
16
Vigilance to Credit Quality
Fully understanding the market
Extensive management experience directly in marketplace
Balancing marketing and credit quality Investing in resources
Credit Administration Department
Review and Monitoring Team
Semi-annual external loan review Ongoing credit training
Stringent underwriting standards and guidelines
17

Stringent Underwriting Standards
Commercial Real Estate: Commercial Loans & Lines:
Loan-to-value ratio 65% Detailed cash flow analysis Minimum debt coverage ratio in Evaluate trade cycle, analyze excess of 125% industry and performance Stricter guidelines for cash-out projections refinancing Other key considerations Sensitivity analysis ` Credit history, experience, Other key considerations financial analysis, terms & conditions and others
Customary personal guarantees
Credit history, experience, collateral, terms & conditions and others
18
Mounting Headwinds
Historical low interest rates Declining equity values Higher FDIC premiums
Weakening economy – significant deterioration from 4Q08
19
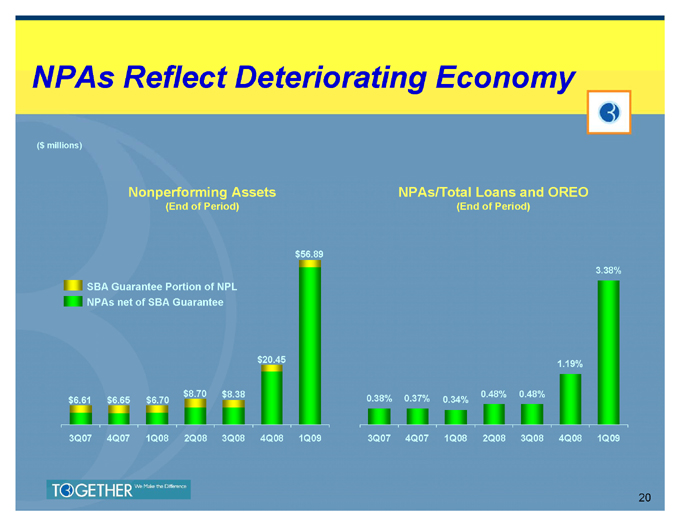
NPAs Reflect Deteriorating Economy
($ millions)
Nonperforming Assets NPAs/Total Loans and OREO
(End of Period) (End of Period)
$56.89
3.38% SBA Guarantee Portion of NPL
NPAs net of SBA Guarantee
$20.45 1.19%
$8.70 $8.38 0.48% 0.48% $6.61 $6.65 $6.70 0.38% 0.37% 0.34%
3Q07 4Q07 1Q08 2Q08 3Q08 4Q08 1Q09 3Q07 4Q07 1Q08 2Q08 3Q08 4Q08 1Q09
20
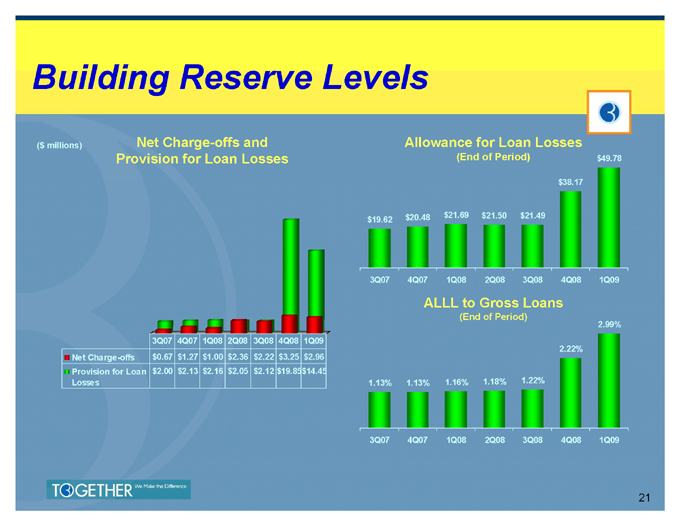
Building Reserve Levels
($ millions) Net Charge-offs and Allowance for Loan Losses Provision for Loan Losses (End of Period) $49.78
$38.17
$20.48 $21.69 $21.50 $21.49 $19.62
3Q07 4Q07 1Q08 2Q08 3Q08 4Q08 1Q09
ALLL to Gross Loans
(End of Period) 2.99% 3Q07 4Q07 1Q08 2Q08 3Q08 4Q08 1Q09 2.22% Net Charge-offs $0.67 $1.27 $1.00 $2.36 $2.22 $3.25 $2.96 Provision for Loan $2.00 $2.13 $2.16 $2.05 $2.12 $19.85 $14.45 Losses 1.13% 1.13% 1.16% 1.18% 1.22%
3Q07 4Q07 1Q08 2Q08 3Q08 4Q08 1Q09
21
Tightened FAS 5 Reserve Methodology
Heightened risk ratios for special mention and substandard credits Shortened loss experience evaluation period
` Better reflects current portfolio stresses and recent losses
Designed to more adequately assess true directional
consistency – given severity and swiftness of economic deterioration
22
Heightened Credit Risk Management
Asset quality task force
` Proactive executive management involvement
` Bi-weekly review of delinquent loans greater than $500,000
` Action plan initiated from day one of delinquency
Internal stress testing mechanisms
` Deployment of new software enabling more regular testing
` Capital burn down analysis assuming significant CRE devaluation
Minimizing portfolio risk
` Strategic sales and run-off of construction and CRE portfolios
` Revitalize SBA lending pipeline
• Allows for growth with minimal risk given 90% guarantee
• Low levels of loan loss provision needed
23
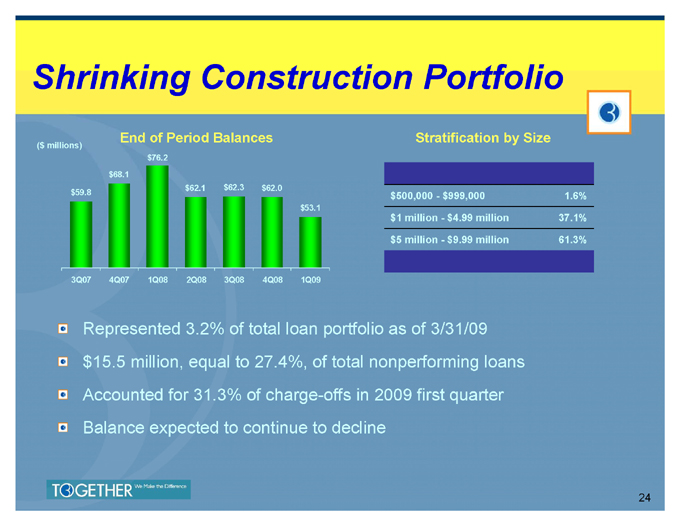
Shrinking Construction Portfolio
End of Period Balances Stratification by Size
($ millions) $76.2 $68.1 $62.1 $62.3 $62.0
$59.8 $500,000—$999,000 1.6%
$53.1
$1 million—$4.99 million 37.1%
$5 million—$9.99 million 61.3%
3Q07 4Q07 1Q08 2Q08 3Q08 4Q08 1Q09
Represented 3.2% of total loan portfolio as of 3/31/09 $15.5 million, equal to 27.4%, of total nonperforming loans Accounted for 31.3% of charge-offs in 2009 first quarter Balance expected to continue to decline
24
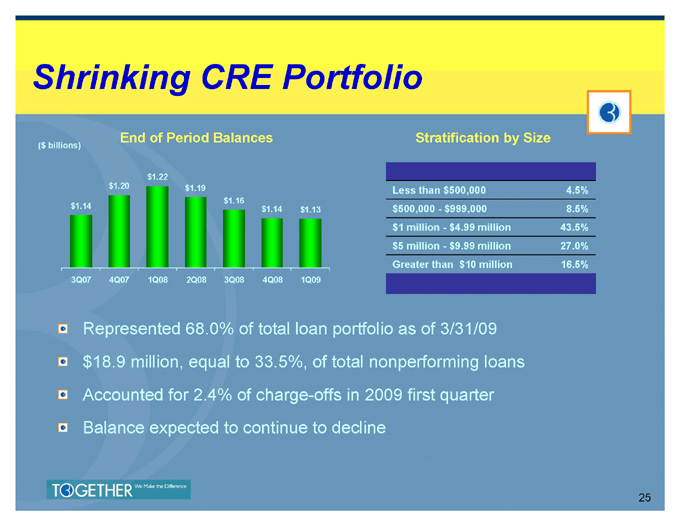
Shrinking CRE Portfolio
End of Period Balances Stratification by Size
($ billions)
$1.22
$1.20 $1.19 Less than $500,000 4.5%
$1.16
$1.14 $1.14 $500,000—$999,000 8.5%
$1.13
$1 million—$4.99 million 43.5% $5 million—$9.99 million 27.0% Greater than $10 million 16.5%
3Q07 4Q07 1Q08 2Q08 3Q08 4Q08 1Q09
Represented 68.0% of total loan portfolio as of 3/31/09 $18.9 million, equal to 33.5%, of total nonperforming loans Accounted for 2.4% of charge-offs in 2009 first quarter Balance expected to continue to decline
25
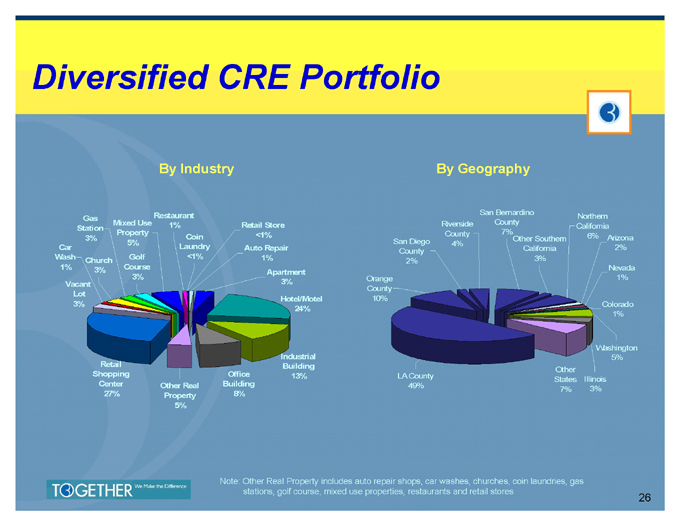
Diversified CRE Portfolio
By Industry By Geography
Restaurant San Bernardino
Gas Northern
Mixed Use 1% Retail Store Riverside County
Station California
Property <1% County 7%
3% Coin Other Southern 6% Arizona
5% San Diego 4%
Car Laundry Auto Repair California 2% County
Wash Golf <1% 1% 3% Church 2%
1% 3% Course Nevada Apartment
3% Orange 1%
Vacant 3% County Lot Hotel/Motel 10%
3% Colorado
24%
1%
Washington
Industrial 5% Retail Building
Other
Shopping Office 13% LA County
States Illinois
Center Other Real Building 49%
7% 3%
27% Property 8% 5%
Note: Other Real Property includes auto repair shops, car washes, churches, coin laundries, gas stations, golf course, mixed use properties, restaurants and retail stores
26
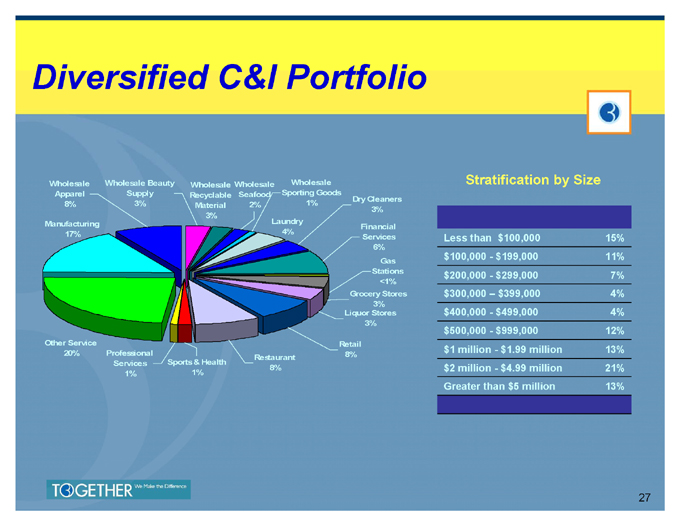
Diversified C&I Portfolio
Wholesale Wholesale Beauty Wholesale Wholesale Wholesale Stratification by Size Apparel Supply Recyclable Seafood Sporting Goods Dry Cleaners
8% 3% Material 2% 1%
3% 3% Manufacturing Laundry Financial 17% 4%
Services Less than $100,000 15% 6% $100,000—$199,000 11% Gas Stations $200,000—$299,000 7% <1% Grocery Stores $300,000 – $399,000 4%
3% $400,000—$499,000 4% Liquor Stores 3% $500,000—$999,000 12% Other Service Retail 20% Professional $1 million—$1.99 million 13% Restaurant 8% Services Sports & Health
8% $2 million—$4.99 million 21%
1% 1%
Greater than $5 million 13%
27
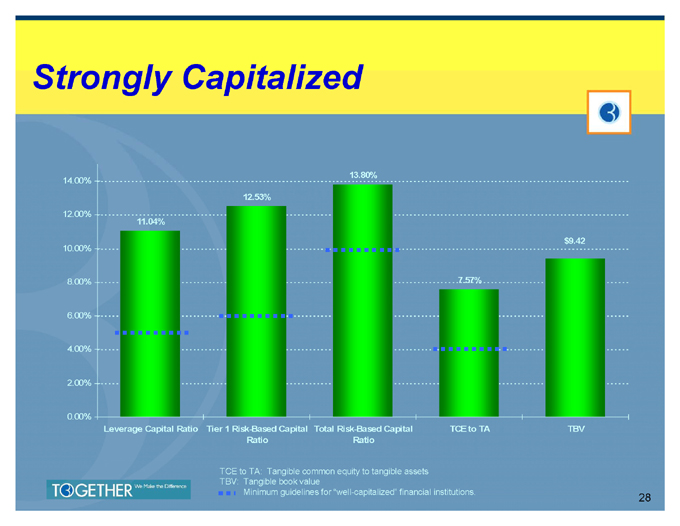
Strongly Capitalized
13.80%
14.00%
12.53%
12.00% 11.04%
10.00% $9.42 8.00% 7.57%
6.00%
4.00%
2.00%
0.00%
Leverage Capital Ratio Tier 1 Risk-Based Capital Total Risk-Based Capital TCE to TA TBV Ratio Ratio
TCE to TA: Tangible common equity to tangible assets TBV: Tangible book value
Minimum guidelines for “well-capitalized” financial institutions.
28
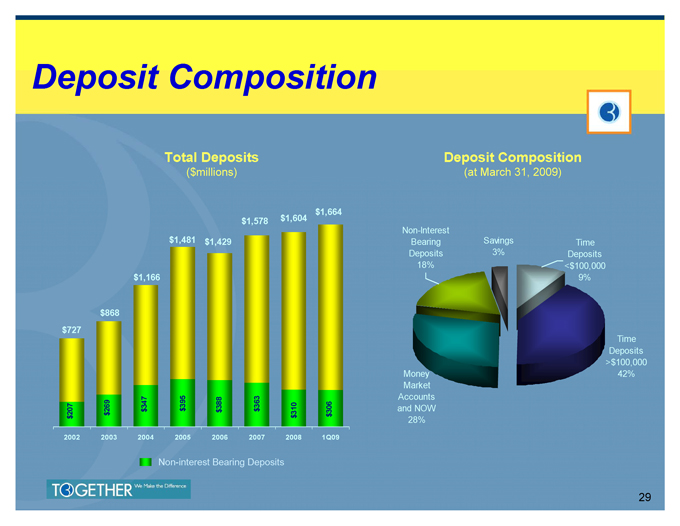
Deposit Composition
Total Deposits Deposit Composition
($millions) (at March 31, 2009)
$1,664 $1,578 $1,604
Non-Interest $1,481 $1,429 Bearing Savings Time Deposits 3% Deposits 18% <$100,000 $1,166 9%
$868 $727
Time Deposits
>$100,000 Money 42% Market 395 363 Accounts 347 388 and NOW
207 269 $ $ $ $ $ 310 306 $ $ $ 28% 2002 2003 2004 2005 2006 2007 2008 1Q09
Non-interest Bearing Deposits
29
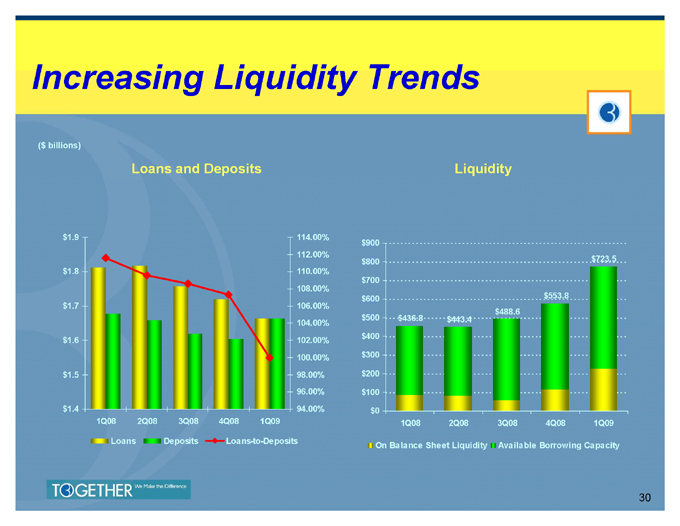
Increasing Liquidity Trends
($ billions)
Loans and Deposits Liquidity
$1.9 114.00% $900 112.00% $800 $723.5 $1.8 110.00% $700 108.00% $600 $553.8 $1.7 106.00% $488.6 $500 $436.8 $443.4 104.00% $400 $1.6 102.00% 100.00% $300 $1.5 98.00% $200
96.00% $100 $1.4 94.00% $0
1Q08 2Q08 3Q08 4Q08 1Q09 1Q08 2Q08 3Q08 4Q08 1Q09 Loans Deposits Loans-to-Deposits On Balance Sheet Liquidity Available Borrowing Capacity
30
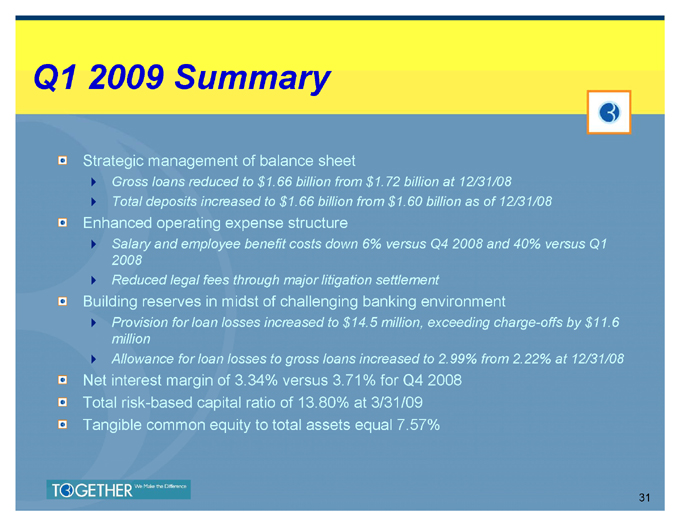
Q1 2009 Summary
Strategic management of balance sheet
` Gross loans reduced to $1.66 billion from $1.72 billion at 12/31/08
` Total deposits increased to $1.66 billion from $1.60 billion as of 12/31/08
Enhanced operating expense structure
` Salary and employee benefit costs down 6% versus Q4 2008 and 40% versus Q1 2008
` Reduced legal fees through major litigation settlement
Building reserves in midst of challenging banking environment
` Provision for loan losses increased to $14.5 million, exceeding charge-offs by $11.6 million
` Allowance for loan losses to gross loans increased to 2.99% from 2.22% at 12/31/08
Net interest margin of 3.34% versus 3.71% for Q4 2008 Total risk-based capital ratio of 13.80% at 3/31/09 Tangible common equity to total assets equal 7.57%
31
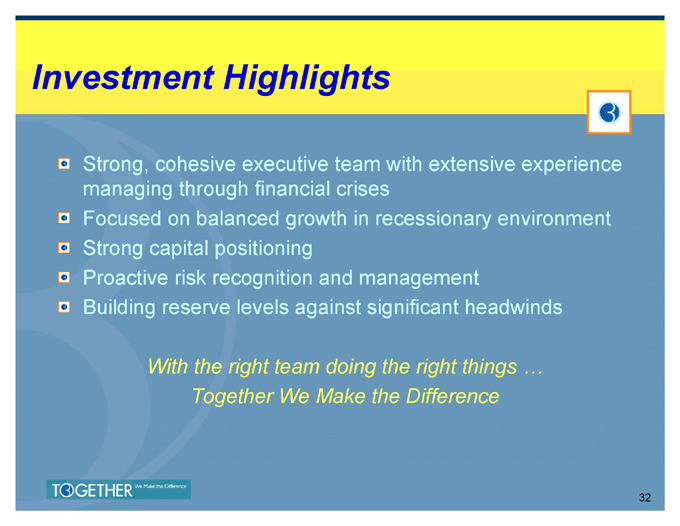
Investment Highlights
Strong, cohesive executive team with extensive experience managing through financial crises Focused on balanced growth in recessionary environment Strong capital positioning Proactive risk recognition and management Building reserve levels against significant headwinds
With the right team doing the right things … Together We Make the Difference
32
33