UNITED STATES
SECURITIES AND EXCHANGE COMMISSION
Washington, D.C. 20549
FORM 10-K
(Mark One)
| x | ANNUAL REPORT PURSUANT TO SECTION 13 OR 15(d) OF THE SECURITIES EXCHANGE ACT OF 1934 |
For the fiscal year ended December 31, 2005
Or
| ¨ | TRANSITION REPORT PURSUANT TO SECTION 13 OR 15(d) OF THE SECURITIES EXCHANGE ACT OF 1934 |
For the transition period from to
Commission File Number: 333-90436
AMERICAN SEAFOODS GROUP LLC
(Exact name of registrant as specified in its charter)
| | |
| Delaware | | 22-3702647 |
(State or other jurisdiction of incorporation or organization) | | (I.R.S. Employer Identification No.) |
| |
Market Place Tower 2025 First Avenue Suite 900 Seattle, Washington 98121 | | 98121 |
| (Address of principal executive offices) | | (Zip Code) |
Registrant’s telephone number, including the area code
(206) 374-1515
Securities registered pursuant to Section 12(b) of the Act: None
Securities registered pursuant to Section 12(g) of the Act: None
Indicate by check mark if the registrant is well-known seasoned issuer, as defined by Rule 405 of the Securities act Yes ¨ No x
Indicate by check mark if the registrant is not required to file reports pursuant to Section 13 or Section 15(d) of the Act. Yes x No ¨
Indicate by check mark whether the registrant (1) has filed all reports required to be filed by Section 13 or 15(d) of the Securities Exchange Act of 1934 during the preceding 12 months (or for such shorter period that the registrant was required to file such reports), and (2) has been subject to such filing requirements for the past 90 days. Yes x No ¨
Indicate by check mark if disclosure of delinquent filers pursuant to Item 405 of Regulation S-K is not contained herein, and will not be contained, to the best of the registrant’s knowledge in definitive proxy or information statements incorporated by reference in Part III of this Form 10-K or any amendment to this Form 10-K. x
Indicate by check mark whether the registrant is a large accelerated filer, accelerated filer, or non-accelerated filer. See definition of “accelerated filer and large accelerated filer” in Rule 12b-2 of the Exchange Act.
| | | | |
Large Accelerated filer ¨ | | Accelerated filer ¨ | | Non-accelerated filer x |
Indicate by check mark whether the registrant is a shell company (as defined in Rule 12b-2 of the Act). Yes ¨ No x
The registrant does not have a class of equity securities registered pursuant to Section 12 of the Securities Exchange Act of 1934 and there is no public market for the voting stock of the registrant.
DOCUMENTS INCORPORATED BY REFERENCE: None
TABLE OF CONTENTS
2
CAUTIONARY STATEMENT REGARDING FORWARD-LOOKING STATEMENTS
This annual report includes forward-looking statements within the meaning of Section 21E of the Securities and Exchange Act of 1934. All statements other than statements of historical fact are “forward-looking statements.” Some of the statements under “Item 1—Business,” “Item 1A—Risk Factors”, “Item 7—Management’s Discussion and Analysis of Financial Condition and Results of Operations,” and elsewhere in this annual report may include forward-looking statements that reflect our current views with respect to future events and financial performance. Statements that include the words “may,” “estimate,” “continue,” “expect,” “intend,” “plan,” “believe,” “project,” “anticipate” and similar statements of a forward-looking nature identify forward-looking statements.
Although we believe that the expectations reflected in our forward-looking statements are reasonable, all forward-looking statements address matters that involve risks and uncertainties. Accordingly, there are or will be important factors that could cause actual results to differ materially from those indicated in these statements. We believe that these factors include the following:
| | • | | our high degree of leverage and significant debt service obligations; |
| | • | | any future changes in government regulation; |
| | • | | the highly competitive nature of the seafood industry; |
| | • | | the risk of a significant decline in the market price of our products; |
| | • | | the risk of a significant decline in the population and biomass of pollock, other groundfish and catfish stocks in the fisheries in which we operate; |
| | • | | the risk that prices at which we purchase catfish remain at high levels or increase; |
| | • | | environmental conditions and regulations; |
| | • | | the risk of increased litigation against us; |
| | • | | the risk of a natural calamity affecting the U.S. Bering Sea or any of our vessels; |
| | • | | the risk of foreign currency fluctuations; and |
| | • | | other risks that impair our access to and ability to harvest pollock and other whitefish. |
We undertake no obligation to publicly update or review any forward-looking statement, whether as a result of new information, future developments or otherwise.
3
PART I
Item 1.Business
Unless the context otherwise requires, references to “we,” “us,” “ASG” and “our” refer to American Seafoods Group LLC and its consolidated subsidiaries.
Overview
We are one of the largest integrated seafood companies in the U.S. in terms of revenues. We harvest and process a variety of fish species aboard our sophisticated catcher-processor vessels, our freezer-longliner vessels and at our land-based processing facilities. We market our products to a diverse group of customers in North America, Asia and Europe. In the U.S., we are the largest harvester and at-sea processor of pollock and Pacific whiting and the largest processor of catfish. Pollock is the world’s highest-volume whitefish harvested for human consumption and accounts for a majority of our revenues. In the U.S., catfish is the basis for a large, commercial aquaculture industry serving major U.S. markets, and according to the Food and Agriculture Organization of the United Nations, or FAO, catfish accounted for approximately 55% of the value of all aquaculture in the U.S. in 2003. In addition, we harvest and/or process additional seafood, including cod, Pacific whiting, scallops and yellowfin sole. We maintain an international marketing network through our U.S., Japan and European offices and have developed long-term relationships with our U.S. and international customer base.
We operate in two principal operating segments, at-sea processing and land-based processing. The at-sea processing segment includes the harvesting and processing of pollock, cod, Pacific whiting and yellowfin sole on our vessels while at sea. The land-based processing segment includes the processing of pollock, cod, catfish and scallops at our facilities in Alabama and Massachusetts.
We own and operate a premier modern fleet of seven catcher-processor vessels, which average over 300 feet in length and carry crews of 90 to 125 persons. Our catcher-processors are capable of producing between 110 and 150 metric tons of frozen finished product daily. We produce a variety of products at sea, such as pollock roe (fish eggs), surimi (a fish protein paste used in products such as imitation lobster and crabmeat), fillet blocks, headed and gutted fish and fishmeal.
We own and operate three freezer-longliners, ranging in length from approximately 125 to 140 feet. These vessels carry an average of 20 crew members and operate in the U.S. Bering Sea/Aleutian Islands Pacific cod fishery, producing headed and gutted cod sold primarily in the European, Asian and North American markets. During 2005, we acquired a catcher vessel,Forum Star, that primarily operates in the cod trawl fishery.
We harvest pollock primarily in the U.S. Bering Sea pollock fishery. According to the Marine Conservation Alliance, this fishery is among the largest and most conservatively managed in the world. In 2004, the Marine Stewardship Council, or MSC, completed a comprehensive four year review of the U.S. Bering Sea pollock fishery and concluded that this fishery met the rigorous MSC criteria as a responsible and sustainably managed fishery. We benefit from the favorable regulatory system that governs pollock fishing in these waters. Under U.S. federal law, the fishery is subject to total allowable catch limitations, quota allocations among the different sectors of participants in the fishery, and rules that give exclusive harvesting rights to specifically identified vessels, with the result that any potential new competitors face significant barriers to entry. We own and operate seven of the 19 catcher-processor vessels permitted to participate in the catcher-processor sector of the fishery. Under the American Fisheries Act, this sector is allocated 40% of the annual directed pollock catch (with 3.4% being allocated to catcher-vessels that deliver to the catcher-processors) and, by the terms of the Pollock Conservation Cooperative agreement, a contractual arrangement among the seven companies that own the catcher-processors named in the statute, this percentage is further divided and allocated among the Cooperative members. Within the catcher-processor sector, our allocation for pollock under the Cooperative agreement is nearly 2.5 times larger than that of the second largest Cooperative member.
4
The U.S. Pacific cod fishery is subject to total allowable catch limitations and quota allocation among the three primary sectors of participants in the fishery: community development quota groups, the fixed gear and the trawl sectors. We participate in the trawl sector with our catcher-processors and one catcher vessel and participate in the fixed gear sector with our freezer-longliners. Of the total quota, 51% is allocated to the fixed gear sector and of that portion, 80% is allocated to the freezer-longliners. A license buyback program is in process, which is expected to reduce the number of licenses available to freezer-longliners once the program concludes. Further efforts to rationalize the cod fishery, such as implementing individual quotas, are currently in process. In 2006, the MSC certified the U.S. Bering Sea/Aleutian Islands Pacific cod fishery as a sustainable managed fishery.
We own and operate two catfish processing facilities in Alabama. We purchase catfish from local farmers and do not own any of the catfish farms. We are not controlled by or affiliated with catfish farmers or their co-operatives. We distribute fresh and frozen catfish products to both retailers and foodservice customers throughout several regions in the U.S. In addition, we conduct land-based processing operations at our facility in Massachusetts, where we manufacture products such as breaded seafood portions, fillets and scallops. We distribute these fresh and frozen seafood products to retailers and foodservice customers throughout the U.S.
Corporate History
On January 28, 2000, American Seafoods, L.P. (ASLP) purchased from Norway Seafoods six catcher-processors, one catcher-vessel, all of the outstanding stock of American Seafoods Company (now referred to as “ASC, Inc.”) and certain assets of Frionor USA (now called “American Seafoods International LLC”). ASC, Inc. was the operator of six of the seven acquired vessels and the owner-operator of one additional catcher-processor vessel. The acquisition was accounted for as a purchase, and all of the debt, assets and goodwill and other intangible assets relating to the acquisition have been “pushed down” to our balance sheet.
In August 2001, we, along with two other partners, formed Pacific Longline Company (PLC) in order to acquire three freezer-longliner vessels. In January 2004, we acquired 100% of the ownership of PLC. PLC harvests and processes primarily Pacific cod in the U.S. Bering Sea.
Effective December 16, 2002, we purchased substantially all of the assets of Southern Pride Catfish Company (now known as “Southern Pride Catfish LLC”). Southern Pride Catfish LLC and its subsidiary, Southern Pride Catfish Trucking, Inc., (collectively, Southern Pride) are engaged in the business of catfish harvesting, processing and distribution. The acquired assets included, among other things, certain real property, fixtures, equipment, accounts receivable, trade name, customer and other contracts, and cash on hand.
In August 2005, we acquired a catcher vessel and related fishing rights from Forum Star, Inc. for an aggregate purchase price of $10.8 million.
On February 27, 2006, ASLP Acquisition LLC, a new company controlled by Bernt O. Bodal, our Chairman and Chief Executive Officer, Coastal Villages Pollock LLC (CVP), one of ASLP’s existing equity holders, and other entities controlled by Bodal or CVP, purchased from Centre Partners and its affiliated funds (Centre), all of Centre’s direct and indirect ownership of partnership interests in ASLP. The aggregate purchase price for Centre’s partnership interests was $81.8 million. ASLP Acquisition LLC and CVP also purchased partnership interests from ASLP partners who had rights to “tag-along” with Centre’s sale. The aggregate purchase price paid to these partners was $34.9 million. ASLP Acquisition LLC owns 20.1% of ASLP.
5
Business Strategy
Over the past decade, we have become one of the largest integrated seafood companies in the U.S. Today, we are committed to building on our existing harvesting, processing and marketing platforms.
The primary components of our business strategy include the following:
Maximize Pollock Revenues
Our pollock harvesting and at-sea processing operations provide a majority of our revenues. Our strategy to maximize pollock revenues includes:
| | • | | Maximize access to pollock resources. Over the last five years, we have increased the share of the total allowable catch we are allowed to harvest in the U.S. Bering Sea pollock fishery by approximately 22%, largely through increasing our purchases of community development quota from Alaska Community Development Groups. Between 1999 and 2005 our purchase of community development quota increased from 5.0% to 54.0% of the total community development quota. We will continue working to maximize our share of the total allowable catch within the applicable regulatory framework. |
| | • | | Optimize product mix to maximize profitability. We will continue our efforts to maximize revenues by optimizing product mix based on global demand and pricing. Each of our vessels is staffed with production managers who coordinate continuously with our marketing department to schedule production between blocks and surimi to optimize product mix and maximize our profitability. |
Continue to Diversify Sources of Revenues
We generate most of our revenues from at-sea processing, primarily comprised of pollock-based products. In addition, we participate in a number of other fisheries, such as the cod, Pacific whiting, and yellowfin sole fisheries. We plan to continue expanding our operations in these and other fisheries, especially within the yellowfin sole fishery, where the market has improved and three of our vessels have extensive catch history. With our Southern Pride and Pacific Longline Company acquisitions, we became both the largest catfish processor in the U.S. and a participant in the freezer-longliner sector of the U.S. Bering Sea Pacific cod fishery and, therefore, have significant market positions in pollock, catfish and cod, the top three whitefish species in terms of U.S. human consumption. In addition, we have state of the art processing facilities to produce scallops, a market we entered into in 2001.
Leverage International Marketing Network
We are currently expanding our presence in worldwide seafood markets, with a particular focus on the Asian and European markets, to increase and diversify our customer base and global seafood market share. We have expanded our Japanese office in an effort to increase direct distribution to end-users and to gain an entryway into growing markets such as South Korea and China. We expect that, over time, increasing local market presence in Asia will help maintain price stability through long-term contracts, improve production planning, strengthen customer relationships and provide us with marketing and sales advantages. Additionally, we believe that a strong local market presence will provide us with an opportunity to introduce new species and product forms into the Asian market and enhance relationships with distributors in Japan. We have a sales office in Denmark to serve the growing European market for pollock block, which in the past has been supplied primarily with Russian pollock. We believe that our access to pollock resources in the U.S. Bering Sea pollock fishery provides us with a competitive advantage in implementing our strategy to increase our presence in Europe.
Pursue Strategic Acquisitions
We intend to evaluate and selectively pursue accretive opportunities that we believe are strategically important based on their potential to diversify our product and customer base, broaden our distribution network and increase our cash flow.
6
Industry and Regulatory Overview
According to the FAO, the worldwide production of seafood, excluding aquatic plants, has increased steadily at a compounded annual growth rate of approximately 2.3% from approximately 105 million metric tons in 1993 to approximately 132 million metric tons in 2003 and is projected to increase slightly from 2004 to 2010, resulting in large part from increasing world population and continued economic growth in developing countries. In 2003, the supply provided by marine and inland fisheries, or capture fisheries, accounted for approximately 90.2 million metric tons, or approximately 68% of that amount. Worldwide seafood production of capture fish has remained stable in recent years. The growth in worldwide seafood production is primarily related to increased fish farming, or aquaculture. From 1990 to 2003, the amount of seafood produced in aquaculture worldwide grew at a compounded annual growth rate of approximately 9% from approximately 13.1 million metric tons to approximately 41.7 million metric tons.
Due to its higher cost per ton of fish produced, aquaculture is used primarily to produce higher value fish species such as catfish and salmon. Aquaculture is not a cost effective alternative for lower value fish species such as pollock or Pacific whiting.
Capture Fisheries
The following chart provides a brief overview of the different categories of fish caught in the wild for human consumption and use in 2004, including the different species of groundfish which we harvest. The table indicates the percentage each species represents of the volume of each category harvested from capture fisheries.
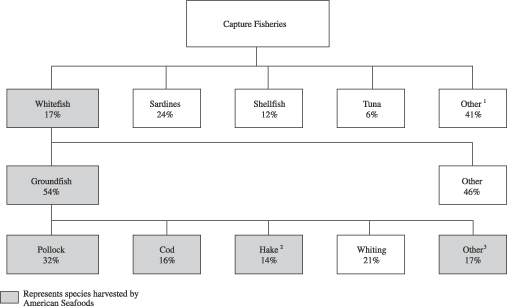
| 1 | Represents species each accounting for less than 5% of the volume of finished products produced from capture fisheries. |
| 2 | Pacific whiting is the only species we harvest in this category. |
| 3 | Yellowfin sole is the only species we harvest in this category. |
Source: FAO Fishstat Plus Database, 2004.
In 2003, approximately 17.0 million metric tons of whitefish were produced worldwide. The whitefish category includes groundfish (such as pollock, Pacific whiting and cod), flatfish (such as sole), and the redfish, bass and conger species groups. From 1990 to 2003, the worldwide production of groundfish has fluctuated between 8.4 million and 11.6 million metric tons. We are the largest harvester and at-sea processor of groundfish
7
in the U.S. Pollock, the species representing a substantial majority of our harvest, is the most abundant whitefish and groundfish species in the world.
Aquaculture
The following chart provides a brief overview of the different categories of fish produced by aquaculture in the U.S. in 2003. In 2003, approximately 31.6% of the seafood produced worldwide was produced in aquaculture. In 2003, according to the FAO, catfish accounted for approximately 55% of the volume of all aquaculture in the U.S., the primary market in which we sell catfish. We are the largest catfish processor in the U.S.
The following table outlines the percentage each segment represents of total U.S. aquaculture production.

Groundfish
Pollock Fisheries
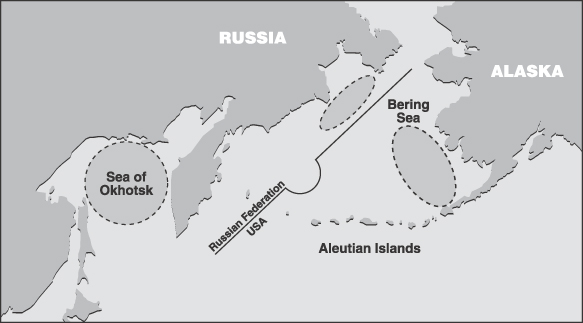
Pollock accounted for 31% of groundfish produced worldwide in 2003, representing 2.9 million metric tons, which is more than any other groundfish species. The two primary global pollock sources are the U.S. Bering Sea pollock fishery, the primary fishery in which we operate, and the Russian pollock fisheries in the Sea of Okhotsk and Bering Sea. The pollock biomasses in these U.S. and Russian pollock fisheries are independent of one another, with virtually no co-mingling between these stocks. Pollock stocks in the U.S. Bering Sea pollock fishery have remained relatively stable since 2001. Pollock stocks in Russia have increased in recent years, although they remain below historical levels. According to TINRO, Wespestad & Ianelli, the Russian fisheries’ pollock stocks are expected to remain at their current levels over the next several years. Approximately 53% of the pollock produced worldwide in 2003 came from the U.S. Bering Sea pollock fishery, up from 30% in 1999.
Between 2001 and 2004, U.S. pollock quotas have remained relatively stable. Russian pollock quotas have declined during that period, but have rebounded in recent years. The total Russian pollock quota in 2006
8
increased by 3% from the 2005 level, up to 1,081,050 metric tons. The quota in the Sea of Okhotsk, the primary Russian fishing area, is down compared to the 2005 level by 4%, to 489,000 metric tons.
The map below represents the U.S. Bering Sea pollock fishery and the Russian pollock fisheries in the Sea of Okhotsk and Bering Sea, our primary competing fisheries.
U.S. Pollock Fishery. According to the Marine Conservation Alliance, the U.S. Bering Sea pollock fishery is one of the healthiest and most responsibly managed fisheries in the world. In contrast to the general world trend of declining groundfish stocks, the U.S. Bering Sea pollock fishery is generally characterized by abundant fish stocks and conservative management. In 2004, the MSC completed a comprehensive four year review of the U.S. Bering Sea pollock fishery and concluded that the fishery met the MSC criteria for a responsible and sustainably managed fishery. We believe the MSC fishery certification guidelines are among the most rigorous guidelines for fishery management assessment in the world. Since the inception of the MSC review program only fifteen fisheries worldwide have received this certification.
The U.S. Bering Sea pollock fishery is highly regulated. Only 19 specifically identified catcher-processor vessels, of which we own seven, can participate in the catcher-processor sector of the fishery. Pollock matures relatively quickly, with fish aged three to seven years contributing most significantly to the commercial fisheries. Rapid growth allows a relatively high portion of the pollock biomass to be harvested each year without impacting overall population. According to the National Marine Fisheries Service, the body that conducts pollock stock assessments and recommends sustainable harvest limits in this fishery, approximately 25% of this fishery’s 2006 pollock biomass could be harvested without causing over fishing to occur. The federal government typically sets harvest limits in the 10% to 20% range, below the levels the National Marine Fisheries Service views as sustainable.
9
The National Marine Fisheries Service considers the current U.S. Bering Sea pollock population healthy and stable. The National Marine Fisheries Service’s population models for pollock in the U.S. Bering Sea pollock fishery show that between 1993 and 2006, the estimated biomass has averaged approximately 10.7 million metric tons. Although the estimated biomass has fallen in recent years, it remains above levels considered sustainable based on current fishing practices. The following graphic indicates the historical pollock total allowable catch and biomass in the U.S. Bering Sea pollock fishery:
U.S. Bering Sea Pollock Fishery Total Allowable Catch/Biomass
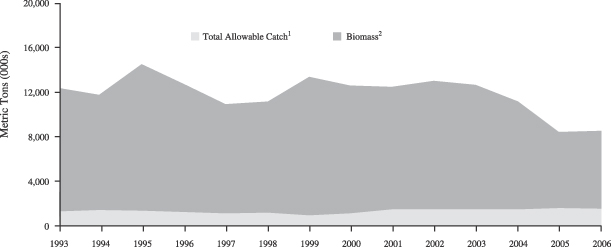
| 1 | Source for 1993 to 1998: National Marine Fisheries Service; source for 1999 to 2005: North Pacific Fishery Management Council; Amounts for 1999 and thereafter refer to the total allowable catch for the Eastern Bering Sea only. |
| 2 | Source for 1993 to 2005: Eastern Bering Sea Walleye Pollock Stock Assessment from Alaska Fisheries Science Center and National Marine Fisheries Service, November 2005. |
The pollock fishery in the U.S. Bering Sea is seasonal. The winter or “A” season takes place from January to April and the summer/fall or “B” season runs from June through October. Since 1998, the year the American Fisheries Act was passed, the National Marine Fisheries Services has permitted participants in the U.S. Bering Sea pollock fishery to harvest 40% of the annual quota during the “A” season and the remaining 60% during the “B” season. During the “A” season, spawning pollock produce large quantities of high-value roe, making this season the more profitable one.
Other Groundfish Fisheries
In addition to harvesting and processing pollock, we participate in the catcher-processor and mothership sectors of the U.S. Pacific whiting fishery and in the catcher-processor and freezer-longlinger sector for the U.S. Bering Sea Pacific cod fishery. In 2003, the U.S. Pacific whiting and cod fisheries represented approximately 13% and 19% of the worldwide production of Pacific whiting and cod, respectively. In February 2006, the MSC certified the U.S. Bering Sea and Aleutian Islands freezer-longliner fishery for Pacific cod. According to the FAO, from 1990 to 2003, the worldwide production of Pacific whiting has varied from a low of approximately 1.0 million metric tons in 1992 to a high of approximately 1.7 million metric tons in 1996. Worldwide production of cod has dropped considerably over the last two decades (mostly attributable to a decline in Atlantic cod) from approximately 2.6 million metric tons in 1981 to approximately 1.3 million metric tons in 2003. We believe this decrease in cod led to the spike in cod pricing in the early 1990s and the conversion of most fillet customers to lower-priced, relatively more abundant pollock as a primary source of groundfish. Over the past five years, the
10
total increase in the U.S. Bering Sea Pacific cod quota was approximately 3% from 188,000 metric tons in 2001 to 194,000 metric tons in 2006.
Harvesting by catcher-processors in the U.S. Pacific whiting fishery is conducted on a cooperative basis similar to the system in place for pollock fishing; the mothership sector for Pacific whiting is conducted on an “Olympic-style” or “open access” basis, meaning that any vessel licensed to operate in the fishery may harvest as much fish as possible until the fishery’s seasonal quota allocation has been reached. Harvesting in the U.S. Pacific cod fishery is Olympic-style but with limited licenses allowed to participate in the fishery.
Groundfish Consumption
Pollock and cod are the first and third, respectively, largest whitefish species in terms of human consumption. There are three primary markets for groundfish products produced for human consumption: Asia, Europe and North America. The Japanese use groundfish primarily to produce surimi (a fish protein paste used in products such as imitation lobster and crabmeat), roe and a variety of fresh-fish products. Consumers in Western Europe and the United States generally purchase groundfish in the form of fresh and frozen fillets, products produced from blocks of fillets and headed and gutted fish.
According to the National Fisheries Institute, through 2004 per capita consumption of pollock has experienced stable growth since 1987 at a compounded annual growth rate of approximately 2.2% per annum.
Groundfish Pricing
Each of the products produced from pollock has different pricing characteristics. The price of pollock roe is heavily influenced by the size and condition of roe skeins, color and freshness of the roe and the maturity of the fish caught. Catcher-processors are more likely to produce higher quality roe because they process the fish within hours of being caught, rather than several days later as is the case with inshore processors. In addition, roe prices are influenced by anticipated Russian and U.S. production and Japanese inventory carry-over, because roe is consumed almost exclusively in Japan. The U.S. Bering Sea pollock fishery commonly produces the highest quality roe.
The prices of surimi and fillets are influenced primarily by expected production in the U.S. and Russian pollock fisheries, and other factors such as carry-over inventories and changes in demand. Because surimi and fillet blocks often are composed of the same raw material, the demand for one product can influence the price of the other. Surimi and fillet blocks are also produced utilizing species of fish other than pollock, such as Pacific whiting or itoyori species. However, due to differences in flesh attributes between pollock and other species, the surimi and block produced from other species are generally not used as substitutes for pollock products yet could potentially have some influence on pollock pricing. Fillet blocks are often supplied by both the U.S. Bering Sea pollock fishery and the Russian fisheries.
Pollock Allocation
We operate within a favorable statutory and regulatory environment. The stable nature of the U.S. Bering Sea pollock fishery is partly a function of the regulatory and cooperative structure that governs its activities. The American Fisheries Act specifically identifies the catcher-processor vessels that are eligible to participate in the fishery, prohibits the entry of additional vessels and prohibits any single entity from harvesting more than 17.5% of the annual directed pollock catch.
The Act allocates the total allowable catch of pollock in the U.S. Bering Sea pollock fishery among the following sectors:
| | • | | 10% of the total allowable catch is allocated to six Alaska Community Development Groups (mostly native Alaskan villages and their residents) that sell or lease their community development quota to other participants, including us; |
11
| | • | | approximately 3.4% of the total allowable catch is set aside for pollock by-catch in other fisheries; |
| | • | | the remaining 86.6% of the total allowable catch (the “directed pollock catch”) is allocated as follows: |
| | ¨ | | 50% of the directed pollock catch is allocated to catcher-vessels delivering to inshore factories; |
| | ¨ | | 40% of the directed pollock catch is allocated to catcher-processors, and catcher-vessels that deliver to catcher-processors; and |
| | ¨ | | 10% of the directed pollock catch is allocated to the catcher-vessels that deliver to at-sea processor vessels called motherships, which do not harvest. |
Catcher-processors, such as the vessels we own, harvest and process fish into products, such as roe, fillets and surimi, within hours of catching them, and operate offshore. Catcher-vessels harvest and deliver fish to catcher-processors, motherships and inshore processors for processing. Motherships are at-sea processors which rely on catcher-vessels to harvest and deliver fish to them. Inshore processors operate onshore at fixed-location processing facilities, relying on catcher-vessels to harvest and deliver fish to them.
We own and operate seven of the 19 catcher-processor vessels permitted to participate in the catcher-processor sector of the U.S. Bering Sea pollock fishery. Under the American Fisheries Act, this sector is allocated 40% of the annual directed pollock catch and, by the terms of the Pollock Conservation Cooperative agreement, a contractual arrangement among the seven companies that own the catcher-processors named in the statute, this percentage is further divided and allocated among the Cooperative members (with 3.4% being allocated to catcher-vessels). Within the catcher-processor sector, our allocation for pollock under the Cooperative agreement is nearly 2.5 times larger than that of the second largest Cooperative member.
In 2003, 2004 and 2005, we harvested an aggregate of 18.7%, 20.1% and 20.5%, respectively, of the total allowable catch in the U.S. Bering Sea pollock fishery. We are allocated 17.1% of the directed pollock catch under our Cooperative agreements, and we lease the right to harvest another 0.4% of the directed pollock catch from other vessels in our fishery, bringing us to 17.5% of the directed pollock catch (which is the maximum permitted harvesting allocation of the directed pollock catch by any single entity). Our share of the directed pollock catch represented 15.1% of the total allowable catch. We supplemented our share of the directed pollock catch in 2003, 2004 and 2005 by purchasing approximately 36.0%, 54.0% and 54.0%, respectively, of the community development quota (or 3.6%, 5.4% and 5.4%, respectively, of the total allowable catch) from Alaska Community Development Groups, two of which are equity investors in our company.
Catfish
Catfish production has grown steadily since the earliest commercial production began. According to the FAO, worldwide production of catfish was approximately 978,000 tons in 2003, up from 472,000 tons in 1990, representing an increase of approximately 107% over 14 years. Of this amount, approximately 58% came from aquaculture and approximately 42% came from capture fisheries.
A large amount of catfish produced in the U.S. comes from independently owned and operated local family farms. The catfish raised in these farms are typically sold to processors, such as ourselves. We purchase catfish from local farmers and do not own any catfish farms. We are not controlled by or affiliated with catfish farmers or their co-operatives. The catfish is processed into various ready to consume products such as fillets, nuggets and marinated and breaded products.
Prior to 1999, the total amount of catfish imports in the U.S. was insignificant, representing less than 5% of the volume of catfish sold. Beginning in 1999, there was an increase in catfish-like imports from Vietnam. In November 2002, the Department of Commerce, or DOC, made a preliminary ruling that the Vietnamese were selling catfish-like products into the U.S. at unfairly low market prices. The DOC issued its final ruling in July 2003, imposing import duties on Vietnamese catfish and other aquaculture exports, which is still in effect.
12
Worldwide catfish consumption is concentrated in the U.S., Asia, Africa and, to a lesser degree, in Central Europe. There is very little catfish consumption in Western Europe or Japan. According to the National Fisheries Institute, in the U.S., per capita catfish consumption has surpassed cod and is now the second largest selling whitefish behind pollock. According to the National Fisheries Institute, through 2004 U.S. per capita catfish consumption, like pollock consumption, has experienced stable growth since 1990 at a compounded annual growth rate of approximately 3.2% per annum since 1990. The majority of this growth has occurred in aquaculture, the sector in which we operate.
In the U.S., the catfish market has evolved over the last decade from being a regional commodity, locally produced and consumed predominantly in the southern U.S., to a large, commercial aquaculture industry serving major U.S. markets. In 2003, according to the FAO, catfish accounted for approximately 48% of the value and 55% of the volume of all aquaculture in the U.S. The U.S. catfish industry is concentrated in Alabama, the region in which we operate, as well as Mississippi, Arkansas and Louisiana. We are the largest catfish processor in the U.S., processing approximately 100 million pounds of catfish per year.
Catfish harvests are seasonal, following the warm weather-growing cycle of the fish. Farmers prefer to harvest their ponds at the end of the summer, after the period in which the fish experience their maximum weight gain and before the fish enter a period of slower growth during the winter. The harvest slows modestly during November and December due to reduced demand during the holiday season and picks up again in the beginning of the year. This leads to a seasonal abundance of fish between late summer and early winter, the time of year when catfish prices are usually at their lowest.
Products
There are three steps in preparing pollock for retail sale: harvesting, primary processing and secondary processing. At-sea catcher-processor vessels harvest fish and conduct primary processing to produce products such as fillets, surimi and roe. These products are further refined and packaged for retail sale by secondary processing companies in the United States, Asia (mainly Japan) and Europe, which produce products such as breaded seafood portions, imitation crabmeat and fish sticks.
The sale of pollock roe is our highest margin business. The fish we catch (after extraction of roe, if applicable) is either processed into surimi or fillet blocks. Each fish is first filleted and incremental flesh is removed from the carcass and sent to the surimi line. The fillets are then either inspected and frozen in block form, or minced and used to produce surimi. The manufacturing processes for surimi and fillet blocks generate different quantities of salable product from each fish.
We process fish into the following products:
At-Sea Processing Segment:
| | • | | Roe. Roe is extracted from spawning fish, which are harvested primarily during the winter and spring. Egg sacs are sorted by size and quality and frozen on the vessels. The egg sacs are then salted and dyed by processors in Asia for sale to consumers. We produce roe primarily from pollock and to a lesser extent from cod. We sell roe primarily to large Japanese and Korean importers. |
| | • | | Block. We produce different types of block products such as skinless, boneless, pin bone out, pin bone in, deepskin and minced blocks. The frozen blocks are cut into different sizes, shapes and weights by our secondary processing operations for conversion into products such as breaded and battered fish sticks and fillets. We sell block produced from pollock, Pacific whiting and cod. We sell most of our block products to foodservice customers, restaurant chains, retailers or large scale secondary processors in Asia, Europe and North America, including to our land-based processing affiliates. |
| | • | | Surimi. Surimi is a tasteless fish paste used as the primary protein in numerous Asian dishes and, to a lesser extent in Europe and the U.S. We produce surimi from pollock and Pacific whiting. We sell |
13
| | surimi as a commodity to importers and large-scale distributors, who then sell it to processors as a raw ingredient. Outside of Japan, the most recognized surimi products are imitation crab, shrimp, scallops and other similar products. Over 1,000 different products are made from surimi. |
| | • | | Fishmeal. Fishmeal is produced from fish by-products, primarily frames, guts and heads of pollock, Pacific whiting and yellowfin sole. We sell fishmeal primarily in China, Taiwan and Japan, where it is used as the main ingredient in aquaculture feeds. |
| | • | | Other. We produce headed and gutted fish from cod which is sold primarily to secondary processors in Europe, Japan and the East coast of the U.S. We produce whole round yellowfin sole which is sold primarily to secondary processors in Korea and China for conversion into individual skinless, boneless fillets. |
Our product sales value in dollars and as a percentage of total sales including intersegment sales, broken out by product type and geographic region for 2005, in our at-sea processing segment, including other revenues, are as follows:
| | | | | | |
| | | 2005 | |
| | | Amount of
Sales | | Percent of
Total Sales | |
| | | (in millions other than percentages) | |
Roe | | $ | 80.9 | | 24.6 | % |
Block | | | 106.2 | | 32.3 | |
Surimi | | | 106.0 | | 32.3 | |
Fishmeal | | | 13.3 | | 4.0 | |
Other | | | 22.2 | | 6.8 | |
| | | | | | |
Total | | $ | 328.6 | | 100.0 | % |
| | | | | | |
| | | | | | |
| | | 2005 | |
| | | Amount of
Sales | | Percent of
Total Sales | |
| | | (in millions other than percentages) | |
North America | | $ | 57.0 | | 17.3 | % |
Japan | | | 137.4 | | 41.8 | |
Europe | | | 86.3 | | 26.3 | |
Asia (other than Japan) | | | 47.9 | | 14.6 | |
| | | | | | |
Total | | $ | 328.6 | | 100.0 | % |
| | | | | | |
Land-Based Processing Segment:
| | • | | Fresh. We sell fresh catfish and scallops. Catfish is sold to foodservice customers and retailers in the U.S. Fresh scallops are sold to wholesalers and high-end restaurants in the U.S., as well as to selected importers to the European Union. |
| | • | | Individually Quick Frozen. Individually quick frozen products are skinless fillets or scallops frozen into individual portions rather than blocks. The individually quick frozen portions are of various sizes and are processed for conversion into “center of the plate” and breaded and battered products. Most of our individually quick frozen products are produced from groundfish, catfish and scallops. We sell our individually quick frozen products to foodservice customers and retailers in the U.S. |
14
Our product sales value in dollars and as a percentage of total sales, broken out by product type and geographic region for 2005, in our land-based processing segment are as follows:
| | | | | | |
| | | 2005 | |
| | | Amount of Sales | | Percent of Total Sales | |
| | | (in millions other than percentages) | |
Individually fresh frozen | | $ | 147.1 | | 71.1 | % |
Fresh | | | 59.8 | | 28.9 | |
| | | | | | |
Total | | $ | 206.9 | | 100.0 | % |
| | | | | | |
| |
| | | 2005 | |
| | | Amount of Sales | | Percent of Total Sales | |
| | | (in millions other than percentages) | |
North America | | $ | 202.2 | | 97.7 | % |
Europe | | | 2.3 | | 1.1 | |
Asia | | | 2.4 | | 1.2 | |
| | | | | | |
Total | | $ | 206.9 | | 100.0 | % |
| | | | | | |
We are continually designing and employing new factory technologies. We employ a full time technical engineer who investigates and designs processing factory improvements. We seek to increase the value of the products produced aboard our vessels and in our land-based processing facilities and to strive to reduce labor and associated costs wherever possible. One example of these efforts is a patented machine that successfully takes the fish head (which previously went entirely to fishmeal) and removes a relatively large section of meat used for higher-value surimi or minced products. We are also investigating new technology that will grade fillets automatically with the use of computers and scanners and that could potentially reduce our labor costs.
Sales, Marketing and Distribution
Overview
We have an international marketing network with offices in the United States, Japan and Denmark. We market, sell and distribute products for two distinct types of customers: the industrial market and the foodservice/retail market. The products we produce through primary processing on board our catcher-processor vessels are sold as a raw material into the industrial market and used by our customers to produce ready to consume end products. The products we produce through secondary processing at our facility in Massachusetts and at our catfish facilities in Alabama are sold in a ready to consume format to the foodservice/retail markets.
In 2005, industrial customers and foodservice/retail customers comprised approximately 60% and 40% of our revenues, respectively. Our industrial sales force consists of sales representatives and brokers targeting an international group of customers primarily in Asia, Europe and North America regions. Our foodservice and retail sales and marketing operations include a network of approximately 40 brokers throughout the U.S. This broker network sells and distributes on average in excess of one million pounds of processed, ready to consume catfish, scallops and breaded pollock or cod per week.
Our office in Denmark reflects our strategy to build a long-term presence in the European markets that will enable us to capitalize on seafood consumption growth trends in previously underserved markets such as France, Spain, Italy and Germany. In addition, we have expanded our Japanese office in an effort to increase direct distribution to end-users and to gain an entryway into growing markets such as South Korea and China.
In 2004, the MSC completed a comprehensive four year review of the U.S. Bering Sea pollock fishery and concluded that it met the rigorous MSC criteria for a responsible and sustainably managed fishery. In February
15
2006, the MSC also certified the U.S. Bering Sea and Aleutian Islands freezer-longliner fishery for Pacific cod. The MSC certification allows us to use the MSC ecolabel on our products. Products displaying the MSC ecolabel assure buyers and consumers that the seafood they purchase come from a responsible and sustainably managed fishery.
Industrial Market
Our primary processing operations focus on products used as raw materials by secondary processors serving end markets throughout the world. We harvest, manufacture and market frozen at-sea products from the Bering Sea and North Pacific. The products produced onboard our catcher-processors and freezer-longliners are specifically made for industrial processors that convert the frozen fillet blocks, headed and gutted fish and surimi products into breaded portions, individual fillets and surimi-based products like imitation crab meat. Roe is salted and dyed by processors in Asia for sale to consumers. Roe is sold to consumers as fresh or frozen whole skeins, or as bags of eggs removed from the skeins. The whole skeins are considered a high-end gourmet food product and are used for gift giving in Japan. We develop annual marketing and sales plans for our products based on anticipated demand and market pricing. We review these plans continuously and, if necessary, adjust them during the season. Because most of our vessels can easily switch between producing surimi and fillet blocks, during each season we constantly monitor and adjust the product mix to meet market demand.
Depending on the product and customer, we negotiate either seasonal or long-term contracts. We have traditionally entered into revolving arrangements in which several larger customers commit to purchase all surimi produced on a specific vessel. Prior to each fishing season, we typically enter into sales commitments for 70% to 90% of our expected production. Final pricing usually occurs during the season or shortly thereafter, based on general pricing in the market. Over the years, we have built good relationships with our core customer base.
We generally sell our pollock roe through a combination of direct sales and silent auctions to Japanese industrial customers. Prior to the commencement of the pollock “A” season, we frequently enter into agreements to sell a specified percentage of the standard grade roe production from certain vessels to particular customers. In 2005, that percentage was 50% for each of our vessels. Under these agreements, the final sales price for the roe sold to the customers is generally identical to the price at which the remainder of the vessels’ roe production is sold at auction. Depending on the quantity of production, the roe of the pollock “B” season is sold through a similar procedure, entirely by auction or through direct negotiated sales with major customers.
Through our brand names “Pride of the Sea,” “American Pride” and “Southern Pride Catfish,” we are a well recognized supplier of industrial and secondarily processed products, and we maintain a strong market position in Japan, the United States, parts of Europe and parts of Asia.
Foodservice and Retail Markets
We focus on selling, marketing and distributing seafood products produced in our four secondary processing facilities to the foodservice and retail channels utilizing our own scalable distribution system and a national broker network. We market products such as breaded portions, fresh and frozen fillets, fresh and frozen sea scallops, and single serve portions under our national brands “American Pride,” “Frionor,” and “Southern Pride Catfish,” as well as under private label brands. The majority of our sales are in the foodservice channel and about one third of our products are sold retail through either seafood specialty shops, grocery or club stores. We market sea scallops in the retail grocery and restaurant channels. The product mix is about 2/3 frozen and 1/3 fresh. Approximately 45% of our foodservice and retail products are delivered through our own fleet of trucks.
We are increasingly emphasizing direct selling, particularly to national restaurant chains in the growth segments of the foodservice industry. We focus our marketing efforts on a consultative selling approach featuring culinary and resource support that assists customers to develop their seafood businesses. We complement our marketing efforts by developing innovative high quality products that also solve specific customers’ challenges, such as scarce labor and food safety.
16
Customers
We have established long-term relationships with a number of key customers worldwide. Our customer base includes industrial importers, foodservice distributors, food retailers, restaurants and reprocessing companies.
For surimi and roe products, our customers have primarily been Japanese and South Korean importers and large scale distributors. Over the past few years, we have focused on broadening our customer base and have been building closer relationships directly with key Japanese food manufacturers. We participate in the growing European surimi market, particularly in France and Spain. The headed and gutted cod products produced aboard our freezer-longliners are primarily sold in the European, Asian and North American markets.
The United States is our primary market for pollock deepskin blocks and catfish products. For pollock deepskin product, we have established long-term customer relationships, including multi-year or multi-season supply contracts with three of the largest U.S. pollock deepskin customers. Our catfish products are sold to a diversified customer base made up of retail, foodservice and specialty seafood distributors.
The table below lists alphabetically our 15 largest customers by revenues in our at-sea processing segment in 2005:
| | | | | | |
Customer | | At-Sea Processing Product | | Market Segment | | Country |
Con Agra Foods | | Pacific Whiting, Pollock surimi | | Retail manufacturer/foodservice | | USA |
Davigel—SA | | Pollock, Pacific Whiting | | Retail manufacturer/foodservice | | Europe |
Frozen Fish International | | Pollock block, deepskin/mince | | Retail manufacturer/foodservice | | Germany |
Golden Tech International | | Pollock roe, surimi, yellowfin | | Importer | | USA |
Gortons of Gloucester | | Pollock block, deepskin/mince | | Retail manufacturer/foodservice | | USA |
Hohsui Corporation | | Roe | | Importer | | Japan |
Kibun Foods USA Inc. | | Surimi | | Importer/retail manufacturer | | Japan |
Nichimo Company Ltd. | | Surimi/roe | | Importer/retail manufacturer | | Japan, USA, Europe |
Ocean Resource Macao
Commercial Offshore | | Fishmeal | | Importer/manufacturer | | China |
Osaka Uoichiba Co Ltd. | | Surimi/roe | | Importer | | Japan |
Peter Pan Seafoods Inc. | | Roe | | Importer/retail manufacturer | | Japan, USA |
Samho America Inc. | | Roe and surimi | | Importer | | Korea |
SIF SA | | H&G Cod, Pollock block, mince, Pacific Whiting | | Retail manufacturer/foodservice | | Europe |
Tokai Denpun | | Surimi/roe, fishmeal | | Importer | | Japan |
Youngs Bluecrest SFD | | Pollock block, deepskin/mince | | Retail manufacturer | | United Kingdom |
The table below lists alphabetically our 15 largest customers by revenues in our land-based processing segment in 2005:
| | | | | | |
Customer | | Land-based Processing Product | | Market Segment | | Country |
Ben E Keith | | Frozen Catfish, Scallops | | Foodservice Distributor | | USA |
Costco Wholesale | | Frozen Scallops | | Club Store | | USA |
Darden Restaurants | | Catfish & Scallops | | Restaurant | | USA |
Dot Foods | | Frozen Catfish | | Distributor | | USA |
Ela Foods | | Scallops | | Importer | | France |
MBM Corporation | | Processed fish | | Distributor | | USA |
Performance Food Group | | Catfish & Processed Fish | | Foodservice Distributor | | USA |
Reinhart Foods | | Catfish & Processed Fish | | Foodservice Distributor | | USA |
Seacliff Seafoods | | Fresh & Frozen Catfish | | Retail Distributor | | USA |
Star Fisheries | | Fresh & Frozen Catfish | | Retail Distributor | | USA |
Sysco Corporation (all divisions) | | Fresh & Frozen Catfish, Scallops | | Foodservice Distributor | | USA |
Tampa Bay Fisheries | | Fresh Catfish | | Processor | | USA |
US Foodservice | | Frozen Catfish, Scallops | | Foodservice Distributor | | USA |
Walmart | | Catfish | | Retail Store | | USA |
Yum! Brands Inc. (LJS division) | | Processed fish | | Restaurant | | USA |
In 2005, our two largest customers accounted for approximately 5% each of our total revenues.
17
Operations
At-Sea Processing
Harvesting operations. Our catcher-processor vessel captain and fishmaster utilize highly sophisticated fish finding technology to identify the size of the fish and the location and density of the school, allowing the vessels to optimize the catch and resource value. Once the fishmaster identifies a fishing area, a mid-water trawl net, which includes cone-shaped nets, is towed behind the vessel. The fishing captain monitors the catch sensors attached along the portion of the net that holds the fish. When the optimal catch level is reached and the net is wound in, the fish are immediately dropped into tanks to await processing.
Aboard our freezer-longliners, we harvest cod using several long lines with baited hooks, which are released from the vessel and weighted on one end to allow the baited hooks to float in mid water. This method of fishing allows us to realize an optimal finish fish product that translates into higher market prices for the longline cod products.
Processing operations. Within hours, harvested fish are converted into primary processed products utilizing highly automated, continuous production processes. In the first phase of processing, fish are released from the holding tanks onto a conveyer, sorted according to size and diverted into hoppers at the head of one of the several processing lines. Headed and gutted pollock are run through an additional line which extracts roe skeins intact. These skeins are weighed, graded, packaged in groups according to grade and frozen. Fish that have been headed and gutted are either frozen as-is or filleted for conversion into either surimi or frozen fillets.
Shipping and cold storage logistics. We have established relationships with shipping agents throughout Europe and Asia to take advantage of favorable distribution and cold storage rates and service, and we have secured cold storage space in the U.S., Canada, Europe and South Korea to ensure timely delivery of quality products at the most cost efficient rate. Also, through our integrated structure, our harvesting operations utilize the cold storage facility of our secondary processing operations for East Coast shipments, further reducing storage costs.
Land-Based Processing Products
Catfish. The catfish we buy are raised in ponds by independent catfish farmers with whom we have contractual relationships. Prior to harvesting catfish, sample fish are tested. They are loaded into baskets and then placed in our aerated tank trucks for live shipment to our processing plants. Unlike a large number of our competitors that depend on farmers to deliver catfish to their plants, we operate our own in-house harvest and live-haul departments, the largest in the nation. Prior to the trucks being unloaded into our plant, sample fish are again tested. At the plant, live catfish are transferred from aerated trucks to the processing lines. The catfish are cleaned, processed, and placed on ice or frozen using an individually quick-frozen method that preserves the taste and quality of the catfish. The frozen catfish can also be breaded and battered. The processing lines and the production processes are highly automated and generally similar to those onboard our catcher-processor vessels, with the exception of some secondary processing operations.
Breaded and battered operations. Pollock is the primary whitefish used in low cost, breaded and battered fish products for the foodservice and retail frozen product markets. We convert raw fish blocks, primarily pollock blocks produced by our harvesting operations, into market ready, frozen, cut or formed, breaded and battered portions. Our products include raw breaded, pre-cooked, batter fried, glazed and dusted products.
Scallop processing operations. We operate a state-of-the-art wet-fish processing facility focused primarily on grading and processing scallops. We purchase scallops from scallop harvesters. Scallops are graded by size and quality and processed into either premium or standard products. We utilize industry leading processing equipment and food technology in the production of our scallops which generally reduce production time and manual labor.
18
Government Regulation
Fisheries Regulation
All U.S. fisheries in which we operate are regulated and subject to total allowable catch limits. Participants in U.S. federal fisheries are required to obtain a federal government permit.
We operate in the groundfish fisheries within the U.S. Exclusive Economic Zone, 3 to 200 nautical miles off the coasts of Alaska, Washington and Oregon. According to the National Marine Fisheries Service, no species in the U.S. Bering Sea is deemed to be overfished. Credit for these healthy stocks and profitable fisheries can be attributed in large part to two pieces of federal legislation.
Magnuson-Stevens Fishery Conservation and Management Act. The Magnuson-Stevens Fishery Conservation and Management Act of 1976 provides the broad framework for conserving and managing marine fisheries within the U.S. Exclusive Economic Zone. The councils that oversee the fisheries in which we participate are the North Pacific Fishery Management Council in Alaska and the Pacific Fishery Management Council in Washington and Oregon. The councils’ two primary areas of responsibility are (1) the establishment of annual maximum catch levels and (2) the development of fishery management plans that regulate who can fish, when and how they can fish and how much they can catch. The fishery management plans are then implemented and given legal force through regulations promulgated by the National Marine Fisheries Service, a division of the Department of Commerce. These regulations are then strictly enforced by both the U.S. Coast Guard and the National Marine Fisheries Service.
Each of the fisheries in which we participate is managed on a maximum sustainable yield basis. At the end of each year, the councils’ Scientific and Statistical Committees, which are composed of scientists from federal, state and academic positions, make recommendations on acceptable biological catch by species or species group. The total allowable catch is then typically set by the council at a level equal to or less than the acceptable biological catch depending upon a variety of factors. The councils also set prohibited species catch limits to limit by-catch of non-target species. These limits are set mainly to protect and preserve crab, halibut, salmon and other non-target species for other fisheries. After being reviewed by the National Marine Fisheries Service, the councils’ recommendations are implemented.
American Fisheries Act. In 1998, Congress passed a second piece of legislation, the American Fisheries Act, which introduced several major changes in the management of the U.S. Bering Sea pollock fishery. The American Fisheries Act and its implementing regulations include the following key provisions:
| | • | | Limitation on participants in the U.S. Bering Sea pollock fishery: |
| | ¨ | | Only a defined group of 20 named catcher-processors, of which 19 catcher-processors are currently eligible to operate in the fishery, and the catcher-vessels that historically delivered to them, are eligible to harvest pollock for processing by catcher-processors. As part of the implementation agreement, eight of the vessels were scrapped and one was permanently removed from the fishery, reducing the overall fleet from 29 to 20; |
| | ¨ | | Only a defined group of catcher-vessels may harvest pollock for delivery to motherships, and only three named motherships may process pollock; and |
| | ¨ | | Only inshore processors that processed more than 2,000 metric tons of pollock during each of 1996 and 1997 may receive an unlimited amount of pollock for processing; those that processed less during those years may only receive and process under 2,000 metric tons annually. Subsequently, the council imposed a processing cap limiting the amount of pollock that can be processed by any single entity to 30% of the directed pollock catch in any given year. |
| | • | | Prohibition on any entity harvesting more than 17.5% of the directed pollock catch in any given year. Allocations purchased from community development quota partners do not count against this percentage. |
19
| | • | | Prohibition on the entry of additional large fishing industry vessels into any U.S. fishery. |
| | • | | Reallocation of the pollock total allowable catch in the U.S. Bering Sea pollock fishery between the various sectors, increasing the community development quota and inshore allocations, while reducing the catcher-processor and the mothership sector allocations: |
| | ¨ | | 10% of the total allowable catch is allocated to six Alaska Community Development Groups (mostly native Alaskan villages and their residents) that sell or lease their community development quota to other participants, including us; |
| | ¨ | | approximately 3.4% of the total allowable catch is set aside for pollock by-catch in other fisheries; |
| | ¨ | | the remaining 86.6% of the total allowable catch (the “directed pollock catch”) is allocated as follows: |
| | • | | 50% of the directed pollock catch is allocated to catcher-vessels delivering to inshore factories; |
| | • | | 40% of the directed pollock catch is allocated to catcher-processors, and catcher-vessels that deliver to catcher-processors; and |
| | • | | 10% of the directed pollock catch is allocated to the catcher-vessels that deliver to at-sea processor vessels called motherships, which do not harvest. |
The American Fisheries Act requires that vessels engaged in U.S. fisheries be owned by entities that are at least 75% U.S. citizen owned and controlled. This requirement applies at each tier of ownership and must also be examined in the aggregate. In April 2006, the Maritime Administration made a favorable determination of continuing eligibility with respect to our compliance with the citizenship requirements of the American Fisheries Act.
For purposes of the American Fisheries Act, a U.S. citizen is:
(i) Any individual who is a citizen of the United States by birth, naturalization or as otherwise authorized by law; or
(ii) Any entity (A) that is organized under the laws of the United States or of a State, (B) of which not less than 75% of the interest in such entity, at each tier of ownership of such entity and in the aggregate, is owned and controlled (including beneficial ownership and control) by U.S. citizens, and (C) with respect to which no voting or other agreements confer control to non-U.S. citizens.
Special rules applicable to corporations, limited liability companies, partnerships, trusts and other entities limit the number of non-U.S. citizen directors to a minority of a quorum of the board of directors, and require that certain principal officers and managers (including the chief executive officer, the chairman of the board of directors, trustees and general partners, and persons authorized to act in the absence or disability of such persons) be U.S. citizens.
The American Fisheries Act is relatively new legislation. As a result, no reported judicial cases clearly interpret its meaning. For this reason, the full future impact of the American Fisheries Act on our ownership and debt capital structure remains uncertain.
The Pollock Conservation Cooperative. By limiting participation in the U.S. Bering Sea pollock fishery, the American Fisheries Act facilitated the formation of a cooperative agreement. In December 1998, the companies owning the 20 catcher-processors named in the American Fisheries Act formed the Pollock Conservation Cooperative. The Pollock Conservation Cooperative controls 36.6% of the directed pollock catch, with the remaining 3.4% of the sector’s 40.0% controlled by seven catcher-vessels that historically delivered to the catcher-processors. The original division of share among the companies was based primarily on historical performance and was reached by the mutual agreement of the participants. In December 1999, Alaska Trawl
20
Fisheries, one of the original Pollock Conservation Cooperative members, agreed to sell its interest to the remaining Pollock Conservation Cooperative members and its vessel, Endurance, has been permanently removed from U.S. fisheries, leaving 19 eligible catcher-processors.
Under the terms of the Pollock Conservation Cooperative membership agreement, each participating company is allocated a percentage of the directed pollock catch by private contractual arrangement. Pollock and other groundfish allocation rights under the Pollock Conservation Cooperative are freely transferable to other participants pursuant to the membership agreement, without the prior consent or approval of the other participants. Participants can then harvest and process their quota shares at their own pace with vessels named in the American Fisheries Act, within certain seasonal restrictions. The stable nature of the U.S. Bering Sea pollock fishery is partly a function of the regulatory and cooperative structure that governs its activities. In addition, the change in fishery management introduced by the American Fisheries Act allowed the catcher-processor sector to: slow the harvesting pace in order to optimize the value per ton of harvested round fish; reduce operating costs; and minimize by-catch and discards.
In 2003, 2004 and 2005, we harvested an aggregate of 18.7%, 20.1% and 20.5% respectively, of the total allowable catch. We are allocated 17.1% of the directed pollock catch under our Cooperative agreements, and we lease the right to harvest another 0.4% of the directed pollock catch from other vessels in our fishery, bringing us to 17.5% of the directed pollock catch (which is the maximum permitted harvesting allocation of the directed pollock catch by any single entity). Our share of the directed pollock catch represented 15.1% of the total allowable catch. We supplemented our share of the directed pollock catch in 2003, 2004 and 2005 by purchasing 36.0%, 54.0% and 54.0%, respectively, of the community development quota (or 3.6%, 5.4% and 5.4%, respectively, of the total allowable catch) from Alaska Community Development Groups, two of which are equity investors in our company. The Alaska Community Development Groups represent native Alaskan villages.
21
The overall allocation of the total allowable catch, as well as our allocation and quota we have purchased, is illustrated in the following chart of the 2006 total allowable catch.
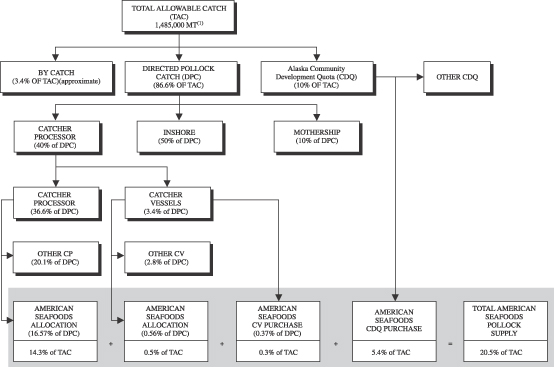
| (1) | This chart reflects the pollock TAC for the Eastern Bering Sea. In addition, there is a TAC of 19,000 MT of pollock in the Aleutian Islands. This TAC is initially awarded to the Aleut Corporation but under certain conditions up to 15,300 MT may be transferred later in 2006 to the directed pollock fishery in the Bering Sea. |
The Pollock Conservation Cooperative membership agreement will continue through the remainder of the named vessels’ lives, unless the Cooperative members unanimously agree to terminate the agreement.
The following is a summary of the Pollock Conservation Cooperative’s current members and their allocations for 2006:
| | | | | |
Company | | Vessels | | % of Directed
Pollock Catch | |
American Seafoods | | 7 | | 16.572 | % |
Trident Seafoods | | 5 | | 6.824 | |
Arctic Storm/Fjord | | 2 | | 3.633 | |
Glacier Fish Ltd. | | 2 | | 3.218 | |
Alaska Ocean | | 1 | | 3.004 | |
Highland Light | | 1 | | 1.764 | |
Starbound Ltd. | | 1 | | 1.585 | |
| | | | | |
Total | | 19 | | 36.600 | % |
| | | | | |
In December 1998, the owners of the seven catcher-vessels listed in the American Fisheries Act as eligible to deliver or sell pollock to the Pollock Conservation Cooperative members formed the High Seas Catchers’
22
Cooperative. As with the Pollock Conservation Cooperative, the 3.4% of the directed pollock catch allocated to the seven catcher-vessels was divided by private contractual arrangement based primarily on historical catch performance. The members of the High Seas Catchers’ Cooperative and their respective allocations are listed below:
| | | | | |
Company | | Vessels | | % of Directed
Pollock Catch | |
Sea Storm | | 1 | | 0.8226 | % |
Neahkanie | | 1 | | 0.6679 | |
American Seafoods | | 2 | | 0.5590 | |
Tracy Anne | | 1 | | 0.4642 | |
Muir Milach | | 1 | | 0.4538 | |
Ocean Harvester | | 1 | | 0.4325 | |
| | | | | |
Total | | 7 | | 3.4000 | % |
| | | | | |
The Pollock Conservation Cooperative and the High Seas Catchers’ Cooperative have entered into an agreement that allows the High Seas Catchers’ Cooperative members to lease their allocations directly to the Pollock Conservation Cooperative members. As a result, 100% of the High Seas Catchers’ Cooperative allocation is now harvested directly by Pollock Conservation Cooperative members.
Food Safety
The manufacture, processing, packaging, storage, distribution and labeling of food products are subject to extensive foreign, federal, state and local regulation. We are regulated by the U.S. Food and Drug Administration, the U.S. Department of Agriculture, the U.S. Department of Commerce, European Union regulators and various U.S. state and local health and agricultural agencies. In addition, some of our facilities are subject to regular on-site inspections and our production and distribution facilities are subject to various federal, state and local environmental and workplace and food safety regulations. Failure to comply with all applicable laws and regulations could subject us to civil remedies, including fines, injunctions, recalls or seizures, and criminal sanctions, any of which or all of which could have a material adverse effect on our business, financial condition and results of operations. None of our products has been subject to such a recall. Additionally, we expect that the food safety regulatory environment in the U.S., Europe and Asia will become more stringent. We believe that we are in substantial compliance with all such laws and regulations. Compliance with current or future laws or regulations could require us to make material expenditures or otherwise adversely affect our business, prospects, results of operations and financial condition.
Environmental Matters
Our vessels and facilities are subject to numerous foreign, federal, state and local laws and regulations relating to the treatment, storage, handling, disposal, emission and discharge of materials into the environment, including the federal Clean Water Act, the Clean Air Act, the Resource Conservation and Recovery Act, the Emergency Planning and Community Right-To-Know Act, the Comprehensive Environmental Response, Compensation and Liability Act, and their state and local counterparts. Under some of these laws, the owner or operator of facilities may be held liable for the costs of removing or remediation of hazardous substances on or under property, regardless of whether the owner or operator knew of or was responsible for the presence of such hazardous substance and regardless of whether the release or disposal of such substances was legal at the time it occurred. We believe that we are in substantial compliance with all such laws and regulations. We also believe that none of the environmental laws and regulations that regulate our business is expected to have a material impact on our business.
Under certain environmental laws and regulations, we will be required to expend capital in the future in order to remain in compliance. We do not believe that such capital expenditures required by environmental laws currently in effect will be material.
23
The National Marine Fisheries Service imposes various operational requirements that limit our ability to discard unwanted species, or by-catch, in the North Pacific. Regulation regarding by-catch is from time to time debated in various forums, including the United Nations, and is the subject of public campaigns by environmental groups. Any significant change in the by-catch rules resulting from these debates or campaigns could materially increase the costs or decrease the flexibility of our fishing operations.
Competition
At-Sea Processing
Our main competitors in the at-sea processing segment are the other members of the Pollock Conservation Cooperative, including Trident Seafoods and Glacier Fish. We also compete with inshore processors, including Maruha and Nissui, and motherships, which rely on catcher-vessels to harvest and deliver fish. In addition, we compete with other pollock fisheries, particularly the Russian pollock fisheries in the Sea of Okhotsk and Bering Sea.
We compete in selling roe primarily on the basis of quality. The price of pollock roe is heavily influenced by the size and condition of roe skeins, color and freshness and the maturity of the fish caught. In addition, pollock roe prices are influenced by anticipated Russian and U.S. production and Japanese inventory carry-over, as pollock roe is consumed almost exclusively in Japan. Approximately one half of our roe is sold in advance and the remainder is sold at auction, where we compete to sell into the Japanese market with other participants in our fishery, as well as with Russian producers. The prices of surimi and fillets are influenced primarily by expected production in the U.S. and Russian pollock fisheries, and other factors such as carry-over inventories and changes in demand. Because surimi and fillet blocks often are composed of the same raw material, the demand for one product can influence the price of the other. Surimi and fillet blocks are also produced utilizing species of fish other than pollock, such as Pacific whiting or itoyori species. However, due to differences in flesh attributes between pollock and other species, the surimi and block produced from other species are generally not used as substitutes for pollock products, except for potentially lower grade applications in surimi, and thus have a lesser influence on pollock pricing.
Land-Based Processing
As of December 2005, there were approximately 20 U.S. catfish processing companies, including Confish, Heartland, America’s Catch and Delta Pride, our primary catfish competitors. We are the largest, processing over 16% of the U.S. farmed catfish market. In 2005, the top five and top ten U.S. catfish companies processed, in the aggregate, approximately 60% and 80% of the U.S. farmed catfish harvest, respectively.
In secondary processing, we compete both for raw materials and customers with numerous other processors. Competition for sales is based largely on price, quality, and product specifications. Our competitors range from large volume, well established secondary processors to small independent importers and brokers. Our major competitors are Ocean Cuisine, Icelandic Seafood Corporation and Trident Seafoods.
Insurance
We carry customary insurance coverage, including policies on each of our vessels which provide for the payment of an assessed amount corresponding to “fair market value” (generally approximately one-half of current replacement cost) in the event of a loss of a vessel. Additionally, all of our catcher-processor vessels have a further layer of umbrella insurance which provides coverage for 80% of the difference between such fair market value and the total replacement cost for one vessel during each one-year policy term. We also carry insurance covering product liability claims and seaman personal injury claims made under the Jones Act. We believe that we carry adequate insurance coverage for our business activities. However, such coverage may prove to be inadequate or may not continue to be available to us. If such coverage proves to be inadequate, the sinking or destruction of, or substantial damage to, any of our vessels could have a material adverse effect on our business, financial condition or results of operations.
24
Employees
As of March 1, 2006, we employed approximately 1,000 full-time personnel, including approximately 225 corporate staff employees and approximately 700 employees at our catfish and secondary processing facilities. In addition to the full-time personnel, we also employ a seasonal vessel crew, either full-time or part-time, of approximately 900. We have an annual retention rate of over 75% and we consider relations with our employees to be good. In addition to their regular compensation, all corporate staff participate in an incentive plan to reward achievement of performance targets.
Employees at our Demopolis, Alabama processing plant are represented by a union. In January 2006, we completed a new five-year collective bargaining agreement with these employees and consider our relations with our unionized employees to be good.
All vessel employees are compensated based upon a pre-season estimated value per product applied to actual production and actual roe value achieved by their vessel.
25
Item 1A.Risk Factors
In addition to the other information contained in this annual report, you should carefully read and consider the following risk factors. If any of these risks actually occur, our business, financial condition, or operating results could be adversely affected and the trading price of our outstanding bonds could decline.
Risks Relating to Our Industry and Its Regulation
The repeal of, or adverse amendments to, the American Fisheries Act and other industry regulations would likely impair our profitability.
The American Fisheries Act restricts the number of vessels operating in the catcher-processor sector of the U.S. Bering Sea pollock fishery to 19 named catcher-processor vessels, of which we own and operate seven, and by allocating 40% of the directed pollock catch to this sector (with 36.6% being allocated to these 19 catcher-processor vessels and 3.4% being allocated to catcher-vessels). In the event that the American Fisheries Act and other related industry regulations were repealed or modified to permit additional large vessels to operate in the catcher-processor sector of the U.S. Bering Sea pollock fishery, we could be subject to new competition that could adversely affect our profitability. In addition, our pollock harvesting rights and profitability would be adversely affected if the American Fisheries Act and other industry regulations were repealed or modified in a manner that decreases the percentage of the total pollock harvest allocated to the 19 catcher-processor vessels named in the Act. A repeal or modification of the American Fisheries Act or other industry regulations could result from changes in the political environment, a significant increase or decrease in the pollock biomass or other factors, all of which are difficult to predict and are beyond our control.
The relatively stable and predictable nature of our harvesting operations and our efficiencies would deteriorate if the Pollock Conservation Cooperative agreement were terminated or adversely changed.
The members of the Pollock Conservation Cooperative, which is comprised of all participants in the catcher-processor sector of the U.S. Bering Sea pollock fishery, have agreed that each member will catch only an agreed-upon share of the total allowable catch allocated to the catcher-processor sector in that fishery. By establishing allocations among all catcher-processors, the Pollock Conservation Cooperative, which we refer to as the Cooperative, ensures that members will have the opportunity to harvest a fixed percentage of the total pollock harvest and removes the incentives to harvest and process pollock as fast as possible, thereby giving each member a greater opportunity to optimize operational efficiencies. The Cooperative could be terminated only upon the unanimous consent of the Cooperative members. The termination of the Cooperative or any adverse change to the allocation system currently in place under the agreement could increase the volatility of our operations, cause us to lose operational efficiencies and have an adverse effect on our existing harvesting rights.
Growth in our core pollock harvesting operations and our profitability are limited by the American Fisheries Act.
The American Fisheries Act imposes a statutory limit on the maximum amount of pollock that we may independently harvest equal to 17.5% of the directed pollock catch. We are allocated 17.1% of the directed pollock catch under our Cooperative agreements, and we license the right to harvest another 0.4% of the directed pollock catch from other vessels in our fishery, bringing us to the 17.5% harvesting limit.
Our business could be materially affected if the community development quota we purchase is significantly reduced or eliminated or offered to us at prices we consider unreasonable.
We supplement our pollock harvest through the purchase of community development quota, which plays an important part in our strategy of maximizing access to pollock. The primary agreements governing our current arrangements for purchasing community development quota expire at the end of 2008. The Alaska Community Development Groups from which we purchase community development quota could decline to continue to sell
26
their quota to us or could offer their quota at prices we consider unreasonable, which could materially adversely affect our business.
In addition, every three years the state of Alaska may re-allocate the community development quota allocation among the six Alaska Community Development Groups. The allocation process is currently under review and the previous allocations for the 2003-2005 cycle have been rolled over to 2006. The Alaska Community Development Groups from which we purchase community development quota could have their quota allocation reduced below current levels in 2007 or in future years. If any significant reduction were to occur, we could experience a significant decline in our revenues, earnings and profitability.
Our at-sea processing operations are subject to regulatory control and political pressure from interest groups that may seek to materially limit our ability to harvest fish.
Under the American Fisheries Act, the Magnuson-Stevens Fishery Conservation and Management Act and other relevant statutes and regulations, various regulatory agencies, including the National Marine Fisheries Service and the North Pacific Fishery Management Council, are endowed with the power to control our harvest of pollock and other groundfish in the fisheries of the North Pacific. These regulators may decrease or eliminate our allocation of the fish supply as a result of political pressure from a broad spectrum of lobbying interests including:
| | • | | native Alaskan groups seeking a greater allocation of the pollock harvest to be devoted to community development quotas; |
| | • | | other sectors of the pollock fishery, such as inshore processors who periodically seek an increased allocation of the pollock harvest devoted to the on-shore sector; and |
| | • | | environmental protection groups. |
The laws and rules that govern the highly-regulated fishing industry could change in a manner that would have a negative impact on our operations. In addition, protests and other similar acts of politically-motivated third party groups could cause substantial disruptions to the ability of our vessels to engage in harvesting activities. These factors may affect a substantial portion of our harvesting and processing operations in any year, which could have a material adverse effect on our business, results of operations or financial condition.
Regulations related to our by-catch could impose substantial costs on our operations and reduce our operational flexibility.
The National Marine Fisheries Service imposes various operational requirements aimed at limiting our ability to discard unwanted species, or by-catch, in the North Pacific. Regulation regarding by-catch is from time to time debated in various forums, including the United Nations, and is the subject of public campaigns by environmental groups. Any significant change in the by-catch rules resulting from these debates or campaigns could materially increase our costs or decrease the flexibility of our fishing operations.
Efforts to protect endangered species, such as Stellar sea lions, may significantly restrict our ability to access our primary fisheries and revenues.
There is a risk that access to certain areas of the primary fisheries in which we operate could be restricted due to constraints imposed by governmental authorities in response to the listing of endangered species, such as Stellar sea lions, for purposes of the Endangered Species Act. Since 1990, the National Marine Fisheries Service has issued various biological opinions as to the impact on Stellar sea lions of the pollock and other groundfish fisheries of the U.S. Bering Sea. These opinions have analyzed the effects of the various groundfish fisheries in the waters off Alaska and have recommended actions to avoid jeopardy for the western population of Stellar sea lions and the adverse modification of its habitat. Based upon these opinions, the National Marine Fisheries Service has adopted several regulations relating to the protection of Stellar sea lions which have caused us to
27
harvest our allocation of pollock and other groundfish from less than the full territory of the fisheries in which we have historically operated.
The regulations to protect endangered species, such as Stellar sea lions, may significantly restrict our fishing operations and revenues. Further, whatever measures that are adopted may be found to be inadequate or not in compliance with the Endangered Species Act. Therefore, as has occurred in the past, a court may in the future force us to modify our fishing operations by restricting our access to certain areas of the primary fisheries in which we operate in order to ensure the protection of the Stellar sea lions or other endangered or threatened species in compliance with the Endangered Species Act. These restrictions could have an impact on our fishing operations, profitability and revenues which may be material to our business.
In addition, the U.S. Fish and Wildlife Service has prepared a biological opinion on the effects of the Bering Sea/Aleutian Islands/Gulf of Alaska groundfish fisheries on bird species listed under the Endangered Species Act, in particular the short-tailed albatross. The National Marine Fisheries Service is also conducting an assessment of the potential interactions between short-tailed albatross and equipment used by trawl and longline vessels in these fisheries. The measures that could be imposed as a result of these investigations could have an impact on our fishing operations, profitability and revenues which may be material to our business.
The National Marine Fisheries Service has determined that under certain circumstances, the short-tailed albatross has the potential to interact with longliners’ gear. Recently implemented regulations require the use of seabird avoidance devices in the U.S. Bering Sea Pacific cod longline fishery.
If we and members of our crew fail to comply with applicable regulations, our vessels may become subject to liens, foreclosure risks and various penalties and our fishing rights could be revoked.
Our industry is subject to highly complex statutes, rules and regulations. For example, we are subject to statutory and contractual limitations on the type and amount of fish we may harvest, as well as restrictions as to where we may fish within our fisheries. If we or members of our crew violate maritime law or otherwise become subject to civil and criminal fines, penalties and sanctions, our vessels could be subject to forfeiture and our fishing rights could be revoked. The violations that could give rise to these consequences include operating a vessel with expired or invalid vessel documentation or in violation of trading restrictions, violating international fishing treaties or fisheries laws or regulations, submitting false reports to a governmental agency, interfering with a fisheries observer or improperly handling or discarding pollock roe. Because our vessels’ harvesting and processing activities take place at sea, outside the day-to-day supervision of senior management, members of the crews of our vessels may have been guilty of infractions or violations that could subject them or us to significant penalties, which could have a material and adverse effect on our results of operations and financial condition.
In 2001, we became aware of allegations that certain crew members may have tampered or attempted to tamper with equipment on board one or more of our vessels which measures the quantity of fish harvested, principally related to the 2001 fishing season. In 2002, we received additional tampering allegations relating to one of our vessels. The National Marine Fisheries Service conducted an investigation regarding these allegations, and in consultation with the National Marine Fisheries Service, we also conducted an internal investigation regarding these allegations. In 2004, we received additional tampering allegations relating to one of our vessels. We understand that the National Marine Fisheries Service conducted an investigation regarding these allegations. It is possible that violations may have occurred or may occur in the future. To date no fines or penalties have been assessed against us in connection with any of these allegations. However, the ultimate outcome of these matters is uncertain.
In addition, our vessels may become subject to liens imposed by operation of maritime law in the ordinary course of business. These include liens for unpaid crew wages, liens for damages arising from maritime torts, liens for various services provided to the vessel and liens arising out of the operation, maintenance and repair of the vessel. The holders of these liens may have the right to foreclose on the vessel if the circumstances giving rise to the liens are not adequately addressed.
28
If we do not comply with rules regulating non-U.S. citizen ownership and control of fishing vessels, we could lose our eligibility to participate in U.S. fisheries.
The American Fisheries Act requires that vessels engaged in U.S. fisheries be owned by entities that are at least 75% U.S. citizen owned and controlled. This requirement applies at each tier of ownership and must also be examined in the aggregate.
If we do not comply with these rules and regulations, we could lose our eligibility to harvest pollock and other species, which would have a material adverse effect on our business, financial condition or results of operations. See “Our Company—Government Regulation.”
In addition, the Maritime Administration has the right to review the terms of our loan covenants and financing arrangements to determine if they constitute an impermissible shifting of control to a non-U.S. citizen lender. Based on discussions with counsel and with pertinent government officials, we believe the intention of the Maritime Administration is to prevent provisions couched as loan covenants from serving as a device to shift control to non-U.S. citizens, and not to impede conventional market based loans and credit facilities.
The American Fisheries Act is relatively new legislation. As a result, no reported judicial cases clearly interpret its meaning. For this reason, the full future impact of the American Fisheries Act on our ownership and debt capital structure remains uncertain.
Risks Relating to Our Business
Our products are subject to pricing volatility, and the prices of our pollock roe and pollock surimi products, which have had significant volatility in recent years, may decline or remain at low levels, which would significantly reduce our profitability.
The sale of pollock roe is our highest margin business. Pollock roe prices have experienced considerable volatility in recent years and may continue to do so in the future. The average price of pollock roe that we sell is heavily influenced by the size and condition of roe skeins, its color and freshness, the maturity of the fish caught, the grade mix of the pollock roe and market perceptions of supply. In addition, pollock roe prices are influenced by anticipated fluctuations in supply, including Russian and U.S. production and Japanese and Korean inventory carry-over, as pollock roe is consumed almost exclusively in Japan and Korea. In addition, a decline in the quality of the pollock roe that we harvest could cause a decline in the price at which we sell our pollock roe. For example, our average A season roe prices per kilogram were 1,778 Japanese yen, 1,685 Japanese yen and 1,692 Japanese yen for the years 2003, 2004 and 2005, respectively. If the market price of pollock roe declines significantly, it would reduce our margins and, without an offsetting increase in volume, it would reduce our revenues.
Pollock surimi prices have also experienced significant volatility, which may continue. From 1999 to 2005, our average pollock surimi prices have fluctuated within a range of approximately 200 to 300 Japanese yen per kilogram. For example, our average pollock surimi prices per kilogram were 222 Japanese yen, 197 Japanese yen and 271 Japanese yen for the years 2003, 2004 and 2005, respectively. Additionally, during the last half of 2003 demand for certain grades of surimi declined, which resulted in an increase in inventory. The 2003 carryover inventory was comprised of a greater percentage of lower quality surimi that was sold at lower than average prices in 2004. Although, average prices increased in 2005, prices and sales volumes may decline again, which would materially and adversely affect our results of operations and cash flows.
Partly as a result of these pricing factors, together with high inventory levels at the end of 2003, our overall performance in 2003 was at a level that would have caused us to be in violation of certain of our financial bank covenants. To prevent this potential violation, during the third quarter of 2003, we cancelled 2003 management bonuses and reversed accruals of those bonuses through June 30, 2003, in accordance with the terms of some of our employment agreements and our general bonus policy, which does not permit the payment of bonuses based
29
on financial performance for any year in which there is a violation of a covenant under our credit agreement. Despite the cancellation and reversal of these bonuses, we would have been in violation of those financial covenants under our credit agreement at the end of 2003 if we had not obtained a covenant modification from our bank lenders. In addition, in October 2004, we entered into another amendment to our senior credit facility to provide covenant relief to us due, in part, to adverse surimi prices. See “Item 7—Management’s Discussion and Analysis of Financial Condition and Results of Operations—Financing Activities—April 2002 ASG Recapitalization.”
If prices at which we purchase catfish remain at high levels or increase, in either case without a proportionate increase in the prices at which we sell our catfish products, our ability to maintain profitability in our catfish processing operations will be adversely affected.
In the second half of 2003, many of the farmers from whom we purchase catfish increased their prices to levels that jeopardized our ability to maintain satisfactory profit margins in the catfish processing operations. Partially as a result of these farm price increases in September 2003, we temporarily closed our catfish processing plant in Demopolis, Alabama. Our Demopolis plant resumed full operations in October 2003. The prices charged by catfish farmers have remained at relatively high levels, which have adversely affected our catfish processing results in 2005. Prices at which farmers are willing or able to sell their catfish to us could remain at levels that do not enable us to maintain satisfactory margins and do not allow us to continue these operations without further shutdowns or interruptions. Such circumstances could lead to the impairment of our long-lived assets, which would adversely effect our results of operations.
Southern Pride’s recent operating results have not met our expectations primarily as a result of increased fish costs combined with lower market prices. Such increased costs and lower market prices are generally consistent with recent industry wide trends.
A material decline in the population and biomass of pollock, other groundfish and catfish stocks in the fisheries in which we operate could materially and adversely affect our business.
The population and biomass of pollock and other groundfish stocks are subject to natural fluctuations which are beyond our control. Biomass is estimated annually through a sampling and computer-modeling process, and a recent National Marine Fisheries Service report indicated a decline in the biomass of pollock. Biomass fluctuations may also be exacerbated by disease, reproductive problems or other biological issues. Pollock stocks are also largely dependent on proper resource management and enforcement. The overall health of a fish stock is difficult to measure and fisheries management is still a relatively inexact science. Since we are unable to predict the timing and extent of fluctuations in the population and biomass of the pollock stocks, we are unable to engage in any measures that might alleviate the adverse effects of these fluctuations. Any such fluctuation that results in a material decline in the population and biomass of the pollock stocks in the fisheries in which we operate could materially and adversely affect our business. Conversely, a significant increase in Russian pollock stocks could dramatically reduce the market price of our products.
Our catfish operations are also subject to the risk of variations in supply. For example, disease in catfish ponds could reduce catfish stocks and adversely affect our business. In recent years, the flesh recovery rates of our catfish operations have decreased primarily due to the processing of leaner fish that resulted from reduced feeding patterns by our suppliers. If we are unable to improve our current supply levels, or if we continue to have low flesh recovery rates, our business will be adversely affected. Total live catfish harvested has been declining for the past three years. During 2003, 2004 and 2005, total live pounds harvested were approximately 662 million pounds, 630 million pounds and 600 million pounds, respectively.
Our business is subject to foreign currency fluctuations that could materially adversely affect our financial condition and liquidity.
Our profitability depends in part on revenues received in Japanese yen as a result of sales in Japan. During 2003, 2004 and 2005, Japanese sales represented 24.9%, 27.0% and 26.8% of our seafood revenue, respectively.
30
A decline in the value of the Japanese yen against the U.S. dollar would adversely affect our earnings from sales in Japan. Fluctuations in currency are beyond our control and are unpredictable. A decline in the value of Japanese yen against the U.S. dollar would adversely affect our earnings from sales in Japan. Fluctuations in currency are beyond our control and are unpredictable.The value of the U.S dollar increased (decreased) against the Japanese yen by approximately (9.9%), (3.9%) and 14.9%, when comparing the values at beginning and end of years 2003, 2004 and 2005, respectively. To hedge some of our exposure to Japanese yen currency fluctuations, we purchase derivative instruments primarily in the form of foreign exchange contracts.
In August 2004, we entered into variable to fixed-rate cross currency interest swap contracts with an aggregate notional amount of $75.0 million in anticipation of our entering into a new credit facility in connection with the anticipated completion of our offering of IDSs. Under the terms of these contracts, we paid a fixed rate of interest in Japanese yen and receive payments on a variable rate of interest in U.S. dollars based on the U.S. dollar three-month LIBOR rate. The objective of these instruments was to reduce our exposure to interest rate risk related to the new credit facility that would have been in place upon completion of the IDS offering and to provide additional risk management against Japanese currency fluctuations related to our Japanese yen sales. As these contracts were not designated as hedges and any gains or losses were recognized in our statements of operations in accordance with generally accepted accounting principles, as applicable. Between September 2004 and October 2005, we terminated all of these cross currency swaps for nominal fees. In November 2005, we entered into two fixed-rate cross currency interest swap contracts with an aggregate notional amount of $50.0 million. Under the terms of these contracts, we pay a fixed rate of interest in Japanese yen and receive payments on a variable rate of interest in U.S. dollars based on the U.S. dollar three-month LIBOR rate. The objective of these instruments is to reduce our exposure to interest rate risk related to our credit facility and to provide additional risk management against Japanese currency fluctuations related to our Japanese yen sales. As we have not designated these contracts as hedges, any gains or losses are recognized in our consolidated statements of operations as applicable.
These instruments may not be sufficient to provide adequate protection against losses related to currency fluctuations and, accordingly, any such fluctuations could adversely affect our revenues, profitability and financial condition. There also exists the risk, should our forecasted yen denominated sales decline, that we could become over hedged through these instruments and thereby exposed to further foreign currency fluctuations.
The segments of the seafood industry in which we operate are competitive, and our inability to compete successfully could adversely affect our business, results of operations and financial condition.
We compete with major integrated seafood companies such as Trident Seafoods, Nissui and Maruha, as well as with inshore processors that operate inshore on fixed location processing facilities, relying on catcher-vessels to harvest and deliver fish for processing. We also compete with motherships that are solely at-sea processors, relying on catcher-vessels to harvest and deliver fish for processing. Additionally, we compete with other pollock fisheries, particularly the Russian pollock fisheries in the Sea of Okhotsk and Bering Sea. Some of our competitors have the benefit of marketing their products under brand names that have better market recognition than ours, or have stronger marketing and distribution channels than we do. In addition, other competitors may produce better quality products or have more advantageous pricing margins than we do. We may not be able to compete successfully with any of these companies. In addition, production and distribution of substitute products for pollock and catfish could have a significant adverse impact on our profitability. Increased competition as to any of our products could result in price reduction, reduced margins and loss of market share, which could negatively affect our profitability. An increase in imported products in the U.S. at low prices could also negatively affect our profitability.
All of our business activities are subject to a variety of natural risks, which could have a material adverse effect on our business, financial condition or results of operations.
The U.S. Bering Sea pollock fishery, the primary fishery in which we operate, is characterized by extreme sea conditions. Additionally, we purchase catfish raised in ponds primarily located in Alabama and Mississippi,
31
and scallops from fishermen who harvest them off the eastern coast of the U.S. Unusual weather conditions could materially and adversely affect the quality and quantity of the fish products we produce and distribute.
Our vessels are expensive assets that are subject to substantial risks of serious damage or destruction. The sinking or destruction of, or substantial damage to, any of our vessels would entail significant costs to us, including the loss of production while the vessel was being replaced or repaired. Our insurance coverage may prove to be inadequate or may not continue to be available to us. In the event that such coverage proves to be inadequate, the sinking or destruction of, or substantial damage to, any of our vessels could have a material adverse effect on our business, financial condition or results of operations.
Should any of our vessels be destroyed or otherwise become inoperable, the American Fisheries Act would limit our ability to replace that vessel. The statute permits the replacement of lost vessels only if the loss is due to an Act of God, an act of war, the result of a collision, or otherwise not an intentional act of the vessel’s owner. These rules would restrict our ability to replace our vessels on account of obsolescence and, accordingly, could cause us to incur increased costs of maintaining our vessels, including the substantial loss of capacity during times of such maintenance and rebuilding.
Seasonality and variability of our businesses may cause volatility in the market value of our securities and may hinder our ability to make timely payments on our debt.
Our business is seasonal in nature, and our net sales and operating results vary significantly from quarter to quarter. For example, our revenue, revenue per pound of fish harvested and gross profit tend to be higher in the January-to-April season, and hence in the first half of our fiscal year, due to the harvesting of roe which has the highest revenue per pound of product sold.
Our fishing seasons, including the important January-to-April season, straddle more than one quarter. As a result, the timing of the recognition of sometimes significant amounts of revenue from one quarter to another can be a function of unpredictable factors, such as the timing of roe auctions, weather, the timing of shipments to pollock roe customers, fishing pace and product delivery schedules, all of which are likely to vary from year to year. Consequently, results of operations for any particular quarter may not be indicative of results of operations for future quarterly periods, which makes it difficult to forecast our results for an entire year. This variability may cause volatility in the market price of our securities. In addition, the seasonality and variability of our business means that at certain times of the year our cash receipts are significantly higher than at other times. Consequently, given that we are required to make regular interest payments to debt holders, there is a risk that we will experience cash shortages. See “Item 7—Management’s Discussion and Analysis of Financial Condition and Results of Operations—Seasonality.”
We may be required to pay significant damages or incur significant costs in connection with litigation that is pending against us or with which we are involved.
The nature of our business exposes us to the potential for disputes, or legal or other proceedings, from time to time relating to labor and employment matters, personal injury and property damage, environmental matters and other matters, as discussed in the other risk factors disclosed in this Form 10-K. These disputes, individually or collectively, could harm our business by distracting our management from the operation of our business. If these disputes develop into proceedings, these proceedings, individually or collectively, could involve significant expenditures by us or result in significant changes to our operations and business practices that could have a material adverse effect on our future revenue and profitability.
On September 23, 2005, we intervened in a lawsuit brought by Horizon Lines, LLC (“Horizon”) against the U.S. Department of Homeland Security and the U.S. Bureau of Customs and Border Protection (“UCB”) in the United States District Court for the District of Columbia. In its complaint, Horizon challenges the validity of a customs ruling issued to Sunmar Shipping, Inc. that interprets the Third Proviso of the Jones Act. In general, the
32
Jones Act prohibits the transportation of merchandise between two points in the United States using “non-coastwise” (foreign-flagged) vessels. The Third Proviso is an exception to this prohibition and permits the use of foreign-flagged vessels when transporting merchandise between two U.S. ports provided certain conditions are met. The ruling challenged by Horizon, although not directly involving us, is substantially similar to a customs ruling we received from the UCB and upon which we rely to transport our products to the East coast of the United States. Horizon seeks to overturn the challenged ruling and, if successful, it may affect our ability to rely on the ruling we received. On February 10, 2006, the court granted Horizon’s motion for summary judgment and directed UCB to reevaluate its customs ruling in light of the court’s decision. We are currently evaluating legal and operational alternatives to this decision, including the possibility of an appeal. If Horizon ultimately prevails in its claim, it could negatively impact our ability to use our current transportation models, increase our costs, and have an adverse effect on our business and results of operations.
We may incur material costs associated with compliance with environmental regulations.
We are subject to foreign, federal, state, and local environmental regulations, including those governing discharges to water, the management, treatment, storage and disposal of hazardous substances, and the remediation of contamination. If we do not fully comply with environmental regulations, or if a release of hazardous substances occurs at or from one of our facilities or vessels, we may be subject to penalties and could be held liable for the cost of remediation. For example, an accident involving one of our vessels could result in significant environmental liability, including fines and penalties and remediation costs. If we are subject to these penalties or costs, we may not be covered by insurance, or any insurance coverage that we do have may not cover the entire cost. Compliance with environmental regulations could require us to make material capital expenditures and could have a material adverse effect on our results of operations and financial condition.
We produce and distribute food products that are susceptible to contamination and, as a result, we face the risk of exposure to product liability claims and damage to our reputation.
As part of the fish processing, small pieces of metal or other similar foreign objects may enter into some of our products. Additionally, our fish products are vulnerable to contamination by disease-producing organisms or pathogens. Shipments of products that contained foreign objects or were so contaminated could lead to an increased risk of exposure to product liability claims, product recalls, adverse public relations and increased scrutiny by federal and state regulatory agencies. If a product liability claim were successful, our insurance might not be adequate to cover all the liabilities we would incur, and we might not be able to continue to maintain such insurance, or obtain comparable insurance at a reasonable cost, if at all. If we did not have adequate insurance or contractual indemnification available, product liability claims relating to defective products could significantly increase our operating costs. In addition, even if a product liability claim was not successful or was not fully pursued, the negative publicity surrounding any such assertion could harm our reputation with our customers.
Our operations are labor intensive, and our failure to attract and retain qualified employees may adversely affect us.
The segments of the harvesting and processing industry in which we compete are labor intensive and require an adequate supply of qualified production workers willing to work in rough weather and potentially dangerous operating conditions at sea. Some of our operations have from time to time experienced a high rate of employee turnover and could continue to experience high turnover in the future. Labor shortages, the inability to hire or retain qualified employees or increased labor costs could have a material adverse effect on our ability to control expenses and efficiently conduct our operations. We may not be able to continue to hire and retain the sufficiently skilled labor force necessary to operate efficiently and to support our operating strategies, or we may not continue to experience favorable labor relations. In addition, our labor expenses could increase as a result of a continuing shortage in the supply of personnel. Changes in applicable state and federal laws and regulations could increase labor costs, which could have a material adverse effect on our business, results of operations and financial condition.
33
Because we distribute a significant amount of our products and receive supplies and other provisions using maritime carriers, certain adverse conditions affecting these carriers and terminals at which they transfer cargo could have a material adverse effect on our business, financial condition or results of operations.
Our distribution and purchase channels depend on the services of maritime carriers that load and unload our products, supplies and other provisions at the Port of Dutch Harbor, Alaska, and then unload our products at terminals in Korea, New Brunswick, Canada, and the Netherlands. A strike, work slow down, unfavorable weather conditions, changes in shipping routes or other factors adversely affecting such carriers or terminals could delay the delivery of our products and supplies. If this were to occur, it would negatively affect our revenues and profitability.
Our substantial indebtedness could adversely affect our cash flow and prevent us from fulfilling our financial obligations, including making payment on our outstanding debt.
We have a significant amount of debt. The degree to which we are leveraged could have important consequences. For example it could:
| | • | | make it more difficult for us to satisfy our debt obligations; |
| | • | | require us to dedicate a significant portion of our cash flow from operations to the payment of the principal and interest on our indebtedness, thereby reducing funds available for future operations, capital expenditures, acquisitions and other general corporate expenses; |
| | • | | limit our ability to obtain additional future financing, if we need it, due to applicable financial and restrictive covenants in our existing debt; |
| | • | | limit our flexibility to plan for and react to changes in our business or strategy; |
| | • | | increase our vulnerability to adverse economic and industry conditions; and |
| | • | | place us at a competitive disadvantage to less leveraged competitors. |
Item 1B.Unresolved Staff Comments
Not applicable.
Available Information
We file annual, quarterly and special reports and other information with the Securities and Exchange Commission (“SEC”). You can read and copy any materials we file with the SEC at the SEC’s Public Reference Room at 100 F Street N.E., Washington, D.C. 20549. You may obtain information on the operation of the Public Reference Room by calling the SEC at 1-800-SEC-0330. The SEC also maintains an Internet site that contains reports, proxy and information statements and other information regarding issuers, such as us, that file electronically with the SEC. The address of the SEC’s Internet site is http://www.sec.gov. We make available free of charge on or through our Internet site, www.americanseafoods.com, our annual report on Form 10-K, quarterly reports on Form 10-Q, current reports on Form 8-K and amendments to those reports filed or furnished pursuant to Section 13(a) or 15(d) of the Exchange Act as soon as reasonably practicable after we electronically file such material with, or furnish it to, the SEC. Information on our website is not part of our annual report. We will voluntarily provide electronic or paper copies of our filings free of charge upon request.
Item 2.Properties
At-Sea Processing Segment
We own and operate the largest fleet, consisting of seven vessels, within the catcher-processor sector of the U.S. Bering Sea pollock fishery. Our catcher-processor vessels range in length from approximately 260 to 340
34
feet, generate between 6,500 and 10,000 horsepower in their main engines (allowing the vessels to operate under extreme sea conditions) and each carry between 90 to 125 crew members. Each of our catcher-processors meets the rigorous seaworthiness requirements of Det Norske Veritas, the highest vessel classification standard in the world. The catcher-processors targeting pollock have the capability to produce between 110 metric tons and 150 metric tons of frozen product daily and can harvest approximately 100 metric tons of fish per haul. An appraisal conducted in 2002 estimated that our fleet has a fair market value of $290.0 million and replacement cost of approximately $545.0 million.
We own and operate three freezer-longliners in the fixed gear sector of the U.S. Bering Sea and Aleutian Islands Pacific cod fishery, ranging in length from approximately 125 to 140 feet. Our freezer-longliners are coast guard inspected each year and are maintained under similar rigorous maintenance standards as our catcher-processors. These vessels carry an average of 20 crew members and operate in the U.S. Bering Sea/Aleutian Islands Pacific cod fishery, producing headed and gutted cod that is sold primarily in the European, Asian and North American markets.
In August 2005, we purchased the catcher-vesselForum Star.Forum Star has participated in the trawl sector of the Pacific cod fishery for the past six years and delivers cod to one of our catcher-processors.
Between 1996 and 1998, we made significant investments on our catcher-processor vessels immediately following their acquisition. Because of this previous capital investment, our annual capital expenditures are primarily made only to maintain our vessels at their current state-of-the-art condition. Our entire fleet is currently equipped with highly sophisticated instruments and we do not believe that any significant further capital expenditure is required to maintain the level of performance of our vessels. Within the pollock fishery, we believe that ours is the only catcher-processor fleet with significant incremental capacity. Each vessel is equipped with highly sophisticated instruments and equipment such as fish finding technology to locate schools of the targeted species, cod ends (nets) with volume sensors and an integrated computer system enabling constant, real-time communication between each vessel and the corporate office. Our port engineers oversee the maintenance of each vessel to help ensure deployment of fit vessels for every fishing trip. Our fleet consists of the following vessels:
| | | | | | |
Vessel | | Vessel type | | Built | | Length (feet) |
American Dynasty | | Catcher-Processor | | 1989 | | 272 |
American Triumph | | Catcher-Processor | | 1991 | | 285 |
Deep Pacific | | Freezer-Longliner | | 1991 | | 125 |
Katie Ann | | Catcher-Processor | | 1986 | | 295 |
Lilli Ann | | Freezer-Longliner | | 1991 | | 141 |
North Cape | | Freezer-Longliner | | 1989 | | 123 |
Northern Eagle | | Catcher-Processor | | 1988 | | 341 |
Northern Hawk | | Catcher-Processor | | 1991 | | 341 |
Northern Jaeger | | Catcher-Processor | | 1991 | | 336 |
Ocean Rover | | Catcher-Processor | | 1990 | | 256 |
American Challenger (1) | | Catcher-Vessel | | 1992 | | 106 |
Forum Star (1) | | Catcher-Vessel | | 1987 | | 100 |
| (1) | Represents a vessel that is listed as a catcher-vessel in the American Fisheries Act and therefore may not process pollock in the U.S. Bering Sea pollock fishery. We do not operate the American Challenger. |
All of our vessels targeting pollock are equipped with both surimi and fillet lines and fishmeal plants. Within hours, these flexible factory platforms can shift production plans between surimi and block products, allowing us to control daily output to meet changing market demands.
35
Land-Based Processing Segment
We own and operate two catfish processing facilities located in Greensboro and Demopolis, Alabama. Combined, these processing facilities operate a total of fifteen processing lines and are capable of processing approximately 425,000 pounds of live catfish per day. We own live hauling equipment, including 15 aerated tank trucks used to harvest and transport the live catfish to our processing facilities. We own and operate a fleet of approximately 30 trucks used for distribution of our products.
We also own and operate a facility in New Bedford, Massachusetts comprised of a secondary processing facility for frozen and block products, a cold storage space for over 9,100 pallets and a corporate office. This facility also includes a state-of-the-art wet-fish processing facility focused primarily on grading and processing scallops.
We lease our corporate headquarters, located in Seattle, Washington. We benefit from a preferential docking agreement with the Port of Seattle which provides for the docking of all of our vessels during the off-season. We also lease office space in Copenhagen, Denmark and Tokyo, Japan. Additionally, in Dutch Harbor, Alaska we lease office space and warehouse facilities and use several docking facilities during the fishing season.
We believe that our existing vessels and facilities are adequate for our current operations.
Item 3.Legal Proceedings
Litigation
General. We are from time to time party to litigation, administrative proceedings and union grievances that arise in the ordinary course of our business. Except as described below, we do not have pending any litigation that, separately or in the aggregate, would in the opinion of management have a material adverse effect on our results of operations or financial condition. However, given the inherent unpredictability of litigation, it is possible that an adverse outcome could, from time to time, have a material adverse effect on our operating results or cash flows in any particular quarterly or annual period.
National Marine Fisheries Service Investigation. In 2001 and 2002, we became aware of allegations that certain crew members may have tampered or attempted to tamper with measurement equipment on board one or more of our vessels. The National Marine Fisheries Service conducted an investigation regarding these allegations, and in consultation with the National Marine Fisheries Service, we also conducted an internal investigation regarding these allegations. In 2004, we received additional tampering allegations relating to one of our vessels. We understand that the National Marine Fisheries Service has conducted an investigation regarding these allegations. To date, no fines or penalties have been assessed against us in connection with any of these allegations. However, the ultimate outcome of these matters is uncertain.
Intervention in U.S. Customs Lawsuit.On September 23, 2005, we intervened in a lawsuit brought by Horizon Lines, LLC (“Horizon”) against the U.S. Department of Homeland Security and the U.S. Bureau of Customs and Border Protection (“UCB”) in the United States District Court for the District of Columbia. In its complaint, Horizon challenges the validity of a customs ruling issued to Sunmar Shipping, Inc. that interprets the Third Proviso of the Jones Act. In general, the Jones Act prohibits the transportation of merchandise between two points in the United States using “non-coastwise” (foreign-flagged) vessels. The Third Proviso is an exception to this prohibition and permits the use of foreign-flagged vessels when transporting merchandise between two U.S. ports provided certain conditions are met. The ruling challenged by Horizon, although not directly involving us, is substantially similar to a customs ruling we received from the UCB and upon which we rely to transport our products to the east coast of the United States. Horizon seeks to overturn the challenged ruling and, if successful, it may affect our ability to rely on the ruling we received. On February 10, 2006, the court granted Horizon’s motion for summary judgment and directed UCB to reevaluate its customs ruling in light of the court’s decision. We are currently evaluating legal and operational alternatives to this decision, including the possibility of an
36
appeal. If Horizon ultimately prevails in its claim, it could negatively impact our ability to use our current transportation models, increase our costs, and have an adverse effect on our business and results of operations.
Item 4.Submission of Matters to a Vote of Security Holders
None.
37
PART II
Item 5.Market For Registrant’s Common Equity, Related Stockholder Matters and Issuer Purchases of Equity Securities
There is no established public trading market for our common equity.
We are part of a group of subsidiaries that are wholly owned by ASLP. As of March 7, 2006, ASLP directly owns approximately 99.8% of the common equity interests in, and is the managing member of, American Seafood Holdings LLC, (“Holdings”). Bernt O. Bodal owns directly approximately 0.2% of Holdings interests. Holdings directly owns 100% of American Seafoods Consolidated LLC, which, in turn, directly owns 90% and indirectly, through ASC, Inc., owns the remaining 10% of ASG Consolidated LLC. ASC, Inc. owns approximately 10% of the ASG Consolidated LLC and has an interest with preferred allocation and distribution rights. We are a wholly-owned subsidiary of ASG Consolidated LLC.
As of March 7, 2006, the beneficial ownership through ASLP, held by Coastal Villages Region Fund, Bernt O. Bodal, our Chairman and Chief Executive Officer, and our directors and officers as a group was 45.3%, 39.7% and 100.0%, respectively.
There are restrictions imposed on distributions to our member by covenants contained in the Third Amended and Restated Credit Agreement, dated as of October 6, 2005, among us, American Seafoods Consolidated LLC, ASG, the banks and other financial institutions, Wells Fargo Bank, N.A., as swingline lender, and Bank of America, N.A., as Administrative Agent and Issuing Lender (the “Credit Agreement”). Distributions are limited to an amount equal to 50% of ASG’s cumulative excess distributable cash flow (as defined in the Credit Agreement) and an additional amount that will enable our member to pay Theoretical Tax, as defined, on the amount of taxable income of ASG and its subsidiaries allocated to members. There are also restrictions on distributions contained in our Senior Subordinated Notes. See “Item 8—Financial Statements and Supplementary Data, Notes 8 and 14”.
38
Item 6.Selected Financial Data
The following selected historical consolidated financial information for ASG as of and for the years ended December 31, 2003, 2004 and 2005 has been derived from the audited consolidated financial statements included elsewhere in this annual report. See Note 1 to the audited consolidated financial statements. The following selected historical consolidated financial data for ASG as of and for the year ended December 31, 2001 and 2002, has been derived from the consolidated financial statements of ASG, which are not included in this annual report.
The following selected historical financial information should be read in conjunction with “Management’s Discussion and Analysis of Financial Condition and Results of Operations” and the consolidated financial statements and related notes included elsewhere in this annual report.
| | | | | | | | | | | | | | | | | | | | |
| | | Year Ended December 31, | |
| | | 2001(1) | | | 2002(2) | | | 2003 | | | 2004 | | | 2005 | |
| | | (dollars in thousands) | |
Statement of Operations Data: | | | | | | | | | | | | | | | | | | | | |
Total sales and revenues | | $ | 336,839 | | | $ | 332,872 | | | $ | 411,363 | | | $ | 461,667 | | | $ | 514,002 | |
Gross profit | | | 75,115 | | | | 97,969 | | | | 102,117 | | | | 88,916 | | | | 102,636 | |
Gross margin | | | 22.30 | % | | | 29.43 | % | | | 24.82 | % | | | 19.26 | % | | | 19.97 | % |
Goodwill impairment | | | — | | | | — | | | | — | | | | (7,171 | ) | | | — | |
Operating income | | | 33,637 | | | | 43,658 | | | | 58,876 | | | | 42,675 | | | | 55,660 | |
Gain (loss) on derivatives | | | 17,650 | | | | 18,982 | | | | (4,040 | ) | | | (12,914 | ) | | | 36,884 | |
Writeoff of recapitalization and deferred financing costs | | | — | | | | — | | | | — | | | | (19,264 | ) | | | (10,903 | ) |
Income (loss) before income taxes and minority interest | | | 16,235 | | | | 8,064 | | | | 14,374 | | | | (28,606 | ) | | | 37,918 | |
Net income (loss) | | | 16,419 | | | | 8,384 | | | | 14,514 | | | | (28,637 | ) | | | 37,865 | |
Other Financial Data: | | | | | | | | | | | | | | | | | | | | |
Ratio of earnings to fixed charges(3) | | | 1.45 | | | | 1.19 | | | | 1.35 | | | | 0.29 | | | | 1.87 | |
| |
| | | As of December 31, | |
| | | 2001 | | | 2002 | | | 2003 | | | 2004 | | | 2005 | |
| | | (dollars in thousands) | |
Balance Sheet Data: | | | | | | | | | | | | | | | | | | | | |
Property, vessels and equipment, net | | $ | 254,341 | | | $ | 253,090 | | | $ | 225,970 | | | $ | 198,340 | | | $ | 171,479 | |
Total assets | | | 516,895 | | | | 521,072 | | | | 519,990 | | | | 459,418 | | | | 466,714 | |
Total debt | | | 326,499 | | | | 551,413 | | | | 527,282 | | | | 481,122 | | | | 453,088 | |
Member’s equity (deficit) | | | 155,032 | | | | (78,439 | ) | | | (111,985 | ) | | | (118,168 | ) | | | (27,009 | ) |
| (1) | Effective January 1, 2002, we changed our method of accounting for goodwill and other intangible assets upon adoption of SFAS No. 142, after which goodwill and certain other intangibles were no longer amortized, but rather subject to periodic impairment analysis. |
| (2) | In October 2001, we reassessed the estimated useful lives of cooperative fishing rights and increased the amortization period. |
| (3) | Ratio of earnings to fixed charges is calculated as the total of income before income taxes, minority interest, fixed charges, and interest expense, including amortization of deferred financing fees and an estimate of the interest within rental expense divided by fixed charges. For the year ended December 31, 2004, the deficiency in earnings was approximately $28.6 million. |
39
Item 7.Management’s Discussion and Analysis of Financial Condition and Results of Operations
The following discussion should be read in conjunction with our consolidated financial statements and the notes to those statements and other financial information appearing elsewhere in this annual report. This annual report contains forward-looking statements that involve risks and uncertainties. Our actual results may differ materially from those indicated in forward-looking statements. See “Cautionary Statement Regarding Forward-Looking Statements.”
Business Overview
We are one of the largest integrated seafood companies in the U.S. in terms of revenues. We harvest and process a variety of fish species aboard our sophisticated catcher-processor and freezer-longliner vessels and at our land-based processing facilities. We market our products to a diverse group of customers in North America, Asia and Europe. We are the largest harvester and at-sea processor of pollock and Pacific whiting and the largest processor of catfish in the U.S. In addition, we harvest or process other seafood, including cod, scallops and yellowfin sole. We maintain an international marketing network through our U.S., Japan and Europe offices and have developed long-term relationships with our U.S. and international customer base.
We operate in two principal operating segments, at-sea processing and land-based processing. The at-sea processing segment includes the harvesting and processing of pollock, cod, Pacific whiting and yellowfin sole on our vessels while at sea. The land-based processing segment includes the primary processing of catfish at our facilities in Alabama and scallops in Massachusetts and secondary processing of pollock, cod and other white fish products in Massachusetts.
The most significant portion of our revenues and profitability is derived from our at-sea processing segment. The performance of our at-sea processing segment largely depends on the amount of pollock, cod and Pacific whiting resources that we harvest and the prevailing market prices for the related products we sell. During 2003, 2004 and 2005, we harvested approximately 329,000 metric tons, 365,000 metric tons and 393,000 metric tons of whitefish, respectively.
Pollock represents the most significant portion of our harvest and the most significant portion of our net sales both in terms of volume and revenues. In 2003, 2004 and 2005, our pollock products represented approximately 68.4%, 73.0 % and 67.2%, respectively, by volume of the products sold in our at-sea processing segment. Some of our products exhibit commodity-like pricing characteristics. These prices fluctuate from season to season and from year to year as a result of factors such as market conditions, inventory levels and production volumes.
We operate in three primary U.S. fisheries, the U.S. Bering Sea pollock fishery, the U.S. Bering Sea Pacific cod fishery and the U.S. Pacific whiting fishery. For each U.S. fishery, the fishery management council determines the annual total allowable catch, which is the total weight of fish that can be harvested. In addition to the amount of the directed pollock catch that we harvest, we supplement our pollock and longline cod harvest by purchasing community development quota allocated to Alaska Community Development Groups.
The remaining portion of our revenues and profitability is derived from our land-based processing segment. The performance of our land-based processing segment largely depends on the amount of catfish, pollock, cod and scallops that we process each year, the cost of fish we purchase and the prevailing market prices for the related products we sell. During 2003, 2004 and 2005, we processed approximately 81 million, 81 million and 87 million finished pounds, respectively, in our land-based processing segment.
Corporate History
On January 28, 2000, American Seafoods, L.P. (ASLP) purchased, through its subsidiaries, from Norway Seafoods six catcher-processors, one catcher-vessel, all of the outstanding stock of American Seafoods Company
40
(now referred to as “ASC, Inc.”) and certain assets of Frionor USA (now called “American Seafoods International LLC”). ASC, Inc. was the operator of the six acquired vessels and the owner-operator of one additional catcher-processor vessel. ASG was formed in connection with the acquisition. The acquisition was accounted for as a purchase, and all of the debt, assets and goodwill and other intangible assets relating to the acquisition have been “pushed down” to the balance sheet of ASG. The purchase accounting resulted in all assets and liabilities being recorded at their estimated fair values on the date of acquisition. The aggregate purchase price for the acquisition was $477.9 million, including acquisition costs.
In August 2001, we, along with two other partners, formed Pacific Longline Company (PLC) in order to acquire three freezer-longliner vessels. Our initial ownership through this transaction was 60% of PLC. Effective January 1, 2004 we purchased the third party minority interest in PLC and increased our ownership to 100%. PLC harvests and processes primarily Pacific cod in the U.S. Bering Sea.
Effective December 16, 2002, we purchased substantially all of the assets of Southern Pride. Southern Pride is engaged in the business of catfish harvesting, processing and distribution. The acquired assets included, among other things, certain real property, fixtures, equipment, accounts receivable, trade name, customer and other contracts, and cash on hand.
On February 27, 2006, ASLP Acquisition LLC, a new company controlled by Bernt O. Bodal, our Chairman and Chief Executive Officer, and CVP, one of ASLP’s existing equity holders, and other entities controlled by Bodal or CVP purchased from Centre Partners and its affiliated funds (Centre), all of Centre’s direct and indirect ownership of partnership interests in ASLP. The aggregate purchase price for Centre’s partnership interests was $81.8 million. ASLP Acquisition LLC and CVP also purchased partnership interests from ASLP partners who had rights to “tag-along” with Centre’s sale. The aggregate purchase price paid to these partners was $34.9 million. After the acquisition, ASLP Acquisition LLC owned 20.1% of ASLP.
Overview of Recent Financial Results for 2003 to 2005
Our seafood sales revenues increased primarily due to the growth in our sales volumes as a result of increases in the pollock community development quota (CDQ) we purchase, increases in the Pacific whiting quota and increases in sales for certain products in both segments. Our gross margin as a percentage of sales declined in 2004 as compared to 2003 primarily due to the purchase of additional CDQ and the downward trend in pollock surimi prices that began in the second half of 2003 (although prices have increased since the second half of 2004). Our gross profit as a percentage of sales increased slightly in 2005 as compared to 2004 primarily as a result of higher sales prices, which was partially offset by higher fuel and freight costs. Operating expenses have increased over the three year period primarily due to an increase in variable expenses resulting from a growth in sales volume, the write-off of the Southern Pride goodwill, which was partially offset by a decrease in equity-based compensation. Net other expenses fluctuated due to a number of factors, including fluctuations in exchange rates, write-offs related to financing activities, changes in borrowings, changes in interest rates, and derivatives gains and losses.
Revenues and Expenses
At-Sea Processing Segment
At-Sea Processing Revenues. Revenues in our at-sea processing segment are primarily driven by the following factors:
| | • | | the volume of pollock and other whitefish harvested annually by our catcher-processors and freezer-longliners; |
| | • | | the quantity of finished product we are able to produce (determined by the flesh and roe recovery rates); |
| | • | | the prevailing market prices for the products we sell, such as roe, surimi (a fish protein paste used in products such as imitation lobster and crabmeat) and fillet block; |
41
| | • | | the timing of our sales of fish products; and |
| | • | | the Japanese yen to U.S. dollar exchange rate. |
Harvest volumes. In addition to the portion of the directed pollock catch allocated to us under the Pollock Conservation Cooperative agreement, an agreement among industry participants in the catcher-process sector, we historically have purchased additional pollock quota from other industry participants up to the 17.5% harvesting limit of the directed pollock catch. In addition, we supplemented our share of the directed pollock catch in 2003, 2004 and 2005 by purchasing 36.4%, 54.0% and 54.0%, respectively, of the total community development quota (CDQ) allocated to Alaska Community Development Groups, which does not count against the 17.5% harvesting limitation. Our agreements with our principal CDQ partners expire at the end of 2008, pursuant to State of Alaska Community Development Quota program guidelines.
Recovery rates. Increases in flesh and roe recovery rates, which represent the percentage of finished product produced from a whole fish, result in higher finished product volumes. Flesh recovery rate means the weight of processed products, other than fishmeal and roe, relative to the weight of fish harvested, expressed as a percentage. Roe recovery rate means the weight of processed roe, relative to the weight of fish harvested, expressed as a percentage.
Market prices. Market prices for our at-sea processed products are primarily influenced by the aggregate supply of products produced in any given year, the grade mix we produce, the anticipated inventory carryover for that year and changes in demand.
During fiscal years 2001 to 2005, our average pollock surimi prices have typically fluctuated within a range of approximately 200 to 300 Japanese yen per kilogram. In the second half of 2003 and the first half of 2004, our average pollock surimi price was at the low end of this range, though surimi prices have risen since that time. Pollock surimi prices are sensitive to grade mix composition, anticipated seasonal production, overall inventory levels and buyers’ speculation of anticipated price levels.
Our pollock roe is typically sold through an auction process. Between the years 2001 and 2004, our average roe prices decreased primarily due to a decline in our grade mix. As a result of producing improved grades of roe in 2005, we realized slightly higher average prices from our auctions over 2004. On a grade-by-grade basis, roe market prices have remained relatively stable over the last few years.
Below is a chart illustrating our average prices achieved for the years 2001 through 2005 for pollock surimi, pollock roe, pollock deepskin and pollock block pin bone out products. The surimi and roe prices are noted in Japanese yen (¥) per kilogram, which is the unit price we receive from our Japanese customers. The pollock deepskin and block pin bone out are noted in U.S. dollars per pound, which is the unit price we receive from our customers.
| | | | | | | | | | | | | | | |
| | | 2001 | | 2002 | | 2003 | | 2004 | | 2005 |
Pollock surimi ¥/kg | | ¥ | 212 | | ¥ | 278 | | ¥ | 222 | | ¥ | 197 | | ¥ | 271 |
Pollock roe ¥/kg (1) | | ¥ | 2,247 | | ¥ | 1,906 | | ¥ | 1,778 | | ¥ | 1,685 | | ¥ | 1,692 |
Pollock deepskin $/lb | | $ | 1.25 | | $ | 1.24 | | $ | 1.25 | | $ | 1.24 | | $ | 1.26 |
Pollock block pin bone out $/lb | | $ | 0.88 | | $ | 1.06 | | $ | 1.04 | | $ | 1.01 | | $ | 1.14 |
| (1) | Average roe prices are for the A season only as this represents more than 95% of the total roe value for each year. |
Exchange rate effects. Because we sell large quantities of roe and surimi to Japanese customers, a significant portion of our revenue is denominated in Japanese yen. Consequently, we could be at risk that any increase or decrease in the value of the Japanese yen relative to the U.S. dollar would increase or decrease the amount of dollar revenues we record on the sales of our products in Japan. To mitigate the potentially adverse
42
effect of fluctuations in the Japanese yen to U.S. dollar spot exchange rate, we enter into forward foreign currency contracts. It is our risk management policy to hedge a target level of 80% of our forecasted Japanese yen sales over the next 12 months, 65% over months 13 to 24, 50% over months 25 to 36, and 35% over months 37 to 48.
Our profitability depends in part on revenue received in Japanese yen as a result of sales to Japanese customers. Japanese sales represented 24.9%, 27.0% and 26.7% of our total revenue in 2003, 2004 and 2005, respectively. A decline in the value of Japanese yen against the U.S. dollar would adversely affect our earnings from sales in Japan. Fluctuations in currency are beyond our control and are unpredictable.During the years ended December 31, 2003, 2004 and 2005, the value of the U.S dollar increased (decreased) against the Japanese yen by approximately (9.9%), (3.9%) and 14.9%, respectively, when comparing such values at the beginning and end of the years. While we conduct hedging activities to mitigate the risk of currency fluctuations, these hedging activities may not be sufficient to provide complete protection against loss and, accordingly, any such fluctuations could adversely affect our revenues.
At-Sea Processing Expenses. The operating cost structure of our at-sea processing operations includes four main cost categories:
| | • | | variable costs driven by revenue or product volume, such as crew compensation, product freight and storage, packaging and additives; |
| | • | | vessel-related depreciation and amortization of cooperative and fishing rights; |
| | • | | fixed costs that are incurred whether or not the vessel is deployed, such as quota purchases, insurance, repair and maintenance, moorage and general supplies; and |
| | • | | operating costs driven by vessel operations, such as fuel, nets and gear supplies, galley supplies, equipment rental, crew travel, observers and technicians. |
After depreciation expense, crew compensation represents the largest operating cost for the vessel operations and is primarily a variable cost, structured to reward each crew member based upon an estimated value of the product. Quota purchase costs are calculated as an amount per harvestable ton and are incurred when we purchase quota amounts from our Alaska Community Development Group partners, catcher vessel owners and other third party fishery participants. Product freight is incurred when we transport the product to either our customer or a cold storage facility. Storage costs are incurred for product entering a cold storage facility.
Land-Based Processing Segment
Land-Based Processing Revenues. Revenues from our land-based processing segment are primarily a function of our throughput volume of pollock, cod, catfish and scallops that we process and the prevailing market prices for those products.
Land-Based Processing Expenses. Operating costs related to our land-based processing operations are principally comprised of the cost of raw material purchases, labor and operating costs. Operating costs include depreciation expense related to equipment and facilities used for processing and transportation.
Enterprise Expense Summary
Cost of sales include operating costs such as crew and factory personnel compensation, quota purchase costs, seafood purchases, vessel fuel, packaging, insurance, product freight, other operating related expenses, amortization of cooperative and fishing rights and depreciation applicable to property, vessels and equipment used in production. Selling, general and administrative expenses include employee compensation and benefits, rent expense, professional fees, promotional costs and other expenses, such as office equipment and supplies, not directly involved in the production process.
43
Results of Operations
Overview of Operating Results
The following table compares selected statements of operations data, expressed in terms of percentage of revenue, for years ended December 31, 2003, 2004 and 2005.
| | | | | | | | | |
| | | Year Ended December 31, | |
| | | 2003 | | | 2004 | | | 2005 | |
Net sales and revenues | | 100 | % | | 100 | % | | 100 | % |
Cost of sales | | 75 | | | 81 | | | 80 | |
| | | | | | | | | |
Gross profit | | 25 | | | 19 | | | 20 | |
Operating expenses | | 11 | | | 10 | | | 9 | |
| | | | | | | | | |
Operating income | | 14 | | | 9 | | | 11 | |
Other income (expense), net | | (10 | ) | | (15 | ) | | (4 | ) |
| | | | | | | | | |
Net income (loss) | | 4 | % | | (6 | )% | | 7 | % |
| | | | | | | | | |
Year Ended December 31, 2005 Compared to the Year Ended December 31, 2004.
Revenue. The following table compares selected segment revenue data presented in amount and as a percentage of total revenue for the years ended December 31, 2004 and 2005, and presents the corresponding change in amount and percentage between the periods (amounts in millions):
| | | | | | | | | | | | | | | | | | | | |
| | | Year Ended December 31, | | | Increase (Decrease) | |
| | | 2004 | | | 2005 | | | Amount | | Percent | |
Net sales and revenues: | | | | | | | | | | | | | | | | | | | | |
At-sea processing | | $ | 289.1 | | | 63 | % | | $ | 328.6 | | | 64 | % | | $ | 39.5 | | 14 | % |
Land-based processing | | | 196.1 | | | 42 | | | | 206.9 | | | 40 | | | | 10.8 | | 6 | |
Intersegment elimination | | | (23.5 | ) | | (5 | ) | | | (21.5 | ) | | (4 | ) | | | 2.0 | | 9 | |
| | | | | | | | | | | | | | | | | | | | |
Total net sales and revenues | | $ | 461.7 | | | 100 | % | | $ | 514.0 | | | 100 | % | | $ | 52.3 | | 11 | % |
| | | | | | | | | | | | | | | | | | | | |
At-sea processing sales increased primarily as a result of higher prices for our pollock surimi and block, as well as higher sales volumes of Pacific whiting and yellowfin sole products. This increase was partially offset by lower sales volumes of pollock roe and block products, as well as pollock surimi due to a lower amount of carryover inventory than in the prior year. Land-based processing sales increased primarily due to higher sales prices generated from our secondary processed and scallop products, which was partially offset by lower catfish and scallop sales volumes.
Gross profit.The following table compares selected segment gross profit data presented in amount and as a percentage of related segment revenue for the years ended December 31, 2004 and 2005, and presents the corresponding change in amount and percentage between the periods (amounts in millions):
| | | | | | | | | | | | | | | | | | | | | |
| | | Year Ended December 31, | | | Increase (Decrease) | |
| | | 2004 | | | 2005 | | | Amount | | | Percent | |
Gross profit: | | | | | | | | | | | | | | | | | | | | | |
At-sea processing | | $ | 86.2 | | | 30 | % | | $ | 100.6 | | | 31 | % | | $ | 14.4 | | | 17 | % |
Land-based processing | | | 13.8 | | | 7 | | | | 13.2 | | | 6 | | | | (0.6 | ) | | (4 | ) |
Intersegment elimination | | | (11.1 | ) | | (47 | ) | | | (11.2 | ) | | (52 | ) | | | (0.1 | ) | | — | |
| | | | | | | | | | | | | | | | | | | | | |
Total gross profit | | $ | 88.9 | | | 19 | % | | $ | 102.6 | | | 20 | % | | $ | 13.7 | | | 15 | % |
| | | | | | | | | | | | | | | | | | | | | |
44
At-sea processing gross profit increased in amount and slightly as percentage of related revenue, primarily as a result of the revenue factors described above, which is partially offset by higher fuel and freight costs during 2005. Land-based processing gross profit decreased slightly in amount and as a percentage of related revenue, primarily as a result of higher production costs, which are partially offset by revenue factors described above and higher catfish production yields in our land-based processing operations.
Operating expenses. The following table compares selected operating expenses in amount and as a percentage of total revenue for the years ended December 31, 2004 and 2005, and presents the corresponding change in amount and percentage between the periods (amounts in millions):
| | | | | | | | | | | | | | | | | | | |
| | | Year Ended December 31, | | | Increase (Decrease) | |
| | | 2004 | | | 2005 | | | Amount | | | Percent | |
Operating expenses: | | | | | | | | | | | | | | | | | | | |
Selling, general and administrative | | $ | 33.0 | | 7 | % | | $ | 40.2 | | 8 | % | | $ | 7.2 | | | 22 | % |
Equity-based compensation | | | 2.9 | | 1 | | | | 3.5 | | 1 | | | | 0.6 | | | 21 | |
Amortization and depreciation | | | 3.1 | | 1 | | | | 3.3 | | — | | | | 0.2 | | | 6 | |
Goodwill impairment | | | 7.2 | | 1 | | | | — | | — | | | | (7.2 | ) | | | |
| | | | | | | | | | | | | | | | | | | |
Total operating expenses | | $ | 46.2 | | 10 | % | | $ | 47.0 | | 9 | % | | $ | 0.8 | | | 2 | % |
| | | | | | | | | | | | | | | | | | | |
Selling, general and administrative expenses, excluding equity-based compensation, increased during 2005 primarily resulting from higher bonus and retirement costs, corporate transportation costs and professional fees as compared to 2004. During 2005, a $0.7 million provision was charged to earnings for amounts due from a large retail customer of our land-based processing segment that filed for bankruptcy protection in the U.S in the first quarter of 2005. During 2004 and 2005, sales to this customer represented less than 1% of our total revenues. The change in equity-based compensation expense resulted primarily from the change in the estimated fair value of options accounted for under variable accounting and the additional accrual of expense for certain performance-based options, the vesting of which became probable in 2005. Amortization and depreciation remained relatively consistent between periods. During 2004, we wrote off goodwill related to our investment in our catfish operations.
Other income (expense), net. The following table compares selected other income (expense), net in amount and as a percentage of total revenue for the years ended December 31, 2004 and 2005, and presents the corresponding change in amount and percentage between the periods (amounts in millions):
| | | | | | | | | | | | | | | | | | | | | |
| | | Year Ended December 31, | | | Change | |
| | | 2004 | | | 2005 | | | Amount | | | Percent | |
Other income (expense), net: | | | | | | | | | | | | | | | | | | | | | |
Interest expense | | $ | (39.3 | ) | | (9 | )% | | $ | (41.8 | ) | | (8 | )% | | $ | (2.5 | ) | | (6 | )% |
Foreign exchange gains (losses), net | | | (5.8 | ) | | (1 | ) | | | 23.8 | | | 4 | | | | 29.6 | | | | |
Other derivatives gains (losses), net | | | (7.1 | ) | | (1 | ) | | | 13.1 | | | 2 | | | | 20.2 | | | | |
Write off of recapitalization transaction and financing costs | | | (19.2 | ) | | (4 | ) | | | (10.9 | ) | | (2 | ) | | | 8.3 | | | | |
Other income (expense), net | | | 0.2 | | | — | | | | (1.9 | ) | | — | | | | (2.1 | ) | | | |
| | | | | | | | | | | | | | | | | | | | | |
Other income (expense), net | | $ | (71.2 | ) | | (15 | )% | | $ | (17.7 | ) | | (4 | )% | | $ | 53.5 | | | 75 | % |
| | | | | | | | | | | | | | | | | | | | | |
45
Interest expense increased due to general increases in interest rates on our variable rate debt. The following table compares the average outstanding debt levels and interest rates on borrowed funds for the years ended December 31, 2004 and 2005 (amounts in millions):
| | | | | | | | | | | | | | | |
| | | Year Ended
December 31, | | | Increase (Decrease) | |
Average Outstanding Balances | | 2004 | | | 2005 | | | Amount | | | Percent | |
Total average balances | | $ | 490.9 | | | $ | 468.4 | | | ($ | 22.5 | ) | | (4.6 | )% |
Average interest rate | | | 6.54 | % | | | 7.66 | % | | | | | | | |
Foreign exchange gains increased primarily due to a stronger average U.S. dollar versus the Japanese yen when compared to the similar prior year.
Other derivative gains primarily increased as a result of realized and unrealized gains on cross currency interest rate swap contracts from the effects of a stronger U.S. dollar versus the Japanese yen when compared to 2005 and general increases in interest rates, and realized and unrealized gains on fuel contracts from the effects of rising fuel prices. Prior to 2004, fuel hedges were primarily classified as a component of cost of sales as the instruments met the requirements to be considered an effective hedge under SFAS 133.
The write off of recapitalization transaction costs related to the cancelled income deposit securities (IDS) offering was charged to earnings in 2004 and the write off of deferred financing costs related to the refinancing of our Former Credit Facility was charged to earnings in 2005.
Other income (expense), net, fluctuated in 2005 resulting from the classification in 2005 of expenses related to one of our two aircraft as other expense. In March 2005, we entered into a two-year charter arrangement of the aircraft with a third party. As a result, expenses in 2005 related to this aircraft are included in other, net of charter income. Previously, the aircraft was used primarily for internal use and its related expenses were classified as a component of selling, general and administrative expenses, net of incidental rental income.
Year Ended December 31, 2004 Compared to the Year Ended December 31, 2003.
Revenue. The following table compares selected segment revenue data presented in amount and as a percentage of total revenue for the years ended December 31, 2003 and 2004, and presents the corresponding change in amount and percentage between the periods (amounts in millions):
| | | | | | | | | | | | | | | | | | | | |
| | | Year Ended December 31, | | | Increase (Decrease) | |
| | | 2003 | | | 2004 | | | Amount | | Percent | |
Net sales and revenues: | | | | | | | | | | | | | | | | | | | | |
At-sea processing | | $ | 254.1 | | | 62 | % | | $ | 289.1 | | | 63 | % | | $ | 35.0 | | 14 | % |
Land-based processing | | | 181.5 | | | 44 | | | | 196.1 | | | 42 | | | | 14.6 | | 8 | |
Intersegment elimination | | | (24.2 | ) | | (6 | ) | | | (23.5 | ) | | (5 | ) | | | 0.7 | | 3 | |
| | | | | | | | | | | | | | | | | | | | |
Total sales and revenues | | $ | 411.4 | | | 100 | % | | $ | 461.7 | | | 100 | % | | $ | 50.3 | | 12 | % |
| | | | | | | | | | | | | | | | | | | | |
At-sea processing sales increased primarily as a result of higher sales volumes of roe and carryover pollock surimi products inventory from the prior year, which is partially offset by lower sales prices during 2004. Land-based processing sales increased primarily due to increased catfish sales prices and higher scallop sales volumes during 2004.
46
Gross profit.The following table compares selected segment gross profit data presented in amount and as a percentage of related segment revenue for the years ended December 31, 2003 and 2004, and presents the corresponding change in amount and percentage between the periods (amounts in millions):
| | | | | | | | | | | | | | | | | | | | | |
| | | Year Ended December 31, | | | Increase (Decrease) | |
| | | 2003 | | | 2004 | | | Amount | | | Percent | |
Gross profit: | | | | | | | | | | | | | | | | | | | | | |
At-sea processing | | $ | 90.8 | | | 36 | % | | $ | 86.2 | | | 30 | % | | $ | (4.6 | ) | | (5 | )% |
Land-based processing | | | 23.1 | | | 13 | | | | 13.8 | | | 7 | | | | (9.3 | ) | | (40 | ) |
Intersegment elimination | | | (11.8 | ) | | (49 | ) | | | (11.1 | ) | | (47 | ) | | | 0.7 | | | (6 | ) |
| | | | | | | | | | | | | | | | | | | | | |
Total gross profit | | $ | 102.1 | | | 25 | % | | $ | 88.9 | | | 19 | % | | $ | (13.2 | ) | | 13 | % |
| | | | | | | | | | | | | | | | | | | | | |
At-sea processing gross profit decreased in 2004 both in amount and as a percentage of related revenue primarily as a result of the sale of the lower grade carryover 2003 B season pollock surimi inventory that we sold at a lower margin and additional purchase of CDQ, which are partially offset by the revenue factors described above. Land-based processing gross profit also decreased in amount and as a percentage of related revenue primarily as a result of higher catfish purchase and production costs and lower production yields, which are partially offset by the revenue factors described above. The lower production yields were largely due to processing smaller, less meaty fish, which resulted from less frequent feeding patterns by catfish farmers.
Operating expenses. The following table compares selected operating expenses in amount and as a percentage of total revenue for the years ended December 31, 2003 and 2004, and presents the corresponding change in amount and percentage between the periods (amounts in millions):
| | | | | | | | | | | | | | | | | | | |
| | | Year Ended December 31, | | | Increase (Decrease) | |
| | | 2003 | | | 2004 | | | Amount | | | Percent | |
Operating expenses: | | | | | | | | | | | | | | | | | | | |
Selling, general and administrative | | $ | 35.3 | | 9 | % | | $ | 33.0 | | 7 | % | | $ | (2.3 | ) | | (7 | )% |
Equity-based compensation | | | 4.7 | | 1 | | | | 2.9 | | 1 | | | | (1.8 | ) | | (38 | ) |
Amortization and depreciation | | | 3.2 | | 1 | | | | 3.1 | | 1 | | | | (0.1 | ) | | (3 | ) |
Goodwill impairment | | | — | | — | | | | 7.2 | | 1 | | | | 7.2 | | | | |
| | | | | | | | | | | | | | | | | | | |
Total operating expenses | | $ | 43.2 | | 11 | % | | $ | 46.2 | | 10 | % | | $ | 3.0 | | | 7 | % |
| | | | | | | | | | | | | | | | | | | |
Selling, general and administrative expenses, excluding equity-based compensation, were higher in 2003 primarily due to higher selling, marketing and retirement costs as compared to 2004. The change in equity-based compensation expense resulted primarily from the change in the estimated fair value of options accounted for under variable accounting. Amortization and depreciation remained relatively consistent between periods. During 2004, we wrote off goodwill related to our investment in our catfish operations.
47
Other income (expense), net. The following table compares selected other income (expense), net in amount and as a percentage of total revenue for the years ended December 31, 2003 and 2004, and presents the corresponding change in amount and percentage between the periods (amounts in millions):
| | | | | | | | | | | | | | | | | | | | | |
| | | Year Ended December 31, | | | Change | |
| | | 2003 | | | 2004 | | | Amount | | | Percent | |
Other income (expense), net: | | | | | | | | | | | | | | | | | | | | | |
Interest expense | | $ | (40.6 | ) | | (9 | )% | | $ | (39.3 | ) | | (9 | )% | | $ | 1.3 | | | 3 | % |
Foreign exchange losses, net | | | (4.0 | ) | | (1 | ) | | | (5.8 | ) | | (1 | ) | | | (1.8 | ) | | (45 | ) |
Other derivatives losses, net | | | — | | | — | | | | (7.1 | ) | | (1 | ) | | | (7.1 | ) | | | |
Write off of recapitalization transaction costs | | | — | | | — | | | | (19.2 | ) | | (4 | ) | | | (19.2 | ) | | | |
Other income (expense), net | | | 0.3 | | | — | | | | 0.2 | | | — | | | | (0.1 | ) | | (33 | ) |
| | | | | | | | | | | | | | | | | | | | | |
Other income (expense), net | | $ | (44.3 | ) | | (10 | )% | | $ | (71.2 | ) | | (15 | )% | | $ | (26.9 | ) | | (61 | )% |
| | | | | | | | | | | | | | | | | | | | | |
Interest expense decreased primarily due to reductions in the outstanding balance of our revolving credit facility during 2004. The following table compares the average outstanding debt levels and interest rates on borrowed funds for the years ended December 31, 2003 and 2004 (amounts in millions):
| | | | | | | | | | | | | | | |
| | | Year Ended
December 31, | | | Increase (Decrease) | |
Average Outstanding Balances | | 2003 | | | 2004 | | | Amount | | | Percent | |
Total average balances | | $ | 523.4 | | | $ | 490.9 | | | $ | (32.5 | ) | | (6 | )% |
Average interest rate | | | 5.79 | % | | | 6.54 | % | | | | | | | |
Foreign exchange losses and other derivative losses increased in 2004 primarily due to the weakness of the average U.S. dollar versus the Japanese yen when compared to 2003. This increase was primarily attributable to unrealized losses on foreign exchange contracts, partially offset by unrealized gains recognized during the period related to the time value portion of our financial derivatives designated as hedges. The unrealized gains were related to the time value portion of the foreign exchange contracts that result from the interest rate differential between the U.S. and Japan.
Other derivative losses increased primarily due to unrealized losses on cross currency swaps.
The non recurring write off of recapitalization transaction costs related to the cancelled income deposit securities (IDS) offering was charged to earnings in 2004.
Seasonality
The U.S. Bering Sea pollock fishery is split into two distinct fishing seasons, known as the “A” and “B” seasons. The A season opens in January and typically ends in April. During the A season, pollock are spawning and therefore carry more high-value roe, making this season the more profitable one. During the A season, we also produce other products such as surimi and fillet blocks, although yields on these products are slightly lower in A season compared to B season due to the prioritization of roe production in the A season. Although the A season typically accounts for approximately 40% of our year’s total pollock harvest measured by weight, it represents a majority of our revenues for the year due to the higher value of roe that is recovered during the A season.
The pollock B season occurs in the latter half of the year, typically beginning in June and extending through the end of October. The primary products produced in the B season are surimi and fillet blocks. The B season typically accounts for approximately 60% of our year’s total pollock harvest.
The freezer-longliner Pacific cod fishery is divided into two seasons. Of the annual quota, approximately 60% is allocated to the A season and the remaining 40% is allocated to the B season. The A season begins
48
January 1st and runs until our portion of the season quota is caught, and the B season begins in mid-August and runs until our portion of the season quota is caught.
To illustrate the seasonal impact of our distinct fishing seasons for all of our operations, the table below shows our quarterly dispersion of our revenues and gross profit, expressed in terms of percentage, for the years ended December 31, 2003, 2004, and 2005:
| | | | | | | | | | | | |
| | | A Season | | | B Season | |
| | | Q1 | | | Q2 | | | Q3 | | | Q4 | |
Revenues: | | | | | | | | | | | | |
2003 | | 27 | % | | 30 | % | | 20 | % | | 23 | % |
2004 | | 29 | | | 28 | | | 20 | | | 23 | |
2005 | | 30 | | | 24 | | | 19 | | | 27 | |
Gross profit: | | | | | | | | | | | | |
2003 | | 40 | | | 32 | | | 18 | | | 10 | |
2004 | | 47 | | | 28 | | | 21 | | | 4 | |
2005 | | 49 | | | 19 | | | 21 | | | 11 | |
Our fishing seasons, including the important January-to-April pollock season, straddle more than one quarter. Additionally, the timing of our sales fluctuates from quarter to quarter. As a result, the timing of the recognition of significant amounts of revenues can vary from one quarter to another.
Historically the gross profit generated as a percentage of revenues in the fourth quarter has been less than the prior three quarters of each year. This is due primarily to less high-margin roe sales and the timing of the sales of B season production in our at-sea processing segment. During the fourth quarter of 2004, gross profits declined below historical levels primarily as a result of higher catfish farm prices and lower catfish processing yields in our land-based processing segment. Revenues and gross profits also declined below historical levels during the second quarter of 2005, primarily as a result of a larger portion of our A season pollock roe being sold in the first quarter rather than being spread over the first and second quarters of 2005, as compared to prior years. Pollock roe products generate higher profit margins than other products.
Financing Activities
Refinancing of Credit Agreement
On October 6, 2005, we entered into a Third Amended and Restated Credit Agreement (New Credit Facility) with a group of banks and other financial institutions, some of which were parties to our former Credit Agreement (Former Credit Facility). The New Credit Facility amended and restated our Former Credit Facility to provide for credit extensions of borrowings not to exceed $520.0 million. The terms of the new credit facility are summarized as follows:
| | • | | Revolving credit facility commitment of $75.0 million, with a sub-credit facility for letters of credit, maturing on September 30, 2011; |
| | • | | Term A loan in the amount of $125.0 million funded at closing, payable in quarterly payments of interest and principal, maturing on September 30, 2011; |
| | • | | Term B-1 loan in the amount of $140.0 million funded at closing, payable in quarterly payments of interest and principal, maturing on September 30, 2012; |
| | • | | Term B-2 credit facility commitment of $180.0 million available on a delayed draw basis at any time within the first seven months of closing, and requiring that any proceeds of such facility be used to pay the principal, interest, call premium and other amounts outstanding on the Senior Subordinated Notes, payable in quarterly payments of interest and principal, maturing on September 30, 2012; |
| | • | | Term A and B loans require additional excess cash flow payments similar to the Former Credit Facility. |
49
The interest on the revolving credit facility and term loans is determined based on rates that are calculated using a Eurodollar rate or base rate at our option. For the revolving credit facility and Term A loans, the amount of the margin is determined by results of financial covenant ratios. Such margins range from 1.25% to 1.75% for Eurodollar rate loans and 0.25% to 0.75% for base rate loans. For the Term B loans, the margins are 1.75% for Eurodollar rate loans and 0.75% for base rate loans.
The New Credit Facility is secured by substantially all of our assets including intangible assets. Under the terms of the New Credit Facility, we are required to meet certain financial tests, including a maximum leverage ratio and a minimum fixed charge coverage ratio. The New Credit Facility contains certain covenants which, among other things, limit the incurrence of additional indebtedness, liens, and encumbrances, changes of control, changes in the nature of the business, investments, dividends and other restricted payments, prepayments of certain indebtedness, certain transactions with affiliates, asset sales, acquisitions, capital expenditures, mergers and consolidations, sales of receivables and other matters customarily restricted in such agreements. In addition, the New Credit Facility contains customary negative and affirmative covenants and customary events of default, funding conditions, representations and warranties and other customary provisions for senior secured credit facilities.
Notwithstanding the above maturity dates, in the event the 11 1/2% Senior Discount Notes issued by ASG Consolidated and ASG Finance remain outstanding as of May 1, 2011, then all amounts outstanding under the New Credit Facility, including revolving credit borrowings, letters of credit and Term A and B loans, will become immediately due and payable in full on such date. As of December 31, 2005, there was $278.1 million of outstanding indebtedness under the New Credit Facility, with approximately $60.0 million of unused borrowing capacity under the revolving credit facility.
We incurred $2.9 million in financing costs associated with the New Credit Facility and wrote off $10.9 million of the carrying balance of deferred financing costs resulting from the extinguishment of debt during 2005 and a portion of the new financing costs. In 2006, if we redeem our outstanding Senior Subordinated Notes with funds to be borrowed under the Term B-2 delayed draw credit facility, we will write off up to an additional $10.0 million of deferred financing costs. We delivered notice of our intent to redeem the Senior Subordinated Notes on March 27, 2006. We expect the redemption will occur on April 27, 2006.
April 2002 ASG Recapitalization
Senior Subordinated Notes. On April 18, 2002, we issued and sold $175.0 million principal amount of 10 1/8% senior subordinated notes (Senior Subordinated Notes) due 2010 as part of a recapitalization. Concurrently with the offering of these notes, we entered into our Former Credit Facility. As part of the April 2002 recapitalization, we used the proceeds of the notes offering, together with borrowings of $325.9 million under our Former Credit Facility, to:
| | • | | repay all outstanding debt under our old credit facilities; |
| | • | | repay all amounts outstanding (including accrued interest), under two senior subordinated promissory notes issued by our affiliates, ASC, Inc. and Holdings, to Norway Seafoods, the former owner of our business; |
| | • | | pay related fees and expenses; and |
| | • | | distribute the remainder of the borrowed amounts to our member. |
Former Credit Facility. In connection with our April 2002 recapitalization, we entered into a senior credit agreement with a syndicate of banks, the administrative agent of which was Bank of America, N.A. Our Former Credit Facility consisted of a $75.0 million revolving credit facility and $370.0 million in term loans ($90.0 million Term A and $280.0 million Term B). Our obligations under our Former Credit Facility were secured by substantially all our assets.
50
In December 2002, we entered into an amendment to the Former Credit Facility that provided, among other things, for an increase in the principal amount of the Term B loans by $50 million and consent to the acquisition of Southern Pride. We used the additional borrowing capacity to fund our acquisition of Southern Pride, to make certain payments related to the acquisition, pay related fees and expenses and for general corporate purposes.
During January 2004, we obtained an amendment to our debt covenants, which, among other things, adjusted the required leverage ratios as of December 31, 2003 and March 31, 2004, primarily due to adverse surimi prices.
In October 2004, we entered into another amendment to the Former Credit Facility that, among other things: (1) permitted the offering of the Senior Discount Notes by ASG Consolidated; (2) provided for guarantees by ASG Consolidated and its wholly-owned subsidiary, ASG Finance, Inc., of our obligations under the credit facility and a pledge of its ownership interests in ASG to secure the guarantee; (3) permitted the sale of certain distribution related assets of Southern Pride Catfish Trucking, Inc. up to an aggregate fair market value of $7.5 million; (4) amended the required leverage ratio beginning September 30, 2004 and made other covenant modifications to provide necessary covenant relief to us primarily due to adverse surimi prices and a decline in the performance of our catfish operations; and (5) excluded certain expenses we incurred from the definition of EBITDA (earnings before interest, tax, depreciation and amortization) for our covenant calculations, including the write-off of offering costs of up to $19.0 million related to our cancelled public IDS offering. The Former Credit Facility was paid off in full with proceeds of the New Credit Facility described above.
Senior Discount Notes
On October 19, 2004, ASG Consolidated LLC, our direct parent (ASG Consolidated), completed an offering of 11 1/2% Senior Discount Notes in the aggregate principal amount of $196.0 million at maturity in November 2011. The Senior Discount Notes were issued at a substantial discount from their aggregate principal amount at maturity to generate gross proceeds of $124.9 million. As of December 31, 2005, the carrying amount of this debt was approximately $142.8 million, which is not recorded on our consolidated balance sheet. The accreted value of each note increases from the date of issuance until November 1, 2008 such that the accreted value at that date will equal the principal amount at maturity. The carrying balance on the notes will accrete using the effective interest method from origination through the period ending November 1, 2008. No interest will be paid during this period. Thereafter, interest will accrue and be payable semi-annually on May 1 and November 1 of each year at a fixed annual rate of 11 1/2%. The first interest-only payment is due on May 1, 2009.
The proceeds of the Senior Discount Notes were distributed, directly or indirectly, to American Seafoods Consolidated LLC (American Seafoods Consolidated). American Seafoods Consolidated distributed such amount to its parent, American Seafoods Holdings LLC (Holdings), which used approximately $32.7 million to repurchase its outstanding redeemable preferred equity units and approximately $5.5 million to repay its indebtedness. ASG Consolidated also incurred related fees and expenses totaling $4.3 million. The balance of approximately $81.9 million was distributed to ASLP, which in turn distributed the funds to its partners.
ASG Consolidated is wholly dependent on distributions from us to meet its debt service obligations. Our ability to make distributions to ASG Consolidated will depend upon our operating results. We are subject to restrictions under our New Credit Facility and the indenture governing our Senior Subordinated Notes. We and our subsidiaries have not guaranteed the repayment of the Senior Discount Notes.
Officer Loan
On July 2, 2002, we loaned $6.0 million to Bernt O. Bodal, our Chairman and Chief Executive Officer, to finance his purchase of equity interests in ASLP. The interest rate on this loan reset each January 1, April 1, July 1 and October 1 to the prime rate plus 1/2 percent. In October 2004, Mr. Bodal repaid the loan in full in the amount of approximately $6.3 million comprised of principal and interest.
51
Non-Cash Capital Contribution
During 2004 and 2005, ASLP made non-cash capital contributions to us of $20.0 million and $5.3 million in receivables, respectively, from us related to equity-based compensation and the extinguishment of its receivable.
Tax Distributions
We make distributions to our sole member, ASG Consolidated, for the tax liabilities it incurs on our taxable income. More specifically, we will make distributions to ASG Consolidated in amounts equal to the theoretical tax on our taxable income (determined without regard to deductions for interest on the notes or other deductions incurred by entities above us), which ASG Consolidated will in turn distribute to its owners (whether or not such amounts are required by such owners actually to pay taxes on the income that is allocated to them). These payments are recorded as distributions to member on the statements of member’s equity (deficit).
During 2004 and 2005, ASC, Inc. received a tax refund in the amount of $2.2 million and $0.6 million, respectively, of prior year’s taxes. ASC, Inc. remitted the amount of its tax refund related to 2004 to us, which was recorded as a tax refund contribution on the statements of member’s equity (deficit) in 2004.
Liquidity and Capital Resources
Overview
Our long-term debt as of December 31, 2005, consists of amounts borrowed pursuant to our New Credit Facility and the Senior Subordinated Notes.
Our short-term and long-term liquidity needs arise primarily from interest payments on our debt, which we expect to be between $32.0 million and $37.0 million for 2006, based on our current capital structure. We expect to redeem our Senior Subordinated Notes on April 27, 2006. If we do so, our short-term liquidity needs will be between $33.0 million and $38.0 million for 2006. The following schedule summarizes our scheduled future principal payments on our long-term debt as of December 31, 2005 (in millions):
| | | | | | | | | | | | | | | | | | | | | |
| | | Year Ending December 31, | | | | |
| | | 2006 | | 2007 | | 2008 | | 2009 | | 2010 | | Thereafter | | Total |
Principal payments | | $ | 8.4 | | $ | 11.6 | | $ | 14.7 | | $ | 17.8 | | $ | 206.1 | | $ | 194.5 | | $ | 453.1 |
| | | | | | | | | | | | | | | | | | | | | |
In addition, the New Credit Facility requires excess cash flow principal payments beginning in March 2007, similar to those under the Former Credit Facility, which have not been included in the above schedule. In the years ended December 31, 2003, 2004 and 2005, we made excess cash flow payments of $33.4 million, $8.3 million and $10.0 million, respectively. In 2005, we also made additional discretionary principal payments on the term loans of $18.0 million prior to the refinancing of the Former Credit Facility. Further, we decreased our borrowings under our revolving credit facility by $1.5 million during 2005, comprised primarily of principal payments of $11.0 million, which is partially offset by $9.5 million in borrowings used to fund the redemption by ASLP of limited partnership units in November 2005.
Additional cash may be needed to support our working capital requirements resulting from the seasonality of our business and potential acquisitions to support business growth. We expect to fund our liquidity needs primarily with cash generated from operations and, to the extent necessary, through additional borrowings under our revolving line of credit, which matures in 2011. If we redeem our Senior Subordinated Notes on April 27, 2006 as expected, we expect to fund the payment of the principal, interest, call premium and other amounts outstanding using the delayed draw term debt commitment under our New Credit Facility.
52
We conduct all of our operations through our subsidiaries. As a result, we are wholly dependent on distributions from our subsidiaries to meet our debt service obligations. Therefore, our ability to make distributions to ASG Consolidated and payments to our debt holders will depend upon the operating results of our subsidiaries, and is subject to restrictions under the New Credit Agreement and the indenture governing our Senior Subordinated Notes, as well as any future indebtedness incurred by our subsidiaries.
The New Credit Agreement contains a credit commitment of $180.0 million available on a delayed draw basis at any time before May 6, 2006, and requires that any proceeds of such facility be used to pay the principal, interest, call premium and other amounts outstanding on the Senior Subordinated Notes, which we expect to occur on April 27, 2006. To the extent this does not occur, the Senior Subordinated Notes mature and become payable in full on April 15, 2010. Additionally, ASG Consolidated’s Senior Discount Notes mature and are payable in full in the amount of $196.0 million in November 2011. Accordingly, we will need to refinance our credit facilities at or prior to their maturities on terms that permit payments sufficient to pay principal on these debt instruments at maturity, or else we will have to refinance them. We might not be able to refinance them at such time on such terms, and our ability to do so will depend both on our own operating performance and on the state of credit markets at the time. Our New Credit Facility also requires us to make excess cash flow payments, as defined in the agreement, which reduce the principal balance on the bank term loans and future quarterly principal payments.
Historical Cash Flow
Year Ended December 31, 2005 Compared to the Year Ended December 31, 2004.
Cash flows. The following table compares selected cash flow information for the years ended December 31, 2004 and 2005, and presents the corresponding change in amount and percentage between the periods (amounts in millions):
| | | | | | | | | | | | | | | |
| | | Year Ended
December 31, | | | Cash Flow
Increase (Decrease) | |
| | | 2004 | | | 2005 | | | Amount | | | Percent | |
Cash flows from (used in): | | | | | | | | | | | | | | | |
Operating activities | | $ | 68.7 | | | $ | 73.4 | | | $ | 4.7 | | | 7 | % |
Investing activities | | | (10.7 | ) | | | (24.8 | ) | | | (14.1 | ) | | (132 | ) |
Financing activities | | | (62.2 | ) | | | (41.9 | ) | | | 20.3 | | | 33 | |
| | | | | | | | | | | | | | | |
Net increase (decrease) in cash and equivalents | | $ | (4.2 | ) | | $ | 6.7 | | | $ | 10.9 | | | 260 | % |
| | | | | | | | | | | | | | | |
Cash flow from operating activities was slightly higher in 2005 primarily resulting from increases in income, which is partially offset by increases in components of working capital, principally comprised of higher inventories, deferred costs and prepaid expenses that were partly offset by increases in accounts payable and accrued expenses as compared to 2004.
Cash flow used in investing activities was higher in 2005 due to a $10.1 million increase in capital expenditures and fishing rights, which is comprised of the acquisition of a catcher vessel, related gear and equipment and fishing rights for $10.0 million, excluding a $0.7 million note payable. Cash flow used in investing activities was also lower in 2004 due to the collection of a $6.0 million related party loan from our chief executive officer, which is partially offset by the purchase of the remaining minority ownership interest in Pacific Longline Company LLC for $1.8 million.
Cash used in financing activities was higher in 2004 primarily because of an increase in the net repayment of our debt of $46.2 million as compared to $28.0 million in 2005, which is partially offset by increases in distributions to members of $7.4 million and financing costs of $2.1 million in 2005 as compared to the same period in 2004. As a policy, we repay our debt as required by our loan agreements, and we pay down our revolving and term debt to reduce our interest cost and improve our leverage ratio as cash is available from our
53
operating activities. Additionally in 2004, we incurred costs related to our offering of income deposit securities of $13.9 million and received capital contributions of $2.2 million.
Year Ended December 31, 2004 Compared to the Year Ended December 31, 2003.
Cash flows. The following table compares selected cash flow information for the years ended December 31, 2003 and 2004, and presents the corresponding change in amount and percentage between the periods (amounts in millions):
| | | | | | | | | | | | | | | |
| | | Year Ended
December 31, | | | Cash Flow
Increase (Decrease) | |
| | | 2003 | | | 2004 | | | Amount | | | Percent | |
Cash flows from (used in): | | | | | | | | | | | | | | | |
Operating activities | | $ | 46.3 | | | $ | 68.7 | | | $ | 22.4 | | | 48 | % |
Investing activities | | | (13.3 | ) | | | (10.7 | ) | | | 2.6 | | | 20 | |
Financing activities | | | (32.9 | ) | | | (62.2 | ) | | | (29.3 | ) | | (89 | ) |
| | | | | | | | | | | | | | | |
Net increase (decrease) in cash and equivalents | | $ | 0.1 | | | $ | (4.2 | ) | | $ | (4.3 | ) | | | |
| | | | | | | | | | | | | | | |
Cash flow from operating activities increased in 2004 primarily resulting from a reduction in components of working capital, primarily due to an increase in collection of accounts receivable and the sale of larger volumes of inventory held over from the prior year B season as compared to 2003.
Cash flow used in investing activities decreased in 2004 primarily due to the collection of a $6.0 million related party loan from our chief executive officer. This amount was partially offset by our January 2004 purchase of the remaining minority ownership interest in PLC for $1.8 million, a $0.6 million increase in property, vessels and equipment purchases in 2004, and a $1.4 million increase in capital projects in progress.
Cash used in financing activities increased in 2004 primarily as a result of a net increase in the repayment of our long-term debt, including the revolving credit facility, and incurring the costs related to the recapitalization transaction. Additionally in 2004, we incurred costs related to our offering of income deposit securities and subordinated notes, other financing costs and made higher tax and other distributions to our member.
At December 31, 2005, we had $7.8 million of cash and cash equivalents, and $60.0 million available under our revolving credit facility. We believe that the cash we expect to generate from operations and borrowing capabilities under our revolving credit facility will be sufficient to meet our liquidity requirements in the foreseeable future.
Other Factors Impacting Liquidity
Credit Facilities. A significant portion of our credit facilities will mature during the years 2010 to 2012. We may be unable to renew or refinance the credit facilities at, or prior to, that time, or may complete such renewal or refinancing at less favorable terms. If we were unable to renew or refinance our credit facilities, our failure to repay all amounts due on the maturity date would cause a default.
Cross Currency Interest Rate Swaps. In August 2004, primarily in order to mitigate liquidity risk related to the impact of Japanese yen fluctuations on our foreign exchange portfolio and related collateral agreement, we entered into variable to fixed-rate cross currency interest swap contracts with an aggregate notional amount of $75.0 million in anticipation of the completion of the IDS offering and subordinated notes. Under the terms of these contracts, we paid a fixed rate of interest in Japanese yen and received payments on a variable rate of interest in U.S. dollars based on the three-month LIBOR rate. The objective of these instruments was to reduce our exposure to interest rate risk related to our new credit facility that was to have been in place upon
54
consummation of the IDS offering, and to provide additional risk management against Japanese currency fluctuations related to our sales to Japan. As these instruments were not been designated as hedges, any unrealized gains and losses resulting from the change in fair value were recognized in our earnings as a component of gain or loss on other derivatives. Between September 2004 and October 2005, we terminated all of these cross currency swaps for nominal fees. In November 2005, we entered into two fixed-rate cross currency interest swap contracts with an aggregate notional amount of $50.0 million. Under the terms of these contracts, we pay a fixed rate of interest in Japanese yen and receive payments on a variable rate of interest in U.S. dollars based on the U.S. dollar three-month LIBOR rate. The objective of these instruments is to reduce our exposure to interest rate risk related to our credit facility and to provide additional risk management against Japanese currency fluctuations related to our Japanese yen sales. As we have not designated these contracts as hedges, any gains or losses are recognized in our consolidated statements of operations as applicable.
Tax Matters. We and our significant subsidiaries are flow-through entities for income tax purposes. We have been and will continue to be obligated, therefore, to make distributions to our member for the tax liabilities it incurs on their allocated portion of our taxable income. More specifically, we will make distributions to our sole member, ASG Consolidated, as allowed by our credit facilities, in amounts equal to the theoretical tax on our taxable income (determined without regard to deductions for interest on the notes or other deductions incurred by entities above us), which ASG Consolidated will in turn distribute to its members (without regard to the actual tax status of each member.)
Capital Expenditures. The majority of our capital expenditures relates to our catcher-processor fleet and includes items such as fishing gear, improvements to vessel factory processing equipment and major scheduled shipyard maintenance. Capital expenditures have been funded primarily from cash flows from operations and borrowings under our revolving credit facility. Major scheduled shipyard maintenance costs relate principally to our periodic overhauls and replacements performed generally on a three-year cycle. These costs are capitalized and depreciated over the period through the next scheduled major shipyard maintenance session.
Capital expenditures reflected below are additions to property, vessels and equipment that have been placed in service. Capital projects in process will be reclassified to property, vessels and equipment when completed and placed in service. The following table summarizes our capital expenditures and capital projects in process and repairs and maintenance expense for the years ended December 31, 2003, 2004 and 2005 (in millions):
| | | | | | | | | |
| | | Year Ended December 31, |
| | | 2003 | | 2004 | | 2005 |
Capital expenditures: | | | | | | | | | |
Purchase of property, vessels and equipment | | $ | 12.3 | | $ | 13.0 | | $ | 14.4 |
Reclassification of prior period capital projects in progress and deposit | | | — | | | 0.4 | | | 1.8 |
| | | | | | | | | |
Total capital expenditures | | | 12.3 | | | 13.4 | | | 16.2 |
Capital projects in process | | | 0.4 | | | 1.8 | | | 2.0 |
| | | | | | | | | |
Total capital expenditures and capital projects in process | | $ | 12.7 | | $ | 15.2 | | $ | 18.2 |
| | | | | | | | | |
Repairs and maintenance expense | | $ | 8.4 | | $ | 8.0 | | $ | 9.7 |
| | | | | | | | | |
Historically, fluctuations in amounts of capital expenditures are primarily attributable to the timing of major scheduled shipyard maintenance and the purchase of fishing gear. Additionally in 2005, capital expenditures include our acquisition of a catcher vessel and related gear and equipment for $1.5 million, excluding the purchase cost assigned to fishing rights of $9.3 million. Fluctuations in the carrying balance of capital projects in process are caused primarily by the timing of the completion of projects related to our fishing vessels. At December 31, 2005, capital projects in process include an opportunistic purchase of used processing equipment of $0.7 million related to our fishing vessels. Fluctuations in the amount of repairs and maintenance expense primarily results from of the timing of vessel repairs and maintenance and the incurrence of unexpected vessel repairs.
55
During 2006 and 2007, we estimate that annual capital expenditures will be $15.0 million to $18.0 million.
Business Development. From time to time, we may acquire businesses and operating assets such as vessels with fishing rights. We expect that these acquisitions will be funded from cash flow from operations or borrowings under our credit facility.
Debt Covenants
Our New Credit Facility requires us to meet certain financial tests, including a maximum leverage ratio and a minimum fixed charge coverage ratio. In addition, the New Credit Facility contains certain covenants which, among other things, limit the incurrence of additional indebtedness, liens and encumbrances, changes in the nature of our business, investments, dividends and other restricted payments, prepayments of certain indebtedness, certain transactions with affiliates, asset sales, acquisitions, capital expenditures, mergers and consolidations, sales of receivables and other matters customarily restricted in such agreements. The New Credit Facility also contains customary negative and affirmative covenants and customary events of default, funding conditions, representations and warranties and other customary provisions for senior secured credit facilities. Such restrictions could limit our ability to respond to certain market conditions, meet our capital spending program, provide for unanticipated capital investments or take advantage of business opportunities. The indentures governing our Senior Subordinated Notes and Senior Discount Notes impose similar restrictions on the operation of our business. The leverage ratio is calculated for purposes of the New Credit Facility based on the ratio of Consolidated EBITDA to Consolidated Funded Debt (both as defined in the New Credit Facility.) See “—Financing Activities.”
Contractual Obligations and Commercial Commitments
The following table provides aggregated information about our contractual obligations as of December 31, 2005 (in thousands):
| | | | | | | | | | | | | | | |
| | | Payments Due by Period (in thousands) |
Contractual Obligations | | Total | | Less than 1 year | | 1-3 years | | 3-5 years | | After 5
years |
Long-term debt, principal payments only | | $ | 453,088 | | $ | 8,431 | | $ | 26,237 | | $ | 223,894 | | $ | 194,526 |
Estimated interest payments on long-term debt (1) | | | 183,600 | | | 35,500 | | | 69,000 | | | 62,100 | | | 17,000 |
Operating leases (2) | | | 15,672 | | | 3,519 | | | 6,013 | | | 3,047 | | | 3,093 |
Unconditional purchase obligations: | | | | | | | | | | | | | | | |
Community development quota and catcher boat commitments (3) | | | 83,041 | | | 29,510 | | | 53,531 | | | — | | | — |
Catfish purchases | | | 44,240 | | | 22,940 | | | 7,100 | | | 7,100 | | | 7,100 |
Fuel purchases | | | 9,900 | | | 9,900 | | | — | | | — | | | — |
Purchase orders | | | 1,969 | | | 1,969 | | | — | | | — | | | — |
Employment and consulting contracts | | | 2,970 | | | 1,485 | | | 1,485 | | | — | | | — |
| | | | | | | | | | | | | | | |
Total contractual cash obligations | | $ | 794,480 | | $ | 113,254 | | $ | 163,366 | | $ | 296,141 | | $ | 221,719 |
| | | | | | | | | | | | | | | |
| (1) | Estimated interest payments are based on the interest rates in effect as of December 31, 2005. Estimated interest payments related to our Revolving Credit Facility are based on an estimated average outstanding principal balance of $20.0 million, plus an annual loan fee equal to 0.5% of the $55.0 million estimated average unused portion of available borrowings. |
| (2) | Includes payments to ASLP for aircraft leases. ASG terminated one of its aircraft lease obligations to ASLP in March 2006. |
| (3) | Estimated based on 2006, 2007 and 2008 total allowable catch and allocated quotas. |
56
The table above excludes derivative contracts that contain net settlement provisions. Under these provisions we may potentially be required to make cash payments to the counterparty as described in “Note 5—Derivative Instruments” in our consolidated financial statements included elsewhere in this annual report. The settlements under these contracts are variable based on the notional amounts and changes in the underlying indices.
Critical Accounting Policies and Estimates
Management’s discussion and analysis of our financial condition and results of operations is based on our consolidated financial statements, which have been prepared in accordance with accounting principles generally accepted in the United States of America. The preparation of financial statements requires us to make estimates and judgments that affect the reported amounts of assets, liabilities, revenues and expenses, and related disclosure of contingent assets and liabilities. On an on-going basis, we evaluate our critical accounting policies and estimates and base our estimates on historical experience and on various other assumptions that we believe to be reasonable under the circumstances, the results of which form the basis for making judgments about the carrying values of assets and liabilities that are not readily apparent from other sources. Actual results may differ from these estimates under different assumptions or conditions.
We believe the following critical accounting policies reflect the most significant judgments and estimates used in the preparation of our consolidated financial statements:
Foreign exchange contracts. We record gains and losses on foreign currency transactions following SFAS No. 133,Accounting for Derivative Instruments and Hedging Activities. Foreign exchange contracts are used to hedge the variability of future cash flows associated with Japanese yen and Euro denominated sales due to changes in foreign currency exchange rates. The effectiveness of the hedged transactions is measured by changes in spot rates and the gain or loss resulting from the change in time value is recognized currently in earnings. The unrealized gains and losses resulting from the change in spot rates, or the effective portion, are recorded in other comprehensive income. These gains and losses are recognized in revenues when the forecasted sales occur. Gains and losses resulting from all derivative instruments not designated or documented as hedges, and the ineffective portion of hedges, representing the time value component of the contract, are recognized currently in earnings. See “Item 1—Business—Risk Factors—Our business is subject to foreign currency fluctuations that could materially adversely affect our financial condition and liquidity.”
Long-Lived Assets. Long-lived assets and amortizable intangible assets are reviewed for impairment whenever events or changes in circumstances indicate that the carrying amount of an asset may not be recoverable. We have no indefinite life intangible assets except goodwill. Asset groups to be held and used are evaluated for impairment by comparing the carrying amount to the future net cash flows expected to be generated by the asset group. If the carrying amount of the assets exceeds the expected future net cash flows, undiscounted and without interest, the impairment to be recognized is measured by the amount by which the carrying amount of the assets exceeds the fair value of the asset groups. Asset groups to be disposed of are reported at the lower of the carrying amount or fair value less costs to sell. Additionally we periodically review the assigned useful lives used to compute depreciation and amortization of our long-lived assets to determine if such lives are still appropriate.
Goodwill. We assess goodwill for impairment by applying a fair value based test at least annually or on an interim basis if circumstances change or events occur that indicate that goodwill may be impaired. We have no other intangibles with an indefinite life. In accordance with SFAS No. 142,Goodwill and Other Intangible Assets, goodwill is evaluated for impairment by using a two-step process. Step 1 involves determining the fair value of the reporting unit, which is compared to the carrying amount of the reporting unit, including goodwill. If the carrying amount exceeds the fair value, then the goodwill may be impaired and Step 2 is then required. In Step 2, the implied value of the goodwill is determined as the difference between the fair value of the reporting unit and the fair value of its net assets. If the carrying amount of the goodwill exceeds the implied value, an impairment loss is recognized to the extent of the difference. In accordance with SFAS No. 142, we assign goodwill to the reporting units that we expect to benefit from the expected synergies of the business combinations that we have entered into.
57
Vessel maintenance. A significant portion of our operations take place on our vessels. On January 28, 2000, the purchase of our vessels was part of the total acquisition of our core business. Our vessels were recorded at their estimated fair market values, with approximately 60% categorized as vessel equipment and machinery with an estimated useful life of seven years and approximately 40% as vessel hull with an estimated useful life of twenty-five years. We depreciate these assets on a straight-line basis over their estimated useful lives.
We incur expenses to repair and maintain our vessels. Repairs and ordinary maintenance are expensed as incurred while significant additions and improvements are capitalized. To maintain our Det Norske Veritas class certification, the highest vessel certification in the industry, our vessels must undergo scheduled major shipyard maintenance every three to five years. As a part of this scheduled maintenance, we may also have major vessel components overhauled. The costs for this major shipyard maintenance are capitalized and charged to operations on a pro-rata basis during the period through the next scheduled major shipyard maintenance.
Valuation Accounts. We have four valuation accounts recorded on our balance sheet. The allowances for trade accounts receivable, promotions and miscellaneous other accounts receivable reflects management’s estimate of potential losses inherent in the accounts receivable balance. The allowance in the receivable from an insurance provider represents the estimated net loss related to insurance claims from a former provider now in bankruptcy. Management determines the allowance based on known troubled accounts, historical experience, and other currently available evidence. It is our policy to write off accounts as collectibility becomes remote. The allowance for trade accounts receivable balance was approximately $0.5 million and $0.6 million at December 31, 2004 and 2005, respectively. Total bad debt write-offs were $0.1 million, $0.6 million and $2.0 million for the years ended December 31, 2003, 2004 and 2005.
Equity-Based Compensation. Certain of our employees have equity-based compensation arrangements under which they received options to acquire partnership units of ASLP. We follow the intrinsic-value-based method of accounting prescribed by Accounting Principles Board (APB) Opinion No. 25, Accounting for Stock Issued to Employees,and related interpretations including FASB Interpretation No. 44,Accounting for Certain Transactions Involving Stock Compensation, an Interpretation of APB Opinion No. 25 to account for equity-based compensation. The related compensation cost has been pushed down to our financial statements, and the deferred compensation has been recorded as a contribution from our parent. We determined the amount of equity-based compensation recorded under APB No. 25 based on the excess of the fair value of ASLP’s partnership units above the exercise price of the option on the applicable measurement date. All of our equity-based compensation plans are variable, meaning we update our estimate of fair value of the ASLP units and adjust compensation expense each period. Since ASLP’s partnership units are not publicly traded, we engaged a valuation firm to determine the fair value as of December 31, 2005. For other dates, we estimated the fair value based on current operating results and the historical relationship of these results to the sales price of ASLP’s previous equity offerings, comparable industry information, and our expectations with respect to the sales price of our securities in proposed or contemplated future transactions.
Prospective Accounting Pronouncements.
The Financial Accounting Standards Board (FASB) issued SFAS No. 123 (revised 2004),Share-Based Payment (123R), in December 2004. SFAS No. 123R is a revision of SFAS No. 123,Accounting for Stock-Based Compensation, and supersedes Accounting Principles Board (APB) Opinion No. 25,Accounting for Stock Issued to Employees. SFAS No. 123R requires the fair value of employee awards issued, modified, repurchased or cancelled after implementation under share-based payment arrangements to be measured as of the date the award is issued, modified, repurchased or cancelled. The resulting cost will then be recognized in the statements of operations over the requisite service period. As we have no equity securities traded in a public market, we are required to implement SFAS No. 123R using the prospective transition method in 2006. We are in the process of determining the effect of the adoption of SFAS 123R at January 1, 2006.
58
In May 2005, the FASB issued SFAS No. 154,Accounting Changes and Error Corrections—a replacement of APB Opinion No. 20 and FASB Statement No. 3. SFAS No. 154 requires retrospective application for changes in accounting principles whenever practicable, rather than including the cumulative effect of an accounting change in net income in the period of change. SFAS No. 154 applies to voluntary changes in accounting principles and also changes required by new accounting pronouncements if specific transition provisions are not provided. We will implement this pronouncement on January 1, 2006. Upon adoption, we expect no effect on our results of operations and financial condition.
Item 7A.Quantitative and Qualitative Disclosures About Market Risk
Pollock Market Conditions. Each of the products produced from pollock has different pricing characteristics. The price of pollock roe is heavily influenced by the size and condition of roe skeins, color and freshness of the roe and the maturity of the fish caught. Catcher-processors are more likely to produce higher quality roe because they process the fish within hours of being caught, rather than several days later as is the case with inshore processors. In addition, roe prices are influenced by anticipated Russian and U.S. production and Japanese inventory carryover because roe is consumed almost exclusively in Japan. The U.S. Bering Sea pollock fishery commonly produces the highest quality roe.
The prices of surimi and fillets are influenced primarily by expected production in the U.S. and Russian pollock fisheries, and other factors such as carry-over inventories and changes in demand. Because surimi and fillet blocks often are composed of the same raw material, the demand for one product can influence the price of the other. Surimi and fillet blocks are also produced utilizing species of fish other than pollock, such as hake or itoyori species. However, due to differences in flesh attributes between pollock and other species, the surimi and block produced from other species are generally not used as substitutes for pollock products and thus have only a modest influence on pollock pricing. Fillet blocks are often supplied by both the U.S. Bering Sea pollock fishery and the Russian fisheries.
In 2003, 2004 and 2005, we harvested an aggregate of approximately 18.7%, 20.1% and 20.5%, respectively, of the total allowable catch in the U.S. Bering Sea pollock fishery. We are allocated 17.1% of the directed pollock catch under our Cooperative agreements, and we purchase the right for a period of time to harvest another 0.4% of the directed pollock catch from other vessels in our fishery, bringing us to 17.5% of the directed pollock catch (which is the maximum permitted harvesting allocation of the directed pollock catch by any single entity). Our share of the directed pollock catch represented approximately 15.1% of the total allowable catch. We supplemented our share of the directed pollock catch in 2003, 2004 and 2005 by purchasing approximately 36.0%, 54.0%, and 54.0% respectively, of the community development quota (or 3.6%, 5.4%, and 5.4% respectively, of the total allowable catch) from Alaska Community Development Groups, two of which are equity investors in ASLP.
Catfish Market Conditions. In the second half of 2003, many of the farmers from whom we purchase catfish increased their prices to levels that jeopardized our ability to maintain satisfactory profit margins in the catfish processing operations. The prices charged by catfish farmers have remained at relatively high levels, which have adversely affected our catfish processing results in 2005. Prices at which farmers are willing or able to sell their catfish to us could remain at levels that do not enable us to maintain satisfactory margins and do not allow us to continue these operations.
Since 2003 Southern Pride’s operating performance has decreased primarily as a result of increased fish costs combined with lower market prices. Such increased costs and lower market prices are generally consistent with recent industry wide trends. In September 2004, management concluded that Southern Pride’s operating results for the quarter ending September 30, 2004 would decline further as compared to recent quarters and that the conditions affecting this decline may continue to affect Southern Pride to a certain degree for the foreseeable future. Based on this conclusion, we recorded an impairment charge of approximately $7.2 million in the third quarter of 2004 related to the goodwill associated with Southern Pride. See “Item 1A—Risk Factors—Risks
59
Relating to Our Business—If prices at which we purchase catfish remain at high levels or increase, in either case without a proportionate increase in the prices at which we sell our catfish products, our ability to maintain profitability in our catfish processing operations will be adversely affected.”
Foreign Currency, Interest Rate and Commodity Hedging. We are exposed to cash flow and earnings risk from certain changes in the yen and euro foreign currency exchange rate, interest rates and diesel fuel prices. To mitigate the risk related to these factors, we utilize forward currency contracts, cross-currency swaps, interest rate swaps and other derivative commodity instruments, principally futures contracts. As of December 31, 2005, we had open foreign exchange contracts maturing through July 31, 2009 with aggregate notional amounts of $378.8 million, including $130.0 million subject to extension agreements.
We have extension agreements to enter into foreign exchange contracts. These agreements expire between September 2006 and March 2008 and between March 2009 and December 2010 and would become binding and effective only if the spot rate falls below a pre-specified level (the trigger) on or before March 2006 and September 2008, respectively. If the spot rate does not reach the trigger by March 2006 or September 2008, neither we nor the counterparty shall have any right or obligation with respect to any of these extension agreements. The trigger for these extension agreements is ¥99 and ¥95 per U.S. dollar, respectively, and the aggregate notional amount is $130.0 million.
At December 31, 2005, we prepared an analysis to determine the sensitivity of our forward foreign exchange contracts to sell Japanese yen, which have total notional amounts of $248.8 million and are staggered over a rolling 48-month timeframe, to changes in exchange rates. A hypothetical adverse Japanese yen exchange rate movement of 1% against our forward foreign exchange contracts would have resulted in a potential loss in fair value of these contracts of approximately $2.5 million, excluding the effect of forward points. All such losses on these forward foreign exchange contracts would be substantially offset by gains on the underlying Japanese yen sales that we have hedged.
We enter into fuel hedges whereby we pay a fixed price per gallon and receive a floating price per gallon with the payments calculated on a notional gallon amount. Our policy is to hedge at least 50% of the forecasted fuel usage for any given season. The objective of the fuel swap agreements is to hedge the variability of future fuel prices. In accordance with our hedging policy in relation to these contracts, we perform periodic assessments of effectiveness on at least a quarterly basis. Based on the results of these analyses, we considered these instruments to be highly effective as of the year ended December 31, 2003 and we recorded an unrealized gain of approximately $1.1 million as a component of accumulated other comprehensive income for this period. We performed this analysis when we entered into fuel contracts in November 2004 and determined that the instruments entered into in 2004 were not highly effective as defined by SFAS 133. Accordingly, we recorded an unrealized loss of approximately $0.7 million representing the fair value of these instruments as of December 31, 2004 in the statement of operations as a component of gain or loss on other derivatives. As of December 31, 2005, we had open contracts with terms through October 2007. As we have not designated these instruments as hedges, we recorded our unrealized gain of $3.7 million in the statement of operations as a component of gain or loss on other derivatives during the year ended December 31, 2005.
During October and early November 2005, we entered into additional fuel derivative contracts whereby we pay a fixed price per gallon and receive a floating price per gallon with payments calculated on notional amounts of 4.5 million gallons over the term of January to March 2006 and 2.0 million gallons over the term of January to October 2007.
Interest Rates. The New Credit Facility requires us to hedge the variable interest rate on a portion of our outstanding debt to convert such debt to fixed-rate debt. We are required to enter into hedging transactions such that no less than 50% of the aggregate principal amounts of our long-term debt are subject to a hedging transaction through October 6, 2008.
60
We have three forward interest rate swaps, effective May 2, 2006, with an aggregate notional amount of $180.0 million that mature in March 2011. Under the terms of these swaps we are required to pay interest at a fixed rate of between 4.78% and 4.84% and receive payments on a variable rate of interest based on the 3-month LIBOR rate. As we have not designated these instruments as hedges, we record any unrealized gains or losses in the statements of operations as a component of interest expense. The fair value of these instruments was an unrealized loss of approximately $0.2 million as of December 31, 2005.
In addition to the interest hedges applicable to our outstanding term loans, interest on our Senior Subordinated Notes has a fixed rate. Approximately 56% and 89% of our total debt effectively has a fixed interest rate or is hedged by interest rate caps and swaps as of December 31, 2004 and 2005, respectively. Interest rate changes generally do not affect the market value of floating rate debt but do impact the amount of our interest payments and, therefore, our future earnings and cash flows, assuming other factors are held constant.
Fuel Purchase Commitment for 2006. In October 2005, we entered into an exclusive fuel requirements agreement that obligates us to purchase our marine diesel fuel used in our fishing fleet from a third-party vendor. The commitment is for 4.5 million gallons of fuel to be delivered during the period January 1 to June 1, 2006 at a prices based on a market index.
Cross Currency Interest Rate Swap Agreements. Effective November 2005, we entered into variable to fixed-rate cross currency interest swap contracts with an aggregate notional amount of $50.0 million, maturing in 2009. Under the terms of these contracts, we pay a fixed rate of interest in Japanese yen and receive payments on a variable rate of interest in U.S. dollars based on the three-month LIBOR rate.
61
Item 8.Financial Statements and Supplementary Data
Report of Independent Registered Public Accounting Firm
The Member
American Seafoods Group LLC:
We have audited the accompanying consolidated balance sheets of American Seafoods Group LLC and subsidiaries (the Company) as of December 31, 2004 and 2005 and the related consolidated statements of operations, member’s equity (deficit) and comprehensive income (loss) and cash flows for each of the years in the three-year period ended December 31, 2005. These consolidated financial statements are the responsibility of the Company’s management. Our responsibility is to express an opinion on these consolidated financial statements based on our audits.
We conducted our audits in accordance with the standards of the Public Company Accounting Oversight Board (United States). Those standards require that we plan and perform the audit to obtain reasonable assurance about whether the financial statements are free of material misstatement. An audit includes examining, on a test basis, evidence supporting the amounts and disclosures in the financial statements. An audit also includes assessing the accounting principles used and significant estimates made by management, as well as evaluating the overall financial statement presentation. We believe that our audits provide a reasonable basis for our opinion.
In our opinion, the consolidated financial statements referred to above present fairly, in all material respects, the financial position of American Seafoods Group LLC and subsidiaries as of December 31, 2004 and 2005 and the results of their operations and their cash flows for each of the years in the three-year period ended December 31, 2005, in conformity with U.S. generally accepted accounting principles.
As discussed in Note 1 to the consolidated financial statements, the Company has included AS Europe ApS in the consolidated financial statements for all periods presented as it was contributed to the Company in 2005, as an entity under common control.
/s/ KPMG LLP
Seattle, Washington
March 30, 2006
62
AMERICAN SEAFOODS GROUP LLC AND SUBSIDIARIES
CONSOLIDATED BALANCE SHEETS
(in thousands)
| | | | | | | | |
| | | December 31, | |
| | | 2004 | | | 2005 | |
| ASSETS | | | | | | | | |
Current assets: | | | | | | | | |
Cash and cash equivalents | | $ | 1,123 | | | $ | 7,779 | |
Trade accounts receivable, net of allowance of $1,460 and $1,952 | | | 38,042 | | | | 37,758 | |
Receivables from related parties | | | 98 | | | | 93 | |
Inventories | | | 50,647 | | | | 55,440 | |
Deferred operating costs and prepaid expenses | | | 8,067 | | | | 13,298 | |
Unrealized gains on derivatives | | | — | | | | 12,822 | |
Other | | | 6,028 | | | | 4,968 | |
| | | | | | | | |
Total current assets | | | 104,005 | | | | 132,158 | |
| | | | | | | | |
| | |
Property, vessels and equipment, net | | | 198,340 | | | | 171,479 | |
Capital projects in process | | | 1,835 | | | | 2,003 | |
| | |
Other assets: | | | | | | | | |
Cooperative and fishing rights, net of accumulated amortization of $65,302 and $69,503 | | | 83,248 | | | | 88,324 | |
Goodwill | | | 33,521 | | | | 33,521 | |
Deferred financing costs, net of accumulated amortization of $13,844 and $9,437 | | | 23,603 | | | | 11,138 | |
Other intangibles, net of accumulated amortization of $1,078 and $1,629 | | | 3,944 | | | | 3,342 | |
Unrealized gains on derivatives | | | 2,063 | | | | 16,942 | |
Other | | | 8,859 | | | | 7,807 | |
| | | | | | | | |
Total other assets | | | 155,238 | | | | 161,074 | |
| | | | | | | | |
Total assets | | $ | 459,418 | | | $ | 466,714 | |
| | | | | | | | |
| LIABILITIES AND MEMBER’S EQUITY (DEFICIT) | | | | | | | | |
Current liabilities: | | | | | | | | |
Accounts payable and accrued expenses | | $ | 33,556 | | | $ | 35,254 | |
Current portion of long-term debt | | | 26,547 | | | | 8,431 | |
Unrealized losses on derivatives | | | 10,983 | | | | 3,422 | |
Payable to related party | | | 1,813 | | | | — | |
| | | | | | | | |
Total current liabilities | | | 72,899 | | | | 47,107 | |
| | | | | | | | |
Long-term liabilities: | | | | | | | | |
Long-term debt, net of current portion | | | 454,575 | | | | 444,657 | |
Unrealized losses on derivatives | | | 50,112 | | | | 1,959 | |
| | | | | | | | |
Total long-term liabilities | | | 504,687 | | | | 446,616 | |
| | | | | | | | |
Total liabilities | | | 577,586 | | | | 493,723 | |
| | | | | | | | |
Commitments and contingencies | | | | | | | | |
| | |
Member’s deficit: | | | | | | | | |
Member’s deficit | | | (72,118 | ) | | | (39,790 | ) |
Accumulated other comprehensive income (loss) | | | (46,050 | ) | | | 12,781 | |
| | | | | | | | |
Total member’s deficit | | | (118,168 | ) | | | (27,009 | ) |
| | | | | | | | |
Total liabilities and member’s deficit | | $ | 459,418 | | | $ | 466,714 | |
| | | | | | | | |
The accompanying notes are an integral part of these consolidated financial statements.
63
AMERICAN SEAFOODS GROUP LLC AND SUBSIDIARIES
CONSOLIDATED STATEMENTS OF OPERATIONS
(in thousands)
| | | | | | | | | | | | |
| | | Year ended December 31, | |
| | | 2003 | | | 2004 | | | 2005 | |
Net sales and revenues: | | | | | | | | | | | | |
Seafood sales | | $ | 409,001 | | | $ | 460,579 | | | $ | 512,930 | |
Other | | | 2,362 | | | | 1,088 | | | | 1,072 | |
| | | | | | | | | | | | |
Total sales and revenues | | | 411,363 | | | | 461,667 | | | | 514,002 | |
Cost of sales: | | | | | | | | | | | | |
Cost of sales, including depreciation and amortization of $38,993, $42,960 and $44,592 | | | 266,225 | | | | 319,248 | | | | 353,880 | |
Cost of sales—related parties | | | 17,324 | | | | 21,257 | | | | 22,096 | |
Shipping and handling costs | | | 25,697 | | | | 32,246 | | | | 35,390 | |
| | | | | | | | | | | | |
Gross profit | | | 102,117 | | | | 88,916 | | | | 102,636 | |
| | | | | | | | | | | | |
Operating expenses: | | | | | | | | | | | | |
Selling, general and administrative expenses, excluding equity-based compensation and related parties | | | 34,183 | | | | 31,922 | | | | 37,140 | |
Selling, general and administrative expenses—related parties | | | 1,124 | | | | 1,105 | | | | 3,085 | |
Equity-based compensation | | | 4,703 | | | | 2,931 | | | | 3,481 | |
Amortization and depreciation | | | 3,231 | | | | 3,112 | | | | 3,270 | |
Goodwill impairment | | | — | | | | 7,171 | | | | — | |
| | | | | | | | | | | | |
Operating income | | | 58,876 | | | | 42,675 | | | | 55,660 | |
| | | | | | | | | | | | |
Other income (expense), net: | | | | | | | | | | | | |
Interest expense | | | (40,573 | ) | | | (39,302 | ) | | | (41,791 | ) |
Foreign exchange gains (losses), net | | | (4,040 | ) | | | (5,816 | ) | | | 23,792 | |
Other derivatives gains (losses), net | | | — | | | | (7,098 | ) | | | 13,092 | |
Write off of recapitalization transaction costs and deferred financing costs | | | — | | | | (19,264 | ) | | | (10,903 | ) |
Other income (expense), net | | | 292 | | | | 199 | | | | (1,932 | ) |
| | | | | | | | | | | | |
Total other income (expense), net | | | (44,321 | ) | | | (71,281 | ) | | | (17,742 | ) |
| | | | | | | | | | | | |
Income (loss) before income taxes | | | 14,555 | | | | (28,606 | ) | | | 37,918 | |
Income tax provision | | | 41 | | | | 31 | | | | 53 | |
| | | | | | | | | | | | |
Net income (loss) | | $ | 14,514 | | | $ | (28,637 | ) | | $ | 37,865 | |
| | | | | | | | | | | | |
The accompanying notes are an integral part of these consolidated financial statements.
64
AMERICAN SEAFOODS GROUP LLC AND SUBSIDIARIES
CONSOLIDATED STATEMENTS OF MEMBER’S EQUITY (DEFICIT)
AND COMPREHENSIVE INCOME (LOSS)
(in thousands)
| | | | | | | | | | | | | | | | |
| | | Member’s Equity (Deficit) | | | Accumulated Other Comprehensive
Income (Loss) | | | Total Member’s Equity (Deficit) | | | Comprehensive Income (Loss) | |
Balance, December 31, 2002 | | $ | (72,115 | ) | | $ | (6,324 | ) | | $ | (78,439 | ) | | | | |
Distributions to member | | | (4,755 | ) | | | — | | | | (4,755 | ) | | | | |
Net income | | | 14,514 | | | | — | | | | 14,514 | | | $ | 14,514 | |
Other comprehensive loss: | | | | | | | | | | | | | | | | |
Unrealized losses on derivative instruments designated as hedges, net | | | — | | | | (43,319 | ) | | | (43,319 | ) | | | (43,319 | ) |
Translation adjustment | | | — | | | | 14 | | | | 14 | | | | 14 | |
| | | | | | | | | | | | | | | | |
Comprehensive loss | | | | | | | | | | | | | | $ | (28,791 | ) |
| | | | | | | | | | | | | | | | |
Balance, December 31, 2003 | | $ | (62,356 | ) | | $ | (49,629 | ) | | $ | (111,985 | ) | | | | |
Distributions to member | | | (3,296 | ) | | | — | | | | (3,296 | ) | | | | |
Contributions from member | | | 22,171 | | | | — | | | | 22,171 | | | | | |
Net loss | | | (28,637 | ) | | | — | | | | (28,637 | ) | | $ | (28,637 | ) |
Other comprehensive gain: | | | | | | | | | | | | | | | | |
Unrealized gains on derivative instruments designated as hedges, net | | | — | | | | 3,600 | | | | 3,600 | | | | 3,600 | |
Translation adjustment | | | — | | | | (21 | ) | | | (21 | ) | | | (21 | ) |
| | | | | | | | | | | | | | | | |
Comprehensive loss | | | | | | | | | | | | | | $ | (25,058 | ) |
| | | | | | | | | | | | | | | | |
Balance, December 31, 2004 | | $ | (72,118 | ) | | $ | (46,050 | ) | | $ | (118,168 | ) | | | | |
Distributions to member | | | (10,796 | ) | | | — | | | | (10,796 | ) | | | | |
Contributions from member | | | 5,259 | | | | — | | | | 5,259 | | | | | |
Net income | | | 37,865 | | | | — | | | | 37,865 | | | $ | 37,865 | |
Other comprehensive gain: | | | | | | | | | | | | | | | | |
Unrealized gains on derivative instruments designated as hedges, net | | | — | | | | 58,892 | | | | 58,892 | | | | 58,892 | |
Translation adjustment | | | — | | | | (61 | ) | | | (61 | ) | | | (61 | ) |
| | | | | | | | | | | | | | | | |
Comprehensive income | | | | | | | | | | | | | | $ | 96,696 | |
| | | | | | | | | | | | | | | | |
Balance, December 31, 2005 | | $ | (39,790 | ) | | $ | 12,781 | | | $ | (27,009 | ) | | | | |
| | | | | | | | | | | | | | | | |
The accompanying notes are an integral part of these consolidated financial statements.
65
AMERICAN SEAFOODS GROUP LLC AND SUBSIDIARIES
CONSOLIDATED STATEMENTS OF CASH FLOWS
(in thousands)
| | | | | | | | | | | | |
| | | Year ended December 31, | |
| | | 2003 | | | 2004 | | | 2005 | |
Cash flows from operating activities: | | | | | | | | | | | | |
Net income (loss) | | $ | 14,514 | | | $ | (28,637 | ) | | $ | 37,865 | |
Adjustments to reconcile net income (loss) to net cash provided by operating activities: | | | | | | | | | | | | |
Depreciation and amortization | | | 42,224 | | | | 46,072 | | | | 47,862 | |
Unrealized (gains) losses on derivatives, net | | | 10,332 | | | | 23,514 | | | | (24,516 | ) |
Writeoff of financing costs related to debt repayment | | | — | | | | — | | | | 10,903 | |
Amortization of deferred financing costs | | | 5,228 | | | | 5,275 | | | | 4,564 | |
Equity-based compensation | | | 4,703 | | | | 2,931 | | | | 3,481 | |
Provision for doubtful trade receivables | | | 345 | | | | 1,371 | | | | 2,453 | |
Provision for doubtful insurance and other receivables | | | 373 | | | | — | | | | 897 | |
Loss on sale of property and equipment and other | | | 211 | | | | 142 | | | | 31 | |
Write off of recapitalization costs | | | — | | | | 19,264 | | | | — | |
Goodwill impairment | | | — | | | | 7,171 | | | | — | |
Minority interest | | | 179 | | | | — | | | | — | |
Change in operating assets and liabilities: | | | | | | | | | | | | |
Trade accounts receivable, net | | | (11,573 | ) | | | (1,258 | ) | | | (2,169 | ) |
Net receivables and payables from related parties | | | 42 | | | | 337 | | | | (30 | ) |
Inventories | | | (21,673 | ) | | | 2,292 | | | | (4,789 | ) |
Deferred operating costs, prepaid expenses and other current assets | | | (4,019 | ) | | | (2,412 | ) | | | (4,171 | ) |
Other assets, net | | | (1,887 | ) | | | (2,130 | ) | | | 93 | |
Accounts payable and accrued expenses | | | 7,304 | | | | (5,199 | ) | | | 948 | |
| | | | | | | | | | | | |
Net cash flows from operating activities | | | 46,303 | | | | 68,733 | | | | 73,422 | |
| | | | | | | | | | | | |
Cash flows from investing activities: | | | | | | | | | | | | |
Purchases of property, vessels and equipment | | | (12,315 | ) | | | (12,954 | ) | | | (14,364 | ) |
Purchase of fishing rights | | | (1,016 | ) | | | — | | | | (8,527 | ) |
Additions to capital projects in process | | | (436 | ) | | | (1,835 | ) | | | (2,003 | ) |
Restricted cash withdrawals | | | — | | | | 14 | | | | 19 | |
Collection of related party loan | | | — | | | | 6,000 | | | | — | |
Purchase of minority interest in PLC | | | — | | | | (1,800 | ) | | | — | |
Other | | | 458 | | | | (166 | ) | | | 3 | |
| | | | | | | | | | | | |
Net cash used in investing activities | | | (13,309 | ) | | | (10,741 | ) | | | (24,872 | ) |
| | | | | | | | | | | | |
Cash flows from financing activities: | | | | | | | | | | | | |
Borrowings on long-term debt facilities | | | — | | | | — | | | | 265,000 | |
Repayment of term loans | | | — | | | | — | | | | (257,746 | ) |
Principal payments on long-term debt | | | (55,520 | ) | | | (23,160 | ) | | | (33,788 | ) |
Net borrowings (repayment) on revolving debt facilities | | | 37,499 | | | | (23,000 | ) | | | (1,500 | ) |
Financing costs | | | (484 | ) | | | (927 | ) | | | (3,002 | ) |
Tax and other distributions to member | | | (4,992 | ) | | | (3,423 | ) | | | (10,796 | ) |
Capital contributions | | | — | | | | 2,199 | | | | — | |
Payment of recapitalization costs | | | (4,760 | ) | | | (13,886 | ) | | | — | |
Principal payments on obligations to related party | | | (4,638 | ) | | | — | | | | — | |
Other | | | (21 | ) | | | — | | | | (62 | ) |
| | | | | | | | | | | | |
Net cash used in financing activities | | | (32,916 | ) | | | (62,197 | ) | | | (41,894 | ) |
| | | | | | | | | | | | |
Net increase (decrease) in cash and cash equivalents | | | 78 | | | | (4,205 | ) | | | 6,656 | |
Cash and cash equivalents at beginning of year | | | 5,250 | | | | 5,328 | | | | 1,123 | |
| | | | | | | | | | | | |
Cash and cash equivalents at end of year | | $ | 5,328 | | | $ | 1,123 | | | $ | 7,779 | |
| | | | | | | | | | | | |
Supplemental disclosures for cash flow information: | | | | | | | | | | | | |
Cash paid during the year for: | | | | | | | | | | | | |
Interest | | $ | 34,970 | | | $ | 35,171 | | | $ | 36,507 | |
Non-cash investing and financing activities: | | | | | | | | | | | | |
Reclassification of prior period capital projects in progress and deposits to property, vessels and equipment | | | — | | | | 436 | | | | 1,856 | |
Capital contribution adjustment for equity-based compensation | | | — | | | | 19,972 | | | | 3,481 | |
Capital contribution adjustment for expenses paid by parent | | | — | | | | — | | | | 1,778 | |
Purchase of fishing rights included in accounts payable and accrued expenses | | | — | | | | — | | | | 750 | |
The accompanying notes are an integral part of these consolidated financial statements.
66
AMERICAN SEAFOODS GROUP LLC AND SUBSIDIARIES
NOTES TO CONSOLIDATED FINANCIAL STATEMENTS
Note 1. Description of Business and Summary of Significant Accounting Policies
Description of Business and Basis of Presentation
American Seafoods Group LLC (ASG), a Delaware limited liability company, and its subsidiaries (collectively referred herein as the “Company”) harvest and process a variety of fish, either on board its sophisticated catcher-processor and freezer-longliner vessels or at its land-based processing facilities, and markets its products to its customers in North America, Asia and Europe. The Company is an at-sea harvester and processor of pollock, Pacific whiting and cod in the U.S. In addition, the Company is a land-based processor of catfish and scallops, and secondary processor of pollock.
ASG was formed in January 2000. The sole owner of ASG is ASG Consolidated LLC (ASG Consolidated), which is held by American Seafoods Consolidated LLC (American Seafoods Consolidated) and ASC, Inc., both of which are held directly or indirectly by American Seafoods Holdings LLC (Holdings), which, in turn, is controlled by American Seafoods, L.P. (ASLP) and its general partner, ASC Management, Inc. ASG has one class of member interests, and the liability of its member is limited to its member’s interest.
The consolidated financial statements include the accounts of ASG and its subsidiaries for all periods presented. All significant intercompany transactions and balances are eliminated in consolidation.
ASG has no significant independent assets or operations and has outstanding public debt. Guarantees of ASG’s debt by its subsidiaries are full and unconditional and joint and several. Any subsidiaries other than the subsidiary guarantors are minor, and there are no significant restrictions on the ability of ASG or any guarantor subsidiary to obtain funds from its subsidiaries by dividend or loan.
Listed below are ASG’s principal operating subsidiaries with a description of their activities and the segment in which they are included. Each subsidiary is considered a reporting unit because it constitutes a business for which discrete financial information is available and management of each segment regularly reviews the operating results. At December 31, 2005, the principal operating subsidiaries are as follows:
At-Sea Processing Segment:
| | • | | American Seafoods Company LLC(ASC) harvests and performs primary processing of mainly pollock, through its seven catcher-processor vessels that operate in the Bering Sea and coastal waters off Washington and Oregon. ASC also markets, sells and distributes its products into the United States, Asian, and European markets. Each of the seven catcher-processor vessels is owned by a limited liability company that is a subsidiary of ASC. Additionally, ASC purchased a catcher vessel in 2005 which was placed into service in 2006. |
| | • | | Pacific Longline Company LLC (PLC) harvests and performs primary processing of mainly Pacific cod through its three freezer-longliner cod fishing vessels that operate in the Bering Sea. Each of the three vessels is owned by a limited liability company that is a subsidiary of PLC. |
Land-Based Processing Segment:
| | • | | American Seafoods International LLC (ASI) operates a secondary processing plant for primarily frozen pollock and cod in New Bedford, Massachusetts, which includes cutting, breading and battering operations. |
| | • | | American Seafoods Processing LLC (ASP) operates a scallop processing facility in New Bedford, Massachusetts. |
67
AMERICAN SEAFOODS GROUP LLC AND SUBSIDIARIES
NOTES TO CONSOLIDATED FINANCIAL STATEMENTS—(Continued)
| | • | | Southern Pride Catfish LLC (SPC) operates two catfish processing facilities in Alabama and processes and distributes catfish products primarily in the United States. |
| | • | | Southern Pride Catfish Trucking, Inc. (SPC Trucking) operates seafood distribution for ASI, ASP and SPC products and is a taxable entity. |
All of the subsidiaries in our land-based processing segment operate under the control of American Pride Seafoods LLC, a wholly-owned subsidiary of ASG.
Corporate History
The Original Acquisition. On January 28, 2000, ASLP purchased from Norway Seafoods, through its subsidiaries, six catcher-processors, one catcher-vessel, all of the outstanding stock of American Seafoods Company (now referred to as “ASC, Inc.”) and certain assets of Frionor USA (now called “ASI”) (Original Acquisition). ASC, Inc. was the operator of the six acquired vessels and the owner-operator of one additional catcher-processor vessel. ASG was formed in connection with the Original Acquisition. As part of the Original Acquisition, ASC, Inc. contributed its assets to ASG in exchange for member interests with preferred distribution rights.
SPC Acquisition. On December 16, 2002, the Company, through its direct and indirect wholly-owned subsidiaries, purchased substantially all of the assets of Southern Pride Catfish Company, Inc. (SPCC), an Alabama corporation engaged in the business of catfish harvesting, processing and distribution and contributed these assets to SPC and SPC Trucking (referred herein collectively as “Southern Pride”). With this addition, the Company has significant market positions in pollock, cod and catfish, the top three domestic whitefish species in terms of human consumption. The operations of Southern Pride are included in the Company’s consolidated financial statements since the acquisition date.
PLC Acquisition. On December 31, 2003, ASG received a contribution of an 80% ownership interest in PLC from Holdings. PLC is included in the Company’s consolidated financial statements for all periods presented as required under the guidance of Statement of Financial Accounting Standards (SFAS) No. 141,Business Combinations, for transactions involving the transfers of net assets between entities under common control. Effective January 1, 2004, ASG purchased the remaining 20% interest in PLC from the third-party minority interest holder.
Contribution of AS Europe. In November 2005, American Seafoods Consolidated LLC contributed AS Europe ApS (ASE), a Danish limited partnership, to ASG Consolidated, which, in turn, contributed ASE to its wholly-owned subsidiary, ASG. The purpose of the contribution was to bring all sales and operating entities under the control of one subsidiary. ASE is included in the Company’s consolidated financial statements for all periods presented as required under the guidance of SFAS No. 141,Business Combinations, for transactions involving the transfers of net assets between entities under common control. The effect of these revisions to prior periods is immaterial. Because this transaction was between entities under common control, the transfer of assets and liabilities was recorded at their carrying amounts, and prior period financial statements and financial information were restated to furnish comparative information. ASE, a sales office, is included in the At-Sea Processing segment for reporting purposes, as 100% of its sales activity relates to at-sea processed product.
Use of Estimates
The preparation of financial statements in conformity with U.S. generally accepted accounting principles requires management to make estimates and assumptions that affect the reported amounts of assets and liabilities
68
AMERICAN SEAFOODS GROUP LLC AND SUBSIDIARIES
NOTES TO CONSOLIDATED FINANCIAL STATEMENTS—(Continued)
and disclosure of contingent assets and liabilities at the date of the financial statements and the reported amounts of revenues and expenses during the reporting period. Actual results could differ from those estimates.
Significant estimates impacting the financial statements include the estimated fair values of the assets and liabilities acquired in connection with the acquisitions, depreciable lives of property, vessels, and equipment, the amortization lives of cooperative and fishing rights and other intangibles, the fair values and the effectiveness of hedges against risks of foreign currency, interest and fuel price changes, the fair value of ASLP units used for equity-based compensation, capitalization of costs incurred, estimated accruals for contingent liabilities and collectibility of receivables.
Concentration of Risk
Financial instruments that potentially subject the Company to concentrations of credit risk consist primarily of cash and cash equivalents, accounts receivable and derivative instruments. The Company places its cash and cash equivalents with high quality financial institutions and limits the amount of credit exposure with any one institution.
Concentrations of credit risk with respect to accounts receivable are limited because a large number of geographically diverse customers that make up the Company’s customer base, thus spreading the trade credit risk. During the years ended December 31, 2003, 2004 and 2005, no single group or customer represents greater than 10% of total sales or accounts receivable. The Company controls credit risk through credit approvals, credit limits, and monitoring procedures. The Company performs credit evaluations of its commercial and industrial customers but generally does not require collateral to support accounts receivable.
All of the Company’s foreign currency exchange, interest rate and fuel derivative instruments involve elements of credit and market risk in excess of the amounts recognized in the consolidated financial statements. The counterparties to the financial instruments consist of a number of major financial institutions for the foreign exchange and interest rate instruments, and a large petroleum company for the fuel instruments. In addition to limiting the amounts of the agreements and contracts it enters into with any one party, the Company monitors its positions with, and the credit quality of, the counterparties to these financial instruments. The Company does not anticipate nonperformance by any of the counterparties.
A significant portion of the Company’s sales are denominated in foreign currencies, predominantly Japanese yen. Material changes in the yen to dollar exchange rates have had and could have a significant impact on the Company’s financial position, operations and cash flow.
The Company’s operations are concentrated in the highly regulated fishing, seafood and aquaculture industry. Material changes in these industries or the applicable regulations have had and could have a significant impact on the Company.
The quality and quantity of the fish harvested and processed could be impacted by biological and environmental risks such as disease and pollution.
Employees in the Demopolis, Alabama processing plant are represented by a union and are subject to a five-year collective bargaining agreement expiring January 2011. Approximately 6% of our total full-time and regular seasonal employees are represented by a union.
Cash and Cash Equivalents
The Company considers all highly-liquid investments with a maturity of three months or less when purchased to be cash equivalents.
69
AMERICAN SEAFOODS GROUP LLC AND SUBSIDIARIES
NOTES TO CONSOLIDATED FINANCIAL STATEMENTS—(Continued)
Accounts Receivable and Revenue Recognition
The Company recognizes revenues and records accounts receivable balances when persuasive evidence of an arrangement exists, delivery has occurred to the extent required by the sales terms agreed to with the customer, the price is fixed or determinable and collectibility is reasonably assured. It is the Company’s policy to evaluate its customers on at least an annual basis and obtain credit insurance for those customers that provide a higher exposure to risk, when available. The allowance for trade accounts receivable reflects management’s estimate of probable losses inherent in the receivable balance. Management determines the allowance based on known troubled accounts, historical experience, and other currently available evidence. It is the Company’s policy to write off accounts if collectibility becomes remote.
Inventories
Inventories, which consist of processed seafood and certain raw materials, are stated at the lower of cost or market. Market value for raw materials is based on replacement cost, and for work in process and finished goods on net realizable value. Cost includes materials, labor, shipping and handling charges, and manufacturing overhead, including vessel operating costs related to harvesting and processing inventories. The average cost method is used to cost land-based processing inventories, which together represented approximately 51% and 46% of consolidated total inventories at December 31, 2004 and 2005, respectively. The first-in, first-out method is used to cost at-sea processing inventories.
Property, Vessels and Equipment
Property, vessels and equipment are stated at cost. Significant additions and improvements are capitalized while repairs and ordinary maintenance are expensed as incurred. Depreciation of property, vessels and equipment is provided using the straight-line method over the assets’ estimated useful lives as follows:
| | |
Vessel hulls | | 20 to 25 years |
Machinery and equipment | | 3 to 7 years |
Buildings | | 25 to 39 years |
Fishing gear | | 2 to 4 years |
Other equipment, furniture and fixtures | | 2 to 5 years |
Office leasehold improvements are depreciated over the lesser of 3-5 years or the remaining life of the lease.
Costs of major scheduled vessel maintenance, which consists of dry-docking the vessel and overhauling or replacing certain components, are capitalized and depreciated over the period through the next major scheduled vessel maintenance, which is generally performed on a three-year cycle.
Capital projects in process are comprised of long-lived assets that have not been placed in service and the related vendor deposits. The Company classifies such costs as property, vessels and equipment when the underlying assets are placed in service.
Impairment or Disposal of Long-Lived Assets
Long-lived assets and amortizable intangible assets are reviewed for impairment whenever events or changes in circumstances indicate that the carrying amount of an asset may not be recoverable. The Company has no indefinite life intangible assets. Asset groups to be held and used are evaluated for impairment by comparing the carrying amount to the future net cash flows expected to be generated by the asset group. If the carrying
70
AMERICAN SEAFOODS GROUP LLC AND SUBSIDIARIES
NOTES TO CONSOLIDATED FINANCIAL STATEMENTS—(Continued)
amount of the asset group exceeds the expected future net cash flows, undiscounted and without interest, the impairment to be recognized is measured by the amount by which the carrying amount of the asset group exceeds the fair value. Asset groups to be disposed of are reported at the lower of the carrying amount or fair value less costs to sell.
Goodwill and Other Intangible Assets
The Company assesses goodwill for impairment by applying a fair value based test at least annually or on an interim basis if circumstances change or events occur that indicate that goodwill may be impaired. In accordance with SFAS No. 142,Goodwill and Other Intangible Assets, goodwill is evaluated for impairment by using a two-step process. Step 1 involves determining the fair value of the reporting unit, which is compared to the carrying amount of the reporting unit, including goodwill. If the carrying amount exceeds the fair value, then the goodwill may be impaired and Step 2 is then required. In Step 2, the implied value of the goodwill is determined as the difference between the fair value of the reporting unit and the fair value of its net assets. If the carrying amount of the goodwill exceeds the implied value, an impairment loss is recognized to the extent of the difference. In accordance with SFAS No. 142, the Company assigns goodwill to the reporting units that the Company expects to benefit from the expected synergies of the business combinations that the Company has entered into.
Derivative Instruments and Hedging
The Company records certain gains and losses on foreign currency transactions, cross currency interest rate swaps, interest rate forward swaps, and fuel contracts in other income and expense. The Company follows the provisions of SFAS No. 133,Accounting for Derivative Instruments and Hedging Activities, as amended. The Company has formally designated certain of its hedging derivative instruments as cash flow hedges, and gains and losses resulting from the effective portion of the hedge, which relate to changes in spot rates, are deferred and included in income when the forecasted sales occur. Gains and losses resulting from all derivative instruments not designated and documented as hedges, and the ineffective portion of hedges, which generally relate to the time value component of the contract, are recognized currently in earnings. In accordance with the Company’s hedging policy, periodic assessments of effectiveness are performed on at least a quarterly basis.
The Company has a significant amount of Japanese yen and Euro denominated sales; therefore, its earnings, cash flows and financial position are exposed to foreign currency risk from yen and Euro denominated sales transactions. The Company attempts to manage foreign currency risk by using foreign currency forward exchange contracts to hedge the variability of future cash flows associated with Japanese yen and Euro denominated sales. These contracts are arranged so that the Company sells Japanese yen or Euros to the counterparty at a fixed exchange rate and receives U.S. dollars in return. It is the Company’s risk management policy to hedge a target level of 80% of its forecasted yen sales over the next 12 months, 65% over months 13 to 24, 50% over months 25 to 36 and 35% over months 37 to 48 and to hedge up to 100% of its forecasted Euro sales over the next twelve months.
Deferred Financing Costs and Debt Discount
It is the Company’s policy to capitalize financing costs and expense such costs over the life of the financing agreement to interest expense. Deferred financing fees are accounted for using the effective interest method.
Incremental direct costs related to the offering of securities are deferred to the extent that management expects that completion of the offering is probable and that the offering will not be postponed for an extended period. During 2003 and 2004, the Company incurred total costs of $19.3 million relating to a proposed senior
71
AMERICAN SEAFOODS GROUP LLC AND SUBSIDIARIES
NOTES TO CONSOLIDATED FINANCIAL STATEMENTS—(Continued)
credit facility and initial public offering of income deposit securities (IDS) and such costs were included in other non current assets through the third quarter of 2004, when the Company determined that it was not probable that it would proceed with a proposed senior credit facility and the initial public offering and, as a result, recorded a write-off of the entire amount.
The Company accounted for existing and new unamortized financing fees in conjunction with the refinance of debt in October 2005 under Emerging Issues Task Force (EITF) 96-19,Debtor’s Accounting for a Modification or Exchange of DebtInstruments and EITF 98-14,Debtor’s Accounting for Changes in Line-of-Credit or Revolving-Debt Arrangements.
Amortization of deferred financing costs was approximately, $5.2 million, $5.3 million and $4.6 million for the years ended December 31, 2003, 2004, and 2005, respectively.
Advertising Costs
The cost of advertising is expensed as incurred. Advertising expenses incurred during 2003, 2004 and 2005 were approximately $0.2 million, $0.1 million, and $0.1 million, respectively.
Leases
The Company has entered into operating leases for its offices, aircraft, warehouses, dock space and land. The Company records rent expense based upon the terms of the lease agreement, which approximates the straight-line method in accordance with generally accepted accounting principles.
Equity-Based Compensation
Certain employees of the Company have equity-based compensation arrangements, which grant them options to acquire partnership units of ASLP. The related compensation cost has been pushed down to the Company’s financial statements.
The Company applies the intrinsic-value-based method of accounting for equity-based compensation awards to employees and has adopted only the disclosure requirements of SFAS No. 123,Accounting for Stock-Based Compensation, as amended by SFAS No. 148,Accounting for Stock-Based Compensation-Transition and Disclosure, an amendment of FASB No. 123. The following table illustrates the effect on net income (loss) as if the fair-value-based method had been applied to all awards in each period. Equity-based compensation has no significant tax effect on the Company.
| | | | | | | | | | | | |
| | | Year Ended | |
| | | 2003 | | | 2004 | | | 2005 | |
| | | (Dollar Amounts In Thousands) | |
Net income (loss), as reported | | $ | 14,514 | | | $ | (28,637 | ) | | $ | 37,865 | |
Equity-based employee compensation expense included in reported net income (loss) | | | 4,703 | | | | 2,931 | | | | 3,481 | |
Equity-based employee compensation expense determined under fair-value-based method for all awards | | | (672 | ) | | | (1,253 | ) | | | (910 | ) |
| | | | | | | | | | | | |
Pro forma net income (loss) | | $ | 18,545 | | | $ | (26,959 | ) | | $ | 40,436 | |
| | | | | | | | | | | | |
72
AMERICAN SEAFOODS GROUP LLC AND SUBSIDIARIES
NOTES TO CONSOLIDATED FINANCIAL STATEMENTS—(Continued)
The fair value of each option grant is estimated using the Black-Scholes option-pricing model. Assumptions used in estimating the fair value were as follows:
| | | | | | |
| | | 2003 | | 2004 | | 2005 |
Risk free interest rate | | 2.52%–3.05% | | 2.58%–2.85% | | 4.38%–4.39% |
Expected life | | 5 years | | 2.17–3.17 years | | 5 years |
Expected volatility is zero as ASLP has no public equity securities. Expected dividend yield is zero as distributions are expected only to pay theoretical tax.
On October 19, 2004, the Company’s direct parent, ASG Consolidated and its subsidiary, ASG Finance, issued and sold 11 1/2% senior discount notes. The distribution of the offering proceeds from these notes to the Company’s ultimate equity holders accelerated the vesting of certain outstanding options held by Company employees under the ASLP Year 2000 Unit Option Plan (see Note 15). Since this transaction was also accompanied by a modification of certain option grants, the Company has measured the incremental compensation cost resulting from the modifications in accordance with the provisions of SFAS No. 123 as of this date.
Income Taxes
The income tax accounts reflected on these financial statements relate solely to foreign sales companies in Japan and Europe, and SPC Trucking, which are taxable entities. All other entities are flow through entities for tax purposes.
Legal Costs
Legal costs associated with loss contingencies are expensed as incurred to the extent such costs are not recoverable from an insurance provider or another party.
Reclassification and Revisions
Certain prior year items have been reclassified to conform to the current year presentation. The effect of these revisions is not material to the financial statements.
Prospective Accounting Pronouncements.
The Financial Accounting Standards Board (FASB) issued SFAS No. 123 (revised 2004),Share-Based Payment (123R), in December 2004. SFAS No. 123R is a revision of SFAS No. 123,Accounting for Stock-Based Compensation, and supersedes Accounting Principles Board (APB) Opinion No. 25,Accounting for Stock Issued to Employees. SFAS No. 123R requires the fair value of employee awards issued, modified, repurchased or cancelled after implementation under share-based payment arrangements to be measured as of the date the award is issued, modified, repurchased or cancelled. The resulting cost will then be recognized in the statements of operations over the requisite service period. As the Company has no equity securities traded in a public market, it is required to implement SFAS No. 123R using the prospective transition method on January 1, 2006. The Company is currently in the process of determining the effect of adoption of SFAS 123R in 2006.
In May 2005, the FASB issued SFAS No. 154,Accounting Changes and Error Corrections—a replacement of APB Opinion No. 20 and FASB Statement No. 3. SFAS No. 154 requires retrospective application for changes in accounting principles whenever practicable, rather than including the cumulative effect of an accounting
73
AMERICAN SEAFOODS GROUP LLC AND SUBSIDIARIES
NOTES TO CONSOLIDATED FINANCIAL STATEMENTS—(Continued)
change in net income in the period of change. SFAS No. 154 applies to voluntary changes in accounting principles and also changes required by new accounting pronouncements if specific transition provisions are not provided. The Company will implement this pronouncement on January 1, 2006.
Note 2. Inventories
Inventories at December 31 consist of the following (in thousands):
| | | | | | |
| | | 2004 | | 2005 |
Fish blocks and surimi | | $ | 22,889 | | $ | 30,020 |
Finished seafood products | | | 18,219 | | | 19,279 |
Breading, batter, additives and packaging supplies | | | 9,539 | | | 6,141 |
| | | | | | |
| | $ | 50,647 | | $ | 55,440 |
| | | | | | |
Note 3. Deferred Operating Costs and Prepaid Expenses
Deferred operating costs and prepaid expenses at December 31 consist of the following (in thousands):
| | | | | | |
| | | 2004 | | 2005 |
Vessel supplies | | $ | 1,696 | | $ | 5,757 |
Fuel | | | 1,678 | | | 2,890 |
Prepaid insurance | | | 2,242 | | | 2,078 |
Permits, licenses and property taxes | | | 377 | | | 277 |
Deposits | | | 223 | | | 246 |
Fish quota purchases and dues | | | 506 | | | 193 |
Fishing gear supplies | | | 502 | | | 51 |
Other | | | 843 | | | 1,806 |
| | | | | | |
| | $ | 8,067 | | $ | 13,298 |
| | | | | | |
Note 4. Property, Vessels and Equipment
Property, vessels and equipment at December 31 consist of the following (in thousands):
| | | | | | | | |
| | | 2004 | | | 2005 | |
Vessels and related equipment | | $ | 314,542 | | | $ | 324,948 | |
Machinery and equipment | | | 30,005 | | | | 33,017 | |
Buildings | | | 12,348 | | | | 12,468 | |
Fishing gear | | | 7,820 | | | | 9,171 | |
Office equipment, furniture and fixtures | | | 7,033 | | | | 7,127 | |
Office leasehold improvements | | | 678 | | | | 941 | |
| | | | | | | | |
| | | 372,426 | | | | 387,672 | |
Less accumulated depreciation and amortization | | | (175,556 | ) | | | (217,663 | ) |
| | | | | | | | |
| | | 196,870 | | | | 170,009 | |
| | |
Land | | | 1,470 | | | | 1,470 | |
| | | | | | | | |
| | $ | 198,340 | | | $ | 171,479 | |
| | | | | | | | |
74
AMERICAN SEAFOODS GROUP LLC AND SUBSIDIARIES
NOTES TO CONSOLIDATED FINANCIAL STATEMENTS—(Continued)
Depreciation of property, vessels and equipment and amortization of leasehold improvements, net of amounts included in inventory, was $37.4 million, $41.5 million, and $40.5 million for the years ended December 31, 2003, 2004 and 2005, respectively. At December 31, 2004 and 2005, depreciation and amortization recorded in ending inventory was $3.5 million and $3.9 million, respectively.
In 2005, the Company purchased the catcher vesselForum Star, related gear and equipment and certain fishing rights primarily in the cod-trawl fishery for $10.8 million, of which $10.0 million was paid in cash, a $0.7 million note payable due in 2006, and $0.1 million in transaction costs. The acquisition purchase price was allocated $1.5 million to the vessel, gear and equipment and the remaining portion to pollock and scallop fishing rights (see Note 6). The acquired assets were placed into service during January 2006.
Note 5. Derivative Instruments
Foreign Exchange Contracts
The Company has a significant amount of Japanese yen and Euro denominated sales; therefore, its earnings, cash flows and financial position are exposed to foreign currency risk. The Company attempts to manage foreign currency risk by using foreign currency forward exchange contracts to hedge the variability of future cash flows associated with Japanese yen and Euro denominated sales. These contracts are arranged so that the Company sells Japanese yen and Euros to the counterparty at a fixed exchange rate and receives U.S. dollars in return. It is the Company’s risk management policy to hedge a target level of 80% of its forecasted yen sales over the next 12 months, 65% over months 13 to 24, 50% over months 25 to 36, and 35% over months 37 to 48. It is the Company’s risk management policy to hedge up to 100% of its committed Euro sales over the next 12 months.
In specific circumstances, the Company may elect to redesignate hedges as speculative instruments as follows:
| | • | | Redesignation due to the sale, termination or execution of offsetting swap positions that effectively eliminate the related hedge contracts, although the forecasted transaction is still considered to be probable. In these circumstances, the amount of unrealized gain or loss recorded to other comprehensive income as of the time of redesignation is held in other comprehensive income (loss) until the underlying forecasted transaction occurs in accordance with the requirements of SFAS 133. During 2005, the Company had one contract that had been redesignated under this criteria for which the underlying designated transaction occurred. The amount reclassified to earnings for this contract was a gain of approximately $1.0 million. As of December 31, 2005, the Company had two contracts with offsetting swap positions and six contracts that were terminated with a total notional amount of $114.2 million with a gain of $1.4 million held in other comprehensive income (loss). |
| | • | | Redesignation upon determination that the underlying forecasted transaction is no longer considered to be probable by the end of the original period of the hedge or an additional two month period following. In accordance with SFAS 133, all unrealized gains or losses due to changes in the net present value of these contracts are recorded to the consolidated statements of operations as a component of unrealized gains or losses from foreign exchange contracts. During 2005, there was one contract for which it was determined that the underlying forecasted transaction was no longer probable and unrealized losses on this contract which totalled approximately $1.0 million was recorded as a component of foreign exchange gains or losses in the statement of operations. The Company did not have any such contract positions as of December 31, 2005. |
75
AMERICAN SEAFOODS GROUP LLC AND SUBSIDIARIES
NOTES TO CONSOLIDATED FINANCIAL STATEMENTS—(Continued)
| | • | | Redesignation due to the sale, termination or execution of offsetting swap positions that effectively eliminates the related hedge contracts and it is determined that the underlying forecasted transaction is no longer considered to be probable by the end of the original period of the hedge or an additional two month period following. In accordance with SFAS 133, all unrealized gains or losses due to changes in net present value of these contracts are recorded to the statements of operations as a component of unrealized gains or losses from foreign exchange contracts. As of December 31, 2005, the Company did not have any such contract positions. |
The following summarizes the Company’s Japanese yen foreign exchange contracts designated as cash flow hedges as of December 31, 2005 (in millions):
| | | | | | | |
| | | Year of Maturity | | |
| | | From | | To | | Notional Amount |
Open contracts | | 2006 | | 2009 | | $ | 248.8 |
Extension agreements—2003 | | 2006 | | 2006 | | | 100.0 |
Extension agreements—2005 | | 2006 | | 2008 | | | 30.0 |
| | | | | | | |
Total amount of contracts | | | | | | $ | 378.8 |
| | | | | | | |
In connection with these foreign currency forward exchange contracts, as of December 31, 2005, the Company also had agreements to extend certain foreign exchange agreements that expire between September 2006 and March 2008 and between March 2009 and December 2010 with a total notional amount of $130.0 million. These extension agreements would become binding and effective only if the spot rate falls below ¥99 and ¥95 per U.S. dollar on or before March 2006 and September 2008, respectively. If the spot rate does not reach the trigger on or before March 2006 or September 2008, neither the Company nor the counterparty shall have any right or obligation with respect to any of these extension agreements.
In addition, the Company had Euro foreign exchange contracts with notional amounts totaling $6.3 million at December 31, 2005, which expire during 2006.
The following summarizes the activity in the statements of operations related to the Company’s foreign exchange contracts (in millions):
| | | | | | | | | | | | |
| | | Year Ended December 31, | |
| | | 2003 | | | 2004 | | | 2005 | |
Statement of operations classification: | | | | | | | | | | | | |
Revenue—gains (losses) reclassified | | $ | 0.9 | | | $ | (12.6 | ) | | $ | (8.6 | ) |
Foreign exchange gains (losses), net: | | | | | | | | | | | | |
Unrealized gains (losses), net | | | (4.2 | ) | | | (4.0 | ) | | | 14.3 | |
Realized gains (losses), net | | | — | | | | (2.1 | ) | | | 9.3 | |
Transactions gains (losses), net | | | 0.2 | | | | 0.3 | | | | 0.2 | |
| | | | | | | | | | | | |
Foreign exchange gains (losses), net | | | (4.0 | ) | | | (5.8 | ) | | | 23.8 | |
| | | | | | | | | | | | |
Net effect on earnings during the period | | $ | (3.1 | ) | | $ | (18.4 | ) | | $ | 15.2 | |
| | | | | | | | | | | | |
The unrealized gains and losses resulting from changes in the spot rate on the effective portion are recorded in accumulated other comprehensive income (loss) and are reclassified to revenue when the underlying forecasted transaction occurs. The estimated amount of existing net loss as of December 31, 2005 that are
76
AMERICAN SEAFOODS GROUP LLC AND SUBSIDIARIES
NOTES TO CONSOLIDATED FINANCIAL STATEMENTS—(Continued)
expected to be reclassified into revenue within the next 12 months are approximately ($5.3) million. The ($5.3) million as of December 31, 2005 includes ($5.1) million in other comprehensive income related to redesignated and terminated foreign exchange contracts. The unrealized gains and losses resulting from factors other than changes in the spot rates, including changes in fair value and the time value component of the contracts, are recorded as foreign exchange gains (losses) and classified in other income (expense), net.
Other Derivative Instruments
The following summarizes activity in the statements of operations related to the Company’s other derivative instruments contracts (in millions):
| | | | | | | | | | | |
| | | Year Ended December 31, | |
| | | 2003 | | 2004 | | | 2005 | |
Statements of operations and inventory classifications: | | | | | | | | | | | |
Cost of production, included as a component of cost of sales and inventory—fuel hedge settlement gains, net | | $ | 1.0 | | $ | 3.0 | | | $ | — | |
| | | |
Interest expense—realized and unrealized gains (losses), net | | | — | | | (0.1 | ) | | | (0.1 | ) |
| | | |
Other derivative gains (losses), net: | | | | | | | | | | | |
Cross currency interest rate swap contracts: | | | | | | | | | | | |
Unrealized gains (losses) | | $ | — | | $ | (6.3 | ) | | $ | 6.6 | |
Realized gains | | | — | | | — | | | | 1.0 | |
Fuel contracts: | | | | | | | | | | | |
Unrealized gains (losses) | | | — | | | (0.8 | ) | | | 3.7 | |
Realized gains | | | — | | | — | | | | 1.8 | |
| | | | | | | | | | | |
Other derivative gains (losses), net | | $ | — | | $ | (7.1 | ) | | $ | 13.1 | |
| | | | | | | | | | | |
Cross Currency Interest Rate Swap Agreements. As of December 31, 2005, the Company had variable to fixed-rate cross currency interest swap contracts with an aggregate notional amount of $50.0 million. Under the terms of these contracts, the Company pays a fixed rate of interest in Japanese yen and receives payments on a variable rate of interest in U.S. dollars based on the three-month LIBOR rate. As these instruments have not been designated as hedges, any unrealized gains and losses resulting from the change in fair value are recognized in the statements of operations as a component of other derivatives gains (losses), net. At December 31, 2005, the fair value of these contracts had an unrealized net gain of approximately $0.3 million, which reflects a $6.3 million reduction in unrealized losses from December 31, 2004. Accordingly, an unrealized gain of approximately $6.6 million was recorded in the statements of operations as a component of other derivatives gains (losses), net for the year ended December 31, 2005.
Interest Rate and Cap Agreements.The Company had an interest rate cap with a notional amount of $72.5 million that matured in June 2005. The cap rate was 5.0% and the variable rate was the three-month LIBOR rate. As this instrument was not considered to be effective until the interest rate of the underlying exceeded the cap rate, any unrealized gains or losses were recognized in the statements of operations. During the years ended December 31, 2004 and 2005, the related realized and unrealized gain (loss) of $(0.1) million and $0.1 million, respectively, was recorded as interest expense.
Interest Rate Forward Swap Agreements.During the fourth quarter of 2005, the Company entered into three forward interest rate swaps with an aggregate notional amount of $180.0 million and effective date of May 2, 2006, that mature in March 2011.As these instruments have not been designated as hedges, any unrealized gains
77
AMERICAN SEAFOODS GROUP LLC AND SUBSIDIARIES
NOTES TO CONSOLIDATED FINANCIAL STATEMENTS—(Continued)
and losses resulting from the change in fair value are recognized in the statement of operations as interest expense. At December 31, 2005, the fair value of these contracts was an unrealized loss of approximately $0.2 million.
Fuel Contracts. The Company has fuel contracts whereby the Company pays a fixed price per gallon and receives a floating price per gallon with payments calculated on the remaining notional amount of 11.5 million gallons over the term of the contracts through October 31, 2007. In accordance with the Company’s hedging policy in relation to these contracts, periodic assessments of effectiveness for accounting purposes are performed on at least a quarterly basis. Based on the results of these analyses, in 2004 the Company determined that these new instruments did not meet the accounting definition of highly effective (although these fuel contracts did produce their intended purpose of offsetting fluctuations in fuel prices). At December 31, 2005, the fair value of these contracts was an unrealized gain of approximately $2.9 million, which represents a $3.7 million increase from the $0.8 million unrealized loss at December 31, 2004. Accordingly, unrealized gains (losses) of approximately $3.7 million were recorded in the statements of operations as a component of other derivatives gains (losses), net for the year ended December 31, 2005.
During the years ended December 31, 2003 and 2004, fuel contracts were accounted for as hedges. Accordingly, the net realized gains on the settlement of fuel contracts of approximately $1.0 million and $3.0 million, respectively, were recorded as inventory production costs, a portion of which is included as a component of cost of sales in the statements of operations during 2003 and 2004 with the remaining portion included in the carrying amount of inventory at December 31, 2003 and 2004.
Note 6. Cooperative and Fishing Rights, Goodwill and Other Intangibles
Cooperative rights were recorded at their estimated fair value of $138.2 million in connection with the Original Acquisition. The cooperative rights are being amortized on a straight-line basis over 20 to 25 years, based principally on the average remaining lives of the vessels at the date of acquisition. There have been no events or circumstances that warrant a revision to the remaining period of amortization.
On December 16, 2002, the Company completed the SPC Acquisition. The allocation of the purchase price included approximately $4.9 million in intangible assets other than goodwill. These acquired intangible assets consist principally of a trade name and customer-based intangibles, each of which has an estimated life of ten years. In the third quarter of 2004, management determined that it was more likely than not that the carrying amount of net assets, including goodwill, at SPC exceeded the fair value of the reporting unit. SPC’s recent operating results have not met management’s expectations primarily as a result of increased fish costs paid to catfish farmers combined with lower processing yields. The Company engaged a valuation firm to assist management in determining the fair value of SPC as of August 31, 2004 and the amount of goodwill impairment in accordance with SFAS No. 142. Pursuant to SFAS No. 142, the Company recorded an impairment charge of $7.2 million in the third quarter of 2004, which represented the entire carrying amount of goodwill associated with SPC.
In 2005, the Company purchased certain fishing rights related to its acquisition of the catcher vesselForum Star. Fishing rights of $9.3 million were placed into service during January 2006.
As of December 31, 2005, goodwill is primarily comprised of the $33.5 million incurred in connection with the Original Acquisition. In the fourth quarter of 2005, management conducted an analysis in accordance with SFAS No. 142 and determined the fair value of goodwill associated with the reporting units within the at-sea processing segment exceeds its carrying amount by a substantial margin and assets and liabilities that make up these reporting units have not changed significantly since the Original Acquisition. Accordingly, management
78
AMERICAN SEAFOODS GROUP LLC AND SUBSIDIARIES
NOTES TO CONSOLIDATED FINANCIAL STATEMENTS—(Continued)
has concluded that the likelihood that a determination that the fair value would be less than the current carrying amount of the reporting unit is remote.
Amortization expense for cooperative and fishing rights and other intangibles and the estimated useful lives for the years ended December 31, 2003, 2004 and 2005 consist of the following (in thousands):
| | | | | | | | | | | |
| | | | | Amortization expense |
| | | Life | | 2003 | | 2004 | | 2005 |
Cooperative rights | | 23.2 | | $ | 3,823 | | $ | 3,822 | | $ | 3,836 |
SPC customer base and trade name | | 10.0 | | | 520 | | | 520 | | | 520 |
RAFI fishing rights | | 21.8 | | | 374 | | | 137 | | | 244 |
PLC fishing rights | | 23.2 | | | 55 | | | 88 | | | 121 |
ASI Non-competition agreements | | 1.0 | | | — | | | 37 | | | 31 |
| | | | | | | | | | | |
| | | | $ | 4,772 | | $ | 4,604 | | $ | 4,752 |
| | | | | | | | | | | |
Weighted-average life | | 22.7 | | | | | | | | | |
| | | | | | | | | | | |
Amortization of cooperative and fishing rights is classified in cost of sales in the statements of operations. Amortization of the SPC customer base and trade name is classified in selling, general and administrative expenses. There is no significant residual value associated with the intangibles.
The estimated aggregate amortization expense for cooperative and fishing rights and other intangibles for each of the next five years is $5.1 million.
Note 7. Accounts Payable and Accrued Expenses
Accounts payable and accrued expenses at December 31 consist of the following (in thousands):
| | | | | | |
| | | 2004 | | 2005 |
Accounts payable | | $ | 14,868 | | $ | 13,056 |
Deferred compensation | | | 5,331 | | | 5,626 |
Accrued payroll and benefits | | | 4,281 | | | 6,946 |
Interest payable | | | 3,741 | | | 3,881 |
Alaska landing tax payable | | | 1,406 | | | 904 |
Other accrued liabilities | | | 3,929 | | | 4,841 |
| | | | | | |
| | $ | 33,556 | | $ | 35,254 |
| | | | | | |
79
AMERICAN SEAFOODS GROUP LLC AND SUBSIDIARIES
NOTES TO CONSOLIDATED FINANCIAL STATEMENTS—(Continued)
Note 8. Long-Term Debt
Long-term debt at December 31 consist of the following in order of priority (in thousands):
| | | | | | |
| | | 2004 | | 2005 |
New Credit Facility: | | | | | | |
Term A loan, interest at 6.28%, maturity in 2011 | | $ | — | | $ | 123,438 |
Term B-1 loan, interest at 6.28%, maturity in 2012 | | | — | | | 139,650 |
Revolving Credit Facility, interest at 5.95%, maturity in 2011 | | | — | | | 15,000 |
Senior Subordinated Notes, interest at 10.125%, maturing in 2010 | | | 175,000 | | | 175,000 |
Former Credit Facility, paid in full October 2005: | | | | | | |
Term A loan, interest at 5.56% | | | 45,319 | | | — |
Term B loan, interest at 5.81% | | | 244,303 | | | — |
Revolving Credit Facility, interest at 5.56% | | | 16,500 | | | — |
| | | | | | |
Total long-term debt | | | 481,122 | | | 453,088 |
Less current portion of long-term debt | | | 26,547 | | | 8,431 |
| | | | | | |
Long-term debt, net of current portion | | $ | 454,575 | | $ | 444,657 |
| | | | | | |
At December 31, 2005, the future maturities of long-term debt are as follows (in thousands):
| | | |
2006 | | $ | 8,431 |
2007 | | | 11,556 |
2008 | | | 14,681 |
2009 | | | 17,806 |
2010 | | | 206,088 |
Thereafter | | | 194,526 |
| | | |
Total long-term debt | | $ | 453,088 |
| | | |
Senior Subordinated Notes
ASG issued and sold $175.0 million of Senior Subordinated Notes as part of a recapitalization on April 18, 2002. These notes mature in 2010, and interest is paid semi-annually in April and October of each year at a fixed annual interest rate of 10 1/8%.
The indenture governing the Senior Subordinated Notes imposes restrictions similar to the Former Credit Facility restrictions (described below) on the operation of the business. The Company was in compliance with the covenants of the indenture of the Senior Subordinated Notes at December 31, 2005.
80
AMERICAN SEAFOODS GROUP LLC AND SUBSIDIARIES
NOTES TO CONSOLIDATED FINANCIAL STATEMENTS—(Continued)
New Credit Facility
On October 6, 2005, the Company entered into a Third Amended and Restated Credit Agreement (New Credit Facility) with a group of banks and other financial institutions, some of which are parties to the Former Credit Facility. The New Credit Facility amends and restates the Former Credit Facility to provide for credit extensions of borrowings not to exceed $520.0 million. The terms of the new credit facility are summarized as follows:
| | • | | Revolving credit facility commitment of $75.0 million, with a sub-credit facility for letters of credit, maturing on September 30, 2011; |
| | • | | Term A loan in the amount of $125.0 million funded at closing, payable in quarterly payments of interest and principal, maturing on September 30, 2011; |
| | • | | Term B-1 loan in the amount of $140.0 million funded at closing, payable in quarterly payments of interest and principal, maturing on September 30, 2012; |
| | • | | Term B-2 credit facility commitment of $180.0 million available on a delayed draw basis at any time within the first seven months of closing, and requiring that any proceeds of such facility be used to pay the principal, interest, call premium and other amounts outstanding on the Senior Subordinated Notes, payable in quarterly payments of interest and principal, maturing on September 30, 2012; |
| | • | | Term A and B loans require additional excess cash flow payments similar to the Former Credit Facility. The first additional excess cash flow payment is due in March 2007. |
The interest on the revolving credit facility and term loans is determined based on rates that are calculated using a Eurodollar rate or base rate at the Company’s option. For the revolving credit facility and Term A loans the amount of the margin is determined based on results of financial covenant ratios. Such margins range from 1.25% to 1.75% for Eurodollar rate loans and 0.25% to 0.75% for base rate loans. For the Term B loans, the margins are 1.75% for Eurodollar rate loans and 0.75% for base rate loans.
The New Credit Facility is secured by substantially all of the Company’s assets including intangible assets. Under the terms of the New Credit Facility, the Company is required to meet certain financial tests, including a maximum leverage ratio and a minimum fixed charge coverage ratio. The New Credit Facility contains certain covenants which, among other things, limit the incurrence of additional indebtedness, liens, and encumbrances, changes of control, changes in the nature of the business, investments, dividends and other restricted payments, prepayments of certain indebtedness, certain transactions with affiliates, asset sales, acquisitions, capital expenditures, mergers and consolidations, sales of receivables and other matters customarily restricted in such agreements. In addition, the New Credit Facility contains customary negative and affirmative covenants and customary events of default, funding conditions, representations and warranties and other customary provisions for senior secured credit facilities.
Notwithstanding the above maturity dates, in the event that the Senior Discount Notes issued by the Company’s direct parent, ASG Consolidated and its subsidiary remain outstanding as of May 1, 2011, then all amounts outstanding under the New Credit Facility, including revolving credit borrowings, letters of credit and Term A and B loans, will become immediately due and payable in full on such date.
81
AMERICAN SEAFOODS GROUP LLC AND SUBSIDIARIES
NOTES TO CONSOLIDATED FINANCIAL STATEMENTS—(Continued)
As of December 31, 2004 and 2005, available borrowings under the revolving loan component of the New and Former Credit facilities are summarized as follows (in thousands):
| | | | | | |
| | | 2004 | | 2005 |
Total revolving credit facility | | $ | 75,000 | | $ | 75,000 |
Less outstanding commitments: | | | | | | |
Outstanding balance | | | 16,500 | | | 15,000 |
Open letters of credit | | | 27,500 | | | — |
| | | | | | |
Total outstanding commitments | | | 44,000 | | | 15,000 |
| | | | | | |
Available borrowings | | $ | 31,000 | | $ | 60,000 |
| | | | | | |
The Company pays an annual loan fee, due quarterly, equal to 1/2% of the unused portion of available borrowings under the revolving loan component of the New Credit Facility.
As of December 31, 2005, the Company was in compliance with its covenants under the New Credit Facility.
Former Credit Facility
In connection with the April 2002 recapitalization, the Company entered into a senior credit agreement with a syndicate of banks, the administrative agent of which was Bank of America, N.A. The Former Credit Facility consisted of a $75.0 million revolving credit facility and $370.0 million in term loans ($90.0 million Term A and $280.0 million Term B). Obligations under the Former Credit Facility were secured by substantially all the Company’s assets. In December 2002, the Company entered into an amendment to the Former Credit Facility that provided, among other things, for an increase in the principal amount of the Term B loans by $50 million.
During January 2004, the Company obtained an amendment to the debt covenants, which, among other things, adjusted the required leverage ratios as of December 31, 2003 and March 31, 2004, primarily due to adverse surimi prices. During the third quarter of 2003, an adjustment was made to reverse the management bonus accrued through June 30, 2003 of approximately $1.2 million, in accordance with certain employment agreements and the Company’s general bonus policy, which require that performance bonuses are not payable for any year in which there is or would be a covenant violation. This amendment and the reversal of the bonuses allowed the Company to maintain compliance with the leverage ratio covenant under the credit agreement.
In October 2004, the Company entered into another amendment to the Former Credit Facility that, among other things: (1) permitted the offering of the Senior Discount Notes by ASG Consolidated; (2) provided for guarantees by ASG Consolidated and its wholly-owned subsidiary, ASG Finance, of ASG’s obligations under the credit facility and a pledge of ownership interests in ASG Consolidated to secure the guarantee; (3) permitted the sale of certain distribution related assets of SPC Trucking up to an aggregate fair market value of $7.5 million; (4) amended the required leverage ratio beginning September 30, 2004 and made other covenant modifications to provide necessary covenant relief to the Company primarily due to recent adverse surimi prices and a decline in the performance of catfish operations; and (5) excluded certain expenses incurred from the definition of EBITDA (earnings before interest, tax, depreciation and amortization) for the covenant calculations, including the write-off of offering costs of up to $19.0 million related to the Company’s cancelled public IDS offering. The Former Credit Facility was paid off in full with proceeds of the New Credit Facility described above.
Deferred Financing Costs
The Company incurred $2.9 million in financing costs associated with the New Credit Facility and wrote off $10.9 million of the carrying balance of deferred financing costs resulting from the extinguishment of debt
82
AMERICAN SEAFOODS GROUP LLC AND SUBSIDIARIES
NOTES TO CONSOLIDATED FINANCIAL STATEMENTS—(Continued)
during 2005 and a portion of the new financing costs. In 2006, if the Company redeems the Senior Subordinated Notes with funds borrowed under the Term B-2 delayed draw credit facility, the Company will write off up to $10.0 million of deferred financing costs.
Financing costs were paid in connection with the Credit Agreement and related amendments and offering of the Senior Subordinated Notes. These deferred financing costs are amortized into interest expense on a straight-line basis, which approximates the effective interest method over the periods presented.
Note 9. Related Parties
Transactions with related parties include the following as of and for the years ended December 31 (in thousands):
| | | | | | | | | |
| | | 2003 | | 2004 | | 2005 |
Cost of sales: | | | | | | | | | |
Purchases of fish quota | | $ | 14,917 | | $ | 14,995 | | $ | 14,978 |
Insurance | | | 2,407 | | | 6,262 | | | 7,118 |
| | | | | | | | | |
Total cost of sales | | | 17,324 | | | 21,257 | | | 22,096 |
| | | | | | | | | |
Selling, general and administrative expenses: | | | | | | | | | |
Aircraft lease expense, net of charter revenue of $71, $146 and $121 | | | 702 | | | 732 | | | 1,906 |
Insurance | | | 272 | | | 223 | | | 669 |
Director’s fees | | | 150 | | | 150 | | | 150 |
Consulting fees | | | — | | | — | | | 360 |
| | | | | | | | | |
Total selling, general and administrative expenses | | | 1,124 | | | 1,105 | | | 3,085 |
| | | | | | | | | |
Other income (expense), net: | | | | | | | | | |
Aircraft lease expense | | | — | | | — | | | 748 |
Interest income | | | 288 | | | 228 | | �� | — |
Note receivable—outstanding at end of period | | | 6,000 | | | — | | | — |
There are a limited number of entities that hold quota rights to fish for pollock in the Bering Sea. Quota rights are expressed in metric tons of harvestable fish. It is common for such entities to sell quota to both fishing companies in which they hold a financial interest and to others. Fishing companies acquire quota to increase the volume of pollock harvested, processed and sold. The Company purchases quota from a number of such entities including two equity holders of ASLP. Purchases of fish quota from related parties comprised 62.6%, 57.8% and 54.0% of total purchases of fish quota in 2003, 2004 and 2005, respectively. The Company is party to agreements with these equity holders, pursuant to which the Company has been granted a license to harvest and process the entire portion of the total allowable catch allocated to these equity holders under the Alaska Community Development Quota program through the 2008 pollock season.
In December 2004, ASG’s chief executive officer and a director of ASC Management entered into contribution agreements with ASLP pursuant to which they agreed to make capital contributions of $20.0 million and $2.8 million, respectively, to ASLP in the event of a failure of ASG to make any principal payment under the Former Credit Facility. ASLP in turn agreed to contribute these amounts to the capital of Holdings and to cause Holdings and its subsidiaries to contribute these amounts to ASG. The contribution obligations were replaced in December 2005, with new obligations to make capital contributions of $30.0 million and $4.0 million, respectively. These contribution obligations will expire on the earlier of the payment of all principal and interest due under the New Credit Facility or January 15, 2007.
83
AMERICAN SEAFOODS GROUP LLC AND SUBSIDIARIES
NOTES TO CONSOLIDATED FINANCIAL STATEMENTS—(Continued)
On July 2, 2002, the Company loaned $6.0 million to its chief executive officer to purchase ownership interests in ASLP and Holdings from a selling ASLP partner at the same price per unit paid by other purchasing partners at that time. The loan bore interest at the prime rate plus one-half percent per annum, reset on January 1, April 1, July 1 and October 1 of each year that the loan was outstanding. During 2003 and 2004, approximately $0.3 million and $0.2 million, respectively, of related party interest income had been recorded pursuant to this loan. Principal and interest on the loan, totaling $6.3 million, were paid in full in October 2004.
The Company leased two aircraft on a month-to-month basis from ASLP. In 2005, the Company entered into a two-year charter arrangement for one of the aircraft with a third party. As a result, expenses related to this aircraft are included in other income (expense) net, less charter income. Previously, this aircraft was used primarily for internal use and its related expenses were classified as a component of selling, general and administrative expenses, net of incidental rental income.
The Company purchases certain insurance policies through an insurance brokerage company the president of which is the brother of the Company’s chief executive officer. During 2003, 2004 and 2005, the related insurance premiums were approximately $2.7 million, $6.5 million and $7.8 million, respectively.
The Company entered into a consulting agreement in January 2005 with a member of the Board. Under the terms of this agreement, the Company will pay $175,000 per year for consulting services. The agreement has a term of one year and is renewable for successive one year terms.
The Company entered into a consulting agreement with a member and former officer in April 2005. Under terms of the agreement, the Company will pay $300,000 per year for consulting services. The agreement has a term of one year and is renewable for successive one year terms.
Note 10. Income Taxes
The taxable entities in the consolidated group include foreign sales companies in Japan and Europe, and SPC Trucking. The Company and all of its other subsidiaries are flow through entities for income tax purposes. Therefore, the provision for income taxes reflects only the provision of the taxable entities. The total current provision for income taxes was $41,000, $31,000 and $53,000 for the years ended December 31, 2003, 2004 and 2005, respectively.
A reconciliation of the statutory tax rate to the effective tax rate is as follows:
| | | | | | | | | |
| | | 2003 | | | 2004 | | | 2005 | |
Statutory rate | | 35.0 | % | | (35.0 | )% | | 35.0 | % |
Impact of flow-through entities | | (34.7 | )% | | 35.1 | % | | (34.9 | )% |
| | | | | | | | | |
Effective rate | | 0.3 | % | | 0.1 | % | | 0.1 | % |
| | | | | | | | | |
The tax effects of temporary differences and carry forwards that give rise to deferred tax assets and liabilities at December 31, 2003, 2004, and 2005 are not material. The book basis of the Company’s flow-through entities’ net assets exceeds tax basis by approximately $123.7 million and $189.1 million at December 31, 2004 and 2005, respectively.
84
AMERICAN SEAFOODS GROUP LLC AND SUBSIDIARIES
NOTES TO CONSOLIDATED FINANCIAL STATEMENTS—(Continued)
Note 11. Retirement Plans
The Company sponsors a defined contribution profit sharing plan that covers all eligible full-time employees. Profit sharing contributions to the plan are at the discretion of management. The Company also makes matching contributions equal to 25% of the employees’ contributions to the plan. The total amount of the Company’s contributions was approximately $0.1 million each in 2003 and 2004, and $0.2 million in 2005.
The Company also sponsors a nonqualified deferred compensation plan for certain employees. The Company makes matching contributions equal to 25% of the employees’ annual contribution up to a maximum Company contribution of 15.0% of the employee’s annual compensation. Employees’ earnings under this plan are calculated to be equal to the returns of certain public funds as designated by the employee. To assist in funding the deferred compensation program, the Company has invested in corporate-owned life insurance policies. The cash surrender value of these policies was approximately $5.2 million and $5.4 million at December 31, 2004, and 2005, respectively, and is included in other assets. The liability for the deferred compensation was approximately $5.3 million and $5.6 million at December 31, 2004 and 2005, respectively, and is included in accrued expenses. The total amount of the Company’s contribution was approximately $0.2 million, $0.1 million and $0.1 million for the years ended December 31, 2003, 2004 and 2005, respectively.
Note 12. Commitments and Contingencies
Leases
The Company leases offices, aircraft, two warehouses, and land under operating leases. Lease expense was $3.9 million, $3.8 million, and $5.8 million for the years ended December 31, 2003, 2004 and 2005, respectively.
Minimum future lease payments under non-cancelable operating leases having remaining terms in excess of one year as of December 31, 2005, are as follows (in thousands):
| | | |
2006 | | $ | 1,424 |
2007 | | | 1,390 |
2008 | | | 807 |
2009 | | | 562 |
2010 | | | 576 |
Thereafter | | | 3,093 |
| | | |
| | $ | 7,852 |
| | | |
Minimum monthly lease payments through 2009 on cancelable aircraft leases as of December 31, 2005 are $221,400. In March 2006, a lease of $62,400 per month was cancelled.
Fuel Purchase Commitment for 2006. In October 2005, we entered into an exclusive fuel requirements agreement that obligates us to purchase our marine diesel fuel used in our fishing fleet from a third-party vendor. The commitment is for 4.5 million gallons of fuel to be delivered during the period January 1 to June 1, 2006 at a prices based on a market index.
Legal Matters
General. The Company is from time to time party to litigation, administrative proceedings and union grievances that arise in the ordinary course of business. Except as described below, the Company does not have
85
AMERICAN SEAFOODS GROUP LLC AND SUBSIDIARIES
NOTES TO CONSOLIDATED FINANCIAL STATEMENTS—(Continued)
pending any litigation that, separately or in the aggregate, would in the opinion of management have a material adverse effect on its operating results or cash flows. However, given the inherent unpredictability of litigation, it is possible that an adverse outcome could, from time to time, have a material adverse effect on the Company’s operating results or cash flows in any particular quarterly or annual period.
National Marine Fisheries Service Investigation. In 2001 and 2002, management became aware of allegations that certain crew members may have tampered or attempted to tamper with measurement equipment on board one or more of the vessels. The National Marine Fisheries Service conducted an investigation regarding these allegations, and in consultation with the National Marine Fisheries Service, the Company also conducted an internal investigation regarding these allegations. In 2004, the Company received additional tampering allegations relating to one of the vessels and the National Marine Fisheries Service conducted an investigation regarding these allegations. To date, no fines or penalties have been assessed or threatened in connection with any of these allegations. However, the ultimate outcome of these matters is uncertain.
Intervention in U.S. Customs Lawsuit.On September 23, 2005, the Company intervened in a lawsuit brought by Horizon Lines, LLC (“Horizon”) against the U.S. Department of Homeland Security and the U.S. Bureau of Customs and Border Protection (“UCB”) in the United States District Court for the District of Columbia. In its complaint, Horizon challenges the validity of a customs ruling issued to Sunmar Shipping, Inc. that interprets the Third Proviso of the Jones Act. In general, the Jones Act prohibits the transportation of merchandise between two points in the United States using “non-coastwise” (foreign-flagged) vessels. The Third Proviso is an exception to this prohibition and permits the use of foreign-flagged vessels when transporting merchandise between two U.S. ports provided certain conditions are met. The ruling challenged by Horizon, although not directly involving ASG, is substantially similar to a customs ruling the Company received from the UCB and upon which the Company relies to transport products to the East coast of the United States. Horizon seeks to overturn the challenged ruling and, if successful, it may affect the Company’s ability to rely on the ruling received. On February 10, 2006, the court granted Horizon’s motion for summary judgment and directed UCB to reevaluate its customs ruling in light of the court’s decision. The Company is currently evaluating legal and operational alternatives to this decision, including the possibility of an appeal. If Horizon ultimately prevails in its claim, it could negatively impact the Company’s ability to use its current transportation models, increase its costs, and have an adverse effect on the Company’s business and results of operations.
Other lawsuits relate principally to employment matters and are not expected to be material to the Company’s consolidated financial statements taken as a whole.
Protection and Indemnity Claims
The Company has protection and indemnity (P&I) policies for each of its fishing vessels and self-insures a portion of worker’s compensation claims subject to maritime law. Through a P&I mutual company, the deductible amounts vary by vessel and by fishing season. Deductible amounts for the policies range as follows:
| | | |
For the years: | | Deductible per claim
or occurrence |
2002 | | $ | 10,000-50,000 |
2003 | | $ | 10,000-50,000 |
2004 | | $ | 10,000-45,000 |
2005 | | $ | 10,000-40,000 |
The Company incurred expenses of $2.2 million, $1.8 million and $2.0 million related to costs paid under deductibles for the years ended December 31, 2003, 2004 and 2005, respectively.
86
AMERICAN SEAFOODS GROUP LLC AND SUBSIDIARIES
NOTES TO CONSOLIDATED FINANCIAL STATEMENTS—(Continued)
The Company records an estimated expense for maritime worker’s compensation claims when it becomes aware of them for amounts up to the deductible, and records payments in excess of the deductible as a receivable from the P&I mutual company. The Company estimates additional expenditures in excess of the deductible for open unpaid claims as of December 31, 2005, may range between $1.5 million and $7.9 million. The Company believes that future expenditures will be fully reimbursable by the P&I mutual company.
Fish Purchase Commitments
As of December 31, 2005, the Company was party to fixed purchase obligation agreements with the following parties:
| | • | | Alaskan community development groups that provide an exclusive license to harvest and process all or part of the groups’ portion of the total allowable catch of pollock and cod allocated to them under the Alaska Community Development Quota (CDQ) program. Under these agreements, the Company is obligated to make minimum purchases over a three year period, which will be based on the total allowable catch for the year. The Company purchased CDQ of $21.6 million, $26.0 million and $27.7 million in 2003, 2004 and 2005, respectively. |
| | • | | Third-party catcher vessels that license their pollock fishing rights. The Company purchased $2.2 million, $5.0 million and $5.8 million from catcher-vessels in 2003, 2004 and 2005, respectively. |
| | • | | The previous owner of Southern Pride’s catfish operations to purchase up to 5.0 million pounds of catfish per year, at the option of the previous owner, at a price based on a market index for a term of ten years ending on January 1, 2013. The Company purchased catfish under this agreement of 2.4 million pounds for $1.3 million in 2003, 3.1 million pounds for $2.0 million in 2004, and 3.4 million pounds for $2.2 million in 2005. |
| | • | | Other catfish farmers with fixed production and delivery schedules at prices based on a market price within a range of minimum and maximum prices. |
The following schedule summarizes the Company’s outstanding annual fish purchase commitments as of December 31, 2005, based on the following: (i) the fixed contractual price; (ii) if a range of prices is specified, then the high end of the range; or (iii) if no price is specified, then the average market price during December 2005 was utilized to estimate the remaining commitment (in millions):
| | | | | | | | | | | | | | | | | | | | | |
| | | Year Ending December 31, | | | | |
| | | 2006 | | 2007 | | 2008 | | 2009 | | 2010 | | Thereafter | | Total |
Source and species: | | | | | | | | | | | | | | | | | | | | | |
CDQ pollock and cod | | $ | 27.5 | | $ | 25.8 | | $ | 25.8 | | $ | — | | $ | — | | $ | — | | $ | 79.1 |
Farm-raised catfish | | | 22.9 | | | 3.6 | | | 3.5 | | | 3.6 | | | 3.5 | | | 7.1 | | | 44.2 |
Catcher vessel pollock | | | 2.0 | | | 1.9 | | | — | | | — | | | — | | | — | | | 3.9 |
| | | | | | | | | | | | | | | | | | | | | |
Totals | | $ | 52.4 | | $ | 31.3 | | $ | 29.3 | | $ | 3.6 | | $ | 3.5 | | $ | 7.1 | | $ | 127.2 |
| | | | | | | | | | | | | | | | | | | | | |
Moorage, Wharfage and Warehousing Agreement
During July 2005, in order to obtain preferential dock space and improve operational efficiency and product security, ASC entered into a six-month agreement with a stevedoring company to provide moorage, wharfage, warehousing and certain other operational services in Dutch Harbor, Alaska. In January 2006, the agreement was extended under similar terms through June 30, 2006. The agreement requires payments of $100,000 per month.
87
AMERICAN SEAFOODS GROUP LLC AND SUBSIDIARIES
NOTES TO CONSOLIDATED FINANCIAL STATEMENTS—(Continued)
The Company expects ASC’s operations will represent a significant amount of the stevedoring company’s revenue generated from this facility. ASC has guaranteed the stevedoring company’s lease payments as described below.
Lease Guarantee
ASC has guaranteed the foregoing stevedoring company’s lease payments for a five-year period ending on June 30, 2010. During the guarantee period, the lessee is required to pay an annualized base rent of $1.2 million plus taxes, utilities and insurance and perform required maintenance. Upon default under the lease agreement, the lessor must first take action against the lessee, including recovery of a $0.1 million security deposit held by the lessor, before proceeding against ASC. The lessee has notified the Company that it was in compliance with the terms of the lease as of December 31, 2005. The Company has not recorded a liability related to its guarantee because it believes default is remote and, therefore, the value of the guarantee is negligible.
ASG Consolidated
ASG Consolidated’s principal source of cash flow is from distributions from ASG. ASG’s ability to make distributions to ASG Consolidated will depend upon the operating results of ASG and its subsidiaries. ASG is subject to restrictions under its New Credit Facility and the indenture governing its Senior Subordinated Notes.
On October 19, 2004, ASG Consolidated and its wholly-owned subsidiary, ASG Finance, Inc., issued and sold 11 1/2% Senior Discount Notes for gross proceeds of $124.9 million. As of December 31, 2005, the carrying amount of this debt was approximately $142.8 million, which is not recorded in the accompanying consolidated balance sheet. ASG and its subsidiaries have not guaranteed the repayment of the Senior Discount Notes. The Senior Discount Notes will have an accreted value of $196.0 million principal amount at maturity in November 2011. ASG Consolidated’s carrying balance on the notes is being accreted using the effective interest method from origination through the period ending November 1, 2008. No interest will be paid during this period. Thereafter, interest will accrue and be payable semi-annually by ASG Consolidated on May 1 and November 1 of each year, at a fixed annual rate of 11 1/2%. The first interest-only payment is due on May 1, 2009.
Note 13. Fair Value of Financial Instruments
The Company’s financial instruments include cash and cash equivalents, receivables, foreign exchange contracts, cross currency interest rate swap agreements, interest rate swap agreements, fuel contracts, accounts payable and accrued expenses, and short-term and long-term borrowings. The Company believes that the fair value of these financial instruments approximates their carrying amounts based on current market indicators, such as prevailing interest rates and market pricing models, except that the estimated fair value of the Company’s Senior Subordinated Notes was approximately $188.1 million and $184.4 million at December 31, 2004 and 2005, respectively, which exceeds the $175.0 million carrying amount.
Note 14. Member’s Interest
Restrictions on Distributions and Liabilities
As described in Note 1, the Company is part of a group of subsidiaries that are owned by ASLP. The partners of ASLP do not have any direct liability for the acts of the Company. There are restrictions imposed on distributions to its sole member by covenants contained in the New Credit Facility, and the Senior Subordinated Note indenture as described in Note 8. Distributions are limited to an amount that will enable the member to pay theoretical tax, as defined in the New Credit Facility, on the amount of taxable income of the Company.
88
AMERICAN SEAFOODS GROUP LLC AND SUBSIDIARIES
NOTES TO CONSOLIDATED FINANCIAL STATEMENTS—(Continued)
Non-Cash Capital Contribution
During 2004 and 2005, ASLP made non-cash capital contributions to the Company of $20.0 million and $5.3 million related to forgiveness of receivables from the Company. There were no such contributions in 2003.
Tax Distributions and Contributions
The Company makes distributions to its sole member for the tax liabilities it incurs on the Company taxable income. More specifically, the Company makes distributions to its member in amounts equal to the theoretical tax on the Company’s taxable income (determined without regard to deductions for interest on the notes or other deductions incurred by entities above the Company), whether or not such amounts are required by such owner actually to pay taxes on the income that is allocated to it. These payments are recorded as distributions to member on the statements of member’s equity (deficit).
During 2004, ASC, Inc. received a tax refund of $2.2 million of prior year’s taxes and contributed the cash to ASG. There were no such contributions in 2003 and 2005.
Note 15. Partnership Unit Option Plan
On January 28, 2000, ASLP adopted a unit option plan (Unit Option Plan). This plan was amended and restated effective April 18, 2002 and again on December 16, 2002. The board of directors of ASC Management, Inc., the general partner of ASLP administers the Unit Option Plan. The board selects eligible participants, number of partnership units subject to each option grant, exercise price of such options, time and condition of exercise of such options, and all terms and conditions of such option grants. Grants have a maximum term of 9 years. Subject to adjustments provided for in the option agreements and increases by the board of directors, the Unit Option Plan provides for an aggregate of 182,000 partnership units to be available for option grants. Unless terminated earlier by the board, the Unit Option Plan will terminate when partnership units are no longer available for grant. As of December 31, 2005, 3,867 units remain available for grant.
In the sole discretion of the board, the terms of an option agreement may provide that in the event of a reorganization, merger, consolidation, sale or other disposition of substantially all of the assets of or equity interest in ASLP, the vesting of some or all of a participant’s outstanding options shall, immediately upon the occurrence of such event or at such other time specified in the option agreement, be accelerated, in part or in full. In addition, the board may at any time accelerate the vesting of any option issued under the Unit Option Plan, in part or in full. The board has accelerated vesting on options in 2002, 2004 and 2006.
The Unit Option Plan provides for the issuance of various types of options including options that vest on certain specified periods of continuing employment (Series A Options); options that vest upon achievement of certain earnings before income, tax, depreciation and amortization targets (Series E Options); and options that vest upon achievement of specified target internal rates of returns by certain partners (Series C, D and F Options). As a result of modifications and performance conditions, all outstanding options are accounted for as variable awards.
89
AMERICAN SEAFOODS GROUP LLC AND SUBSIDIARIES
NOTES TO CONSOLIDATED FINANCIAL STATEMENTS—(Continued)
Activity and price information for the plan are summarized as follows:
| | | | | | | | | | | | | | | | | | | | | | | |
| | | Series A
(units) | | | Series C
(units) | | | Series D
(units) | | | Series E
(units) | | | Series F
(units) | | | Other | | Weighted
Average
Exercise Price | | Weighted
Average Grant
Date Fair Value |
Balance Outstanding, December 31, 2002 | | 29,191 | | | 16,740 | | | 11,272 | | | 37,539 | | | 8,307 | | | 567 | | $ | 100.47 | | | |
| | | | | | | | | | | | | | | | | | | | | | | |
Exercisable, end of year | | — | | | — | | | — | | | 3,670 | | | — | | | 567 | | | 169.51 | | | |
Granted | | 466 | | | — | | | — | | | 466 | | | 466 | | | — | | | 219.71 | | $ | 27.81 |
Exercised | | — | | | — | | | — | | | — | | | — | | | — | | | — | | | |
Forfeited | | (166 | ) | | (167 | ) | | — | | | (300 | ) | | — | | | — | | | 91.95 | | | |
Expired | | — | | | — | | | — | | | — | | | — | | | — | | | — | | | |
| | | | | | | | | | | | | | | | | | | | | | | |
Balance Outstanding, December 31, 2003 | | 29,491 | | | 16,573 | | | 11,272 | | | 37,705 | | | 8,773 | | | 567 | | $ | 102.07 | | | |
| | | | | | | | | | | | | | | | | | | | | | | |
Exercisable, end of year | | 4,180 | | | — | | | — | | | 3,670 | | | — | | | 567 | | $ | 110.16 | | | |
Granted | | — | | | — | | | — | | | — | | | — | | | — | | | — | | | — |
Exercised | | (23,089 | ) | | (8,182 | ) | | (5,636 | ) | | (7,663 | ) | | — | | | — | | | 62.03 | | | |
Forfeited | | (222 | ) | | (1,732 | ) | | (1,127 | ) | | (5,047 | ) | | (83 | ) | | — | | | 106.80 | | | |
Expired | | (90 | ) | | — | | | — | | | (50 | ) | | — | | | — | | | 91.58 | | | |
| | | | | | | | | | | | | | | | | | | | | | | |
Balance Outstanding, December 31, 2004 | | 6,090 | | | 6,659 | | | 4,509 | | | 24,945 | | | 8,690 | | | 567 | | $ | 96.80 | | | |
| | | | | | | | | | | | | | | | | | | | | | | |
Exercisable, end of year | | 2,332 | | | — | | | — | | | 1,199 | | | — | | | 567 | | $ | 130.28 | | | |
Granted | | 2,350 | | | — | | | — | | | 11,568 | | | 2,350 | | | — | | | 195.75 | | $ | 38.50 |
Exercised | | — | | | (835 | ) | | — | | | — | | | — | | | — | | | 0.01 | | | |
Forfeited | | (83 | ) | | (21 | ) | | — | | | (146 | ) | | (83 | ) | | — | | | 115.11 | | | |
Expired | | — | | | — | | | — | | | — | | | — | | | — | | | — | | | |
| | | | | | | | | | | | | | | | | | | | | | | |
Balance Outstanding, December 31, 2005 | | 8,357 | | | 5,803 | | | 4,509 | | | 36,367 | | | 10,957 | | | 567 | | $ | 122.07 | | | |
| | | | | | | | | | | | | | | | | | | | | | | |
Exercisable, end of year | | 2,911 | | | — | | | — | | | 3,643 | | | — | | | 567 | | $ | 128.29 | | | |
Outstanding options under the Unit Option Plan at December 31, 2005, are summarized as follows:
| | | | | | | | | | | | |
| Price Range | | Options
Outstanding | | Weighted Average
Exercise Price
Options Outstanding | | Options Exercisable | | Weighted Average
Exercise Price
Options Exercisable | | Weighted Average
Remaining
Contractual Life
(Years) |
| $ 0.01 | | 10,312 | | $ | 0.01 | | — | | | — | | 3.08 |
| $122.86 - $123.33 | | 39,413 | | | 122.88 | | 6,401 | | $ | 122.88 | | 5.54 |
| $176.32 - $176.41 | | 7,617 | | | 176.33 | | 720 | | | 176.39 | | 8.07 |
| $210.30 | | 9,218 | | | 210.30 | | — | | | — | | 7.92 |
| | | | | | | | | | | | |
| $0.01 - $210.30 | | 66,560 | | $ | 122.07 | | 7,121 | | $ | 128.29 | | 5.89 |
| | | | | | | | | | | | |
On October 19, 2004, the Company’s direct parent ASG Consolidated and its subsidiary ASG Finance, Inc. completed its offering of Senior Discount Notes. The distribution of the offering proceeds from these notes to the Company’s ultimate equity holders accelerated the vesting of certain outstanding options held by Company employees under the ASLP Year 2000 Unit Option Plan. Specifically, all outstanding Series A awards, 50% of
90
AMERICAN SEAFOODS GROUP LLC AND SUBSIDIARIES
NOTES TO CONSOLIDATED FINANCIAL STATEMENTS—(Continued)
the Series C and D awards and approximately 14.6% of the Series E awards vested and were exercised immediately prior to the distribution. No Series F awards vested. The acceleration of the options resulted in the recognition of compensation costs. In addition, in order to compensate for the reduction in value caused by the distribution, the exercise price of the remaining outstanding Series E and F options were reduced to an amount equal to the greater of (i) the exercise price related to each option reduced by $96.38 or (ii) the fair market value of the underlying units after the distribution, and a cash payment was made by ASLP to holders of the remaining outstanding unvested Series C and D options in the amount of $96.38 per remaining outstanding unvested unit. In addition, holders of unvested Series E and F options who are still employees of ASLP or its subsidiaries at the time of exercise will receive a tax gross-up payment to cover their tax liability in connection with the exercise of their options, which payment will not exceed $50.00 per unit. The modification to the terms of the unvested Series C, D, E and F options resulted in additional compensation cost in 2004 and will result in future compensation costs in excess of amounts that would have been recorded absent the modification. Compensation cost, if any, for the unvested Series C, D, E and F options is recognized to the extent their respective vesting targets are probable.
Option holders were also offered an alternative to the accelerated vesting of their options as outlined above. Those option holders that elected this alternative received pro-rata vesting of their Series A options based on their service period through October 20, 2004, received vesting on all other options to the extent that they would have received vesting under an acceleration event and received a reduction in the exercise price on all options that had an exercise price in excess of the fair market value of the units after the distribution from the offering such that the related exercise price was an amount equal to the greater of (i) the exercise price related to each option reduced by $96.38 or (ii) the fair market value of the underlying units after the distribution. In addition, holders of unvested Series E and F options who are still employees of ASLP or its subsidiaries at the time of exercise will receive a payment to cover their tax liability in connection with the exercise of their options, which will not exceed $50.00 per unit. As all of these modifications were considered to be effective after the completion of the distribution to the Company’s ultimate equity holders, the option holders that chose this alternative did not participate in any of the distribution of proceeds from the offering. All option holders were presented with these two alternatives on October 20, 2004 and chose between these two alternatives by November 26, 2004.
Beginning in the fourth quarter of 2004, the vesting of C and D options was considered to be probable as certain partners of ASLP had achieved its targeted rate of return on their investment. During the fourth quarter of 2005, the Company determined that vesting of the F options was probable, primarily as a result to the acquisition of the ASLP partnership interest as described in note 20. In accordance with APB 25, the Company began expensing these options when they became probable.
The Company has recognized compensation expense of approximately $4.7 million, $2.9 million and $3.5 million for the years ended December 31, 2003, 2004 and 2005, respectively. Prior to the fourth quarter of 2004, equity-based compensation was recorded as a related party payable. In late 2004, ASLP contributed its receivable in the amount of $20.0 million to the Company and agreed that no amounts will be due in the future relating to existing options.
91
AMERICAN SEAFOODS GROUP LLC AND SUBSIDIARIES
NOTES TO CONSOLIDATED FINANCIAL STATEMENTS—(Continued)
Note 16. Accumulated Other Comprehensive Income (Loss)
Comprehensive income (loss) includes net income (loss) as well as a component comprised of gains and losses that under generally accepted accounting principles are reflected as accumulated other comprehensive income (loss) in member’s equity (deficit), but are excluded from the determination of net income (loss). The Company has segregated the total accumulated other comprehensive income (loss) from the other components of member’s equity (deficit) in the accompanying condensed balance sheets. The components of accumulated other comprehensive income (loss) at December 31, 2004 and 2005 are as follows (in thousands):
| | | | | | | | |
| | | 2004 | | | 2005 | |
Unrealized gains (losses) on derivative instruments designated as hedges | | $ | (46,034 | ) | | $ | 12,858 | |
Translation adjustment | | | (16 | ) | | | (77 | ) |
| | | | | | | | |
Total accumulated other comprehensive income (loss) | | $ | (46,050 | ) | | $ | 12,781 | |
| | | | | | | | |
Note 17. Quarterly Information (Unaudited)
The following tables set forth selected quarterly consolidated financial data for the Company for the years ended December 31, 2004 and 2005 (in thousands).
| | | | | | | | | | | | | | | | | | | | | | | | | | | | |
| | | 2004 | | | 2005 | |
| | | Q1 | | Q2 | | | Q3 | | | Q4 | | | Q1 | | Q2 | | Q3 | | Q4 | |
Revenues | | $ | 134,893 | | $ | 127,296 | | | $ | 92,986 | | | $ | 106,492 | | | $ | 152,964 | | $ | 123,989 | | $ | 100,403 | | $ | 136,646 | |
Gross profit | | | 42,006 | | | 24,336 | | | | 18,816 | | | | 3,758 | | | | 50,592 | | | 19,125 | | | 21,401 | | | 11,518 | |
Goodwill impairment | | | — | | | — | | | | 7,171 | | | | — | | | | — | | | — | | | — | | | — | |
Operating income (loss) | | | 29,542 | | | 16,974 | | | | 7,614 | | | | (11,455 | ) | | | 37,551 | | | 9,637 | | | 11,644 | | | (3,172 | ) |
Derivative gains (losses), net | | | 1,782 | | | (3,870 | ) | | | 4,688 | | | | (15,514 | ) | | | 7,030 | | | 15,332 | | | 9,439 | | | 5,083 | |
Write off of recapitalization transaction and deferred financing costs | | | — | | | — | | | | 18,948 | | | | 316 | | | | — | | | — | | | — | | | 10,903 | |
Net income (loss) | | | 21,345 | | | 3,635 | | | | (16,189 | ) | | | (37,428 | ) | | | 33,512 | | | 14,469 | | | 10,027 | | | (20,143 | ) |
Revenues, operating income (loss) and net income (loss) have been revised to reflect the inclusion of ASE, as described in Note 1. The net effect of these revisions is not material to the financial statements.
Note 18. Segment and Geographical Information
The Company is principally engaged in the harvesting, processing, marketing, selling and distribution of fish products. At December 31, 2005, the Company’s reportable segments are:
| | • | | At-Sea Processing—primarily comprised of the harvesting and processing of pollock, Pacific whiting, yellowfin sole and Pacific cod aboard the Company’s vessels operating in the Bering Sea; and |
| | • | | Land-Based Processing—primarily comprised of the processing of catfish and scallops and secondary processing of pollock in the Company’s processing plants in Alabama and Massachusetts. |
Segment operating results and balances are determined on a basis consistent with the accounting policies used in the consolidated financial statements. Corporate costs are allocated to each segment based on total assets.
92
AMERICAN SEAFOODS GROUP LLC AND SUBSIDIARIES
NOTES TO CONSOLIDATED FINANCIAL STATEMENTS—(Continued)
Segment information as of and for the year ended December 31, 2005 is as follows (in thousands):
| | | | | | | | | | | | | | | | | |
| | | At-Sea
Processing | | Land-Based
Processing | | | Segment
Totals | | Adjustments | | | Consolidated
Totals |
Revenues: | | | | | | | | | | | | | | | | | |
External customers | | $ | 307,082 | | $ | 206,920 | | | $ | 514,002 | | $ | — | | | $ | 514,002 |
Intersegment | | | 21,534 | | | — | | | | 21,534 | | | (21,534 | ) | | | — |
| | | | | | | | | | | | | | | | | |
Total revenues | | | 328,616 | | | 206,920 | | | | 535,536 | | | (21,534 | ) | | | 514,002 |
| | | | | | | | | | | | | | | | | |
Gross profit: | | | | | | | | | | | | | | | | | |
External customers | | | 89,392 | | | 13,244 | | | | 102,636 | | | — | | | | 102,636 |
Intersegment | | | 11,251 | | | — | | | | 11,251 | | | (11,251 | ) | | | — |
| | | | | | | | | | | | | | | | | |
Total gross profit | | | 100,643 | | | 13,244 | | | | 113,887 | | | (11,251 | ) | | | 102,636 |
| | | | | | | | | | | | | | | | | |
Net income (loss) | | | 46,064 | | | (8,605 | ) | | | 37,459 | | | 406 | | | | 37,865 |
Depreciation and amortization expense | | | 41,298 | | | 6,564 | | | | 47,862 | | | — | | | | 47,862 |
Interest expense | | | 37,812 | | | 3,979 | | | | 41,791 | | | — | | | | 41,791 |
Write off deferred financing costs | | | 9,864 | | | 1,039 | | | | 10,903 | | | — | | | | 10,903 |
Purchases of property, vessels and equipment | | | 11,436 | | | 2,928 | | | | 14,364 | | | — | | | | 14,364 |
Capital projects in process | | | 1,819 | | | 184 | | | | 2,003 | | | — | | | | 2,003 |
Goodwill | | | 33,031 | | | 490 | | | | 33,521 | | | — | | | | 33,521 |
Total assets | | | 393,930 | | | 72,784 | | | | 466,714 | | | — | | | | 466,714 |
Segment information as of and for the year ended December 31, 2004 is as follows (in thousands):
| | | | | | | | | | | | | | | | | | | | |
| | | At-Sea
Processing | | | Land-Based
Processing | | | Segment
Totals | | | Adjustments | | | Consolidated
Totals | |
Revenues: | | | | | | | | | | | | | | | | | | | | |
External customers | | $ | 265,526 | | | $ | 196,141 | | | $ | 461,667 | | | $ | — | | | $ | 461,667 | |
Intersegment | | | 23,614 | | | | — | | | | 23,614 | | | | (23,614 | ) | | | — | |
| | | | | | | | | | | | | | | | | | | | |
Total revenues | | | 289,140 | | | | 196,141 | | | | 485,281 | | | | (23,614 | ) | | | 461,667 | |
| | | | | | | | | | | | | | | | | | | | |
Gross profit: | | | | | | | | | | | | | | | | | | | | |
External customers | | | 75,162 | | | | 13,754 | | | | 88,916 | | | | — | | | | 88,916 | |
Intersegment | | | 11,084 | | | | — | | | | 11,084 | | | | (11,084 | ) | | | — | |
| | | | | | | | | | | | | | | | | | | | |
Total gross profit | | | 86,246 | | | | 13,754 | | | | 100,000 | | | | (11,084 | ) | | | 88,916 | |
| | | | | | | | | | | | | | | | | | | | |
Net loss | | | (10,027 | ) | | | (19,148 | ) | | | (29,175 | ) | | | 538 | | | | (28,637 | ) |
Depreciation and amortization expense | | | 39,769 | | | | 6,303 | | | | 46,072 | | | | — | | | | 46,072 | |
Goodwill impairment | | | — | | | | 7,171 | | | | 7,171 | | | | — | | | | 7,171 | |
Interest expense | | | 35,095 | | | | 4,207 | | | | 39,302 | | | | — | | | | 39,302 | |
Write off recapitalization transaction costs | | | 17,191 | | | | 2,073 | | | | 19,264 | | | | — | | | | 19,264 | |
Purchases of property, vessels and equipment | | | 10,269 | | | | 2,685 | | | | 12,954 | | | | — | | | | 12,954 | |
Capital projects in process | | | 1,835 | | | | — | | | | 1,835 | | | | — | | | | 1,835 | |
Goodwill | | | 33,031 | | | | 490 | | | | 33,521 | | | | — | | | | 33,521 | |
Total assets | | | 381,189 | | | | 78,229 | | | | 459,418 | | | | — | | | | 459,418 | |
93
AMERICAN SEAFOODS GROUP LLC AND SUBSIDIARIES
NOTES TO CONSOLIDATED FINANCIAL STATEMENTS—(Continued)
Segment information as of and for the year ended December 31, 2003 is as follows (in thousands):
| | | | | | | | | | | | | | | | | |
| | | At-Sea
Processing | | Land-Based
Processing | | | Segment
Totals | | Adjustments | | | Consolidated
Totals |
Revenues: | | | | | | | | | | | | | | | | | |
External customers | | $ | 229,823 | | $ | 181,540 | | | $ | 411,363 | | $ | — | | | $ | 411,363 |
Intersegment | | | 24,242 | | | — | | | | 24,242 | | | (24,242 | ) | | | — |
| | | | | | | | | | | | | | | | | |
Total revenues | | | 254,065 | | | 181,540 | | | | 435,605 | | | (24,242 | ) | | | 411,363 |
| | | | | | | | | | | | | | | | | |
Gross profit: | | | | | | | | | | | | | | | | | |
External customers | | | 79,011 | | | 23,106 | | | | 102,117 | | | — | | | | 102,117 |
Intersegment | | | 11,826 | | | — | | | | 11,826 | | | (11,826 | ) | | | — |
| | | | | | | | | | | | | | | | | |
Total gross profit | | | 90,837 | | | 23,106 | | | | 113,943 | | | (11,826 | ) | | | 102,117 |
| | | | | | | | | | | | | | | | | |
Net income (loss) | | | 19,110 | | | (5,499 | ) | | | 13,611 | | | 903 | | | | 14,514 |
Depreciation and amortization expense | | | 36,546 | | | 5,678 | | | | 42,224 | | | — | | | | 42,224 |
Interest expense | | | 35,206 | | | 5,367 | | | | 40,573 | | | — | | | | 40,573 |
Purchases of property, vessels and equipment | | | 6,950 | | | 5,365 | | | | 12,315 | | | — | | | | 12,315 |
Capital projects in process | | | 436 | | | — | | | | 436 | | | — | | | | 436 |
Goodwill | | | 33,186 | | | 7,661 | | | | 40,847 | | | — | | | | 40,847 |
Total assets | | | 433,375 | | | 86,615 | | | | 519,990 | | | — | | | | 519,990 |
All significant non-cash charges to income, including unrealized gains (losses) on derivatives, and interest accrued to related parties, are attributable to the at-sea processing segment for all years presented. Interest expense and loss from debt repayment and related write-offs are allocated based on the assets of operating entities comprising each segment. Intersegment revenues are based on market prices of products sold.
The Company attributes its revenues to customers in different geographical areas on the basis of the location of the customer. Export sales from the United States consist principally of processed pollock roe and surimi to Japan and frozen whitefish to Europe. Substantially all long-lived assets are located in the United States and substantially all North America sales are to customers in the United States.
Seafood sales to U.S. and foreign customers, for the years ended December 31, were (in millions):
| | | | | | | | | |
| | | 2003 | | 2004 | | 2005 |
U.S. Customers | | $ | 205.9 | | $ | 210.2 | | $ | 232.7 |
Foreign Customers | | | 203.1 | | | 250.4 | | | 280.2 |
| | | | | | | | | |
| | $ | 409.0 | | $ | 460.6 | | $ | 512.9 |
| | | | | | | | | |
Seafood sales by geographic region for the years ended December 31, were (in millions):
| | | | | | | | | |
| | | 2003 | | 2004 | | 2005 |
North America | | $ | 207.3 | | $ | 214.3 | | $ | 236.6 |
Japan | | | 102.0 | | | 124.2 | | | 137.4 |
Europe | | | 58.5 | | | 73.7 | | | 88.6 |
Other Asia | | | 41.2 | | | 48.4 | | | 50.3 |
| | | | | | | | | |
| | $ | 409.0 | | $ | 460.6 | | $ | 512.9 |
| | | | | | | | | |
94
AMERICAN SEAFOODS GROUP LLC AND SUBSIDIARIES
NOTES TO CONSOLIDATED FINANCIAL STATEMENTS—(Continued)
Note 19. Valuation and Qualifying Accounts
Information relating to valuation and qualifying accounts is as follows for 2003, 2004 and 2005 (in thousands):
| | | | | | | | | | | | | |
| | | Balance at Beginning
of Period | | Charged to
Expense or
Revenue | | Deductions
and
Adjustments(1) | | | Balance
at End
of Period |
Year ended December 31, 2003: | | | | | | | | | | | | | |
Allowances for trade accounts receivable | | $ | 452 | | $ | 345 | | $ | (106 | ) | | $ | 691 |
Allowance for receivable from insurance provider | | | 1,829 | | | 161 | | | — | | | | 1,990 |
Allowance for other accounts receivables | | | — | | | 212 | | | — | | | | 212 |
Year ended December 31, 2004: | | | | | | | | | | | | | |
Allowances for trade accounts receivable | | $ | 691 | | $ | 435 | | $ | (602 | ) | | $ | 524 |
Allowance for promotions | | | — | | | 936 | | | — | | | | 936 |
Allowance for receivable from insurance provider | | | 1,990 | | | — | | | 565 | | | | 2,555 |
Allowance for other accounts receivables | | | 212 | | | — | | | — | | | | 212 |
Year ended December 31, 2005: | | | | | | | | | | | | | |
Allowances for trade accounts receivable | | $ | 524 | | $ | 1,100 | | $ | (1,025 | ) | | $ | 599 |
Allowance for promotions | | | 936 | | | 1,353 | | | (936 | ) | | | 1,353 |
Allowance for receivable from insurance provider | | | 2,555 | | | 850 | | | — | | | | 3,405 |
Allowance for other accounts receivables | | | 212 | | | 47 | | | — | | | | 259 |
| (1) | Deductions for accounts receivable represent accounts written off, net of recoveries. Adjustments for the receivable from an insurance provider represent a 100% allowance established for additional gross receivables resulting from reconciliation with the insurance provider liquidator. |
The Company had valuation accounts recorded on the balance sheet at December 31, 2005 as follows:
| | • | | Allowances for trade accounts receivable reflect management’s estimate of potential losses inherent in the accounts receivable balance. Management determines the allowance based on known troubled accounts, historical experience, and other currently available evidence. The Company’s policy is to write-off accounts as collectibility becomes remote. |
| | • | | The Company has outstanding claims receivable totaling $4.6 million from an Australian insurance carrier and its U.S. subsidiary (collectively referred herein as the “Carrier”) that filed bankruptcy in 2001. The Carrier provided employee personal injury coverage for the Company during the years 1996 to 1999. The amount of the receivable has increased as claims were presented to the Carrier for reimbursement under its policies. In February 2006, an Australian bankruptcy court issued a Scheme of Arrangement (Scheme) related to its claims, which provides creditors in the United States the ability to recover amounts from a trust fund established by the New York Superintendent of Insurance with the remainder of their claim being recovered from assets of the Carrier or other assets of the bankruptcy estate. Creditors will vote whether to accept the Scheme on March 29, 2006. Based on information available, management has estimated that the Company will recover between 15% and 25% of its outstanding receivable, with no amount within the range being a better estimate than any other amount. In accordance with SFAS No. 5,Accounting for Contingencies, and related interpretations, the Company has recorded an allowance assuming it will realize 25% of its outstanding receivable. This resulted in an additional provision for uncollectible accounts of approximately $0.9 million during 2005. The ultimate amount to be realized is dependent on a number of factors including both creditor and bankruptcy courts’ acceptance of the Scheme and the ultimate amount of cash available to be distributed by the bankruptcy estate. If the Scheme is approved, the Company expects it will receive payments over an undetermined period beginning with an estimated 5% of the recovery during 2006. As of |
95
AMERICAN SEAFOODS GROUP LLC AND SUBSIDIARIES
NOTES TO CONSOLIDATED FINANCIAL STATEMENTS—(Continued)
| | December 31, 2004 and 2005, the net receivable of approximately $2.0 million and $1.1 million, respectively, is classified as other non current assets. |
Note 20. Significant, Unusual, and Infrequent Activities Occurring in the Fourth Quarter
In the fourth quarter of 2005, the Company refinanced its credit facility, wrote off deferred financing costs in conjunction with this refinance, received the contribution of the entity ASE from its parent company and completed the acquisition of the vesselForum Star. These items are discussed in greater detail elsewhere in the notes to these consolidated financial statements.
Note 21. Subsequent Events
Formation of New Entity. Effective January 1, 2006, American Pride Seafoods LLC was formed and all of the outstanding equity interests of American Seafoods International LLC and Southern Pride Catfish LLC were contributed to the new entity. American Pride Seafoods LLC has no significant assets or operations other than the ownership of ASI and SPC.
Collective Bargaining Agreement. On January 15, 2006, the Company entered into a new five-year collective bargaining agreement with employees at the Demopolis, Alabama plant represented by a union. These employees represent approximately 6% of our total employees, including seasonal employees.
Acquisition of Partnership Interests. On February 27, 2006, ASLP Acquisition LLC, a new company controlled by Bernt O. Bodal, our Chairman and Chief Executive Officer, and Coastal Villages Pollock LLC (CVP), one of ASLP’s existing equity holders, and other entities controlled by Mr. Bodal or CVP, purchased from Centre Partners and its affiliated funds (Centre), all of Centre’s direct and indirect ownership of partnership interests in ASLP. The aggregate purchase price for Centre’s partnership interests was $81.8 million. ASLP Acquisition LLC and CVP also purchased partnership interests from ASLP partners who had rights to “tag-along” with Centre’s sale. The aggregate purchase price paid to these partners was $34.9 million. ASLP Acquisition LLC owns 20.1% of ASLP.
Redemption Of Senior Subordinated Notes. On March 27, 2006, ASG delivered notice to holders of its Senior Subordinated Notes that it will redeem its Senior Subordinated Notes on April 27, 2006.
96
Item 9. Changes in and Disagreements with Accountants on Accounting and Financial Disclosure
Not applicable.
Item 9A. Controls and Procedures
Disclosure Controls and Procedures
We maintain disclosure controls and procedures that are designed to ensure that information required to be disclosed in the reports we file or submit under the Securities Exchange Act of 1934 (the “Exchange Act”) is recorded, processed, summarized, and reported within the time periods specified in the SEC’s rules and forms, and that such information is accumulated and communicated to our management, including our Chief Executive Officer and Chief Financial Officer, as appropriate, to allow timely decisions regarding required disclosure.
As of the end of the period covered by this report, we evaluated, under the supervision and with the participation of our Disclosure Practices Committee and management, including our Chief Executive Officer and Chief Financial Officer, the effectiveness of the design and operation of our disclosure controls and procedures pursuant to Exchange Act Rule 13a-15. In the evaluation, we considered the material weaknesses disclosed below and the resulting audit adjustments made. Because we did not earlier identify and correct these items, our Chief Executive Officer and Chief Financial Officer concluded that our disclosure controls and procedures were not effective as of December 31, 2005.
Internal Control over Financial Reporting
Our management is responsible for establishing and maintaining adequate internal control over financial reporting. Internal controls over financial reporting are processes designed to provide reasonable assurance regarding the reliability of financial reporting and the preparation of financial statements for external purposes in accordance with U.S. Generally Accepted Accounting Principles.
By SEC Release No. 33-8618 dated September 22, 2005, the SEC extended to the end of the first fiscal year ending on or after July 15, 2007 the date on which each “non-accelerated filer” (defined in Rule 12b-2 of the Securities Exchange Act of 1934) must include in its annual report on Form 10-K a management report on its internal control over financial reporting, as well as an evaluation of any changes that occurred during the year that materially affected or are likely to materially affect such control.
As a “non-accelerated filer”, we are not required to include a report on internal control over financial reporting in our annual report on Form 10-K for the year ended December 31, 2005. Nevertheless, we have engaged the firm of Moss Adams LLP to assist us in evaluating our internal control environment and to recommend changes to our current internal controls so that we may comply with the reporting requirements when they may apply to us.
During the course of the annual audit of our consolidated financial statements we, along with our auditors, identified certain internal control deficiencies that are material weaknesses. A material weakness is a control deficiency, or a combination of control deficiencies, that results in more than a remote likelihood that a material misstatement of the financial statements will not be prevented or detected.
The control deficiencies culminating in material weaknesses related to certain of our financial reporting processes including our internal reporting of significant contracts and agreements, accounting for derivatives and our ability to file our financial reports in a timely manner. A contributing factor was that many of our accounting processes are largely driven by manual and worksheet centric calculations that do not have an appropriate level of review to compensate for the degree of complexity and manual input involved.
97
As we strive towards more effective internal control over financial reporting, we will, among other things, continue taking the following actions to cure the control deficiencies that resulted in the material weaknesses noted above.
| | • | | We have engaged Moss Adams LLP to assist us with documenting processes, performing testing and reviewing our internal control over financial reporting in connection with our assessment under Section 404 of the Sarbanes-Oxley Act of 2002; |
| | • | | We continue to evaluate and implement improvements to our accounting and management information systems; |
| | • | | We will develop and implement a remediation plan to address the deficiencies identified in our internal control over financial reporting, including the material weaknesses. |
There were no significant changes in our internal control over financial reporting during the fourth quarter of 2005 that have materially affected, or are reasonably likely to materially affect, our internal control over financial reporting.
Item 9B. Other Information
None.
98
PART III
Item 10.Directors and Executive Officers of the Registrant
The following table identifies as of March 7, 2006 our executive officers and key employees, as well as the members of the board of directors of ASC Management, Inc. As a limited liability company, we do not have a board of directors; nor does any of our immediate parent ASG Consolidated, LLC, its parent American Seafoods Consolidated LLC, our ultimate parent American Seafoods Holdings, LLC, and its parent American Seafoods, L.P. We therefore disclose the identity of the directors of ASC Management, Inc., the managing general partner of American Seafoods, L.P. and our executive officers.
| | | | |
Name | | Age | | Position |
Bernt O. Bodal | | 52 | | Chairman and Chief Executive Officer, Director of ASC Management, Inc. |
Brad Bodenman | | 42 | | Chief Financial Officer and Treasurer |
Amy Humphreys | | 39 | | Vice President of Finance and Corporate Development |
Matthew D. Latimer | | 38 | | Chief Legal Officer and General Counsel |
Inge Andreassen | | 42 | | President, American Seafoods Company LLC |
John Cummings | | 50 | | President, American Pride Seafoods LLC |
William Bittner | | 60 | | Director of ASC Management, Inc. |
Morgen Crow | | 42 | | Director of ASC Management, Inc. |
Jeffrey Davis | | 56 | | Director of ASC Management, Inc. |
Elliott H. Jurgensen, Jr. | | 61 | | Director of ASC Management, Inc. |
Scott Perekslis | | 38 | | Director of ASC Management, Inc. |
Robert Williams | | 39 | | Director of ASC Management, Inc. |
Bernt O. Bodal. Mr. Bodal has been the Chairman and Chief Executive Officer of ASG since 2000. Since January 2000, he has been the President of ASC Management, Inc., the general partner of ASLP and a director of ASC Management, Inc. From 1994 to 1998, Mr. Bodal served as President and Chief Executive Officer of American Seafoods Company and RGI Seafoods, a subsidiary of Norway Seafoods. Between 1998 and 2000, Mr. Bodal pursued personal investment activities.
Brad Bodenman. Mr. Bodenman has been the Chief Financial Officer of ASG since May 2002 and Treasurer since March 2002. From April 2000 to December 2001, Mr. Bodenman was the Chief Financial Officer and Treasurer of Essential Markets, Inc., a developer of proprietary software, and from 1997 to 2000, Mr. Bodenman was the Chief Financial Officer and Treasurer of Muzak, LLC., a business music provider.
Amy Humphreys. Ms. Humphreys has been the Vice President of Finance and Corporate Development of ASG since May 2003. She was the Director of Finance and Corporate Development of ASG from 2000 to 2003. Ms. Humphreys was the Business Development Manager of American Seafoods Company from 1996 to 2000.
Matthew D. Latimer. Mr. Latimer has been the Chief Legal Officer and General Counsel of ASG since August 2004. Mr. Latimer was Of Counsel with the law firm of Davis Wright Tremaine LLP from January of 2003 until August 2004. Prior to January 2003, Mr. Latimer was an associate at the law firm of Cooley Godward LLP from October 1999 to December 2002. From February 1999 to October 1999, Mr. Latimer was an associate at the law firm of Dorsey and Whitney LLP. From September 1995 to February 1999, Mr. Latimer was an associate at the law firm of Bogle & Gates PLLC.
Inge Andreassen. Mr. Andreassen has been President of American Seafoods Company LLC since April 2005. Mr. Andreassen served as the Vice President of Operations of American Seafoods Company LLC from 2000 to 2005. From 1996 to 2000, Mr. Andreassen was the Vice President of Operations of American Seafoods Company.
John Cummings. Mr. Cummings has been the President of American Seafoods International LLC since April 2002, President of Southern Pride Catfish LLC since December 2003 and President of American Pride
99
Seafoods since January 2006. From 2000 to 2002, Mr. Cummings was President of Gofish.com, a privately held service firm with online seafood trading, and from 1993 to 2000, Mr. Cummings was President of Fishery Products International, Inc., a subsidiary of FPI Ltd., a supplier of fresh and frozen seafood products.
William Bittner. Mr. Bittner practices law in Alaska at Birch, Horton, Bittner and Cherot, where he has been a senior attorney since 1973. Mr. Bittner has been a shareholder in Birch, Horton, Bittner since 1973 and has served on its board of directors since 1976.
Morgen Crow. Mr. Crow has served as a director of ASC Management, Inc. since 2000. Mr. Crow has been the Executive Director of Coastal Villages Region Fund since 1999. Mr. Crow is a member of the board of directors of the Marine Conservation Alliance and the Pollock Conservation Cooperative.
Jeffrey Davis. Mr. Davis has served as a director of ASC Management, Inc. since February 2005. Mr. Davis was the Chief Operating Officer of ASG and the Chief Executive Officer of American Seafoods International LLC from January 2000 to December 2004. Mr. Davis was the President and Chief Executive Officer of Baader North America Corporation, a wholly-owned U.S. subsidiary of Baader Beteiligungs GmbH, a manufacturer of fish and poultry processing machines, from 1980 to December 1999.
Elliott H. Jurgensen, Jr. Mr. Jurgensen was an audit partner at KPMG LLP from 1979 to 2003. Mr. Jurgensen pursued personal business ventures after his retirement from KPMG in 2003. Mr. Jurgensen has been a director of BSQUARE Corporation since 2003 where he serves on the audit committee as the audit committee financial expert and the chair of the compensation committee. In addition, Mr. Jurgensen has been a director of McCormick & Schmick’s Seafood Restaurants, Inc. since 2004 where he serves as the chair of the audit committee and as its audit committee financial expert.
Scott Perekslis. Mr. Perekslis has been a director of ASC Management, Inc. since 2000. Mr. Perekslis has been a Managing Director of Centre Partners Management LLC since 2001. He has served in various capacities for Centre Partners and its affiliates since 1991. Mr. Perekslis is the Chairman of Hyco International, Inc. and is a member of the board of directors of Gray Energy Services LLC, Maverick Media LLC, Firearms Training Systems, Inc. and the Board of Trustees of Connors Brothers Income Fund. Mr. Perekslis serves on the compensation committees of Hyco International, Inc. and Firearms Training Systems, Inc. and serves on the audit committee and as the chair of the compensation committee of Connors Brothers Income Fund.
Robert Williams. Mr. Williams has served as a director of ASC Management, Inc. since 2005. Mr. Williams has served as the Deputy Director/Chief of Operations of Coastal Villages Region Fund since July 2005. From January 2002 to July 2005, Mr. Williams was Director of Business Development/Quota Manager for Coastal Villages Region Fund. Prior to that, Mr. Williams was a senior auditor and audit manager at a large Alaskan audit firm. He currently serves as a board member for the Toghotthele Corporation that is based in Nenana, Alaska and has been a Certified Public Accountant since 1998.
We have insurance that indemnifies our directors and officers against certain liabilities.
100
Board of Directors and other Governance Matters
We are a limited liability company. In our case, the ultimate function of a board of directors is fulfilled by the board of directors of ASC Management, Inc., which is the managing general partner of ASLP, our ultimate parent. The composition of ASC Management’s board of directors and other governance matters is determined in accordance with the provisions of the Second Amended and Restated Securityholders Agreement of ASLP (Securityholders Agreement.) Pursuant to the terms of the Securityholders Agreement, the board of directors consists of seven members. The unitholders entitled to appoint board members, the number of the board members they are entitled to appoint and the name of the current board members appointed by such unitholders are:
| | | | |
Unit Holder | | # Board Members | | Current Appointee |
Bernt O. Bodal | | One member | | Bernt O. Bodal |
| | |
| Management Securityholders (including Bodal) | | One member | | Jeffrey Davis |
| | |
ASLP Acquisition LLC(1) | | Two members | | Elliott Jurgensen and William Bittner |
| | |
Coastal Villages Pollock LLC | | Three members | | Morgen Crow, Robert Williams, Scott Perekslis |
| (1) | ASLP Acquisition LLC is a Delaware limited liability company controlled by Bernt O. Bodal. |
The two Board members appointed by ASLP Acquisition and one of the Board members appointed by Coastal Villages must be “independent” as described in Section 303A.02 of the NYSE Listed Companies Manual and are removable only for cause.
The Board members have been placed into three classes with terms of three years. The initial terms for each director will expire as follows:
| | |
Name of Director | | Expiry of Initial Term |
Bernt Bodal, Elliott H. Jurgensen, Jr. | | 2007 |
Robert Williams, Scott Perekslis | | 2008 |
Morgen Crow, William Bittner, Jeffrey Davis | | 2009 |
The Securityholders Agreement also provides that the following corporate actions may be taken only with the consent of the holders of more than two-thirds of the securities (including options) of ASLP: (i) The adoption of any plan or program providing for the issuance or grant of any securities of ASLP or any of its subsidiaries to a senior officer of ASLP or any subsidiary (including us), or the adoption of any other executive or incentive compensation plan or program in which any such person is eligible to participate; (ii) the issuance of any securities of ASLP to a person who is a senior officer of ASLP or any subsidiary (including us), or the material modification of the terms of any prior issuance of such securities, other than pursuant to a plan adopted under clause (i) above; (iii) the making or material modification of any loan or other extension of credit by ASLP or any subsidiary (including us) to a senior officer in excess of $100,000; and (iv) the filing of a registration statement with the SEC for a public equity offering.
The Securityholders Agreement also provides that upon the sale of more than 10% of the outstanding partnership interests of ASLP by either Bodal, ASLP Acquisition or Coastal Villages, other partners may “tag-along” in the sale, and provides ASLP with a right of first offer on any sales by partners. To the extent ASLP declines to exercise this right of first offer in full, Coastal Villages may exercise a right of first offer to acquire such partnership interests.
Additionally, the Securityholders Agreement provides rights of first offer to, first, ASLP and then Coastal Villages in the event certain transfers of partnership interests are proposed by the partners or, in some cases, members of ASLP Acquisition. In addition, Coastal Villages has a right of first offer in the event that ASLP proposes to dispose of all or substantially all of ASLP’s assets.
101
Board Committees
The Board of Directors has established three committees: The Audit Committee, the Compensation Committee and the Finance Committee. The composition of these committees is determined in accordance with the Securityholders Agreement.
Audit Committee. The audit committee must consist of at least three members, one of whom must be a director appointed by Coastal Villages and the other two of whom must be independent directors selected by a majority of all of the independent directors. The audit committee is currently comprised of Messrs. Jurgensen (Chair), Bittner and Williams. Each of Mr. Jurgensen and Mr. Bittner meets the independence criteria prescribed by applicable law and the rules of the SEC for audit committee membership. Mr. Jurgensen has been determined by the Board of Directors to be an “audit committee financial expert” under SEC rules. The audit committee has the following responsibilities:
| | • | | recommending the engagement of independent accountants to audit our financial statements; |
| | • | | discussing the scope and results of the audit with our independent accountants; |
| | • | | reviewing the functions of our management and our independent accountants pertaining to our statements; and |
| | • | | performing such other related duties and functions as are deemed appropriate by the audit committee and the board of directors. |
Compensation Committee. The compensation committee must consist of at least two members, one of whom must be a director appointed by Coastal Villages and one of whom must be an independent director appointed by a majority of the independent directors. The compensation committee is currently comprised of Messrs. Perekslis (Chair), Crow and Bodal (ex-officio member). The compensation committee has the following responsibilities:
| | • | | assisting the Board in fulfilling its responsibilities relating to the design, administration and oversight of employee compensation programs and benefit plans; |
| | • | | discharging the Board’s duties relating to compensation of our directors and executive officers; and |
| | • | | reviewing the performance of our Chief Executive Officer. |
Finance Committee.The finance committee must consist of at least three members, one of whom must be a director appointed by Coastal Villages, one of whom must be a director appointed by either Bodal or ASLP Acquisition, and one of whom must be an independent director appointed by a majority of the independent directors. The Finance committee currently consists of Messrs. Bodal (Chair), Williams and Perekslis. The finance committee has the following responsibilities:
| | • | | Receive notification from the General Partner prior to making any capital expenditures, acquisitions or dispositions of ASLP assets in excess of $1,000,000. |
| | • | | Receive notification and be actively engaged by the General Partner as soon as practicable after ASLP begins to actively pursue plans to make any material capital expenditure, acquisition or disposition, or a series or combination of related capital expenditures, acquisitions, or dispositions, or to enter into any material credit facility or other material transaction. If the amount of such capital expenditure, acquisition, disposition, or a series or combination of related capital expenditures, acquisitions or dispositions, is reasonably likely to be in excess of $30,000,000, or if the amount of such credit facility, or a series or combination of related credit facilities, is reasonably likely to be in excess of $100,000,000, such transaction may not be consummated unless it is recommended by a majority of the Finance Committee members and authorized and approved by a majority of the full Board, including the affirmative vote of all of the independent directors. |
Code of Ethics
We have adopted a code of business conduct and ethics applicable to our Chief Executive Officer, Chief Financial Officer, controller and other financial leaders, as well as to our employees generally, which is a “code
102
of ethics” as defined by applicable rules of the Securities and Exchange Commission. This code is publicly available on our website at www. americanseafoods.com. If we make any amendments to this code other than technical, administrative or other non-substantive amendments, or grant any waivers, including implicit waivers, from a provision of this code to our Chief Executive Officer, Chief Financial Officer, or controller, we will disclose the nature of the amendment or waiver, its effective date and to whom it applies on our website or on Form 8-K filed with the Securities and Exchange Commission.
Item 11.Executive Compensation
The following table sets forth information concerning the compensation of the Chief Executive Officer and each of the four most highly compensated executive officers of the operating subsidiaries of ASG during each of the last three fiscal years.
Summary Compensation Table
| | | | | | | | | | | | | | | |
| | | Annual Compensation(1) | | Long Term Compensation
Awards
Securities
Underlying
Options/SARs(3) | | | All Other
Compensation(4) |
Name and Principal Position | | Fiscal
Year | | Salary | | | Bonus(2) | | |
Bernt O. Bodal Chairman and Chief Executive Officer | | 2005
2004
2003 | | $
| 420,000
420,000
400,000 |
| | $
| 434,766
1,062,031
680 | | 3,300
—
— | (5)
| | $
| 3,292
18,688
16,563 |
| | | | | |
Brad Bodenman Chief Financial Officer and Treasurer | | 2005
2004
2003 | | $
| 250,000
250,000
185,000 |
| | $
| 258,790
459,679
680 | | 740
—
— | (6)
| | $
| 11,607
8,322
4,940 |
| | | | | |
Inge Andreassen President of American Seafoods Company LLC | | 2005
2004
2003 | | $
| 262,500
210,000
200,000 |
| | $
| 520,000
157,815
680 | | 900
—
— | (7)
| | $
| 3,931
3,633
3,407 |
| | | | | |
Amy Humphreys Vice President of Finance and Corporate Development | | 2005
2004
2003 | | $
| 200,947
175,000
156,923 |
| | $
| 205,700
209,707
680 | | 600
—
— | (8)
| | $
| 8,242
7,946
6,544 |
| | | | | |
Matthew Latimer Chief Legal Officer and General Counsel | | 2005
2004
2003 | | $
| 200,000
61,410
— |
(10)
| | $
| 204,665
42,767
— | | 5,550
—
— | (9)
| | $
| 3,013
135
— |
| (1) | Includes amounts deferred under the American Seafoods Group Deferred Compensation Plan. The American Seafoods Group Deferred Compensation Plan also provides for a company match of $0.25 for each dollar deferred (up to a maximum of 15% of compensation) (for amounts, see “All Other Compensation” column). |
| (2) | Except for a holiday payment of $680, in 2003, no management bonuses were paid in accordance with our employment agreements and our general bonus policy, which does not require the payment of bonuses based on financial performance for any year in which there is or would be a violation of a covenant under our credit agreement. But for the elimination of these bonuses in 2003, we would have been in violation of our leverage covenant under our credit agreement. Amounts for 2004 include $840,801 paid to Mr. Bodal, $44,714 paid to Mr. Andreassen and $16,093 paid to Ms. Humphreys related to the distribution on unvested options made in connection with the Senior Discount Note offering. |
| (3) | As of the date of this annual report, ASLP held 99.8% of the beneficial interests in Holdings and had 899,618 units outstanding. |
103
| (4) | Includes the following amounts related to a company match under the American Seafoods Group Deferred Compensation Plan, life insurance premiums related to the American Seafoods Group Deferred Compensation Plan and life insurance coverage provided pursuant to the American Seafoods Group Executive Life Insurance Plan. |
| | | | | | | | | | | |
Name | | Year | | Deferred
Compensation
Plan | | Life
Insurance
Premiums | | Executive
Life
Insurance
Plan |
Bernt O. Bodal | | 2005
2004
2003 | | $
| —
14,063
14,063 | | $
| 2,225
2,125
— | | $
| 1,067
2,500
2,500 |
| | | | |
Brad Bodenman | | 2005
2004
2003 | | $
| 9,469
5,459
3,318 | | $
| 1,200
1,130
— | | $
| 938
1,733
1,622 |
| | | | |
Inge Andreassen | | 2005
2004
2003 | | $
| 2,500
2,500
2,500 | | $
| 450
400
224 | | $
| 981
733
683 |
| | | | |
Amy Humphreys | | 2005
2004
2003 | | $
| 7,130
6,562
5,625 | | $
| 400
380
— | | $
| 712
1,004
919 |
| | | | |
Matthew Latimer | | 2005
2004
2003 | | $
| 1,143
—
— | | $
| 1,060
—
— | | $
| 810
135
— |
| (5) | Consists of a grant under the Unit Option Plan of 3,300 Series E options. |
| (6) | Consists of a grant under the Unit Option Plan of 740 Series E options. |
| (7) | Consists of a grant under the Unit Option Plan of 900 Series E options. |
| (8) | Consists of a grant under the Unit Option Plan of 600 Series E options. |
| (9) | Consists of grants under the Unit Option Plan of 1,850 Series A options, 1,850 Series E options, and 1,850 Series F options. |
| (10) | Mr. Latimer was hired in August 2004. |
Aggregated Option Exercises and Fiscal Year-End Option Value
The following table sets forth certain information regarding options in ASLP held by the named executive officers at December 31, 2005.
Option/SAR Grants in Last Fiscal Year
| | | | | | | | | | | | | | |
Name | | Number of
Securities Underlying Options/SARs Granted (#) | | | % of Total
Options/SARs Granted to Employees in Fiscal Year (1) | | | Exercise or Base Price ($/Unit) | | Expiration Date | | Grant Date Value (2) |
Bernt O. Bodal | | 3,300 | (3) | | 20.3 | % | | $ | 210.30 | | 12/1/2013 | | $ | 136,488 |
Brad Bodenman | | 740 | (3) | | 4.5 | % | | $ | 210.30 | | 12/1/2013 | | $ | 30,606 |
Inge Andreassen | | 900 | (3) | | 5.5 | % | | $ | 210.30 | | 12/1/2013 | | $ | 37,224 |
Amy Humphreys | | 600 | (3) | | 3.7 | % | | $ | 210.30 | | 12/1/2013 | | $ | 24,816 |
Matthew Latimer | | 1,850 | (3) | | 11.4 | % | | $ | 176.32 | | 11/17/2014 | | $ | 64,288 |
| | 1,850 | (4) | | 11.4 | % | | $ | 176.32 | | 11/17/2014 | | $ | 64,288 |
| | 1,850 | (5) | | 11.4 | % | | $ | 176.32 | | 11/17/2014 | | $ | 64,288 |
| (1) | Total grants to employees during the fiscal year ended December 31, 2005 equaled 16,268. |
104
| (2) | The Black-Scholes option pricing model was used to determine the grant date value. |
| (3) | Grant of Series E options under the Unit Option plan. |
| (4) | Grant of Series A options under the Unit Option plan. |
| (5) | Grant of Series F options under the Unit Option plan. |
Option Plan
ASLP adopted a Unit Option Plan on January 28, 2000, which was amended and restated effective December 16, 2002. Options to acquire units in ASLP were granted under the plan to officers and certain key employees. The purpose of the Unit Option Plan was to promote the success of ASLP and the interests of its partners by attracting, motivating, retaining and rewarding eligible participants.
The ASLP Unit Option Plan has been administered by the entire board of directors of ASC Management, Inc. The board has selected eligible participants for participation in the Unit Option Plan and determined the number of partnership units subject to each option granted there under, the exercise price of such option, the time and condition of exercise of such option and all other terms and conditions of such option, including the form of the option agreement setting forth the terms and conditions of such option.
We may in the future adopt a long-term incentive plan to provide incentive compensation for any new members of management or to supplant the existing options once they have been exercised or have lapsed.
Employment Agreements
Each of Bernt O. Bodal, Inge Andreassen, Matthew Latimer and Brad Bodenman has an employment agreement with ASLP and American Seafoods Group, or, in the case of Mr. Andreassen, American Seafoods Company LLC (ASC). The employment agreements expired in 2005 for Messrs. Bodal, Andreassen and Bodenman, and will expire in 2007 for Mr. Latimer. However, they are subject to automatic extensions for succeeding terms of one year each unless terminated by delivery of notice by either party in accordance with the terms of the contract. Pursuant to these contracts, each executive may receive, in addition to his base salary, a discretionary and nondiscretionary bonus. Any discretionary bonus will be determined by the board of directors of ASLP in its sole discretion. The nondiscretionary bonus will be awarded if the Adjusted EBITDA (as defined in the Employment Agreements) of ASLP (or, in the case of Mr. Andreassen, the Adjusted EBITDA of ASLP and ASC) exceeds certain targets set by the Board, but the nondiscretionary bonuses will not be payable if, at the time of payment or at any time during the year of measurement, we are in default under any credit agreement relating to indebtedness for borrowed money.
If we terminate any of these executives’ employment with cause or if any of these executives terminates his employment without good reason, the executive is entitled only to payment of his unpaid base salary for the period prior to termination. If an executive’s employment terminates because of his death, or we terminate the executive’s employment upon his disability, then the executive is entitled to his unpaid salary and a pro-rated share of the nondiscretionary portion of the bonus to which he would otherwise have been entitled in respect of the year during which termination occurred. If we terminate an executive’s employment for any other reason or if the executive terminates for good reason, he is entitled to all of the amounts referred to in the preceding sentence, as well as severance compensation equal to the amount of his actual aggregate base salary for the 12 month period immediately prior to such termination payable over a 24 month period (except for Mr. Latimer, whose severance is payable over a 12 month period).
Board of Directors Compensation
Only Messrs. Bittner, Davis, Jurgensen and Perekslis, receive compensation for serving as directors. Messrs. Bittner, Davis and Perekslis each receive $6,250 per quarter as compensation for serving as directors. Mr. Jurgensen receives $10,000 per quarter for serving as a director.
105
Compensation Committee Interlocks and Insider Participation
On February 27, 2004, the board of directors of ASC Management, Inc. appointed Messrs. Crow, Perekslis and Bodal (as ex officio member) as members of the compensation committee. The members of the compensation committee do not receive any compensation for their services. Mr. Bodal serves as our Chief Executive Officer and as the President of ASC Management, Inc.
Item 12.Security Ownership of Certain Beneficial Owners and Management and Related Stockholder Matters
The following table and accompanying footnotes provide information regarding the indirect beneficial ownership of equity interests in ASG Consolidated as of March 7, 2006. The persons listed below include: (i) each person known to us to beneficially own 5% or more of the equity interests in ASLP, ASG’s indirect parent; (ii) each named executive officer of ASG; (iii) each director of ASC Management, Inc., the managing general partner of ASLP; and (iv) all executive officers and directors as a group.
The persons listed on the following table directly and indirectly, through the ownership of limited partnership units of ASLP, own membership interests in American Seafoods Holdings LLC (“Holdings”). ASLP and Bernt O. Bodal each directly owns 99.8% and 0.2%, respectively, of the interests of Holdings. However, the unit information has been adjusted to treat Mr. Bodal’s direct ownership interests in Holdings as if they were interests in units of ASLP, which is the managing member of Holdings. Holdings directly owns 100% of American Seafoods Consolidated LLC, which, in turn, owns directly approximately 90% and indirectly owns the remaining interests in ASG Consolidated. ASG Consolidated owns directly 100% of ASG.
The general partner of ASLP is an affiliate of ASLP Acquisition LLC, an entity controlled by Bernt O. Bodal, our Chairman and Chief Executive Officer, and Mr. Bodal directly and through ASLP Acquisition has the right to designate a majority of the members of the board of directors of ASLP’s general partner. Accordingly, Mr. Bodal has broad authority to conduct our business and control our company. Mr. Bodal, ASLP Acquisition, Coastal Villages Pollock LLC and other holders of ASLP limited partnership units entered into a Second Amended and Restated Securityholders Agreement, dated February 27, 2006, which governs several aspects of the relationship among the holders of ASLP limited partnership units. See “Item 13—Certain Relationships and Related Transactions—ASLP Securityholders Agreement” and “Item 10—Directors and Officers of the Registrant—Board of Directors and Other Governance Matters.”
The information in the table set forth below includes outstanding options that are exercisable within 60 days of March 7, 2006.
| | | | | |
Name of Beneficial Holder(1) | | Number of
ASLP Units | | Percentage of
ASLP Units(2) | |
Coastal Villages(3) | | 407,056 | | 45.2 | % |
Bernt O. Bodal(4) | | 492,562 | | 54.8 | % |
Inge Andreassen(5) | | 4,594 | | * | |
Brad Bodenman(5) | | 3,197 | | * | |
Matthew Latimer(5) | | 2,450 | | * | |
Amy Humphreys | | — | | * | |
John Cummings | | — | | * | |
Morgen Crow(6) | | 407,056 | | 45.2 | % |
Jeffrey Davis(5) | | 27,877 | | 3.1 | % |
Elliott Jurgensen | | — | | * | |
William Bittner | | — | | * | |
Robert Williams(6) | | 407,056 | | 45.2 | % |
Scott Perekslis | | — | | * | |
All directors and executive officers
as a group (12 persons) | | 899,618 | | 100.0 | % |
106
| (1) | Unless otherwise indicated below, the persons named in the table above have sole voting and investment power with respect to the number of securities set forth opposite their names. |
| (2) | Applicable percentage ownership is based on 899,618 units outstanding as of March 7, 2006 plus, in the case of each holder, any presently exercisable options held by such holder and options that will become exercisable within 60 days of March 7, 2006. |
| (3) | Includes an aggregate of 47,507 units of ASLP beneficially owned by Coastal Villages through its ownership of shares in CP3 Tax-Exempt Holdings Corp. (“CP3”) and ASC Offshore Holdings Corp. (“ASC Offshore”). Coastal Villages is shown as the beneficial owner of its proportionate share of the units held by CP3 and ASC Offshore because Coastal Villages can vote the units on certain important matters and CP3 and ASC Offshore are special purpose entities formed solely to hold ASLP units. Also includes 37 units of ASLP beneficially owned by Coastal Villages through its ownership of shares of ASC Management, ASLP’s general partner. |
| (4) | Consists of (i) 208,230 units of ASLP held directly by Mr. Bodal, (ii) 180,879 units of ASLP held by ASLP Acquisition LLC, a special purpose entity formed solely to hold ASLP units and over which Mr. Bodal exercises sole investment and voting power as its Managing Member (which amount includes 63 units of ASLP beneficially owned by ASLP Acquisition through its ownership of shares in ASC Management), (iii) 75,652 units of ASLP held by other members of ASLP Acquisition who have granted ASLP Acquisition, and accordingly Mr. Bodal as its Managing Member, an irrevocable proxy to vote such units, and (iv) an aggregate of 27,801 units of ASLP beneficially owned by Mr. Bodal through his purchase of an interest in CP3. Mr. Bodal is shown as the beneficial owner of his proportionate share of the units held by CP3 because Mr. Bodal can vote units on certain important matters and CP3 is a special purpose entity formed solely to hold units of ASLP. Also includes 1,621 units representing a deemed conversion of Mr. Bodal’s direct ownership interest in American Seafoods Holdings LLC, a subsidiary of ASLP. |
| (5) | Amounts shown for Messrs. Bodenman, Latimer, Andreassen and Davis do not include 3,566 units, 2,231 units, 4,182 units and 25,379 units, respectively, of ASLP held by ASLP Acquisition over which such persons, as members of ASLP Acquisition, have economic rights, but no voting or investment control. |
| (6) | Mr. Crow is the Executive Director and Mr. Williams is the Deputy Director of Coastal Villages Region Fund, the parent of Coastal Villages Pollock LLC, and as such may be deemed to beneficially own and share the power to vote or dispose of the units held by Coastal Villages Pollock LLC. Mr. Crow and Mr. Williams disclaim beneficial ownership of such units. |
The addresses of the beneficial owners shown in the table above who are beneficial owners of five percent or more of our membership interests are as follows: Coastal Villages Pollock LLC, 711 H Street, Suite 200, Anchorage, Alaska 99501; Bernt O. Bodal, American Seafoods Group LLC, Market Place Tower, 2025 First Avenue, Suite 900, Seattle, Washington 98121.
Changes in Control
On February 27, 2006, Íslandsbanki hf. (“ISB”), a commercial bank based in Iceland, provided financing to ASLP Acquisition, Bernt O. Bodal, and a portion of the financing used by Coastal Villages, for the purchase of partnership interests held, directly and indirectly, by Centre Partners and its affiliated funds (“Centre”) and certain other sellers. The loans from ISB do not impose any covenants or conditions on ASLP, ASG, or any of their respective subsidiaries. The loans are secured by pledges by Bodal, the other participants in ASLP Acquisition, ASLP Acquisition itself, Coastal and CP3 Tax-Exempt, Inc., a corporation through which Bodal and Coastal Villages hold a portion of their ASLP partnership interests (“CP3”), of membership interests in ASLP Acquisition, shares in CP3 and partnership interests in ASLP. These pledges collectively represent approximately 46.3% of ASLP’s partnership interests. In the event of a default under the loan documents, ISB may exercise typical remedies with respect to the pledged interests, including foreclosure, subject to certain restrictions on transfer, voting and control rights imposed by the United States Maritime Administration.
107
Equity Compensation Plan Information
The following table sets forth information as of December 31, 2005 concerning compensation plans previously approved by security holders and not previously approved by security holders. A description of the material features of the ASLP Unit Option Plan may be found in “Item 8—Financial Statements and Supplementary Data” as well as in “Item 11—Executive Compensation”.
| | | | | | | |
Plan Category | | Number of securities
to be issued upon
exercise of
outstanding options,
warrants and rights
(a) | | Weighted-average
exercise price of
outstanding
options, warrants
and rights (b) | | Number of securities
remaining available
for future issuance
under equity
compensation plans
(excluding securities
reflected in column (a))
(c) |
Equity compensation plans approved by security holders | | — | | | — | | — |
Equity compensation plans not approved by security holders | | 57,342 | | $ | 107.88 | | 3,867 |
Total | | 57,342 | | $ | 107.88 | | 3,867 |
Item 13.Certain Relationships and Related Transactions
ASLP Securityholders Agreement
The holders of options and units in ASLP are party to a Second Amended and Restated Securityholders Agreement entered into on February 27, 2006. As in effect on the date of this annual report, the ASLP Securityholders Agreement imposes restrictions on transfers of securities in ASLP, provides “first offer” and “tag-along” rights with respect to certain transfers of ASLP securities and deals with certain other governance matters. In addition, the ASLP Securityholders Agreement contains provisions specifying the composition of the board of directors of ASC Management, Inc., the general partner of ASLP. Under those provisions, Bernt O. Bodal, directly and through ASLP Acquisition LLC, currently has the right to elect a majority of that board.
The ASLP Securityholders Agreement further provides that our board of directors will initially consist of seven directors nominated by certain unitholders of ASLP as follows:
| | | | |
Unit Holder | | # Board Members | | Independent or Affiliated(1) |
Bernt O. Bodal | | One member | | Affiliated |
| | |
| Management Securityholders (including Bodal) | | One member | | Affiliated |
| | |
ASLP Acquisition LLC | | Two members | | Independent |
| | |
Coastal Villages Pollock LLC | | Three members | | Independent (1 member);
Affiliated (2 members) |
| (1) | “Independent” directors must meet the definition of independent as described in Section 303A.02 of the NYSE Listed Companies Manual and are removable only for cause. “Affiliated” directors need not meet the NYSE independence definition and may be removed at any time by the party that appointed them. |
Agreement Relating to Coastal Villages
We are party to an agreement with Coastal Villages, a substantial equity holder of our company, pursuant to which Coastal Villages has granted us a license to harvest and process the entire portion of the total allowable catch allocated to it under the Alaska Community Development Quota program through the 2008 pollock season. Pursuant to this agreement, we paid to Coastal Villages $12.2 million in 2005 based on tons harvested. Coastal
108
Villages’ quota for the 2005 season represented 2.4% of the total allowable catch. Under the agreement, we are also committed to certain job training and community development initiatives for the benefit of Coastal Villages’ member communities. Coastal Villages is our largest supplier of community development quota. The agreement with Coastal Villages is scheduled to terminate on December 31, 2008. See “Item 1A—Risk Factors—Risks Relating to Our Industry and Its Regulations—Our business could be materially affected if the community development quota we purchase is significantly reduced or eliminated or offered to us at prices we consider unreasonable.”
Transactions and Agreements Relating to Our Management
Corporate Insurance Policies
We purchase corporate insurance policies from ABD Seattle-Sullivan & Curtis, or ABD, an insurance brokerage company in which Mr. Trond R. Bodal is the President. Mr. Trond R. Bodal is the brother of Bernt O. Bodal, our Chairman and Chief Executive Officer. We paid ABD approximately $7.8 million in 2005. No amounts were paid directly to Mr. Trond R. Bodal with respect to these insurance policies. We believe that the terms of the insurance policies we have obtained from ABD are no less favorable to us than those that would have been obtained from another insurance company.
Aircraft Charters
On December 31, 2002, ASLP leased an aircraft on a long term basis from a third party lender. In connection with that lease, Mr. Bodal agreed to indemnify and hold harmless ASLP from costs and losses associated with the extent to which that long-term lease is at a notional cost or value in excess of $5.7 million. Also on December 31, 2002, we entered into a month to month lease arrangement with ASLP for use of the aircraft, which we terminated in March 2006. In December 2004, we entered into a month-to-month charter arrangement with ASLP for the use of an additional aircraft. Our monthly lease payment to ASLP under this arrangement is $159,000, plus certain operating expenses. Our lease expense to ASLP under these arrangements was $1.9 million in 2005.
Messrs. Bodal, Perekslis and Bodenman and Centre Partners, an affiliate of Mr. Perekslis, have entered into time sharing agreements with us pursuant to which they can lease the new aircraft on an hourly basis at a rate that is slightly above our direct and incremental operating costs.
Guarantees of Corporate Debt
In December 2005, Messrs. Bodal and Davis agreed to contribute to the capital of ASLP, our ultimate parent, $30.0 million and $4.0 million, respectively, in the event that we defaulted in the payment of any principal or interest due under our Credit Agreement. ASLP, in turn, agreed to “push down” such capital contributions to us. The contribution agreement will remain in effect until the earlier of the repayment of all of the outstanding principal and interest owing under our Credit Agreement or January 15, 2007.
Consulting Agreements
In December 2004, we entered into a consulting agreement with Jeffrey Davis, a member of our Board of Directors since February 2005. Under the terms of the consulting agreement, we will pay Mr. Davis $175,000 per year for consulting services. The agreement has a term of one year and is renewable for successive one year terms.
109
Item 14. Principal Accountant Fees and Services
The following table sets forth the aggregate fees by our independent auditors, KPMG LLP, for the years ended December 31, 2004 and 2005 (in thousands).
| | | | | | | |
| | | 2004 | | | 2005 |
Audit fees | | $ | 1,753 | (1) | | $ | 930 |
Tax fees | | | 1,293 | | | | 337 |
| | | | | | | |
| | $ | 3,046 | | | $ | 1,267 |
| | | | | | | |
| (1) | Includes audit fees of $910,000 related to the IDS offering. |
In the table above, pursuant to their definitions under the applicable regulations of the Securities and Exchange Commission, “audit fees” are fees for professional services rendered for the audit of our annual consolidated financial statements and review of our condensed consolidated financial statements included in our quarterly reports on Form 10-Q, for services that are normally provided by the accountant in connection with regulatory filings or engagements including services provided in connection with the filing of registration statements for the sale of our securities with the Securities and Exchange Commission, for accounting consultations, and for audits in connection with acquisitions; “tax fees” are fees for tax compliance, tax advice and tax planning. In addition to the fees included in the table above, KPMG LLP provided other services to Holdings and ASLP in the form of tax and accounting consultation services in the aggregate amount of approximately $421,000 for the year ended December 31, 2005.
Pre-Approval Policies and Procedures
The Audit Committee of our Board of Directors pre-approves all audit and non-audit services performed by KPMG LLP. The Audit Committee’s policy for pre-approval requires that the committee consider whether the services to be delivered by the auditors are compatible with the maintenance of their independence. The Audit Committee has concluded that services provided by the auditors to date do not compromise their independence. Pre-approvals of non-audit services are sometimes delegated to a single member of the Audit Committee. However, any pre-approvals made by a single Audit Committee member must be presented to the full Audit Committee at the next regularly scheduled meeting.
110
PART IV
Item 15. Exhibits and Financial Statement Schedules
(a) Financial Statements and Financial Statement Schedules:
(1) Index to Financial Statements
(2) Index to Financial Statement Schedules.
Schedules have been omitted because they are not applicable or are not required or the information required to be set forth in schedules is included in the consolidated financial statements or related notes.
(3) Exhibits.
| | |
Exhibit
Number | | Description |
| |
| 3.1 | | Certificate of Formation of American Seafoods Group LLC(1) |
| |
| 3.2 | | Third Amended and Restated Limited Liability Company Agreement of American Seafoods Group LLC(1) |
| |
| 4.1 | | Indenture, dated as of April 18, 2002, among American Seafoods Group LLC, American Seafoods Finance, Inc., the Guarantors listed on Schedule A thereto and Wells Fargo Bank Minnesota, National Association, as trustee, relating to the 10 1/8% Senior Subordinated Notes due 2010(1) |
| |
| 4.2 | | Supplemental Indenture, dated as of December 16, 2002, among Southern Pride Catfish LLC, American Seafoods Group LLC, American Seafoods Finance, Inc., the other Guarantors (as defined therein) and Wells Fargo Bank Minnesota, National Association, as trustee(2) |
| |
| 4.3 | | Supplemental Indenture, dated as of December 16, 2002, among Southern Pride Catfish Trucking, Inc., American Seafoods Group LLC, American Seafoods Finance, Inc., the other Guarantors (as defined therein) and Wells Fargo Bank Minnesota, National Association, as trustee(2) |
| |
| 4.4 | | Third Supplemental Indenture, dated as of September 26, 2003, among American Seafoods Group LLC, American Seafoods Finance, Inc., the Guarantors (as defined therein) and Wells Fargo Bank Minnesota, National Association, as trustee(3) |
| |
| 4.5 | | Supplemental Indenture, dated as of January 11, 2006, among American Pride LLC, American Seafoods Group LLC, American Seafoods Finance, Inc., the Guarantors (as defined therein) and Wells Fargo Bank, National Association, as trustee* |
| |
| 10.1 | | First Amended and Restated Membership Agreement dated September 2005* |
| |
| 10.2 | | High Seas Catchers’ Cooperative Agreement dated December 1998(2) |
| |
| 10.3 | | Employment Agreement, dated January 28, 2000, by and among American Seafoods, L.P., American Seafoods Group LLC and Bernt O. Bodal(4) |
111
| | |
Exhibit
Number | | Description |
| |
| 10.4 | | Amendment No. 1, dated as of March 29, 2005, to the Employment Agreement, dated as of January 28, 2000, among American Seafoods, L.P., American Seafoods Group LLC and Bernt O. Bodal(5) |
| |
| 10.5 | | Employment Agreement, dated March 18, 2002, by and between American Seafoods Group LLC and Brad Bodenman(6) |
| |
| 10.6 | | Amendment No. 1, dated as of March 29, 2005, to the Employment Agreement, dated as of March 18, 2002, by and between American Seafoods Group LLC and Brad Bodenman(5) |
| |
| 10.7 | | Employment Agreement, dated January 28, 2000, by and among American Seafoods, L.P., American Seafoods Company LLC and Inge Andreassen(4) |
| |
| 10.8 | | Employment Agreement, dated August 9, 2004, by and among American Seafoods, L.P., American Seafoods Group LLC and Matthew D. Latimer(7) |
| |
| 10.9 | | Employment Agreement, dated April 8, 2002, by and among American Seafoods, L.P., American Seafoods International LLC and John Cummings(6) |
| |
| 10.11 | | Consulting Agreement, dated January 1, 2005, by and between American Seafoods Group LLC and Southern Group, LLC(5) |
| |
| 10.12 | | Third Amended and Restated Credit Agreement, dated as of October 6, 2005, by and among American Seafoods Consolidated LLC, ASG Consolidated LLC, American Seafoods Group LLC, other financial institutions from time to time party thereto, DNB NOR Bank ASA, as Documentation Agent, and IslandsBanki HF, Harris N.A. and Wells Fargo Bank, N.A., as Co-Syndication Agents, Wells Fargo Bank, N.A., as Swingline Lender and Bank of America, N.A., as Administrative Agent and Issuing Lender(8) |
| |
| 10.13 | | Second Amended and Restated Securityholders Agreement dated February 27, 2006(9) |
| |
| 21.1 | | Subsidiaries of the Registrant* |
| |
| 31.1 | | Certification of Chief Executive Officer pursuant to Rule 13a-14(a)/15(d)-14(a) of the Securities Exchange Act of 1934, as amended, as adopted pursuant to Section 302 of the Sarbanes-Oxley Act of 2002* |
| |
| 31.2 | | Certification of Chief Financial Officer pursuant to Rule 13a-14(a)/15(d)-14(a) of the Securities Exchange Act of 1934, as amended, as adopted pursuant to Section 302 of the Sarbanes-Oxley Act of 2002* |
| |
| 32.1 | | Certification of Chief Executive Officer pursuant to 18 U.S.C. 1350, as adopted pursuant to Section 906 of the Sarbanes-Oxley Act of 2002* |
| |
| 32.2 | | Certification of Chief Financial Officer pursuant to 18 U.S.C. 1350, as adopted pursuant to Section 906 of the Sarbanes-Oxley Act of 2002* |
| (1) | Filed as an exhibit to American Seafoods Group LLC’s Form S-4 on June 13, 2002 |
| (2) | Filed as an exhibit to American Seafoods Group LLC’s Form 8-K on December 30, 2002 |
| (3) | Filed as an exhibit to American Seafoods Corporation’s Form S-1 on October 16, 2003 |
| (4) | Filed as an exhibit to Amendment No. 1 of American Seafoods Group LLC’s Form S-4 on July 26, 2002 |
| (5) | Filed as an exhibit to American Seafoods Group LLC’s Form 10-K on March 31, 2005 |
| (6) | Filed as an exhibit to Amendment No. 1 of American Seafoods Group LLC’s Form S-4 on September 12, 2002 |
| (7) | Filed as an exhibit to American Seafoods Group LLC’s Form 10-Q on November 15, 2004 |
| (8) | Filed as an exhibit to ASG Consolidated LLC’s Form 10-Q on November 14, 2005 |
| (9) | Filed as an exhibit to ASG Consolidated LLC’s Form 8-K on March 3, 2006 |
112
(b) Exhibits
The following exhibits are filed with this annual report:
| | |
| 4.5 | | Supplemental Indenture, dated as of January 11, 2006, among American Pride LLC, American Seafoods Group LLC, American Seafoods Finance, Inc., the Guarantors (as defined therein) and Wells Fargo Bank, National Association, as trustee. |
| |
| 10.1 | | First Amended and Restated Membership Agreement dated September 2005. |
| |
| 21.1 | | List of Subsidiaries of the Registrant. |
| |
| 31.1 | | Certification of Chief Executive Officer pursuant to Rule 13a-14(a)/15(d)-14(a) of the Securities Exchange Act of 1934, as amended, as adopted pursuant to Section 302 of the Sarbanes-Oxley Act of 2002. |
| |
| 31.2 | | Certification of Chief Financial Officer pursuant to Rule 13a-14(a)/15(d)-14(a) of the Securities Exchange Act of 1934, as amended, as adopted pursuant to Section 302 of the Sarbanes-Oxley Act of 2002. |
| |
| 32.1 | | Certification of Chief Executive Officer pursuant to 18 U.S.C. 1350, as adopted pursuant to Section 906 of the Sarbanes-Oxley Act of 2002. |
| |
| 32.2 | | Certification of Chief Financial Officer pursuant to 18 U.S.C. 1350, as adopted pursuant to Section 906 of the Sarbanes-Oxley Act of 2002. |
113
SIGNATURES
Pursuant to the requirements of Section 13 or 15(d) of the Securities Exchange Act of 1934, the Registrant has duly caused this report to be signed on its behalf by the undersigned thereunto duly authorized, on the 10th day of April 2006.
| | |
AMERICAN SEAFOODS GROUP LLC |
| |
By: | | /s/ BRAD BODENMAN |
| | Brad Bodenman Chief Financial Officer |
Pursuant to the requirements of the Securities Exchange Act of 1934, as amended, this report has been signed below by the following persons on behalf of the registrant and in the capacities and on the dates indicated.
| | | | |
Name | | Title | | Date |
| | |
/s/ BERNT O. BODAL Bernt O. Bodal | | Chairman and Chief Executive Officer, American Seafoods Group LLC, Director of ASC Management, Inc. (Principal Executive Officer) | | April 10, 2006 |
| | |
/s/ BRAD BODENMAN Brad Bodenman | | Chief Financial Officer, American Seafoods Group LLC (Principal Financial Officer and Principal Accounting Officer) | | April 10, 2006 |
| | |
/s/ MORGEN CROW Morgen Crow | | Director of ASC Management, Inc. | | April 10, 2006 |
| | |
/s/ ROBERT WILLIAMS Robert Williams | | Director of ASC Management, Inc. | | April 10, 2006 |
| | |
/s/ ELLIOTT H. JURGENSEN, JR. Elliott H. Jurgensen, Jr. | | Director of ASC Management, Inc. | | April 10, 2006 |
| | |
/s/ WILLIAM BITTNER William Bittner | | Director of ASC Management, Inc. | | April 10, 2006 |
| | |
/s/ SCOTT PEREKSLIS Scott Perekslis | | Director of ASC Management, Inc. | | April 10, 2006 |
| | |
/s/ JEFFREY DAVIS Jeffrey Davis | | Director of ASC Management, Inc. | | April 10, 2006 |
114