U.S. SECURITIES AND EXCHANGE COMMISSION
WASHINGTON, D.C. 20549
FORM 10-K
Annual Report under Section 13 or 15(d) of the
Securities Exchange Act of 1934
For the Fiscal Year ended December 31, 2007
OR
Transition Report under Section 13 or 15(d) of the
Securities Exchange Act of 1934
For the Transition Period from to
Commission File Number: 000-49898
North State Bancorp
(Exact name of registrant as specified in its charter)
| | |
| North Carolina | | 65-1177289 |
(State or other jurisdiction of incorporation or organization) | | (I.R.S. Employer Identification No.) |
4270 The Circle at North Hills
Raleigh, North Carolina 27609
(Address of principal executive offices, including zip code)
(919) 787-9696
(Issuer’s telephone number)
Securities Registered under Section 12(b) of the Act: None
Securities Registered under Section 12(g) of the Act:
| | |
| Title of Each Class | | Name of Each Exchange On Which Registered |
| Common Stock, No Par Value | | None |
Indicate by check mark if the registrant is a well-known seasoned issuer, as defined in Rule 405 of the Securities Act. Yes¨ Nox
Indicate by check mark if the registrant is not required to file reports to Section 13 or Section 15(d) of the Act. Yes¨ Nox
Indicate by check mark whether the registrant (1) has filed all reports required to be filed by Section 13 or 15(d) of the Exchange Act during the past 12 months (or for such shorter period that the registrant was required to file such reports), and (2) has been subject to such filing requirements for the past 90 days. Yesx No¨
Indicated by check mark if disclosure of delinquent filers in response to Item 405 of Regulation S-K is not contained herein, and will not be contained, to the best of the registrant’s knowledge, in definitive proxy or information statements incorporated by reference in Part III of this Form 10-K or any amendment to this Form 10-K.¨
Indicate by check mark whether the registrant is a shell company (as defined in Rule 12b-2 of the Exchange Act). Yes¨ Nox.
Indicate by check mark whether the registrant is a large accelerated filer, an accelerated filer, a non-accelerated filer, or a smaller reporting company. See the definitions of “large accelerated filer,” “accelerated filer” and “smaller reporting company” in Rule 12b-2 of the Exchange Act.
| | |
Large accelerated filer ¨ | | Accelerated filer ¨ |
Non-accelerated filer x | | Smaller reporting company ¨ |
(Do not check if a smaller reporting company)
The aggregate market value of the common stock held by non-affiliates was $62.1 million as of June 30, 2007, based on the average bid and ask price of the common stock as quoted on the over-the-counter Bulletin Board on that day.
As of March 7, 2008, the registrant had outstanding 7,157,747 shares of Common Stock, no par value.
DOCUMENTS INCORPORATED BY REFERENCE
Portions of the registrant’s definitive proxy statement to be filed for its 2008 Annual Meeting of Shareholders to be held on May 29, 2008 to be mailed to shareholders within 120 days of December 31, 2007 are incorporated by reference into Part III of this report.
NORTH STATE BANCORP
ANNUAL REPORT ON FORM 10-K
Table of Contents
PART I
Item 1.Business.
Overview
We are a commercial bank holding company that was incorporated on June 5, 2002. We have one corporate subsidiary, North State Bank, which we acquired on June 28, 2002 as part of the Bank’s holding company reorganization. Our primary business is the ownership and operation of North State Bank. We also have three trust subsidiaries that we established to issue trust preferred securities and an approximately 5.6% equity interest in a title insurance agency.
North State Bank was incorporated under the laws of the State of North Carolina in May 2000 and opened for business on June 1, 2000. The Bank is not a member of the Federal Reserve System. Our main office and that of the Bank is located at 4270 The Circle at North Hills, Raleigh, North Carolina. The Bank also operates offices at 6200 Falls of Neuse Road in north Raleigh, 2413 Blue Ridge Road in west Raleigh, 14091 New Falls of Neuse Road in Raleigh, 835 Highway 70 West in Garner, North Carolina, 16 West Martin Street in downtown Raleigh and a loan production office at 1908 Eastwood Road in Wilmington, North Carolina which was replaced by a full service banking office in January 2008 located at 1411 Commonwealth Drive, Wilmington, North Carolina. The term “we” in this report refers interchangeably to North State Bancorp and North State Bank.
We focus on serving the total banking needs of professional firms, professionals, property management companies, churches and individuals who highly value a mutually beneficial banking relationship in the cities of Raleigh, Garner and Wilmington and the greater Wake County and New Hanover County market areas, by providing banking services including checking, savings and investment accounts; commercial, installment, mortgage, and personal loans; safe deposit boxes; savings bonds; wire transfer; and other associated services. We own approximately 5.6% of Beacon Title Agency, LLC, a title insurance agency. Through the Bank’s subsidiary, North State Bank Financial Services, Inc., we offer brokerage services.
Supervision and Regulation
Regulation of North State Bank
North State Bank is a North Carolina banking corporation whose deposits are insured by the Federal Deposit Insurance Corporation. As a commercial bank, we are subject to extensive regulation by the FDIC and the North Carolina Commissioner of Banks. The North Carolina Commissioner of Banks and the FDIC periodically examine our operations and require us to submit periodic reports regarding our financial condition and operations.
We are subject to various state and federal laws and regulations that restrict or otherwise apply to our lending, deposit-taking and other business activities. Additionally, federal law generally prohibits us from engaging as principal in activities that are not permitted for national banks unless the FDIC determines that the activity would pose no significant risk to the deposit insurance fund, and we are, and continue to be, in compliance with all applicable capital standards. In addition, we generally are not able to acquire or retain equity investments of a type, or in an amount, that is not permissible for a national bank.
A bank must obtain the prior approval of the North Carolina Commissioner of Banks for any of the following events:
| | • | | the merger with or purchase of substantially all the assets or assumption of liabilities of another financial institution; |
| | • | | the establishment of a branch office; and |
| | • | | the establishment or acquisition of a subsidiary corporation. |
The North Carolina Commissioner of Banks or the FDIC may sanction any insured bank not operated in accordance with or not conforming to their regulations, policies, and directives. Proceedings may be instituted against an insured bank or any director, officer or employee of a bank that engages in unsafe and unsound practices, including the violation of applicable laws and regulations. The FDIC can terminate insurance of accounts of any insured bank not operated in accordance with or not conforming to its regulations, policies, and directives.
All FDIC-insured banks must maintain average daily reserves against their transaction accounts. Because required reserves must be maintained in the form of vault cash or in a non-interest-bearing account at a Federal Reserve Bank, the effect of the reserve requirement is to reduce the amount of the Banks’ interest-earning assets.
1
The Bank is subject to the provisions of Section 23A of the Federal Reserve Act. Section 23A places limits on the amount of certain transactions with affiliate entities. The total amount of the transactions by the Bank with a single affiliate is limited to 10% of the Bank’s capital and surplus and, for all affiliates, to 20% of the Bank’s capital and surplus. Each of the transactions among affiliates must also meet specified collateral requirements and must comply with other provisions of Section 23A designed to avoid transfers of low-quality assets between affiliates. The Bank also is subject to the provisions of Section 23B of the Federal Reserve Act which, among other things, prohibits transactions with affiliates that are subject to Section 23A unless the transactions are on terms substantially the same, or at least as favorable to the Bank or its subsidiaries, as those prevailing at the time for comparable transactions with nonaffiliated companies.
The USA Patriot Act of 2001 is intended to strengthen the ability of U.S. law enforcement and the intelligence community to work cohesively to combat terrorism on a variety of fronts. The Patriot Act contains sweeping anti-money laundering and financial transparency laws which require various regulations, including standards for verifying customer identification at account opening, and rules to promote cooperation among financial institutions, regulators, and law enforcement entities in identifying parties that may be involved in terrorism or money laundering. The Patriot Act has required financial institutions to adopt new policies and procedures to combat money laundering, and it grants the Secretary of the Treasury broad authority to establish regulations and impose requirements and restrictions on financial institutions’ operations.
Community Reinvestment Act
We are subject to the provisions of the Community Reinvestment Act of 1977, which requires financial institutions to meet the credit needs of their local communities, including low and moderate income communities. In accordance with the Community Reinvestment Act, the FDIC periodically assesses our record of meeting the credit needs of our local communities by assigning one of the following ratings to our performance in that regard:
| | • | | substantial noncompliance. |
In addition, the FDIC will strongly consider our performance under the Community Reinvestment Act as a factor upon any application by us for any of the following:
| | • | | the establishment of a branch; |
| | • | | the relocation of a main office or branch; and |
| | • | | the merger or consolidation with or the acquisition of assets or assumption of liabilities of an insured depository institution. |
Capital Requirements
We must comply with the capital requirements imposed by the FDIC. Under the FDIC’s regulations, state-chartered, nonmember banks that receive the highest rating during the examination process have the following characteristics:
| | • | | no anticipated or significant current growth; |
| | • | | well-diversified risk (including no undue interest rate risk exposure), excellent asset quality, high liquidity and good earnings; and |
| | • | | in general, are considered strong banking organizations. |
The FDIC requires banks to maintain a minimum leverage ratio of 3% of Tier 1 capital, which is common stockholders’ equity less intangible assets, identified losses and other adjustments, to average total consolidated assets. The FDIC can require banks to maintain a ratio of 100 to 200 basis points above the stated minimum, and has generally set a minimum leverage ratio of not less than 4% for most banks.
To provide measurement of capital adequacy that is more sensitive to the individual risk profiles of financial institutions, the FDIC’s risk-based capital regulations provide that, in addition to maintaining their required leverage ratio, banks are expected to maintain a level of capital commensurate with risk profiles assigned to their assets. The regulations generally require a minimum ratio of Tier 1 capital to risk-weighted assets of 4%, and a minimum ratio of total capital to risk-weighted assets of 8%, of which at least one-half must be in the form of Tier 1 capital.
2
Dividends
The payment of any cash dividend is subject to the Bank’s board of directors’ evaluation of its operating results, financial condition, future growth plans, general business conditions, and to tax and other relevant considerations and regulatory limitations, including our minimum capital requirements. The Bank might not declare and pay any cash dividends, and if it were to do so, it might not continue to declare them or maintain them at the same level. As North State Bancorp owns all of the stock of North State Bank, any dividend declared would be paid to it.
In addition, other statutory and regulatory restrictions apply to the payment of cash dividends on our common stock. Under North Carolina law applicable to banks, our directors may declare a cash dividend in an amount equal to our undivided profits, as they deem appropriate, subject to the limitation that the bank’s capital surplus is at least 50% of its paid-in capital. Cash dividends may only be paid out of retained earnings. We cannot pay a cash dividend at any time that we are “undercapitalized” or insolvent, or when payment of the dividend would render us insolvent. Also, a FDIC-insured bank cannot pay a cash dividend while it is in default on any assessment due the FDIC.
Insurance Assessments
The FDIC insures our customers’ deposits. Under the Federal Deposit Insurance Reform Act of 2005, the FDIC uses a risk-based assessment system to determine the amount of a bank’s deposit insurance assessment based on an evaluation of the probability that the deposit insurance fund will incur a loss with respect to that bank. The evaluation considers risks attributable to different categories and concentrations of the bank’s assets and liabilities and other factors the FDIC considers to be relevant, including information obtained from the bank’s federal and state banking regulators. The FDIC is responsible for maintaining the adequacy of the deposit insurance fund, and the amount paid by a bank for deposit insurance is influenced not only by the assessment of the risk it poses to the deposit insurance fund, but also by the adequacy of the insurance fund to cover the risk posed by all insured institutions. FDIC insurance assessments could be increased substantially in the future if the FDIC finds such an increase to be necessary in order to adequately maintain the deposit insurance fund. The FDIC also may terminate a bank’s deposit insurance if it finds that the bank has engaged in unsafe and unsound practices, is in an unsafe or unsound condition to continue operations, or has violated applicable laws, regulations, rules, or orders.
Interstate Banking and Branching
Subject to state law, federal law permits adequately capitalized and managed bank holding companies to acquire control of a bank in any state. In addition, federal law permits banks to merge with banks located in other states and allows states to adopt legislation permitting out-of-state banks to open branch offices within that state’s borders. The North Carolina Reciprocal Interstate Banking Act permits banking organizations in any state with similar reciprocal legislation to acquire North Carolina banking organizations. In addition, subject to another state having similar laws, the North Carolina Interstate Branch Banking Act:
| | • | | permits North Carolina banks and out-of-state banks to merge; |
| | • | | authorizes North Carolina banks to establish or acquire branch offices in any other state; and |
| | • | | permits out-of-state banks to establish or acquire branch offices in North Carolina. |
Prompt Corrective Action
The Federal Deposit Insurance Corporation Improvement Act of 1991 establishes a system of prompt corrective action to resolve the problems of undercapitalized institutions. Under this system, the federal banking regulators must rate supervised institutions on a basis of five capital categories. The federal banking regulators also must take certain mandatory supervisory actions and are authorized to take all other discretionary actions with respect to institutions in the three undercapitalized categories, the severity of which will depend upon the capital category in which the institution is placed. Generally, subject to narrow exception, the Federal Deposit Insurance Corporation Improvement Act requires the primary or appropriate banking regulator to appoint a receiver or conservator for an institution that is critically undercapitalized. The federal banking agencies have specified by regulation the relevant capital level for each category.
Under the Federal Deposit Insurance Corporation Improvement Act, the FDIC adopted regulations setting forth a five-tier scheme for measuring the capital adequacy of FDIC-insured commercial banks. Under the regulations, a bank is placed in one of the following capital categories:
| | • | | Well Capitalized – a bank which has a total capital ratio of at least 10%, a Tier 1 capital ratio of at least 6%, and a Tier 1 leverage ratio of at least 5%; |
3
| | • | | Adequately Capitalized – a bank which has a total capital ratio of at least 8%, a Tier 1 capital ratio of at least 4%, and a Tier 1 leverage ratio of at least 4%; |
| | • | | Undercapitalized – a bank that has a total capital ratio of under 8%, a Tier 1 capital ratio of under 4%, or a Tier 1 leverage ratio of under 4%; |
| | • | | Significantly Undercapitalized – a bank that has a total capital ratio of under 6%, a Tier 1 capital ratio of under 3%, or a Tier 1 leverage ratio of under 3%; and |
| | • | | Critically Undercapitalized – a bank whose tangible equity is not greater than 2% of total tangible assets. |
The regulations permit the FDIC to downgrade a bank to the next lower category if the FDIC determines after notice and opportunity for hearing or response that the bank is in an unsafe or unsound condition or that the bank has received and not corrected a less-than-satisfactory rating for any of the categories of asset quality, management, earnings, or liquidity in its most recent examination. Supervisory actions by the appropriate federal banking regulator depend upon an institution’s classification within the five categories.
The Federal Deposit Insurance Corporation Improvement Act generally prohibits a depository institution from making any capital distribution including payment of a cash dividend if the depository institution would thereafter be undercapitalized. Undercapitalized depository institutions are subject to restrictions on borrowing from the Federal Reserve System. In addition, undercapitalized depository institutions are subject to growth limitations and are required to submit capital restoration plans. If a depository institution fails to submit an acceptable plan, it is treated as if it is significantly undercapitalized.
Significantly undercapitalized depository institutions might be subject to a number of requirements and restrictions including orders to sell sufficient voting stock to become adequately capitalized, requirements to reduce total assets, and cessation of receipt of deposits from correspondent banks. Critically undercapitalized depository institutions are subject to appointment of a receiver or conservator.
Safety and Soundness Standards
The Federal Deposit Insurance Act requires the federal bank regulatory agencies to prescribe standards relating to internal controls, information systems and internal audit systems, loan documentation, credit underwriting, interest rate risk exposure, asset growth, asset quality, earnings, stock valuation, and compensation, fees and benefits, and such other operational and managerial standards as the agencies deem appropriate. The federal bank regulatory agencies have adopted a set of guidelines prescribing safety and soundness standards under the Federal Deposit Insurance Corporation Improvement Act. In general, the guidelines require appropriate systems and practices to identify and manage the risks and exposures specified in the guidelines. The guidelines prohibit excessive compensation as an unsafe and unsound practice and describe compensation as excessive when the amounts paid are unreasonable or disproportionate to the services performed by the executive officer, employee, director or principal shareholder. In addition, the agencies adopted regulations that authorize, but do not require, an agency to order an institution that has been given notice by an agency that is not satisfying any of such safety and soundness standards to submit a compliance plan. If, after being so notified, an institution fails to submit an acceptable compliance plan, the agency must issue an order directing action to correct the deficiency and may issue an order directing other actions of the types to which an undercapitalized institution is subject under the prompt correction action provisions of the Federal Deposit Insurance Corporation Improvement Act. If an institution fails to comply with such an order, the agency may seek to enforce such order in judicial proceedings and to impose civil money penalties.
Financial Modernization Legislation
The Gramm-Leach-Bliley Act of 1999 permits bank holding companies meeting management, capital and Community Reinvestment Act standards, and that register as a “financial holding company,” to engage in a broad range of non-banking activities, including insurance underwriting and investment banking. The Act allows insurance companies and other financial services companies to acquire banks and allows bank holding companies to acquire securities firms and mutual fund advisory companies. The Act requires appropriate safeguards if a bank holding company wishes to engage in any of these activities. The Act also contains extensive customer privacy protection provisions which require banks to adopt and implement policies and procedures for the protection of the financial privacy of their customers, including procedures that allow customers to elect that certain financial information not be disclosed to certain persons.
4
A bank holding company may become a financial holding company under the Gramm-Leach-Bliley Act if each of its subsidiary banks is “well capitalized” under the Federal Deposit Insurance Corporation Improvement Act prompt corrective action provisions, is well managed and has at least a satisfactory rating under the Community Reinvestment Act. In addition, the bank holding company must file a declaration with the Federal Reserve Board that the bank holding company wishes to become a financial holding company. A bank holding company that falls out of compliance with these requirements may be required to cease engaging in some of its activities. We registered as a financial holding company in September 2007 in order to invest in Beacon Title Agency, LLC, a title insurance agency, as a means to generate non-interest income.
Regulation of North State Bancorp
As a registered bank holding company, we are subject to the supervision of, and to regular inspection by, the Board of Governors of the Federal Reserve System.
The Federal Reserve is authorized to adopt regulations affecting various aspects of bank holding companies. As a bank holding company, our activities, and those of companies which we control or in which we hold more than 5% of the voting stock, is limited to banking or managing or controlling banks or furnishing services to or performing services for our subsidiaries, or any other activity which the Federal Reserve determines to be so closely related to banking or managing or controlling banks as to be a proper incident thereto. In making such determinations, the Federal Reserve is required to consider whether the performance of such activities by a bank holding company or its subsidiaries can reasonably be expected to produce benefits to the public such as greater convenience, increased competition or gains in efficiency that outweigh possible adverse effects, such as undue concentration of resources, decreased or unfair competition, conflicts of interest or unsound banking practices.
Generally, bank holding companies are required to obtain prior approval of the Federal Reserve to engage in any new activity not previously approved by the Federal Reserve or acquire more than 5% of any class of voting stock of any company. Bank holding companies also must obtain the prior approval of the Federal Reserve before acquiring more than 5% of any class of voting stock of any bank that is not already majority-owned by the bank holding company. Similarly, an entity seeking to acquire more than 5% of the voting securities of a bank holding company such as our company must first receive Federal Reserve approval.
Bank holding companies are required to give the Federal Reserve Board prior written notice of any purchase or redemption of outstanding equity securities if the gross consideration for the purchase or redemption, when combined with the net consideration paid for all such purchases or redemptions during the preceding 12 months, is equal to 10% or more of the holding company’s consolidated net worth. The Federal Reserve Board may disapprove such a purchase or redemption if it determines that the proposal would constitute an unsafe and unsound practice, or would violate any law, regulation, Federal Reserve Board order or directive, or any condition imposed by, or written agreement with, the Federal Reserve Board. Such notice and approval is not required for a bank holding company that would be treated as “well capitalized” under applicable regulations of the Federal Reserve Board, that has received a composite “1” or “2” rating at its most recent bank holding company inspection by the Federal Reserve Board, and that is not the subject of any unresolved supervisory issues.
Bank holding companies are required to serve as a source of financial strength for their depository institution subsidiaries, and, if their depository institution subsidiaries become undercapitalized, bank holding companies may be required to guarantee the subsidiaries’ compliance with capital restoration plans filed with their bank regulators, subject to certain limits.
Bank holding companies must meet minimum capital requirements imposed by the Federal Reserve. These capital requirements generally are the same as those for banks imposed by the FDIC.
Dividends
As a bank holding company that does not, as an entity, currently engage in separate business activities of a material nature, our ability to pay cash dividends depends upon the cash dividends we receive from our subsidiary, North State Bank. At present, our only sources of income are cash dividends paid by the Bank and interest earned on any investment securities we hold. We must pay all of our operating expenses from funds we receive from the Bank. Therefore, shareholders may receive cash dividends from us only to the extent that funds are available after payment of our operating expenses and only in the event that the board decides to declare a dividend. In addition, the Federal Reserve Board generally prohibits bank holding companies from paying cash dividends except out of operating earnings where the prospective rate of earnings retention appears consistent with the bank holding company’s capital needs, asset quality and overall financial condition. To date, we have retained our earnings for use in the development of our business. As a relatively young bank holding company that expects to continue to expand its operations in Wake County, and other markets in North Carolina, we may or may not pay cash dividends on our common stock in the foreseeable future. We might not declare and pay any cash dividends, and if we were to do so, we might not continue to declare them or maintain them at the same
5
level. We expect that, for the foreseeable future, any cash dividends paid by the Bank to us will likely be limited to amounts needed to pay any separate expenses or to make required payments on our debt obligations, including the interest payments on our junior subordinated debt.
Competition
The banking laws of North Carolina allow banks located in North Carolina to develop branches throughout the state. In addition, out-of-state institutions may open branches in North Carolina as well as acquire or merge with institutions located in North Carolina. As a result of such laws, banking in North Carolina is highly competitive.
We have six full-service banking offices located in Wake County and one full-service banking office in Wilmington, New Hanover County. Both of these counties have numerous branches and corporate headquarters of money-center, super-regional, regional and statewide institutions, some of which have a major presence in Raleigh and/or Wilmington. In our market areas, we face competition from other banks, savings and loan associations, savings banks, credit unions, finance companies and major retail stores that offer competing financial services. Many of these competitors have greater resources, broader geographic coverage and higher lending limits than we do. As a result, we focus on our customer relationships to help us provide a competitive advantage in attracting and keeping customers.
Employees
As of December 31, 2007, we had 99 full time employees. We believe that our future success will depend in part on our continued ability to attract, hire, and retain qualified personnel. None of our employees are represented by a labor union. We have not experienced any work stoppages and consider our relations with our employees to be good.
Available Information
Our web site address is www.northstatebank.com. Information on our web site is not incorporated by reference herein. We make available free of charge through our web site our annual report on Form 10-K, quarterly reports on Form 10-Q, current reports on Form 8-K, and all amendments to those reports as soon as reasonably practicable after such material is electronically filed with or furnished to the Securities and Exchange Commission.
Item 1A.Risk Factors
Risks Related to Our Business
We may not be able to maintain and manage our growth, which may adversely affect our results of operations and financial condition and the value of our common stock.
Our strategy has been to increase the size of our company by opening new offices and aggressively pursuing business development opportunities. We have grown rapidly since we began operations. We can provide no assurance that we will continue to be successful in increasing the volume of loans and deposits at acceptable risk levels and upon acceptable terms while managing the costs and implementation risks associated with our growth strategy. There can be no assurance that our further expansion will be profitable or that we will continue to be able to sustain our historical rate of growth, either through internal growth or through expansion in our existing markets or into new markets, or that we will be able to maintain capital sufficient to support our continued growth. If we grow too quickly, however, and are not able to control costs and maintain asset quality, rapid growth also could adversely affect our financial performance. There are considerable costs involved in opening new banking offices. New banking offices generally do not generate sufficient revenues to offset their costs until they have been in operation for at least a year or more. Accordingly, we expect our new banking offices opened in late 2007 and early 2008 to negatively impact our earnings for some period of time until the offices reach economies of scale if ever. Also, we have no assurance these new or any future banking offices will be successful even after they are established.
Interest rate volatility could significantly harm our business.
Our results of operations may be significantly affected by the monetary and fiscal policies of the federal government and the regulatory policies of government authorities. A significant component of our earnings is our net interest income. Net interest income is the difference between income from interest-earning assets, such as loans, and the expense of interest-bearing liabilities, such as deposits and our borrowings. We may not be able to effectively manage changes in what we charge as interest on our earning assets and the expense we must pay on interest-bearing liabilities, which may significantly reduce our earnings. The Federal Reserve has made significant changes in interest rates during the last few years. Since rates charged on loans often tend to react to market
6
conditions faster than do rates paid on deposit accounts, these rate changes, especially decreasing rates, may have a negative impact on our earnings until we can make appropriate adjustments in our deposit rates. Fluctuations in interest rates are not predicable or controllable and therefore there can be no assurances of our ability to continue to maintain a consistent positive spread between the interest earned on our earning assets and the interest paid on our interest-bearing liabilities.
Our profitability depends significantly on economic conditions in our market area.
Our success depends to a large degree on the general economic conditions in Wake and New Hanover Counties and adjoining markets. The local economic conditions in these areas have a significant impact on the amount of loans that we make to our borrowers, the ability of our borrowers to repay these loans and the value of the collateral securing these loans. If the value of real estate in these areas were to decline materially, a significant portion of our loan portfolio could become under collateralized which could have a material adverse effect on us. A significant decline in general economic condition caused by inflation, recession, unemployment or other factors beyond our control would impact these local economic conditions and could negatively affect our financial condition and performance.
The lack of seasoning of our loan portfolio makes it difficult to assess the adequacy of our loan loss reserves accurately.
We attempt to maintain an appropriate allowance for loan losses to provide for probable losses in our loan portfolio. We periodically determine the amount of the allowance based on consideration of several factors, including:
| | • | | Historical loss rates through peer statistics and internal historical data; |
| | • | | Evaluation of general economic factors such as unemployment, inflation and interest rate environment; |
| | • | | Regulatory examination results and asset quality rating; |
| | • | | Regular reviews of loan delinquencies and overall loan portfolio quality; and |
| | • | | the levels of construction, development and non-owner occupied commercial real estate lending amount and quality of collateral, including guarantees, securing the loans and levels of highly leveraged transactions. |
There is no precise method of predicting credit losses, however, since any estimate of loan losses is necessarily subjective and the accuracy depends on the outcome of future events. In addition, due to our rapid growth over the past several years and our limited operating history, a large portion of the loans in our loan portfolio was originated recently. In general, loans do not begin to show signs of credit deterioration or default until they have been outstanding for some period of time, a process referred to as “seasoning.” As a result, a portfolio of older loans will usually perform more predictably than a newer portfolio. Because our loan portfolio is relatively new, the current level of delinquencies and defaults may not be representative of the level that will prevail when the portfolio becomes more seasoned, which may be higher than current levels. If charge-offs in future periods increase, we may be required to increase our provision for loan losses, which would decrease our net income and possibly our capital.
If we experience greater loan losses than anticipated, it would have an adverse effect on our net income.
While the risk of nonpayment of loans is inherent in banking, if we experience greater nonpayment levels than we anticipate, our earnings, would be adversely impacted, which could adversely affect our overall financial condition as well as the value of our common stock. We cannot assure you that our monitoring procedures and policies will reduce certain lending risks or that our allowance for loan losses will be adequate to cover actual losses. In addition, as a result of the rapid growth in our loan portfolio, loan losses may be greater than management’s estimates of the appropriate level for the allowance. Loan losses can cause insolvency and failure of a financial institution and, in such an event, our shareholders could lose their entire investment. In addition, future provisions for loan losses could materially and adversely affect our profitability. Any loan losses will reduce the loan loss allowance. A reduction in the loan loss allowance may require an increase in our provision for loan losses. This would reduce our earnings which could have an adverse effect on our stock price.
Liquidity is essential to our business and we rely, in part, on external sources to finance a significant portion of our operations.
Liquidity is essential to our business. Our liquidity could be substantially negatively affected by our inability to attract sufficient deposits; access secured lending markets, brokered deposit markets or raise funding in the long-term or short-term capital markets. Factors that we cannot control, such as disruption of the financial markets or negative views about the financial services industry generally, could impair our ability to raise funding. In addition, our ability to raise funding could be impaired if the Federal Home Loan Bank or deposit brokers develop a negative perception of our long-term or short-term financial prospects. Such negative
7
perceptions could be developed if we suffer a decline in the level of our business activity, regulatory authorities take significant action against us, or we discover employee misconduct or illegal activity, among other things. If we were unable to raise funds using the methods described above, we would likely need to liquidate unencumbered assets, such as our investment and loan portfolios, to meet maturing liabilities. We may be unable to sell some of our assets, or we may have to sell assets at a discount from market value, either of which could adversely affect our operations.
We rely heavily on the services of key personnel.
Larry D. Barbour, our president and chief executive officer, has substantial experience with our operations and has contributed significantly to our growth since our founding. The loss of the services of Mr. Barbour or of one or more members of our executive management team may have a material adverse effect on our operations. If Mr. Barbour or other members of our executive management team were no longer employed by us, our ability to implement our growth strategy could be impaired.
Our ability to retain and attract qualified employees is critical to the success of our business and the failure to do so may materially adversely affect our performance.
Our people are our most important resource and competition for qualified employees is intense. We may expand our banking network over the next several years, not just in our existing core market areas, but also in other community markets throughout central and eastern North Carolina and other contiguous markets. To expand into new markets successfully, we must identify and retain experienced key management members with local expertise and relationships in these markets. In order to attract and retain qualified employees, we must compensate such employees at market levels. Those levels have caused employee compensation to be our greatest expense as compensation is highly variable and moves with performance. If we are unable to continue to attract and retain qualified employees, or if compensation costs required to attract and retain employees become more expensive, our performance, including our competitive position, could be materially adversely affected.
New or acquired bank office facilities and other facilities may not be profitable.
We may not be able to identify profitable locations for new bank offices. In addition the costs to start up new bank office facilities or to acquire existing bank offices, and the additional costs to operate these facilities, may increase our noninterest expense and decrease earnings in the short term. If offices of other banks become available for sale, we may acquire those offices. It may be difficult to adequately and profitably manage our growth through the establishment or purchase of bank offices. In addition, we can provide no assurance that any such offices will successfully attract enough deposits and other business to offset the expenses of their operation.
We are subject to operational risk and an operational failure could materially adversely affect our businesses.
Operational risk refers to the risk of loss arising from inadequate or failed internal processes, people and/or systems. Operational risk also refers to the risk that external events, such as external changes (e.g., natural disasters, terrorist attacks and/or health epidemics), failures or frauds, will result in losses to our businesses.
Our business is highly dependent on our ability to process, on a daily basis, a large number of transactions and the transactions we process have become increasingly complex. We perform the functions required to operate our business either by ourselves or through agreements with third parties. We rely on the ability of our employees, our internal systems and systems at technology centers operated by third parties to process high numbers of transactions. In the event of a breakdown or improper operation of our or third-party’s systems or improper action by third parties or employees, we could suffer financial loss, an impairment to our liquidity, a disruption of our businesses, regulatory sanctions and damage to our reputation.
In order to be profitable, we must compete successfully with other financial institutions which have greater resources and capabilities than we do.
The banking business in North Carolina in general, and in Wake and New Hanover Counties in particular, in which we operate are extremely competitive. Most of our competitors are larger and have greater resources than we do and have been in existence a longer period of time. We will have to overcome historical bank-customer relationships to attract customers away from our competition. We compete with other commercial banks, savings banks, thrifts, credit unions and securities brokerage firms.
8
Some of our competitors are not regulated as extensively as we are and, therefore, may have greater flexibility in competing for business. Some of these competitors are subject to similar regulation but have the advantages of larger established customer bases, higher lending limits, extensive branch networks, numerous automated teller machines, greater advertising-marketing budgets or other factors.
Our legal lending limit is determined by law and is based on our capital levels. The size of the loans that we offer to our customers may be less than the size of the loans that larger competitors are able to offer. This limit may affect our success in establishing relationships with the larger businesses in our markets.
We are subject to extensive regulation that could limit or restrict our activities.
We operate in a highly regulated industry and are subject to examination, supervision, and comprehensive regulation by the North Carolina Office of the Commissioner of Banks, the FDIC, and the Federal Reserve Board. Our compliance with these regulations is costly and restricts certain of our current and possible future activities, including, investments, loans and interest rates charged, interest rates paid on deposits, locations of offices, payment of cash dividends, and mergers and acquisitions. We must also meet regulatory capital requirements. If we fail to meet these capital and other regulatory requirements, our financial condition, liquidity, and results of operations would be materially and adversely affected. Our failure to remain “well capitalized” and “well managed” for regulatory purposes could affect customer confidence, our ability to grow, the cost of our funds and FDIC insurance, our ability, should we decide, to pay cash dividends on our common stock, and our ability to make acquisitions.
The laws and regulations applicable to the banking industry could change at any time, and we cannot predict the effects of these changes on our business and profitability. For example, new legislation or regulation could limit the manner in which we may conduct our business, including our ability to obtain financing, attract deposits, and make loans. Many of these regulations are intended to protect depositors, the public, and the FDIC, not shareholders. In addition, the burden imposed by these regulations may place us at a competitive disadvantage compared to competitors who are larger or who are less regulated. The laws, regulations, interpretations, and enforcement policies that apply to us have been subject to significant change in recent years, sometimes retroactively applied, and may change significantly in the future. Our cost of compliance could adversely affect our ability to operate profitably.
Our growth may require us to raise additional capital that may not be available when it is needed, or at all.
We are required by regulatory authorities to maintain adequate levels of capital to support our operations. We anticipate that our capital resources will satisfy our capital requirements for the foreseeable future. We may at some point, however, need to raise additional capital to support our continued growth. Our ability to raise additional capital, if needed, will depend in part on conditions in the capital markets at that time, which are outside our control, and on our financial performance. Accordingly, we may be unable to raise additional capital, if and when needed, on terms acceptable to us, or at all. If we cannot raise additional capital when needed, our ability to further expand our operations through internal growth and acquisitions could be materially impaired. In addition, if we issue additional equity capital, the interests of existing shareholders would be diluted.
Investors could lose confidence in our financial reports, and our stock price might be adversely affected, if our internal controls over financial reporting are found not to be effective by management or by an independent registered public accounting firm or if we make disclosure of existing or potential significant deficiencies or material weaknesses in those controls.
As a non-accelerated filer with a fiscal year end of December 31, we had to report our management’s assessment of the effectiveness of our internal controls over financial reporting, as required by Section 404 of the Sarbanes-Oxley Act of 2002, for the first time for our fiscal year ended December 31, 2007. That report is included in this Annual Report on Form 10-K. We must provide our auditor’s attestation of our management’s assessment of the effectiveness of our internal controls over financial reporting for our fiscal year ending December 31, 2008. If our internal controls over financial reporting are found not to be effective by our independent registered public accounting firm or if we make disclosure of existing or potential significant deficiencies or material weaknesses in those controls, investors could lose confidence in our financial reports, and our stock price might be adversely affected. In addition, remedying any deficiencies, significant deficiencies or material weaknesses that we or our independent registered public accounting firm might identify, could require us to incur significant costs and expend significant time and management resources. We cannot assure you that any of the measures we might implement to remedy any such deficiencies would effectively mitigate or remedy such deficiencies.
9
Risks Related to Owning Our Common Stock
We have implemented anti-takeover devices that could make it more difficult for another company to acquire us, even though such an acquisition may increase shareholder value.
If we were to be acquired by another company, our shareholders may receive a premium for their shares. However, provisions in our articles of incorporation and bylaws could make it difficult for anyone to acquire us. Our articles of incorporation require a supermajority vote of two-thirds of our outstanding common stock in order to affect a sale or merger of the company, that has not been approved by our board of directors. Our articles of incorporation also provide for “blank check” preferred stock, which allows our board of directors, without shareholder approval, to issue preferred shares with rights and preferences superior to those of our common stock, including superior rights on voting and to cash dividends and liquidation proceeds. In addition, our articles of incorporation permit our board to consider constituents other than our shareholders in deciding on a merger or sale of the company. These constituents are our employees, depositors, customers, creditors and the communities in which we conduct business. This provision also allows the board to consider the competence, experience and integrity of any proposed acquirer as well as the prospects of success of any merger or sale proposal. All of these provisions may make a merger or sale of our company more difficult or prevent a merger or sale altogether even if the merger or sale is supported by our shareholders and would provide them a premium for their shares.
Our bylaws divide the board of directors into three classes of directors serving staggered three-year terms with approximately one-third of the board of directors elected at each annual meeting of shareholders. The classification of directors makes it more difficult for shareholders to change the composition of the board of directors. As a result, at least two annual meetings of shareholders would be required for the shareholders to change a majority of the directors, whether or not a change in the board of directors would be beneficial and whether or not a majority of shareholders believe that such a change would be desirable. Consequently, a takeover attempt may prove difficult, and shareholders may not realize the highest possible price for their shares.
Our common stock is quoted on the Over-the-Counter Bulletin Board and is not quoted on a stock exchange, the trading volume is low and the sale of a substantial amount of our common stock in the public market could depress the price of our common stock.
Our common stock is not traded on a national stock exchange, such as the NASDAQ. It is only quoted on the Over-the-Counter Bulletin Board. Consequently, our common stock is not as liquid as most stocks traded on an exchange. In addition, the average daily trading volume of our shares as quoted on the Over-the-Counter Bulletin Board for all of 2007 was approximately 1,800 shares, which means our stock is thinly traded. Thinly traded stock can be more volatile than stock trading on an exchange. We cannot predict the extent to which an active public market for our common stock will develop or be sustained. In recent years, the stock market has experienced a high level of price and volume volatility, and market prices for the stock of many companies have experienced wide price fluctuations that have not necessarily been related to their operating performance. Therefore, our shareholders may not be able to sell their shares at the volumes, prices, or times that they desire. We cannot predict the effect, if any, that future sales of our common stock in the market, or availability of shares of our common stock for sale in the market, will have on the market price of our common stock. We therefore can give no assurance that sales of substantial amounts of our common stock in the market, or the potential for large amounts of sales in the market, would not cause the price of our common stock to decline or impair our ability to raise capital through sales of our common stock.
We have never paid cash dividends and may not ever pay cash dividends.
We have never paid cash dividends on our common stock and may never do so. Consequently, any returns on an investment in our common stock in the foreseeable future will have to come from an increase in the value of the stock itself. As noted above, the lack of an active trading market for our common stock could make it difficult to sell shares of our common stock. The payment of cash dividends would be dependent on our operations, capital levels and needs and other factors.
Our securities are not FDIC insured.
Our common stock is not a savings or deposit account or other obligation of the bank, and is not insured by the Federal Deposit Insurance Corporation or any other governmental agency and is subject to investment risk, including the possible loss of principal.
10
The holders of our junior subordinated debentures have rights that are senior to those of our common shareholders.
We have supported our continued growth through the issuance of trust preferred securities from three special purpose trusts and an accompanying sale of $15.5 million junior subordinated debentures to these trusts. Payments of the principal and interest on the preferred securities of the trusts are conditionally guaranteed by us. Further, the accompanying junior subordinated debentures that we issued to the trusts are senior to our shares of common stock. As a result, we must make payments on the junior subordinated debentures before any cash dividends can be paid on our common stock and, in the event of our bankruptcy, dissolution or liquidation, the holder of the junior subordinated debentures must be satisfied before any distributions can be made on our common stock. We have the right to defer distributions on the junior subordinated debentures (and the related trust preferred securities) for up to five years, during which time no cash dividends may be paid on our common stock.
Item 1B.Unresolved Staff Comments
None.
Item 2.Properties.
Our headquarters are located in Raleigh, North Carolina, where we occupy approximately 12,000 square feet of office space in a stand-alone building under a lease extending through March 2015. We have an office and operations center in north Raleigh that consists of approximately 9,773 square feet of office space under a lease extending through April 2017. Beginning in May 2008, we will add another 1,756 square feet under lease in the same building. We own an office in west Raleigh that consists of approximately 10,000 square feet, approximately 5,200 square feet of which we occupy and the remainder of which is vacant. We have an office in Garner, North Carolina, where we own a building that has approximately 5,000 square feet of office space. We own an office in the Wakefield area of Raleigh which has approximately 10,000 square feet of office space. During 2007 we occupied under lease approximately 850 square feet of office space for our loan production office in Wilmington, North Carolina. In January 2008 our Wilmington office became a full service banking office and relocated to a new stand-alone building under lease where we occupy the entire first floor, approximately 9,440 square feet of office space. This lease runs through December 31, 2022. Upon opening of the new office in January 2008, we closed our loan production office in Wilmington. We leased approximately 3,700 square feet of office space in downtown Raleigh beginning in 2006 which we occupied and began operations as a full service banking office in December 2007. This lease runs through October 2011.
Item 3.Legal Proceedings.
From time to time, we are party to various legal proceedings or claims, either asserted or unasserted, which arise in the ordinary course of business. Although the ultimate outcome of these matters is not yet determined, we do not believe that the resolution of these matters will have a material effect upon our financial condition or results of operations in any interim or annual period.
Item 4.Submission of Matters to a Vote of Security Holders.
No matter was submitted to a vote of our shareholders during the fourth quarter of the year ended December 31, 2007.
11
PART II
Item 5. Market for Registrant’s Common Equity, Related Stockholder Matters and Issuer Purchases of Equity Securities.
Stock Information
Our common stock is not traded on any exchange. Our stock is listed on the Over-the-Counter Bulletin Board. Set forth below for each quarter in 2007 and 2006 is information on the high and low bid and asked prices of our common stock as reported on the Over-the-Counter Bulletin Board. Prices have been adjusted for the 3-for-2 stock splits in the second quarter of 2007 and the third quarter of 2006.
| | | | | | |
| | | High | | Low |
Fiscal Year Ended December 31, 2007 | | | | | | |
January 1 through March 31, 2007 | | $ | 17.49 | | $ | 15.70 |
April 1 through June 30, 2007 | | | 17.20 | | | 15.67 |
July 1 through September 30, 2007 | | | 21.75 | | | 16.80 |
October 1 through December 31, 2007 | | | 17.25 | | | 12.00 |
| | |
Fiscal Year Ended December 31, 2006 | | | | | | |
January 1 through March 31, 2006 | | $ | 12.22 | | $ | 9.55 |
April 1 through June 30, 2006 | | | 11.33 | | | 9.78 |
July 1 through September 30, 2006 | | | 14.67 | | | 10.67 |
October 1 through December 31, 2006 | | | 16.66 | | | 14.17 |
As of March 7 2008, there were approximately 601 shareholders of record. We estimate that there were approximately 1,200 beneficial owners on March 7, 2008.
Dividends
To date, we have not paid any cash dividends. Our ability to pay cash dividends is dependent on the earnings of our subsidiary, North State Bank. Pursuant to the order of the North Carolina Commissioner of Banks approving the organization of North State Bank in 2000, North State Bank could not pay cash dividends for its first three years of operation. In the future, we expect that any earnings will be used for the development of our business as we seek to expand our operations in Wake County, North Carolina. Subject to these restrictions, the Board of Directors will consider the payment of cash dividends when it is deemed prudent to do so. Further, our ability to declare and pay cash dividends depends upon, among other things, restrictions imposed by the reserve and capital requirements of North Carolina and federal law, our income and fiscal condition, tax considerations, and general business conditions. Therefore, we may or may not pay cash dividends on our common stock in the foreseeable future, and it is possible we might never pay cash dividends.
On March 17, 2004, our trust subsidiary issued preferred securities in a private placement. On December 15, 2005 and on November 28, 2007, respectively, our second and third trust subsidiaries, respectively, issued preferred securities in a private placement. In each instance, we, in turn, issued unsecured subordinated debentures to each trust to serve as the income source for the trust’s payment of interest on its preferred securities. Pursuant to the terms of the indentures that govern our debentures, we are prohibited from paying cash dividends on our stock in the event we are in default on the terms of the debentures or the indentures.
12
Equity Compensation Plans
Set forth below is information on our equity compensation plans as of December 31, 2007.
| | | | | | |
Plan Category | | Number of securities to be issued upon exercise of
outstanding options,
warrants and rights | | Weighted-average exercise price of
outstanding options,
warrants and rights | | Number of securities remaining available for future issuance under equity compensation plans |
Equity compensation plans approved by our shareholders | | 597,780 | | $4.36 | | 493,586 |
Equity compensation plans not approved by our shareholders | | - | | - | | - |
Total | | 597,780 | | $4.36 | | 493,586 |
Our equity compensation plans consist of the 2000 Stock Option Plan for Employees, the 2000 Stock Option Plan for Non-Employee Directors and the 2003 Stock Plan, all of which were approved by our shareholders. We do not have any equity compensation plans or arrangements that have not been approved by our shareholders.
13
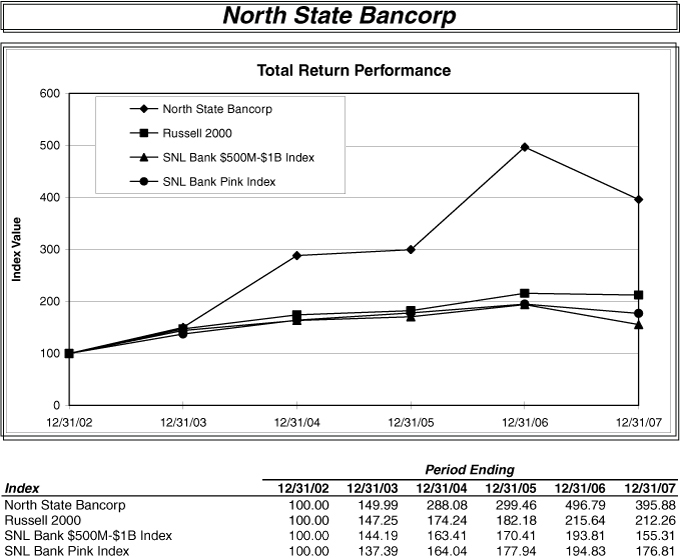
Comparison of Cumulative Total Return
The following graph compares the cumulative total shareholder return on our common stock over the five-year period ended December 31, 2007, with the cumulative total return for the same period on the Russell 2000 Index, the SNL $500M - $1B and SNL Bank Pink Banks Index. The graph assumes that at the beginning of the period indicated $100 was invested in our common stock and the stock of the companies comprising the Russell 2000 Index, the SNL $500M - $1B and SNL Bank Pink Banks Index, and that all dividends, if any, were reinvested. Prices are based on quotations for our common stock on the Over-the-Counter Bulletin Board from May 17 2002, the data on which our common stock was first quoted on the Bulletin Board. Prior to that, prices are based on private trades known to us.
Item 6.Selected Financial Data.
The following table sets forth selected consolidated financial information for our company as of and for the years ended December 31, 2007, 2006, 2005, 2004 and 2003. The data has been derived from our audited consolidated financial statements. The consolidated financial statements as of December 31, 2007 and 2006 and for the years ended December 31, 2007, 2006 and 2005 and the independent registered public accounting firm’s report thereon, are included elsewhere in this report. The following should also be read in conjunction with “Management’s Discussion and Analysis of Financial Condition and Results of Operations” included in Item 7 of this report.
14
| | | | | | | | | | | | | | | | | | | | |
| | | At or for the Year Ended December 31, | |
| | | 2007 | | | 2006 | | | 2005 | | | 2004 | | | 2003 | |
| | | (Dollars in thousands, except per share data) | |
| | | | | |
Operating Data: | | | | | | | | | | | | | | | | | | | | |
Total interest income | | $ | 32,738 | | | $ | 26,412 | | | $ | 18,781 | | | $ | 12,599 | | | $ | 9,213 | |
Total interest expense | | | 15,439 | | | | 11,587 | | | | 6,497 | | | | 4,135 | | | | 3,251 | |
| | | | | | | | | | | | | | | | | | | | |
Net interest income | | | 17,299 | | | | 14,825 | | | | 12,284 | | | | 8,464 | | | | 5,962 | |
Provision for loan losses | | | 1,339 | | | | 69 | | | | 792 | | | | 920 | | | | 690 | |
| | | | | | | | | | | | | | | | | | | | |
Net interest income after provision for loan losses | | | 15,960 | | | | 14,756 | | | | 11,492 | | | | 7,544 | | | | 5,272 | |
Noninterest income | | | 1,121 | | | | 1,174 | | | | 1,310 | | | | 1,034 | | | | 996 | |
Noninterest expense | | | 12,033 | | | | 10,743 | | | | 8,901 | | | | 6,364 | | | | 4,853 | |
| | | | | | | | | | | | | | | | | | | | |
Income before income taxes | | | 5,048 | | | | 5,187 | | | | 3,901 | | | | 2,214 | | | | 1,415 | |
Provision for income taxes | | | 1,953 | | | | 1,915 | | | | 1,463 | | | | 838 | | | | 436 | |
| | | | | | | | | | | | | | | | | | | | |
Net income | | $ | 3,095 | | | $ | 3,272 | | | $ | 2,438 | | | $ | 1,376 | | | $ | 979 | |
| | | | | | | | | | | | | | | | | | | | |
| | | | | |
Per Share Data: (1) | | | | | | | | | | | | | | | | | | | | |
Earnings per share - basic | | $ | 0.45 | | | $ | 0.49 | | | $ | 0.38 | | | $ | 0.22 | | | $ | 0.15 | |
Earnings per share - diluted | | | 0.42 | | | | 0.46 | | | | 0.35 | | | | 0.20 | | | | 0.15 | |
Market price: | | | | | | | | | | | | | | | | | | | | |
High | | | 21.75 | | | | 16.66 | | | | 10.00 | | | | 9.28 | | | | 5.64 | |
Low | | | 12.00 | | | | 9.55 | | | | 5.43 | | | | 4.69 | | | | 2.93 | |
Close | | | 12.75 | | | | 16.00 | | | | 9.64 | | | | 9.28 | | | | 4.83 | |
Book value | | | 4.52 | | | | 3.90 | | | | 3.31 | | | | 2.96 | | | | 2.75 | |
| | | | | |
Weighted average shares outstanding: | | | | | | | | | | | | | | | | | | | | |
Basic | | | 6,917,365 | | | | 6,617,228 | | | | 6,392,127 | | | | 6,379,555 | | | | 6,330,437 | |
Diluted | | | 7,301,377 | | | | 7,162,121 | | | | 6,944,169 | | | | 6,793,980 | | | | 6,584,711 | |
| | | | | |
Selected Year-End Balance Sheet Data: | | | | | | | | | | | | | | | | | | | | |
Total assets | | $ | 547,520 | | | $ | 455,477 | | | $ | 382,438 | | | $ | 309,542 | | | $ | 249,020 | |
Loans | | | 469,228 | | | | 345,943 | | | | 294,175 | | | | 244,620 | | | | 181,532 | |
Allowance for loan losses | | | 5,020 | | | | 3,983 | | | | 3,679 | | | | 3,053 | | | | 2,360 | |
Deposits | | | 457,310 | | | | 402,078 | | | | 337,371 | | | | 269,133 | | | | 208,548 | |
Short-term borrowings | | | 37,886 | | | | 10,670 | | | | 10,006 | | | | 14,273 | | | | 15,911 | |
Long-term debt | | | 16,332 | | | | 11,196 | | | | 11,215 | | | | 5,155 | | | | 6,000 | |
Shareholders’ equity | | | 31,557 | | | | 26,597 | | | | 21,140 | | | | 18,914 | | | | 17,514 | |
| | | | | |
Selected Average Balances: | | | | | | | | | | | | | | | | | | | | |
Total assets | | $ | 472,824 | | | $ | 398,097 | | | $ | 330,922 | | | $ | 271,694 | | | $ | 211,387 | |
Loans | | | 393,927 | | | | 316,620 | | | | 262,962 | | | | 212,127 | | | | 141,224 | |
Total interest-earning assets | | | 454,005 | | | | 382,899 | | | | 318,720 | | | | 261,559 | | | | 200,832 | |
Deposits | | | 412,125 | | | | 349,070 | | | | 293,565 | | | | 230,265 | | | | 179,973 | |
Short-term borrowings | | | 14,681 | | | | 10,784 | | | | 10,003 | | | | 15,699 | | | | 6,992 | |
Long-term debt | | | 11,666 | | | | 11,205 | | | | 5,166 | | | | 6,043 | | | | 6,000 | |
Total interest-bearing liabilities | | | 349,144 | | | | 284,504 | | | | 233,631 | | | | 194,680 | | | | 140,779 | |
Shareholders’ equity | | | 29,219 | | | | 23,944 | | | | 20,017 | | | | 18,338 | | | | 17,389 | |
| | | | | |
Selected Performance Ratios: | | | | | | | | | | | | | | | | | | | | |
Return on average assets | | | 0.65 | % | | | 0.82 | % | | | 0.74 | % | | | 0.51 | % | | | 0.46 | % |
Return on average equity | | | 10.59 | % | | | 13.67 | % | | | 12.18 | % | | | 7.50 | % | | | 5.63 | % |
Net interest spread | | | 2.79 | % | | | 2.83 | % | | | 3.11 | % | | | 2.69 | % | | | 2.33 | % |
Net interest margin | | | 3.81 | % | | | 3.87 | % | | | 3.85 | % | | | 3.24 | % | | | 2.97 | % |
Noninterest income to total revenue | | | 6.09 | % | | | 7.34 | % | | | 9.64 | % | | | 10.89 | % | | | 14.31 | % |
Noninterest income to average assets | | | 0.24 | % | | | 0.29 | % | | | 0.40 | % | | | 0.38 | % | | | 0.47 | % |
Noninterest expense to average assets | | | 2.54 | % | | | 2.70 | % | | | 2.69 | % | | | 2.34 | % | | | 2.30 | % |
Efficiency ratio | | | 65.33 | % | | | 67.15 | % | | | 65.48 | % | | | 67.00 | % | | | 69.75 | % |
| | | | | |
Asset Quality Ratios: | | | | | | | | | | | | | | | | | | | | |
Nonperforming loans to period-end loans | | | 0.66 | % | | | 0.11 | % | | | 0.00 | % | | | 0.11 | % | | | 0.55 | % |
Allowance for loan losses to period-end loans | | | 1.07 | % | | | 1.15 | % | | | 1.25 | % | | | 1.25 | % | | | 1.30 | % |
Ratio of allowance for loan losses to nonperforming loans | | | 1.62 | x | | | 10.03 | x | | | 0.00 | x | | | 11.74 | x | | | 2.36 | x |
Nonperforming assets to total assets | | | 0.57 | % | | | 0.09 | % | | | 0.00 | % | | | 0.25 | % | | | 0.40 | % |
Net loan charge-offs to average loans | | | -0.08 | % | | | 0.07 | % | | | -0.06 | % | | | -0.11 | % | | | -0.12 | % |
15
| | | | | | | | | | | | | | | |
| | | At or for the Year Ended December 31, | |
| | | 2007 | | | 2006 | | | 2005 | | | 2004 | | | 2003 | |
| | | (Dollars in thousands, except per share data) | |
| | | | | |
Capital Ratios (2): | | | | | | | | | | | | | | | |
Total risk-based capital | | 10.32 | % | | 10.21 | % | | 10.30 | % | | 11.01 | % | | 10.85 | % |
Tier 1 risk-based capital | | 9.25 | % | | 9.09 | % | | 9.09 | % | | 9.76 | % | | 9.60 | % |
Leverage ratio | | 8.50 | % | | 7.58 | % | | 7.53 | % | | 7.94 | % | | 7.87 | % |
Equity to assets ratio | | 5.76 | % | | 5.84 | % | | 5.53 | % | | 6.11 | % | | 7.03 | % |
Average equity to average assets | | 6.18 | % | | 6.01 | % | | 6.05 | % | | 6.75 | % | | 8.23 | % |
| | | | | |
Other Data (3)(4): | | | | | | | | | | | | | | | |
Number of banking offices | | 7 | | | 6 | | | 5 | | | 4 | | | 3 | |
Number of full time equivalent employees | | 99 | | | 75 | | | 68 | | | 48 | | | 43 | |
| | (1) | Adjusted for the 3-for-2 stock splits in 2007 and 2006, the 6-for-5 stock split in 2005, the 23-for-20 stock split in 2004 and the 11-for-10 stock split in 2003. |
| | (2) | Capital ratios are for bank only. |
| | (3) | Includes one loan production office for each of the years 2007, 2006, 2005, 2004 and 2003. |
| | (4) | Year 2004 does not include our full-service main banking office in Raleigh that opened in March 2005. |
Item 7. Management’s Discussion and Analysis of Financial Condition and Results of Operations.
NOTE REGARDING FORWARD-LOOKING STATEMENTS
Statements contained in this report, which are not historical facts, are forward-looking statements, as that term is defined in the Private Securities Litigation Reform Act of 1995. Amounts herein could vary as a result of market and other factors. Such forward-looking statements are subject to risks and uncertainties which could cause actual results to differ materially from those currently anticipated due to a number of factors, which include, but are not limited to, factors discussed in documents we file with the U.S. Securities and Exchange Commission from time to time. Such forward-looking statements may be identified by the use of such words as “believe,” “expect,” “anticipate,” “should,” “might,” “planned,” “estimated,” and “potential.” Examples of forward-looking statements include, but are not limited to, estimates with respect to our financial condition, expected or anticipated revenue, results of operations and business that are subject to various factors which could cause actual results to differ materially from these estimates. These factors include, but are not limited to: changes in interest rates; changes in real estate values and real estate markets; our ability to manage growth; substantial changes in financial markets; loss of deposits and loan demand to other savings and financial institutions; general economic conditions; changes in accounting principles, policies, or guidelines; changes in legislation or regulation; and other economic, competitive, governmental, regulatory, and technological factors affecting our operations, pricing, products and services.
Management’s Discussion and Analysis
The following discussion and analysis is presented to assist in understanding our consolidated financial condition and results of operations for the years ended December 31, 2007 and 2006. You should read this discussion and the related financial data in conjunction with our audited consolidated financial statements and the related footnotes, which are included elsewhere in this report. In each of 2007 and 2006, we issued a three-for-two stock split in 2005 we issued a six-for-five stock split, in 2004. We issued a 23-for-20 stock split and in 2003 we issued an 11-for-10 stock split. All references in this report to per share results and weighted average common and potential common shares outstanding have been adjusted for the effects of these stock splits. Because we have no operations and our only significant business is the ownership of North State Bank, the following discussion concerns primarily the business of the Bank. However, for ease of reading and because the financial statements are presented on a consolidated basis, this discussion makes no distinction between our company and our bank unless otherwise noted.
Description of Business
We are a commercial bank holding company that was incorporated on June 5, 2002. We have one subsidiary, North State Bank, which we acquired on June 28, 2002 as part of our bank holding company reorganization. In March 2004, we established a subsidiary trust, North State Statutory Trust I, which we refer to as Trust I, to issue trust preferred securities. In December 2005, we established a second subsidiary trust, North State Statutory Trust II, which we refer to as Trust II and in November 2007 we established a third subsidiary trust, North State Statutory Trust III, which we refer to as Trust III. In October 2007, we acquired approximately 5.6% of Beacon Title Agency, LLC, a title insurance agency. Our only business is the ownership and operation of North State Bank and its three subsidiary trusts and our investment in Beacon Title Agency.
16
North State Bank is a North Carolina chartered banking corporation. The bank, which offers a full array of commercial and retail banking services, opened for business on June 1, 2000. Through the bank, we currently operate six full-service banking offices located in Raleigh and Garner, North Carolina and one loan production office located in Wilmington, North Carolina which began operations as a full-service banking office in January 2008. Our principal customers consist of professional firms, professionals, churches, property management companies and individuals who value a mutually beneficial banking relationship. The bank has a subsidiary, North State Financial Services, Inc., which offers brokerage services.
Financial Condition at December 31, 2007 and 2006
For the year 2007, good balance sheet growth continued with total assets surpassing $500 million during the second quarter 2007. At December 31, 2007, total assets had grown to $547.5 million from $455.5 million at December 31, 2006, an increase of $92.0 million or 20.2%. Our loan portfolio led our asset growth and ended the year 2007 at $469.2 million compared to loans of $345.9 million at December 31, 2006. The strong loan growth was principally funded by deposits, which grew $55.2 million or 13.7% to $457.3 million at December 31, 2007, and short-term borrowings which grew $27.2 million to $37.9 million at December 31, 2007 as well as a decline of $33.1 million or 37.9% to $54.2 million at December 31, 2007 in other earning assets, principally investments and federal funds sold.
All investments are accounted for as available for sale under Financial Accounting Standards Board, or FASB, No. 115 and are presented at their fair market value. The fair market value of the investment securities portfolio at December 31, 2007 was $34.8 million compared to $41.9 million at December 31, 2006 representing a net decrease of $7.1 million or 16.9% as funds from maturing investments were re-deployed into the loan portfolio. The investment portfolio at December 31, 2007 consisted of U.S. Government agency securities, mortgage-backed securities and municipal bonds. The net decrease in the portfolio during 2007 was attributed to an increase in fair value of $524,000 and purchases of $7.2 million offset by decreases in the portfolio of $14.8 million representing principal re-payments and maturities.
Federal Funds sold declined to $18.2 million at December 31, 2007 compared to $44.1 million at December 31, 2006 due to our strong loan growth. Interest-earning deposits held at correspondent banks decreased slightly by $110,000 to $1.1 million at December 31, 2007.
Loan production was up $123.3 million or 35.6% and the loan portfolio ended the year at $469.2 million compared to $345.9 million at December 31, 2006. The loan growth primarily occurred in commercial real estate and construction loans reflecting favorable market conditions in our markets during the year. Our loan production office in Wilmington, which opened in the second quarter of 2006, provided approximately 34% of the growth in loans for the year 2007. Favorable market conditions contributed to the substantial loan growth in this market as well as the experience of two senior commercial lenders who combined have worked and lived in the Wilmington area over 35 years. Our other markets provided favorable but more modest growth for the year. Commercial and real-estate construction loans provided most of the loan growth, increasing $81.4 million and $27.6 million, respectively for the year 2007 compared to December 31, 2006. These loan types represented approximately 88.5% of the loan portfolio at December 31, 2007. Other loans such as 1-4 family real estate mortgages were up $8.1 million and home equity lines of credit were up $5.7 million for the year 2007 compared to December 31, 2006. Installment loans to individuals remained flat for the year 2007. A substantial portion of our loan growth, approximately $82.1 million, occurred during the second half of the year, a time of declining interest rates. The prime interest rate fell from 8.25% at the beginning of the year through mid-September 2007 to 7.25% by year-end 2007. As of December 31, 2007, approximately 35.6% of our loans have variable interest rates that change with market conditions.
The allowance for loan losses was $5.0 million at December 31, 2007 compared to $4.0 million at December 31, 2006 representing 1.07% and 1.15% respectively, of loans outstanding at each date. The decrease in the level of the allowance relative to gross loans to 1.07% at December 31, 2007 resulted from the decrease in the actual impairment allocated to specific loans. Although impaired loans increased, the actual impairment decreased from $534,000 to $472,000, representing six basis points of the total eight basis point decrease in the allowance as a percentage of total loans outstanding. The allowance for loan losses is maintained at a level management considers adequate to provide for probable loan losses based on our assessment of our loan portfolio at December 31, 2007.
Our premises and equipment grew $2.7 million during 2007 primarily due to the addition of a new full service office in downtown Raleigh which opened in December 2007, our new full service banking office in Wilmington which opened in January 2008 and also for the May 2007 purchase of 1.73 acres of land for $2.2 million to build a new banking office at our 6200 Falls of Neuse Road location. Construction for the proposed multi-story full-service banking office is expected to begin in the second quarter of 2008. Other assets grew slightly, up approximately $962,000 over December 31, 2006 primarily reflecting additional purchases of FHLB stock as our short-term borrowings increased.
A key source of funding for our loan growth during the year 2007 was deposits, increasing overall $55.2 million to $457.3 million at December 31, 2007.
17
Interest-bearing transaction accounts which are savings, money market and interest checking accounts, continued to be the largest type of deposit accounts, totaling $199.5 million, which represented 43.6% of total deposits outstanding at December 31, 2007, an increase of $45.1 million or 29.2% over December 31, 2006. Continued growth in these deposits is a result of our efforts to emphasize relationship banking with our customers. For the year, time deposits grew to $163.0 million at December 31, 2007, a $20.6 million or 14.4% increase over $142.5 million at December 31, 2006. Time deposit growth accelerated during the last quarter of 2007, increasing approximately $23.1 million during the last three months of 2007; $10.0 million of the increase was in wholesale brokered certificates of deposit, which were used to fund our loan growth. The bank had no wholesale brokered certificates of deposit at December 31, 2006. Our significant loan demand during 2007 necessitated our supporting our local deposit funds by acquiring wholesale brokered deposits outside our market area. Demand deposit levels declined by $10.4 million for the year, ending the year at $94.8 million or 20.7 % of total deposits at December 31, 2007 compared to 26.2% of total deposits at December 31, 2006. The implementation of a new technology in early 2007 to expedite the deposit clearing process, referred to as Check 21, contributed to the decline in these demand deposits. The new Check 21 process clears deposits electronically resulting in a much quicker clearing of the check items and thereby reducing the levels of our demand deposits. In addition, since June 2007, the decline in these core, low-cost demand deposits reflects the slow down in real-estate closings due to an easing of property sales with our attorney customers.
As noted above, our significant loan growth out-paced our deposit growth the second half of the year and necessitated increasing our short-term borrowings by $27.2 million to $37.9 million at December 31, 2007. Other short-term borrowings at December 31, 2007 included FHLB advances of $14.0 million and securities sold under repurchase agreement and Federal Funds purchased from correspondent banks of $23.9 million. Short-term borrowings were $10.7 million at December 31, 2006.
Long-term debt increased by 45.9% from $11.2 million at December 31, 2006 to $16.3 million at December 31, 2007. During November 2007, we issued $5.2 million of junior subordinated debentures to Trust III in exchange for the proceeds of trust preferred securities issued by Trust III. At December 31, 2007, we had $867,000 in long-term FHLB advances and $15.5 million in junior subordinated debentures.
Total shareholders’ equity increased $5.0 million or 18.7% from $26.6 million at December 31, 2006 to $31.6 million at December 31, 2007. The increase was provided by net income of $3.1 million and the conversion of 131,982 stock options held by directors and employees into common stock. The exercise of these options contributed $956,000 to our total shareholders’ equity while stock based compensation added $109,000. Other comprehensive income components increased shareholders’ equity at December 31, 2007 by $800,000.
Investments
Our investment portfolio primarily consists of U.S. Government agency securities, including mortgage-backed securities, or MBSs. The MBSs consist of fixed rate mortgage securities underwritten and guaranteed by Ginnie Mae (GNMA), Freddie Mac (FHLMC) and Fannie Mae (FNMA). All of the securities held in our investment portfolio are available for sale. In addition to economic and market conditions, our overall management strategy for our investment portfolio is determined by, among other factors, loan demand, deposit mix, liquidity and collateral needs, our interest rate risk position and the overall structure of our balance sheet.
Available for sale securities are reported at fair value and consist of debt instruments not classified as trading securities or as held to maturity securities. Unrealized holding gains and losses on available for sale securities are reported, net of related tax effect, in other comprehensive income. Gains and losses on the sale of available for sale securities are determined using the specific-identification method. Declines in the fair value of available for sale securities below their cost that are other than temporary would result in write-downs of the individual securities to their fair value. Such write-downs would be included in earnings as realized losses. Premiums and discounts are recognized in interest income using the interest method over the period to maturity. The tables below present information on our investment portfolio at the dates indicated.
18
| | | | | | | | | | | | |
| | | At December 31, 2007 |
| | | Amortized
cost | | Gross
unrealized
gains | | Gross
unrealized
losses | | Fair
value |
Securities available for sale: | | | (Dollars in thousands) |
U. S. government securities and obligations of U.S. governmental agencies | | $ | 9,232 | | $ | 133 | | $ | 1 | | $ | 9,364 |
State and municipal securities | | | 5,993 | | | 2 | | | 25 | | | 5,970 |
Mortgage-backed securities | | | 19,503 | | | 118 | | | 112 | | | 19,509 |
| | | | | | | | | | | | |
Total securities available for sale | | $ | 34,728 | | $ | 253 | | $ | 138 | | $ | 34,843 |
| | | | | | | | | | | | |
| |
| | | At December 31, 2006 |
| | | Amortized
cost | | Gross
unrealized
gains | | Gross
unrealized
losses | | Fair
value |
Securities available for sale: | | | (Dollars in thousands) |
U. S. government securities and obligations of U.S. governmental agencies | | $ | 11,991 | | $ | 9 | | $ | 57 | | $ | 11,943 |
State and municipal securities | | | 6,110 | | | - | | | 34 | | | 6,076 |
Mortgage-backed securities | | | 24,240 | | | 11 | | | 338 | | | 23,913 |
| | | | | | | | | | | | |
Total securities available for sale | | $ | 42,341 | | $ | 20 | | $ | 429 | | $ | 41,932 |
| | | | | | | | | | | | |
| |
| | | At December 31, 2005 |
| | | Amortized
cost | | Gross
unrealized
gains | | Gross
unrealized
losses | | Fair
value |
Securities available for sale: | | | (Dollars in thousands) |
U. S. government securities and obligations of U.S. governmental agencies | | $ | 13,990 | | $ | - | | $ | 145 | | $ | 13,845 |
State and municipal securities | | | 6,231 | | | - | | | 72 | | | 6,159 |
Mortgage-backed securities | | | 22,169 | | | 9 | | | 480 | | | 21,698 |
| | | | | | | | | | | | |
Total securities available for sale | | $ | 42,390 | | $ | 9 | | $ | 697 | | $ | 41,702 |
| | | | | | | | | | | | |
The amortized cost, fair value and weighted average yield of securities available for sale at December 31, 2007 by contractual maturity are shown below. Expected maturities will differ from contractual maturities because borrowers may have the right to call or prepay obligations with or without call or prepayment penalties.
19
| | | | | | | | | |
| | | As of December 31, 2007 | |
| | | Amortized
Cost | | Fair
Value | | Weighted
Average
Yield | |
| | | (Dollars in thousands) | |
Securities available for sale: | | | | | | | | | |
U. S. Government agencies | | | | | | | | | |
Due within one year | | $ | 4,008 | | $ | 4,016 | | 4.64 | % |
Due after one but within five years | | | 5,224 | | | 5,348 | | 4.99 | % |
Due after five but within ten years | | | - | | | - | | - | |
Due after ten years | | | - | | | - | | - | |
| | | | | | | | | |
| | | 9,232 | | | 9,364 | | 4.83 | % |
| | | | | | | | | |
| | | |
State and local governments | | | | | | | | | |
Due within one year | | | - | | | - | | - | |
Due after one but within five years | | | 1,007 | | | 1,005 | | 4.42 | % |
Due after five but within ten years | | | - | | | - | | - | |
Due after ten years | | | 4,986 | | | 4,965 | | 5.51 | % |
| | | | | | | | | |
| | | 5,993 | | | 5,970 | | 5.33 | % |
| | | | | | | | | |
| | | |
Mortgage-backed securities | | | | | | | | | |
Due within one year | | | - | | | - | | - | |
Due after one but within five years | | | 2,000 | | | 1,994 | | 4.30 | % |
Due after five but within ten years | | | 4,442 | | | 4,459 | | 5.18 | % |
Due after ten years | | | 13,061 | | | 13,056 | | 4.65 | % |
| | | | | | | | | |
| | | 19,503 | | | 19,509 | | 4.74 | % |
| | | | | | | | | |
| | | |
Total Securities available for sale: | | | | | | | | | |
Due within one year | | $ | 4,008 | | $ | 4,016 | | 4.64 | % |
Due after one but within five years | | | 8,231 | | | 8,347 | | 4.75 | % |
Due after five but within ten years | | | 4,442 | | | 4,459 | | 5.18 | % |
Due after ten years | | | 18,047 | | | 18,021 | | 4.89 | % |
| | | | | | | | | |
| | $ | 34,728 | | $ | 34,843 | | 4.86 | % |
| | | | | | | | | |
Loan Portfolio
Our loan policies and procedures establish the basic guidelines governing lending operations. Generally, the guidelines address the type of loans that we seek, target markets, underwriting and collateral requirements, terms, interest rate and yield considerations and compliance with laws and regulations. The policies are reviewed and approved at least annually by the board of directors. Responsibility for loan review, underwriting, compliance and document monitoring resides with the chief credit officer. He is responsible for loan processing and approval. All loans and credit lines are subject to approval procedures and amount limitations. Depending upon the loan requested, approval may be granted by the individual loan officer, our credit administration officers or, for the largest relationships, the directors’ loan committee. Any loan exposure in the aggregate greater than $3 million requires the approval of the director’s loan committee. All individual loan authorities are reviewed and approved annually by the directors’ loan committee and ratified by the board of directors.
We make loans primarily to professional firms, professionals, property management companies, churches and individuals. These loans consist of commercial and consumer real estate loans, business loans and loans to individuals. Our total loan portfolio grew by $123.3 million or 35.6% between December 31, 2006 and December 31, 2007. This growth is attributable to our focus on relationship banking, our experienced loan officers and the vibrant markets in the Wake County and New Hanover County areas. Loan growth has been particularly strong in the New Hanover County market throughout 2007, with loan growth of approximately $42.2 million from this market area in 2007, which is a result of a full year’s production from our loan production office in Wilmington, which opened in the second quarter of 2006. Our Wilmington loan production office provided approximately 34% of the growth in our loan portfolio for the year.
20
Real estate construction and land development loans comprised 20.2% and real estate loans secured by one-to-four family residential properties comprised 6.3% of our total loan portfolio at December 31, 2007. These loans increased $35.7 million or 28.7% for the year 2007 compared to December 31, 2006. Other commercial loans secured by real estate comprised 68.2% of our total loan portfolio, down slightly from 69.0% at December 31, 2006 and are principally secured by owner-occupied buildings including professional practices, office, flex, retail and church properties. Properties securing these loans are located primarily within our markets of Wake and New Hanover County, North Carolina. These loans typically have interest rates that are initially fixed for one to seven years with the remainder of the loan term subject to repricing. As of December 31, 2007, approximately 35.6% of our loan portfolio was subject to repricing based on variable interest rates compared to 37.2% at December 31, 2006.
Home equity loans, the predominant type of consumer loan in our portfolio, increased $5.7 million over December 31, 2006 and comprised 4.3% of our total loan portfolio. These loans are typically secured by the primary residence of the borrower and the combined loan-to-value ratio is usually 90% or less.
While we originate mortgage loans, we do not retain them in our portfolio. We do not service loans for other financial institutions. We do not engage in sub-prime mortgage lending. We have no foreign loans and we do not engage in lease financing or highly leveraged transactions.
The table below present’s information on our loan portfolio by major category at the dates indicated.
| | | | | | | | | | | | | | | | | | | | | | | | | | | | | | | | | | | |
| | | At December 31, | |
| | | 2007 | | | 2006 | | | 2005 | | | 2004 | | | 2003 | |
| | | Amount | | | % of
Total
Loans | | | Amount | | | % of
Total
Loans | | | Amount | | | % of
Total
Loans | | | Amount | | | % of
Total
Loans | | | Amount | | | % of
Total
Loans | |
| | | (Dollars in thousands) | |
| | | | | | | | | | |
Commercial | | $ | 320,386 | | | 68.22 | % | | $ | 239,014 | | | 69.04 | % | | $ | 200,950 | | | 68.25 | % | | $ | 174,107 | | | 71.12 | % | | $ | 137,385 | | | 75.64 | % |
Real estate - construction | | | 95,033 | | | 20.24 | % | | | 67,404 | | | 19.47 | % | | | 56,586 | | | 19.22 | % | | | 35,987 | | | 14.70 | % | | | 19,162 | | | 10.55 | % |
Real estate - 1 to 4 family mortgage | | | 29,534 | | | 6.29 | % | | | 21,438 | | | 6.19 | % | | | 19,222 | | | 6.53 | % | | | 19,170 | | | 7.83 | % | | | 12,392 | | | 6.82 | % |
Loans to individuals | | | 4,065 | | | 0.87 | % | | | 3,414 | | | 0.99 | % | | | 2,933 | | | 1.00 | % | | | 2,359 | | | 0.96 | % | | | 1,897 | | | 1.04 | % |
Home equity lines of credit | | | 20,592 | | | 4.38 | % | | | 14,933 | | | 4.31 | % | | | 14,732 | | | 5.00 | % | | | 13,189 | | | 5.39 | % | | | 10,807 | | | 5.95 | % |
| | | | | | | | | | | | | | | | | | | | | | | | | | | | | | | | | | | |
Subtotal | | | 469,610 | | | 100.00 | % | | | 346,203 | | | 100.00 | % | | | 294,423 | | | 100.00 | % | | | 244,812 | | | 100.00 | % | | | 181,643 | | | 100.00 | % |
| | | | | | | | | | |
Unamortized net deferred loan fees | | | (382 | ) | | | | | | (260 | ) | | | | | | (248 | ) | | | | | | (192 | ) | | | | | | (111 | ) | | | |
| | | | | | | | | | | | | | | | | | | | | | | | | | | | | | | | | | | |
| | | | | | | | | | |
Total loans | | $ | 469,228 | | | | | | $ | 345,943 | | | | | | $ | 294,175 | | | | | | $ | 244,620 | | | | | | $ | 181,532 | | | | |
| | | | | | | | | | | | | | | | | | | | | | | | | | | | | | | | | | | |
21
The table below presents as of December 31, 2007 (i) the aggregate maturities of loans in the named categories of our loan portfolio and (ii) the aggregate amounts of such loans, by variable and fixed rates.
| | | | | | | | | | | | | | | | | | | | | | | | |
| | | At December 31, 2007 | |
| | | Due within
one year | | | Due after one
year but within 5 | | | Due after
five years | | | Total | |
| | | Amount | | Yield | | | Amount | | Yield | | | Amount | | Yield | | | Amount | | Yield | |
| | | (Dollars in thousands) | |
Variable rate loans: | | | | | | | | | | | | | | | | | | | | | | | | |
Real estate - construction | | $ | 38,436 | | 9.65 | % | | $ | 5,062 | | 7.31 | % | | $ | 12,749 | | 7.20 | % | | $ | 56,247 | | 8.88 | % |
Commercial and industrial loans | | | 62,875 | | 8.50 | % | | | 22,622 | | 7.81 | % | | | 4,401 | | 7.05 | % | | | 89,898 | | 8.26 | % |
Installment loans | | | 94 | | 9.16 | % | | | - | | 0.00 | % | | | - | | 0.00 | % | | | 94 | | 9.16 | % |
Equity Lines | | | 3,746 | | 8.55 | % | | | 16,554 | | 8.25 | % | | | 326 | | 8.44 | % | | | 20,626 | | 8.31 | % |
| | | | | | | | | | | | | | | | | | | | | | | | |
| | | | | | | | |
Total at variable rates | | | 105,151 | | 8.92 | % | | | 44,238 | | 7.92 | % | | | 17,476 | | 7.19 | % | | | 166,865 | | 8.47 | % |
| | | | | | | | | | | | | | | | | | | | | | | | |
| | | | | | | | |
Fixed rate loans: | | | | | | | | | | | | | | | | | | | | | | | | |
Real estate - construction | | | 16,888 | | 7.27 | % | | | 9,810 | | 6.63 | % | | | 11,814 | | 6.38 | % | | | 38,512 | | 6.83 | % |
Real estate - 1 to 4 family mortgage | | | 16,230 | | 6.97 | % | | | 9,128 | | 6.59 | % | | | 4,147 | | 5.92 | % | | | 29,505 | | 6.70 | % |
Commercial and industrial loans | | | 66,285 | | 7.12 | % | | | 112,313 | | 7.05 | % | | | 48,665 | | 4.93 | % | | | 227,263 | | 6.62 | % |
Installment loans | | | 2,373 | | 7.43 | % | | | 1,157 | | 7.27 | % | | | 450 | | 16.83 | % | | | 3,980 | | 8.45 | % |
| | | | | | | | | | | | | | | | | | | | | | | | |
| | | | | | | | |
Total at fixed rates | | | 101,776 | | 7.13 | % | | | 132,408 | | 6.99 | % | | | 65,076 | | 5.34 | % | | | 299,260 | | 6.68 | % |
| | | | | | | | | | | | | | | | | | | | | | | | |
| | | | | | | | |
Subtotal | | | 206,927 | | 8.04 | % | | | 176,646 | | 7.22 | % | | | 82,552 | | 5.73 | % | | | 466,125 | | 7.32 | % |
| | | | | | | | |
Nonaccrual loans | | | 467 | | | | | | 2,636 | | | | | | - | | | | | | 3,103 | | | |
| | | | | | | | | | | | | | | | | | | | | | | | |
| | | | | | | | |
Loans, gross | | $ | 207,394 | | | | | $ | 179,282 | | | | | $ | 82,552 | | | | | $ | 469,228 | | | |
| | | | | | | | | | | | | | | | | | | | | | | | |
The above table is based on contractual scheduled maturities. Early repayment of loans or renewals at maturity is not considered in this table. Demand loans and loans having no stated schedule of repayments and no stated maturity are reported as due in one year or less.
Asset Quality and the Allowance for Loan Losses
We prepare our consolidated financial statements on the accrual basis of accounting, including the recognition of interest income on our loan portfolio, unless a loan is placed on a non-accrual basis. We place loans on a non-accrual basis when in management’s opinion, the borrower may be unable to meet payments as they become due. Amounts received on non-accrual loans generally are applied first to principal and then to interest only after all principal has been collected. Restructured loans are those for which concessions, including the reduction of interest rates below a rate otherwise available to that borrower or the deferral of interest or principal have been granted due to the borrower’s weakened financial condition. Interest on restructured loans is accrued at the restructured rates when it is anticipated that no loss of original principal will occur. At December 31, 2007, we had $3.1 million in non-accrual loans, $492,000 in accruing loans that were past due 90 days or more and no restructured loans. At December 31, 2007, other impaired loans of $327,000, all of which were on accrual status, consisted of one loan that was performing in accordance with its original terms and not past due, and two loans that were past due 30-89 days. Impaired loans during the fourth quarter of 2007 increased primarily due to one relationship representing $2.8 million or 72.4% of total impaired loans at December 31, 2007. The loans were secured by real estate, equipment and life insurance. Other impaired loans at December 31, 2006, consisted of one loan of $242,000 that was performing in accordance with its original terms and not in non-accrual and not past due.
22
The table below sets forth for the dates indicated information about our non-performing assets.
| | | | | | | | | | | | | | | | | | | | |
| | | At December 31, | |
| | | 2007 | | | 2006 | | | 2005 | | | 2004 | | | 2003 | |
| | | (Dollars in thousands) | |
| | | | | |
Nonaccrual loans | | $ | 3,103 | | | $ | 397 | | | $ | - | | | $ | 260 | | | $ | 1,002 | |
Restructured loans | | | - | | | | - | | | | - | | | | - | | | | - | |
| | | | | | | | | | | | | | | | | | | | |
Total nonperforming loans | | | 3,103 | | | | 397 | | | | - | | | | 260 | | | | 1,002 | |
Other real estate owned | | | - | | | | - | | | | - | | | | 520 | | | | - | |
| | | | | | | | | | | | | | | | | | | | |
Total nonperforming assets | | $ | 3,103 | | | $ | 397 | | | $ | - | | | $ | 780 | | | $ | 1,002 | |
| | | | | | | | | | | | | | | | | | | | |
Accruing loans past due ninety days or more | | $ | 492 | | | $ | - | | | $ | - | | | $ | 46 | | | $ | - | |
Other impaired loans (1) | | $ | 327 | | | $ | 242 | | | $ | - | | | $ | - | | | $ | - | |
Allowance for loan losses | | $ | 5,020 | | | $ | 3,983 | | | $ | 3,679 | | | $ | 3,053 | | | $ | 2,360 | |
Nonperforming loans to period end loans | | | 0.66 | % | | | 0.11 | % | | | 0.00 | % | | | 0.11 | % | | | 0.55 | % |
Allowance for loan losses to period end loans | | | 1.07 | % | | | 1.15 | % | | | 1.25 | % | | | 1.25 | % | | | 1.30 | % |
Nonperforming assets to loans and other real estate | | | 0.66 | % | | | 0.11 | % | | | 0.00 | % | | | 0.32 | % | | | 0.55 | % |
Nonperforming assets to total assets | | | 0.57 | % | | | 0.09 | % | | | 0.00 | % | | | 0.25 | % | | | 0.40 | % |
Ratio of allowance for loan losses to nonperforming loans | | | 1.62 | x | | | 10.03 | x | | | - | x | | | 11.74 | x | | | 2.36 | x |
(1) Other impaired loans consists of one loan that was performing and not past due as of December 31, 2007, and two loans that were past due 30-89 days , however, subsequently brought current. Other impaired loans as of December 31 2006 consisted of one loan that was performing and not past due.
Our allowance for loan losses is maintained at a level that our management considers adequate to provide for probable loan losses based on our assessment of various factors affecting our loan portfolio, including a review of problem loans, business conditions and loss experience and an overall evaluation of the quality of the underlying collateral. The allowance is increased by provisions charged to operations and reduced by loans charged off, net of recoveries. At December 31, 2007, our allowance as a percentage of loans was 1.07%, down from 1.15% at December 31, 2006. The decrease in the level of the allowance relative to gross loans resulted from the decrease in the actual impairment allocated to specific loans. Although impaired loans increased, the actual impairment decreased from $534,000 at December 31, 2006 to $472,000 at December 31, 2007, representing six basis points of the total eight basis point decrease in the allowance as a percentage of total loans outstanding. Once a loan is considered impaired, it is not included in the determination of the FAS 5 component of the allowance.
Management evaluates the adequacy of our allowance for loan losses on a monthly basis and on a quarterly basis, our directors review management’s evaluation of the allowance for loan losses. Management re-evaluated and implemented improvements to its model and methodology used to estimate the allowance for loan losses during 2006. In evaluating the allowance for loan losses, on a monthly basis we prepare an analysis of our current loan portfolio using historical loss rates, peer statistics and data from our portfolio. The bank utilizes a system of nine possible risk ratings. The risk ratings are established based on perceived probability of loss. All loans risk rated “doubtful” and “loss” are removed from their homogeneous group and individually analyzed for impairment as detailed in FAS 114. Other groups of loans based on loan size may be selected for impairment review. For loans determined to be impaired, the specific allowance is based on the present value of expected cash flows or the fair value of the collateral or the loan’s observable market price. The bank has identified seven qualitative factors that are considered indicators of changes in the level of risk of loss inherent in the bank’s loan portfolio. These factors include and consider the risk of payment performance, overall portfolio quality (utilizing weighted average risk rating), general economic factors such as unemployment, inflation, delinquency and charge-off rates, regulatory examination results, interest rate environment, levels of highly leveraged transactions (as defined in Section 365.2 of the FDIC regulations) and levels of construction, development and non-owner occupied commercial real estate lending. These factors are examined for trends and the risk that they represent to our loan portfolio. Each of these factors is assigned a level of risk and this risk factor is applied to only the FAS 5 pool of loans to calculate the appropriate allowance. Using the data gathered during this monthly evaluation process, the model calculates an estimated reserve amount.
23
While we believe that our management uses the best information available to determine the allowance for loan losses, unforeseen market conditions could result in adjustments to the allowance for loan losses, and net income could be significantly affected, if circumstances differ substantially from the assumptions used in making the final determination. Because these factors and management’s assumptions are subject to change, the allocation is not necessarily indicative of future loan portfolio performance. Also, as an important component of their periodic examination process, regulatory agencies review our allowance for loan losses and may require additional provisions for estimated losses based on judgments that differ from those of management. Additional information regarding our allowance for loan losses and loan loss experience is presented in Note E to our consolidated financial statements included in this report.
The table below provides information on our allocation of our allowance for loan losses among various loan categories at the dates presented.
| | | | | | | | | | | | | | | | | | | | | | | | | | | | | | |
| | | At December 31, | |
| | | 2007 | | | 2006 | | | 2005 | | | 2004 | | | 2003 | |
| | | Amount | | % of Total
Loans (1) | | | Amount | | % of Total
Loans (1) | | | Amount | | % of Total
Loans (1) | | | Amount | | % of Total
Loans (1) | | | Amount | | % of Total
Loans (1) | |
| | | (Dollars in thousands) | |
Real estate loans: | | | | | | | | | | | | | | | | | | | | | | | | | | | | | | |
Commercial | | $ | 3,425 | | 68.22 | % | | $ | 2,750 | | 69.04 | % | | $ | 1,565 | | 68.25 | % | | $ | 2,041 | | 71.12 | % | | $ | 1,794 | | 75.64 | % |
Real estate - construction | | | 1,016 | | 20.24 | % | | | 775 | | 19.47 | % | | | 748 | | 19.22 | % | | | 422 | | 14.70 | % | | | 259 | | 10.55 | % |
Real estate - 1 to 4 family | | | 316 | | 6.29 | % | | | 247 | | 6.19 | % | | | 502 | | 6.53 | % | | | 225 | | 7.83 | % | | | 71 | | 6.82 | % |
Loans to individuals | | | 43 | | 0.87 | % | | | 39 | | 0.99 | % | | | 12 | | 1.00 | % | | | 27 | | 0.96 | % | | | 22 | | 1.04 | % |
Home equity lines of credit | | | 220 | | 4.38 | % | | | 172 | | 4.31 | % | | | 197 | | 5.00 | % | | | 155 | | 5.39 | % | | | 71 | | 5.95 | % |
| | | | | | | | | | | | | | | | | | | | | | | | | | | | | | |
| | | | | | | | | | |
Total allocated | | | 5,020 | | 100.00 | % | | | 3,983 | | 100.00 | % | | | 3,024 | | 100.00 | % | | | 2,870 | | 100.00 | % | | | 2,217 | | 100.00 | % |
| | | | | | | | | | |
Unallocated | | | 0 | | | | | | 0 | | | | | | 655 | | | | | | 183 | | | | | | 143 | | | |
| | | | | | | | | | | | | | | | | | | | | | | | | | | | | | |
Total | | $ | 5,020 | | | | | $ | 3,983 | | | | | $ | 3,679 | | | | | $ | 3,053 | | | | | $ | 2,360 | | | |
| | | | | | | | | | | | | | | | | | | | | | | | | | | | | | |
(1) Represents total of all outstanding loans in each category as a percent of total loans outstanding
The table below present’s information regarding the changes in our allowance for loan losses at or for the years indicated.
| | | | | | | | | | | | | | | | | | | | |
| | | At or for the Year Ended December 31, | |
| | | 2007 | | | 2006 | | | 2005 | | | 2004 | | | 2003 | |
| | | (Dollars in thousands) | |
| | | | | |
Loan outstanding at the end of the year | | $ | 469,228 | | | $ | 345,943 | | | $ | 294,175 | | | $ | 244,620 | | | $ | 181,532 | |
| | | | | | | | | | | | | | | | | | | | |
Average loans outstanding during the year | | $ | 393,927 | | | $ | 316,620 | | | $ | 262,962 | | | $ | 212,127 | | | $ | 141,224 | |
| | | | | | | | | | | | | | | | | | | | |
Allowance for loan losses at beginning of year | | $ | 3,983 | | | $ | 3,679 | | | $ | 3,053 | | | $ | 2,360 | | | $ | 1,845 | |
Provision for loan losses | | | 1,339 | | | | 69 | | | | 792 | | | | 920 | | | | 690 | |
| | | | | | | | | | | | | | | | | | | | |
| | | 5,322 | | | | 3,748 | | | | 3,845 | | | | 3,280 | | | | 2,535 | |
| | | | | | | | | | | | | | | | | | | | |
Loans charged off: | | | | | | | | | | | | | | | | | | | | |
Real estate loans | | | - | | | | - | | | | (32 | ) | | | (82 | ) | | | (171 | ) |
Commercial and industrial loans | | | (299 | ) | | | - | | | | (169 | ) | | | (183 | ) | | | (4 | ) |
Installment loans | | | (3 | ) | | | (5 | ) | | | (5 | ) | | | (13 | ) | | | - | |
| | | | | | | | | | | | | | | | | | | | |
Total charge-offs | | | (302 | ) | | | (5 | ) | | | (206 | ) | | | (278 | ) | | | (175 | ) |
| | | | | | | | | | | | | | | | | | | | |
| | | | | |
Recoveries of loans previously charged off: | | | | | | | | | | | | | | | | | | | | |
Real estate loans | | | - | | | | 230 | | | | 9 | | | | - | | | | - | |
Commercial and industrial loans | | | - | | | | 2 | | | | 22 | | | | 50 | | | | - | |
Installment loans | | | - | | | | 8 | | | | 9 | | | | 1 | | | | - | |
| | | | | | | | | | | | | | | | | | | | |
Total recoveries | | | - | | | | 240 | | | | 40 | | | | 51 | | | | - | |
| | | | | | | | | | | | | | | | | | | | |
| | | | | |
Net recoveries/(charge-offs) | | | (302 | ) | | | 235 | | | | (166 | ) | | | (227 | ) | | | (175 | ) |
| | | | | | | | | | | | | | | | | | | | |
| | | | | |
Allowance for loan losses at end of year | | $ | 5,020 | | | $ | 3,983 | | | $ | 3,679 | | | $ | 3,053 | | | $ | 2,360 | |
| | | | | | | | | | | | | | | | | | | | |
| | | | | |
Ratios: | | | | | | | | | | | | | | | | | | | | |
Nonperforming loans to period-end loans | | | 0.66 | % | | | 0.11 | % | | | 0.00 | % | | | 0.11 | % | | | 0.55 | % |
Allowance for loan losses as a percent of loans at end of year | | | 1.07 | % | | | 1.15 | % | | | 1.25 | % | | | 1.25 | % | | | 1.30 | % |
Net recoveries (charge-offs) as a percent of average loans | | | (0.08 | %) | | | 0.07 | % | | | (0.06 | %) | | | (0.11 | %) | | | (0.12 | %) |
24
Deposits
Our deposits are the primary source of our funds for loans. Our deposit strategy is to raise our deposits in our market areas through relationship banking. We believe that the great majority of our deposits are from individuals and entities located in our market areas. However, strong loan growth during the year 2007 outpaced our growth in deposits which necessitated $10.0 million in wholesale brokered certificate of deposit funds during the last quarter of 2007. The bank had no wholesale brokered certificates of deposit at December 31, 2006.
The table below present’s information on our average deposits for the years presented.
| | | | | | | | | | | | | | | | | | |
| | | For the Year Ended December 31, | |
| | | 2007 | | | 2006 | | | 2005 | |
| | | Average
Amount | | Average
Rate | | | Average
Amount | | Average
Rate | | | Average
Amount | | Average
Rate | |
| | | (Dollars in thousands) | |
Savings, NOW and money market | | $ | 181,377 | | 3.79 | % | | $ | 143,123 | | 3.64 | % | | $ | 123,705 | | 2.25 | % |
Time deposits over $ 100,000 | | | 77,784 | | 5.23 | % | | | 56,916 | | 4.70 | % | | | 37,252 | | 3.77 | % |
Wholesale brokered certificates of deposit | | | 1,266 | | 4.98 | % | | | - | | 0.00 | % | | | - | | 0.00 | % |
Other time deposits | | | 62,370 | | 4.90 | % | | | 62,476 | | 4.23 | % | | | 57,505 | | 3.02 | % |
| | | | | | | | | | | | | | | | | | |
| | | | | | |
Total interest-bearing deposits | | | 322,797 | | 4.36 | % | | | 262,515 | | 4.01 | % | | | 218,462 | | 2.71 | % |
| | | | | | |
Non-interest-bearing deposits | | | 89,328 | | - | | | | 86,555 | | - | | | | 75,103 | | - | |
| | | | | | | | | | | | | | | | | | |
| | | | | | |
Total deposits | | $ | 412,125 | | 3.41 | % | | $ | 349,070 | | 3.02 | % | | $ | 293,565 | | 2.02 | % |
| | | | | | | | | | | | | | | | | | |
The following table presents the amounts and maturities of deposits with balances of $100,000 or more:
| | | |
| | | At December 31, 2007 |
| | | (In thousands) |
Remaining maturity: | | | |
Less than three months | | $ | 21,998 |
Three to six months | | | 20,028 |
Six to twelve months | | | 36,678 |
Over twelve months | | | 11,677 |
| | | |
Total | | $ | 90,381 |
| | | |
Borrowings
The following table sets forth certain information regarding our short-term borrowings for the periods indicated.
25
| | | | | | | | | | | | |
| | | For the Year Ended December 31, | |
| | | 2007 | | | 2006 | | | 2005 | |
| | | (Dollars in thousands) | |
Short-term borrowings: | | | | | | | | | | | | |
Repurchase agreements and federal funds purchased | | | | | | | | | | | | |
Balance outstanding at end of period | | $ | 23,886 | | | $ | 10,670 | | | $ | 10,006 | |
Maximum amount outstanding at any month end during the period | | | 23,886 | | | | 11,031 | | | | 12,299 | |
Average balance outstanding | | | 12,459 | | | | 10,784 | | | | 10,003 | |
Weighted-average interest rate during the period | | | 3.32 | % | | | 2.54 | % | | | 2.28 | % |
Weighted-average interest rate at end of period | | | 4.49 | % | | | 2.05 | % | | | 2.34 | % |
Short-term Federal Home Loan Bank advances | | | | | | | | | | | | |
Balance outstanding at end of period | | $ | 14,000 | | | $ | - | | | $ | - | |
Maximum amount outstanding at any month end during the period | | | 14,000 | | | | - | | | | - | |
Average balance outstanding | | | 2,222 | | | | - | | | | 443 | |
Weighted-average interest rate during the period | | | 4.55 | % | | | 0.00 | % | | | 4.29 | % |
Weighted-average interest rate at end of period | | | 4.56 | % | | | 0.00 | % | | | 0.00 | % |
Total short-term borrowings: | | | | | | | | | | | | |
Balance outstanding at end of period | | $ | 37,886 | | | $ | 10,670 | | | $ | 10,006 | |
Maximum amount outstanding at any month end during the period | | | 37,886 | | | | 11,031 | | | | 12,299 | |
Average balance outstanding | | | 14,681 | | | | 10,784 | | | | 10,446 | |
Weighted-average interest rate during the period | | | 3.51 | % | | | 2.54 | % | | | 2.28 | % |
Weighted-average interest rate at end of period | | | 4.52 | % | | | 2.05 | % | | | 2.34 | % |
Results of Operations For the Years Ended December 31, 2007 and 2006
Overview. For the year ended December 31, 2007, our net income was $3.1 million compared to $3.3 million for the year ended December 31, 2006, a decrease of 5.4%. The decrease in earnings was primarily attributable to: additional provision for loan losses due to loan growth; significant loan growth not arising until the last quarter of the year; the effect of declining interest rates in the last quarter of the year; a change in deposit mix; the implementation of Check 21; increased interest expense due to higher levels of short-term borrowings and additional operating expenses due to new offices. Diluted net income per share of common stock was $0.42 in 2007 and $0.46 in 2006, a decrease of $0.04 or 7.2%. Return on average assets was 0.65% in 2007 versus 0.82% in 2006 while return on average equity was 10.59% and 13.67% for the years ended December 31, 2007 and December 31, 2006, respectively.
Net Interest Income. Net interest income was $17.3 million for the year ended December 31, 2007, an increase of $2.5 million or 16.7% over the year ended December 31, 2006. The increase in net interest income was attributable to an overall higher level of average earning assets, specifically average loan volume. The growth in average loan volume of $77.3 million provided substantially all of the $6.3 million increase in interest income while the growth in average interest-bearing liabilities of $64.6 million was the primary cause of the $3.9 million increase in interest expense for the year ended December 31, 2007 compared to the prior year.
Changes in interest rates had a minimal effect on net interest income for the year, contributing to a decrease in net interest income of approximately $376,000. However, potential additional interest revenue was lost due to a substantial portion of our average loan growth occurring during a period of declining interest rates. Also, approximately 35.6% of our loan portfolio repriced immediately in response to declines in interest rates in the last few months of 2007. Other factors affecting our net interest income for the year 2007 include changes in our average deposit mix and the effect of our average loan volume outpacing average deposits, requiring additional funds from short-term borrowings rather than lower-costing core deposits.
In addition to an increase in average interest-bearing deposit volume, a change in the mix of average deposits also was a factor in the increase in interest expense. Higher costing time deposits greater than $100,000 increased to 18.9% of total average deposits for the year 2007 compared to 16.3% for the year 2006 while non-interest-bearing deposits decreased to 21.7% of total average deposits for the year 2007 compared to 24.8% for the year 2006. Wholesale brokered certificates of deposit were added during the fourth quarter of 2007 to provide additional funds to support our loan growth, paying an average rate of 4.98%. These deposits resulted in additional interest expense of $63,000 for the year ended December 31, 2007.
26
The average yield on our earning assets during 2007 was 7.21% compared to 6.90% during 2006, up 31 basis points. During the same period, the average cost of our interest-bearing liabilities increased by 35 basis points to 4.42% for the year 2007. The yield and rate increases primarily reflect the increase in average market rates, principally changes in the Fed Funds rate and subsequent changes to the prime lending rate. For the first nine months of 2007, the national prime lending rate averaged 32 basis points higher than the prior year, but averaged only nine basis points higher for the entire year 2007 compared to 2006. The national prime lending rate remained at 8.25% for the year until it decreased to 7.75% in September 2007, down to 7.25% at December 31, 2007. Our net interest margin decreased slightly to 3.81% during 2007 compared to 3.87% during 2006.
Provision for Loan Losses. We recorded $1.3 million in provision for loan losses in 2007 compared to $69,000 for the provision recorded in 2006. Provisions for loan losses are charged to income to bring the allowance for loan losses to a level deemed appropriate by our management. The increase in the provision during 2007 resulted principally from increased loan volume and management’s evaluation of the loan portfolio at December 31, 2007. During 2007, loan charge-offs were $302,000 compared to net recoveries of $235,000 for the year 2006. The allowance for loan losses was $5.0 million at December 31, 2007 and $4.0 million at December 31, 2006, representing 1.07% and 1.15%, respectively, of loans outstanding at December 31, 2007 and 2006. See “Asset Quality and the Allowance For Loan Losses.”
Non-interest Income. Non-interest income is derived primarily from service charges and fees on deposit accounts and other loan fees. Non-interest income was $1.1 million for the year 2007, a decrease of $53,000 from the prior year period. Income from mortgage lending decreased $96,000 in 2007 to $230,000 as a result of continued slow mortgage loan production. Fees earned on deposit accounts decreased by $28,100 to $312,300. Credit card and other loan fees decreased $22,800 for the same period. Fees generated from financial and wealth management services provided $128,300 in non-interest income during 2007 compared to $49,900 during 2006. We expect wealth management income to continue to drive our growth in non-interest income in the future. Non-interest income as a percentage of average total assets decreased to .24% for the year 2007 compared to .29% for the year 2006. In October 2007, we acquired an approximately 5.6% equity interest in a tile insurance agency, which we anticipate will provide non-interest income in the future.
Non-interest Expense. Non-interest expense includes salaries and benefits paid to employees, occupancy and equipment expenses and all other operating costs. Non-interest expense increased $1.3 million to $12.0 million for the year ended December 31, 2007 compared to $10.7 million for the year ended December 31, 2006. Salaries and employee benefits comprised over half of the non-interest expense for 2007 and increased $1.0 million compared to 2006. This reflects an increase in additional loan officers, management and support staff added throughout the year. Our full-time equivalent employees grew by 24 to 99 at December 31, 2007 compared to 75 for the prior year period. The bank hired additional staff for the opening of our office in downtown Raleigh and the opening of our full service banking office in Wilmington which occurred in January 2008.
Premises and equipment costs increased $228,000 for the year ended December 31, 2007 compared to the previous year. Most of this increase related to the opening of the office in downtown Raleigh as well as the opening of our full service banking office in Wilmington during January 2008. Building lease expense increased approximately $90,000 over the prior year primarily for our building lease for our downtown Raleigh office. Other non-interest expense increased $27,000 during 2007. The primary contributors to the overall net increase in other noninterest expense were data processing and other outsourced services up $126,000 and increased FDIC insurance and state regulatory assessments of $277,000 due to higher regulatory rate requirements; these increases were offset by a decrease in director fees of $352,000 due to the decision of the board of directors to waive their equity compensation for fiscal 2007. Our outsourced services expense is related to data processing and other services for our customers’ accounts. These services are primarily volume driven and increase as we add new offices and products with corresponding increases in loan, deposit and other customer based accounts. In the aggregate, non-interest expense as a percentage of average total assets decreased to 2.54% for the year 2007 compared to 2.70% for the year 2006.
Income Taxes. We recorded $2.0 million in income tax expense for the year ended December 31, 2007 and $1.9 million for the year ended December 31, 2006. Income tax expense as a percentage of pretax income was 38.7% for 2007 and 36.9% for 2006. We adopted the provisions of Interpretation No. 48 “Accounting for Uncertainty in Income Taxes – an interpretation of Financial Accounting Standards Board Statement No. 109” (“FIN 48”) on January 1, 2007. Management has evaluated our tax positions and has concluded that we have no uncertain tax positions for which we should not recognize a tax benefit. The adoption of this statement had no material effect on our financial position or results of operations.
27
Results of Operations For the Years Ended December 31, 2006 and 2005
Overview. For the year ended December 31, 2006, our net income was $3.3 million compared to $2.4 million for the year ended December 31, 2005, an increase of 34.2%. Diluted net income per share of common stock was $0.69 in 2006 and $0.53 in 2005, an increase of $0.16 or 31.0%. Return on average assets was 0.82% in 2006 versus 0.74% in 2005 while return on average equity was 13.67% and 12.18% for the years ended December 31, 2006 and December 31, 2005, respectively.
Net Interest Income. Net interest income was $14.8 million for the year ended December 31, 2006, an increase of $2.5 million or 20.7% over the year ended December 31, 2005. The increase in net interest income was attributable to an overall higher level of earning assets and a better spread between the income we received from our earning assets and the expense we paid to fund those assets. We increased average earning assets by $63.4 million in 2006 as compared to 2005. The average yield on our earning assets in 2006 was 6.90% compared to 5.89% during 2005, up 101 basis points. During the same period, the cost of our interest-bearing liabilities increased by 129 basis points to 4.07%. The yield and rate increases were driven by strategic pricing of both our loans and deposits to reflect the increase in market rates, principally changes in the Fed Funds rate and subsequent changes to the prime lending rate. The national prime lending rate increased 100 basis points to 8.25% at December 31, 2006 from 7.25% at December 31, 2005. The 129 basis point increase in cost of funds reflects changes in our deposit mix due to growth in higher costing time deposits and competitive pricing. Our net interest margin increased slightly to 3.91% during 2006 compared to 3.89% during 2005.
Provision for Loan Losses. We recorded a $69,000 provision for loan losses in 2006, representing a decrease of $723,000 from the $792,000 provision recorded in 2005. Provisions for loan losses are charged to income to bring the allowance for loan losses to a level deemed appropriate by our management. The reduction in the provision during 2006 resulted principally from significant recoveries during the current year of loans that were charged off prior to 2006, a decrease in the level of loan charge-offs during the year, and from modifications to the methodology used to estimate the allowance for loan losses. During 2005, the provision for loan losses was made principally in response to growth in loans. Net recoveries of $235,000 were recorded during 2006 and net-charge-offs were $167,000 in 2005. The allowance for loan losses was $4.0 million at December 31, 2006 and $3.7 million at December 31, 2005, representing 1.15% and 1.25%, respectively, of loans outstanding at December 31, 2006 and 2005.
Non-interest Income. Non-interest income is derived primarily from service fees on deposit accounts and income from mortgage lending operations. Non-interest income was $1.2 million for the year 2006, a decrease of $136,000 from the prior year period. Income from mortgage lending decreased $166,000 in 2006 to $326,000 as a restructuring of our mortgage loan performance standards resulted in fewer mortgage loan originators, which slowed overall mortgage loan production. Fees earned on deposit accounts decreased slightly by $17,000 to $754,000. During 2005, we added a full-time in-house Director of Wealth Management to expand on the financial products and services (such as annuities, stocks, bonds and mutual fund offerings) offered through our offices. Fees generated from financial and wealth management services provided $50,000 in non-interest income during 2006 compared to $10,000 during 2005.
Non-interest Expense. Non-interest expense includes salaries and benefits paid to employees, occupancy and equipment expenses and all other operating costs. Non-interest expense increased $1.8 million to $10.7 million for the year ended December 31, 2006 compared to $8.9 million for the year ended December 31, 2005. Salaries and employee benefits comprised over half of the non-interest expense for 2006 and increased $937,000 compared to 2005. This reflects an increase in additional loan officers and support staff added throughout the year. The Bank hired additional staff for the opening of our full service office in the Wake Forest area during the third quarter, additional staff for the opening of our new loan production office in Wilmington during the second quarter and two officers for our corporate accounting and risk management staff. Premises and equipment costs increased $302,000 for the year ended December 31, 2006 compared to the previous year. Most of this increase related to the opening of the full service office in the Wake Forest area, new lease expense for the future downtown office and a full year of expenses related to our corporate headquarters at North Hills. Other non-interest expense increased $603,000 during 2006 led by director fees, increasing $239,000 and data processing and other outsourced services, increasing $155,000. Director’s fees are directly tied to the change in the value of our stock, which increased 66% during 2006. In addition, the Bank began paying its advisory boards members a nominal fee in 2006. Our outsourced services expense is related to data processing and other services for our customers’ accounts. These services are primarily volume driven and increase as we add new offices and products with corresponding increases in loan, deposit and other customer based accounts. Professional fees decreased $46,000 as most of our expenses for compliance with Section 404 of Sarbanes Oxley were incurred during 2005. In the aggregate, non-interest expense as a percentage of average total assets remained basically unchanged at 2.70% for 2006 and 2.69% for 2005.
Income Taxes. We recorded $1.9 million in income tax expense for the year ended December 31, 2006 and $1.5 million for the year ended December 31, 2005. Income tax expense as a percentage of pretax income was 36.9% for 2006 and 37.5% for 2005. The increase in income taxes was attributable to higher pretax earnings, up $1.3 million or 33.0% over the previous year-end.
28
Net Interest Income
Like most financial institutions, the primary component of our earnings is net interest income. Net interest income is the difference between interest income, principally from loan and investment securities portfolios, and interest expense, principally on customer deposits and borrowings. Changes in net interest income result from changes in volume, spread and margin. For this purpose, volume refers to the average dollar level of interest-earning assets and interest-bearing liabilities, spread refers to the difference between the average yield on interest-earning assets and the average cost of interest-bearing liabilities, and margin refers to net interest income divided by average interest-earning assets and is influenced by the level and relative mix of interest-earning assets and interest-bearing liabilities, as well as levels of non-interest-bearing liabilities. The following table sets forth, for the periods indicated, information with regard to average balances of assets and liabilities, as well as the total dollar amounts of interest income from interest-earning assets and interest expense on interest-bearing liabilities, resultant yields or costs, net interest income, net interest spread, net interest margin and ratio of average interest-earning assets to average interest-bearing liabilities. Non-accrual loans are included in determining average loans outstanding. Accretion of net deferred loan fees is included in interest income in the table below.
29
| | | | | | | | | | | | | | | | | | | | | | | | | | | | | | |
| | | Year Ended December 31, 2007 | | | Year Ended December 31, 2006 | | | Year Ended December 31, 2005 | |
| | | (Dollars in thousands) | |
| | | Average
Balance | | | Interest | | Average
Rate | | | Average
Balance | | | Interest | | Average
Rate | | | Average
Balance | | | Interest | | Average
Rate | |
Interest-earning assets: | | | | | | | | | | | | | | | | | | | | | | | | | | | | | | |
Loans | | $ | 393,927 | | | $ | 29,756 | | 7.55 | % | | $ | 316,620 | | | $ | 23,426 | | 7.40 | % | | $ | 262,962 | | | $ | 16,911 | | 6.43 | % |
Investment securities available for sale | | | 38,600 | | | | 1,751 | | 4.54 | % | | | 42,658 | | | | 1,739 | | 4.08 | % | | | 37,503 | | | | 1,188 | | 3.17 | % |
Other interest-earning assets | | | 21,478 | | | | 1,231 | | 5.73 | % | | | 23,621 | | | | 1,247 | | 5.28 | % | | | 18,255 | | | | 682 | | 3.74 | % |
| | | | | | | | | | | | | | | | | | | | | | | | | | | | | | |
| | | | | | | | | |
Total interest-earning assets | | | 454,005 | | | | 32,738 | | 7.21 | % | | | 382,899 | | | | 26,412 | | 6.90 | % | | | 318,720 | | | | 18,781 | | 5.89 | % |
| | | | | | | | | | | | | | | | | | | | | | | | | | | | | | |
| | | | | | | | | |
Other assets | | | 18,822 | | | | | | | | | | 15,198 | | | | | | | | | | 12,202 | | | | | | | |
| | | | | | | | | | | | | | | | | | | | | | | | | | | | | | |
| | | | | | | | | |
Total assets | | $ | 472,827 | | | | | | | | | $ | 398,097 | | | | | | | | | $ | 330,922 | | | | | | | |
| | | | | | | | | | | | | | | | | | | | | | | | | | | | | | |
| | | | | | | | | |
Interest-bearing liabilities: | | | | | | | | | | | | | | | | | | | | | | | | | | | | | | |
Deposits: | | | | | | | | | | | | | | | | | | | | | | | | | | | | | | |
Savings, NOW and money market | | | 181,377 | | | | 6,883 | | 3.79 | % | | | 143,123 | | | | 5,210 | | 3.64 | % | | | 123,705 | | | | 2,786 | | 2.25 | % |
Time deposits over $100,000 | | | 77,784 | | | | 4,069 | | 5.23 | % | | | 56,916 | | | | 2,677 | | 4.70 | % | | | 37,252 | | | | 1,406 | | 3.77 | % |
Wholesale brokered certificates of deposit | | | 1,266 | | | | 63 | | 4.98 | % | | | - | | | | - | | 0.00 | % | | | - | | | | - | | 0.00 | % |
Other time deposits | | | 62,370 | | | | 3,054 | | 4.90 | % | | | 62,476 | | | | 2,645 | | 4.23 | % | | | 57,505 | | | | 1,736 | | 3.02 | % |
Borrowings: | | | | | | | | | | | | | | | | | | | | | | | | | | | | | | |
Short-term borrowings | | | 14,681 | | | | 515 | | 3.51 | % | | | 10,784 | | | | 274 | | 2.54 | % | | | 10,003 | | | | 228 | | 2.28 | % |
Long-term debt | | | 11,666 | | | | 855 | | 7.33 | % | | | 11,205 | | | | 781 | | 6.97 | % | | | 5,166 | | | | 341 | | 6.60 | % |
| | | | | | | | | | | | | | | | | | | | | | | | | | | | | | |
| | | | | | | | | |
Total interest-bearing liabilities | | | 349,144 | | | | 15,439 | | 4.42 | % | | | 284,504 | | | | 11,587 | | 4.07 | % | | | 233,631 | | | | 6,497 | | 2.78 | % |
| | | | | | | | | | | | | | | | | | | | | | | | | | | | | | |
| | | | | | | | | |
Non-interest-bearing deposits | | | 89,328 | | | | | | | | | | 86,555 | | | | | | | | | | 75,103 | | | | | | | |
Other liabilities | | | 5,136 | | | | | | | | | | 3,094 | | | | | | | | | | 2,171 | | | | | | | |
Shareholders’ equity | | | 29,219 | | | | | | | | | | 23,944 | | | | | | | | | | 20,017 | | | | | | | |
| | | | | | | | | | | | | | | | | | | | | | | | | | | | | | |
| | | | | | | | | |
Total liabilities and shareholders’ equity | | $ | 472,827 | | | | | | | | | $ | 398,097 | | | | | | | | | $ | 330,922 | | | | | | | |
| | | | | | | | | | | | | | | | | | | | | | | | | | | | | | |
| | | | | | | | | |
Net interest income and interest rate spread | | | | | | $ | 17,299 | | 2.79 | % | | | | | | $ | 14,825 | | 2.83 | % | | | | | | $ | 12,284 | | 3.11 | % |
| | | | | | | | | | | | | | | | | | | | | | | | | | | | | | |
| | | | | | | | | |
Net interest margin | | | | | | | | | 3.81 | % | | | | | | | | | 3.87 | % | | | | | | | | | 3.85 | % |
| | | | | | | | | | | | | | | | | | | | | | | | | | | | | | |
| | | | | | | | | |
Ratio of average interest-earning assets to average interest-bearing liabilities | | | 130.03 | % | | | | | | | | | 134.58 | % | | | | | | | | | 136.42 | % | | | | | | |
| | | | | | | | | | | | | | | | | | | | | | | | | | | | | | |
(1) Nonaccrual loans are included in loan amounts.
30
Rate/Volume Analysis
The following table analyzes the dollar amount of changes in interest income and interest expense for major components of interest-earning assets and interest-bearing liabilities. The table distinguishes between (i) changes attributable to volume (changes in volume multiplied by the prior period’s rate), (ii) changes attributable to rate (changes in rate multiplied by the prior period’s volume), and (iii) net change (the sum of the previous columns). The change attributable to both rate and volume (changes in rate multiplied by changes in volume) has been allocated equally to both the changes attributable to volume and the changes attributable to rate.
| | | | | | | | | | | | | | | | | | | | | |
| | | Year Ended December 31, 2007 vs. 2006 | | | Year Ended December 31, 2006 vs. 2005 |
| | | Increase (Decrease) Due to | | | Increase Due to |
| | | Volume | | | Rate | | | Total | | | Volume | | Rate | | Total |
| | | (Dollars in thousands) |
Interest income: | | | | | | | | | | | | | | | | | | | | | |
Loans | | $ | 5,780 | | | $ | 550 | | | $ | 6,330 | | | $ | 3,710 | | $ | 2,805 | | $ | 6,515 |
Investment securities available for sale | | | (175 | ) | | | 187 | | | | 12 | | | | 187 | | | 364 | | | 551 |
Other interest-earning assets | | | (118 | ) | | | 102 | | | | (16 | ) | | | 242 | | | 323 | | | 565 |
| | | | | | | | | | | | | | | | | | | | | |
Total interest income | | | 5,487 | | | | 839 | | | | 6,326 | | | | 4,139 | | | 3,492 | | | 7,631 |
| | | | | | | | | | | | | | | | | | | | | |
Interest expense: | | | | | | | | | | | | | | | | | | | | | |
Deposits: | | | | | | | | | | | | | | | | | | | | | |
Savings, NOW and money market | | $ | 1,422 | | | $ | 251 | | | $ | 1,673 | | | $ | 572 | | $ | 1,852 | | $ | 2,424 |
Time deposits over $ 100,000 | | | 1,037 | | | | 355 | | | | 1,392 | | | | 834 | | | 437 | | | 1,271 |
Wholesale brokered time deposits | | | 32 | | | | 31 | | | | 63 | | | | - | | | - | | | - |
Other time deposits | | | (5 | ) | | | 414 | | | | 409 | | | | 180 | | | 729 | | | 909 |
Borrowings: | | | | | | | | | | | | | | | | | | | | | |
Short-term borrowings | | | 118 | | | | 123 | | | | 241 | | | | 19 | | | 27 | | | 46 |
Long-term debt | | | 33 | | | | 41 | | | | 74 | | | | 410 | | | 30 | | | 440 |
| | | | | | | | | | | | | | | | | | | | | |
Total interest expense | | | 2,637 | | | | 1,215 | | | | 3,852 | | | | 2,015 | | | 3,075 | | | 5,090 |
| | | | | | | | | | | | | | | | | | | | | |
Net interest income increase | | $ | 2,850 | | | $ | (376 | ) | | $ | 2,474 | | | $ | 2,124 | | $ | 417 | | $ | 2,541 |
| | | | | | | | | | | | | | | | | | | | | |
Liquidity
Our liquidity is a measure of our ability to fund loans, withdrawals and maturities of deposits, and other cash outflows in a cost effective manner. Our principal sources of liquidity are deposits, scheduled payments and prepayments of loan principal, maturities of investment securities, access to liquid assets, and funds provided by operations. While scheduled loan payments and maturing investments are relatively predictable sources of funds, deposit flows and loan prepayments are greatly influenced by general interest rates, economic conditions and competition.
Liquid assets (consisting of cash and due from banks, interest-earning deposits with other banks, federal funds sold and investment securities classified as available for sale) comprised 12.0% and 21.8% of our total assets at December 31, 2007 and 2006, respectively.
We have historically been a net seller of federal funds, as our liquidity has exceeded our need to fund new loan demand. However, during the fourth quarter of 2007, strong loan demand necessitated our borrowing short-term funds rather than selling federal funds. We have established credit lines with other financial institutions to purchase up to $21.3 million in federal funds. As a member of the Federal Home Loan Bank of Atlanta, or FHLB, we may obtain advances up to 10% of our bank’s assets. As another source of short-term borrowings, we also utilize securities sold under agreements to repurchase. At December 31, 2007, borrowings consisted of securities sold under agreements to repurchase of $23.9 million and short-term FHLB advances of $14.0 million. In addition, we had long-term FHLB advances of $867,000 at December 31, 2007.
Total deposits were $457.3 million and $402.1 million at December 31, 2007 and 2006, respectively. Time deposits, which are the only deposit accounts that have stated maturity dates, are generally considered to be rate sensitive. Time deposits represented 35.6% and 35.4%, respectively, of total deposits at December 31, 2007 and 2006. Time deposits of $100,000 or more represented 19.8% and 18.2%, respectively, of our total deposits at December 31, 2007 and 2006. Time deposits at December 31, 2007 included $10.0 million of wholesale brokered certificates of deposit that mature in May 2008. We acquired these brokered deposits in the fourth quarter of 2007 to partially fund the significant rise in loan demand in that quarter. Other than these brokered deposits, we believe that most of the time deposits are relationship-oriented. While we will need to pay competitive rates to retain these deposits at their maturities, there are other subjective factors that will determine their continued retention. Based upon prior experience, we anticipate that a substantial portion of outstanding certificates of deposit will renew upon maturity.
We believe that current sources of funds provide adequate liquidity for our current cash flow needs.
31
Asset/Liability Management
Our results of operations depend substantially on our net interest income. Like most financial institutions, our interest income and cost of funds are affected by general economic conditions and by competition in the marketplace.
The purpose of asset/liability management is to provide stable net interest income growth by protecting our earnings from undue interest rate risk, which arises from volatile interest rates and changes in the balance sheet mix, and by managing the risk/return relationships between liquidity, interest rate risk, market risk, and capital adequacy. We maintain, and have complied with, our Board approved asset/liability management policy that provides guidelines for controlling exposure to interest rate risk by utilizing the following ratios and trend analysis: liquidity, equity, volatile liability dependence, portfolio maturities, maturing assets and maturing liabilities. Our policy is to control the exposure of our earnings to changing interest rates by generally endeavoring to maintain a position within a narrow range around an “earnings neutral position,” which is defined as the mix of assets and liabilities that generate a net interest margin that is least affected by interest rate changes.
When suitable lending opportunities are not sufficient to utilize available funds, we have generally invested such funds in securities, primarily securities issued by governmental agencies and mortgage-backed securities. The securities portfolio contributes to our earnings and plays an important part in our overall interest rate management. However, management of the securities portfolio alone cannot balance overall interest rate risk. The securities portfolio must be used in combination with other asset/liability techniques to actively manage the balance sheet. The primary objectives in our overall management of our securities portfolio are safety, liquidity, yield, asset/liability management, which is also known as interest rate risk, and investing in securities that can be pledged for public deposits.
In reviewing our needs with regard to proper management of our asset/liability program, we estimate our future needs, taking into consideration historical periods of high loan demand and low deposit balances, estimated loan and deposit increases (due to increased demand through marketing), and forecasted interest rate changes.
The analysis of an institution’s interest rate gap, which is the difference between the repricing of interest-earning assets and interest-bearing liabilities during a given period of time, is a standard tool for the measurement of exposure to interest rate risk. The following table sets forth the amounts of our interest-earning assets and interest-bearing liabilities outstanding at December 31, 2007, which is projected to reprice or mature in each of the future time periods shown. Except as stated below, the amounts of assets and liabilities shown which reprice or mature within a particular period were determined in accordance with the contractual terms of the assets or liabilities. Loans with adjustable rates are shown as being due at the end of the next upcoming adjustment period. Money market deposit accounts and negotiable order of withdrawal or other transaction accounts are assumed to be subject to immediate repricing and depositor availability and have been placed in the shortest period. In making the gap computations, none of the assumptions made regarding prepayment rates and deposit drop off rates have been used for any interest-earning assets or interest-bearing liabilities. In addition, the table does not reflect scheduled principal payments that will be received throughout the lives of the loans. The interest rate sensitivity of our assets and liabilities illustrated in the following table would vary substantially if different assumptions were used or if actual experience differs from that indicated by such assumptions.
32
| | | | | | | | | | | | | | | | | | | | |
| | | Terms to Repricing at December 31, 2007 | |
| | | 3 Months
or Less | | | Over 3 Months
to 12 Months | | | Total Within
12 Months | | | Over 12
Months | | | Total | |
| | | (Dollars in thousands) | |
Interest-earning assets: | | | | | | | | | | | | | | | | | | | | |
Loans | | $ | 203,539 | | | $ | 59,076 | | | $ | 262,615 | | | $ | 206,613 | | | $ | 469,228 | |
Investment securities available for sale | | | 6,574 | | | | 10,777 | | | | 17,351 | | | | 17,492 | | | | 34,843 | |
Other earning assets | | | 20,649 | | | | 134 | | | | 20,783 | | | | 179 | | | | 20,962 | |
| | | | | | | | | | | | | | | | | | | | |
Total interest-earning assets | | $ | 230,762 | | | $ | 69,987 | | | $ | 300,749 | | | $ | 224,284 | | | $ | 525,033 | |
| | | | | | | | | | | | | | | | | | | | |
Percent of total interest-earning assets | | | 43.95 | % | | | 13.33 | % | | | 57.28 | % | | | 42.72 | % | | | 100.00 | % |
Cumulative percent of total interest-earning assets | | | 43.95 | % | | | 57.28 | % | | | 57.28 | % | | | 100.00 | % | | | 100.00 | % |
Interest-bearing liabilities | | | | | | | | | | | | | | | | | | | | |
Deposits: | | | | | | | | | | | | | | | | | | | | |
Savings, money market, and NOW | | $ | 199,503 | | | $ | - | | | $ | 199,503 | | | $ | - | | | $ | 199,503 | |
Time deposits (1) | | | 34,277 | | | | 109,357 | | | | 143,634 | | | | 19,385 | | | | 163,019 | |
Borrowings: | | | | | | | | | | | | | | | | | | | | |
Short-term borrowings | | | 37,886 | | | | - | | | | 37,886 | | | | - | | | | 37,886 | |
Long-term debt | | | 15,465 | | | | - | | | | 15,465 | | | | 867 | | | | 16,332 | |
| | | | | | | | | | | | | | | | | | | | |
| | $ | 287,131 | | | $ | 109,357 | | | $ | 396,488 | | | $ | 20,252 | | | $ | 416,740 | |
| | | | | | | | | | | | | | | | | | | | |
Percent of total interest-bearing liabilities | | | 68.90 | % | | | 26.24 | % | | | 95.14 | % | | | 4.86 | % | | | 100.00 | % |
Cumulative percent of total interest-bearing liabilities | | | 68.90 | % | | | 95.14 | % | | | 95.14 | % | | | 100.00 | % | | | 100.00 | % |
Interest sensitivity gap | | $ | (56,369 | ) | | $ | (39,370 | ) | | $ | (95,739 | ) | | $ | 204,032 | | | $ | 108,293 | |
Cumulative interest sensitivity gap | | | (56,369 | ) | | | (95,739 | ) | | | (95,739 | ) | | | 108,293 | | | | 108,293 | |
Cumulative interest sensitivity gap as a percent of total interest-earning assets | | | (10.74 | %) | | | (18.23 | %) | | | (18.23 | %) | | | 20.63 | % | | | 20.63 | % |
Cumulative ratio of interest-sensitive assets to interest-sensitive liabilities | | | 80.37 | % | | | 75.85 | % | | | 75.85 | % | | | 125.99 | % | | | 125.99 | % |
(1) Includes $10.0 million wholesale brokered certificates of deposit maturing May 2008.
Capital
A significant measure of the strength of a financial institution is its capital base. Federal bank regulators have classified capital into the following components: (1) Tier I capital, which includes common shareholders’ equity (excluding accumulated other comprehensive income) and qualifying preferred equity, and (2) Tier II capital, which includes a portion of the allowance for loan losses, certain qualifying long-term debt and preferred stock that does not qualify as Tier I capital. Minimum capital levels are regulated by risk-based capital adequacy guidelines, which require a financial institution to maintain capital as a percentage of its risk-adjusted assets, which are the institution’s assets and certain off-balance sheet items adjusted for predefined credit risk factors. A financial institution is required to maintain, at a minimum, Tier I capital as a percentage of risk-adjusted assets of 4.0% and combined Tier I and Tier II capital as a percentage of risk-adjusted assets of 8.0%. In addition to the risk-based guidelines, federal regulations require a financial institution to maintain a minimum leverage ratio (Tier I capital as a percentage of tangible assets) of 4.0%. Our equity to assets ratio was 5.76% and 5.84%, respectively, at December 31, 2007 and December 31, 2006. As the following table indicates, at December 31, 2007 we exceeded our regulatory capital requirements.
| | | | | | | | | |
| | | At December 31, 2007 | |
| | | Actual
Ratio | | | Minimum
Requirement | | | Well-Capitalized
Requirement | |
Total risk-based capital ratio | | 10.32 | % | | 8.00 | % | | 10.00 | % |
Tier 1 risk-based capital ratio | | 9.25 | % | | 4.00 | % | | 6.00 | % |
Leverage ratio | | 8.50 | % | | 4.00 | % | | 5.00 | % |
33
In March 2004, we established a trust, North State Statutory Trust I, which sold $5.2 million of its preferred and common securities in a pooled private placement and in turn used these funds in the purchase of $5.2 million of junior subordinated debentures issued by us. In December 2005, we established a second trust, North State Statutory Trust II, which sold $5.2 million of its preferred and common securities in a pooled private placement and in turn used these funds in the purchase of $5.2 million of junior subordinated debentures issued by us. In November 2007, we established a third trust, North State Statutory Trust III, which sold $5.2 million of its preferred and common securities in a pooled private placement and in turn used these funds in the purchase of $5.2 million of junior subordinated debentures issued by us.
Our trust preferred securities presently qualify as Tier 1 regulatory capital and are reported in Federal Reserve regulatory reports as a minority interest in a consolidated subsidiary. The Federal Accounting Standards Board adopted in 2003 a rule, FASB Interpretation No. 46 (Revised), that requires the Trusts to be deconsolidated from our financial statements. On July 2, 2003, the Board of Governors of the Federal Reserve issued a letter, SR 03-13, stating that notwithstanding FIN 46 trust preferred securities will continue to be included in Tier 1 capital until notice is given to the contrary. There can be no assurance that the Federal Reserve will continue to allow institutions to include trust preferred securities in Tier 1 capital for regulatory capital purposes. In the event of a disallowance, there would be a reduction in our consolidated Tier 1 and leverage capital ratios.
We intend that our company and our bank remain “well-capitalized” for regulatory purposes. To do so, we might need additional capital in the future due to our continuing growth, greater than expected future growth or other reasons. If necessary, we will consider all viable alternatives for raising capital including additional issuances of trust preferred securities.
Contractual Obligations and Commitments
In the normal course of business, we have various outstanding contractual obligations that will require future cash outflows, as well as commitments and contingent liabilities, such as commitments to extend credit, that may or may not require future cash outflows. To meet the financing needs of our customers, we issue various financial instruments, such as lines of credit, loan commitments and standby letters of credit. These instruments either are not recorded on our balance sheet or are recorded on our balance sheet in amounts that differ from the full contract or notional amounts. These instruments involve varying elements of market, credit and liquidity risk. The following table reflects our expected contractual obligations and future operating lease commitments as of December 31, 2007.
| | | | | | | | | | | | | | | |
| | | Payments Due by Period |
Contractual Obligations | | Total | | On Demand
or Within
1 Year | | 2 - 3 Years | | 4 - 5 Years | | After
5 Years |
| | | (Dollars in thousands) |
Short-term borrowings | | $ | 37,886 | | $ | 37,886 | | $ | - | | $ | - | | $ | - |
Long-term debt | | | 16,332 | | | - | | | - | | | - | | | 16,332 |
Operating lease payments | | | 11,039 | | | 1,043 | | | 2,156 | | | 2,074 | | | 5,766 |
Time deposits (1) | | | 163,019 | | | 143,634 | | | 17,528 | | | 1,857 | | | - |
| | | | | | | | | | | | | | | |
Total contractual cash obligations | | $ | 228,276 | | $ | 182,563 | | $ | 19,684 | | $ | 3,931 | | $ | 22,098 |
| | | | | | | | | | | | | | | |
(1) Includes $10.0 million of wholesale brokered certificates of deposit maturing in May 2008.
The following table reflects our other commitments outstanding as of December 31, 2007.
34
| | | | | | | | | | | | | | | |
| | | Amount of Commitment Expiration Per Period |
Contractual Obligations | | Total
Amounts
Committed | | Within
1 Year | | 2 - 3 Years | | 4 - 5 Years | | After
5 Years |
| | | (Dollars in thousands) |
Undisbursed portion of home equity credit lines secured by 1-4 family residential properties | | $ | 16,622 | | $ | 7,418 | | $ | 2,312 | | $ | 4,001 | | $ | 2,891 |
Undisbursed portion of commercial, construction and land development loans | | | 58,892 | | | 58,892 | | | - | | | - | | | - |
Other commitments and lines of credit | | | 22,702 | | | 11,088 | | | 2,872 | | | 4,099 | | | 4,643 |
Standby letters of credit | | | 2,306 | | | 2,303 | | | 3 | | | - | | | - |
| | | | | | | | | | | | | | | |
Total commercial commitments | | $ | 100,522 | | $ | 79,701 | | $ | 5,187 | | $ | 8,100 | | $ | 7,534 |
| | | | | | | | | | | | | | | |
Off-Balance Sheet Arrangements
Information about our off-balance sheet risk exposure is presented in Note L to the accompanying consolidated financial statements. As part of our ongoing business, we do not participate in transactions that generate relationships with unconsolidated entities or financial partnerships, such as entities often referred to as special purpose entities, or SPEs, which generally are established for the purpose of facilitating off-balance sheet arrangements or other contractually narrow or limited purposes. As of December 31, 2007, our sole SPE activity is with North State Statutory Trust I, North State Statutory Trust II and North State Statutory Trust III. We issued $5.2 million of junior subordinated debentures, included in long-term debt on the balance sheet, to these trusts on March 17, 2004, December 15, 2005 and November 28, 2007, respectively, in exchange for the proceeds of trust preferred securities issued by these trusts.
Recent Accounting Pronouncements
See Note B to our consolidated financial statements for a discussion of recent accounting pronouncements and management’s assessment of the potential impact on our consolidated financial statements.
Critical Accounting Policy
Our most significant critical accounting policy is the determination of our allowance for loan losses. A critical accounting policy is one that is both very important to the portrayal of our financial condition and results, and requires our most difficult, subjective or complex judgments. What makes these judgments difficult, subjective and/or complex is the need to make estimates about the effects of matters that are inherently uncertain. If the mix and amount of future write-offs differ significantly from those assumptions we use in making our determination, the allowance for loan losses and provision for loan losses on our income statement could be materially affected. For further discussion of the allowance for loan losses and a detailed description of the methodology we use in determining the adequacy of the allowance, see the section of this discussion titled “Asset Quality and the Allowance for Loan Losses” and Note E to our consolidated financial statements contained in this report.
QUARTERLY FINANCIAL DATA (UNAUDITED)
The following table sets forth, for the periods indicated, certain of our consolidated quarterly financial information. This information is derived from our unaudited financial statements, which include, in the opinion of management, all normal recurring adjustments which management considers necessary for a fair presentation of the results for such periods. This information should be read in conjunction with our consolidated financial statements included elsewhere in this report. The results for any quarter are not necessarily indicative of results for any future period.
35
| | | | | | | | | | | | | | | | | | | | | | | | | |
| | | 2007 | | 2006 |
| | | Fourth
Quarter | | Third
Quarter | | Second
Quarter | | First
Quarter | | Fourth
Quarter | | | Third
Quarter | | Second
Quarter | | First
Quarter |
| | | (In thousands, except per share data) |
Operating Data: | | | | | | | | | | | | | | | | | | | | | | | | | |
Total interest income | | $ | 8,858 | | $ | 8,415 | | $ | 7,917 | | $ | 7,548 | | $ | 7,286 | | | $ | 6,908 | | $ | 6,353 | | $ | 5,866 |
Total interest expense | | | 4,300 | | | 3,933 | | | 3,663 | | | 3,544 | | | 3,437 | | | | 3,072 | | | 2,701 | | | 2,378 |
| | | | | | | | | | | | | | | | | | | | | | | | | |
Net interest income | | | 4,558 | | | 4,482 | | | 4,254 | | | 4,004 | | | 3,849 | | | | 3,836 | | | 3,652 | | | 3,488 |
Provision for loan losses | | | 662 | | | 255 | | | 211 | | | 211 | | | (392 | ) | | | 85 | | | 223 | | | 154 |
| | | | | | | | | | | | | | | | | | | | | | | | | |
Net interest income after provision for loan losses | | | 3,896 | | | 4,227 | | | 4,043 | | | 3,793 | | | 4,241 | | | | 3,751 | | | 3,429 | | | 3,334 |
Noninterest income | | | 275 | | | 293 | | | 303 | | | 250 | | | 321 | | | | 273 | | | 295 | | | 285 |
Noninterest expense | | | 3,176 | | | 3,015 | | | 2,937 | | | 2,904 | | | 3,056 | | | | 2,638 | | | 2,527 | | | 2,521 |
| | | | | | | | | | | | | | | | | | | | | | | | | |
Income before income taxes | | | 995 | | | 1,505 | | | 1,409 | | | 1,139 | | | 1,506 | | | | 1,386 | | | 1,197 | | | 1,098 |
Provision for income taxes | | | 385 | | | 573 | | | 563 | | | 432 | | | 546 | | | | 516 | | | 446 | | | 407 |
| | | | | | | | | | | | | | | | | | | | | | | | | |
Net income | | $ | 610 | | $ | 932 | | $ | 846 | | $ | 707 | | $ | 960 | | | $ | 870 | | $ | 751 | | $ | 691 |
| | | | | | | | | | | | | | | | | | | | | | | | | |
Per Share Data: (1) | | | | | | | | | | | | | | | | | | | | | | | | | |
Net income: | | | | | | | | | | | | | | | | | | | | | | | | | |
Basic | | $ | 0.09 | | $ | 0.13 | | $ | 0.12 | | $ | 0.10 | | $ | 0.14 | | | $ | 0.13 | | $ | 0.12 | | $ | 0.11 |
Diluted | | | 0.08 | | | 0.13 | | | 0.12 | | | 0.10 | | | 0.13 | | | | 0.12 | | | 0.11 | | | 0.10 |
Common stock price: | | | | | | | | | | | | | | | | | | | | | | | | | |
High | | $ | 17.25 | | $ | 21.75 | | $ | 17.20 | | $ | 17.49 | | $ | 16.66 | | | $ | 14.67 | | $ | 11.33 | | $ | 12.22 |
Low | | | 12.00 | | | 16.80 | | | 15.67 | | | 15.70 | | | 14.17 | | | | 10.67 | | | 9.78 | | | 9.55 |
Close | | | 12.75 | | | 16.85 | | | 17.20 | | | 16.67 | | | 16.00 | | | | 14.33 | | | 11.33 | | | 9.78 |
Book value | | $ | 4.52 | | $ | 4.35 | | $ | 4.10 | | $ | 4.03 | | $ | 3.90 | | | $ | 3.75 | | $ | 3.55 | | $ | 3.40 |
(1) Adjusted for the effects of three for two stock splits in 2007 and 2006.
Item 7A.Quantitative and Qualitative Disclosures About Market Risk.
Market risk reflects the risk of economic loss resulting from adverse changes in market price and interest rates. This risk of loss can be reflected in diminished current market values and/or reduced potential net interest income in future periods.
The largest component of our earnings is net interest income which can fluctuate widely, directly impacting our overall earnings. Significant interest rate movements occur due to differing maturities or repricing intervals of our interest-earning assets and interest-bearing liabilities and the fact that rates on these financial instruments do not change uniformly. Management is responsible for minimizing our exposure to interest rate risk. This is accomplished by developing objectives, goals and strategies designed to enhance profitability and performance while minimizing our overall interest rate risk.
We use several modeling techniques to measure interest rate risk. Our primary method is the simulation of net interest income under varying interest rate scenarios. We believe this methodology is preferable in that it takes into account the pricing strategies we would undertake in response to rate changes, whereas other methods such as interest rate shock or balance sheet gap analysis do not take these into consideration. Our balance sheet remains asset-sensitive, which means that more assets than liabilities are subject to immediate repricing as market rates change. During periods of rising rates, this should result in increased interest income. The opposite would be expected during periods of declining rates.
Our hedging strategy is generally intended to take advantage of opportunities to reduce, to the extent possible, unpredictable cash flows. We may use a variety of commonly used derivative products that are instruments used by financial institutions to manage interest rate risk. The products that may be used as part of a hedging strategy include swaps, caps, floors and collars. Currently, we utilize a stand-alone derivative financial instrument, in the form of an interest rate floor in our asset/liability management program. The transaction involves both credit and market risk. Direct credit exposure is limited to the net difference between the calculated amounts to be received and paid, if any. The instrument is designated as a cash flow hedge of the risk of overall changes in cash flows below the strike rate on the floor. The cash flow hedge is consistent with our risk management objective and strategy to reduce our exposure to decreases in cash flows relating to interest receipts on its prime-based variable-rate loans. At December 31, 2007, the outstanding notional value of the interest rate floor was $50.0 million with a fair value of $1.0 million and an unrealized gain of $681,000 and a maturity date of November 1, 2009. Additional discussion of derivatives is presented in Note L to our consolidated financial statements included under Item 8 of Part II in this Form 10-K.
See the section entitled “Asset/Liability Management” in Item 7 for a more detailed discussion of market risk.
36
Item 8.Financial Statements and Supplemental Data.
The information required by this Item is found beginning at page F-1 of this report.
Item 9.Changes in and Disagreements with Accountants on Accounting and Financial Disclosure.
Not applicable.
Item 9A(T).Controls and Procedures.
Disclosure Controls and Procedures
Our management, under the supervision and with the participation of our Chief Executive Officer and Chief Financial Officer, carried out an evaluation of our disclosure controls and procedures as defined in Rule 13a-15(e) of the Exchange Act. Based on that evaluation, the Chief Executive Officer and Chief Financial Officer concluded that our disclosure controls and procedures were effective as of December 31, 2007.
Management’s Report on Internal Control over Financial Reporting
Our management is responsible for establishing and maintaining adequate internal control over financial reporting as defined in Rule 13a-15(f) of the Securities Exchange Act of 1934 as amended (the Exchange Act). Our internal control over financial reporting is a process designed to provide reasonable assurance regarding the reliability of financial reporting and the preparation of financial statements for external purposes in accordance with accounting principles generally accepted in the United States of America.
Under the supervision and with the participation of management, including the Chief Executive Officer and the Chief Financial Officer, we conducted an evaluation of the effectiveness of the internal control over financial reporting based on the framework in “Internal Control — Integrated Framework” promulgated by the Committee of Sponsoring Organizations of the Treadway Commission, commonly referred to as the “COSO” criteria. Based on this evaluation under the COSO criteria, management concluded that our internal control over financial reporting was effective as of December 31, 2007.
Because of its inherent limitations, internal control over financial reporting cannot provide absolute assurance of achieving financial reporting objectives. Internal control over financial reporting is a process that involves human adherence to and compliance with policies and procedures. It is subject to lapses in judgment and breakdowns resulting from human failures. Also, projections of any evaluation of effectiveness to future periods are subject to the risk that controls may become inadequate due to changes in conditions, or that the degree of compliance with the policies and procedures may deteriorate.
This annual report does not include an attestation report of our registered public accounting firm regarding internal control over financial reporting. Management’s report was not subject to attestation by our registered public accounting firm pursuant to temporary rules of the Securities and Exchange Commission that permit us to provide only management’s report in this annual report.
There was no change in our internal control over financial reporting that occurred during the fourth quarter of 2007 that has materially affected or is likely to materially affect, our internal control over financial reporting.
Item 9B.Other Information.
Not applicable.
PART III
Item 10.Directors, Executive Officers, and Corporate Governance.
The information required by this Item concerning our directors and executive officers is incorporated by reference from the sections captioned “Proposal No. 1 - Election of Directors”, “Other Information – Other Directors” and “Other Information - Executive Officers” contained in our proxy statement related to the 2008 Annual Meeting of Shareholders scheduled to be held on May 29, 2008. The information required by this Item concerning compliance with Section 16(a) of the United States Securities Exchange Act of 1934, as amended, is incorporated by reference from the section of our proxy statement captioned “Section 16(a) Beneficial Ownership Reporting Compliance.”
Our Board of Directors has determined that the members of the Audit Committee are independent as defined in Rule 4200(a)(15) of the Nasdaq listing standards. Our Board of Directors also has determined that Mr. Jack M. Stancil is an “audit
37
committee financial expert” as defined in Item 401(h) of Regulation S-B.
Our Board of Directors has adopted a code of ethics for our Chief Executive Officer, Chief Financial Officer and any other senior accounting officer or other persons performing similar functions. We will provide copies of our code of ethics without charge upon request. To obtain a copy of our code of ethics, please send your written request to North State Bancorp, 4270 The Circle at North Hills, Raleigh, North Carolina 27609, Attention: Stacey Koble.
Since the date of our proxy statement for our 2007 Annual Meeting of Shareholders, we have not made any material change to the procedures by which our shareholders may recommend nominees to our Board of Directors. Those procedures are discussed under the section captioned “Director Nominations” in our proxy statement for the 2008 Annual Meeting of Shareholders.
Item 11.Executive Compensation.
The information required by this Item is incorporated by reference to the information under the sections captioned “Executive Compensation”, “Other Information – Compensation Discussion and Analysis”, “Employment and Change in Control Agreements” , “Other Information – Compensation Committee Report”, “Other Information – Compensation Committee Interlocks and Insider Participation”, and “Other Information - Director Compensation” contained in our proxy statement.
Item 12.Security Ownership of Certain Beneficial Owners and Management and Related Stockholder Matters.
The information required by this Item is incorporated by reference to the information under the section captioned “Security Ownership of Management and Certain Beneficial Owners” contained in our proxy statement and in Part II, Item 5 of this report.
Item 13.Certain Relationships and Related Transactions, and Director Independence.
The information required by this Item is incorporated by reference to the information under the section captioned “Certain Transactions” contained in our proxy statement.
Item 14.Principal Accountant Fees and Services.
The information required by this Item is incorporated by reference to the information under the section captioned “Report of the Audit Committee” contained in our proxy statement.
38
Item 15.Exhibits and Financial Statement Schedules.
| | |
Exhibit No. | | Exhibit Title |
| |
| 3.1 (a) | | Articles of Incorporation, amended as of May 9, 2007 |
| |
| 3.2 (a) | | Bylaws adopted June 7, 2002 |
| |
| 4.1 (a) | | Form of North State Bancorp stock certificate |
| |
| 4.2 (f) | | Amended and Restated Declaration of Trust by and among U.S. Bank National Association, as Institutional Trustee, North State Bancorp, as Sponsor, and Larry D. Barbour and Kirk A. Whorf as administrators, dated as of March 17, 2004 |
| |
| 4.3 (f) | | Indenture dated as of March 17, 2004, between North State Bancorp, as Issuer and U.S. Bank National Association, as Trustee |
| |
| 4.4 (b) | | Amended and Restated Declaration of Trust by and among Wilmington Trust Company, as Delaware Trustee, Wilmington Trust Company, as Institutional Trustee, North State Bancorp, as Sponsor, and Larry D. Barbour and Kirk A. Whorf as administrators, dated as of December 15, 2005 |
| |
| 4.5 (b) | | Indenture dated as of December 15, 2005, between North State Bancorp, as Issuer and Wilmington Trust Company, as Trustee |
| |
| 4.6 (h) | | Amended and Restated Declaration of Trust by and among Wells Fargo Delaware Trust Company, as Delaware Trustee, Wells Fargo Bank, N.A., as Property Trustee, North State Bancorp, as Depositor, and Kirk A. Whorf, Sandra A. Temple and David M. Shipp as administrators, dated as of November 28, 2007 |
| |
| 4.7 (h) | | Junior Subordinated Indenture dated as of November 28, 2007, between North State Bancorp, as Issuer and Wells Fargo Bank, N.A., as Trustee |
| |
| 10.1 (c) | | Stock Option Plan for Non-Employee Directors, assumed as of June 28, 2002 |
| |
| 10.2 (c) | | Stock Option Plan for Employees, assumed as of June 28, 2002 |
| |
| 10.3 (d) | | Employment Agreement between North State Bank and Larry D. Barbour, dated as of June 1, 2000 |
| |
| 10.4 (d) | | Change in Control Agreement between North State Bank and Kirk A. Whorf, dated as of June 1, 2000, as amended on October 29, 2002 |
| |
| 10.5 (d) | | Change in Control Agreement between North State Bank and Judy M. Stephenson, dated as of June 1, 2000 |
| |
| 10.6 (d) | | Change in Control Agreement between North State Bank and Sandra A. Temple, dated as of June 1, 2000, as amended on October 24, 2002 |
| |
| 10.7 (e) | | 2003 Stock Plan |
| |
| 10.8 (f) | | Guarantee Agreement dated as of March 17, 2004, by and between North State Bancorp and U.S. Bank National Association |
| |
| 10.9 (b) | | Guarantee Agreement dated as of December 15, 2005, by and between North State Bancorp and Wilmington Trust Company |
39
| | |
| |
| 10.11(f) | | Lease dated May 1, 2003 between North State Bancorp and NHM00, LLC. |
| |
| 10.12(g) | | Assignment and Assumption of Lease effective January 14, 2000 among North State Bank, Oberlin Investors Two, LLC and Branch Banking & Trust Company. |
| |
| 10.13(g) | | Office Lease dated April 10, 2000 between North State Bank and Oberlin Investors Two, LLC (including Amendment No. One dated March 29, 2001). |
| |
| 10.14(i) | | Lease agreement dated as of December 29, 2006 by and between North State Bank and Atrium Investments, LLC |
| |
| 10.15(i) | | Lease agreement dated as of November 1, 2006 between North State Bancorp and Capital Club Properties, LLC |
| |
| 10.16(h) | | Guarantee Agreement dated as of November 28, 2007, by and between North State Bancorp and Wells Fargo Bank, N.A. |
| |
| 10.17 | | Change in Control Agreement between North State Bank and David M. Shipp, dated September 10, 2007 |
| |
| 21.1 | | List of Subsidiaries |
| |
| 23 | | Consent of Dixon Hughes PLLC |
| |
| 31.1 | | Certification pursuant to Rule 13a-14(a) |
| |
| 31.2 | | Certification pursuant to Rule 13a-14(a) |
| |
| 32.1 | | Certifications pursuant to 18 U.S.C. Section 1350 as adopted pursuant to Section 906 of the Sarbanes-Oxley Act of 2002 |
(a) Incorporated by reference to exhibits filed with our Quarterly Report of Form 10-Q f on May 15, 2007.
(b) Incorporated by reference to exhibits filed with our Current Report on Form 8-K filed on December 20, 2005.
(c) Incorporated by reference to exhibits filed with our Registration Statement on Form S-8 filed on July 31, 2002 (Registration Statement No. 333-97419).
(d) Incorporated by reference to exhibits filed with our Annual Report on Form 10-KSB for the year ended December 31, 2002.
(e) Incorporated by reference to exhibits filed with our Registration Statement on Form S-8 filed on July 25, 2003 (Registration Statement No. 333-107337).
(f) Incorporated by reference to exhibits filed with our Annual Report on Form 10-KSB for the year ended December 31, 2005.
(g) Incorporated by reference to exhibits filed with our Quarterly Report on Form 10-QSB for the quarter ended March 31, 2005.
(h) Incorporated by reference to exhibits filed with our Current Report on Form 8-K filed on November 30, 2007.
(i) Incorporated by reference to exhibits filed with our Annual Report on Form 10-KSB for the year ended December 31, 2006.
40
ITEM 8 – FINANCIAL STATEMENTS
NORTH STATE BANCORP & SUBSIDIARY
INDEX TO THE CONSOLIDATED FINANCIAL STATEMENTS
F-1

REPORT OF INDEPENDENT REGISTERED PUBLIC ACCOUNTING FIRM
To the Shareholders and the Board of Directors
North State Bancorp
Raleigh, North Carolina
We have audited the accompanying consolidated balance sheets of North State Bancorp and subsidiary as of December 31, 2007 and 2006, and the related consolidated statements of operations, comprehensive income, changes in shareholders’ equity and cash flows for each of the years in the three-year period ended December 31, 2007. These consolidated financial statements are the responsibility of the Company’s management. Our responsibility is to express an opinion on these consolidated financial statements based on our audits.
We conducted our audits in accordance with the standards of the Public Company Accounting Oversight Board (United States). Those standards require that we plan and perform the audit to obtain reasonable assurance about whether the financial statements are free of material misstatement. We were not engaged to perform an audit of the Company’s internal control over financial reporting. Our audit included consideration of internal control over financial reporting as a basis for designing audit procedures that are appropriate in the circumstances, but not for the purpose of expressing an opinion on the effectiveness of the Company’s internal control over financial reporting. Accordingly, we express no such opinion. An audit includes examining, on a test basis, evidence supporting the amounts and disclosures in the financial statements. An audit also includes assessing the accounting principles used and significant estimates made by management, as well as evaluating the overall financial statement presentation. We believe that our audits provide a reasonable basis for our opinion.
In our opinion, the consolidated financial statements referred to above present fairly, in all material respects, the financial position of North State Bancorp and subsidiary at December 31, 2007 and 2006 and the results of their operations and their cash flows for each of the years in the three-year period ended December 31, 2007 in conformity with accounting principles generally accepted in the United States of America.

Raleigh, North Carolina
March 28, 2008
F-2
NORTH STATE BANCORP
CONSOLIDATED BALANCE SHEETS
December 31, 2007 and 2006
| | | | | | | |
| | | 2007 | | 2006 | |
| | | (Dollars in thousands,
except per share data) | |
ASSETS | | | | |
Cash and due from banks | | $ | 11,425 | | $ | 12,189 | |
Interest-earning deposits with banks | | | 1,139 | | | 1,249 | |
Federal funds sold | | | 18,202 | | | 44,059 | |
Investment securities available for sale, at fair value (Note C) | | | 34,843 | | | 41,932 | |
| | |
Loans (Note D) | | | 469,228 | | | 345,943 | |
Less allowances for loan losses (Note E) | | | 5,020 | | | 3,983 | |
| | | | | | | |
NET LOANS | | | 464,208 | | | 341,960 | |
Accrued interest receivable | | | 2,090 | | | 1,754 | |
Stock in the Federal Home Loan Bank of Atlanta, at cost | | | 1,621 | | | 939 | |
Premises and equipment (Note F) | | | 10,463 | | | 7,810 | |
Other assets (Note I) | | | 3,529 | | | 3,585 | |
| | | | | | | |
TOTAL ASSETS | | $ | 547,520 | | $ | 455,477 | |
| | | | | | | |
LIABILITIES AND SHAREHOLDERS’ EQUITY | | | | | | | |
Deposits: | | | | | | | |
Demand | | $ | 94,788 | | $ | 105,228 | |
Savings, money market and NOW | | | 199,503 | | | 154,400 | |
Time (Note G) | | | 163,019 | | | 142,450 | |
| | | | | | | |
TOTAL DEPOSITS | | | 457,310 | | | 402,078 | |
Accrued interest payable | | | 2,511 | | | 2,297 | |
Short-term borrowings (Note H) | | | 37,886 | | | 10,670 | |
Long-term debt (Note H) | | | 16,332 | | | 11,196 | |
Accrued expenses and other liabilities (Note N) | | | 1,924 | | | 2,639 | |
| | | | | | | |
TOTAL LIABILITIES | | | 515,963 | | | 428,880 | |
| | | | | | | |
Commitments (Note L) | | | | | | | |
Shareholders’ equity (Notes K and N): | | | | | | | |
Preferred stock, no par value, 1,000,000 shares
authorized, none issued | | | - | | | - | |
Common stock, no par value as of May 9, 2007; prior to | | | | | | | |
May 9, 2007 $1 par value; 10,000,000 shares authorized | | | | | | | |
6,974,604 and 4,542,061 shares issued and outstanding | | | | | | | |
December 31, 2007 and 2006, respectively | | | 19,609 | | | 4,542 | |
Additional paid-in capital | | | - | | | 14,002 | |
Accumulated earnings | | | 11,439 | | | 8,344 | |
Accumulated other comprehensive income (loss) | | | 509 | | | (291 | ) |
| | | | | | | |
TOTAL SHAREHOLDERS’ EQUITY | | | 31,557 | | | 26,597 | |
| | | | | | | |
TOTAL LIABILITIES AND | | | | | | | |
SHAREHOLDERS’ EQUITY | | $ | 547,520 | | $ | 455,477 | |
| | | | | | | |
See accompanying notes.
F-3
NORTH STATE BANCORP
CONSOLIDATED STATEMENTS OF OPERATIONS
Years Ended December 31, 2007, 2006 and 2005
| | | | | | | | | |
| | | 2007 | | 2006 | | 2005 |
| | | (Dollars in thousands, except per share data) |
INTEREST INCOME | | | | | | | | | |
Loans | | $ | 29,756 | | $ | 23,426 | | $ | 16,911 |
Investment securities: | | | | | | | | | |
Taxable | | | 1,482 | | | 1,474 | | | 1,078 |
Tax-exempt | | | 269 | | | 265 | | | 110 |
Federal funds sold | | | 1,010 | | | 1,031 | | | 643 |
Dividends and interest earning deposits | | | 221 | | | 216 | | | 39 |
| | | | | | | | | |
TOTAL INTEREST INCOME | | | 32,738 | | | 26,412 | | | 18,781 |
| | | | | | | | | |
INTEREST EXPENSE | | | | | | | | | |
Money market, NOW and savings deposits | | | 6,883 | | | 5,210 | | | 2,786 |
Time deposits | | | 7,186 | | | 5,322 | | | 3,141 |
Short-term borrowings | | | 515 | | | 274 | | | 229 |
Long-term debt | | | 855 | | | 781 | | | 341 |
| | | | | | | | | |
TOTAL INTEREST EXPENSE | | | 15,439 | | | 11,587 | | | 6,497 |
| | | | | | | | | |
| | | |
NET INTEREST INCOME | | | 17,299 | | | 14,825 | | | 12,284 |
PROVISION FOR LOAN LOSSES (Note E) | | | 1,339 | | | 69 | | | 792 |
| | | | | | | | | |
NET INTEREST INCOME AFTER PROVISION FOR LOAN LOSSES | | | 15,960 | | | 14,756 | | | 11,492 |
| | | | | | | | | |
| | | |
NON-INTEREST INCOME (Note J) | | | 1,121 | | | 1,174 | | | 1,310 |
| | | | | | | | | |
NON-INTEREST EXPENSE | | | | | | | | | |
Salaries and employee benefits (Note N) | | | 6,574 | | | 5,539 | | | 4,602 |
Occupancy and equipment (Note F) | | | 1,900 | | | 1,672 | | | 1,370 |
Other (Note J) | | | 3,559 | | | 3,532 | | | 2,929 |
| | | | | | | | | |
TOTAL NON-INTEREST EXPENSE | | | 12,033 | | | 10,743 | | | 8,901 |
| | | | | | | | | |
| | | |
INCOME BEFORE INCOME TAXES | | | 5,048 | | | 5,187 | | | 3,901 |
INCOME TAXES (Note I) | | | 1,953 | | | 1,915 | | | 1,463 |
| | | | | | | | | |
NET INCOME | | $ | 3,095 | | $ | 3,272 | | $ | 2,438 |
| | | | | | | | | |
NET INCOME PER COMMON SHARE | | | | | | | | | |
Basic | | $ | .45 | | $ | .49 | | $ | .38 |
| | | | | | | | | |
Diluted | | $ | .42 | | $ | .46 | | $ | .35 |
| | | | | | | | | |
WEIGHTED AVERAGE COMMON SHARES OUTSTANDING | | | | | | | | | |
Basic | | | 6,917,365 | | | 6,617,228 | | | 6,392,127 |
| | | | | | | | | |
Diluted | | | 7,301,377 | | | 7,162,121 | | | 6,944,169 |
| | | | | | | | | |
See accompanying notes.
F-4
NORTH STATE BANCORP
CONSOLIDATED STATEMENTS OF COMPREHENSIVE INCOME
Years Ended December 31, 2007, 2006 and 2005
| | | | | | | | | | | | |
| | | 2007 | | | 2006 | | | 2005 | |
| | | (Dollars in thousands) | |
Net income | | $ | 3,095 | | | $ | 3,272 | | | $ | 2,438 | |
| | | | | | | | | | | | |
Other comprehensive income (loss): | | | | | | | | | | | | |
Securities available for sale: | | | | | | | | | | | | |
Unrealized holding gains (losses) on available for sale securities | | | 524 | | | | 278 | | | | (373 | ) |
Tax effect | | | (202 | ) | | | (106 | ) | | | 145 | |
Reclassification of losses recognized in net income | | | - | | | | - | | | | (3 | ) |
Tax effect | | | - | | | | - | | | | 1 | |
| | | | | | | | | | | | |
Net of tax amount | | | 322 | | | | 172 | | | | (230 | ) |
| | | | | | | | | | | | |
Cash flow hedging activities: | | | | | | | | | | | | |
Unrealized holding gains (losses) on hedging activities | | | 700 | | | | (60 | ) | | | - | |
Tax effect | | | (248 | ) | | | 23 | | | | - | |
Reclassification of gain recognized in net income | | | 42 | | | | - | | | | - | |
Tax effect | | | (16 | ) | | | - | | | | - | |
| | | | | | | | | | | | |
Net of tax amount | | | 478 | | | | (37 | ) | | | - | |
| | | | | | | | | | | | |
Total other comprehensive income (loss) | | | 800 | | | | 135 | | | | (230 | ) |
| | | | | | | | | | | | |
Comprehensive income | | $ | 3,895 | | | $ | 3,407 | | | $ | 2,208 | |
| | | | | | | | | | | | |
See accompanying notes.
F-5
NORTH STATE BANCORP
CONSOLIDATED STATEMENTS OF CHANGES IN SHAREHOLDERS’ EQUITY
Years Ended December 31, 2007, 2006 and 2005
| | | | | | | | | | | | | | | | | | | | |
| | | Common stock | | Additional
paid-in
capital | | | Accumulated
earnings | | Accumulated
other
comprehensive
income (loss) | | | Total
shareholders’
equity | |
| | | Shares | | Amount | | | | |
| | | (Dollars in thousands, except per share data) | |
Balance at December 31, 2004 | | 2,366,041 | | $ | 2,366 | | $ | 14,110 | | | $ | 2,634 | | $ | (196 | ) | | $ | 18,914 | |
Net income | | - | | | - | | | - | | | | 2,438 | | | - | | | | 2,438 | |
Other comprehensive loss, net of tax | | - | | | - | | | - | | | | - | | | (230 | ) | | | (230 | ) |
Six-for-five stock split | | 473,980 | | | 474 | | | (474 | ) | | | - | | | - | | | | - | |
Stock options exercised | | 2,138 | | | 2 | | | 16 | | | | - | | | - | | | | 18 | |
| | | | | | | | | | | | | | | | | | | | |
Balance at December 31, 2005 | | 2,842,159 | | | 2,842 | | | 13,652 | | | | 5,072 | | | (426 | ) | | | 21,140 | |
Net income | | - | | | - | | | - | | | | 3,272 | | | - | | | | 3,272 | |
Other comprehensive income, net of tax | | - | | | - | | | - | | | | - | | | 135 | | | | 135 | |
Three-for-two stock split | | 1,471,881 | | | 1,472 | | | (1,472 | ) | | | - | | | - | | | | - | |
Stock based compensation | | - | | | - | | | 65 | | | | - | | | - | | | | 65 | |
Stock options exercised including income tax benefit of $844 | | 228,021 | | | 228 | | | 1,757 | | | | - | | | - | | | | 1,985 | |
| | | | | | | | | | | | | | | | | | | | |
Balance at December 31, 2006 | | 4,542,061 | | | 4,542 | | | 14,002 | | | | 8,344 | | | (291 | ) | | | 26,597 | |
Net income | | - | | | - | | | - | | | | 3,095 | | | 0 | | | | 3,095 | |
Other comprehensive income, net of tax | | - | | | - | | | - | | | | - | | | 800 | | | | 800 | |
Three-for-two stock split | | 2,300,561 | | | - | | | - | | | | - | | | - | | | | - | |
Stock based compensation | | - | | | 109 | | | - | | | | - | | | - | | | | 109 | |
Stock options exercised including income tax benefit of $504 | | 131,982 | | | 780 | | | 176 | | | | - | | | - | | | | 956 | |
Change in par value of common stock | | - | | | 14,178 | | | (14,178 | ) | | | - | | | - | | | | - | |
| | | | | | | | | | | | | | | | | | | | |
Balance at December 31, 2007 | | 6,974,604 | | $ | 19,609 | | $ | - | | | $ | 11,439 | | $ | 509 | | | $ | 31,557 | |
| | | | | | | | | | | | | | | | | | | | |
See accompanying notes.
F-6
NORTH STATE BANCORP
CONSOLIDATED STATEMENTS OF CASH FLOWS
Years Ended December 31, 2007, 2006 and 2005
| | | | | | | | | | | | |
| | | 2007 | | | 2006 | | | 2005 | |
| | | (Dollars in thousands) | |
CASH FLOWS FROM OPERATING ACTIVITIES | | | | | | | | | | | | |
Net income | | $ | 3,095 | | | $ | 3,272 | | | $ | 2,438 | |
Adjustments to reconcile net income to net cash provided by operating activities: | | | | | | | | | | | | |
Depreciation and amortization | | | 637 | | | | 542 | | | | 489 | |
Net (accretion) amortization of premiums on investment securities | | | (15 | ) | | | 21 | | | | 108 | |
Provision for loan losses | | | 1,339 | | | | 69 | | | | 792 | |
Stock based compensation | | | 109 | | | | 65 | | | | - | |
Deferred income taxes | | | (565 | ) | | | (278 | ) | | | (313 | ) |
Realized gain on sales of investment securities available for sale | | | - | | | | - | | | | (3 | ) |
Loss from sale of foreclosed assets | | | - | | | | - | | | | 9 | |
Change in assets and liabilities: | | | | | | | | | | | | |
Increase in accrued interest receivable | | | (336 | ) | | | (468 | ) | | | (396 | ) |
Decrease (increase) in other assets | | | 896 | | | | (1,423 | ) | | | (492 | ) |
Increase in accrued interest payable | | | 214 | | | | 903 | | | | 516 | |
Increase (decrease) in accrued expenses and other liabilities | | | (715 | ) | | | 1,031 | | | | 759 | |
| | | | | | | | | | | | |
NET CASH PROVIDED BY OPERATING ACTIVITIES | | | 4,659 | | | | 3,734 | | | | 3,907 | |
| | | | | | | | | | | | |
| | | |
CASH FLOWS FROM INVESTING ACTIVITIES | | | | | | | | | | | | |
Purchase of investment securities available for sale | | | (7,187 | ) | | | (12,177 | ) | | | (20,619 | ) |
Proceeds from maturities and repayments of investment securities available for sale | | | 14,816 | | | | 12,205 | | | | 12,923 | |
Proceeds from sales of investment securities available for sale | | | - | | | | - | | | | 887 | |
Net increase in loans | | | (123,587 | ) | | | (51,533 | ) | | | (49,721 | ) |
Redemption (purchase) of Federal Home Loan Bank stock | | | (682 | ) | | | (295 | ) | | | 125 | |
Purchases of premises and equipment | | | (3,290 | ) | | | (2,494 | ) | | | (2,105 | ) |
Proceeds from disposal of premises and equipment | | | - | | | | - | | | | 14 | |
Proceeds from sale of foreclosed assets | | | - | | | | - | | | | 512 | |
| | | | | | | | | | | | |
NET CASH USED BY INVESTING ACTIVITIES | | | (119,930 | ) | | | (54,294 | ) | | | (57,984 | ) |
| | | | | | | | | | | | |
| | | |
CASH FLOWS FROM FINANCING ACTIVITIES | | | | | | | | | | | | |
Net increase in deposits | | | 55,232 | | | | 64,707 | | | | 68,238 | |
Net change in short term borrowings | | | 27,216 | | | | 664 | | | | (4,267 | ) |
Issuance of junior subordinated debentures | | | 5,155 | | | | - | | | | 5,155 | |
Net change in long-term debt | | | (19 | ) | | | (19 | ) | | | 905 | |
Excess tax benefits from exercise of stock options | | | 504 | | | | 844 | | | | - | |
Proceeds from exercise of stock options | | | 452 | | | | 1,141 | | | | 18 | |
| | | | | | | | | | | | |
NET CASH PROVIDED BY FINANCING ACTIVITIES | | | 88,540 | | | | 67,337 | | | | 70,049 | |
| | | | | | | | | | | | |
| | | |
NET INCREASE (DECREASE) IN CASH AND CASH EQUIVALENTS | | | (26,731 | ) | | | 16,777 | | | | 15,972 | |
CASH AND CASH EQUIVALENTS, BEGINNING | | | 57,497 | | | | 40,720 | | | | 24,748 | |
| | | | | | | | | | | | |
| | | |
CASH AND CASH EQUIVALENTS, ENDING | | $ | 30,766 | | | $ | 57,497 | | | $ | 40,720 | |
| | | | | | | | | | | | |
See accompanying notes.
F-7
NORTH STATE BANCORP
CONSOLIDATED STATEMENTS OF CASH FLOWS (Continued)
Years Ended December 31, 2007, 2006 and 2005
| | | | | | | | | | | |
| | | 2007 | | 2006 | | | 2005 | |
| | | (Dollars in thousands) | |
SUPPLEMENTAL DISCLOSURES OF CASH FLOW INFORMATION | | | | | | | | | | | |
Interest paid | | $ | 15,226 | | $ | 12,490 | | | $ | 5,981 | |
Income taxes paid | | | 1,684 | | | 1,814 | | | | 1,885 | |
| | | |
SUPPLEMENTAL DISCLOSURES OF NONCASH INVESTING ACTIVITIES | | | | | | | | | | | |
Unrealized gain (loss) on investment securities available for sale, net of tax | | $ | 322 | | $ | 172 | | | $ | (230 | ) |
Unrealized gain (loss) on hedging activities, net of tax | | | 478 | | | (37 | ) | | | - | |
See accompanying notes.
F-8
NORTH STATE BANCORP
NOTES TO CONSOLIDATED FINANCIAL STATEMENTS
December 31, 2007, 2006 and 2005
NOTE A - ORGANIZATION AND OPERATIONS
On June 28, 2002, North State Bancorp (the “Company”) was formed as a holding company for North State Bank (the “Bank”). Upon formation, one share of the Company’s $1 par value common stock was exchanged for each of the outstanding shares of the Bank’s $5 par value common stock. On May 9, 2007, the Company’s shareholders approved the decrease of the Company’s par value of common stock from $1.00 per share to no par value per share. The Company currently has no operations and conducts no business on its own other than owning the Bank, North State Statutory Trust I, North State Statutory Trust II and North State Statutory Trust III, all of which are wholly-owned subsidiaries of the Company. The Company is subject to the rules and regulations of the Federal Reserve Bank and the North Carolina Commissioner of Banks.
The Bank was incorporated May 25, 2000 and began banking operations on June 1, 2000. The Bank is engaged in general commercial and retail banking in central North Carolina, principally Wake County and in southeast North Carolina in New Hanover County, operating under the banking laws of North Carolina and the rules and regulations of the Federal Deposit Insurance Corporation and the North Carolina Commissioner of Banks. The Bank undergoes periodic examinations by those regulatory authorities. The Bank’s wholly-owned subsidiary, North State Bank Financial Services, Inc., offers brokerage services.
NOTE B - SUMMARY OF SIGNIFICANT ACCOUNTING POLICIES
Basis of Presentation
The accompanying consolidated financial statements include the accounts and transactions of North State Bancorp and its wholly owned subsidiary North State Bank. All significant intercompany transactions and balances are eliminated in consolidation. North State Bancorp and its subsidiary are collectively referred to herein as the “Company”.
Under Financial Accounting Standards Board (“FASB”) Interpretation No. 46, “Consolidation of Variable Interest Entities” North State Statutory Trust I, North State Statutory Trust II and North State Statutory Trust III are not included in the Company’s consolidated financial statements. The junior subordinated debentures issued by the Company to the three Trusts are included in long-term debt and the Company’s equity interest in the three Trusts is included in other assets.
Use of Estimates
The preparation of consolidated financial statements in conformity with accounting principles generally accepted in the United States of America requires management to make estimates and assumptions that affect the reported amounts of assets and liabilities and the disclosure of contingent assets and liabilities at the date of the financial statements and the reported amounts of revenues and expenses during the reporting period. Actual results could differ from those estimates. Material estimates that are particularly susceptible to significant change relate to the determination of the allowance for loan losses.
Cash and Cash Equivalents
For the purpose of presentation in the statement of cash flows, cash and cash equivalents include cash and due from banks, interest-earning deposits with banks and federal funds sold.
Securities Available for Sale
Available for sale securities are reported at fair value and consist of debt instruments not classified as trading securities or as held to maturity securities. Unrealized holding gains and losses on available for sale securities are reported, net of related tax effect, in other comprehensive income. Gains and losses on the sale of available for sale securities are determined using the specific-identification method. Declines in the fair value of available for sale securities below their cost that are other than temporary would result in write-downs of the individual securities to their fair value. Such write-downs would be included in earnings as realized losses. Premiums and discounts are recognized in interest income using the interest method over the period to maturity.
F-9
NORTH STATE BANCORP
NOTES TO CONSOLIDATED FINANCIAL STATEMENTS
December 31, 2007, 2006 and 2005
NOTE B - SUMMARY OF SIGNIFICANT ACCOUNTING POLICIES (Continued)
Loans
Loans that management has the intent and ability to hold for the foreseeable future or until maturity are reported at their outstanding principal adjusted for any charge-offs, the allowance for loan losses, and any deferred fees or costs on originated loans and unamortized premiums or discounts on purchased loans. Loan origination fees and certain direct origination costs are capitalized and recognized as an adjustment of the yield of the related loan. The accrual of interest on loans is discontinued when, in management’s opinion, the borrower may be unable to meet payments as they become due. When interest accrual is discontinued, all unpaid accrued interest is reversed against interest income. Interest income is subsequently recognized only to the extent cash payments are received. Loans are written down or charged off when management has determined the loan to be uncollectible in part or in total.
Allowance for Loan Losses
The provision for loan losses is based upon management’s estimate of the amount needed to maintain the allowance for loan losses at an adequate level. In evaluating the allowance for loan losses the Company prepares an analysis of its current loan portfolio using historical loss rates, peer statistics and data from its portfolio. The Company utilizes a system of nine possible risk ratings. The risk ratings are established based on perceived probability of loss. All loans risk rated “doubtful” and “loss” are removed from their homogeneous group and individually evaluated for impairment as detailed in Statement of Financial Accounting Standards (“SFAS”) No. 114, “Accounting by Creditors for Impairment of a Loan as amended by SFAS No. 118, Accounting by Creditors for Impairment of a Loan - Income Recognition and Disclosure”. Other groups of loans based on loan size may be selected for impairment review. The Company has identified seven factors that are considered as indicators of changes in the level of risk of loss inherent with the Company’s loan portfolio. These factors include payment performance, overall portfolio quality utilizing weighted average risk rating, general economic factors such as unemployment, inflation, delinquency and charge-off rates, regulatory examination results, the interest rate environment, levels of highly leveraged transactions and levels of commercial real estate concentrations, which address the risks associated with construction, development and non-owner occupied commercial real estate lending.
In accordance with SFAS No. 114, a loan is considered impaired when, based on current information and events, it is considered probable that the Company will be unable to collect the scheduled payments of principal and interest when due according to the contractual terms of the loan agreement. The measurement of impaired loans is generally based on the present value of expected future cash flows discounted at the historical effective interest rate, or upon the fair value of the collateral if the loan is collateral dependent. If the recorded investment in the loan exceeds the measure of fair value, a valuation allowance is established as a component of the allowance for loan losses.
While management uses the best information available to make evaluations, future adjustments to the allowance may be necessary if conditions differ substantially from the assumptions used in making the evaluations. In addition, regulatory examiners may require the Company to recognize adjustments to the allowance for loan losses based on their judgments about information available to them at the time of their examination.
Mortgage Origination Fees
The Company originates single family, residential first mortgage loans as a mortgage broker. The Company does not retain the mortgage loans it originates. The Company recognizes certain origination and service release fees at the time of closing, which are included in non-interest income as “Mortgage origination fees.”
F-10
NORTH STATE BANCORP
NOTES TO CONSOLIDATED FINANCIAL STATEMENTS
December 31, 2007, 2006 and 2005
NOTE B - SUMMARY OF SIGNIFICANT ACCOUNTING POLICIES (Continued)
Premises and Equipment
Premises and equipment are stated at cost less accumulated depreciation. Depreciation is calculated on the straight-line method over the estimated useful lives of the assets which are 3 - 10 years for furniture and equipment and 30 years for buildings. Leasehold improvements are amortized over the terms of the respective leases or the estimated useful lives of the improvements, whichever is shorter. Repairs and maintenance costs are charged to operations as incurred and additions and improvements to premises and equipment are capitalized. Upon sale or retirement, the cost and related accumulated depreciation are removed from the accounts and any gains or losses are reflected in current operations. Long-lived depreciable assets are evaluated periodically for impairment when events or changes in circumstances indicate the carrying amount may not be recoverable.
Foreclosed Assets
Assets acquired through, or in lieu of, foreclosure are held for sale and are initially recorded at fair value at the date of foreclosure, establishing a new cost basis. Principal and interest losses existing at the time of acquisition of such assets are charged against the allowance for loan losses and interest income, respectively. Subsequent to foreclosure, valuations are periodically performed by management and the assets are carried at the lower of carrying amount or fair value less estimated cost to sell. Revenue and expenses from operations and changes in the valuation allowance are included in other expenses.
Stock in Federal Home Loan Bank of Atlanta
As a requirement for membership, the Company invests in stock of the Federal Home Loan Bank of Atlanta (“FHLB”). This investment was carried at a cost of $1.6 million and $939,000, respectively, as of December 31, 2007 and 2006. Due to the redemption provisions of the FHLB, the Company estimated that fair value equals cost and that this investment was not impaired at December 31, 2007.
Income Taxes
Deferred tax assets and liabilities are recognized for the estimated future tax consequences attributable to differences between the tax basis of assets and liabilities and their carrying amounts for financial reporting purposes. Deferred tax assets and liabilities are measured using enacted tax rates in effect for the year in which the temporary differences are expected to be recovered or settled. Deferred tax assets are reduced by a valuation allowance if it is more likely than not that the tax benefits will not be realized.
Stock Compensation Plans
Effective January 1, 2006, the Company adopted SFAS No. 123 (revised 2004), “Share-Based Payment” (“SFAS No. 123R”), which was issued by the Financial Accounting Standards Board (“FASB”), in December 2004. SFAS No. 123R revises SFAS No. 123, “Accounting for Stock Based Compensation,” and supersedes Accounting Principles Board (“APB”) No. 25, “Accounting for Stock Issued to Employees” (“APB No. 25”), and its related interpretations. SFAS No.123R requires recognition of the cost of employee services received in exchange for an award of equity instruments in the financial statements over the period the employee is required to perform the services in exchange for the award (presumptively the vesting period). SFAS No. 123R also requires measurement of the cost of employee services received in exchange for an award based on the grant-date fair value of the award. SFAS No. 123R also amends SFAS No. 95, “Statement of Cash Flows,” to require that excess tax benefits be reported as financing cash inflows, rather than as a reduction of taxes paid, which is included within operating cash flows.
The Company adopted SFAS No. 123R on January 1, 2006 using the modified prospective application as permitted under SFAS No.123R. Accordingly, prior period amounts have not been restated. Under this application, the Company is required to record compensation expense for all awards granted after the date of adoption and for the unvested portion of previously granted awards that remain outstanding at the date of adoption. Prior to the adoption of SFAS No. 123R, the Company used the intrinsic value method as prescribed by APB No. 25 and thus recognized
F-11
NORTH STATE BANCORP
NOTES TO CONSOLIDATED FINANCIAL STATEMENTS
December 31, 2007, 2006 and 2005
NOTE B - SUMMARY OF SIGNIFICANT ACCOUNTING POLICIES (Continued)
Stock Compensation Plans (Continued)
no compensation expense for options granted with exercise prices equal to the fair market value of the Company’s common stock on the date of grant.
At December 31, 2007, the Company had three stock-based compensation plans, which are more fully described in Note N.
Earnings Per Common Share
The Company issued a 3-for-2 stock split in each of 2007 and 2006 and a 6-for-5 stock split in 2005. All references in these financial statements to per share results and weighted average common and potential common shares outstanding have been adjusted for the effects of these stock splits.
Basic earnings per share represents income available to common shareholders divided by the weighted-average number of common shares outstanding during the period. Diluted earnings per share reflect additional common shares that would have been outstanding if dilutive potential common shares had been issued, as well as any adjustment to income that would result from the assumed issuance. Potential common shares that may be issued by the Company relate solely to outstanding stock options. Basic and diluted net income per common share have been computed based upon net income as presented in the accompanying consolidated statements of operations divided by the weighted average number of common shares outstanding or assumed to be outstanding as summarized below:
| | | | | | |
| | | 2007 | | 2006 | | 2005 |
Weighted average number of common shares used in computing basic net income per share | | 6,917,365 | | 6,617,228 | | 6,392,127 |
Effect of dilutive stock options | | 384,012 | | 544,893 | | 552,042 |
| | | | | | |
Weighted average number of common shares and dilutive potential common shares used in computing diluted net income per share | | 7,301,377 | | 7,162,121 | | 6,944,169 |
| | | | | | |
For the year ended December 31, 2007 there were 11,776 anti-dilutive shares excluded from the calculation of total dilutive weighted average shares due to the exercise price exceeding the average market price for the year. There were no anti-dilutive options for the years ended December 31, 2006 and 2005.
Comprehensive Income (Loss)
The Company reports as comprehensive income all changes in shareholders’ equity during the year from sources other than shareholders. Other comprehensive income refers to all components (revenues, expenses, gains and losses) of comprehensive income that is excluded from net income. The Company’s other comprehensive income includes unrealized gains and losses on investment securities available for sale, net of income taxes and unrealized holding gains (losses) on hedge instruments, net of income taxes.
F-12
NORTH STATE BANCORP
NOTES TO CONSOLIDATED FINANCIAL STATEMENTS
December 31, 2007, 2006 and 2005
NOTE B - SUMMARY OF SIGNIFICANT ACCOUNTING POLICIES (Continued)
Comprehensive Income (Loss) (Continued)
Accumulated other comprehensive income consists of the following:
| | | | | | | | | | | | |
| Accumulated other comprehensive income (loss): | | 2007 | | | 2006 | | | 2005 | |
| | | (Dollars in thousands) | |
Unrealized holding gains (losses) on available for sale securities | | $ | 115 | | | $ | (410 | ) | | $ | (688 | ) |
Tax effect | | | (47 | ) | | | 156 | | | | 262 | |
| | | | | | | | | | | | |
Net unrealized holding gains (losses) on available for sale securities | | | 68 | | | | (254 | ) | | | (426 | ) |
| | | | | | | | | | | | |
| | | |
Unrealized holding gains (losses) on hedging activities | | | 681 | | | | (60 | ) | | | - | |
Tax effect | | | (240 | ) | | | 23 | | | | - | |
| | | | | | | | | | | | |
Net unrealized holding gains (losses) on hedging activities | | | 441 | | | | (37 | ) | | | - | |
| | | | | | | | | | | | |
Total accumululated other comprehensive income (loss) | | $ | 509 | | | $ | (291 | ) | | $ | (426 | ) |
| | | | | | | | | | | | |
Derivative Instruments
The Company’s deposit and loan activities are vulnerable to interest rate risk. The associated variability in cash flows may impact the results of operations of the Company. The Company’s hedging strategy is generally intended to take advantage of opportunities to reduce, to the extent possible, unpredictable cash flows. The Company may employ a variety of common derivative products that are instruments used by financial institutions to manage interest rate risk. The financial instruments that may be used as part of a hedging strategy include swaps, caps, floors and collars.
Under the guidelines of SFAS No. 133, derivative financial instruments generally are required to be carried at fair value. Derivative instruments designated in a hedge relationship to mitigate exposure to changes in the fair value of an asset, liability, or firm commitment attributable to a particular risk, such as interest rate risk, are considered fair value hedges under SFAS No. 133. Derivative instruments designated in a hedge relationship to mitigate exposure to variability in expected future cash flows, or other types of forecasted transactions, are considered cash flow hedges.
The Company does not enter into derivative financial instruments for speculative or trading purposes.
The Company utilizes a stand-alone derivative financial instrument, in the form of an interest rate floor, in its asset/liability management program. Under the guidelines of SFAS No. 133, derivative financial instruments generally are required to be carried at fair value. The floor is designated as a cash flow hedge of the overall changes in cash flows on the first Prime based interest payments received by the Company each calendar month during the term of the hedge that in aggregate for each period, are interest payments on principal from specified portfolios greater than or equal to the notional amount of the floor.
Segment Reporting
SFAS No. 131, “Disclosures about Segments of an Enterprise and Related Information”, requires management to report selected financial and descriptive information about reportable operating segments. It also establishes standards for related disclosures about products and services, geographic areas, and major customers. Generally, disclosures are required for segments internally identified to evaluate performance and resource allocation. In all material respects, the Company’s operations are entirely within the commercial and retail banking segment, and the consolidated financial statements presented herein reflect the results of that segment. Also, the Company has no foreign operations or customers.
Recent Accounting Pronouncements
FASB Staff Position (“FSP”) FIN 39-1, “Amendment of FASB Interpretation No. 39”, amends FIN 39 to permit entities to offset fair value amounts recognized for derivative instruments and fair value amounts recognized for the
F-13
NORTH STATE BANCORP
NOTES TO CONSOLIDATED FINANCIAL STATEMENTS
December 31, 2007, 2006 and 2005
NOTE B - SUMMARY OF SIGNIFICANT ACCOUNTING POLICIES (Continued)
Recent Accounting Pronouncements (Continued)
right to reclaim cash collateral (a receivable) or obligation to return cash collateral (a payable) arising from derivative instruments executed with the same counterparty under a master netting arrangement. FSP FIN 39-1 is effective for fiscal years beginning after November 15, 2007 and the effects of applying this FSP, if any, are to be recognized as a change in accounting principle through retrospective application. The Company anticipates that this FSP will have a limited impact on the Company’s financial position, results of operations and cash flows.
The Company adopted the provisions of SFAS No. 155, “Accounting for Certain Hybrid Financial Instruments” (“SFAS 155”), effective January 1, 2007. The adoption of the provisions of SFAS 155 had no effect on the Company’s consolidated financial position or results of operations.
The provisions of SFAS No. 156, “Accounting for Servicing of Financial Assets—an amendment of FASB Statement No. 140” (“SFAS 156”), were effective beginning January 1, 2007. The adoption of the provisions of SFAS 156 had no effect on the Company’s consolidated financial position or results of operations.
SFAS 157, “Fair Value Measurements” (“SFAS 157”), defines fair value, establishes a framework for measuring fair value in generally accepted accounting principles, and expands disclosures about fair value measurements. SFAS 157 is effective for fiscal years beginning after November 15, 2007. The Company has evaluated the effect of implementing SFAS 157 on its financial position and results of operations and has determined that the impact of implementation will not have a material effect on its financial assets and liabilities, including its derivative financial instruments.
SFAS 159, “The Fair Value Option for Financial Assets and Financial Liabilities” (“SFAS 159”), permits an entity to choose to measure many financial instruments and certain other items at fair value. The fair value option permits companies to choose to measure eligible items at fair value at specified election dates. Companies will report unrealized gains and losses on items for which the fair value option has been elected in earnings after adoption. SFAS 159 requires additional disclosures related to the fair value measurements included in the companies financial statements. This statement is effective for financial statements issued for fiscal years beginning after November 15, 2007. Early adoption is permitted; however, the Company will adopt SFAS 159 effective January 1, 2008. The Company has evaluated the effect of implementing SFAS 159 and has determined that the impact of implementation will not have a material effect on its financial position or results of operations.
On March 19, 2008, FASB issued Statement No. 161, “Disclosures about Derivative Instruments and Hedging Activities”. The new standard is intended to improve financial reporting about derivative instruments and hedging activities by requiring enhanced disclosures to enable investors to better understand their effects on an entity’s financial position, financial performance, and cash flows. It is effective for financial statements issued for fiscal years and interim periods beginning after November 15, 2008. The standard was not yet adopted as of December 31, 2007.
In June 2006, the FASB issued Interpretation No. 48, “Accounting for Uncertainty in Income Taxes – an interpretation of FASB Statement No. 109” (“FIN 48”). The Company adopted the provisions of FASB Interpretation No. 48 (“FIN 48”) on January 1, 2007. There was no material impact from the adoption of FIN 48.
The Emerging Issues Task Force (“EITF”) of FASB reached a consensus at its September 2006 meeting regarding EITF 06-5, “Accounting for Purchases of Life Insurance Determining the Amount That Could be Realized in Accordance with FASB Technical Bulletin No. 85-4”. The scope of EITF 06-5 is limited to the determination of net cash surrender value of a life insurance contract in accordance with Technical Bulletin 85-4. This EITF outlines when contractual limitations of the policy should be considered when determining the net realizable value of the contract. EITF 06-5 is effective for fiscal years beginning after December 15, 2006, with earlier application permitted. The adoption of the provisions of EITF 06-5 had no effect on the Company’s consolidated financial position or results of operations.
F-14
NORTH STATE BANCORP
NOTES TO CONSOLIDATED FINANCIAL STATEMENTS
December 31, 2007, 2006 and 2005
NOTE B - SUMMARY OF SIGNIFICANT ACCOUNTING POLICIES (Continued)
Recent Accounting Pronouncements (Continued)
From time to time the FASB issues exposure drafts for proposed statements of financial accounting standards. Such exposure drafts are subject to comment from the public, to revisions by the FASB and to final issuance by the FASB as statements of financial accounting standards. Management considers the effect of the proposed statements on the consolidated financial statements of the Company and monitors the status of changes to and proposed effective dates of exposure drafts.
Reclassification
Certain amounts in the 2006 and 2005 financial statements have been reclassified to conform with the 2007 presentation. The reclassifications had no effect on net income or shareholders’ equity as previously reported.
NOTE C - INVESTMENT SECURITIES
The amortized cost and fair value of securities available for sale, with gross unrealized gains and losses, follows:
| | | | | | | | | | | | |
| | | At December 31, 2007 |
| | | Amortized
cost | | Gross
unrealized
gains | | Gross
unrealized
losses | | Fair
value |
| Securities available for sale: | | (Dollars in thousands) |
| | | | |
U. S. government securities and obligations of U.S. governmental agencies | | $ | 9,232 | | $ | 133 | | $ | 1 | | $ | 9,364 |
State and municipal securities | | | 5,993 | | | 2 | | | 25 | | | 5,970 |
Mortgage-backed securities | | | 19,503 | | | 118 | | | 112 | | | 19,509 |
| | | | | | | | | | | | |
Total securities available for sale | | $ | 34,728 | | $ | 253 | | $ | 138 | | $ | 34,843 |
| | | | | | | | | | | | |
| |
| | | At December 31, 2006 |
| | | Amortized
cost | | Gross
unrealized
gains | | Gross
unrealized
losses | | Fair
value |
| Securities available for sale: | | (Dollars in thousands) |
| | | | |
U. S. government securities and obligations of U.S. governmental agencies | | $ | 11,991 | | $ | 9 | | $ | 57 | | $ | 11,943 |
State and municipal securities | | | 6,110 | | | - | | | 34 | | | 6,076 |
Mortgage-backed securities | | | 24,240 | | | 11 | | | 338 | | | 23,913 |
| | | | | | | | | | | | |
Total securities available for sale | | $ | 42,341 | | $ | 20 | | $ | 429 | | $ | 41,932 |
| | | | | | | | | | | | |
The following table shows at December 31, 2007 and 2006 gross unrealized losses on and fair values of the Company’s investments, aggregated by investment category and length of time that the individual securities have been in a continuous unrealized loss position. All unrealized losses on investment securities are considered by management to be temporary given the credit ratings on these investment securities and the Company’s intent and ability to hold its securities to maturity. The unrealized losses relate to two U.S. Government Agency bonds, 14 mortgage-backed securities and three municipal bonds. The unrealized losses are not likely to reverse unless and until market interest rates decline to the levels that existed when the securities were purchased. Since none of the unrealized losses relate to the marketability of the securities or the issuer’s ability to honor redemption obligations, none of the securities are deemed to be other than temporarily impaired.
F-15
NORTH STATE BANCORP
NOTES TO CONSOLIDATED FINANCIAL STATEMENTS
December 31, 2007, 2006 and 2005
NOTE C - INVESTMENT SECURITIES (Continued)
| | | | | | | | | | | | | | | | | | |
| | | 2007 |
| | | Less than 12 months | | 12 months of more | | Total |
| | | Fair
Value | | Unrealized
Losses | | Fair
Value | | Unrealized
Losses | | Fair
Value | | Unrealized
Losses |
| | | (Dollars in thousands) |
Securities available for sale: | | | | | | | | | | | | | | | | | | |
U. S. government securities and obligations of U.S. government agencies | | $ | - | | $ | - | | $ | 1,997 | | $ | 1 | | $ | 1,997 | | $ | 1 |
State and local governments | | | 1,519 | | | 22 | | | 548 | | | 3 | | | 2,067 | | | 25 |
Mortgage-backed securities | | | - | | | - | | | 8,306 | | | 112 | | | 8,306 | | | 112 |
| | | | | | | | | | | | | | | | | | |
Total temporarily impaired securities | | $ | 1,519 | | $ | 22 | | $ | 10,851 | | $ | 116 | | $ | 12,370 | | $ | 138 |
| | | | | | | | | | | | | | | | | | |
| |
| | | 2006 |
| | | Less than 12 months | | 12 months of more | | Total |
| | | Fair
Value | | Unrealized
Losses | | Fair
Value | | Unrealized
Losses | | Fair
Value | | Unrealized
Losses |
| | | (Dollars in thousands) |
Securities available for sale: | | | | | | | | | | | | | | | | | | |
U. S. government securities and obligations of U.S. government agencies | | $ | 1,979 | | $ | 9 | | $ | 7,926 | | $ | 48 | | $ | 9,905 | | $ | 57 |
State and local governments | | | 1,529 | | | 12 | | | 1,547 | | | 22 | | | 3,076 | | | 34 |
Mortgage-backed securities | | | 4,634 | | | 19 | | | 14,615 | | | 319 | | | 19,249 | | | 338 |
| | | | | | | | | | | | | | | | | | |
Total temporarily impaired securities | | $ | 8,142 | | $ | 40 | | $ | 24,088 | | $ | 389 | | $ | 32,230 | | $ | 429 |
| | | | | | | | | | | | | | | | | | |
The amortized cost and fair values of securities available for sale at December 31, 2007 by contractual maturity are shown below. Expected maturities will differ from contractual maturities because borrowers may have the right to call or prepay obligations with or without call or prepayment penalties.
| | | | | | |
| | | As of December 31, 2007 |
| | | Amortized
Cost | | Fair
Value |
| | | (Dollars in thousands) |
Securities available for sale: | | | | | | |
Due within one year | | $ | 4,008 | | $ | 4,016 |
Due after one but within five years | | | 8,231 | | | 8,347 |
Due after five but within ten years | | | 4,442 | | | 4,459 |
Due after ten years | | | 18,047 | | | 18,021 |
| | | | | | |
| | $ | 34,728 | | $ | 34,843 |
| | | | | | |
Securities with a carrying value of $30.1 million and $17.3 million at December 31, 2007 and 2006, respectively, were pledged to secure securities sold under agreements to repurchase and public deposits.
No investment securities were sold during 2007 and 2006. During 2005, proceeds from the sale of investment securities of $887,000 resulted in a net gain of $3,000.
F-16
NORTH STATE BANCORP
NOTES TO CONSOLIDATED FINANCIAL STATEMENTS
December 31, 2007, 2006 and 2005
NOTE D - LOANS
Following is a summary of loans:
| | | | | | | | | | | | | | |
| | | At December 31, | |
| | | 2007 | | | 2006 | |
| | | Amount | | | % of
Total
Loans | | | Amount | | | % of
Total
Loans | |
| | | (Dollars in thousands) | |
| | | | |
Commercial | | $ | 320,386 | | | 68.22 | % | | $ | 239,014 | | | 69.04 | % |
Real estate - construction | | | 95,033 | | | 20.24 | % | | | 67,404 | | | 19.47 | % |
Real estate - 1 to 4 family mortgage | | | 29,534 | | | 6.29 | % | | | 21,438 | | | 6.19 | % |
Loans to individuals | | | 4,065 | | | 0.87 | % | | | 3,414 | | | 0.99 | % |
Home equity lines of credit | | | 20,592 | | | 4.38 | % | | | 14,933 | | | 4.31 | % |
| | | | | | | | | | | | | | |
Subtotal | | | 469,610 | | | 100.00 | % | | | 346,203 | | | 100.00 | % |
Unamortized net deferred loan fees | | | (382 | ) | | | | | | (260 | ) | | | |
| | | | | | | | | | | | | | |
Total loans | | $ | 469,228 | | | | | | $ | 345,943 | | | | |
| | | | | | | | | | | | | | |
Loans are primarily made in Wake County and New Hanover County in North Carolina. Real estate loans can be affected by the condition of the local real estate market. Commercial and installment loans can be affected by the local economic conditions.
Nonperforming assets at December 31, 2007 and 2006 consisted of the following:
| | | | | | | | |
| | | At December 31, | |
| | | 2007 | | | 2006 | |
| | | (Dollars in thousands) | |
| | |
Nonaccrual loans | | $ | 3,103 | | | $ | 397 | |
Restructured loans | | | - | | | | - | |
| | | | | | | | |
Total nonperforming loans | | | 3,103 | | | | 397 | |
Other real estate owned | | | - | | | | - | |
| | | | | | | | |
Total nonperforming assets | | $ | 3,103 | | | $ | 397 | |
| | | | | | | | |
| | |
Accruing loans past due ninety days or more | | $ | 492 | | | $ | - | |
Other impaired loans | | $ | 327 | | | $ | 242 | |
Allowance for loan losses | | $ | 5,020 | | | $ | 3,983 | |
Nonperforming loans to period end loans | | | 0.66 | % | | | 0.11 | % |
Allowance for loan losses to period end loans | | | 1.07 | % | | | 1.15 | % |
Nonperforming assets to loans and other real estate | | | 0.66 | % | | | 0.11 | % |
Nonperforming assets to total assets | | | 0.57 | % | | | 0.09 | % |
Ratio of allowance for loan losses to nonperforming loans | | | 1.62 | x | | | 10.03 | x |
F-17
NORTH STATE BANCORP
NOTES TO CONSOLIDATED FINANCIAL STATEMENTS
December 31, 2007, 2006 and 2005
NOTE D – LOANS (Continued)
All loans rated “Doubtful” and “Loss” are individually analyzed for impairment as detailed in SFAS No. 114. Other groups of loans based on loan size may be selected for impairment review. At December 31, 2007, the total recorded investment in loans considered impaired in accordance with SFAS No. 114 totaled $3.9 million. Impaired loans of $3.4 million had a corresponding allowance of $472,000. There was no corresponding allowance for the remaining impaired loans consisting of two loans past due ninety days of $434,000 and $57,000. For the year ended December 31, 2007, the average recorded investment in impaired loans was approximately $761,000. The amount of interest recognized on impaired loans during the portion of the year that they were considered impaired was not material.
At December 31, 2006, the total recorded investment in loans that management considered impaired in accordance with SFAS No. 114 totaled $639,000 with a corresponding allowance of $534,000. For the year ended December 31, 2006, the average recorded investment in impaired loans was approximately $266,000. The amount of interest recognized on impaired loans during the portion of the year that they were considered impaired was not material.
The Company has had loan transactions with its directors and executive officers. Such loans were made in the ordinary course of business and on substantially the same terms and collateral as those for comparable transactions prevailing at the time and did not involve more than the normal risk of collectability or present other unfavorable features. A summary of related party loan transactions is as follows (dollars in thousands):
| | | | |
Balance at December 31, 2006 | | $ | 12,580 | |
Additional borrowings | | | 10,222 | |
Loan repayments | | | (6,518 | ) |
| | | | |
Balance at December 31, 2007 | | $ | 16,284 | |
| | | | |
At December 31, 2007, the Company had pre-approved but unused lines of credit totaling $8.8 million to executive officers, directors and their affiliates.
NOTE E - ALLOWANCE FOR LOAN LOSSES
An analysis of the allowance for loan losses for the years ended December 31, 2007, 2006 and 2005 follows:
| | | | | | | | | | | | |
| | | 2007 | | | 2006 | | | 2005 | |
| | | (Dollars in thousands) | |
| | | |
Beginning balance | | $ | 3,983 | | | $ | 3,679 | | | $ | 3,053 | |
Provision for loan losses | | | 1,339 | | | | 69 | | | | 792 | |
| | | |
Charge-offs | | | (302 | ) | | | (5 | ) | | | (206 | ) |
Recoveries | | | - | | | | 240 | | | | 40 | |
| | | | | | | | | | | | |
Net recoveries/(charge-offs) | | | (302 | ) | | | 235 | | | | (166 | ) |
| | | | | | | | | | | | |
Ending balance | | $ | 5,020 | | | $ | 3,983 | | | $ | 3,679 | |
| | | | | | | | | | | | |
F-18
NORTH STATE BANCORP
NOTES TO CONSOLIDATED FINANCIAL STATEMENTS
December 31, 2007, 2006 and 2005
NOTE F - PREMISES AND EQUIPMENT
Following is a summary of premises and equipment at December 31, 2007 and 2006:
| | | | | | | | |
| | | 2007 | | | 2006 | |
| | | (Dollars in thousands) | |
| | |
Land | | $ | 4,695 | | | $ | 2,492 | |
Buildings | | | 3,683 | | | | 3,683 | |
Leasehold improvements | | | 959 | | | | 805 | |
Furniture, fixtures and equipment | | | 3,416 | | | | 2,999 | |
Construction in process | | | 522 | | | | 9 | |
| | | | | | | | |
| | | 13,275 | | | | 9,988 | |
Accumulated depreciation | | | (2,812 | ) | | | (2,178 | ) |
| | | | | | | | |
Total | | $ | 10,463 | | | $ | 7,810 | |
| | | | | | | | |
Depreciation and amortization amounting to $637,000 in 2007, $542,000 in 2006 and $489,000 in 2005 is included in occupancy and equipment expense.
The Company leases office facilities under non-cancelable operating leases. Future minimum lease payments required under the leases are as follows (dollars in thousands):
Year ending December 31:
| | | |
2008 | | $ | 1,043 |
2009 | | | 1,084 |
2010 | | | 1,072 |
2011 | | | 1,072 |
2012 | | | 1,002 |
Thereafter | | | 5,766 |
| | | |
| | $ | 11,039 |
| | | |
Total rental expense for the years ended December 31, 2007 and 2006 amounted to $894,000 and $809,000, respectively. Rent expense is included in occupancy and equipment expenses.
NOTE G - DEPOSITS
The aggregate amount of time deposits in denominations of $100,000 or more at December 31, 2007 and 2006 was approximately $90.4 million and $73.2 million, respectively.
F-19
NORTH STATE BANCORP
NOTES TO CONSOLIDATED FINANCIAL STATEMENTS
December 31, 2007, 2006 and 2005
NOTE G – DEPOSITS (Continued)
At December 31, 2007, the scheduled maturities of time deposits were as follows:
| | | | | | | | | |
| | | At December 31, 2007 |
| | | Less than
$100,000 (1) | | $100,000
or more | | Total |
| | | (Dollars in thousands) |
2008 | | $ | 64,930 | | $ | 78,704 | | $ | 143,634 |
2009 | | | 5,122 | | | 8,731 | | | 13,853 |
2010 | | | 2,485 | | | 1,190 | | | 3,675 |
2011 | | | 66 | | | 626 | | | 692 |
2012 | | | 35 | | | 1,130 | | | 1,165 |
| | | | | | | | | |
| | $ | 72,638 | | $ | 90,381 | | $ | 163,019 |
| | | | | | | | | |
(1) Includes $10.0 million of wholesale brokered certificates of deposit maturing May 16, 2008 issued in denominations of $1,000 per account.
NOTE H – BORROWINGS
Short-term Borrowings
The Company had repurchase agreements outstanding in the amount of $23.9 million and $10.7 million at December 31, 2007 and 2006, respectively. Securities sold under agreements to repurchase generally mature within one to four days from the transaction date and are collateralized by U.S. Government Agency obligations. These repurchase agreements are due within one year and are classified as short-term borrowings in the accompanying consolidated balance sheets.
At December 31, 2007, the Company had $14.0 million in a short-term Federal Home Loan Bank advances. The advances consisted of $8.0 million, maturing January 3, 2008 with an interest rate of 4.60% and $6.0 million maturing January 7, 2008 with an interest rate of 4.51%. These advances are secured by a blanket floating lien on qualifying 1-4 family mortgage loans.
As of December 31, 2007 the Company had available lines of credit totaling approximately $61.0 million with various financial institutions for borrowing on a short-term basis, with no amounts outstanding at that date. These lines are subject to annual renewals with varying interest rates.
Long-term Debt
On March 17, 2004, the Company issued $5.2 million of junior subordinated debentures to North State Statutory Trust I (“Trust I”) in exchange for the proceeds of trust preferred securities issued by Trust I. On December 15, 2005, the Company issued $5.2 million of junior subordinated debentures to North State Statutory Trust II (“Trust II”) in exchange for the proceeds of trust preferred securities issued by Trust II. On November 28, 2007, the Company issued $5.2 million of junior subordinated debentures to North State Statutory Trust III (“Trust III”) in exchange for the proceeds of trust preferred securities issued by Trust III. Trust I, Trust II and Trust III are wholly owned by the Company. The junior subordinated deferrable interest debentures are included in long-term debt and the Company’s equity interests in Trust I, Trust II and Trust III are included in other assets.
The junior subordinated debentures for Trust I pay interest quarterly at an annual rate, reset quarterly, equal to 3-month LIBOR plus 2.79%. The debentures are redeemable on July 17, 2009 or afterwards in whole or in part, on any January 17, April 17, July 17 or October 17. Redemption is mandatory at April 17, 2034. The Company has fully and unconditionally guaranteed the repayment of the trust preferred securities. The Company’s obligation under the guarantee is unsecured and subordinate to senior and subordinated indebtedness of the Company.
F-20
NORTH STATE BANCORP
NOTES TO CONSOLIDATED FINANCIAL STATEMENTS
December 31, 2007, 2006 and 2005
NOTE H – BORROWINGS (Continued)
Long-term Debt (Continued)
The junior subordinated debentures for Trust II pay interest quarterly at an annual rate, reset quarterly, equal to 3-month LIBOR plus 1.65%. The debentures are redeemable on July 15, 2010 or afterwards in whole or in part, on any January 15, April 15, July 15 or October 15. Redemption is mandatory at April 15, 2035. The Company has fully and unconditionally guaranteed the repayment of the trust preferred securities. The Company’s obligation under the guarantee is unsecured and subordinate to senior and subordinated indebtedness of the Company.
The junior subordinated debentures for Trust III pay interest quarterly at an annual rate, reset quarterly, equal to 3-month LIBOR plus 2.75%. The debentures are redeemable on November 28, 2037 or afterwards in whole or in part, on any January 15, April 15, July 15 or October 15. Redemption is mandatory at December 15, 2037. The Company has fully and unconditionally guaranteed the repayment of the trust preferred securities. The Company’s obligation under the guarantee is unsecured and subordinate to senior and subordinated indebtedness of the Company.
The trust preferred securities issued by Trust I, Trust II and Trust III presently qualify as Tier 1 regulatory capital for regulatory capital purposes subject to certain limitations, none of which were applicable at December 31, 2007.
At December 31, 2007 and 2006, the Company had $867,000 and $886,000, respectively, in a long-term Federal Home Loan Bank advance. This advance, maturing October 7, 2025, funds a qualified Community Investment Program loan. The Company pays 2.00% interest for the advance with the loan earning 4.00%. These advances are secured by a blanket floating lien on qualifying 1-4 family mortgage loans.
| | | | | | |
| | | For the Year Ended
December 31, |
| | | 2007 | | 2006 |
| | | (Dollars in thousands) |
Short-term borrowings: | | | | | | |
Repurchase agreements | | $ | 23,886 | | $ | 10,670 |
FHLB advances | | | 14,000 | | | - |
| | | | | | |
| | $ | 37,886 | | $ | 10,670 |
| | | | | | |
Long-term debt: | | | | | | |
FHLB advances | | $ | 867 | | $ | 886 |
Junior subordinated debentures | | | 15,465 | | | 10,310 |
| | | | | | |
| | $ | 16,332 | | $ | 11,196 |
| | | | | | |
Trust preferred securities and related junior subordinated debentures outstanding are as follows:
| | | | | | | | | | |
| | | Carrying Value
at December 31, | | Maturity
Date | | Interest rate |
| | | 2007 | | 2006 | | |
| | | (Dollars in thousands) | | |
North State Statutory Trust I | | $ | 5,155 | | $ | 5,155 | | 4/17/2034 | | 3 mo LIBOR plus 2.79%, resets quarterly |
North State Statutory Trust II | | | 5,155 | | | 5,155 | | 4/15/2035 | | 3 mo LIBOR plus 1.65%, resets quarterly |
North State Statutory Trust III | | | 5,155 | | | - | | 12/15/2037 | | 3 mo LIBOR plus 2.75%, resets quarterly |
| | | | | | | | | | |
| | $ | 15,465 | | $ | 10,310 | | | | |
| | | | | | | | | | |
NOTE I - INCOME TAXES -
The significant components of the provision for income taxes for the years ended December 31, 2007, 2006 and 2005 are as follows:
F-21
NORTH STATE BANCORP
NOTES TO CONSOLIDATED FINANCIAL STATEMENTS
December 31, 2007, 2006 and 2005
NOTE I – INCOME TAXES (Continued)
| | | | | | | | | | | | |
| | | 2007 | | | 2006 | | | 2005 | |
| | | (Dollars in thousands) | |
Current tax expense: | | | | | | | | | | | | |
Federal | | $ | 2,085 | | | $ | 1,781 | | | $ | 1,487 | |
State | | | 433 | | | | 412 | | | | 289 | |
| | | | | | | | | | | | |
| | | 2,518 | | | | 2,193 | | | | 1,776 | |
| | | | | | | | | | | | |
Deferred tax provision: | | | | | | | | | | | | |
Federal | | | (472 | ) | | | (241 | ) | | | (259 | ) |
State | | | (174 | ) | | | (60 | ) | | | (82 | ) |
| | | | | | | | | | | | |
| | | (646 | ) | | | (301 | ) | | | (341 | ) |
| | | | | | | | | | | | |
| | | |
Provision for income tax expense before adjustment to deferred tax asset valuation allowance | | | 1,872 | | | | 1,892 | | | | 1,435 | |
Increase in valuation allowance | | | 81 | | | | 23 | | | | 28 | |
| | | | | | | | | | | | |
Net provision for income taxes | | $ | 1,953 | | | $ | 1,915 | | | $ | 1,463 | |
| | | | | | | | | | | | |
The difference between the provision for income taxes and the amounts computed by applying the statutory federal income tax rate of 34% to income before income taxes is summarized below:
| | | | | | | | | | | | |
| | | 2007 | | | 2006 | | | 2005 | |
| | | (Dollars in thousands) | |
Expected income tax expense | | $ | 1,716 | | | $ | 1,764 | | | $ | 1,326 | |
Increase (decrease) resulting from: | | | | | | | | | | | | |
State income taxes, net of federal tax effect | | | 171 | | | | 232 | | | | 137 | |
Adjustment to deferred tax asset valuation allowance | | | 81 | | | | 23 | | | | 28 | |
Other permanent differences | | | (15 | ) | | | (104 | ) | | | (28 | ) |
| | | | | | | | | | | | |
Provision for income taxes | | $ | 1,953 | | | $ | 1,915 | | | $ | 1,463 | |
| | | | | | | | | | | | |
Deferred income taxes reflect the net tax effects of temporary differences between the carrying amounts of assets and liabilities for financial reporting purposes and the amounts used for income tax purposes. Significant components of deferred taxes at December 31, 2007 and 2006 are as follows:
F-22
NORTH STATE BANCORP
NOTES TO CONSOLIDATED FINANCIAL STATEMENTS
December 31, 2007, 2006 and 2005
NOTE I – INCOME TAXES (Continued)
| | | | | | | | |
| | | 2007 | | | 2006 | |
| | | (Dollars in thousands) | |
Deferred tax assets relating to: | | | | | | | | |
Allowance for loan losses | | $ | 1,798 | | | $ | 1,282 | |
Deferred compensation | | | 543 | | | | 502 | |
Unrealized loss on available for sale securities | | | - | | | | 155 | |
Unrealized loss on hedge activities | | | - | | | | 24 | |
Lease obligations | | | 74 | | | | 19 | |
State net operating loss carrryforwards | | | 132 | | | | 55 | |
| | | | | | | | |
Total deferred tax assets | | | 2,547 | | | | 2,037 | |
Less: Valuation allowance | | | (132 | ) | | | (51 | ) |
| | | | | | | | |
Net deferred tax asset | | | 2,415 | | | | 1,986 | |
Deferred tax liabilities relating to: | | | | | | | | |
Deferred loan origination fees | | | (179 | ) | | | (140 | ) |
Unrealized loss on available for sale securities | | | (47 | ) | | | - | |
Unrealized loss on hedge activities | | | (240 | ) | | | - | |
Property and equipment | | | (52 | ) | | | (65 | ) |
Prepaid expenses | | | (58 | ) | | | (41 | ) |
| | | | | | | | |
Total deferred tax liabilities | | | (576 | ) | | | (246 | ) |
| | | | | | | | |
Net recorded deferred tax assets included in other assets | | $ | 1,839 | | | $ | 1,740 | |
| | | | | | | | |
The Company adopted the provisions of FASB Interpretation No. 48 (“FIN 48”) on January 1, 2007. There was no material impact from the adoption of FIN 48. It is the Company’s policy to recognize interest and penalties associated with uncertain tax positions as components of income taxes. There were no interest or penalties accrued during 2007. The Company’s federal and state income tax returns are subject to examination for the years 2004, 2005, and 2006. There was no unfunded tax provision at December 31, 2007.
NOTE J - NON-INTEREST INCOME AND OTHER NON-INTEREST EXPENSE
The major components of non-interest income for the years ended December 31, 2007, 2006 and 2005 are as follows:
| | | | | | | | | |
| | | 2007 | | 2006 | | 2005 |
| | | (Dollars in thousands) |
Mortgage origination fees | | $ | 230 | | $ | 326 | | $ | 492 |
Service charges and fees on deposits | | | 703 | | | 754 | | | 682 |
Gain on sale of investment securities | | | - | | | - | | | 3 |
Other | | | 188 | | | 94 | | | 133 |
| | | | | | | | | |
Total non-interest income | | $ | 1,121 | | $ | 1,174 | | $ | 1,310 |
| | | | | | | | | |
The major components of other non-interest expense for the years ended December 31, 2007, 2006 and 2005 are as follows:
F-23
NORTH STATE BANCORP
NOTES TO CONSOLIDATED FINANCIAL STATEMENTS
December 31, 2007, 2006 and 2005
NOTE J - NON-INTEREST INCOME AND OTHER NON-INTEREST EXPENSE (Continued)
| | | | | | | | | |
| | | 2007 | | 2006 | | 2005 |
| | | (Dollars in thousands) |
Professional fees | | $ | 291 | | $ | 295 | | $ | 341 |
Postage, printing & office supplies | | | 173 | | | 144 | | | 126 |
Advertising and promotion | | | 317 | | | 295 | | | 276 |
Data processing & other outsourced services | | | 679 | | | 553 | | | 398 |
Directors fees | | | 286 | | | 638 | | | 399 |
Other | | | 1,813 | | | 1,607 | | | 1,389 |
| | | | | | | | | |
Total non-interest expense | | $ | 3,559 | | $ | 3,532 | | $ | 2,929 |
| | | | | | | | | |
NOTE K - REGULATORY MATTERS
The Bank, as a North Carolina banking corporation, may pay cash dividends to the Company only out of undivided profits as determined pursuant to North Carolina General Statutes Section 53-87. However, regulatory authorities may limit payment of dividends by any bank when it is determined that such limitation is in the public interest and is necessary to ensure financial soundness of the bank.
The Company (on a consolidated basis) and the Bank are subject to various regulatory capital requirements administered by federal and state banking agencies. Failure to meet minimum capital requirements can initiate certain mandatory - and possibly additional discretionary - actions by regulators that, if undertaken, could have a direct material effect on the Company’s consolidated financial statements. Under capital adequacy guidelines and the regulatory framework for prompt corrective action, the Bank must meet specific capital guidelines that involve quantitative measures of its assets, liabilities, and certain off-balance-sheet items as calculated under regulatory accounting practices. The capital amounts and classifications are also subject to qualitative judgments by the regulators about components, risk weightings, and other factors. Prompt corrective action provisions are not applicable to bank holding companies.
As of December 31, 2007, the most recent notification from the FDIC categorized the Bank as well capitalized under the regulatory framework for prompt corrective action. To be categorized as well capitalized, the Bank must maintain minimum amounts and ratios. There are no conditions or events since that notification that management believes have changed the Bank’s category.
Quantitative measures established by regulation to ensure capital adequacy require the Company and the Bank to maintain minimum amounts and ratios, as prescribed by regulations, of total and Tier I capital to risk-weighted assets and of Tier I capital to average assets. Because the Company’s only significant asset is its investment in the Bank, information concerning capital ratios is essentially the same for the Company and the Bank. As of December 31, 2007 and 2006, the Bank met its capital adequacy requirements as set forth below:
F-24
NORTH STATE BANCORP
NOTES TO CONSOLIDATED FINANCIAL STATEMENTS
December 31, 2007, 2006 and 2005
NOTE K - REGULATORY MATTERS (Continued)
| | | | | | | | | | | | | | | | | | |
| | | Actual | | | Minimum for capital
adequacy purposes | | | Minimum to be well
capitalized under prompt
corrective action provisions | |
| | | Amount | | Ratio | | | Amount | | Ratio | | | Amount | | Ratio | |
| | | (Dollars in thousands) | |
As of December 31, 2007: | | | | | | | | | | | | | | | | | | |
Total Capital (to Risk- | | | | | | | | | | | | | | | | | | |
Weighted Assets) | | $ | 48,640 | | 10.32 | % | | $ | 37,722 | | 8.00 | % | | $ | 47,153 | | 10.00 | % |
Tier I Capital (to Risk- | | | | | | | | | | | | | | | | | | |
Weighted Assets) | | | 43,620 | | 9.25 | % | | | 18,861 | | 4.00 | % | | | 28,292 | | 6.00 | % |
Tier I Capital (to Average | | | | | | | | | | | | | | | | | | |
Assets) | | | 43,620 | | 8.50 | % | | | 20,529 | | 4.00 | % | | | 25,661 | | 5.00 | % |
As of December 31, 2006: | | | | | | | | | | | | | | | | | | |
Total Capital (to Risk- | | | | | | | | | | | | | | | | | | |
Weighted Assets) | | $ | 36,308 | | 10.21 | % | | $ | 28,436 | | 8.00 | % | | $ | 35,546 | | 10.00 | % |
Tier I Capital (to Risk- | | | | | | | | | | | | | | | | | | |
Weighted Assets) | | | 32,325 | | 9.09 | % | | | 14,218 | | 4.00 | % | | | 21,327 | | 6.00 | % |
Tier I Capital (to Average | | | | | | | | | | | | | | | | | | |
Assets) | | | 32,325 | | 7.58 | % | | | 17,049 | | 4.00 | % | | | 21,311 | | 5.00 | % |
The Company is also subject to these capital requirements. Information regarding the Company’s capital and capital ratios is set forth below:
| | | | | | | | | | | | |
| | | December 31, 2007 | | | December 31, 2006 | |
| | | Amount | | Ratio | | | Amount | | Ratio | |
Total Capital (to Risk-Weighted Assets) | | $ | 51,533 | | 10.89 | % | | $ | 41,181 | | 11.56 | % |
Tier I Capital (to Risk-Weighted Assets) | | | 46,513 | | 9.83 | % | | | 37,198 | | 10.44 | % |
Tier I Capital (to Average Assets) | | | 46,513 | | 9.03 | % | | | 37,198 | | 9.34 | % |
NOTE L – DERIVATIVES AND OFF-BALANCE SHEET RISK
Derivative Financial Instruments and Hedging Activities
SFAS No. 133, “Accounting for Derivative Instruments and Hedging Activities” (“SFAS 133”), as amended and interpreted, establishes accounting and reporting standards for derivative instruments, including certain derivative instruments embedded in other contracts, and for hedging activities. As required by SFAS 133, the Company records all derivatives on the balance sheet at fair value. The accounting for changes in the fair value of derivatives depends on the intended use of the derivative and the resulting designation. Derivatives used to hedge the exposure to changes in the fair value of an asset, liability, or firm commitment attributable to a particular risk, such as interest rate risk, are considered fair value hedges. Derivatives used to hedge the exposure to variability in expected future cash flows, or other types of forecasted transactions, are considered cash flow hedges. To qualify for hedge accounting, the Company must comply with the detailed rules and strict documentation requirements at the inception of the hedge, and hedge effectiveness is assessed at inception and periodically throughout the life of each hedging relationship.
The Company’s objective in using derivatives is to add stability to interest income and to manage its exposure to changes in interest rates. To accomplish this objective, the Company uses an interest rate floor to protect against movements in interest rates below the floor’s strike rate over the life of the agreement. The interest rate floor has a notional amount of $50.0 million, a strike rate of 7.50%, and a maturity date of November 1, 2009. The floor hedges the variable cash flows associated with existing variable-rate loan assets that are based on the prime rate (“Prime”). For accounting purposes, the floor is designated as a cash flow hedge of the overall changes in cash
F-25
NORTH STATE BANCORP
NOTES TO CONSOLIDATED FINANCIAL STATEMENTS
December 31, 2007, 2006 and 2005
NOTE L – DERIVATIVES AND OFF-BALANCE SHEET RISK (Continued)
Derivative Financial Instruments and Hedging Activities (Continued)
flows on the first Prime-based interest payments received by the Company each calendar month during the term of the hedge that, in aggregate for each period, are interest payments on principal from specified portfolios greater than or equal to the notional amount of the floor.
On a quarterly basis, the Company performs effectiveness testing. The Company uses the “Hypothetical Derivative Method” described in SFAS 133 Implementation Issue No. G20, “Cash Flow Hedges: Assessing and Measuring the Effectiveness of a Purchased Option Used in a Cash Flow Hedge,” for quarterly prospective and retrospective assessments of hedge effectiveness, as well as for measurements of hedge ineffectiveness. The effective portion of changes in the fair value of the derivative is initially reported in other comprehensive income (outside of earnings) and subsequently reclassified to earnings (“interest income on loans”) when the hedged transactions affect earnings. Ineffectiveness resulting from the hedge is recorded as a gain or loss in the consolidated statement of income as part of noninterest income. The Company also monitors the risk of counterparty default on an ongoing basis. Hedge ineffectiveness at December 31, 2007 and 2006 was insignificant.
Prepayments in hedged loan portfolios are treated in a manner consistent with the guidance in SFAS 133 Implementation Issue No. G25, “Cash Flow hedges: Using the First-Payments-Received Technique in Hedging the Variable Interest Payments on a Group of Non-Benchmark-Rate-Based Loans,” which allows the designated forecasted transactions to be the variable, Prime-rate-based interest payments on a rolling portfolio of prepayable interest-bearing loans using the first-payments-received technique, thereby allowing interest payments from loans that prepay to be replaced with interest payments from new loan originations.
As of December 31, 2007, no derivatives were designated as fair value hedges or hedges of net investments in foreign operations. Additionally, the Company does not use derivatives for trading or speculative purposes.
At December 31, 2007 and 2006, derivatives with a fair value of $1.0 million and $305,000, respectively, were included in other assets. For the years ended December 31, 2007 and 2006, the change in net unrealized gains and losses on derivatives designated as cash flow hedges reported in the consolidated statements of changes in stockholder’s equity was $742,000 (net gain) and $60,000 (net loss), respectively. Prior to 2006, the Company had no derivative financial instruments.
Amounts reported in accumulated other comprehensive income related to derivatives will be reclassified to interest income when the originally hedged forecasted transactions (interest income on variable-rate assets) affect earnings. The change in net unrealized gains and losses on cash flow hedges reflects a reclassification of $42,000 and $45 of net unrealized gains and losses from accumulated other comprehensive income to reduce interest income for the years ended December 31, 2007 and 2006, respectively. For the year ended December 31, 2008, the Company estimates that an additional $251,000 will be reclassified from accumulated other comprehensive income as an addition to interest income.
At December 31, 2007, the information pertaining to the outstanding interest rate floor (purchased option) agreement is as follows:
| | | | | | | |
| | | December 31, | |
| | | 2007 | | 2006 | |
| | | (Dollars in thousands) | |
Notional amount | | $ | 50,000 | | $ | 50,000 | |
Fair Value | | | 1,005 | | | 305 | |
Unrealized gain (loss) relating to interest rate floor | | | 681 | | | (61 | ) |
F-26
NORTH STATE BANCORP
NOTES TO CONSOLIDATED FINANCIAL STATEMENTS
December 31, 2007, 2006 and 2005
NOTE L – DERIVATIVES AND OFF-BALANCE SHEET RISK (Continued)
Off-Balance Sheet Risk, Commitments and Contingencies
The Company is a party to financial instruments with off-balance sheet risk in the normal course of business to meet the financing needs of its customers. These financial instruments include commitments to extend credit and standby letters of credit. Those instruments involve, to varying degrees, elements of credit and interest rate risk in excess of the amount recognized in the balance sheet. The contract or notional amounts of those instruments reflect the extent of involvement the Company has in particular classes of financial instruments. The Company uses the same credit policies in making commitments and conditional obligations as it does for on-balance-sheet instruments.
Commitments to extend credit are agreements to lend to a customer as long as there is no violation of conditions established in the contract. Commitments generally have fixed expiration dates or other termination clauses and may require payment of a fee. Since some of the commitments are expected to expire without being drawn upon, the total commitment amounts do not necessarily represent future cash requirements. The Company evaluates each customer’s creditworthiness on a case-by-case basis. The amount of collateral obtained, if deemed necessary by the Company, upon extension of credit is based on management’s credit evaluation of the borrower. Collateral obtained varies but may include real estate, stocks, bonds, and certificates of deposit.
A summary of the contract amount of the Company’s exposure to off-balance sheet credit risk as of December 31, 2007 is as follows (dollars in thousands):
| | | |
Financial instruments whose contract amounts represent credit risk: | | | |
Commitments to extend credit | | $ | 22,702 |
Undisbursed lines of credit | | | 75,514 |
Standby letters of credit | | | 2,306 |
NOTE M - DISCLOSURES ABOUT FAIR VALUES OF FINANCIAL INSTRUMENTS
Financial instruments include cash and due from banks, interest-bearing deposits with banks, federal funds sold, investments, accrued interest, loans, deposit accounts and borrowings. Fair value estimates are made at a specific moment in time, based on relevant market information and information about the financial instrument. These estimates do not reflect any premium or discount that could result from offering for sale at one time the Company’s entire holdings of a particular financial instrument. Because no active market readily exists for a portion of the Company’s financial instruments, fair value estimates are based on judgments regarding future expected loss experience, current economic conditions, risk characteristics of various financial instruments, and other factors. These estimates are subjective in nature and involve uncertainties and matters of significant judgment and, therefore, cannot be determined with precision. Changes in assumptions could significantly affect the estimates.
The following methods and assumptions were used to estimate the fair value of each class of financial instruments for which it is practicable to estimate that value:
Cash and Due from Banks, Interest-Earning Deposits With Banks and Federal Funds Sold
The carrying amounts for cash and due from banks, and interest-earning deposits with banks and federal funds sold approximate fair value because of the short maturities of those instruments.
Investment Securities Available for Sale
Fair value for investment securities available for sale equals quoted market price if such information is available. If a quoted market price is not available, fair value is estimated using quoted market prices for similar securities.
Loans
For certain homogenous categories of loans, such as residential mortgages, fair value is estimated using the quoted market prices for securities backed by similar loans, adjusted for differences in loan characteristics. The fair value of
F-27
NORTH STATE BANCORP
NOTES TO CONSOLIDATED FINANCIAL STATEMENTS
December 31, 2007, 2006 and 2005
NOTE M - DISCLOSURES ABOUT FAIR VALUES OF FINANCIAL INSTRUMENTS (Continued)
Loans (Continued)
other types of loans is estimated by discounting the future cash flows using the current rates at which similar loans would be made to borrowers with similar credit ratings and for the same remaining maturities.
Stock in Federal Home Loan Bank of Atlanta
The fair value for FHLB stock approximates carrying value, based on the redemption provisions of the Federal Home Loan Bank.
Deposits
The fair value of demand, savings, money market and NOW deposits is the amount payable on demand at the reporting date. The fair value of time deposits and borrowings is estimated by discounting expected cash flows using the rates currently offered for instruments of similar remaining maturities.
Borrowings
The fair values are based on discounting expected cash flows at the interest rate for debt with the same or similar remaining maturities and collateral requirements.
Accrued Interest
The carrying amounts of accrued interest approximate fair value.
Derivative Financial Instruments
Fair values for the interest rate floor are based upon amounts required to settle the contracts.
Financial Instruments with Off-Balance Sheet Risk
With regard to financial instruments with off-balance sheet risk discussed in Note L, it is not practicable to estimate the fair value of future financing commitments.
The following table presents the carrying values and estimated fair values of the Company’s financial instruments at December 31, 2007 and 2006.
F-28
NORTH STATE BANCORP
NOTES TO CONSOLIDATED FINANCIAL STATEMENTS
December 31, 2007, 2006 and 2005
NOTE M - DISCLOSURES ABOUT FAIR VALUES OF FINANCIAL INSTRUMENTS (Continued)
| | | | | | | | | | | | |
| | | 2007 | | 2006 |
| | | Carrying
Amount | | Estimated
Fair Value | | Carrying
Amount | | Estimated
Fair Value |
| | | (Dollars in thousands) |
Financial assets: | | | | | | | | | | | | |
Cash and due from banks | | $ | 11,425 | | $ | 11,425 | | $ | 12,189 | | $ | 12,189 |
Interest-earning deposits with banks | | | 1,139 | | | 1,139 | | | 1,249 | | | 1,249 |
Federal funds sold | | | 18,202 | | | 18,202 | | | 44,059 | | | 44,059 |
Investment securities available for sale | | | 34,843 | | | 34,843 | | | 41,932 | | | 41,932 |
Loans, net | | | 464,208 | | | 465,056 | | | 341,960 | | | 336,544 |
Accrued interest receivable | | | 2,090 | | | 2,090 | | | 1,754 | | | 1,754 |
Stock in the Federal Home Loan Bank | | | 1,621 | | | 1,621 | | | 939 | | | 939 |
Financial liabilities: | | | | | | | | | | | | |
Deposits | | $ | 457,310 | | $ | 456,646 | | | 402,078 | | $ | 402,070 |
Short-term borrowings | | | 37,886 | | | 37,886 | | | 10,670 | | | 10,670 |
Long-term debt | | | 16,332 | | | 16,321 | | | 11,196 | | | 11,185 |
Accrued interest payable | | | 2,511 | | | 2,511 | | | 2,297 | | | 2,297 |
On-balance sheet derivative financial instruments: | | | | | | | | | | | | |
Interest rate floor agreement | | | | | | | | | | | | |
| | $ | 1,005 | | $ | 1,005 | | | 305 | | $ | 305 |
NOTE N - EMPLOYEE AND DIRECTOR BENEFIT PLANS
Stock Option Plans
During 2000, the Bank adopted, with shareholder approval, an Employee Stock Option Plan and a Non-Employee Director Stock Option Plan. The Company assumed these plans in July 2002 as part of the Bank’s holding company reorganization. In 2003, the Company adopted, with shareholder approval, the 2003 Stock Plan. The 2003 Stock Plan replaced the two prior plans. All shares available for issuance under the prior plans, plus any shares covered by outstanding options that are forfeited under the prior plans, were transferred to the 2003 Plan. An aggregate of 1,239,827 shares of the Company’s common stock was initially reserved for options under the stock option plans. On May 9, 2007, the Company’s shareholders approved an additional 525,000 shares of the Company’s common stock for future issuance of options under the 2003 Stock Plan. Certain of the options granted to directors in 2000 vested immediately at the time of grant. All other options granted vest 20% annually. All unexercised options expire ten years after the date of grant.
The fair market value of each option award is estimated on the date of grant using the Black-Scholes option pricing model. In valuing options under Black-Scholes, the risk-free interest rate is based upon a U.S. Treasury instrument with a life that is similar to the expected life of the option grant. Expected volatility is estimated based on the Company’s historical volatility over a period similar to the expected life of the option grant. The expected term of the options is based upon the average life of previously issued stock options. The expected dividend yield is based upon current yield on date of grant. No post-vesting restrictions exist for these options. The following table illustrates the assumptions for the Black-Scholes model used in determining the fair value of options granted to employees for the years ended December 31, 2007 and 2006.
F-29
NORTH STATE BANCORP
NOTES TO CONSOLIDATED FINANCIAL STATEMENTS
December 31, 2007, 2006 and 2005
NOTE N - EMPLOYEE AND DIRECTOR BENEFIT PLANS (Continued)
Stock Option Plans (Continued)
| | | | | | | | |
| | | 2007 | | | 2006 | |
Estimated fair value of options granted | | $ | 10.74 | | | $ | 5.63 | |
Assumptions in estimating option values: | | | | | | | | |
Risk-free interest rate | | | 4.45 | % | | | 5.37 | % |
Dividend yield | | | 0.00 | % | | | 0.00 | % |
Volatility | | | 41.67 | % | | | 25.00 | % |
Expected life | | | 10 years | | | | 10 years | |
A summary of option activity under the stock option plans for the year ended December 31, 2007, adjusted for the effect of the 3-for-2 stock split in the second quarter of 2007 is as follows:
| | | | | | | | | | | |
| | | Shares | | | Weighted Average | | Aggregate
Intrinsic
Value |
| | | | Exercise
Price | | Remaining
Contractual Term | |
| | | | | | | | | | (In thousands) |
Outstanding December 31, 2006 | | 724,314 | | | | 3.34 | | 4.24 years | | | |
Granted | | 35,500 | | | | 17.87 | | | | | |
Exercised | | (160,854 | ) | | | 2.77 | | | | | |
Forfeited | | (1,180 | ) | | | 5.15 | | | | | |
| | | | | | | | | | | |
Outstanding December 31, 2007 | | 597,780 | | | $ | 4.36 | | 3.75 years | | $ | 5,015 |
| | | | | | | | | | | |
Exercisable at December 31, 2007 | | 503,048 | | | $ | 2.98 | | | | $ | 4,915 |
| | | | | | | | | | | |
For the year ended December 31, 2007, the intrinsic value of options exercised was approximately $2.4 million. During third quarter of 2007, 35,500 options were granted with a fair value of $10.74 per option. The fair value of options vested was approximately $109,000 for the year ended December 31, 2007. As of December 31, 2007, approximately $536,500 of share-based compensation expense remained to be recognized over a weighted average period of 2.97 years.
Cash received from option exercises under share-based payment arrangements for the year ended December 31, 2007 was approximately $445,000. A tax benefit of $504,000 was realized for tax deductions from option exercise of the share-based payment arrangements during the year ended December 31, 2007.
The impact of the adoption of SFAS 123R is as follows:
| | | | | | | | |
| | | For the year ended December 31, | |
| | | 2007 | | | 2006 | |
| | | (in thousands except per share data) | |
Income before income tax expense | | $ | (109 | ) | | $ | (65 | ) |
Net income | | $ | (109 | ) | | $ | (65 | ) |
| | |
Cash flow from operating activities | | $ | (504 | ) | | $ | (844 | ) |
Cash flow provided by financing activities | | $ | 504 | | | $ | 844 | |
| | |
Basic earnings per share | | $ | (0.02 | ) | | $ | (0.01 | ) |
Diluted earnings per share | | $ | (0.01 | ) | | $ | (0.01 | ) |
Employment Agreements
The Company has entered into an employment agreement with its chief executive officer to ensure a stable and competent management base. This agreement provides for benefits as spelled out in the contract and cannot be terminated by the Board of Directors, except for cause, without prejudicing the officer’s right to receive certain
F-30
NORTH STATE BANCORP
NOTES TO CONSOLIDATED FINANCIAL STATEMENTS
December 31, 2007, 2006 and 2005
NOTE N - EMPLOYEE AND DIRECTOR BENEFIT PLANS (Continued)
Employment Agreements (Continued)
vested rights, including compensation. In the event of a change in control of the Company, as outlined in the agreement, the acquirer will be bound to the terms of this contract.
The Company has entered into agreements with three executive officers and two non-executive officers that provide for severance pay benefits in the event of a change in control of the Company which results in the termination of such officers or diminished compensation, duties or benefits.
Deferred Compensation Plan for Directors
In December 2001, the Company implemented a non-qualifying deferred compensation plan for directors. Under the plan, a participating director could elect to defer receipt of all or a portion of his or her director fees that would otherwise be payable in cash. At the end of each calendar year, the fees electively deferred during the year were converted, using a formula based upon 125% of the dollar amount of fees deferred and the fair value of the Company’s common stock at the close of business on the preceding January 1, into a hypothetical number of shares (the “phantom shares”) credited to the participating director’s account. The then current value of all phantom shares accumulated under the plan were payable to the participating director, or to his or her designated beneficiary, upon retirement, disability or death. Provisions of $613,000 in 2006 and $399,000 in 2005 were expensed to provide for future obligations payable under this plan. At December 31, 2006 and December 31, 2005, the outstanding deferred obligations were $1.3 million and $719,000, respectively. Effective December 31, 2006, the amount of phantom shares credited to a director under the plan was converted to a cash amount based on a value of $24.00 per phantom share. Beginning January 1, 2007, this amount was credited to a bookkeeping account for each director, and each month a rate of earnings will be credited to the account for the month equal to the 3-month LIBOR rate in effect on the last business day of the month plus 2%.
Beginning in 2007, the Company implemented a new deferred compensation plan for directors. Under this plan, a director may elect to defer the payment of all or a portion of his or her director’s fees that would otherwise have been paid currently. The fees deferred will be increased by 25% and credited to a bookkeeping account kept by the Company for the director. Beginning January 1, 2008, the fees will not be increased by 25%.
Director fees of $254,000 were expensed during 2007 to provide for the pre-2007 outstanding deferred obligations and fees expensed under the new 2007 deferred compensation plan for directors. During September 2007, the board of directors waived the equity compensation portion of the 2007 deferred compensation plan for fiscal 2007 and in December 2007 terminated the equity compensation portion in its entirety.
401(k) Retirement Plan
The Company maintains a qualified 401(k) Plan for regular full or part-time employees. Under the plan, employees may contribute up to an annual maximum as determined under the Internal Revenue Code. The Company matches 100% of such contributions not exceeding 6% of the participants’ compensation. In addition, the board of directors can authorize additional discretionary contributions to the plan. The plan provides that employees’ contributions are 100% vested at all times and the Company’s contributions vest based on the years of service, vesting at 33.33% at the end of the first year of service, 66.67% at the end of the second year service, and 100% at the end of the third year of service. The expense related to this plan for the years ended December 31, 2007, 2006, and 2005 totaled approximately $280,000, $217,000, and $96,000, respectively.
NOTE O - PARENT COMPANY FINANCIAL DATA
Following are the condensed financial statements of North State Bancorp as of December 31, 2007 and 2006 and for the years ended December 31, 2007, 2006 and 2005:
F-31
NORTH STATE BANCORP
NOTES TO CONSOLIDATED FINANCIAL STATEMENTS
December 31, 2007, 2006 and 2005
NOTE O - PARENT COMPANY FINANCIAL DATA (Continued)
Condensed Statements of Financial Condition
December 31, 2007 and 2006
(Dollars in thousands)
| | | | | | | |
| Assets | | 2007 | | 2006 | |
Cash | | $ | 1,098 | | $ | 3,720 | |
Investment in North State Bank | | | 44,130 | | | 32,034 | |
Investment in North State Statutory Trust I | | | 155 | | | 155 | |
Investment in North State Statutory Trust II | | | 155 | | | 155 | |
Investment in North State Statutory Trust III | | | 155 | | | - | |
Other assets | | | 1,396 | | | 876 | |
| | | | | | | |
Total assets | | $ | 47,089 | | $ | 36,940 | |
| | | | | | | |
Liabilities and Shareholders’ equity | | | | | | | |
Other liabilities | | $ | 67 | | $ | 33 | |
Long-term debt | | | 15,465 | | | 10,310 | |
| | |
Shareholders’ equity | | | | | | | |
Common stock | | | 19,609 | | | 4,542 | |
Additional paid-in capital | | | - | | | 14,002 | |
Retained earnings | | | 11,439 | | | 8,344 | |
Accumulated other comprehensive income (loss) | | | 509 | | | (291 | ) |
| | | | | | | |
Total shareholders’ equity | | | 31,557 | | | 26,597 | |
| | | | | | | |
Total liabilities and shareholders’ equity | | $ | 47,089 | | $ | 36,940 | |
| | | | | | | |
Condensed Statements of Operations
Years Ended December 31, 2007, 2006 and 2005
(Dollars in thousands)
| | | | | | | | | | | | |
| | | 2007 | | | 2006 | | | 2005 | |
Equity in undistributed earnings of subsidiary | | $ | 3,895 | | | $ | 3,867 | | | $ | 2,760 | |
Interest income | | | 124 | | | | 213 | | | | 3 | |
Interest expense | | | (838 | ) | | | (763 | ) | | | (334 | ) |
Other income | | | 24 | | | | 23 | | | | 9 | |
Other expense | | | (110 | ) | | | (68 | ) | | | - | |
| | | | | | | | | | | | |
Net income | | $ | 3,095 | | | $ | 3,272 | | | $ | 2,438 | |
| | | | | | | | | | | | |
F-32
NORTH STATE BANCORP
NOTES TO CONSOLIDATED FINANCIAL STATEMENTS
December 31, 2007, 2006 and 2005
NOTE O - PARENT COMPANY FINANCIAL DATA (Continued)
Condensed Statements of Cash Flows
Years Ended December 31, 2007, 2006 and 2005
(Dollars in thousands)
| | | | | | | | | | | | |
| | | 2007 | | | 2006 | | | 2005 | |
Cash flows from operating activities: | | | | | | | | | | | | |
Net income | | $ | 3,095 | | | $ | 3,272 | | | $ | 2,438 | |
Adjustments to reconcile net income to net cash used by operating activities: | | | | | | | | | | | | |
Amortization | | | 2 | | | | 1 | | | | 12 | |
Stock based compensation | | | 109 | | | | 65 | | | | - | |
Equity in undistributed earnings of subsidiaries | | | (3,895 | ) | | | (3,867 | ) | | | (2,760 | ) |
Dividends from subsidiaries | | | | | | | - | | | | 177 | |
Changes in assets and liabilities: | | | | | | | | | | | | |
(Increase) decrease in other assets | | | 278 | | | | (707 | ) | | | - | |
Increase in other liabilities | | | 34 | | | | 4 | | | | 17 | |
| | | | | | | | | | | | |
Net cash used by operating activities | | | (377 | ) | | | (1,232 | ) | | | (116 | ) |
| | | | | | | | | | | | |
Cash flows from investing activities: | | | | | | | | | | | | |
Investment in subsidiaries | | | (8,356 | ) | | | (1,134 | ) | | | (1,165 | ) |
| | | | | | | | | | | | |
Net cash used by investing activities | | | (8,356 | ) | | | (1,134 | ) | | | (1,165 | ) |
| | | | | | | | | | | | |
Cash flows from financing activities: | | | | | | | | | | | | |
Issuance of junior subordinated debentures | | | 5,155 | | | | - | | | | 5,155 | |
Proceeds from stock options exercised | | | 453 | | | | 1,141 | | | | 18 | |
Excess tax benefits from stock options | | | 503 | | | | 844 | | | | - | |
| | | | | | | | | | | | |
Net cash provided by financing activities | | | 6,111 | | | | 1,985 | | | | 5,173 | |
| | | |
Net (decrease) increase in cash and cash equivalents | | | (2,622 | ) | | | (381 | ) | | | 3,892 | |
Cash and cash equivalents, beginning | | | 3,720 | | | | 4,101 | | | | 209 | |
| | | | | | | | | | | | |
Cash and cash equivalents, ending | | $ | 1,098 | | | $ | 3,720 | | | $ | 4,101 | |
| | | | | | | | | | | | |
F-33
SIGNATURES
Pursuant to the requirement of Section 13 or 15(d) of the Securities Exchange Act of 1934, the registrant has duly caused this report to be signed on its behalf by the undersigned, thereunto duly authorized.
| | | | | | | | | | | | |
| | | | | | | | NORTH STATE BANCORP |
| | | | | |
| Date: March 27, 2008 | | | | | | | | By: | | /s/ Larry D. Barbour |
| | | | | | | | | | | | Larry D. Barbour, President |
| | | | | | | | | | | | and Chief Executive Officer |
Pursuant to the requirement of the Securities Exchange Act of 1934, this report has been signed below by the following persons on behalf of the registrant and in the capacities and on the date indicated.
| | | | |
Signature | | Title | | Date |
| | |
/s/ Larry D. Barbour Larry D. Barbour | | President, Chief Executive Officer and Director (principal executive officer) | | March 27, 2008 |
| | |
/s/ Kirk A. Whorf Kirk A. Whorf | | Chief Financial Officer (principal financial officer) | | March 27, 2008 |
| | |
/s/ JoAnn B. Bratton JoAnn B. Bratton | | Controller (principal accounting officer) | | March 27, 2008 |
| | |
/s/ Forrest H. Ball Forrest H. Ball | | Director | | March 27, 2008 |
| | |
/s/ James C. Branch James C. Branch | | Director | | March 27, 2008 |
| | |
/s/ Charles T. Francis Charles T. Francis | | Director | | March 27, 2008 |
| | |
/s/ Glenn Futrell Glenn Futrell | | Director | | March 27, 2008 |
| | |
C. Thomas Hendrickson | | Director | | March 27, 2008 |
| | |
/s/ Jeanette W. Hyde Jeanette W. Hyde | | Director | | March 27, 2008 |
S-1
| | | | |
| | |
/s/ J. Keith Keener J. Keith Keener | | Director | | March 27, 2008 |
| | |
Burley B. Mitchell, Jr. | | Director | | March 27, 2008 |
| | |
/s/ Barry W. Partlo Barry W. Partlo | | Director | | March 27, 2008 |
| | |
/s/ Gary H. Pendleton Gary H. Pendleton | | Director | | March 27, 2008 |
| | |
/s/ W. Harold Perry W. Harold Perry | | Director | | March 27, 2008 |
| | |
/s/ Nutan T. Shah Nutan T. Shah | | Director | | March 27, 2008 |
| | |
/s/ Fred J. Smith, Jr. Fred J. Smith, Jr. | | Director | | March 27, 2008 |
| | |
/s/ Jack M. Stancil Jack M. Stancil | | Director | | March 27, 2008 |
S-2