| | | | | |
| TABLE OF CONTENTS | |
| |
| Page |
| |
| |
| |
| |
| |
| |
| |
| |
| |
| |
| |
| |
| |
| Tenant Type Summary | |
| |
| |
| |
| | | | | | | | | | | | | | | | | | | | | | | | | | |
| CORPORATE PROFILE |
| | | | | | | | |
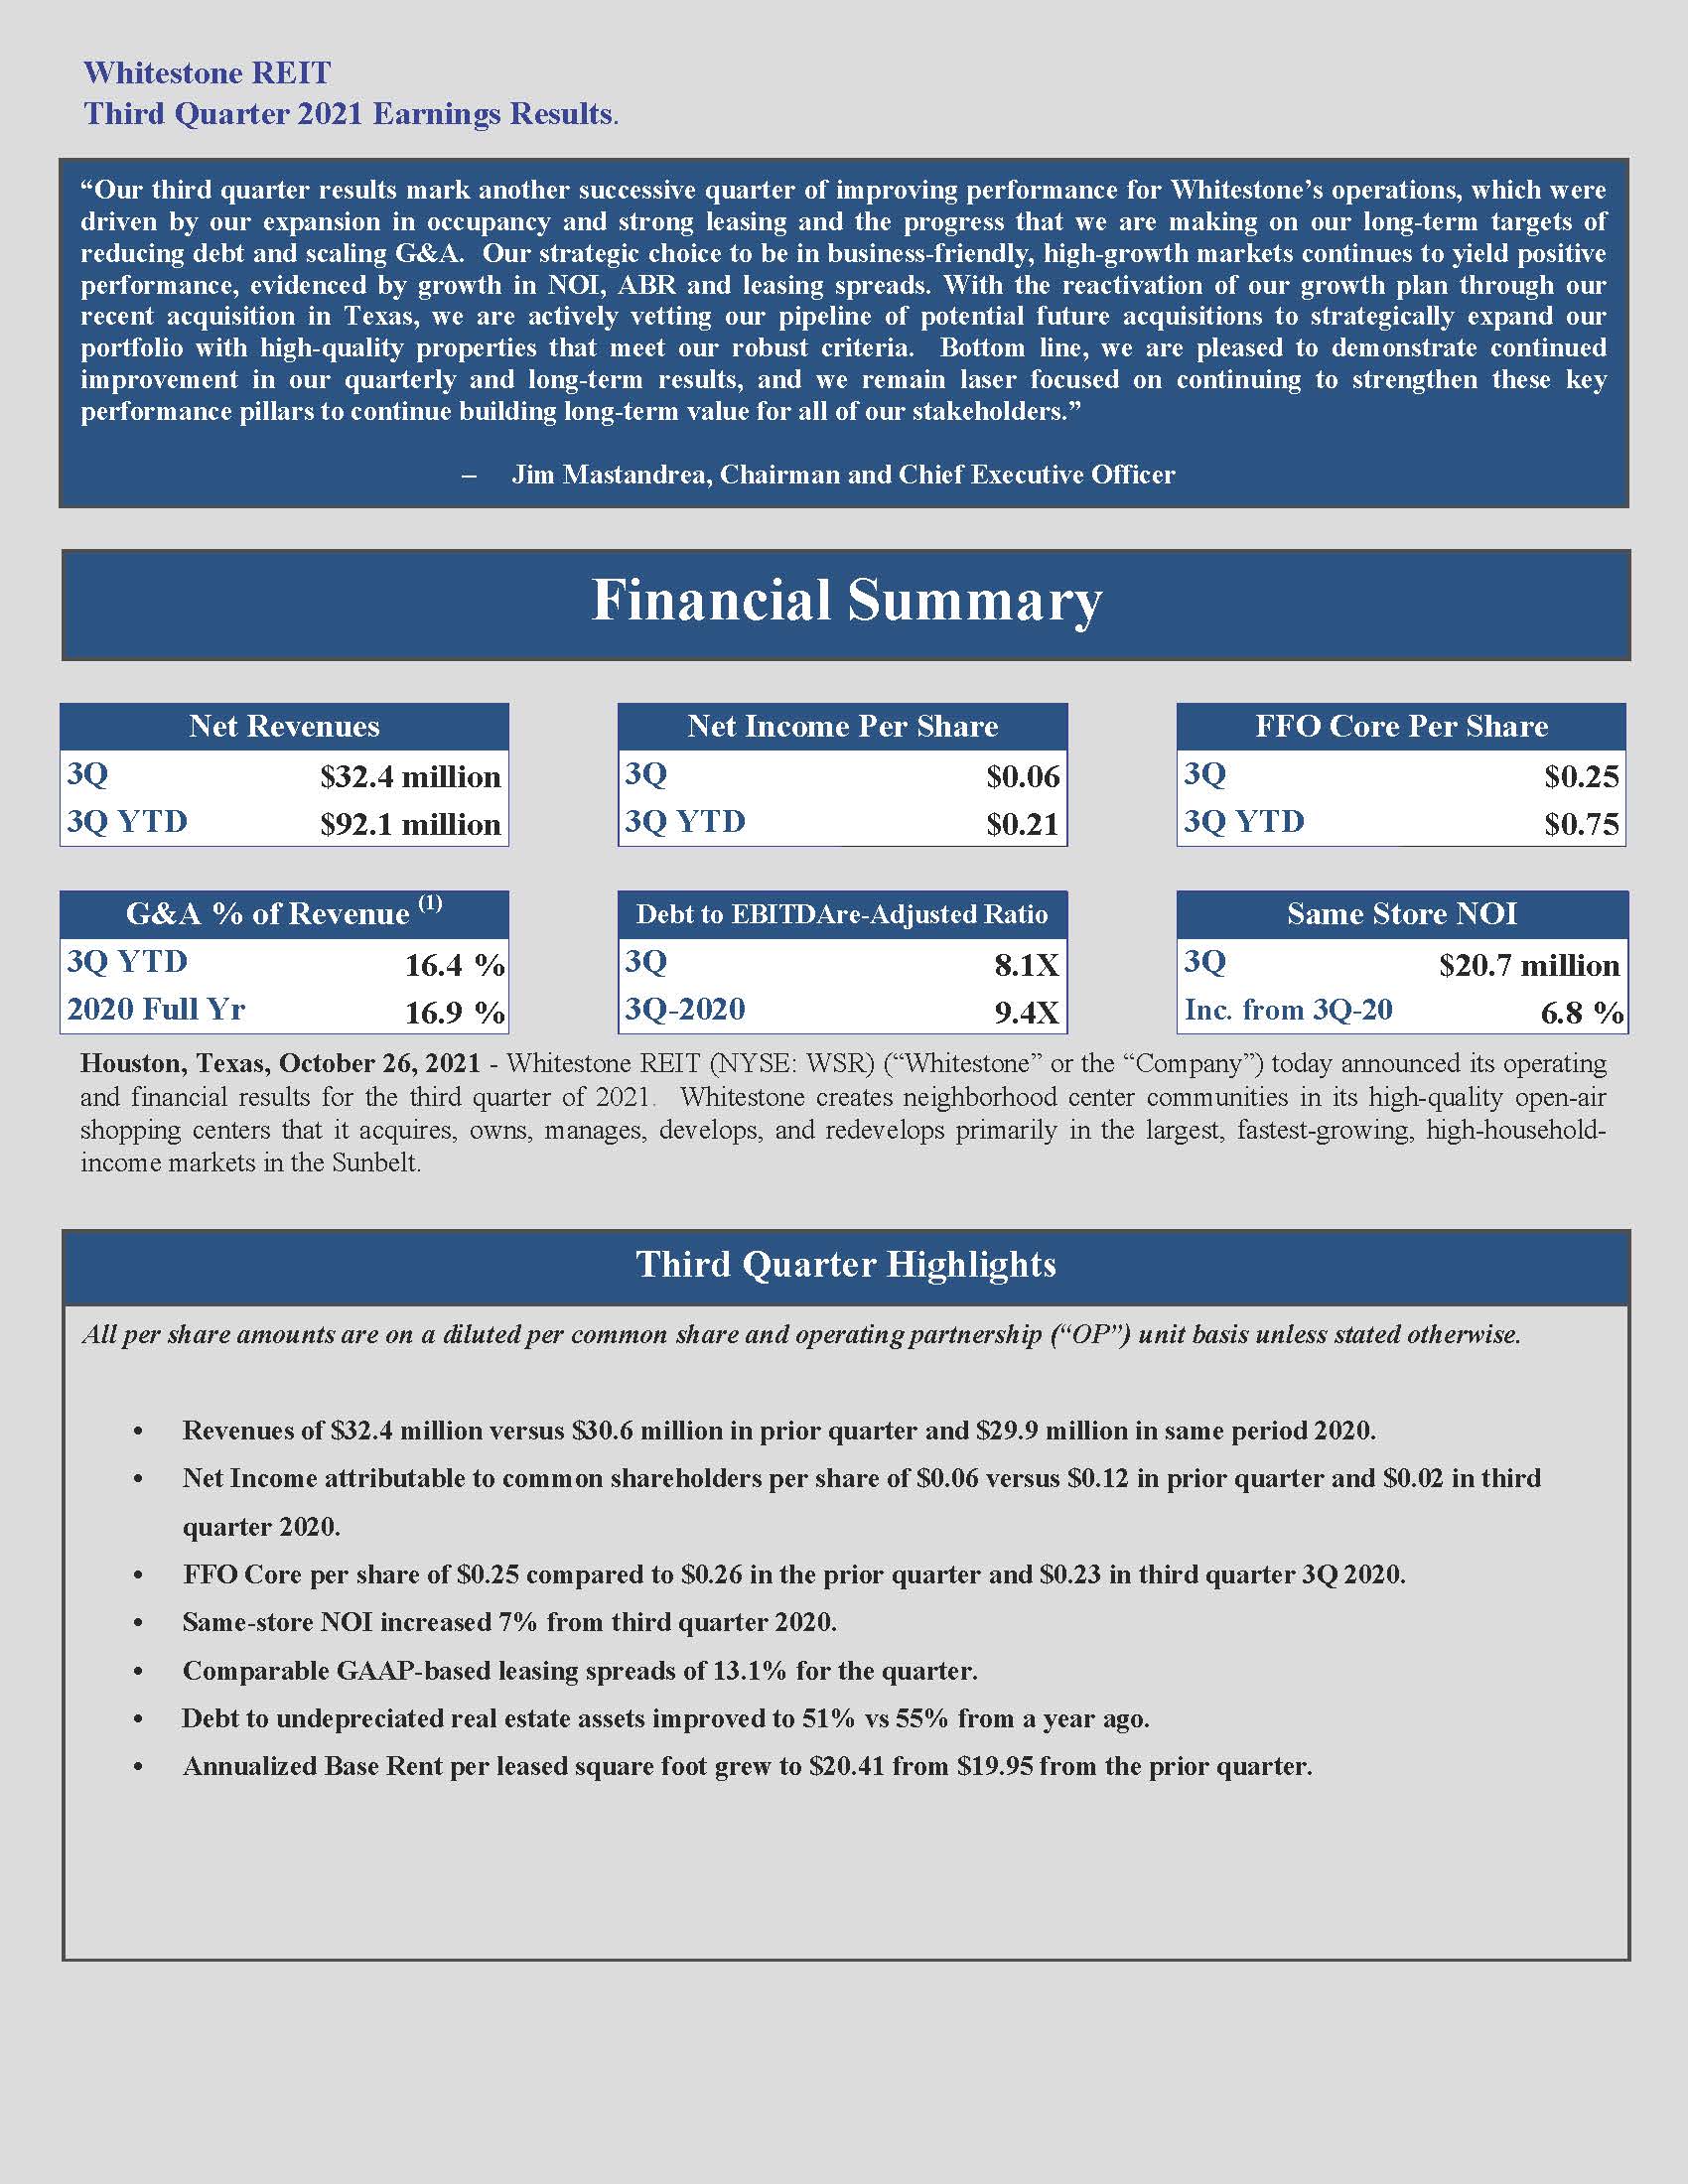
| NYSE: WSR | | Whitestone REIT (NYSE: WSR) is a community-centered shopping center REIT that acquires, owns, manages, |
| Common Shares | | develops and redevelops high-quality open-air neighborhood centers primarily in the largest, fastest-growing and |
| | high-household-income markets in the Sunbelt. Whitestone creates communities that thrive through |
| 59 Community Centers | | creating local connections between consumers in the surrounding communities and a well-crafted mix of national, |
| 5.1 million sq. ft. of gross | | regional and local tenants that provide daily necessities, needed services, entertainment and experiences. Whitestone |
| leasable area | | has consistently paid a monthly dividend for more than 15 years. The Company’s balanced and well-managed |
| 1,509 tenants | | capital structure provides stability and flexibility to support it through a multitude of economic cycles. |
| | |
| 6 Top Growth Markets | | We invest in properties that are or can become Community Centered Properties® from which our tenants deliver |
| Austin | | needed services to the surrounding population. We focus on properties with smaller rental spaces that present |
| Chicago | | opportunities for attractive returns. |
| Dallas-Fort Worth | | |
| Houston | | Our strategic efforts target entrepreneurial, service-oriented tenants at each property who provide services to their |
| Phoenix | | respective surrounding communities. Operations include an internal management structure providing cost-effective |
| San Antonio | | services to locally-oriented, smaller space tenants. Multi-cultural community focus sets us apart from traditional |
| | commercial real estate operators. We value diversity on our team and maintain in-house leasing, property |
| Fiscal Year End | | management, marketing, construction, and maintenance departments with culturally diverse and multi-lingual |
| 12/31 | | associates who understand the particular needs of our tenants and neighborhoods. |
| | | | | | | | |
| Common Shares & | | We have a diverse tenant base concentrated on service offerings such as specialty retail, grocery, restaurants, |
| Units Outstanding*: | | medical, educational and financial services, and entertainment. These tenants tend to occupy smaller spaces (less |
| Common Shares: 49.1 million | | than 3,000 square feet) and, as of September 30, 2021, provided a 52% premium rental rate compared to our larger |
| Operating Partnership Units: | | space tenants. The largest of our 1,509 tenants at our wholly owned properties comprised only 2.7% of our |
| 0.8 million | | annualized base rental revenues for the three months ended September 30, 2021. |
| | | | | | | | |
| Distribution (per share / unit)*: | | | | | | | | |
| Quarter: $ 0.1075 | | Investor Relations: | | | | |
| Annualized: $ 0.43 | | Whitestone REIT | | | | | | ICR LLC. |
| Dividend Yield: 4.3%** | | Rebecca Elliott | | | | | | Brad Cohen |
| | Vice President, Corporate Communications | | | | 203.682.8211 |
| | 2600 South Gessner, Suite 500, Houston, Texas 77063 | | | | |
| Board of Trustees: | | 713.435.2219 email: ir@whitestonereit.com | | |
| Nandita V. Berry | | website: www.whitestonereit.com | | |
| Jeffrey A. Jones | | | | |
| Paul T. Lambert | | Analyst Coverage: | | | | | | |
| Jack L. Mahaffey | | B. Riley FBR | | JMP Securities | | Maxim Group | | |
| James C. Mastandrea | | Craig Kucera | | Aaron Hecht | | Michael Diana | | |
| David F. Taylor | | 540.277.3366 | | 415.835.3963 | | 212.895.3641 | | |
| Trustee Emeritus: | | ckucera@brileyfbr.com | | ahecht@jmpsecurities.com | | mdiana@maximgrp.com | | |
| Daniel G. DeVos | | | | | | | | |
| | | | | | | | |
| | | | | | | | |
| * As of October 25, 2021 | | | | | | | | |
| ** Based on common share price | | | | | | | | |
| of $9.91 as of close of market on | | | | | | | | |
| October 25, 2021. | | | | | | | | |
| | We are followed by the analysts listed above. Please note that any opinions, estimates or forecasts regarding our performance made by these analysts are theirs alone and do not represent opinions, forecasts or predictions of our management. We do not by our reference above or distribution imply our endorsement of or concurrence with such information, conclusions or recommendations. |

| | | | | | | | | | | | | | |
| Whitestone REIT and Subsidiaries |
| CONSOLIDATED BALANCE SHEETS |
| (in thousands, except share and per share data) |
| | |
| | September 30, 2021 | | December 31, 2020 |
| | | | |
| ASSETS |
| Real estate assets, at cost | | | | |
| Property | | $ | 1,165,274 | | | $ | 1,106,426 | |
| Accumulated depreciation | | (183,383) | | | (163,712) | |
| Total real estate assets | | 981,891 | | | 942,714 | |
| Investment in real estate partnership | | 34,408 | | | 33,979 | |
| Cash and cash equivalents | | 10,858 | | | 25,777 | |
| Restricted cash | | 106 | | | 179 | |
| Escrows and acquisition deposits | | 10,437 | | | 9,274 | |
Accrued rents and accounts receivable, net of allowance for doubtful accounts (1) | | 21,991 | | | 23,009 | |
| Receivable due from related party | | 651 | | | 335 | |
| Unamortized lease commissions, legal fees and loan costs | | 8,356 | | | 7,686 | |
Prepaid expenses and other assets(2) | | 2,371 | | | 2,049 | |
| Total assets | | $ | 1,071,069 | | | $ | 1,045,002 | |
| | | | |
| LIABILITIES AND EQUITY |
| Liabilities: | | | | |
| Notes payable | | $ | 618,649 | | | $ | 644,185 | |
Accounts payable and accrued expenses(3) | | 44,563 | | | 50,918 | |
| Payable due to related party | | 530 | | | 125 | |
| Tenants' security deposits | | 7,718 | | | 6,916 | |
| Dividends and distributions payable | | 5,333 | | | 4,532 | |
| Total liabilities | | 676,793 | | | 706,676 | |
| Commitments and contingencies: | | — | | | — | |
| Equity: | | | | |
| Preferred shares, $0.001 par value per share; 50,000,000 shares authorized; none issued and outstanding as of September 30, 2021 and December 31, 2020 | | — | | | — | |
| Common shares, $0.001 par value per share; 400,000,000 shares authorized; 48,839,594 and 42,391,316 issued and outstanding as of September 30, 2021 and December 31, 2020, respectively | | 48 | | | 42 | |
| Additional paid-in capital | | 618,963 | | | 562,250 | |
| Accumulated deficit | | (221,277) | | | (215,809) | |
| Accumulated other comprehensive loss | | (9,726) | | | (14,400) | |
| Total Whitestone REIT shareholders' equity | | 388,008 | | | 332,083 | |
| Noncontrolling interest in subsidiary | | 6,268 | | | 6,243 | |
| Total equity | | 394,276 | | | 338,326 | |
| Total liabilities and equity | | $ | 1,071,069 | | | $ | 1,045,002 | |
| | | | | | | | | | | | | | |
| Whitestone REIT and Subsidiaries |
| CONSOLIDATED BALANCE SHEETS |
| (in thousands) |
| | |
| | September 30, 2021 | | December 31, 2020 |
(1) Accrued rents and accounts receivable, net of allowance for doubtful accounts | | | | |
| Tenant receivables | | $ | 19,898 | | | $ | 22,956 | |
| Accrued rents and other recoveries | | 17,833 | | | 16,348 | |
| Allowance for doubtful accounts | | (15,919) | | | (16,426) | |
| Other receivables | | 179 | | | 131 | |
| Total accrued rents and accounts receivable, net of allowance for doubtful accounts | | $ | 21,991 | | | $ | 23,009 | |
| | | | |
(2) Operating lease right of use assets (net) | | $ | 316 | | | $ | 592 | |
(3) Operating lease liabilities | | $ | 323 | | | $ | 603 | |
| | | | | | | | | | | | | | | | | | | | | | | | | | | | | | | | |
| Whitestone REIT and Subsidiaries |
| CONSOLIDATED STATEMENTS OF OPERATIONS AND COMPREHENSIVE INCOME (LOSS) |
| (in thousands) |
| | | | | | | | | | |
| | Three Months Ended | | % Change From |
| | September 30, 2021 | | June 30, 2021 | | September 30, 2020 | | June 30, 2021 | | September 30, 2020 |
| Revenues | | | | | | | | | | |
Rental(1) | | $ | 32,069 | | | $ | 30,152 | | | $ | 28,868 | | | 6 | % | | 11 | % |
| Management, transaction, and other fees | | 375 | | | 466 | | | 1,032 | | | (20) | % | | (64) | % |
| Total revenues | | 32,444 | | | 30,618 | | | 29,900 | | | 6 | % | | 9 | % |
| | | | | | | | | | |
| Operating expenses | | | | | | | | | | |
| Depreciation and amortization | | 7,340 | | | 7,105 | | | 7,171 | | | 3 | % | | 2 | % |
| Operating and maintenance | | 5,789 | | | 5,444 | | | 5,029 | | | 6 | % | | 15 | % |
| Real estate taxes | | 4,589 | | | 4,160 | | | 4,670 | | | 10 | % | | (2) | % |
| General and administrative | | 5,672 | | | 4,730 | | | 5,860 | | | 20 | % | | (3) | % |
| Total operating expenses | | 23,390 | | | 21,439 | | | 22,730 | | | 9 | % | | 3 | % |
| | | | | | | | | | |
| Other expenses (income) | | | | | | | | | | |
| Interest expense | | 6,142 | | | 6,143 | | | 6,400 | | | — | % | | (4) | % |
| (Gain) loss on sale or disposal of assets, net | | 48 | | | (224) | | | 18 | | | N.M. (2) | | N.M. |
| Interest, dividend and other investment income | | (31) | | | (23) | | | (71) | | | 35 | % | | (56) | % |
| Total other expenses | | 6,159 | | | 5,896 | | | 6,347 | | | 4 | % | | (3) | % |
| | | | | | | | | | |
| Income before equity investment in real estate partnership and income tax | | 2,895 | | | 3,283 | | | 823 | | | (12) | % | | 252 | % |
| | | | | | | | | | |
| Equity in earnings of real estate partnership | | 151 | | | 189 | | | 196 | | | (20) | % | | (23) | % |
| Provision for income tax | | (100) | | | (87) | | | (105) | | | 15 | % | | (5) | % |
| Income from continuing operations | | 2,946 | | | 3,385 | | | 914 | | | (13) | % | | 222 | % |
| | | | | | | | | | |
| Gain on sale of property from discontinued operations | | — | | | 1,833 | | | — | | | N.M. | | N.M. |
| Income from discontinued operations | | — | | | 1,833 | | | — | | | N.M. | | N.M. |
| | | | | | | | | | |
| Net income | | 2,946 | | | 5,218 | | | 914 | | | (44) | % | | 222 | % |
| | | | | | | | | | |
| Less: Net income attributable to noncontrolling interests | | 47 | | | 92 | | | 14 | | | (49) | % | | 236 | % |
| | | | | | | | | | |
| Net income attributable to Whitestone REIT | | $ | 2,899 | | | $ | 5,126 | | | $ | 900 | | | (43) | % | | 222 | % |
| | | | | | | | | | | | | | | | | | | | | | | | | | | | | | | | |
| Whitestone REIT and Subsidiaries |
| CONSOLIDATED STATEMENTS OF OPERATIONS AND COMPREHENSIVE INCOME (LOSS) |
| (in thousands, except per share data) |
| | | | | | | | | | |
| | Three Months Ended | | % Change From |
| | September 30, 2021 | | June 30, 2021 | | September 30, 2020 | | June 30, 2021 | | September 30, 2020 |
| Basic Earnings Per Share: | | | | | | | | | | |
| Net income from continuing operations attributable to Whitestone REIT excluding amounts attributable to unvested restricted shares | | $ | 0.06 | | | $ | 0.08 | | | $ | 0.02 | | | (25) | % | | 200 | % |
| Income from discontinued operations attributable to Whitestone REIT | | — | | | 0.04 | | | — | | | N.M. | | N.M. |
| Net income attributable to common shareholders, excluding amounts attributable to unvested restricted shares | | $ | 0.06 | | | $ | 0.12 | | | $ | 0.02 | | | (50) | % | | 200 | % |
| Diluted Earnings Per Share: | | | | | | | | | | |
| Net income from continuing operations attributable to Whitestone REIT excluding amounts attributable to unvested restricted shares | | $ | 0.06 | | | $ | 0.08 | | | $ | 0.02 | | | (25) | % | | 200 | % |
| Income from discontinued operations attributable to Whitestone REIT | | — | | | 0.04 | | | — | | | N.M. | | N.M. |
| Net income attributable to common shareholders, excluding amounts attributable to unvested restricted shares | | $ | 0.06 | | | $ | 0.12 | | | $ | 0.02 | | | (50) | % | | 200 | % |
| | | | | | | | | | |
| Weighted average number of common shares outstanding: | | | | | | | | | | |
| Basic | | 46,883 | | | 43,378 | | | 42,346 | | | 8 | % | | 11 | % |
| Diluted | | 47,825 | | | 44,125 | | | 43,440 | | | 8 | % | | 10 | % |
| | | | | | | | | | |
| Consolidated Statements of Comprehensive Income (Loss) | | | | | | | | | | |
| | | | | | | | | | |
| Net income | | $ | 2,946 | | | $ | 5,218 | | | $ | 914 | | | (44) | % | | 222 | % |
| | | | | | | | | | |
| Other comprehensive income (loss) | | | | | | | | | | |
| | | | | | | | | | |
| Unrealized gain (loss) on cash flow hedging activities | | 1,273 | | | 1,289 | | | 1,241 | | | (1) | % | | 3 | % |
| | | | | | | | | | |
| Comprehensive income (loss) | | 4,219 | | | 6,507 | | | 2,155 | | | (35) | % | | 96 | % |
| | | | | | | | | | |
| Less: Net income attributable to noncontrolling interests | | 47 | | | 92 | | | 14 | | | (49) | % | | 236 | % |
| Less: Comprehensive income (loss) attributable to noncontrolling interests | | 20 | | | 21 | | | 43 | | | (5) | % | | (53) | % |
| | | | | | | | | | |
| Comprehensive income (loss) attributable to Whitestone REIT | | $ | 4,152 | | | $ | 6,394 | | | $ | 2,098 | | | (35) | % | | 98 | % |
| | | | | | | | | | | | | | | | | | | | | | | | | | | | | | | | |
| | | | | | | | | | |
| Whitestone REIT and Subsidiaries |
| CONSOLIDATED STATEMENTS OF OPERATIONS AND COMPREHENSIVE INCOME (LOSS) |
| (in thousands) |
| | | | | | | | | | |
| | Three Months Ended | | % Change From |
| | September 30, 2021 | | June 30, 2021 | | September 30, 2020 | | June 30, 2021 | | September 30, 2020 |
(1) Rental | | | | | | | | | | |
| Rental revenues | | $ | 23,177 | | | $ | 22,238 | | | $ | 21,808 | | | 4 | % | | 6 | % |
| Recoveries | | 8,720 | | | 8,057 | | | 8,339 | | | 8 | % | | 5 | % |
| Bad debt | | 172 | | | (143) | | | (1,279) | | | 220 | % | | 113 | % |
| Total rental | | $ | 32,069 | | | $ | 30,152 | | | $ | 28,868 | | | 6 | % | | 11 | % |
(2) Not Meaningful
| | | | | | | | | | | | | | | | | | | | |
| Whitestone REIT and Subsidiaries |
| CONSOLIDATED STATEMENTS OF OPERATIONS AND COMPREHENSIVE INCOME (LOSS) |
| (in thousands) |
| | | | | | |
| | Nine Months Ended September 30, | | % Change From September 30, |
| | 2021 | | 2020 | | 2020 |
| Revenues | | | | | | |
Rental(1) | | $ | 90,916 | | | $ | 86,116 | | | 6 | % |
| Management, transaction, and other fees | | 1,191 | | | 1,965 | | | (39) | % |
| Total revenues | | 92,107 | | | 88,081 | | | 5 | % |
| | | | | | |
| Operating expenses | | | | | | |
| Depreciation and amortization | | 21,458 | | | 21,112 | | | 2 | % |
| Operating and maintenance | | 16,072 | | | 15,021 | | | 7 | % |
| Real estate taxes | | 12,787 | | | 13,591 | | | (6) | % |
| General and administrative | | 16,036 | | | 15,604 | | | 3 | % |
| Total operating expenses | | 66,353 | | | 65,328 | | | 2 | % |
| | | | | | |
| Other expenses (income) | | | | | | |
| Interest expense | | 18,417 | | | 19,561 | | | (6) | % |
| (Gain) loss on sale or disposal of assets, net | | (177) | | | 882 | | | N.M. |
| Interest, dividend and other investment income | | (103) | | | (206) | | | (50) | % |
| Total other expenses | | 18,137 | | | 20,237 | | | (10) | % |
| | | | | | |
| Income before equity investment in real estate partnership and income tax | | 7,617 | | | 2,516 | | | 203 | % |
| | | | | | |
| Equity in earnings of real estate partnership | | 429 | | | 752 | | | (43) | % |
| Provision for income tax | | (274) | | | (288) | | | (5) | % |
| Income from continuing operations | | 7,772 | | | 2,980 | | | 161 | % |
| | | | | | |
| Gain on sale of property from discontinued operations | | 1,833 | | | — | | | N.M. |
| Income from discontinued operations | | 1,833 | | | — | | | N.M. |
| | | | | | |
| Net income | | 9,605 | | | 2,980 | | | 222 | % |
| | | | | | |
| Less: Net income attributable to noncontrolling interests | | 165 | | | 58 | | | 184 | % |
| | | | | | |
| Net income attributable to Whitestone REIT | | $ | 9,440 | | | $ | 2,922 | | | 223 | % |
| | | | | | | | | | | | | | | | | | | | |
| Whitestone REIT and Subsidiaries |
| CONSOLIDATED STATEMENTS OF OPERATIONS AND COMPREHENSIVE INCOME (LOSS) |
| (in thousands, except per share data) |
| | | | |
| | Nine Months Ended September 30, | | % Change From September 30, |
| | 2021 | | 2020 | | 2020 |
| Basic Earnings Per Share: | | | | | | |
| Net income from continuing operations attributable to Whitestone REIT excluding amounts attributable to unvested restricted shares | | $ | 0.17 | | | $ | 0.07 | | | 143 | % |
| Income from discontinued operations attributable to Whitestone REIT | | 0.04 | | | — | | | N.M. |
| Net income attributable to common shareholders, excluding amounts attributable to unvested restricted shares | | $ | 0.21 | | | $ | 0.07 | | | 200 | % |
| Diluted Earnings Per Share: | | | | | | |
| Net income from continuing operations attributable to Whitestone REIT excluding amounts attributable to unvested restricted shares | | $ | 0.17 | | | $ | 0.07 | | | 143 | % |
| Income from discontinued operations attributable to Whitestone REIT | | 0.04 | | | — | | | N.M. |
| Net income attributable to common shareholders, excluding amounts attributable to unvested restricted shares | | $ | 0.21 | | | $ | 0.07 | | | 200 | % |
| | | | | | |
| Weighted average number of common shares outstanding: | | | | | | |
| Basic | | 44,268 | | | 42,202 | | | 5 | % |
| Diluted | | 45,108 | | | 43,040 | | | 5 | % |
| | | | | | |
| Consolidated Statements of Comprehensive Income (Loss) | | | | | | |
| | | | | | |
| Net income | | $ | 9,605 | | | $ | 2,980 | | | 222 | % |
| | | | | | |
| Other comprehensive income (loss) | | | | | | |
| | | | | | |
| Unrealized gain (loss) on cash flow hedging activities | | 4,783 | | | (10,395) | | | N.M. |
| | | | | | |
| Comprehensive income (loss) | | 14,388 | | | (7,415) | | | N.M. |
| | | | | | |
| Less: Net income attributable to noncontrolling interests | | 165 | | | 58 | | | 184 | % |
| Less: Comprehensive income (loss) attributable to noncontrolling interests | | 82 | | | (203) | | | N.M. |
| | | | | | |
| Comprehensive income (loss) attributable to Whitestone REIT | | $ | 14,141 | | | $ | (7,270) | | | N.M. |
| | | | | | | | | | | | | | | | | | | | |
| | | | |
| Whitestone REIT and Subsidiaries |
| CONSOLIDATED STATEMENTS OF OPERATIONS AND COMPREHENSIVE INCOME (LOSS) |
| (in thousands) |
| | | | | | |
| | Nine Months Ended September 30, | | % Change From September 30, |
| | 2021 | | 2020 | | 2020 |
(1) Rental | | | | | | |
| Rental revenues | | $ | 67,041 | | | $ | 65,591 | | | 2 | % |
| Recoveries | | 24,375 | | | 24,976 | | | (2) | % |
| Bad debt | | (500) | | | (4,451) | | | 89 | % |
| Total rental | | $ | 90,916 | | | $ | 86,116 | | | 6 | % |
| | | | | | | | | | | | | | | | |
Whitestone REIT and Subsidiaries
CONSOLIDATED STATEMENTS OF CASH FLOWS
(in thousands) | | |
| | | | | | |
| | Nine Months Ended September 30, | | |
| | | 2021 | | 2020 | | |
| Cash flows from operating activities: | | | | | | |
| Net income from continuing operations | | $ | 7,772 | | | $ | 2,980 | | | |
| Net income from discontinued operations | | 1,833 | | | — | | | |
| Net income | | 9,605 | | | 2,980 | | | |
| Adjustments to reconcile net income to net cash provided by operating activities: | | | | | | |
| Depreciation and amortization | | 21,458 | | | 21,112 | | | |
| Amortization of deferred loan costs | | 822 | | | 839 | | | |
| (Gain) loss on sale or disposal of assets and loan forgiveness, net | | (177) | | | 882 | | | |
| Bad debt | | 500 | | | 4,451 | | | |
| Share-based compensation | | 4,066 | | | 3,980 | | | |
| Equity in earnings of real estate partnership | | (429) | | | (752) | | | |
| Changes in operating assets and liabilities: | | | | | | |
| Escrows and acquisition deposits | | (1,163) | | | 522 | | | |
| Accrued rents and accounts receivable | | 518 | | | (6,123) | | | |
| Receivable due from related party | | (316) | | | (825) | | | |
| Unamortized lease commissions, legal fees and loan costs | | (2,531) | | | (958) | | | |
| Prepaid expenses and other assets | | 1,548 | | | 2,145 | | | |
| Accounts payable and accrued expenses | | (1,572) | | | 131 | | | |
| Payable due to related party | | 405 | | | 538 | | | |
| Tenants' security deposits | | 802 | | | 298 | | | |
| Net cash provided by operating activities | | 31,703 | | | 29,220 | | | |
| Cash flows from investing activities: | | | | | | |
| Acquisitions of real estate | | (53,364) | | | — | | | |
| Additions to real estate | | (6,058) | | | (5,808) | | | |
| Proceeds from note receivable | | — | | | 922 | | | |
| Net cash used in investing activities | | (59,422) | | | (4,886) | | | |
| Net cash provided by investing activities of discontinued operations | | 1,833 | | | — | | | |
| Cash flows from financing activities: | | | | | | |
| Distributions paid to common shareholders | | (14,063) | | | (20,771) | | | |
| Distributions paid to OP unit holders | | (248) | | | (430) | | | |
| Proceeds from issuance of common shares, net of offering costs | | 53,335 | | | 2,241 | | | |
| Payments of exchange offer costs | | (49) | | | (43) | | | |
| Proceeds from notes payable | | — | | | 1,734 | | | |
| Net proceeds from (payments of) credit facility | | (25,000) | | | 30,000 | | | |
| Repayments of notes payable | | (2,403) | | | (11,514) | | | |
| Repurchase of common shares | | (678) | | | (2,076) | | | |
| Net cash provided by (used in) financing activities | | 10,894 | | | (859) | | | |
| Net increase (decrease) in cash, cash equivalents and restricted cash | | (14,992) | | | 23,475 | | | |
| Cash, cash equivalents and restricted cash at beginning of period | | 25,956 | | | 15,643 | | | |
Cash, cash equivalents and restricted cash at end of period (1) | | $ | 10,964 | | | $ | 39,118 | | | |
(1) For a reconciliation of cash, cash equivalents and restricted cash, see supplemental disclosures below.
| | | | | | | | | | | | | | | | |
| Whitestone REIT and Subsidiaries | | |
| CONSOLIDATED STATEMENTS OF CASH FLOWS | | |
| Supplemental Disclosures | | |
| (in thousands) | | |
| | | | | | |
| | Nine Months Ended September 30, | | |
| | 2021 | | 2020 | | |
| Supplemental disclosure of cash flow information: | | | | | | |
| Cash paid for interest | | $ | 17,732 | | | $ | 18,790 | | | |
| Cash paid for taxes | | $ | 364 | | | $ | 353 | | | |
| Non cash investing and financing activities: | | | | | | |
| Disposal of fully depreciated real estate | | $ | 284 | | | $ | 34 | | | |
| Financed insurance premiums | | $ | 1,712 | | | $ | 1,431 | | | |
| Value of shares issued under dividend reinvestment plan | | $ | 45 | | | $ | 74 | | | |
| Value of common shares exchanged for OP units | | $ | — | | | $ | 1,138 | | | |
| Change in fair value of cash flow hedge | | $ | 4,783 | | | $ | (10,395) | | | |
| | | | | | | | | | | | | | |
| | September 30, |
| | 2021 | | 2020 |
| Cash, cash equivalents and restricted cash | | | | |
| Cash and cash equivalents | | $ | 10,858 | | | $ | 38,990 | |
| Restricted cash | | 106 | | | 128 | |
| Total cash, cash equivalents and restricted cash | | $ | 10,964 | | | $ | 39,118 | |
| | | | | | | | | | | | | | | | | | | | | | | | | | | | | | | | | | |
| Whitestone REIT and Subsidiaries | | |
| RECONCILIATION OF NON-GAAP MEASURES | | |
| (in thousands, except per share and per unit data) | | |
| | | | | | | | | | | | |
| | | Three Months Ended | Change From | | |
| | September 30, 2021 | | June 30, 2021 | | September 30, 2020 | | June 30, 2021 | | September 30, 2020 | | |
| FFO (NAREIT) AND FFO CORE | | | | | | | | | | | | |
| Net income attributable to Whitestone REIT | | $ | 2,899 | | | $ | 5,126 | | | $ | 900 | | | (43) | % | | 222 | % | | |
Adjustments to reconcile to FFO:(1) | | | | | | | | | | | | |
| Depreciation and amortization of real estate assets | | 7,305 | | | 7,068 | | | 7,125 | | | 3 | % | | 3 | % | | |
| Depreciation and amortization of real estate assets of real estate partnership (pro rata) | | 440 | | | 409 | | | 386 | | | 8 | % | | 14 | % | | |
| (Gain) loss on sale or disposal of assets, net | | 48 | | | (224) | | | 18 | | | 121 | % | | 167 | % | | |
| Gain on sale of property from discontinued operations | | — | | | (1,833) | | | — | | | N.M. | | N.M. | | |
(Gain) loss on sale or disposal of properties or assets of real estate partnership (pro rata)(2) | | 1 | | | (20) | | | 24 | | | N.M. | | N.M. | | |
| Net income attributable to noncontrolling interests | | 47 | | | 92 | | | 14 | | | (49) | % | | 236 | % | | |
| FFO (NAREIT) | | 10,740 | | | 10,618 | | | 8,467 | | | 1 | % | | 27 | % | | |
| Adjustments to reconcile to FFO Core: | | | | | | | | | | | | |
| Share-based compensation expense | | 1,563 | | | 1,244 | | | 1,645 | | | 26 | % | | (5) | % | | |
| FFO Core | | $ | 12,303 | | | $ | 11,862 | | | $ | 10,112 | | | 4 | % | | 22 | % | | |
| | | | | | | | | | | | |
| FFO PER SHARE AND OP UNIT CALCULATION | | | | | | | | | | | | |
| Numerator: | | | | | | | | | | | | |
| FFO | | $ | 10,740 | | | $ | 10,618 | | | $ | 8,467 | | | 1 | % | | 27 | % | | |
| | | | | | | | | | | | |
| | | | | | | | | | | | |
| FFO Core | | $ | 12,303 | | | $ | 11,862 | | | $ | 10,112 | | | 4 | % | | 22 | % | | |
| Denominator: | | | | | | | | | | | | |
| Weighted average number of total common shares - basic | | 46,883 | | | 43,378 | | | 42,346 | | | 8 | % | | 11 | % | | |
| Weighted average number of total noncontrolling OP units - basic | | 773 | | | 773 | | | 776 | | | — | % | | — | % | | |
| Weighted average number of total common shares and noncontrolling OP units - basic | | 47,656 | | | 44,151 | | | 43,122 | | | 8 | % | | 11 | % | | |
| | | | | | | | | | | | |
| Effect of dilutive securities: | | | | | | | | | | | | |
| Unvested restricted shares | | 942 | | | 747 | | | 1,094 | | | 26 | % | | (14) | % | | |
| Weighted average number of total common shares and noncontrolling OP units - diluted | | 48,598 | | | 44,898 | | | 44,216 | | | 8 | % | | 10 | % | | |
| | | | | | | | | | | | |
| FFO per common share and OP unit - basic | | $ | 0.23 | | | $ | 0.24 | | | $ | 0.20 | | | (4) | % | | 15 | % | | |
| FFO per common share and OP unit - diluted | | $ | 0.22 | | | $ | 0.24 | | | $ | 0.19 | | | (8) | % | | 16 | % | | |
| | | | | | | | | | | | |
| FFO Core per common share and OP unit - basic | | $ | 0.26 | | | $ | 0.27 | | | $ | 0.23 | | | (4) | % | | 13 | % | | |
| FFO Core per common share and OP unit - diluted | | $ | 0.25 | | | $ | 0.26 | | | $ | 0.23 | | | (4) | % | | 9 | % | | |
(1) Includes pro-rata share attributable to real estate partnership.
(2) Included in equity in earnings of real estate partnership on the consolidated statements of operations and comprehensive income (loss).
| | | | | | | | | | | | | | | | | | | | | | |
| Whitestone REIT and Subsidiaries | | |
| RECONCILIATION OF NON-GAAP MEASURES | | |
| (in thousands, except per share and per unit data) | | |
| | | | | | | | |
| | | | % Change | | |
| | | Nine Months Ended September 30, | | From September 30, | | |
| | 2021 | | 2020 | | 2020 | | |
| FFO (NAREIT) AND FFO CORE | | | | | | | | |
| Net income attributable to Whitestone REIT | | $ | 9,440 | | | $ | 2,922 | | | 223 | % | | |
Adjustments to reconcile to FFO:(1) | | | | | | | | |
| Depreciation and amortization of real estate assets | | 21,353 | | | 20,943 | | | 2 | % | | |
| Depreciation and amortization of real estate assets of real estate partnership (pro rata) | | 1,254 | | | 1,262 | | | (1) | % | | |
| (Gain) loss on sale or disposal of assets, net | | (177) | | | 882 | | | N.M. | | |
| Gain on sale of property from discontinued operations | | (1,833) | | | — | | | N.M. | | |
(Gain) loss on sale or disposal of properties or assets of real estate partnership (pro rata)(2) | | (19) | | | 78 | | | (124) | % | | |
| Net income attributable to noncontrolling interests | | 165 | | | 58 | | | 184 | % | | |
| FFO (NAREIT) | | 30,183 | | | 26,145 | | | 15 | % | | |
| Adjustments to reconcile to FFO Core: | | | | | | | | |
| Share-based compensation expense | | 4,275 | | | 4,167 | | | 3 | % | | |
| FFO Core | | $ | 34,458 | | | $ | 30,312 | | | 14 | % | | |
| | | | | | | | |
| FFO PER SHARE AND OP UNIT CALCULATION | | | | | | | | |
| Numerator: | | | | | | | | |
| FFO | | $ | 30,183 | | | $ | 26,145 | | | 15 | % | | |
| | | | | | | | |
| | | | | | | | |
| FFO Core excluding amounts attributable to unvested restricted common shares | | $ | 34,458 | | | $ | 30,312 | | | 14 | % | | |
| Denominator: | | | | | | | | |
| Weighted average number of total common shares - basic | | 44,268 | | | 42,202 | | | 5 | % | | |
| Weighted average number of total noncontrolling OP units - basic | | 773 | | | 836 | | | (8) | % | | |
| Weighted average number of total common shares and noncontrolling OP units - basic | | 45,041 | | | 43,038 | | | 5 | % | | |
| | | | | | | | |
| Effect of dilutive securities: | | | | | | | | |
| Unvested restricted shares | | 840 | | | 838 | | | — | % | | |
| Weighted average number of total common shares and noncontrolling OP units - diluted | | 45,881 | | | 43,876 | | | 5 | % | | |
| | | | | | | | |
| FFO per common share and OP unit - basic | | $ | 0.67 | | | $ | 0.61 | | | 10 | % | | |
| FFO per common share and OP unit - diluted | | $ | 0.66 | | | $ | 0.60 | | | 10 | % | | |
| | | | | | | | |
| FFO Core per common share and OP unit - basic | | $ | 0.77 | | | $ | 0.70 | | | 10 | % | | |
| FFO Core per common share and OP unit - diluted | | $ | 0.75 | | | $ | 0.69 | | | 9 | % | | |
(1) Includes pro-rata share attributable to real estate partnership.
(2) Included in equity in earnings of real estate partnership on the consolidated statements of operations and comprehensive income (loss).
| | | | | | | | | | | | | | | | | | | | | | | | | | | | |
| Whitestone REIT and Subsidiaries | | |
| RECONCILIATION OF NON-GAAP MEASURES | | |
| (continued) | | |
| (in thousands) | | |
| | | | | | | | | | |
| | Three Months Ended | | Nine Months Ended | | |
| | | September 30, | | September 30, | | |
| | 2021 | | 2020 | | 2021 | | 2020 | | |
| PROPERTY NET OPERATING INCOME | | | | | | | | | | |
| Net income attributable to Whitestone REIT | | $ | 2,899 | | | $ | 900 | | | $ | 9,440 | | | $ | 2,922 | | | |
| General and administrative expenses | | 5,672 | | | 5,860 | | | 16,036 | | | 15,604 | | | |
| Depreciation and amortization | | 7,340 | | | 7,171 | | | 21,458 | | | 21,112 | | | |
| Equity in earnings of real estate partnership | | (151) | | | (196) | | | (429) | | | (752) | | | |
| Interest expense | | 6,142 | | | 6,400 | | | 18,417 | | | 19,561 | | | |
| Interest, dividend and other investment income | | (31) | | | (71) | | | (103) | | | (206) | | | |
| Provision for income taxes | | 100 | | | 105 | | | 274 | | | 288 | | | |
| Gain on sale of property from discontinued operations | | — | | | — | | | (1,833) | | | — | | | |
| Management fee, net of related expenses | | 83 | | | 81 | | | 246 | | | 246 | | | |
| (Gain) loss on sale or disposal of assets, net | | 48 | | | 18 | | | (177) | | | 882 | | | |
| NOI of real estate partnership (pro rata) | | 1,003 | | | 990 | | | 2,846 | | | 3,250 | | | |
| Net income attributable to noncontrolling interests | | 47 | | | 14 | | | 165 | | | 58 | | | |
| NOI | | 23,152 | | | 21,272 | | | 66,340 | | | 62,965 | | | |
Non-Same Store NOI (1) | | (730) | | | — | | | (730) | | | — | | | |
| NOI of real estate partnership (pro rata) | | (1,003) | | | (990) | | | (2,846) | | | (3,250) | | | |
| NOI less Non-Same Store NOI and NOI of real estate partnership (pro rata) | | 21,419 | | | 20,282 | | | 62,764 | | | 59,715 | | | |
| Same Store straight-line rent adjustments | | (507) | | | (61) | | | (1,201) | | | 558 | | | |
| Same Store amortization of above/below market rents | | (177) | | | (149) | | | (618) | | | (584) | | | |
| Same Store lease termination fees | | (79) | | | (727) | | | (306) | | | (1,028) | | | |
Same Store NOI (2) | | $ | 20,656 | | | $ | 19,345 | | | $ | 60,639 | | | $ | 58,661 | | | |
(1) We define “Non-Same Store” as properties that have been acquired since the beginning of the period being compared and properties that have been sold, but not classified as discontinued operations. For purposes of comparing the three months ended September 30, 2021 to the three months ended September 30, 2020, Non-Same Store includes properties acquired between July 1, 2020 and September 30, 2021 and properties sold between July 1, 2020 and September 30, 2021, but not included in discontinued operations. For purposes of comparing the nine months ended September 30, 2021 to the nine months ended September 30, 2020, Non-Same Store includes properties acquired between January 1, 2020 and September 30, 2021 and properties sold between January 1, 2020 and September 30, 2021, but not included in discontinued operations.
(2) We define “Same Store” as properties that have been owned during the entire period being compared. For purposes of comparing the three months ended September 30, 2021 to the three months ended September 30, 2020, Same Store includes properties owned before July 1, 2020 and not sold before September 30, 2021. For purposes of comparing the nine months ended September 30, 2021 to the nine months ended September 30, 2020, Same Store includes properties owned before January 1, 2020 and not sold before September 30, 2021.
| | | | | | | | | | | | | | | | | | | | | | | | | | | | | | | | | | |
| Whitestone REIT and Subsidiaries | | |
| RECONCILIATION OF NON-GAAP MEASURES | | |
| (continued) | | |
| (in thousands) | | |
| | | | | | |
| | Three Months Ended | | % Change From | | |
| | September 30, 2021 | | June 30, 2021 | | September 30, 2020 | | June 30, 2021 | | September 30, 2020 | | |
| EARNINGS BEFORE INTEREST, TAX, DEPRECIATION AND AMORTIZATION FOR REAL ESTATE (EBITDAre) |
| | | | | | | | | | | | |
| Net income attributable to Whitestone REIT | | $ | 2,899 | | | $ | 5,126 | | | $ | 900 | | | (43) | % | | 222 | % | | |
| Depreciation and amortization | | 7,340 | | | 7,105 | | | 7,171 | | | 3 | % | | 2 | % | | |
| Interest expense | | 6,142 | | | 6,143 | | | 6,400 | | | — | % | | (4) | % | | |
| Provision for income taxes | | 100 | | | 87 | | | 105 | | | 15 | % | | (5) | % | | |
| Net income attributable to noncontrolling interests | | 47 | | | 92 | | | 14 | | | (49) | % | | 236 | % | | |
| Equity in earnings of real estate partnership | | (151) | | | (189) | | | (196) | | | (20) | % | | (23) | % | | |
| EBITDAre adjustments for real estate partnership | | 807 | | | 766 | | | 804 | | | 5 | % | | — | % | | |
| Gain on sale of property from discontinued operations | | — | | | (1,833) | | | — | | | N.M. | | N.M. | | |
| (Gain) loss on sale or disposal of assets, net | | 48 | | | (224) | | | 18 | | | 121 | % | | 167 | % | | |
| EBITDAre | | 17,232 | | | 17,073 | | | 15,216 | | | 1 | % | | 13 | % | | |
| Management fee, net of related expenses | | 83 | | | 83 | | | 81 | | | — | % | | 2 | % | | |
| Share-based compensation expense | | 1,563 | | | 1,244 | | | 1,645 | | | 26 | % | | (5) | % | | |
| EBITDAre-Adjusted | | $ | 18,878 | | | $ | 18,400 | | | $ | 16,942 | | | 3 | % | | 11 | % | | |
| | | | | | | | | | | | | | | | | | | | | | |
| | Nine Months Ended September 30, | | % Change From September 30, | | |
| | 2021 | | 2020 | | 2020 | | |
| EARNINGS BEFORE INTEREST, TAX, DEPRECIATION AND AMORTIZATION FOR REAL ESTATE (EBITDAre) | | |
| | | | | | | | |
| Net income attributable to Whitestone REIT | | $ | 9,440 | | | $ | 2,922 | | | 223 | % | | |
| Depreciation and amortization | | 21,458 | | | 21,112 | | | 2 | % | | |
| Interest expense | | 18,417 | | | 19,561 | | | (6) | % | | |
| Provision for income taxes | | 274 | | | 288 | | | (5) | % | | |
| Net income attributable to noncontrolling interests | | 165 | | | 58 | | | 184 | % | | |
| Equity in earnings of real estate partnership | | (429) | | | (752) | | | (43) | % | | |
| EBITDAre adjustments for real estate partnership | | 2,258 | | | 2,690 | | | (16) | % | | |
| Gain on sale of property from discontinued operations | | (1,833) | | | — | | | N.M. | | |
| (Gain) loss on sale or disposal of assets, net | | (177) | | | 882 | | | N.M. | | |
| EBITDAre | | 49,573 | | | 46,761 | | | 6 | % | | |
| Management fee, net of related expenses | | 246 | | | 246 | | | — | % | | |
| Share-based compensation expense | | 4,275 | | | 4,167 | | | 3 | % | | |
| EBITDAre-Adjusted | | $ | 54,094 | | | $ | 51,174 | | | 6 | % | | |
| | | | | | | | | | | | | | | | | | | | | | | | | | |
| Whitestone REIT and Subsidiaries |
| SAME STORE PROPERTY ANALYSIS |
| (in thousands) |
| | | | | | | | |
| | Three Months Ended September 30, | | Increase | | % Increase |
| | 2021 | | 2020 | | (Decrease) | | (Decrease) |
| Same Store (53 properties excluding development land) | | | | | | | | |
| Property revenues | | | | | | | | |
| Rental | | $ | 31,056 | | | $ | 28,868 | | | $ | 2,188 | | | 8 | % |
| Management, transaction and other fees | | 231 | | | 888 | | | (657) | | | (74) | % |
| Total property revenues | | 31,287 | | | 29,756 | | | 1,531 | | | 5 | % |
| | | | | | | | |
| Property expenses | | | | | | | | |
| Property operation and maintenance | | 5,460 | | | 4,804 | | | 656 | | | 14 | % |
| Real estate taxes | | 4,408 | | | 4,670 | | | (262) | | | (6) | % |
| Total property expenses | | 9,868 | | | 9,474 | | | 394 | | | 4 | % |
| | | | | | | | |
| Total property revenues less total property expenses | | 21,419 | | | 20,282 | | | 1,137 | | | 6 | % |
| | | | | | | | |
| Same Store straight-line rent adjustments | | (507) | | | (61) | | | (446) | | | (731) | % |
| Same Store amortization of above/below market rents | | (177) | | | (149) | | | (28) | | | (19) | % |
| Same Store lease termination fees | | (79) | | | (727) | | | 648 | | | 89 | % |
| | | | | | | | |
Same Store NOI (1) | | $ | 20,656 | | | $ | 19,345 | | | $ | 1,311 | | | 7 | % |
(1) For a reconciliation of Same Store NOI, see previous section “Reconciliation of Non-GAAP Measures.”
| | | | | | | | | | | | | | | | | | | | | | | | | | |
| Whitestone REIT and Subsidiaries |
| SAME STORE PROPERTY ANALYSIS |
| (in thousands) |
| | | | | | | | |
| | Nine Months Ended September 30, | | Increase | | % Increase |
| | 2021 | | 2020 | | (Decrease) | | (Decrease) |
| Same Store (53 properties, excluding development land) | | | | | | | | |
| Property revenues | | | | | | | | |
| Rental | | $ | 89,903 | | | $ | 86,116 | | | $ | 3,787 | | | 4 | % |
| Management, transaction and other fees | | 764 | | | 1,510 | | | (746) | | | (49) | % |
| Total property revenues | | 90,667 | | | 87,626 | | | 3,041 | | | 3 | % |
| | | | | | | | |
| Property expenses | | | | | | | | |
| Property operation and maintenance | | 15,297 | | | 14,320 | | | 977 | | | 7 | % |
| Real estate taxes | | 12,606 | | | 13,591 | | | (985) | | | (7) | % |
| Total property expenses | | 27,903 | | | 27,911 | | | (8) | | | — | % |
| | | | | | | | |
| Total property revenues less total property expenses | | 62,764 | | | 59,715 | | | 3,049 | | | 5 | % |
| | | | | | | | |
| Same Store straight-line rent adjustments | | (1,201) | | | 558 | | | (1,759) | | | (315) | % |
| Same Store amortization of above/below market rents | | (618) | | | (584) | | | (34) | | | (6) | % |
| Same Store lease termination fees | | (306) | | | (1,028) | | | 722 | | | 70 | % |
| | | | | | | | |
Same Store NOI(1) | | $ | 60,639 | | | $ | 58,661 | | | $ | 1,978 | | | 3 | % |
| | | | | | | | |
| | | | | | | | |
| | | | | | | | |
| | | | | | | | |
| | | | | | | | |
| | | | | | | | |
| | | | | | | | |
| | | | | | | | |
| | | | | | | | |
| | | | | | | | |
| | | | | | | | |
| | | | | | | | |
| | | | | | | | |
| | | | | | | | |
| | | | | | | | |
| | | | | | | | |
| | | | | | | | |
(1) For a reconciliation of Same Store NOI, see previous section “Reconciliation of Non-GAAP Measures.”
| | | | | | | | | | | | | | | | | | | | | | | | | | |
| Whitestone REIT and Subsidiaries |
| OTHER FINANCIAL INFORMATION |
| (in thousands, except number of properties and employees) |
| | | | | | | | |
| | Three Months Ended | | Nine Months Ended |
| | September 30, | | September 30, |
| | | 2021 | | 2020 | | 2021 | | 2020 |
| Other Financial Information: | | | | | | | | |
| | | | | | | | |
Tenant improvements (1) (2) | | $ | 476 | | | $ | 1,279 | | | $ | 1,444 | | | $ | 2,264 | |
Leasing commissions (1) (2) | | $ | 610 | | | $ | 221 | | | $ | 2,345 | | | $ | 957 | |
Maintenance capital (1) | | $ | 2,017 | | | $ | 933 | | | $ | 4,096 | | | $ | 2,843 | |
Scheduled debt principal payments (1) | | $ | 441 | | | $ | 481 | | | $ | 1,331 | | | $ | 1,441 | |
Straight-line rent income (1) | | $ | 541 | | | $ | 51 | | | $ | 1,235 | | | $ | (674) | |
Market rent amortization income from acquired leases (1) | | $ | 161 | | | $ | 147 | | | $ | 603 | | | $ | 586 | |
Non-cash share-based compensation expense (1) | | $ | 1,563 | | | $ | 1,645 | | | $ | 4,275 | | | $ | 4,167 | |
Non-real estate depreciation and amortization (1) | | $ | 35 | | | $ | 45 | | | $ | 105 | | | $ | 168 | |
Amortization of loan fees (1) | | $ | 291 | | | $ | 282 | | | $ | 839 | | | $ | 851 | |
| Undepreciated value of unencumbered properties | | $ | 883,260 | | | $ | 824,628 | | | $ | 883,260 | | | $ | 824,628 | |
| Number of unencumbered properties | | 52 | | | 51 | | | 52 | | | 51 | |
| Full time employees | | 91 | | | 85 | | | 91 | | | 85 | |
(1) Includes pro-rata share attributable to real estate partnership.
(2) Does not include first generation costs needed for new acquisitions, development or redevelopment of a property to bring the property to operating standards for its intended use.
| | | | | | | | | | | | | | | | | | | | |
| Whitestone REIT and Subsidiaries |
| MARKET CAPITALIZATION AND SELECTED RATIOS |
| (in thousands, except per share amounts and percentages) |
| | | | | | |
| | As of September 30, 2021 |
| MARKET CAPITALIZATION: | | Percent of Total Equity | | Total Market Capitalization | | Percent of Total Market Capitalization |
| Equity Capitalization: | | | | | | |
| Common shares outstanding | | 98.4 | % | | 48,840 | | | |
| Operating partnership units outstanding | | 1.6 | % | | 773 | | | |
| Total | | 100.0 | % | | 49,613 | | | |
| | | | | | |
| Market price of common shares as of | | | | | | |
| September 30, 2021 | | | | $ | 9.78 | | | |
| | | | | | |
| Total equity capitalization | | | | $ | 485,215 | | | 44 | % |
| | | | | | |
| Debt Capitalization: | | | | | | |
| Outstanding debt | | | | $ | 619,472 | | | |
| Less: Cash and cash equivalents | | | | (10,858) | | | |
| Total debt capitalization | | | | 608,614 | | | 56 | % |
| | | | | | |
| Total Market Capitalization as of | | | | | | |
| September 30, 2021 | | | | $ | 1,093,829 | | | 100 | % |
| | | | | | | | | | | | | | | | | | | | | | | | | | |
| SELECTED RATIOS: | | | | | | | | |
| | | | |
| | Three Months Ended | | Nine Months Ended |
| | September 30, | | September 30, |
| INTEREST COVERAGE RATIO | | 2021 | | 2020 | | 2021 | | 2020 |
| EBITDAre/Interest Expense | | | | | | | | |
EBITDAre (1) | | $ | 17,232 | | | $ | 15,216 | | | $ | 49,573 | | | $ | 46,761 | |
| | | | | | | | |
| Interest expense | | 6,142 | | | 6,400 | | | 18,417 | | | 19,561 | |
| Pro rata share of interest expense from real estate partnership | | 160 | | | 167 | | | 484 | | | 490 | |
| Less: amortization of loan fees, including pro rata share from real estate partnership | | (280) | | | (282) | | | (839) | | | (851) | |
| Interest expense, excluding amortization of loan fees | | 6,022 | | | 6,285 | | | 18,062 | | | 19,200 | |
| | | | | | | | |
| Ratio of EBITDAre to interest expense | | 2.9 | | | 2.4 | | | 2.7 | | | 2.4 | |
(1) For a reconciliation of EBITDAre, see previous section “Reconciliation of Non-GAAP Measures.”
| | | | | | | | | | | | | | |
| Whitestone REIT and Subsidiaries |
| MARKET CAPITALIZATION AND SELECTED RATIOS |
| (continued) |
| (in thousands, except per share amounts and percentages) |
| | |
| LEVERAGE RATIO | | September 30, |
| | 2021 | | 2020 |
| Debt/Undepreciated Book Value | | | | |
| Outstanding debt | | $ | 619,009 | | | $ | 667,277 | |
| Less: Cash | | (10,858) | | | (38,990) | |
| Add: Proportional share of net debt of real estate partnership | | 8,479 | | | 8,766 | |
| Outstanding debt after cash | | $ | 616,630 | | | $ | 637,053 | |
| | | | |
| Undepreciated real estate assets | | $ | 1,165,274 | | | $ | 1,104,963 | |
| Add: Proportional share of real estate from unconsolidated partnership | | 46,124 | | | 45,787 | |
| Undepreciated real estate assets | | $ | 1,211,398 | | | $ | 1,150,750 | |
| Ratio of debt to real estate assets | | 51 | % | | 55 | % |
| | | | | | | | | | | | | | | | | | | | | | | | | | |
| | Three Months Ended | | Nine Months Ended |
| | September 30, | | September 30, |
| | 2021 | | 2020 | | 2021 | | 2020 |
| Debt/EBITDAre Ratio | | | | | | | | |
| Outstanding debt | | $ | 619,009 | | | $ | 667,277 | | | $ | 619,009 | | | $ | 667,277 | |
| Less: Cash | | (10,858) | | | (38,990) | | | (10,858) | | | (38,990) | |
| Add: Proportional share of net debt of unconsolidated real estate partnership | | 8,479 | | | 8,766 | | | 8,479 | | | 8,766 | |
| Total Net Debt | | $ | 616,630 | | | $ | 637,053 | | | $ | 616,630 | | | $ | 637,053 | |
| | | | | | | | |
| EBITDAre | | $ | 17,232 | | | $ | 15,216 | | | $ | 49,573 | | | $ | 46,761 | |
| Management fee, net of related expenses | | 83 | | | 81 | | | 246 | | | 246 | |
| Share based compensation | | 1,563 | | | 1,645 | | | 4,275 | | | 4,167 | |
| EBITDAre-Adjusted | | $ | 18,878 | | | $ | 16,942 | | | $ | 54,094 | | | $ | 51,174 | |
| | | | | | | | |
| Effect of partial period acquisitions and dispositions | | 60 | | | — | | | 1,614 | | | — | |
| | | | | | | | |
| Pro forma EBITDAre-Adjusted | | 18,938 | | | 16,942 | | | 55,708 | | | 51,174 | |
| | | | | | | | |
| Pro forma annualized EBITDAre-Adjusted | | $ | 75,752 | | | $ | 67,768 | | | $ | 74,277 | | | $ | 68,232 | |
| | | | | | | | |
| Ratio of debt to pro forma EBITDAre-Adjusted | | 8.1 | | 9.4 | | 8.3 | | 9.3 |
| | | | | | | | | | | | | | |
| Whitestone REIT and Subsidiaries |
| SUMMARY OF OUTSTANDING DEBT AND DEBT MATURITIES |
| TOTAL OUTSTANDING DEBT |
| (in thousands) |
| | | | |
| Description | | September 30, 2021 | | December 31, 2020 |
| Fixed rate notes | | | | |
$100.0 million, 1.73% plus 1.35% to 1.90% Note, due October 30, 2022 (1) | | $ | 100,000 | | | $ | 100,000 | |
$165.0 million, 2.24% plus 1.35% to 1.90% Note, due January 31, 2024 (2) | | 165,000 | | | 165,000 | |
| $80.0 million, 3.72% Note, due June 1, 2027 | | 80,000 | | | 80,000 | |
| $19.0 million 4.15% Note, due December 1, 2024 | | 18,442 | | | 18,687 | |
| $20.2 million 4.28% Note, due June 6, 2023 | | 17,914 | | | 18,222 | |
| $14.0 million 4.34% Note, due September 11, 2024 | | 13,044 | | | 13,236 | |
| $14.3 million 4.34% Note, due September 11, 2024 | | 13,834 | | | 14,014 | |
| $15.1 million 4.99% Note, due January 6, 2024 | | 13,973 | | | 14,165 | |
| $2.6 million 5.46% Note, due October 1, 2023 | | 2,302 | | | 2,339 | |
| $50.0 million, 5.09% Note, due March 22, 2029 | | 50,000 | | | 50,000 | |
| $50.0 million, 5.17% Note, due March 22, 2029 | | 50,000 | | | 50,000 | |
| $1.7 million 3.25% Note, due December 28, 2021 | | 463 | | | — | |
| Floating rate notes | | | | |
| Unsecured line of credit, LIBOR plus 1.40% to 1.90%, due January 31, 2023 | | 94,500 | | | 119,500 | |
| Total notes payable principal | | 619,472 | | | 645,163 | |
| Less deferred financing costs, net of accumulated amortization | | (823) | | | (978) | |
| Total notes payable | | $ | 618,649 | | | $ | 644,185 | |
(1) Promissory note includes an interest rate swap that fixed the LIBOR portion of Term Loan 3 at 1.73%.
(2) Promissory note includes an interest rate swap that fixed the LIBOR portion of the interest rate at an average rate of 2.24% for the duration of the term through January 31, 2024.
| | | | | | | | |
| SCHEDULE OF DEBT MATURITIES AS OF SEPTEMBER 30, 2021 |
| (in thousands) |
| | |
| Year | | Amount Due |
| 2021 (remaining) | | $ | 1,138 | |
| 2022 | | 101,683 | |
| 2023 | | 122,363 | |
| 2024 | | 228,574 | |
| 2025 | | 17,143 | |
| | |
| Thereafter | | 148,571 | |
| Total | | $ | 619,472 | |
| | | | | | | | | | | | | | | | | | | | | | | | | | | | | | | | |
| Whitestone REIT and Subsidiaries |
| SUMMARY OF OCCUPANCY AND TOP TENANTS |
| | | | | | | | | | |
| | Gross Leasable Area as of | | Occupancy % as of |
| | September 30, | | September 30, | | March 31 | | December 31, | | September 30, |
Community Centered Properties® | | 2021 | | 2021 | | 2021 | | 2020 | | 2020 |
| Whitestone | | 5,116,220 | | | 90 | % | | 89 | % | | 88 | % | | 89 | % |
| | | | | | | | | | |
| Unconsolidated real estate partnership | | 926,798 | | 59 | % | | 59 | % | | 61 | % | | 62 | % |
| | | | | | | | | | | | | | | | | | | | | | | | | | | | | | | | |
| Whitestone REIT and Subsidiaries |
| SUMMARY OF OCCUPANCY AND TOP TENANTS |
| (continued) |
| | | | | | | | | | |
| Tenant Name | | Location | | Annualized Rental Revenue
(in thousands) | | Percentage of Total Annualized Base Rental Revenues (1) | | Initial Lease Date | | Year Expiring |
| | | | | | | | | | |
Safeway Stores Incorporated (2) | | Austin, Houston and Phoenix | | $ | 2,529 | | | 2.7 | % | | 11/14/1982, 5/8/1991, 7/1/2000, 4/1/2014, 4/1/2014 and 10/19/16 | | 2022, 2024, 2025, 2025, 2026 and 2034 |
| Whole Foods Market | | Houston | | 2,247 | | | 2.4 | % | | 9/3/2014 | | 2035 |
| Frost Bank | | Houston | | 1,988 | | | 2.1 | % | | 7/1/2014 | | 2024 |
| Newmark Real Estate of Houston LLC | | Houston | | 1,050 | | | 1.1 | % | | 10/1/2015 | | 2026 |
Bashas' Inc. (3) | | Phoenix | | 1,010 | | | 1.1 | % | | 10/9/2004 and 4/1/2009 | | 2024 and 2029 |
Verizon Wireless (4) | | Houston and Phoenix | | 946 | | | 1.0 | % | | 8/16/1994, 2/1/2004, 5/10/2004, 1/27/2006 and 5/1/2014 | | 2022, 2023, 2024, 2024 and 2038 |
Walgreens & Co. (5) | | Houston and Phoenix | | 946 | | | 1.0 | % | | 11/14/1982, 11/2/1987, 8/24/1996 and 11/3/1996 | | 2022, 2027, 2049 and 2056 |
| Alamo Drafthouse Cinema | | Austin | | 690 | | | 0.7 | % | | 2/1/2012 | | 2031 |
Dollar Tree (6) | | Houston and Phoenix | | 641 | | | 0.7 | % | | 8/10/1999, 6/29/2001, 11/8/2009, 12/17/2009, and 5/21/2013 | | 2023, 2025, 2025, 2026 and 2027 |
Wells Fargo & Company (7) | | Phoenix | | 592 | | | 0.6 | % | | 10/24/1996 and 4/16/1999 | | 2022 and 2023 |
| Kroger Co. | | Dallas | | 483 | | | 0.5 | % | | 12/15/2000 | | 2022 |
| Regus Corporation | | Houston | | 460 | | | 0.5 | % | | 5/23/2014 | | 2025 |
| Paul's Ace Hardware | | Phoenix | | 427 | | | 0.5 | % | | 3/1/2008 | | 2023 |
| Original Ninfas LP | | Houston | | 411 | | | 0.4 | % | | 8/29/2018 | | 2029 |
| Whataburger University | | San Antonio | | 374 | | | 0.4 | % | | 2/1/2018 | | 2023 |
| | | | $ | 14,794 | | | 15.7 | % | | | | |
(1) Annualized Base Rental Revenues represents the monthly base rent as of September 30, 2021 for each applicable tenant multiplied by 12.
(2) As of September 30, 2021, we had six leases with the same tenant occupying space at properties located in Phoenix, Houston and Austin. The annualized rental revenue for the lease that commenced on April 1, 2014, and is scheduled to expire in 2034, was $1,047,000, which represents approximately 1.1% of our total annualized base rental revenue. The annualized rental revenue for the lease that commenced on April 1, 2014, and is scheduled to expire in 2024, was $42,000, which represents less than 0.1% of our annualized base rental revenue. The annualized rental revenue for the lease that commenced on May 8, 1991, and is scheduled to expire in 2026, was $344,000, which represents approximately 0.4% of our total annualized base rental revenue. The annualized rental revenue for the lease that commenced on July 1, 2000, and is scheduled to expire in 2025, was $353,000, which represents approximately 0.4% of our total annualized base rental
revenue. The annualized rental revenue for the lease that commenced on November 14, 1982, and is scheduled to expire in 2022, was $318,000, which represents approximately 0.3% of our total annualized base rental revenue. The annualized rental revenue for the lease that commenced on October 19, 2016, and is scheduled to expire in 2025, was $425,000, which represents approximately 0.5% of our total annualized base rental revenue.
(3) As of September 30, 2021, we had two leases with the same tenant occupying space at properties located in Phoenix. The annualized rental revenue for the lease that commenced on October 9, 2004, and is scheduled to expire in 2024, was $281,000, which represents approximately 0.3% of our total annualized base rental revenue. The annualized rental revenue for the lease that commenced on April 1, 2009, and is scheduled to expire in 2029, was $729,000, which represents approximately 0.8% of our total annualized base rental revenue.
(4) As of September 30, 2021, we had five leases with the same tenant occupying space at properties located in Phoenix and Houston. The annualized rental revenue for the lease that commenced on August 16, 1994, and is scheduled to expire in 2038, was $22,000, which represents less than 0.1% of our total annualized base rental revenue. The annualized rental revenue for the lease that commenced on January 27, 2006, and is scheduled to expire in 2023, was $136,000, which represents approximately 0.1% of our total annualized base rental revenue. The annualized rental revenue for the lease that commenced on February 1, 2004, and is scheduled to expire in 2024, was $38,000, which represents less than 0.1% of our total annualized base rental revenue. The annualized rental revenue for the lease that commenced on May 1, 2014, and is scheduled to expire in 2024, was $749,000, which represents approximately 0.8% of our total annualized rental revenue. The annualized rental revenue for the lease that commenced on May 10, 2004, and is scheduled to expire in 2022, was $6,000, which represents less than 0.1% of our total annualized base rental revenue.
(5) As of September 30, 2021, we had four leases with the same tenant occupying space at properties located in Phoenix and Houston. The annualized rental revenue for the lease that commenced on November 3, 1996, and is scheduled to expire in 2049, was $279,000, which represents approximately 0.3% of our total annualized base rental revenue. The annualized rental revenue for the lease that commenced on November 2, 1987, and is scheduled to expire in 2027, was $189,000, which represents approximately 0.2% of our total annualized base rental revenue. The annualized rental revenue for the lease that commenced on November 14, 1982, and is scheduled to expire in 2022, was $181,000, which represents approximately 0.2% of our total annualized base rental revenue. The annualized rental revenue for the lease that commenced on August 24, 1996, and is scheduled to expire in 2056, was $298,000, which represents approximately 0.3% of our total annualized rental revenue.
(6) As of September 30, 2021, we had five leases with the same tenant occupying space at properties in Houston and Phoenix. The annualized rental revenue for the lease that commenced on August 10, 1999, and is scheduled to expire in 2025, was $88,000, which represents approximately 0.1% of our total annualized base rental revenue. The annualized rental revenue for the lease that commenced on December 17, 2009, and is scheduled to expire in 2025, was $118,000, which represents approximately 0.1% of our total annualized base rental revenue. The annualized rental revenue for the lease that commenced on June 29, 2001, and is scheduled to expire in 2026, was $175,000, which represents approximately 0.2% of our total annualized base rental revenue. The annualized rental revenue for the lease that commenced on May 21, 2013, and is scheduled to expire in 2023, was $110,000, which represents approximately 0.1% of our total annualized base rental revenue. The annualized rental revenue for the lease that commenced on November 8, 2009, and is scheduled to expire in 2027, was $151,000, which represents approximately 0.2% of our total annualized base rental revenue.
(7) As of September 30, 2021, we had two leases with the same tenant occupying space at properties located in Phoenix. The annualized rental revenue for the lease that commenced on October 24, 1996, and is scheduled to expire in 2022, was $131,000, which represents approximately 0.1% of our total annualized base rental revenue. The annualized rental revenue for the lease that commenced on April 16, 1999, and is scheduled to expire in 2023, was $461,000, which represents approximately 0.5% of our total annualized base rental revenue.
| | | | | | | | | | | | | | |
| Whitestone REIT and Subsidiaries |
| TENANT TYPE SUMMARY |
| As of September 30, 2021 |
| | | | |
| | % of Leased SF | | % of ABR |
| Restaurants & Food Service | | 18% | | 24% |
| Grocery | | 14% | | 9% |
| Financial Services | | 6% | | 9% |
| Salons | | 7% | | 8% |
| Medical & Dental | | 7% | | 7% |
| Non Retail | | 4% | | 6% |
| General Retail | | 7% | | 5% |
| Home Décor And Improvement | | 7% | | 5% |
| Apparel | | 4% | | 4% |
| Education | | 4% | | 4% |
| Fitness | | 5% | | 4% |
| Local Services | | 2% | | 2% |
| Off-Price | | 4% | | 2% |
| Entertainment | | 2% | | 2% |
| Pet Supply & Services | | 3% | | 2% |
| Wireless | | 1% | | 2% |
| Pharmacies & Nutritional Supplies | | 2% | | 2% |
| Sporting Goods | | 1% | | 1% |
| Postal Services | | 1% | | 1% |
| Automotive Supply & Services | | 1% | | 1% |
| Total | | 100% | | 100% |
| | | | | | | | | | | | | | | | | | | | | | | | | | |
| Whitestone REIT and Subsidiaries |
| SUMMARY OF LEASING ACTIVITY |
|
| | Three Months Ended | | Nine Months Ended |
| | September 30, | | September 30, |
| | 2021 | | 2020 | | 2021 | | 2020 |
| RENEWALS | | | | | | | | |
| Number of Leases | | 65 | | | 46 | | | 170 | | | 145 | |
Total Square Feet (1) | | 148,574 | | | 172,174 | | | 438,357 | | | 477,341 | |
| Average Square Feet | | 2,286 | | | 3,743 | | | 2,579 | | | 3,292 | |
| Total Lease Value | | $ | 20,310,000 | | | $ | 9,679,000 | | | $ | 48,776,000 | | | $ | 35,358,000 | |
| NEW LEASES | | | | | | | | |
| Number of Leases | | 38 | | | 32 | | | 119 | | | 77 | |
Total Square Feet (1) | | 90,143 | | | 85,196 | | | 282,207 | | | 181,413 | |
| Average Square Feet | | 2,372 | | | 2,662 | | | 2,371 | | | 2,356 | |
| Total Lease Value | | $ | 12,735,000 | | | $ | 9,861,000 | | | $ | 44,943,000 | | | $ | 21,131,000 | |
| TOTAL LEASES | | | | | | | | |
| Number of Leases | | 103 | | | 78 | | | 289 | | | 222 | |
Total Square Feet (1) | | 238,717 | | | 257,370 | | | 720,564 | | | 658,754 | |
| Average Square Feet | | 2,318 | | | 3,300 | | | 2,493 | | | 2,967 | |
| Total Lease Value | | $ | 33,045,000 | | | $ | 19,540,000 | | | $ | 93,719,000 | | | $ | 56,489,000 | |
(1) Represents the square footage as the result of new, renewal, expansion and contraction leases.
| | | | | | | | | | | | | | | | | | | | | | | | | | | | | | | | | | | | | | | | | | | | | | | | | | | | | | | | | | | | | | | | | | | | | | | | | | |
| Whitestone REIT and Subsidiaries |
| SUMMARY OF LEASING ACTIVITY |
| | | | | | | | | | | | | | | | | | | | | | | | |
| Type | | Number of Leases Signed | | Lease Value Signed | | GLA Signed | | Weighted Average Lease Term (2) | | TI and Incentives (3) | | TI and Incentives Per Sq. Ft. | | Contractual Rent Per Sq. Ft. (4) | | Prior Contractual Rent Per Sq. Ft. (5) | | Annual Increase (Decrease) in Contractual Rent | | Cash Basis Increase (Decrease) Over Prior Rent | | Annual Increase (Decrease) in Straight-lined Rent | | Straight-lined Basis Increase (Decrease) Over Prior Rent |
| | | | | | | | | | | | | | | | | | | | | | | | |
Comparable: (1) | | | | | | | | | | | | | | | | | | | | | | | | |
| | | | | | | | | | | | | | | | | | | | | | | | |
| Comparable Total Leases: | | | | | | | | | | | | | | | | | | | | | | | | |
| 3rd Quarter 2021 | | 75 | | | $ | 21,174,759 | | | 159,787 | | | 4.8 | | | $ | 843,333 | | | $ | 5.28 | | | $ | 24.34 | | | $ | 23.62 | | | $ | 115,317 | | | 3.0 | % | | $ | 468,826 | | | 13.1 | % |
| 2nd Quarter 2021 | | 71 | | | 22,322,346 | | | 207,913 | | | 5.1 | | | 2,069,587 | | | 9.95 | | | 20.91 | | | 21.12 | | | (44,199) | | | (1.0) | % | | 282,582 | | | 6.8 | % |
| 1st Quarter 2021 | | 72 | | | 21,870,651 | | | 160,509 | | | 5.4 | | | 1,201,947 | | | 7.49 | | | 22.12 | | | 23.14 | | | (162,801) | | | (4.4) | % | | 273,174 | | | 7.8 | % |
| 4th Quarter 2020 | | 73 | | | 16,880,587 | | | 297,812 | | | 4.1 | | | 388,146 | | | 1.30 | | | 13.20 | | | 13.19 | | | 4,030 | | | 0.1 | % | | 254,859 | | | 6.8 | % |
| Total - 12 months | | 291 | | | $ | 82,248,343 | | | 826,021 | | | 4.7 | | | $ | 4,503,013 | | | $ | 5.45 | | | $ | 19.03 | | | $ | 19.13 | | | $ | (87,653) | | | (0.5) | % | | $ | 1,279,441 | | | 8.5 | % |
| | | | | | | | | | | | | | | | | | | | | | | | |
| Comparable New Leases: | | | | | | | | | | | | | | | | | | | | | | | | |
| 3rd Quarter 2021 | | 13 | | | $ | 2,201,043 | | | 18,848 | | | 4.2 | | | $ | 101,472 | | | $ | 5.38 | | | $ | 23.72 | | | $ | 25.49 | | | $ | (33,336) | | | (6.9) | % | | $ | 23,927 | | | 5.4 | % |
| 2nd Quarter 2021 | | 19 | | | 5,852,882 | | | 39,326 | | | 5.6 | | | 892,966 | | | 22.71 | | | 25.01 | | | 25.52 | | | (19,839) | | | (2.0) | % | | 29,940 | | | 3.1 | % |
| 1st Quarter 2021 | | 26 | | | 11,296,796 | | | 56,578 | | | 6.7 | | | 1,002,823 | | | 17.72 | | | 23.87 | | | 26.52 | | | (149,925) | | | (10.0) | % | | 75,001 | | | 5.3 | % |
| 4th Quarter 2020 | | 20 | | | 4,653,817 | | | 30,371 | | | 5.5 | | | 291,222 | | | 9.59 | | | 23.58 | | | 26.73 | | | (95,836) | | | (11.8) | % | | (42,922) | | | (5.4) | % |
| Total - 12 months | | 78 | | | $ | 24,004,538 | | | 145,123 | | | 5.8 | | | $ | 2,288,483 | | | $ | 15.77 | | | $ | 24.10 | | | $ | 26.16 | | | $ | (298,936) | | | (7.9) | % | | $ | 85,946 | | | 2.4 | % |
| | | | | | | | | | | | | | | | | | | | | | | | |
| Comparable Renewal Leases: | | | | | | | | | | | | | | | | | | | | | | | | |
| 3rd Quarter 2021 | | 62 | | | $ | 18,973,716 | | | 140,939 | | | 4.9 | | | $ | 741,861 | | | $ | 5.26 | | | $ | 24.43 | | | $ | 23.37 | | | $ | 148,653 | | | 4.5 | % | | $ | 444,899 | | | 14.1 | % |
| 1st Quarter 2021 | | 52 | | | 16,469,464 | | | 168,587 | | | 5.0 | | | 1,176,621 | | | 6.98 | | | 19.95 | | | 20.09 | | | (24,360) | | | (0.7) | % | | 252,642 | | | 7.9 | % |
| 4th Quarter 2020 | | 46 | | | 10,573,855 | | | 103,931 | | | 4.7 | | | 199,124 | | | 1.92 | | | 21.17 | | | 21.29 | | | (12,876) | | | (0.6) | % | | 198,173 | | | 9.6 | % |
| 3rd Quarter 2020 | | 53 | | | 12,226,770 | | | 267,441 | | | 3.9 | | | 96,924 | | | 0.36 | | | 12.02 | | | 11.65 | | | 99,866 | | | 3.2 | % | | 297,781 | | | 10.1 | % |
| Total - 12 months | | 213 | | | $ | 58,243,805 | | | 680,898 | | | 4.5 | | | $ | 2,214,530 | | | $ | 3.25 | | | $ | 17.95 | | | $ | 17.64 | | | $ | 211,283 | | | 1.8 | % | | $ | 1,193,495 | | | 10.5 | % |
| | | | | | | | | | | | | | | | | | | | | | | | | | | | | | | | | | | | | | | | | | | | |
| Whitestone REIT and Subsidiaries |
| SUMMARY OF LEASING ACTIVITY |
| (continued) |
| | | | | | | | | | | | | | |
| Type | | Number of Leases Signed | | Lease Value Signed | | GLA Signed | | Weighted Average Lease Term (2) | | TI and Incentives (3) | | TI and Incentives per Sq. Ft. | | Contractual Rent Per Sq. Ft. (4) |
| | | | | | | | | | | | | | |
| Total: | | | | | | | | | | | | | | |
| | | | | | | | | | | | | | |
| New & Renewal | | | | | | | | | | | | | | |
| 3rd Quarter 2021 | | 103 | | | $ | 33,044,924 | | | 238,717 | | | 5.0 | | | $ | 2,040,458 | | | $ | 8.55 | | | $ | 24.44 | |
| 2nd Quarter 2021 | | 92 | | | 29,849,313 | | | 256,622 | | | 5.7 | | | 2,870,379 | | | 11.19 | | | 21.44 | |
| 1st Quarter 2021 | | 94 | | | 30,824,156 | | | 225,225 | | | 4.0 | | | 2,034,341 | | | 9.03 | | | 13.69 | |
| 4th Quarter 2020 | | 84 | | | 19,013,353 | | | 322,875 | | | 4.0 | | | 502,216 | | | 1.56 | | | 16.85 | |
| Total - 12 months | | 373 | | | $ | 112,731,746 | | | 1,043,439 | | | 4.9 | | | $ | 7,447,394 | | | $ | 7.14 | | | $ | 19.72 | |
| | | | | | | | | | | | | | |
| New | | | | | | | | | | | | | | |
| 3rd Quarter 2021 | | 38 | | | $ | 12,734,682 | | | 90,143 | | | 5.2 | | | $ | 1,210,123 | | | $ | 13.42 | | | $ | 24.85 | |
| 2nd Quarter 2021 | | 35 | | | 12,312,470 | | | 75,071 | | | 5.9 | | | 1,652,986 | | | 22.02 | | | 24.44 | |
| 1st Quarter 2021 | | 46 | | | 19,895,385 | | | 116,993 | | | 6.7 | | | 1,832,500 | | | 15.66 | | | 21.62 | |
| 4th Quarter 2020 | | 28 | | | 6,477,724 | | | 49,664 | | | 4.9 | | | 401,475 | | | 8.08 | | | 22.27 | |
| Total - 12 months | | 147 | | | $ | 51,420,261 | | | 331,871 | | | 5.8 | | | $ | 5,097,084 | | | $ | 15.36 | | | $ | 23.23 | |
| | | | | | | | | | | | | | |
| Renewal | | | | | | | | | | | | | | |
| 3rd Quarter 2021 | | 65 | | | $ | 20,310,242 | | | 148,574 | | | 5.0 | | | $ | 830,335 | | | $ | 5.59 | | | $ | 24.19 | |
| 2nd Quarter 2021 | | 57 | | | 17,536,843 | | | 181,551 | | | 4.9 | | | 1,217,393 | | | 6.71 | | | 20.12 | |
| 1st Quarter 2021 | | 48 | | | 10,928,771 | | | 108,232 | | | 4.7 | | | 201,841 | | | 1.86 | | | 21.24 | |
| 4th Quarter 2020 | | 56 | | | 12,535,629 | | | 273,211 | | | 3.9 | | | 100,741 | | | 0.37 | | | 12.13 | |
| Total - 12 months | | 226 | | | $ | 61,311,485 | | | 711,568 | | | 4.5 | | | $ | 2,350,310 | | | $ | 3.30 | | | $ | 18.07 | |
(1) Comparable leases represent leases signed on spaces for which there was a former tenant within the last twelve months and the new or renewal square footage was within 25% of the expired square footage.
(2) Weighted average lease term is determined on the basis of square footage.
(3) Estimated amount per signed lease. Actual cost of construction may vary.
(4) Contractual rent represents contractual minimum rent under the new lease for the first month, excluding concessions.
(5) Prior contractual rent represents contractual minimum rent under the prior lease for the final month.
| | | | | | | | | | | | | | | | | | | | | | | | | | | | | | | | | | | | | | |
| Whitestone REIT and Subsidiaries |
LEASE EXPIRATIONS(1) |
| | | | | | | | | | | | |
| | | | | | | | | Annualized Base Rent(2) |
| | | | | Gross Leasable Area | | as of September 30, 2021 |
| Year | | Number of
Leases | | Square Feet | | Percent
of Gross Leasable Area | | Amount
(in thousands) | | Percent of
Total | | Per Square Foot |
| 2021 | | 260 | | | 320,883 | | | 6.3 | % | | $ | 5,106 | | | 5.5 | % | | $ | 15.91 | |
| 2022 | | 288 | | | 648,636 | | | 12.7 | % | | 12,700 | | | 13.6 | % | | 19.58 | |
| 2023 | | 218 | | | 660,372 | | | 12.9 | % | | 12,763 | | | 13.7 | % | | 19.33 | |
| 2024 | | 216 | | | 756,691 | | | 14.8 | % | | 16,093 | | | 17.2 | % | | 21.27 | |
| 2025 | | 194 | | | 760,836 | | | 14.9 | % | | 14,120 | | | 15.1 | % | | 18.56 | |
| 2026 | | 145 | | | 533,162 | | | 10.4 | % | | 10,734 | | | 11.5 | % | | 20.13 | |
| 2027 | | 56 | | | 222,024 | | | 4.3 | % | | 4,961 | | | 5.3 | % | | 22.34 | |
| 2028 | | 38 | | | 172,559 | | | 3.4 | % | | 3,952 | | | 4.2 | % | | 22.90 | |
| 2029 | | 21 | | | 160,906 | | | 3.1 | % | | 3,042 | | | 3.3 | % | | 18.91 | |
| 2030 | | 24 | | | 73,243 | | | 1.4 | % | | 2,286 | | | 2.4 | % | | 31.21 | |
| Total | | 1,460 | | | 4,309,312 | | | 84.2 | % | | $ | 85,757 | | | 91.8 | % | | $ | 19.90 | |
(1) Lease expirations table reflects rents in place as of September 30, 2021, and does not include option periods.
(2) Annualized Base Rent represents the monthly base rent as of September 30, 2021 for each tenant multiplied by 12.
| | | | | | | | | | | | | | | | | | | | | | | | | | | | | | | | | | | | | | | | | | | | |
| Whitestone REIT and Subsidiaries |
| Property Details |
| As of September 30, 2021 |
| | | | | | | | | | | | | | |
Community Name | |
Location | |
Year Built/
Renovated | | Gross Leasable
Square Feet | | Percent Occupied at 09/30/2021 | | Annualized Base Rental Revenue (in thousands) (1) | | Average Base Rental Revenue Per Sq. Ft. (2) | | Average Net Effective Annual Base Rent Per Leased Sq. Ft.(3) |
| Whitestone Properties: | | | | | | | | | | | | | | |
| Ahwatukee Plaza | | Phoenix | | 1979 | | 72,650 | | | 81 | % | | $ | 648 | | | $ | 11.01 | | | $ | 13.42 | |
| Anthem Marketplace | | Phoenix | | 2000 | | 113,293 | | | 88 | % | | 1,519 | | | 15.24 | | | 14.99 | |
| Anthem Marketplace Phase II | | Phoenix | | 2019 | | 6,853 | | | 100 | % | | 235 | | | 34.23 | | | 34.00 | |
| Bissonnet/Beltway | | Houston | | 1978 | | 29,205 | | | 93 | % | | 412 | | | 15.17 | | | 14.69 | |
| BLVD Place | | Houston | | 2014 | | 216,944 | | | 100 | % | | 9,291 | | | 42.83 | | | 43.62 | |
| The Citadel | | Phoenix | | 2013 | | 28,547 | | | 99 | % | | 508 | | | 17.97 | | | 17.97 | |
| City View Village | | San Antonio | | 2005 | | 17,870 | | | 100 | % | | 556 | | | 31.11 | | | 30.37 | |
| Davenport Village | | Austin | | 1999 | | 128,934 | | | 95 | % | | 3,130 | | | 25.55 | | | 25.91 | |
| Desert Canyon | | Phoenix | | 2000 | | 62,533 | | | 88 | % | | 772 | | | 14.03 | | | 14.92 | |
| Eldorado Plaza | | Dallas | | 2004 | | 219,287 | | | 95 | % | | 3,237 | | | 15.54 | | | 15.95 | |
| Fountain Hills | | Phoenix | | 2009 | | 111,289 | | | 88 | % | | 1,602 | | | 16.36 | | | 16.41 | |
| Fountain Square | | Phoenix | | 1986 | | 118,209 | | | 90 | % | | 1,859 | | | 17.47 | | | 17.62 | |
| Fulton Ranch Towne Center | | Phoenix | | 2005 | | 120,575 | | | 96 | % | | 2,033 | | | 17.56 | | | 17.88 | |
| Gilbert Tuscany Village | | Phoenix | | 2009 | | 49,415 | | | 89 | % | | 925 | | | 21.03 | | | 20.44 | |
| Gilbert Tuscany Village Hard Corner | | Phoenix | | 2009 | | 14,603 | | | 100 | % | | 124 | | | 8.49 | | | 8.90 | |
| Heritage | | Dallas | | 2006 | | 70,431 | | | 100 | % | | 1,657 | | | 23.53 | | | 23.08 | |
| HQ Village | | Dallas | | 2009 | | 89,134 | | | 83 | % | | 2,409 | | | 32.56 | | | 34.79 | |
| Keller Place | | Dallas | | 2001 | | 93,541 | | | 93 | % | | 970 | | | 11.15 | | | 11.36 | |
| Kempwood Plaza | | Houston | | 1974 | | 91,302 | | | 88 | % | | 1,205 | | | 15.00 | | | 15.20 | |
| La Mirada | | Phoenix | | 1997 | | 147,209 | | | 89 | % | | 3,170 | | | 24.20 | | | 23.57 | |
| Las Colinas | | Dallas | | 2000 | | 104,919 | | | 80 | % | | 2,279 | | | 27.15 | | | 26.04 | |
| Lion Square | | Houston | | 2014 | | 117,592 | | | 88 | % | | 1,618 | | | 15.64 | | | 15.60 | |
| The MarketPlace at Central | | Phoenix | | 2012 | | 111,130 | | | 98 | % | | 1,096 | | | 10.06 | | | 9.63 | |
| Market Street at DC Ranch | | Phoenix | | 2003 | | 244,888 | | | 96 | % | | 5,133 | | | 21.83 | | | 21.14 | |
| Mercado at Scottsdale Ranch | | Phoenix | | 1987 | | 118,730 | | | 86 | % | | 1,677 | | | 16.42 | | | 16.06 | |
| Paradise Plaza | | Phoenix | | 1983 | | 125,898 | | | 90 | % | | 1,578 | | | 13.93 | | | 13.04 | |
| Parkside Village North | | Austin | | 2005 | | 27,045 | | | 100 | % | | 876 | | | 32.39 | | | 38.12 | |
| Parkside Village South | | Austin | | 2012 | | 90,101 | | | 100 | % | | 2,210 | | | 24.53 | | | 26.99 | |
| Pima Norte | | Phoenix | | 2007 | | 35,110 | | | 62 | % | | 356 | | | 16.35 | | | 17.92 | |
| Pinnacle of Scottsdale | | Phoenix | | 1991 | | 113,108 | | | 98 | % | | 2,497 | | | 22.53 | | | 22.20 | |
| Pinnacle Phase II | | Phoenix | | 2017 | | 27,063 | | | 100 | % | | 838 | | | 30.96 | | | 29.49 | |
| The Promenade at Fulton Ranch | | Phoenix | | 2007 | | 98,792 | | | 80 | % | | 1,096 | | | 13.87 | | | 13.40 | |
| Providence | | Houston | | 1980 | | 90,327 | | | 92 | % | | 1,062 | | | 12.78 | | | 13.22 | |
| Quinlan Crossing | | Austin | | 2012 | | 109,892 | | | 97 | % | | 2,556 | | | 23.98 | | | 23.89 | |
| Seville | | Phoenix | | 1990 | | 90,042 | | | 88 | % | | 2,581 | | | 32.57 | | | 32.41 | |
| Shaver | | Houston | | 1978 | | 21,926 | | | 94 | % | | 337 | | | 16.35 | | | 16.35 | |
| Shops at Pecos Ranch | | Phoenix | | 2009 | | 78,767 | | | 88 | % | | 1,782 | | | 25.71 | | | 27.19 | |
| Shops at Starwood | | Dallas | | 2006 | | 55,385 | | | 100 | % | | 1,773 | | | 32.01 | | | 31.56 | |
| The Shops at Williams Trace | | Houston | | 1985 | | 132,991 | | | 84 | % | | 1,938 | | | 17.35 | | | 18.42 | |
| South Richey | | Houston | | 1980 | | 69,928 | | | 96 | % | | 704 | | | 10.49 | | | 10.55 | |
| Spoerlein Commons | | Chicago | | 1987 | | 41,455 | | | 88 | % | | 700 | | | 19.19 | | | 20.42 | |
| Starwood Phase II | | Dallas | | 2016 | | 35,351 | | | 90 | % | | 1,174 | | | 36.90 | | | 38.50 | |
| Strand | | San Antonio | | 2000 | | 73,920 | | | 100 | % | | 1,753 | | | 23.71 | | | 26.27 | |
| SugarPark Plaza | | Houston | | 1974 | | 95,032 | | | 97 | % | | 1,135 | | | 12.31 | | | 12.35 | |
| Sunridge | | Houston | | 1979 | | 49,359 | | | 90 | % | | 668 | | | 15.04 | | | 15.26 | |
| Sunset at Pinnacle Peak | | Phoenix | | 2000 | | 41,530 | | | 97 | % | | 768 | | | 19.06 | | | 19.76 | |
| Terravita Marketplace | | Phoenix | | 1997 | | 102,733 | | | 75 | % | | 1,165 | | | 15.12 | | | 15.30 | |
| Town Park | | Houston | | 1978 | | 43,526 | | | 96 | % | | 1,009 | | | 24.15 | | | 23.96 | |
| Dana Park | | Phoenix | | 2009 | | 323,026 | | | 79 | % | | 5,730 | | | 22.45 | | | 22.23 | |
| Westchase | | Houston | | 1978 | | 50,332 | | | 77 | % | | 631 | | | 16.28 | | | 16.26 | |
| Williams Trace Plaza | | Houston | | 1983 | | 129,222 | | | 90 | % | | 1,812 | | | 15.58 | | | 14.60 | |
| Windsor Park | | San Antonio | | 2012 | | 196,458 | | | 97 | % | | 1,960 | | | 10.29 | | | 10.10 | |
| Woodlake Plaza | | Houston | | 1974 | | 106,169 | | | 67 | % | | 1,194 | | | 16.79 | | | 17.32 | |
| Total/Weighted Average - Whitestone Properties | | | | | | 4,953,571 | | | 90 | % | | 89,948 | | | 20.18 | | | 20.35 | |
| | | | | | | | | | | | | | |
| | | | | | | | | | | | | | |
| | | | | | | | | | | | | | |
| | | | | | | | | | | | | | |
| | | | | | | | | | | | | | |
| Development Properties: | | | | | | | | | | | | | | |
| Lakeside Market | | Dallas | | 2000 | | 162,649 | | | 80 | % | | 3,143 | | | $ | 24.15 | | | 24.89 | |
| Total/Weighted Average - Development Properties | | | | | | | | | | | | | | |
| | | | | | | | | | | | | | |
| Land Held for Development: | | | | | | | | | | | | | | |
| BLVD Phase II-B | | Houston | | N/A | | — | | | — | | | — | | | — | | | — | |
| Dana Park Development | | Phoenix | | N/A | | — | | | — | | | — | | | — | | | — | |
| Eldorado Plaza Development | | Dallas | | N/A | | — | | | — | | | — | | | — | | | — | |
| Fountain Hills | | Phoenix | | N/A | | — | | | — | | | — | | | — | | | — | |
| Market Street at DC Ranch | | Phoenix | | N/A | | — | | | — | | | — | | | — | | | — | |
Total/Weighted Average - Land Held For Development (5) | | | | | | — | | | — | | | — | | | — | | | — | |
| | | | | | | | | | | | | | |
| Grand Total/Weighted Average - Whitestone Properties | | | | | | 5,116,220 | | | 90 | % | | $ | 93,091 | | | $ | 20.22 | | | $ | 20.41 | |
| | | | | | | | | | | | | | |
| | | | | | | | | | | | | | |
| Properties owned in Unconsolidated Real Estate Partnership (81.4% ownership): | | | | | | | | | | | | |
| 9101 LBJ Freeway | | Dallas | | 1985 | | 125,874 | | | 48 | % | | $ | 1,112 | | | $ | 18.40 | | | $ | 18.37 | |
| Corporate Park Northwest | | Houston | | 1981 | | 174,359 | | | 74 | % | | 1,825 | | | 14.14 | | | 13.92 | |
| Corporate Park Woodland II | | Houston | | 2000 | | 14,344 | | | 100 | % | | 248 | | | 17.29 | | | 17.34 | |
| Holly Hall Industrial Park | | Houston | | 1980 | | 90,000 | | | 57 | % | | 373 | | | 7.27 | | | 7.27 | |
| Holly Knight | | Houston | | 1984 | | 20,015 | | | 100 | % | | 431 | | | 21.53 | | | 21.53 | |
| Interstate 10 Warehouse | | Houston | | 1980 | | 151,000 | | | 12 | % | | 120 | | | 6.62 | | | 6.51 | |
| Uptown Tower | | Dallas | | 1982 | | 253,981 | | | 64 | % | | 4,176 | | | 25.69 | | | 25.25 | |
| Westgate Service Center | | Houston | | 1984 | | 97,225 | | | 90 | % | | 731 | | | 8.35 | | | 8.16 | |
| Total/Weighted Average - Unconsolidated Properties | | | | | | 926,798 | | | 59 | % | | $ | 9,016 | | | $ | 16.49 | | | $ | 16.27 | |
(1) Calculated as the tenant’s actual September 30, 2021 base rent (defined as cash base rents including abatements) multiplied by 12. Excludes vacant space as of September 30, 2021. Because annualized base rental revenue is not derived from historical results that were accounted for in accordance with generally accepted accounting principles, historical results differ from the annualized amounts. Total abatements for leases in effect as of September 30, 2021 equaled approximately $297,326 for the month ended September 30, 2021.
(2) Calculated as annualized base rent divided by leased square feet as of September 30, 2021.
(3) Represents (i) the contractual base rent for leases in place as of September 30, 2021, adjusted to a straight-line basis to reflect changes in rental rates throughout the lease term and amortize free rent periods and abatements, but without regard to tenant improvement allowances and leasing commissions, divided by (ii) square footage under commenced leases of September 30, 2021.
(4) Includes (i) new acquisitions, through the earlier of attainment of 90% occupancy or 18 months of ownership, and (ii) properties that are undergoing significant development, redevelopment or re-tenanting.
(5) As of September 30, 2021, these parcels of land were held for development and, therefore, had no gross leasable area.