James C. Mastandrea Chairman & CEOWHITESTONE REITTown Hall Meeting
Safe Harbor Statement
Statements included herein that state the Company’s or management’s
intentions, hopes, beliefs, expectations or predictions of the future
are “forward-looking” statements within the meaning of the Private
Securities Litigation Reform Act of 1995, which by their nature,
involve known and unknown risks and uncertainties.
The Company’s actual results, performance or achievements could
differ materially from those expressed or implied by these
statements. Reference is made to t he Company’s regulatory filings
with the Securities and Exchange Commission for information or
factors that may impact the Company’s performance.
WHITESTONE REIT
OUR MISSION IS TO SERVE OUR …
1) Shareholders by working diligently
and efficiently to maximize the value
of the enterprise and the real estate
properties we own.
2) Fellow Employees by providing
development and training while
encouraging the pursuit of
excellence.
WHITESTONE REIT
OUR MISSION IS TO SERVE OUR …
3) Tenants by providing quality rental
space and a professional community
atmosphere.
4) Community by working together in
an ethical and honest manner.
Today’s Agenda
• Whitestone REIT:
– Progress to Date
– Financial Report
• The REIT Industry
• Global Financial and Credit Crisis
• Whitestone’s Plan
Progress To Date
WHITESTONE
REIT
• Restructured Management
• Repositioned Properties
• Stabilized Balance Sheet
• Reduced Dividends
• Aligned Management Interest
w/Shareholders
Progress to Date
WHITESTONE REIT
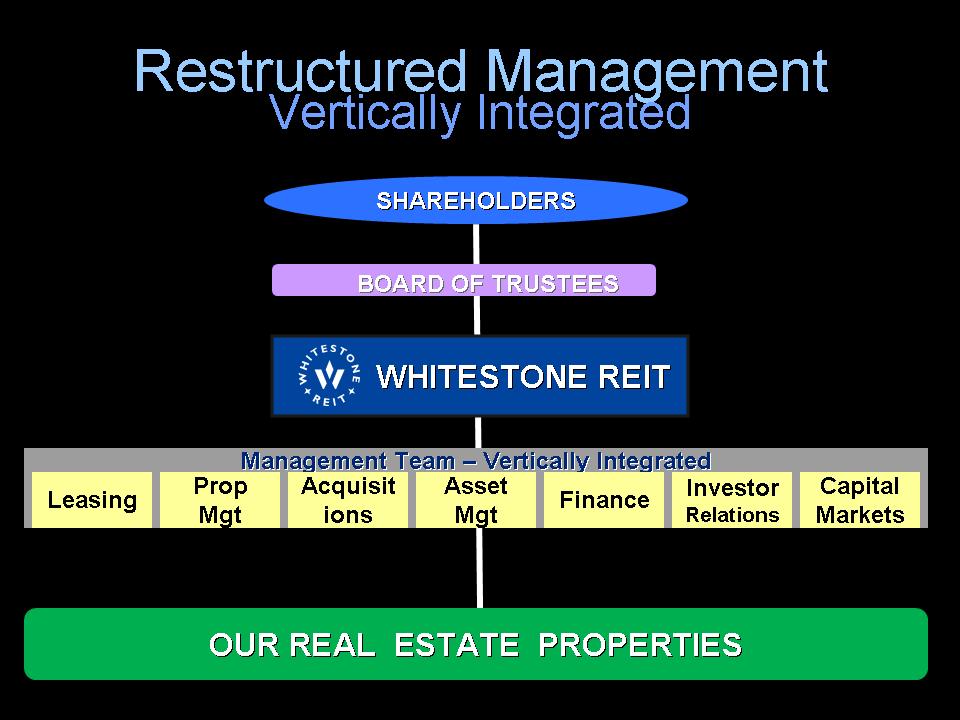
OUR REAL ESTATE PROPERTIESOUR REAL ESTATE PROPERTIESWHITESTONEWHITESTONEREITREITLeasing
Management Team Management Team ––Vertically Integrated
Prop Mgt
Acquisitions
Capital
Markets
Asset
Mgt
Finance
Investor Relations
Restructured ManagementVertically Integrated
SHAREHOLDERS SHAREHOLDERS BOARD OF TRUSTEES BOARD OF TRUSTEES

Westchase Renovation
Repositioned Properties:
WHITESTONE
REIT
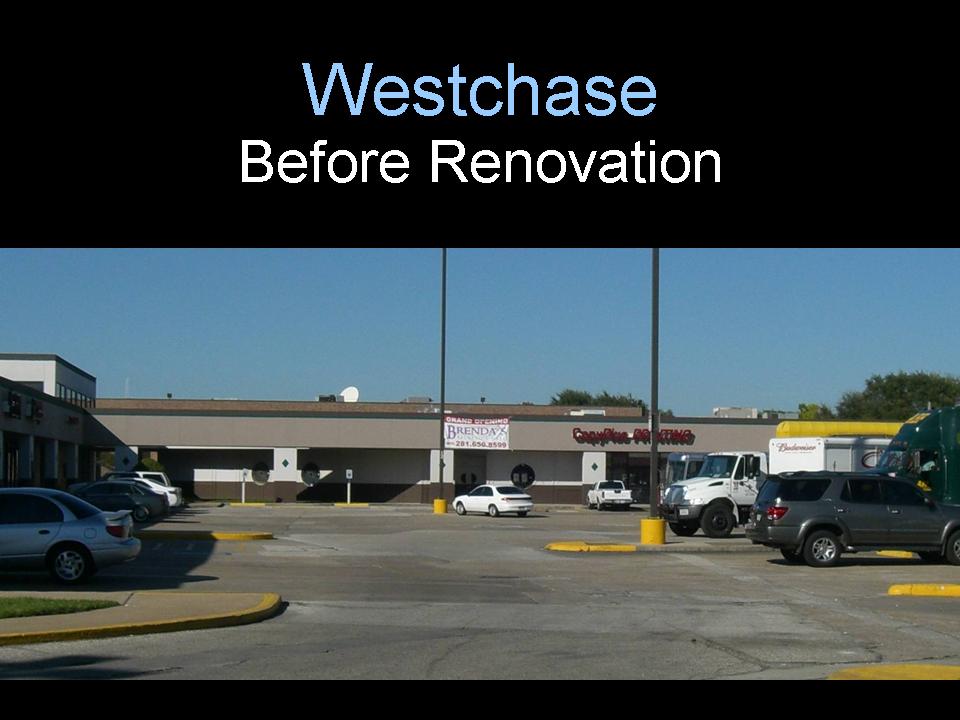
Before Renovation
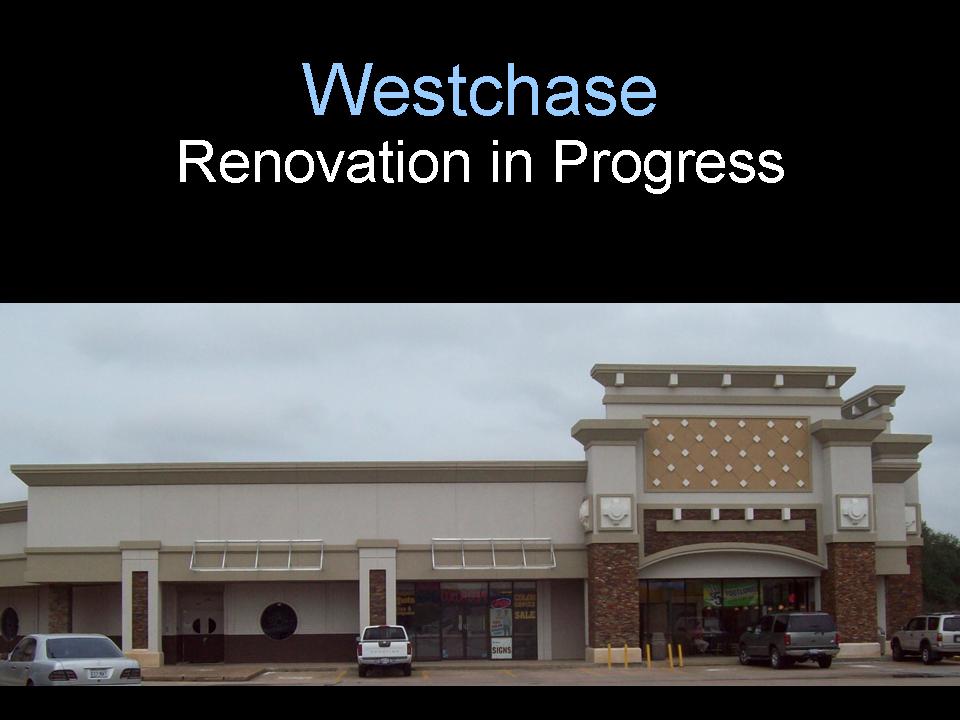
Renovation in Progress
Westchase
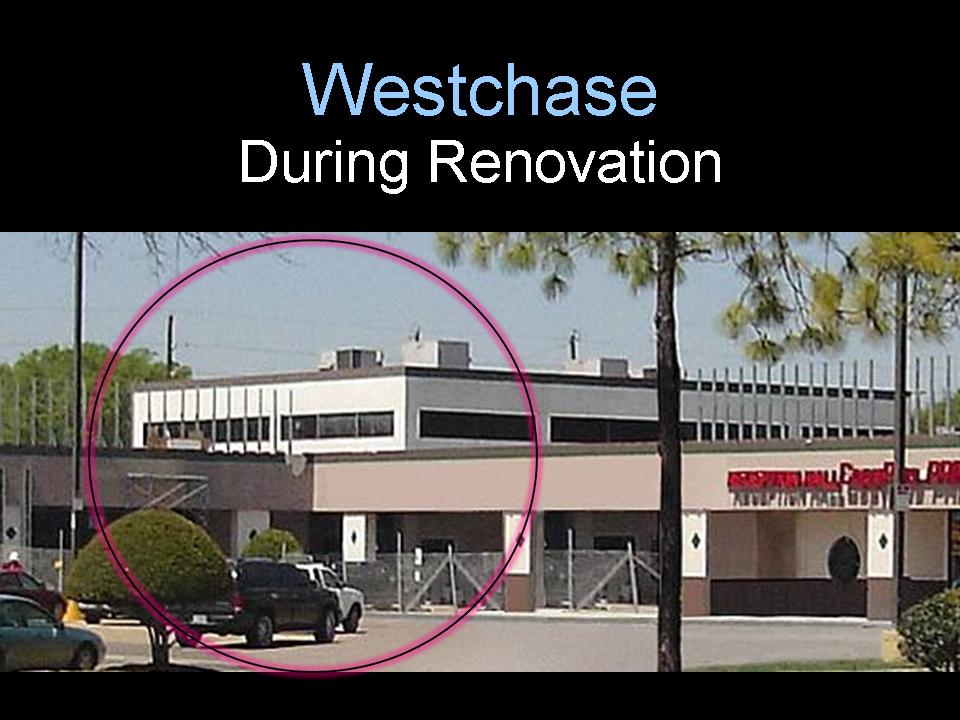
During Renovation
Westchase
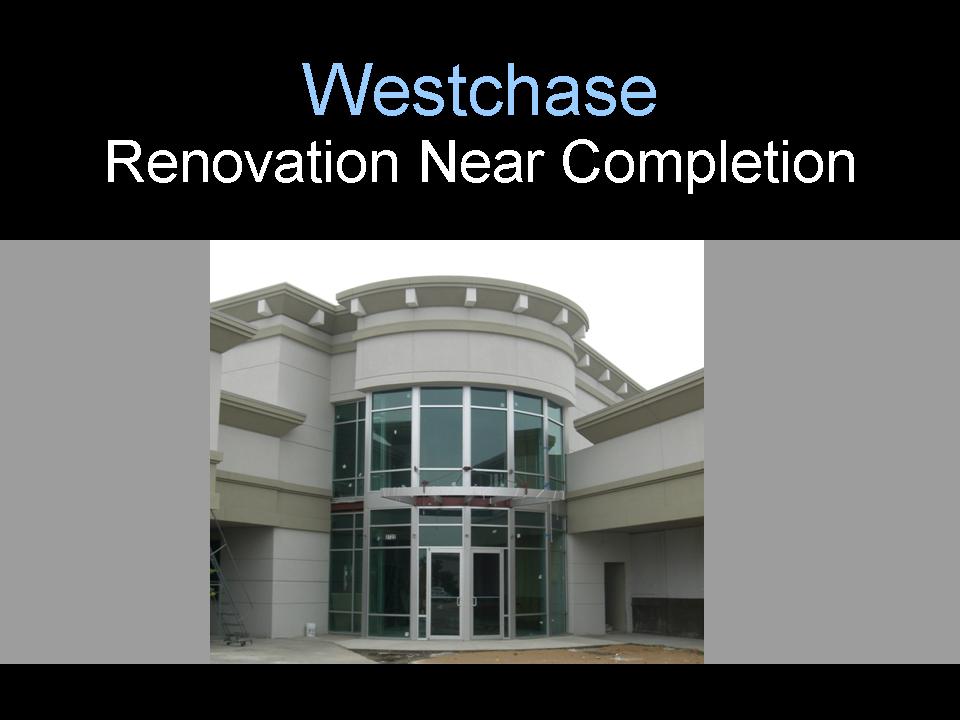
Renovation Near Completion
Westchase
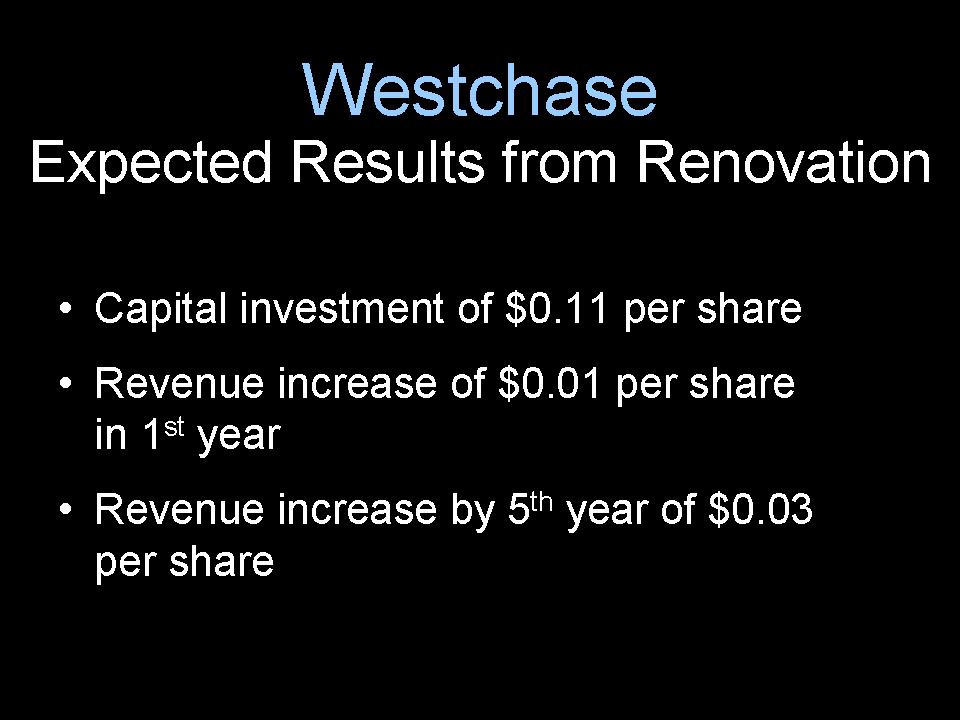
Westchase
Expected Results from Renovation
• Capital investment of $0.11 per share
• Revenue increase of $0.01 per share
in 1st year
• Revenue increase by 5th year of $0.03
per share
Stabilized Balance Sheet
WHITESTONE
REIT
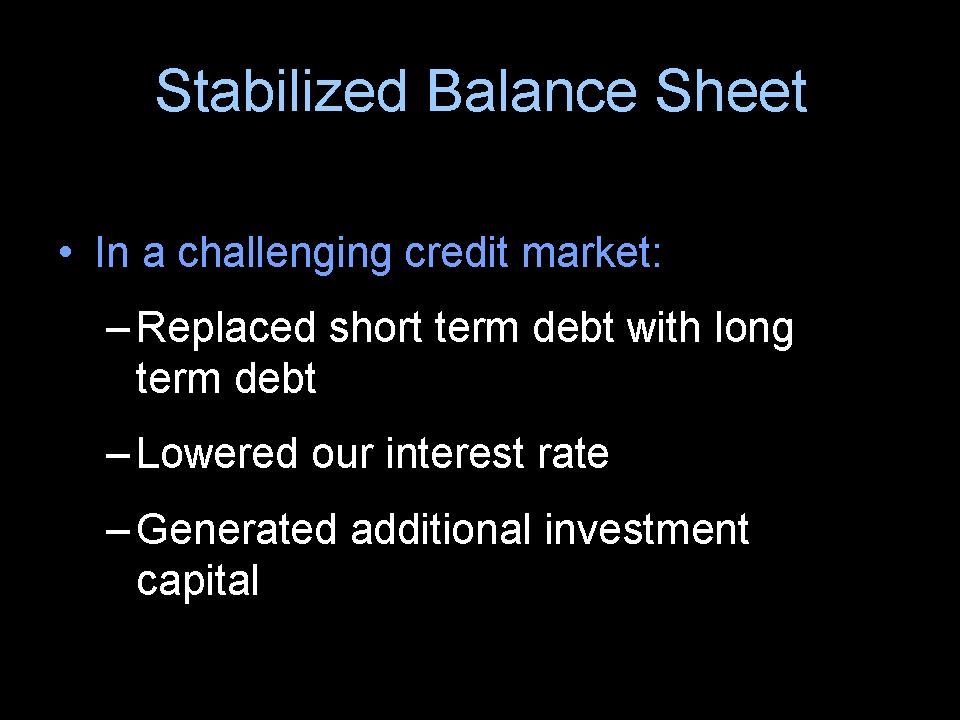
Stabilized Balance Sheet
• In a challenging credit market:
– Replaced short term debt with long
term debt
– Lowered our interest rate
– Generated additional investment
capital
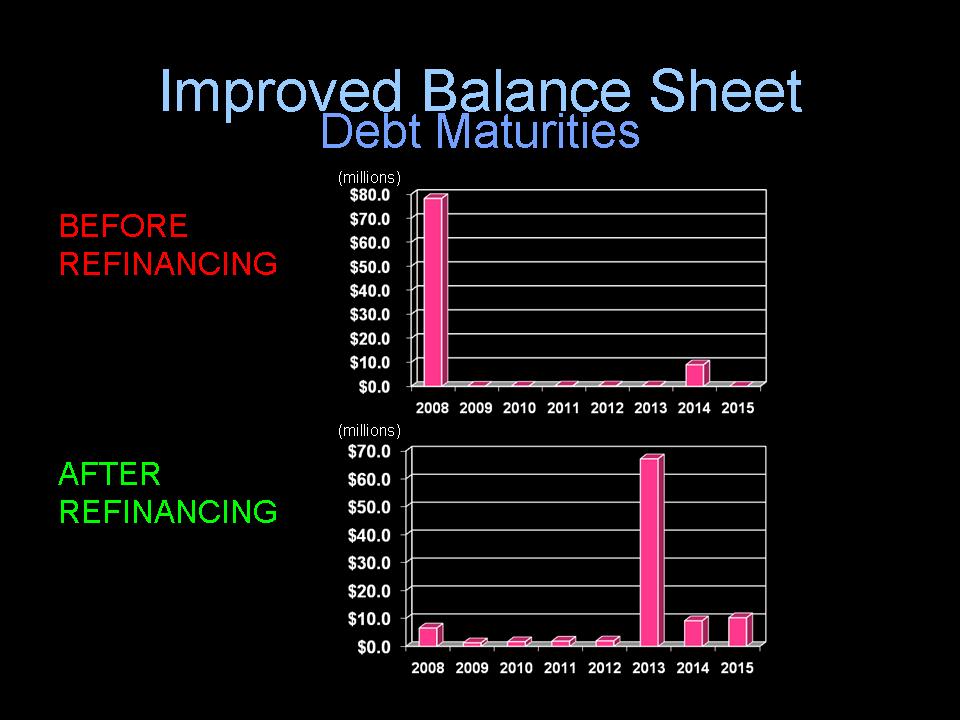
Improved Balance SheetDebt Maturities
BEFORE
REFINANCING
AFTER
REFINANCING
(millions)
(millions)
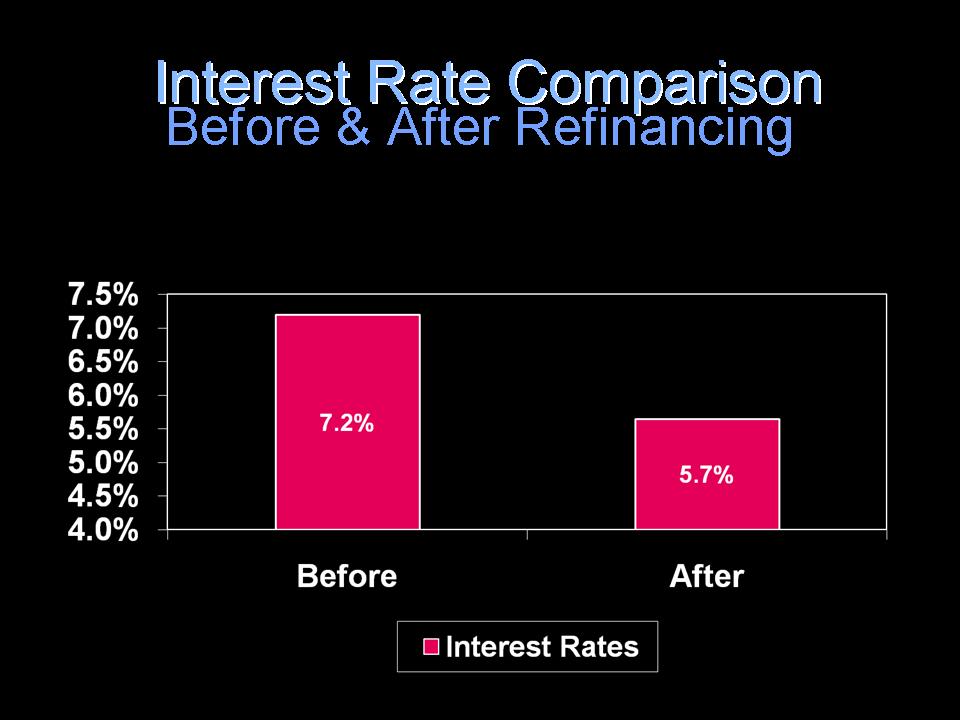
Interest Rate Comparison Interest Rate Comparison Before & After Refinancing
Reduced Dividends
To Level Supported by FFO
WHITESTONE
REIT
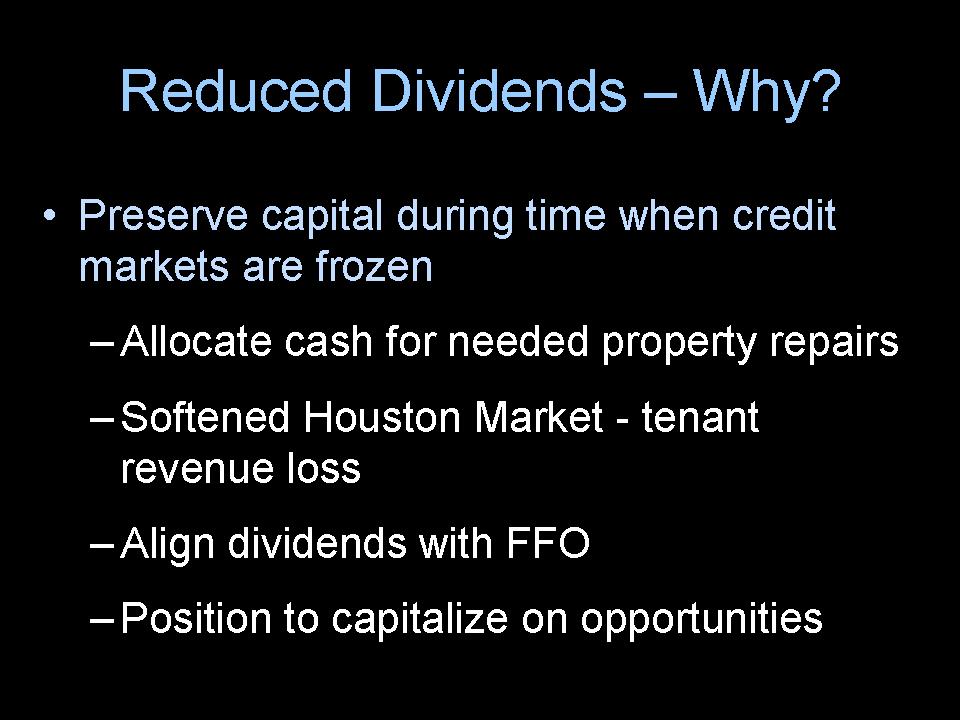
Reduced Dividends – Why?
• Preserve capital during time when credit
markets are frozen
– Allocate cash for needed property repairs
– Softened Houston Market -tenant
revenue loss
– Align dividends with FFO
– Position to capitalize on opportunities
Aligned Management
Compensation
With Shareholders Interest
WHITESTONE
REIT
Suspended Raise/Bonus
• Suspended Raises
• Eliminated Bonuses
• Implemented Stock Ownership Program
tied to Performance of Company

• Occupancy
• Revenue
• Net Income
• Funds From
Operations
Financial Report
WHITESTONE
REIT
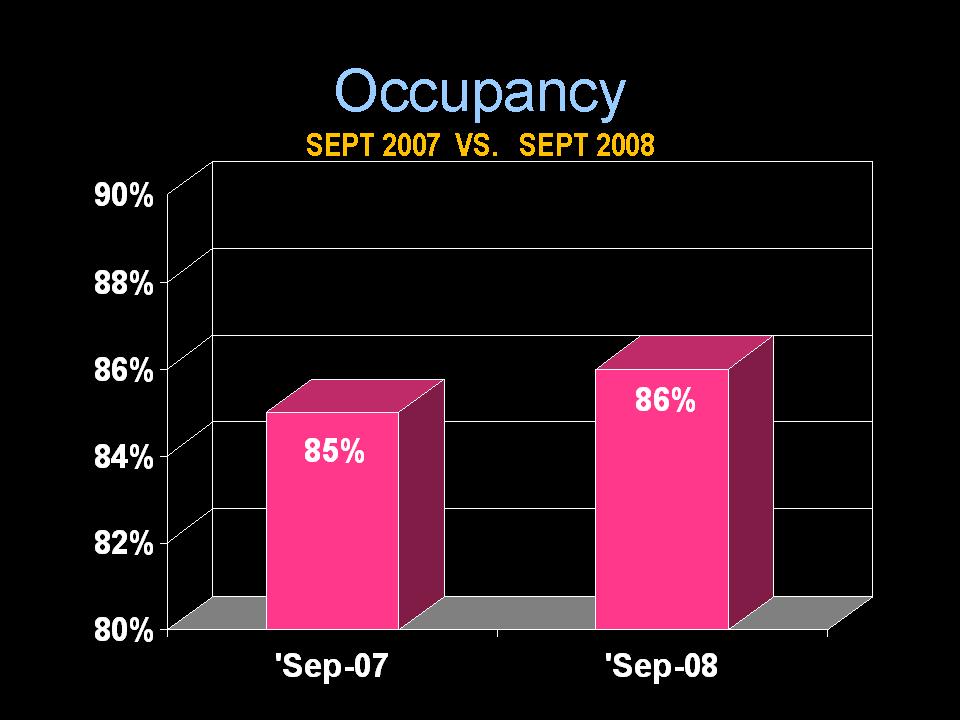
Occupancy
• Occupancy increased:
to 86% at September 30, 2008
from 85% at September 30, 2007
• 53 new & renewal leases totaling194,000 sq ft & $5.6 million in total value
• Tenant move-outs of approx. 50,000 sq ft
Occupancy
85%
86%
80%
82%
84%
86%
88%
90%
'Sep-07 'Sep-08
SEPT 2007 VS. SEPT 2008
Rent Per Square Foot
• Rent per square foot increased
to $12.06 in the 3rd quarter from
$11.44 last year, or 5%.
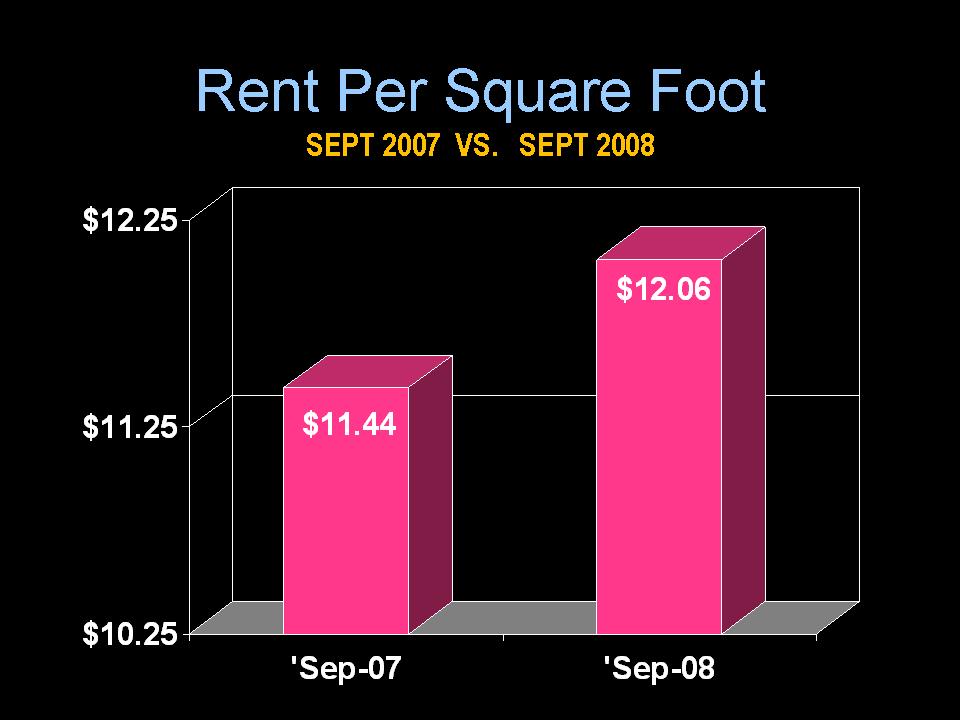
Rent Per Square Foot
$11.44
$12.06
$10.25
$11.25
$12.25
'Sep-07 'Sep-08
SEPT 2007 VS. SEPT 2008
Revenues
• Revenues for the nine months ended
September 2008 were $23.1 million versus
$21.7 million in 2007, an increase of $1.4
million or 6%.
• Revenues for the 3rd quarter 2008 were
$7.6 million vs $7.4 million in 2007, an
increase of $0.2 million or 3%.
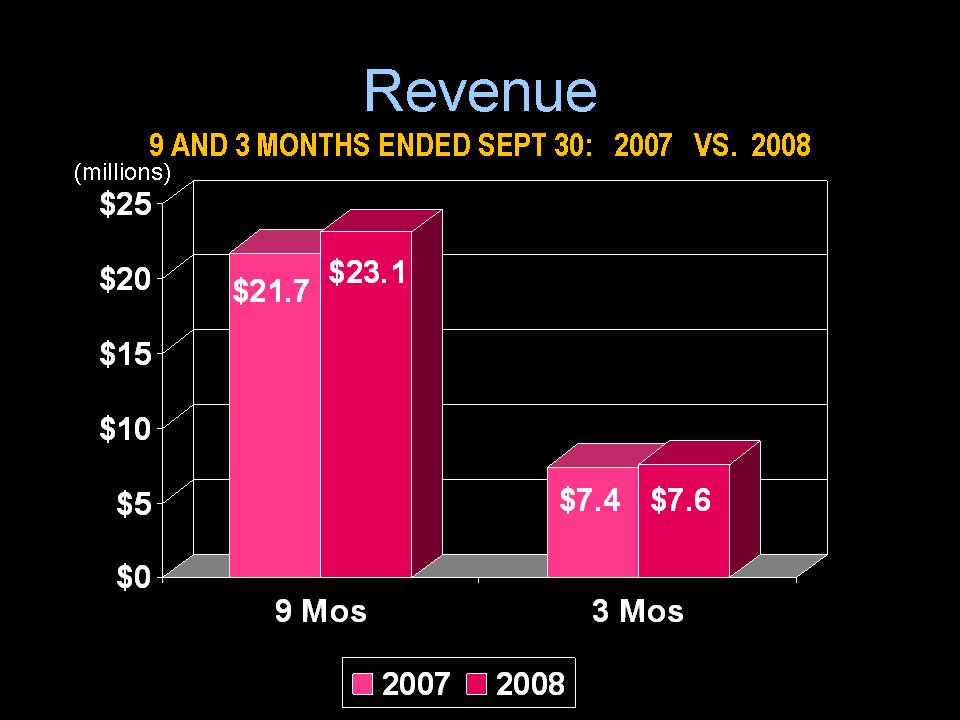
$21.7 $23.1
$7.4 $7.6
$0
$5
$10
$15
$20
$25
9 Mos 3 Mos
2007 2008
9 AND 3 MONTHS ENDED SEPT 30: 2007 VS. 2008
(millions)
Revenue
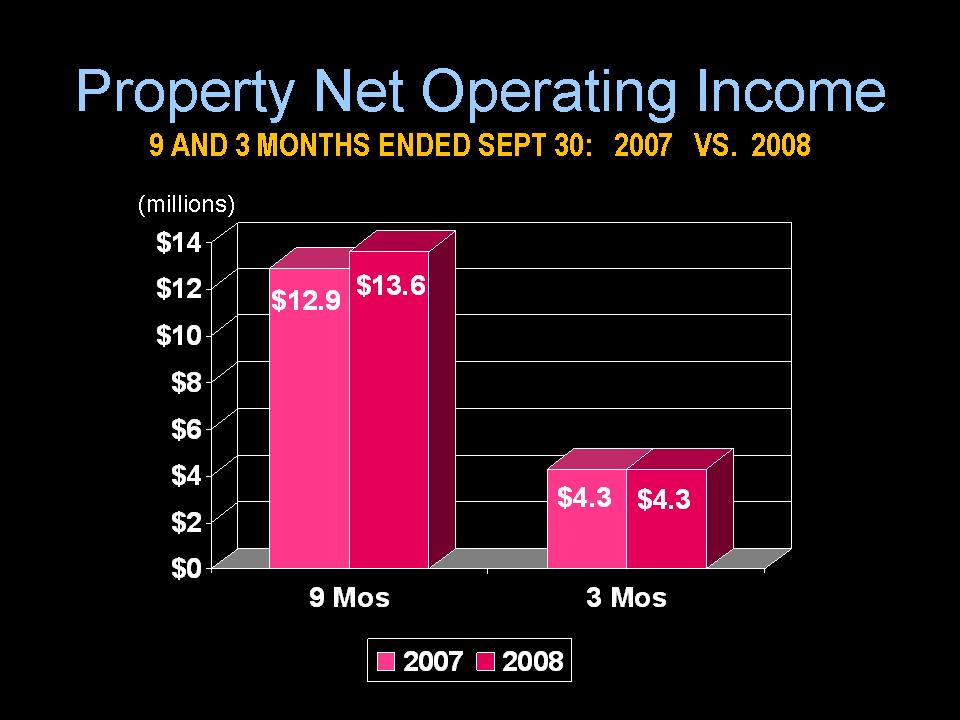
Property Net Operating Income
• Property NOI for the nine months ended
September 2008 was $13.6 million versus
$12.9 million in 2007, an increase of $0.7
million or 5%
• Property NOI for the 3rd quarter 2008 was
$4.3 million vs $4.3 million in 2007
Property Net Operating Income
9 AND 3 MONTHS ENDED SEPT 30: 2007 VS. 2008
(millions)
$12.9 $13.6
$4.3 $4.3
$0
$2
$4
$6
$8
$10
$12
$14
9 Mos 3 Mos
2007 2008

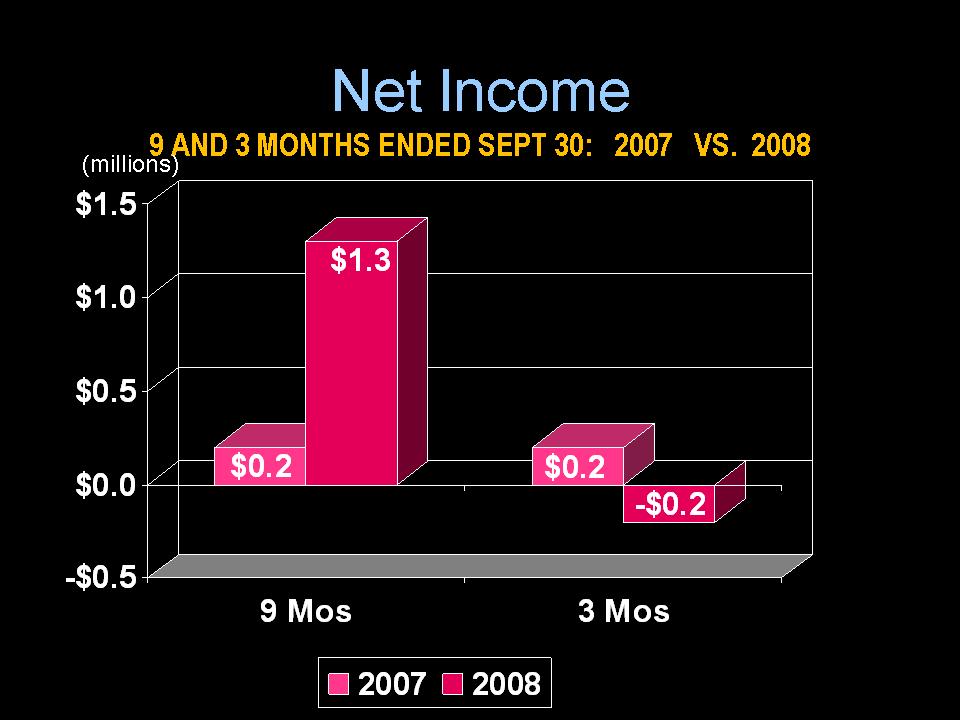
Net Income
• Net Income for the nine months ended Sept 2008:
was $1.3 million
versus $0.2 million in 2007,
an increase of $1.1 million
– Gain from litigation settlement of $2.3 million
– Offset by:
• Loan fees from extension of $0.7 million
• Interest Cost of $0.4 million
Net Income (cont.)
• Net loss for the quarter was $0.2 million versus
net income of $0.2 million in 2007, a decrease of
$0.4 million
– Eliminated litigation cost of $0.2 million
– Offset by
• Loan fees from extension of $0.3 million
• Interest cost of $0.2 million
Net Income
9 AND 3 MONTHS ENDED SEPT 30: 2007 VS. 2008(millions)
$0.2
$1.3
$0.2
-$0.2
-$0.5
$0.0
$0.5
$1.0
$1.5
9 Mos 3 Mos
2007 2008
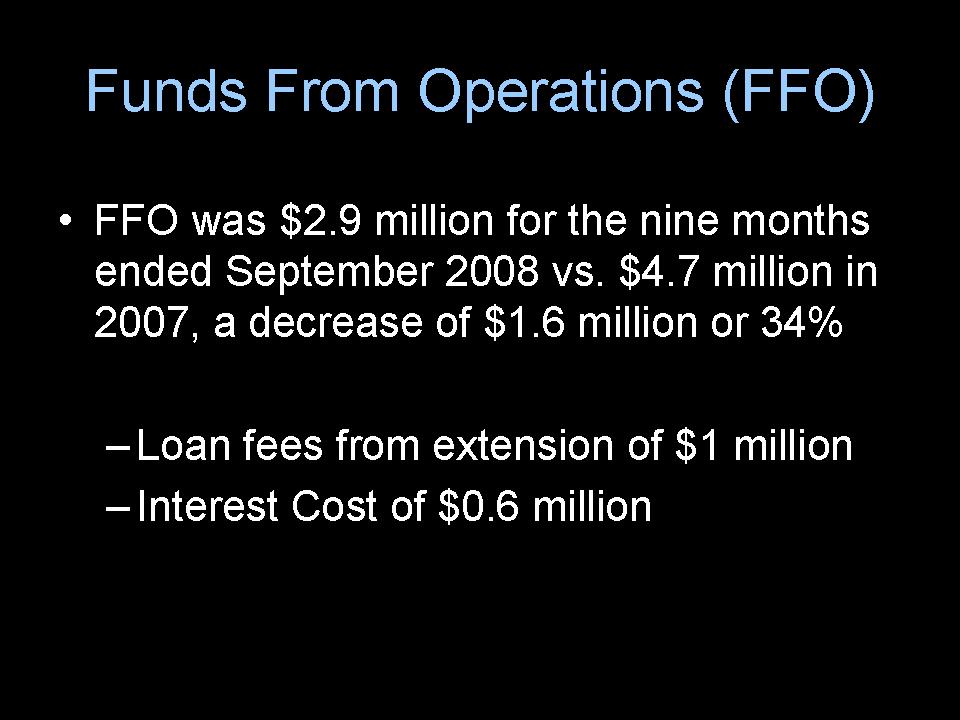
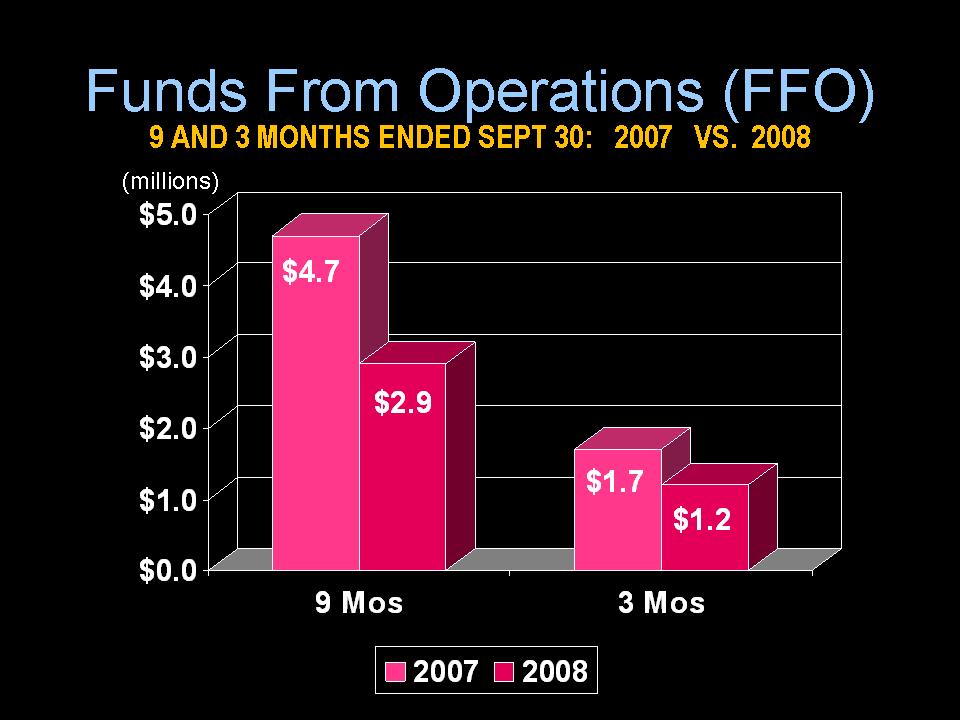
Funds From Operations (FFO)
• FFO was $2.9 million for the nine months
ended September 2008 vs. $4.7 million in
2007, a decrease of $1.6 million or 34%
– Loan fees from extension of $1 million
– Interest Cost of $0.6 million
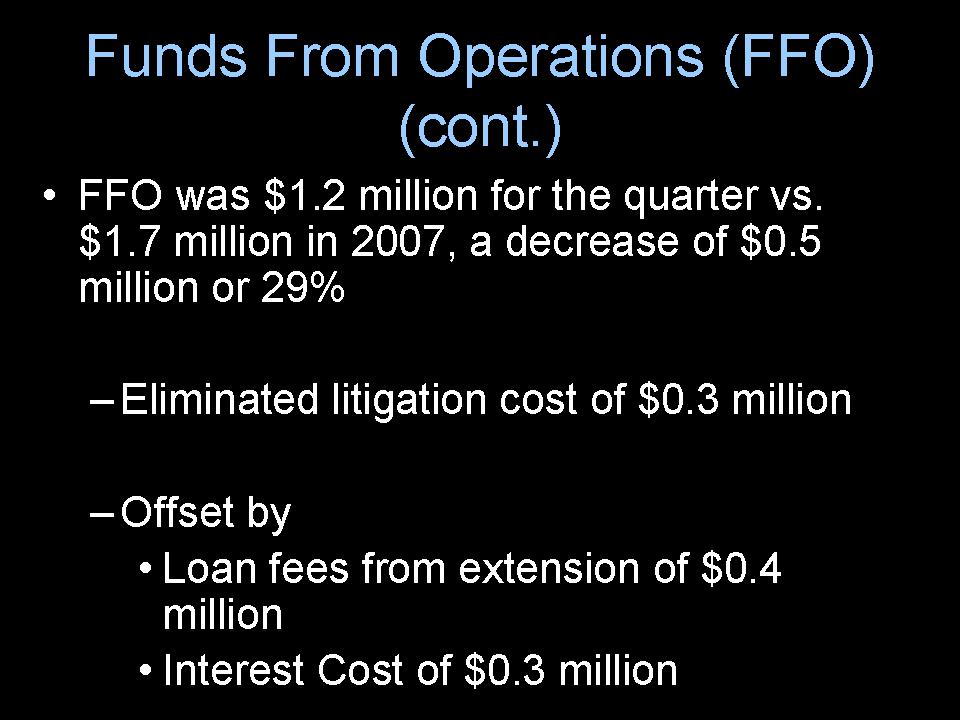
Funds From Operations (FFO)
(cont.)
• FFO was $1.2 million for the quarter vs.
$1.7 million in 2007, a decrease of $0.5
million or 29%
– Eliminated litigation cost of $0.3 million
– Offset by
• Loan fees from extension of $0.4
million
• Interest Cost of $0.3 million
Funds From Operations (FFO)
(millions)
9 AND 3 MONTHS ENDED SEPT 30: 2007 VS. 2008
$4.7
$2.9
$1.7
$1.2
$0.0
$1.0
$2.0
$3.0
$4.0
$5.0
9 Mos 3 Mos
2007 2008
• Dividends were lower than previous year
due to fewer shares and OP units
outstanding
Dividends
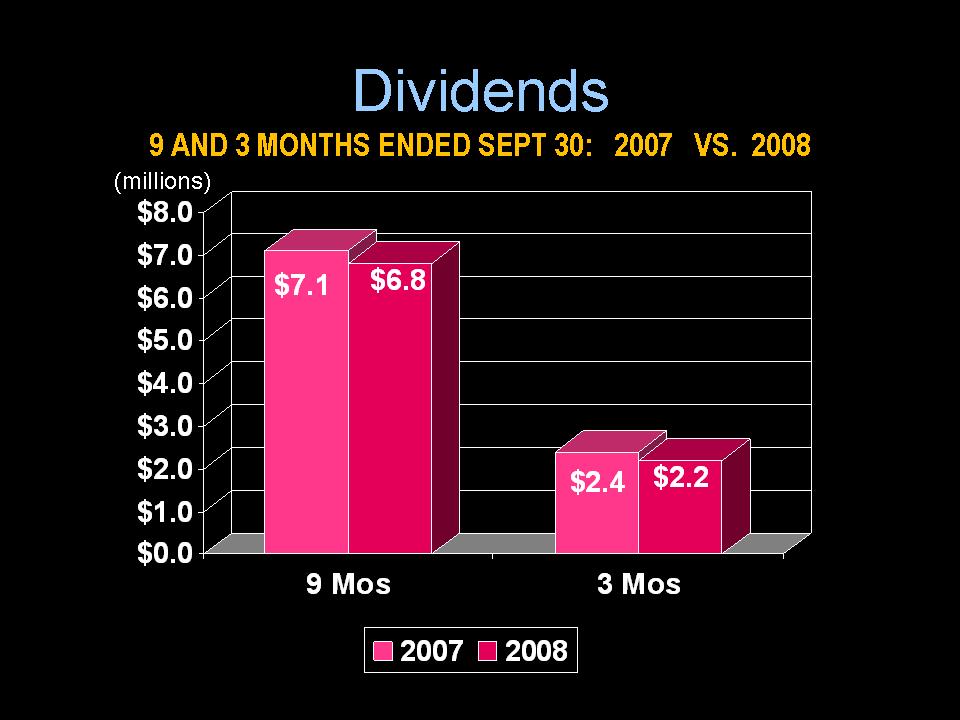
Dividends
9 AND 3 MONTHS ENDED SEPT 30: 2007 VS. 2008
$7.1 $6.8
$2.4 $2.2
$0.0
$1.0
$2.0
$3.0
$4.0
$5.0
$6.0
$7.0
$8.0
9 Mos 3 Mos
2007 2008
(millions)
WHITESTONE
REIT
Balance SheetBalance Sheet
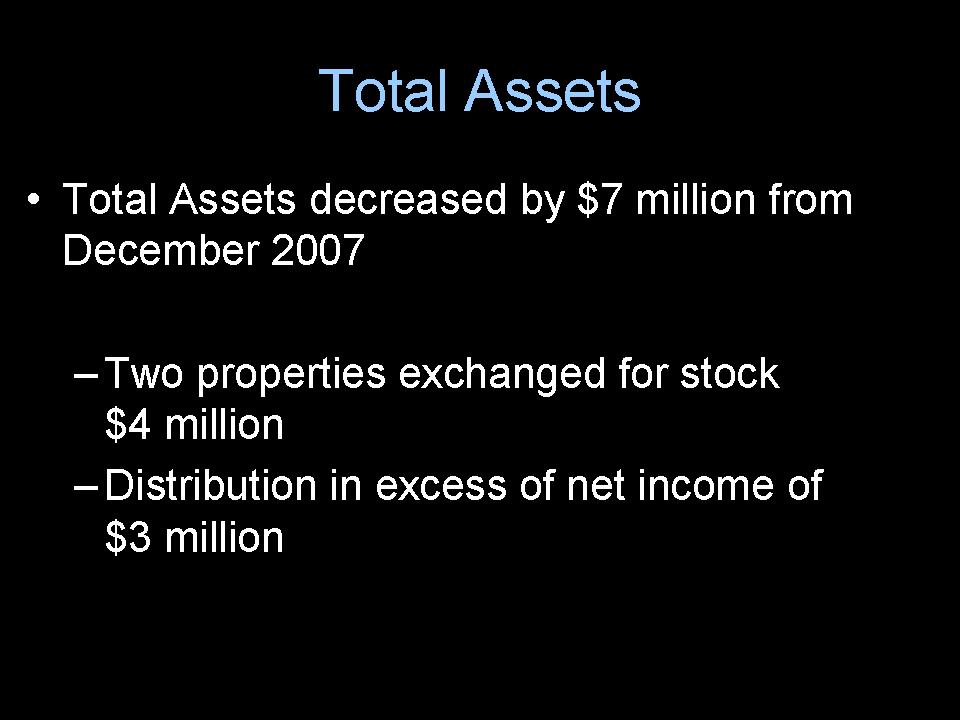
Total Assets
• Total Assets decreased by $7 million from
December 2007
– Two properties exchanged for stock
$4 million
– Distribution in excess of net income of
$3 million
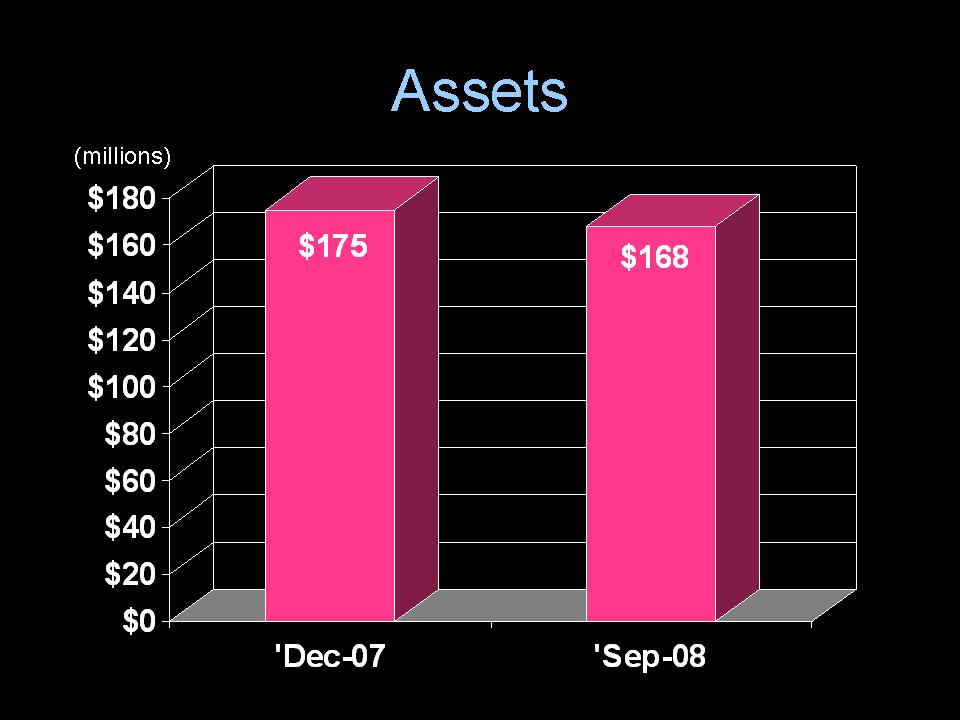
Assets
$175 $168
$0
$20
$40
$60
$80
$100
$120
$140
$160
$180
'Dec-07 'Sep-08
(millions)
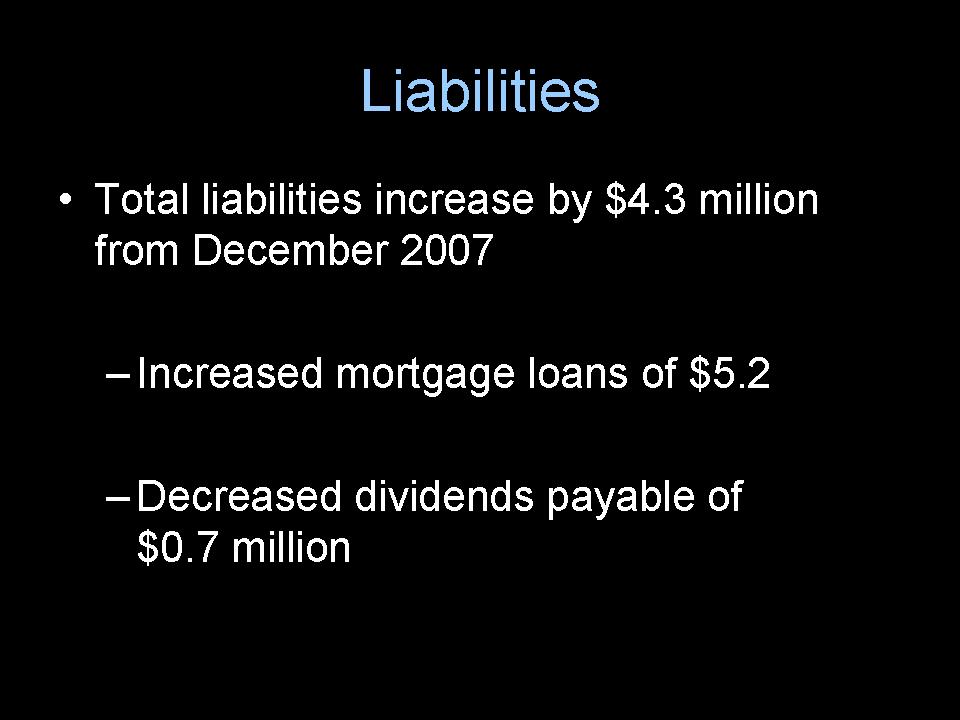
Liabilities
• Total liabilities increase by $4.3 million
from December 2007
– Increased mortgage loans of $5.2
– Decreased dividends payable of
$0.7 million
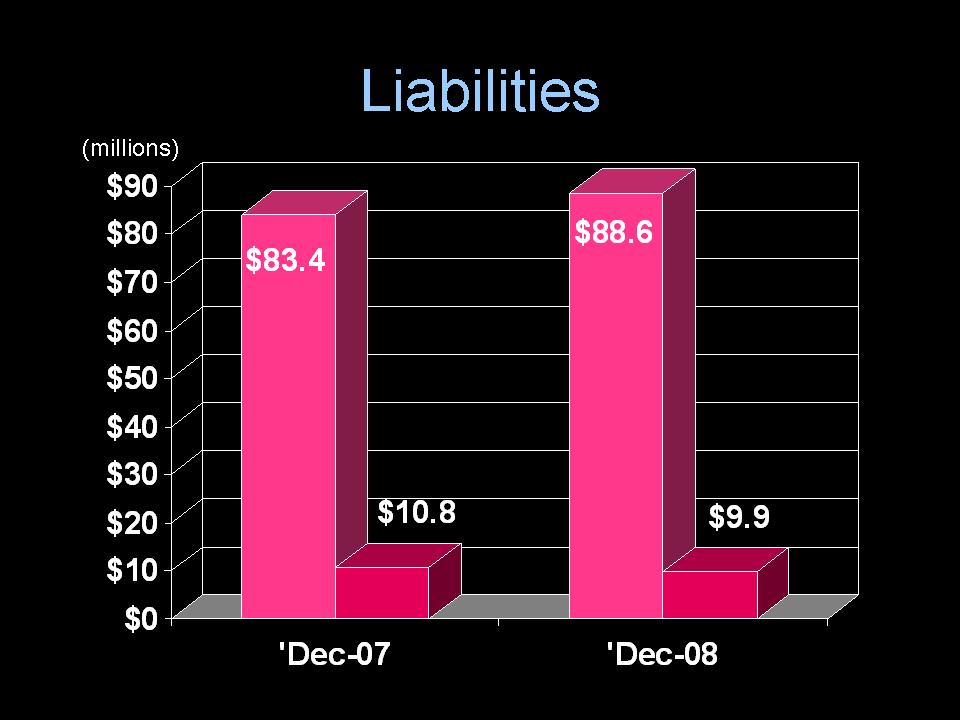
Liabilities
$83.4
$10.8
$88.6
$9.9
$0
$10
$20
$30
$40
$50
$60
$70
$80
$90
'Dec-07 'Dec-08
Equity
• Shareholders equity decreased by
$5.7 million
– Treasury shares exchanged for
properties of $2.5 million
– Dividends in excess of net income
of $3.2 million
Equity (cont.)
• Minority interest decreased by $6.2 million
– OP units exchanged for properties of
$4.7 million
– Distributions in excess of net income of
$1.5 million
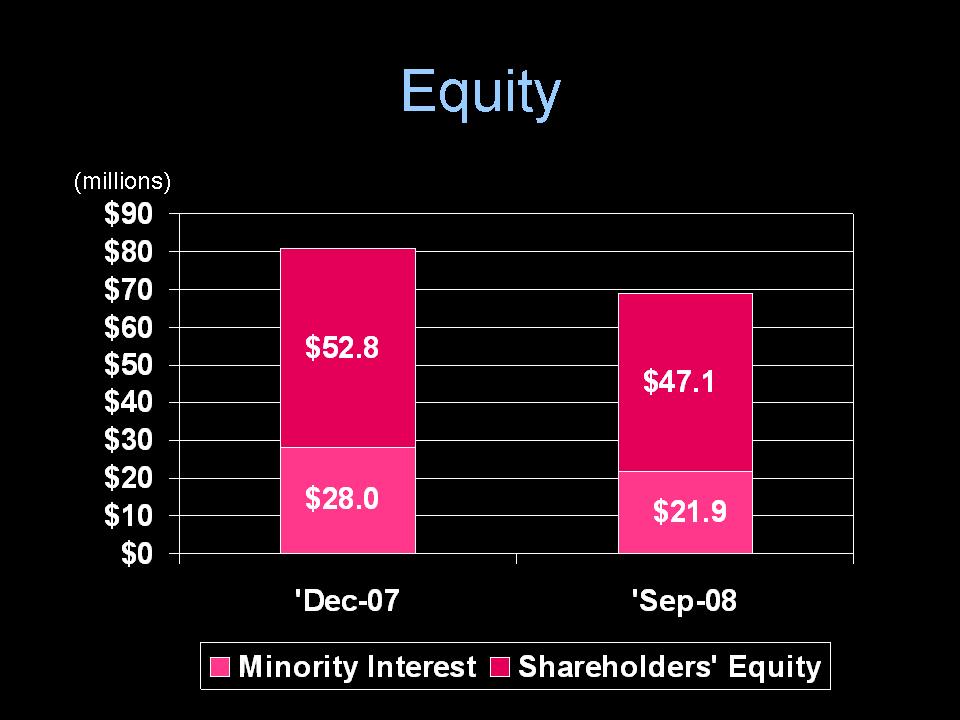
Equity
$52.8
$47.1
$21.9 $28.0
$0
$10
$20
$30
$40
$50
$60
$70
$80
$90
'Dec-07 'Sep-08
Minority Interest Shareholders' Equity
(millions)

ike WHITESTONE
REIT
Challenges
99 Cent Only & Circuit City
• 99 Cent Only Stores pulling
out of Texas
– Two Whitestone
properties (Houston)
• Circuit City filed Chapter 11
– One Whitestone property
99 Cent Only + Circuit City
• $0.02 lost revenue per share
• $0.02 lost revenue per share
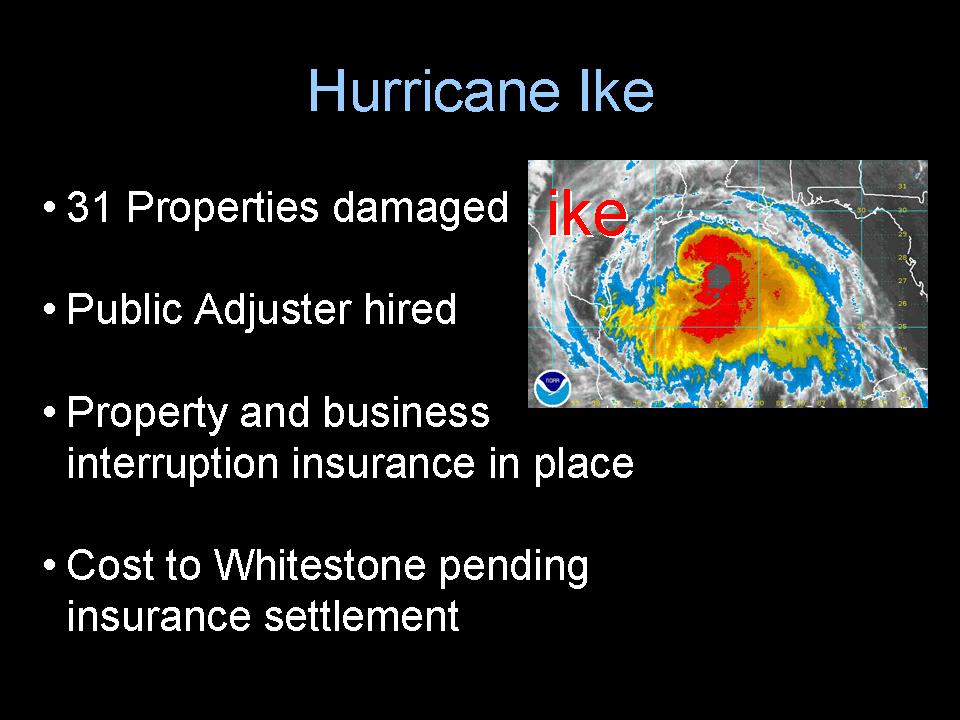
• 31 Properties damaged
• Public Adjuster hired
• Property and business
interruption insurance in place
• Cost to Whitestone pending
insurance settlement
Hurricane Ike
ike

Global Financial & Credit Crisis:
The Challenge for Public REITs
WHITESTONE
REIT
Challenge -Earnings
Growth
• REIT earnings increase limited by leases
• Internally generated capital
– Limited by 90% payout requirement
• Capital gains are not recurring
– Can be retained if offset by capital losses
– Can be retained if the required tax is paid
– Can be distributed to shareholders

Challenge: Attracting
Investor Capital During
Crisis
• Operational and financial trends
• Active redevelopment program
• Pipeline of attractive acquisitions
• Geographic diversification
• Strong balance sheet
• Management ownership
• Experienced Board
• Proven Investment Banker
Challenge – Sustaining
Dividends
As of Nov 5th, 16 US and 4 Canadian
REITs cut or suspended dividends and
more are expected to follow.
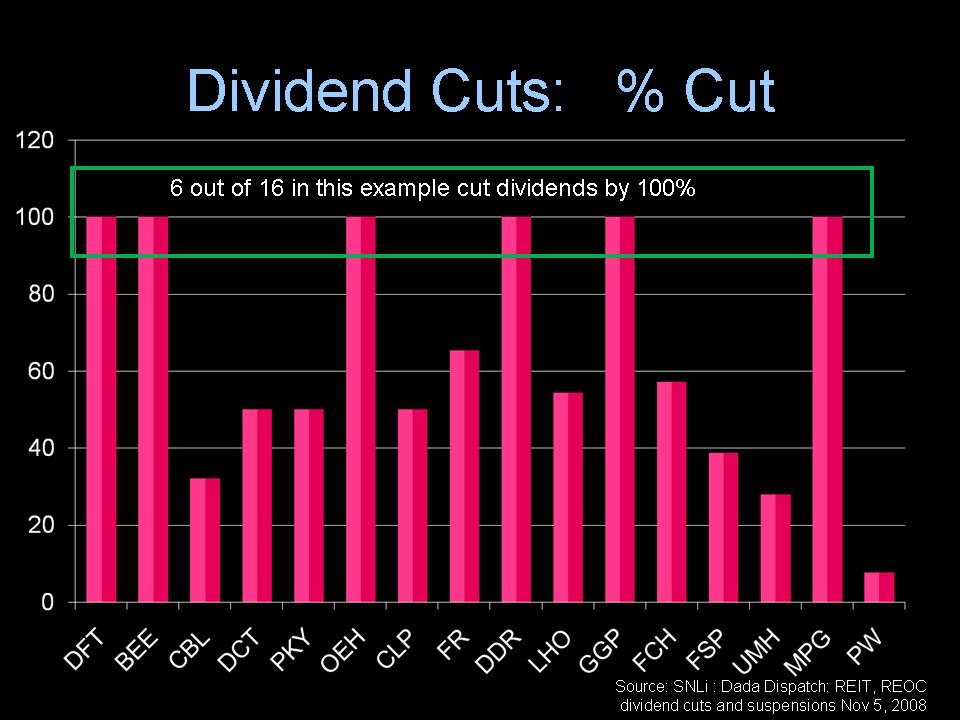
Dividend Cuts: % Cut
6 out of 16 in this example cut dividends by 100%
Source: SNLi : Dada Dispatch: REIT, REOC
dividend cuts and suspensions Nov 5, 2008

Dividend Cuts
“REITs would be well served to reduce their
dividends to between 90% and 100% of
taxable net income and use the dividend
savings to shore up balance sheets”
-RBC Capital Market Analysts 10/9/08 Report
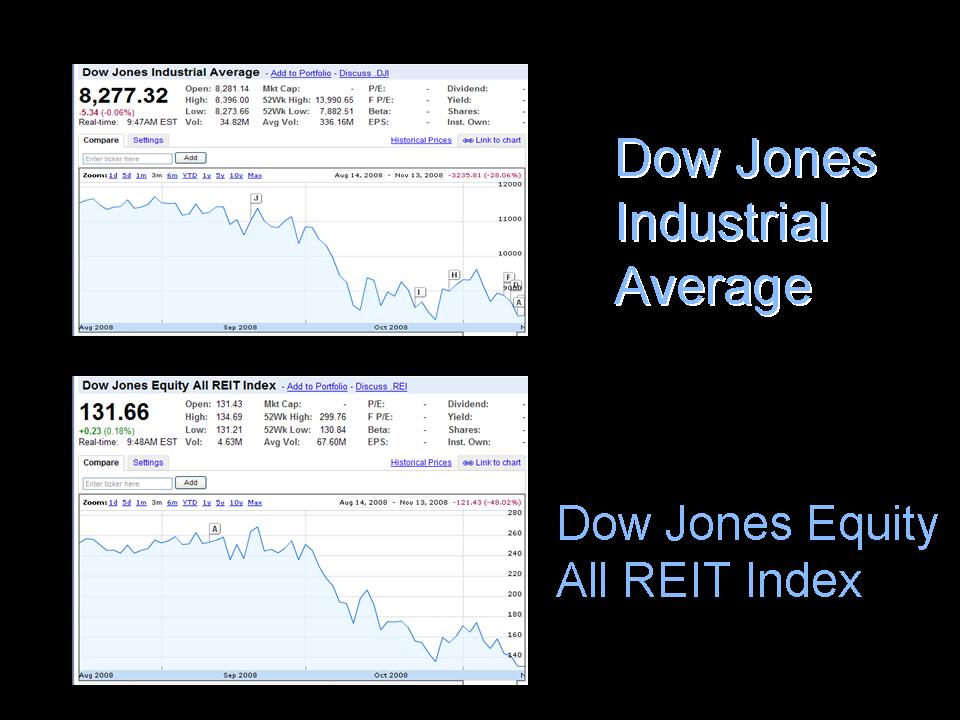
Dow JonesDow Jones
IndustrialIndustrial
AverageAverage
Dow Jones Equity
All REIT Index
Current Economic Crisis
• Government bailout
• Unemployment rising
• Economy slowing into a Recession
• Consumer confidence low
• Declining retail sales
• Capital markets frozen
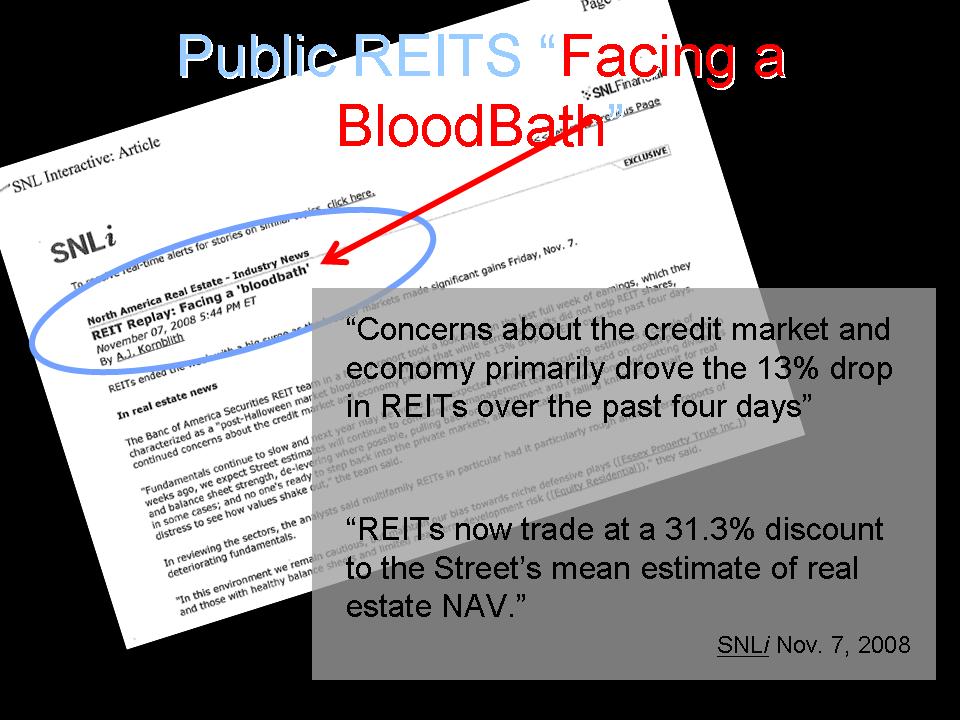
Public REITS “Facing a
BloodBath”
“Concerns about the credit market and
economy primarily drove the 13% drop
in REITs over the past four days”
“REITs now trade at a 31.3% discount
to the Street’s mean estimate of real
estate NAV.”
SNLi Nov. 7, 2008
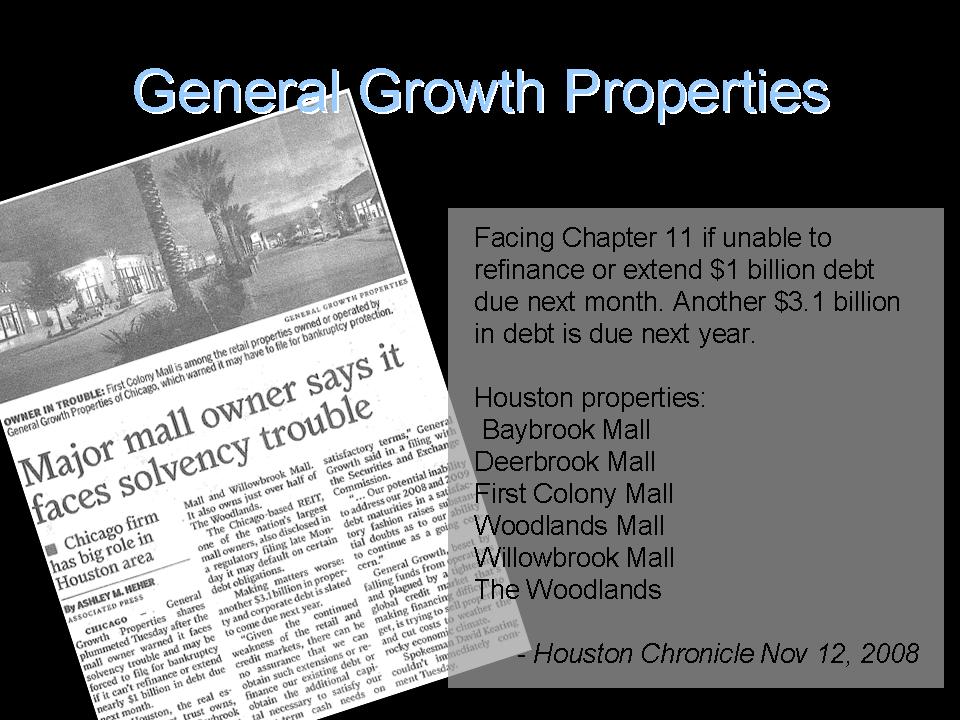
General Growth Properties
Facing Chapter 11 if unable to
refinance or extend $1 billion debt
due next month. Another $3.1 billion
in debt is due next year.
Houston properties:
Baybrook Mall
Deerbrook Mall
First Colony Mall
Woodlands Mall
Willowbrook Mall
The Woodlands
- Houston Chronicle Nov 12, 2008
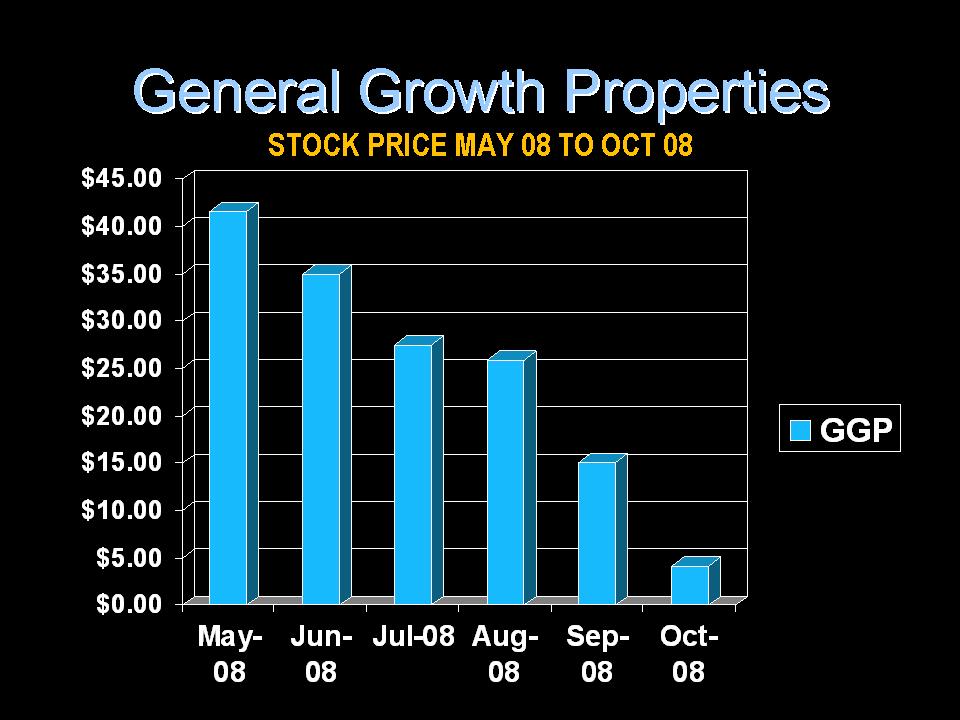
General Growth Properties
STOCK PRICE MAY 08 TO OCT 08
May-Jun-Jul-08 Aug-Sep-Oct0808 080808
$0.00
$5.00
$10.00
$15.00
$20.00
$25.00
$30.00
$35.00
$40.00
$45.00
GGP
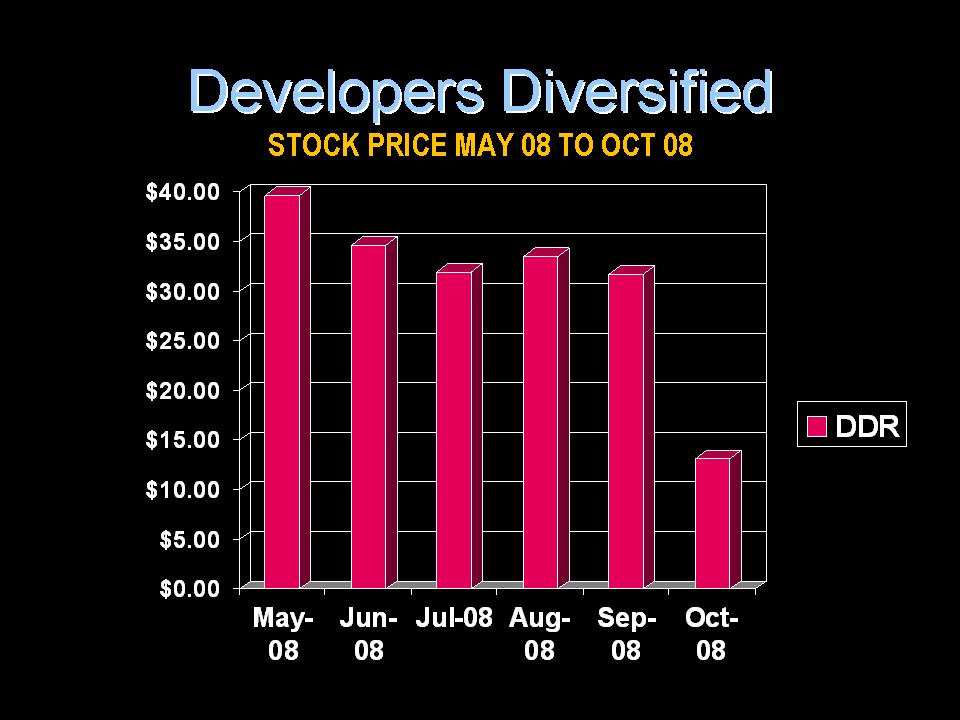
Developers Diversified
STOCK PRICE MAY 08 TO OCT 08
May-Jun-Jul-08 Aug-Sep-Oct0808 080808
$0.00
$5.00
$10.00
$15.00
$20.00
$25.00
$30.00
$35.00
$40.00
DDR
Developers Diversified
STOCK PRICE MAY 08 TO OCT 08
May-Jun-Jul-08 Aug-Sep-Oct0808 080808
$0.00
$5.00
$10.00
$15.00
$20.00
$25.00
$30.00
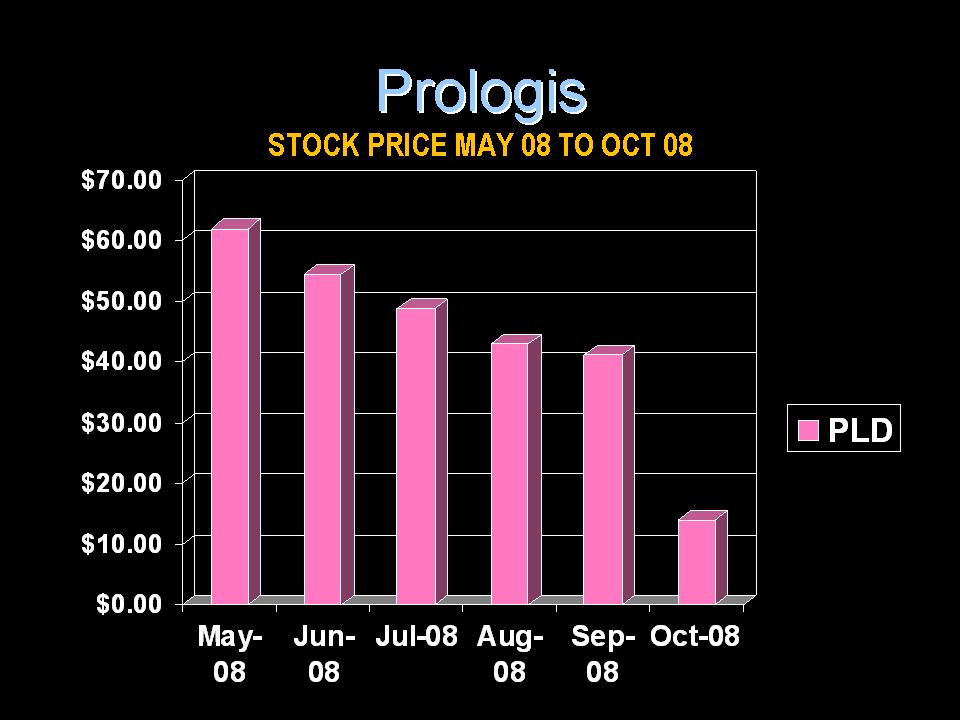
Prologis
STOCK PRICE MAY 08 TO OCT 08
May-Jun-Jul-08 Aug-Sep-Oct-08
0808 0808
$0.00
$10.00
$20.00
$30.00
$40.00
$50.00
$60.00
$70.00
PLD
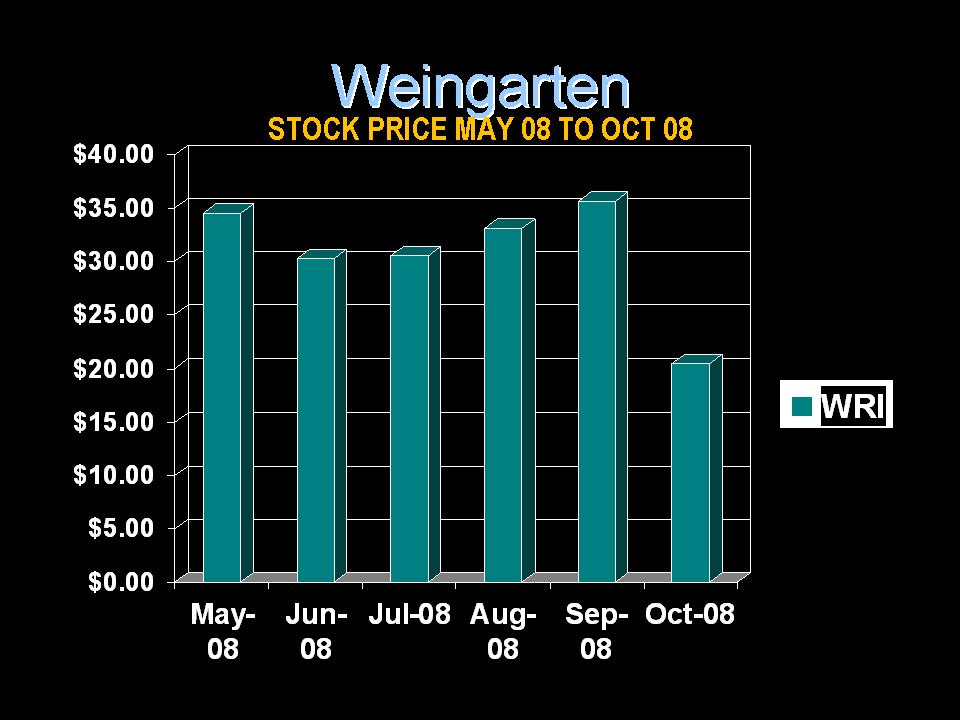
$0.00
$5.00
$10.00
$15.00
$20.00
$25.00
$30.00
$35.00
$40.00
May-08
Jun-08
Jul-08 Aug-08
Sep-08
Oct-08
WRI
WeingartenWeingartenSTOCK PRICE MAY 08 TO OCT 08
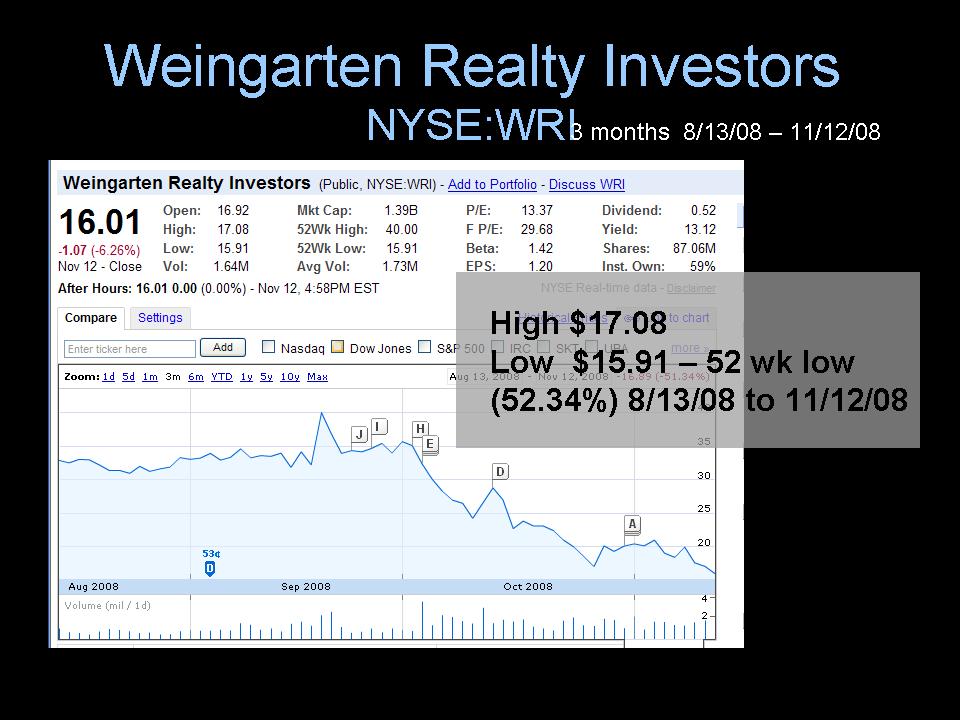
Weingarten Realty Investors
NYSE:WRI3 months 8/13/08 – 11/12/08
High $17.08
Low $15.91 – 52 wk low
(52.34%) 8/13/08 to 11/12/08
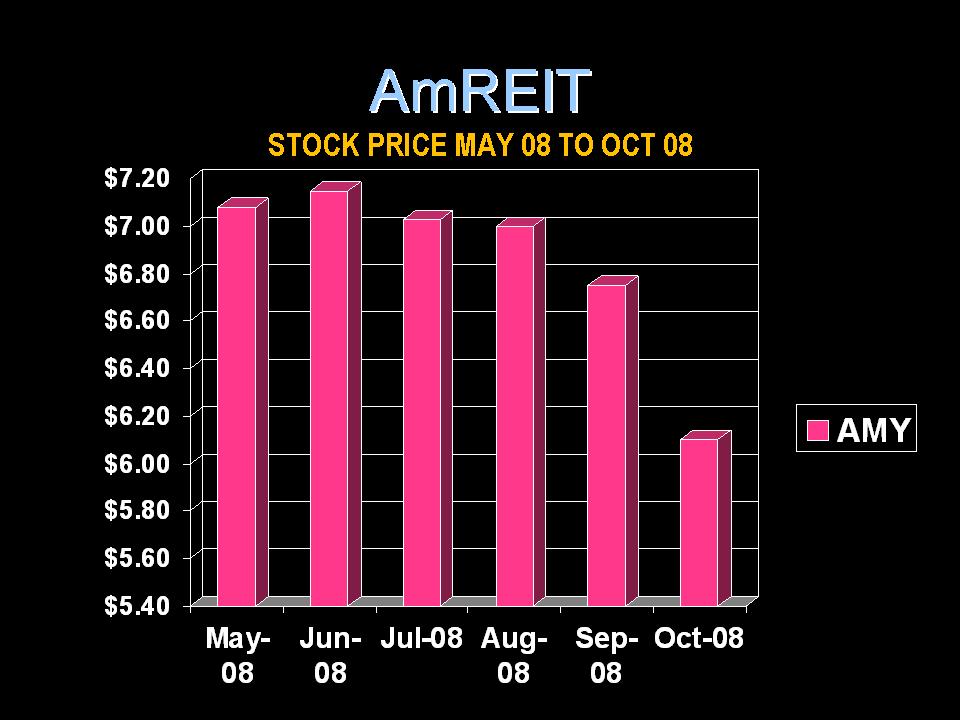
AmREIT
STOCK PRICE MAY 08 TO OCT 08
May-Jun-Jul-08 Aug-Sep-Oct-08
0808 0808
$5.40
$5.60
$5.80
$6.00
$6.20
$6.40
$6.60
$6.80
$7.00
$7.20
AMY
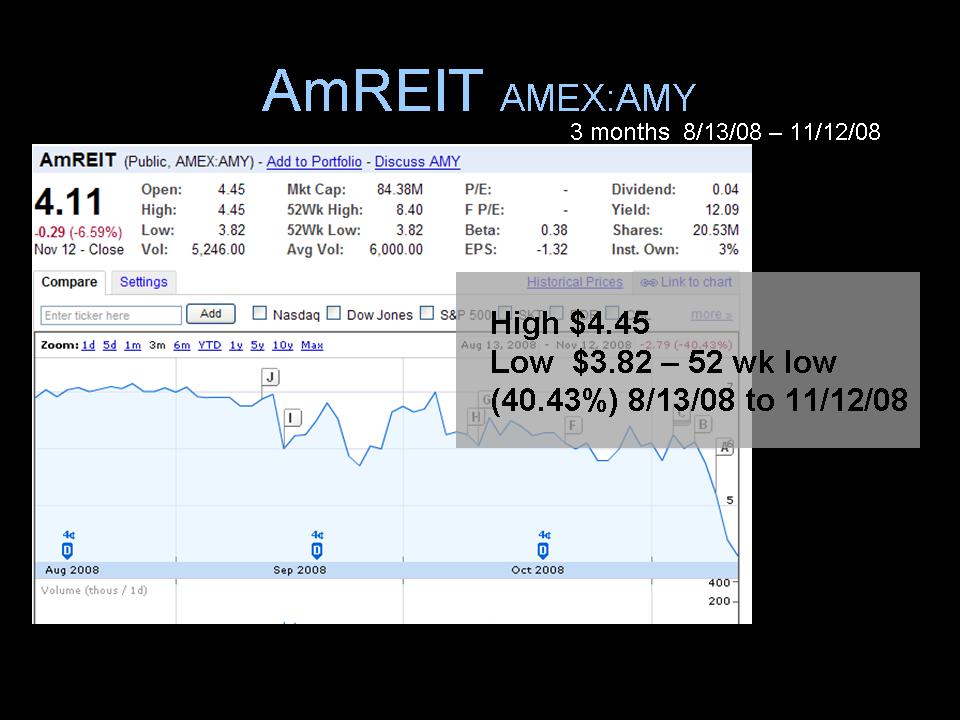
AmREIT AMEX:AMY
3 months 8/13/08 – 11/12/08
High $4.45
Low $3.82 – 52 wk low
(40.43%) 8/13/08 to 11/12/08
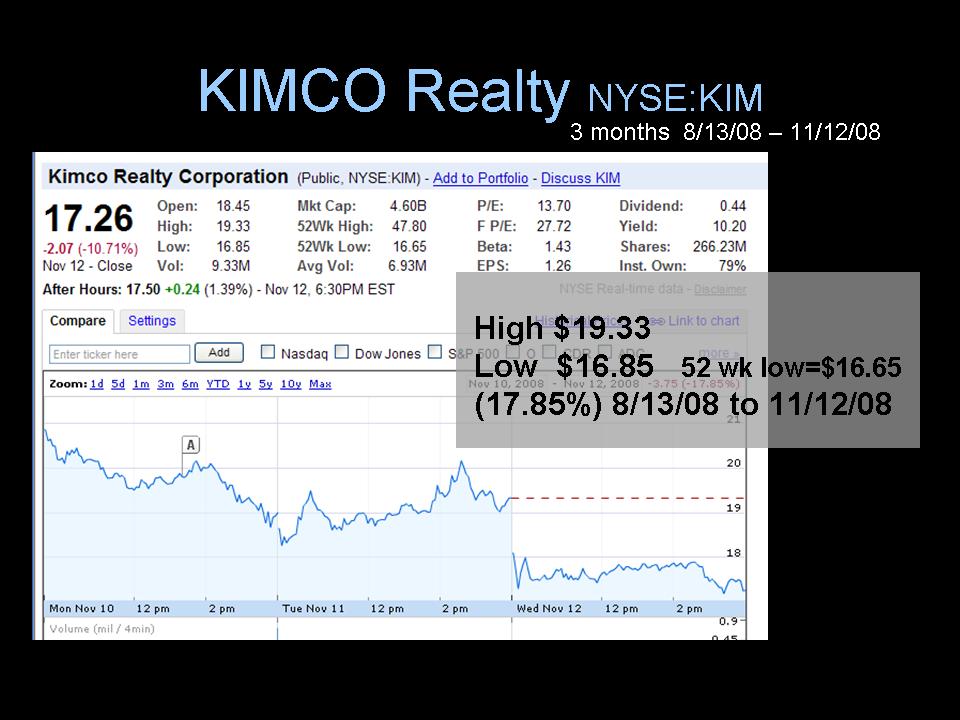
KIMCO Realty NYSE:KIM
3 months 8/13/08 – 11/12/08
High $19.33
Low $16.85 52 wk low=$16.65
(17.85%) 8/13/08 to 11/12/08
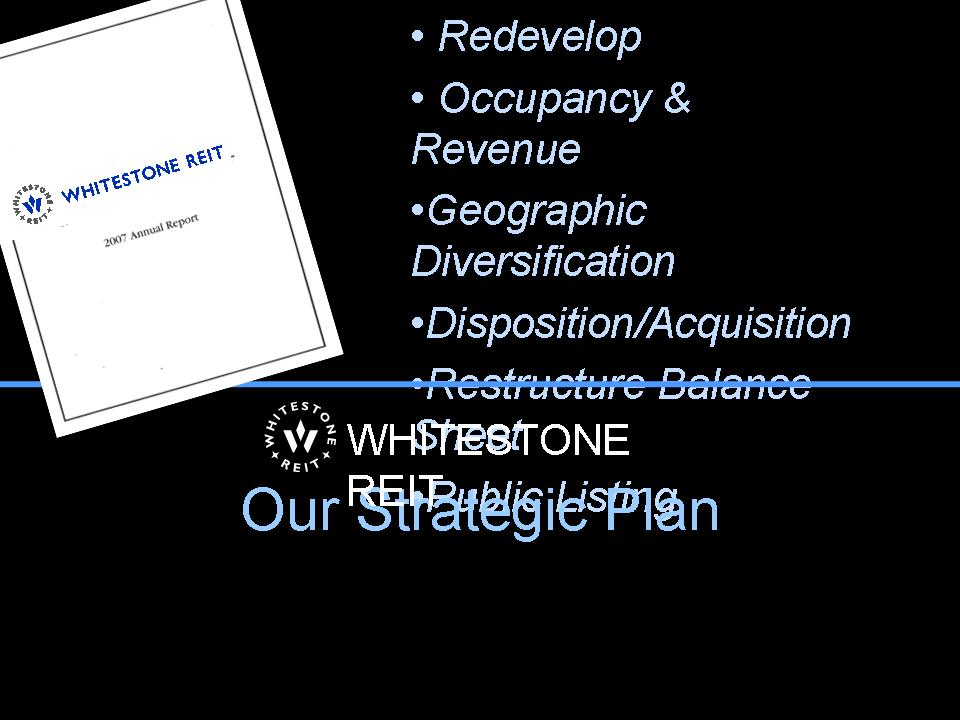
• Redevelop
• Occupancy &
Revenue
•Geographic
Diversification
•Disposition/Acquisition
Restructure Balance
Sheet
•Public Listing Our Strategic Plan
WHITESTONE
REIT
James C. Mastandrea
Chairman & CEO
Question/Answer
Thank You.