
JohnsonDiversey, Inc.
Senior Creditors Meeting
MAY, 2003

Introduction
| · | Welcome to JDI’s first annual Senior Creditors meeting |
| · | Purpose of Meeting: |
| — | Post-acquisition general business update |
| — | Integration plan and innovation developments |
| — | Operating performance for FY 2002 and 1Q03 |
| — | Business plan for 2003 |
| · | Public debt holders will be required to leave prior to discussion of non-public information |
| · | Private debt holders will receive non-public information electronically |
| · | Information being presented is subject to the confidentiality provisions contained in the Senior Secured Credit Agreement. |
| · | Q&A session after presentation |
Forward Looking Statements
Some of the statements that will be made in this presentation are forward looking and subject to risks and uncertainties, some of which are beyond our control. Please refer to the “Risk Factors” and “Cautionary Statement Concerning Forward Looking Statements” sections in our Registration Statement on Form S-4 which was declared effective by the SEC on November 27, 2002 for certain risks and uncertainties we face.
The presentation also includes references to EBITDA which is a non-GAAP measure within the meaning of the SEC’s Regulation G. A reconciliation of EBITDA to net income, and a calculation of EBITDA margin as used in this presentation is included in the handout and will be posted on our website atwww.johnsondiversey.com and can be accessed by clicking on the investor relations link.
3

Overview of Presenters
Greg Lawton
President and Chief Executive Officer
Mike Bailey
Executive Vice President and Chief Financial Officer
Greg Clark
Senior Vice President, Product Portfolio & Innovation
Francisco Sanchez
Vice President and Corporate Treasurer
4
Executive Summary
| · | Experience since closing has bolstered the view of merger benefits. |
| · | Key industry trends largely unchanged. |
| · | Company is effectively reacting to key near term issues of SARS and Iraq war. |
| · | Sales growth accelerating. |
| · | Company culture emerging as planned. |
| · | Ahead of plan with synergy benefits. Opportunities identified to exceed the $150 million target. |
| · | Integration infrastructure tasks proven to be more difficult. Three year time horizon remains viable. |
| · | Key systems strategy complete and launched. |
| · | Debt repayment ahead of plan with strong liquidity. |
We are on course or ahead of plan in all areas and are adjusting to market dynamics
5
Business Segments
[GRAPH]
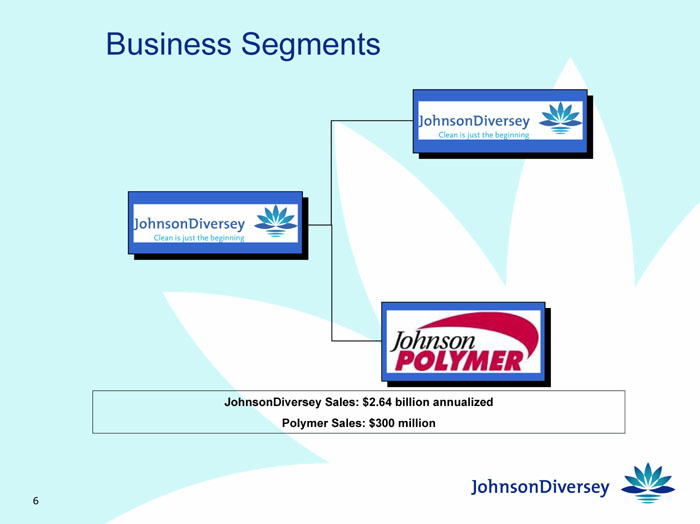
JohnsonDiversey Sales: $2.64 billion annualized
Polymer Sales: $300 million
6
Key Combined JWP & DL Strengths
| · | Leading market positions worldwide |
| · | Comprehensive line of products and services |
| · | Extensive geographic reach |
| · | Stable and predictable cash flows |
| · | Significant cost and revenue synergy potential |
| · | Experienced management team with strong sponsorship |
Size, strength, and geographic reach to compete successfully worldwide
7
Institutional & Industrial Market Highlights
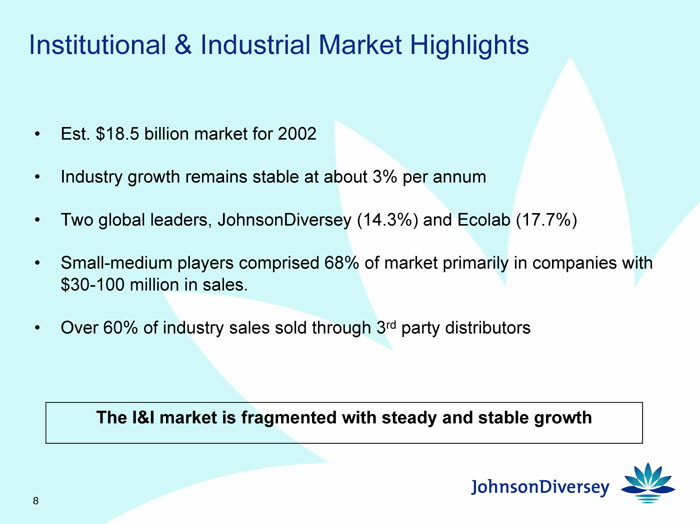
| · | Est. $18.5 billion market for 2002 |
| · | Industry growth remains stable at about 3% per annum |
| · | Two global leaders, JohnsonDiversey (14.3%) and Ecolab (17.7%) |
| · | Small-medium players comprised 68% of market primarily in companies with $30-100 million in sales. |
| · | Over 60% of industry sales sold through 3rd party distributors |
The I&I market is fragmented with steady and stable growth
8
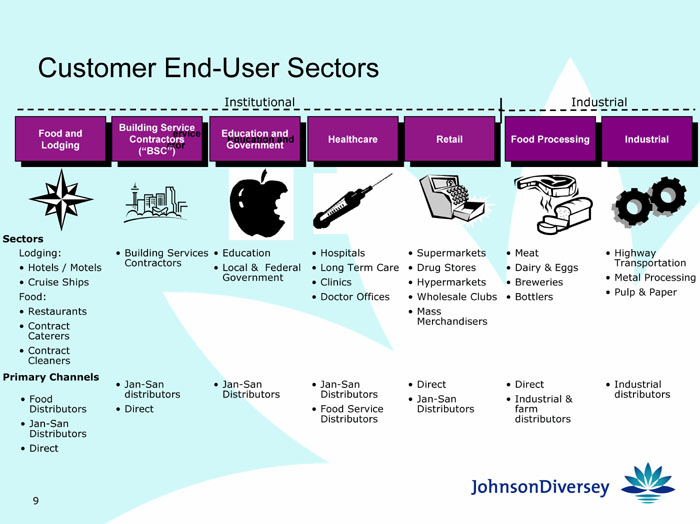
Customer End-User Sectors
Food and Lodging | Building Service Contractors (“BSC”) | Education and Government | Healthcare | Retail | Food Processing | Industrial | ||||||
[GRAPH] | ||||||||||||
Sectors | ||||||||||||
Lodging: • Hotels / Motels • Cruise Ships Food: • Restaurants • Contract Caterers • Contract Cleaners | • Building Services Contractors | • Education • Local & Federal Government | • Hospitals • Long Term Care • Clinics • Doctor Offices | • Supermarkets • Drug Stores • Hypermarkets • Wholesale Clubs • Mass Merchandisers | • Meat • Dairy & Eggs • Breweries • Bottlers | • Highway Transportation • Metal Processing • Pulp & Paper | ||||||
Primary Channels | ||||||||||||
• Food Distributors • Jan-San Distributors • Direct | • Jan-San distributors • Direct | • Jan-San Distributors | • Jan-San Distributors • Food Service Distributors | • Direct • Jan-San Distributors | • Direct • Industrial & farm distributors | • Industrial distributors | ||||||
9
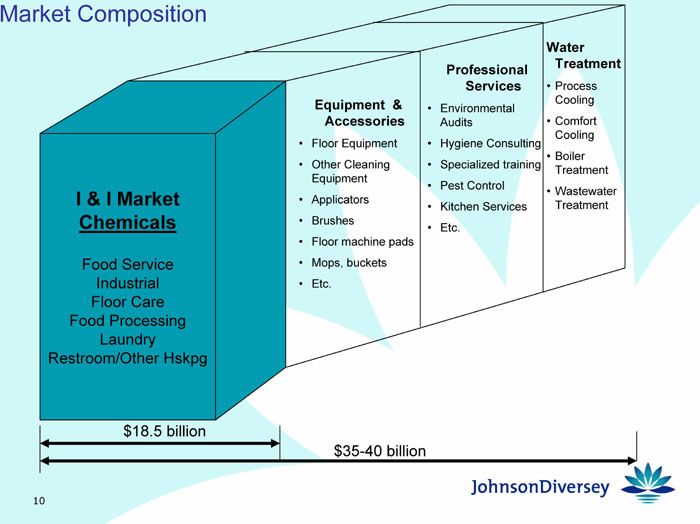
Market Composition
I & I Market Chemicals | Equipment & Accessories | Professional Services | Water Treatment | |||
Food Service Industrial Floor Care Food Processing Laundry Restroom/Other Hskpg | • Floor Equipment • Other Cleaning Equipment • Applicators • Brushes • Floor machine pads • Mops, buckets • Etc. | • Environmental Audits • Hygiene Consulting • Specialized training • Pest Control • Kitchen Services • Etc. | • Process Cooling • Comfort Cooling • Boiler Treatment • Wastewater Treatment | |||
$18.5 billion |
$35-40 billion
10
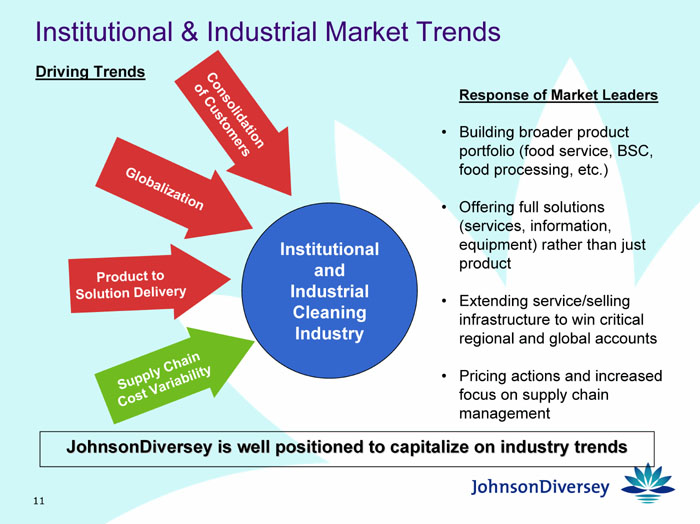
Institutional & Industrial Market Trends
Driving Trends
[GRAPH]
Response of Market Leaders
| · | Building broader product portfolio (food service, BSC, food processing, etc.) |
| · | Offering full solutions (services, information, equipment) rather than just product |
| · | Extending service/selling infrastructure to win critical regional and global accounts |
| · | Pricing actions and increased focus on supply chain management |
JohnsonDiversey is well positioned to capitalize on industry trends
11

2003 Impacts
WAR
| · | Initial run up in material costs from Iraq war have abated. |
| · | Food and lodging sector affected in the immediate area of Iraq, such as Turkey. |
| · | Perceived security risks affected tourism and travel industry, but heightened attention to hygiene is partially offsetting downturn in travel. |
SARS
| · | SARS halted travel in Asia/Pacific region with high hotel vacancy rates and low restaurant business. |
| · | JD is providing disinfectants that are effective against SARS-like viruses, as well as extensive training programs. |
| · | JD established a SARS web site as a clearinghouse of information on the virus. |
| · | Economic impact of SARS is being offset by a dramatic increase in demand for cleaning and disinfection. |
| · | Asia-Pacific represents 16% of our global business. JD is well positioned to profitably manage through this public health crisis. |
Company is effectively reacting to key near term market issues
12
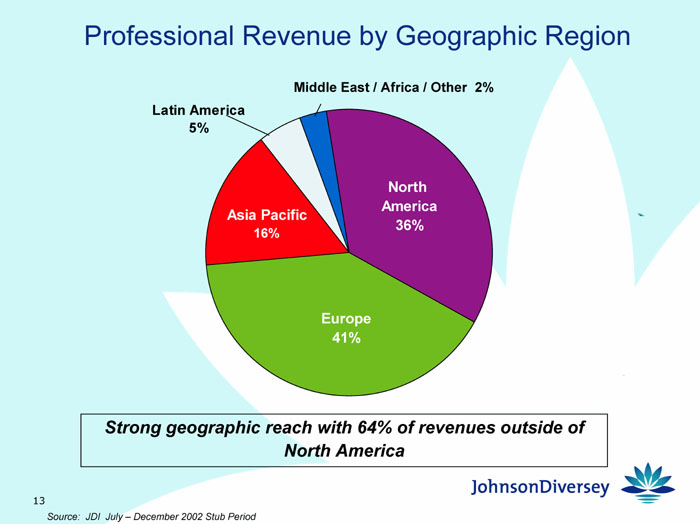
Professional Revenue by Geographic Region
[GRAPH]
Strong geographic reach with 64% of revenues outside of
North America
Source: JDI July – December 2002 Stub Period
13
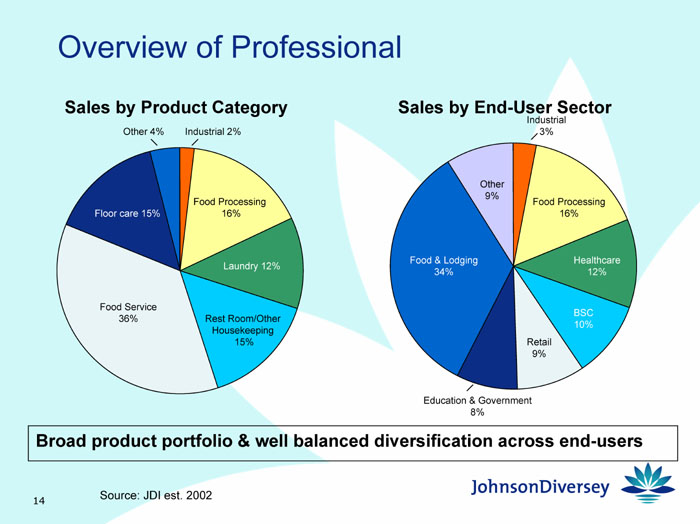
Overview of Professional
Sales by Product Category
[GRAPH]
Sales by End-User Sector
[GRAPH]
Broad product portfolio & well balanced diversification across end-users
Source: JDI est. 2002
14
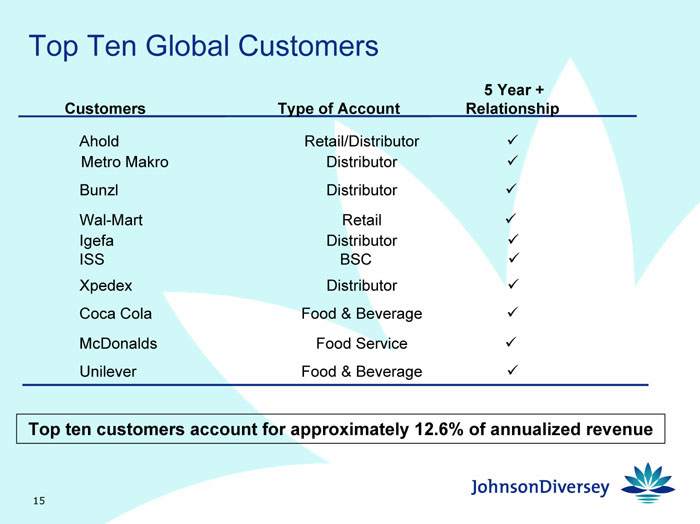
Top Ten Global Customers
Customers | Type of Account | 5 Year + Relationship | ||
Ahold | Retail/Distributor | ü | ||
Metro Makro | Distributor | ü | ||
Bunzl | Distributor | ü | ||
Wal-Mart | Retail | ü | ||
Igefa | Distributor | ü | ||
ISS | BSC | ü | ||
Xpedex | Distributor | ü | ||
Coca Cola | Food & Beverage | ü | ||
McDonalds | Food Service | ü | ||
Unilever | Food & Beverage | ü |
Top ten customers account for approximately 12.6% of annualized revenue
15
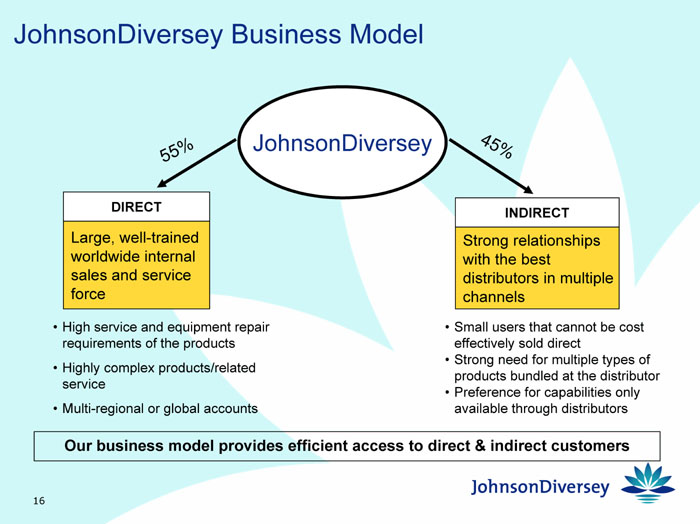
JohnsonDiversey Business Model
[GRAPH]
DIRECT – 55%
Large, well-trained worldwide internal sales and service force
| · | High service and equipment repair requirements of the products |
| · | Highly complex products/related service |
| · | Multi-regional or global accounts |
INDIRECT – 45%
Strong relationships with the best distributors in multiple channels
| · | Small users that cannot be cost effectively sold direct |
| · | Strong need for multiple types of products bundled at the distributor |
| · | Preference for capabilities only available through distributors |
Our business model provides efficient access to direct & indirect customers
16
Our Vision And Mission Are Clear
VISION
Best Solutions and Service for you Every Day, Everywhere!
MISSION
To become thepreeminentprovider oftotal cleaning and sanitation solutions to a core group of customer sectors where we will have a unique,sustainable competitive position every day, everywhere.
17
7 Strategic Customer Sectors
| · | Lodging |
| · | Food Service |
| · | Healthcare |
| · | Building Service Contractors |
| · | Retail |
| · | Food & Beverage |
| · | Consumer brands & channel partners |
Sectors chosen for growth & profit potential, ability to leverage skills & exploit interdependencies
18
Strategic Objectives
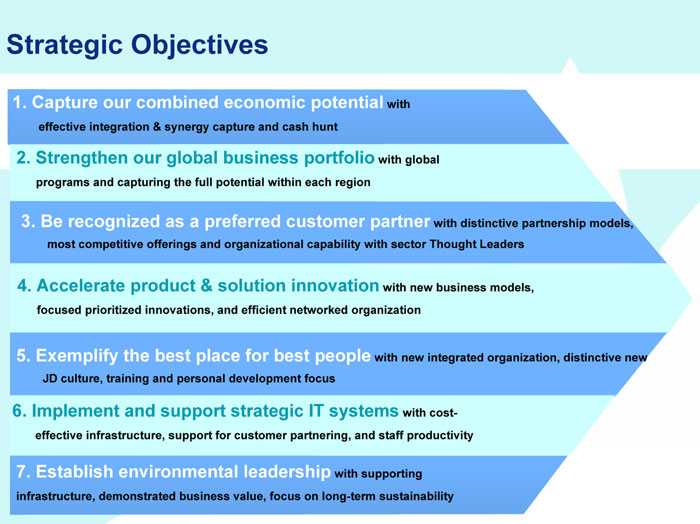
| 1. | Capture our combined economic potential with effective integration & synergy capture and cash hunt |
| 2. | Strengthen our global business portfolio with global programs and capturing the full potential within each region |
| 3. | Be recognized as a preferred customer partner with distinctive partnership models, most competitive offerings and organizational capability with sector Thought Leaders |
| 4. | Accelerate product & solution innovation with new business models, focused prioritized innovations, and efficient networked organization |
| 5. | Exemplify the best place for best people with new integrated organization, distinctive new JD culture, training and personal development focus |
| 6. | Implement and support strategic IT systems with cost-effective infrastructure, support for customer partnering, and staff productivity |
| 7. | Establish environmental leadership with supporting infrastructure, demonstrated business value, focus on long-term sustainability |
19
Overview of Polymer
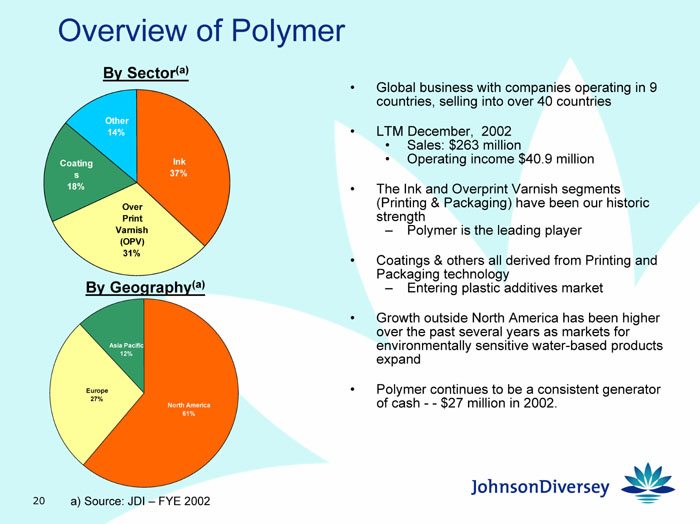
By Sector(a)
[GRAPH]
By Geography(a)
[GRAPH]
| · | Global business with companies operating in 9 countries, selling into over 40 countries |
| · | LTM December, 2002 |
| · | Sales: $263 million |
| · | Operating income $40.9 million |
| · | The Ink and Overprint Varnish segments (Printing & Packaging) have been our historic strength |
| — | Polymer is the leading player |
| · | Coatings & others all derived from Printing and Packaging technology |
| — | Entering plastic additives market |
| · | Growth outside North America has been higher over the past several years as markets for environmentally sensitive water-based products expand |
| · | Polymer continues to be a consistent generator of cash — $27 million in 2002. |
a) Source: JDI – FYE 2002
20
Johnson Polymer Strategic Initiatives
| · | Maintain and grow share in Printing, Packaging and Coatings |
| · | Gain differentiation in targeting markets of direct food contact, film printing, dispersion resins, and wood coatings |
| · | Establish new positions in new businesses of functional coatings and plastic additives |
| · | Leverage growing environmental awareness |
21
2002 Major Achievements
| · | Exceeded synergy target by 32% and headcount reduction by 37% |
| · | Made $57 million unscheduled repayment of debt |
| · | Registered senior subordinated bonds in November 2002 |
| · | Launched public reporting |
| · | Met all financial covenants under loan agreements |
| · | Secured significant customer wins without any material customer losses since closing |
| · | Created a new structure for innovation and commercialization focused on top 30 business products |
| · | Completed placement of top 4,000 managers by September 2002 |
| · | Defined new cultural attributes and launched global orientation program |
22
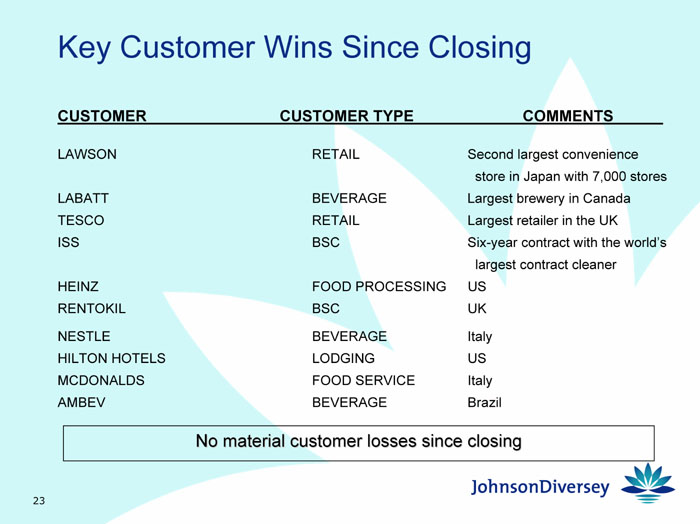
Key Customer Wins Since Closing
CUSTOMER | CUSTOMER TYPE | COMMENTS | ||
LAWSON | RETAIL | Second largest convenience | ||
store in Japan with 7,000 stores | ||||
LABATT | BEVERAGE | Largest brewery in Canada | ||
TESCO | RETAIL | Largest retailer in the UK | ||
ISS | BSC | Six-year contract with the world’s | ||
largest contract cleaner | ||||
HEINZ | FOOD PROCESSING | US | ||
RENTOKIL | BSC | UK | ||
NESTLE | BEVERAGE | Italy | ||
HILTON HOTELS | LODGING | US | ||
MCDONALDS | FOOD SERVICE | Italy | ||
AMBEV | BEVERAGE | Brazil |
No material customer losses since closing
23
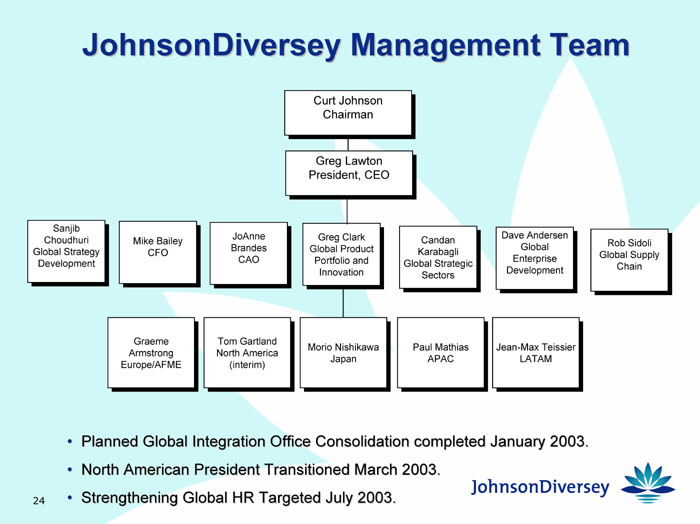
JohnsonDiversey Management Team
Curt Johnson Chairman | ||||||||||||
Greg Lawton President, CEO | ||||||||||||
Sanjib Choudhuri Global Strategy Development | Mike Bailey CFO | JoAnne Brandes CAO | Greg Clark Global Product Portfolio and Innovation | Candan Karabagli Global Strategic Sectors | Dave Andersen Global Enterprise Development | Rob Sidoli Global Supply Chain | ||||||
Graeme Armstrong Europe/AFME | Tom Gartland North America (interim) | Morio Nishikawa Japan | Paul Mathias APAC | Jean-Max Teissier LATAM |
| · | Planned Global Integration Office Consolidation completed January 2003. |
| · | North American President Transitioned March 2003. |
| · | Strengthening Global HR Targeted July 2003. |
24
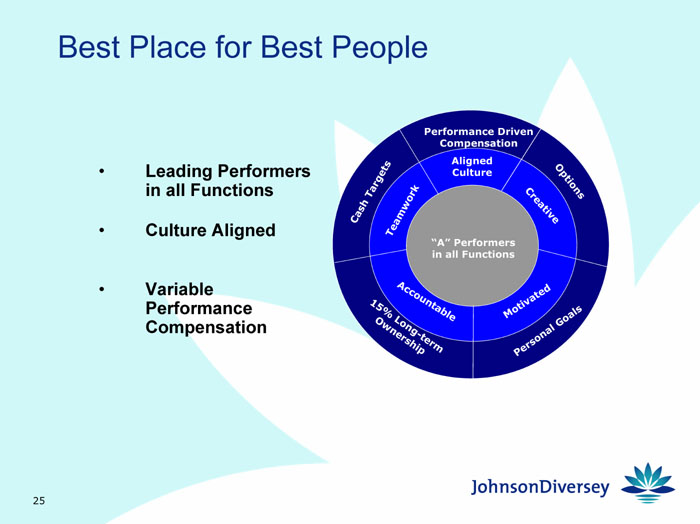
Best Place for Best People
| · | Leading Performers in all Functions |
| · | Culture Aligned |
| · | Variable Performance Compensation |
[GRAPH]
25
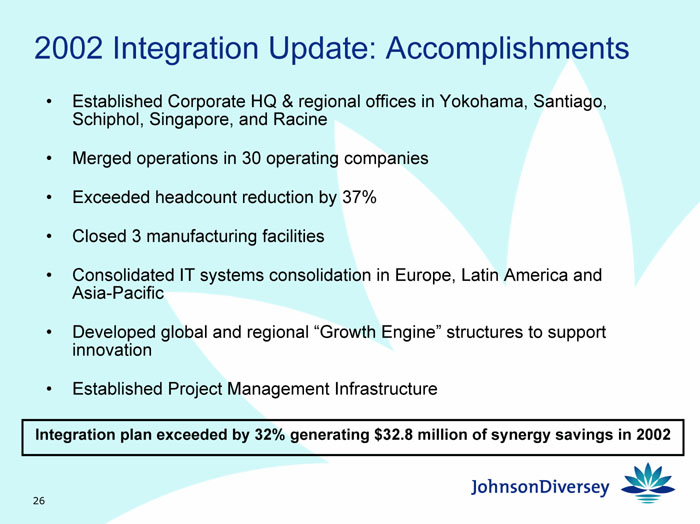
2002 Integration Update: Accomplishments
| · | Established Corporate HQ & regional offices in Yokohama, Santiago, Schiphol, Singapore, and Racine |
| · | Merged operations in 30 operating companies |
| · | Exceeded headcount reduction by 37% |
| · | Closed 3 manufacturing facilities |
| · | Consolidated IT systems consolidation in Europe, Latin America and Asia-Pacific |
| · | Developed global and regional “Growth Engine” structures to support innovation |
| · | Established Project Management Infrastructure |
Integration plan exceeded by 32% generating $32.8 million of synergy savings in 2002
26
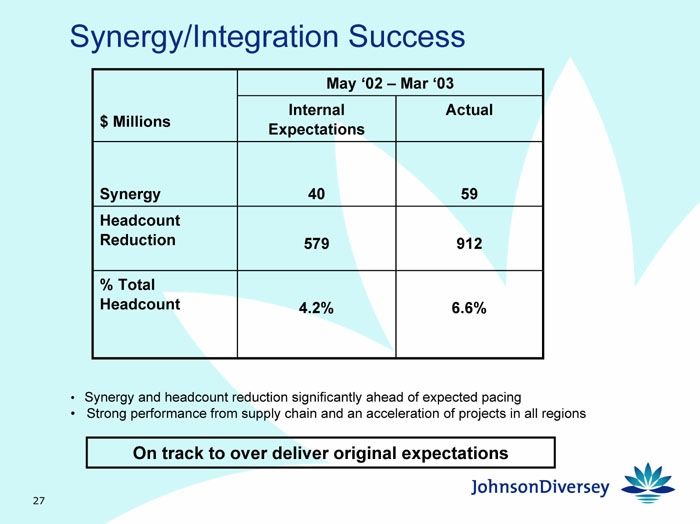
Synergy/Integration Success
$Millions | May ‘02 – Mar ‘03 | |||
Internal Expectations | Actual | |||
Synergy | 40 | 59 | ||
Headcount Reduction | 579 | 912 | ||
% Total Headcount | 4.2% | 6.6% | ||
| · | Synergy and headcount reduction significantly ahead of expected pacing |
| · | Strong performance from supply chain and an acceleration of projects in all regions |
On track to over deliver original expectations
27
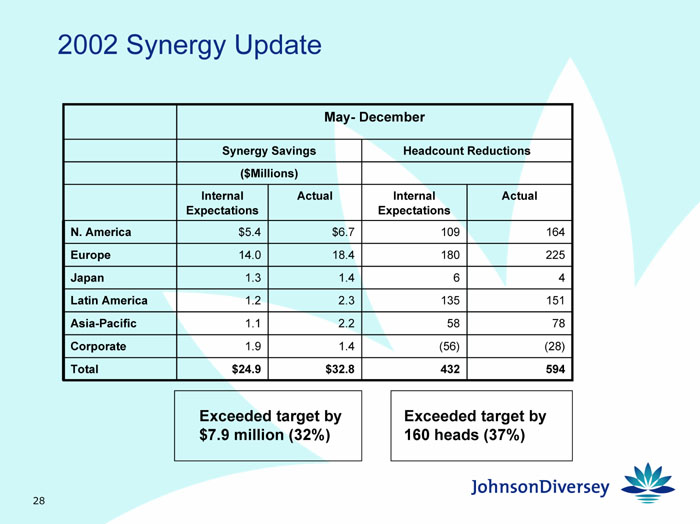
2002 Synergy Update
May – December | ||||||||
Synergy Savings | Headcount Reductions | |||||||
($Millions) | ||||||||
Internal Expectations | Actual | Internal Expectations | Actual | |||||
N. America | $5.4 | $6.7 | 109 | 164 | ||||
Europe | 14.0 | 18.4 | 180 | 225 | ||||
Japan | 1.3 | 1.4 | 6 | 4 | ||||
Latin America | 1.2 | 2.3 | 135 | 151 | ||||
Asia-Pacific | 1.1 | 2.2 | 58 | 78 | ||||
Corporate | 1.9 | 1.4 | (56) | (28) | ||||
Total | $24.9 | $32.8 | 432 | 594 | ||||
Exceeded target by $7.9 million (32%) | Exceeded target by 160 heads (37%) |
28
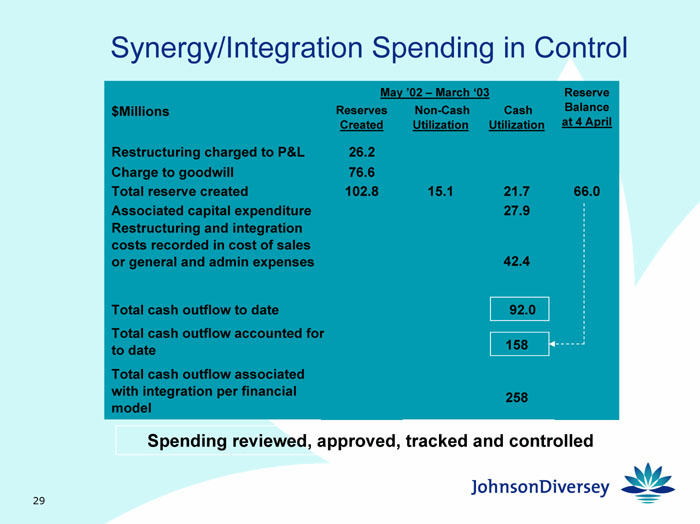
Synergy/Integration Spending in Control
May ‘02 – March ‘03 | Reserve Balance at 4 April | |||||||
$Millions | Reserves Created | Non-Cash Utilization | Cash Utilization | |||||
Restructuring charged to P&L | 26.2 | |||||||
Charge to goodwill | 76.6 | |||||||
Total reserve created | 102.8 | 15.1 | 21.7 | 66.0 | ||||
Associated capital expenditure | 27.9 | |||||||
Restructuring and integration costs recorded in cost of sales or general and admin expenses | 42.4 | |||||||
Total cash outflow to date | 92.0 | |||||||
Total cash outflow accounted for to date | 158 | |||||||
Total cash outflow associated with integration per financial mode | 258 | |||||||
Spending reviewed, approved, tracked and controlled
29
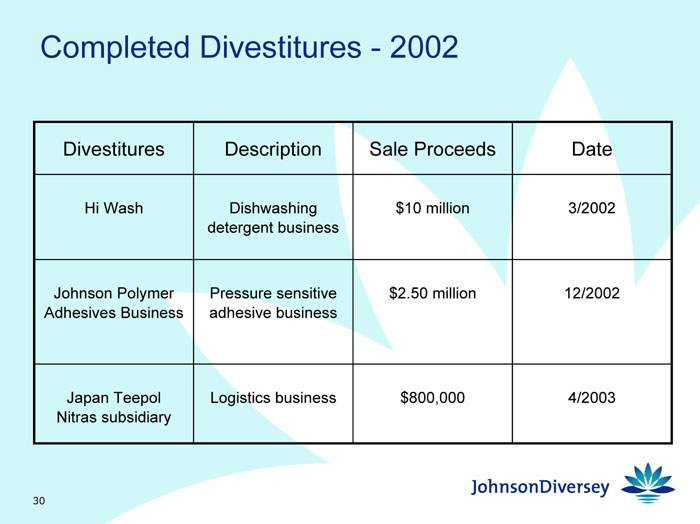
Completed Divestitures – 2002
Divestitures | Description | Sale Proceeds | Date | |||
Hi Wash | Dishwashing detergent business | $10 million | 3/2002 | |||
Johnson Polymer Adhesives Business | Pressure sensitive adhesive business | $2.50 million | 12/2002 | |||
Japan Teepol Nitras subsidiary | Logistics business | $800,000 | 4/2003 |
30
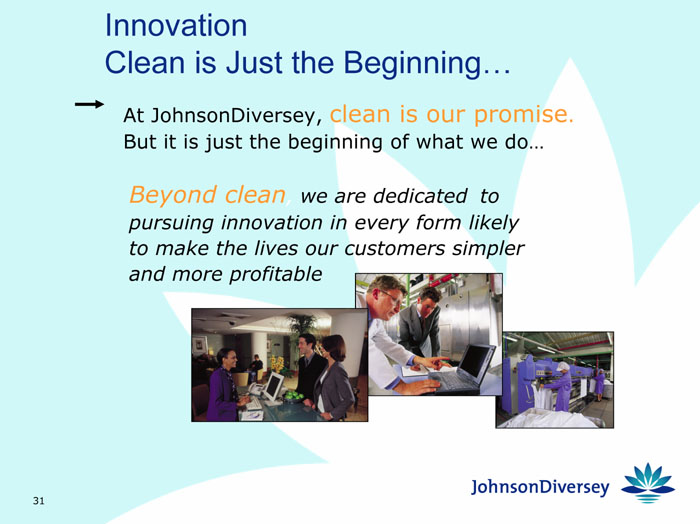
Innovation Clean is Just the Beginning…
®
At JohnsonDiversey, clean is our promise. But it is just the beginning of what we do…
Beyond clean, we are dedicated to pursuing innovation in every form likely to make the lives our customers simpler and more profitable
[GRAPH]
31
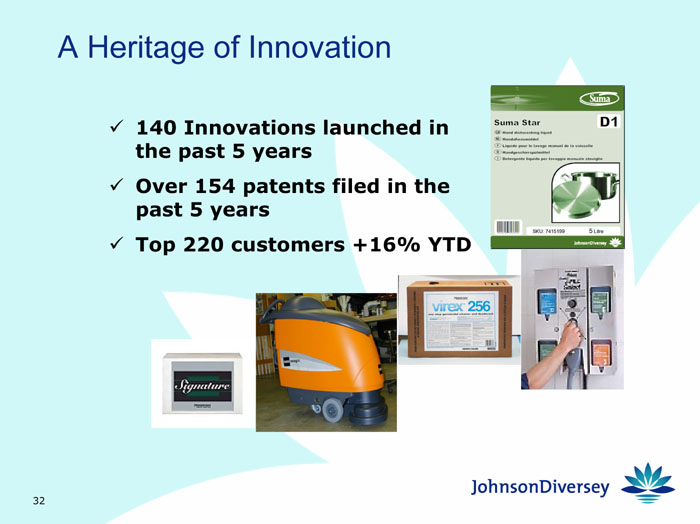
A Heritage of Innovation
| ü140 | Innovations launched in the past 5 years |
| üOver | 154 patents filed in the past 5 years |
| üTop | 220 customers +16% YTD |
[GRAPH]
32
Commitment to Innovation
| · | Innovation Spend: $75 million |
| · | Innovation Headcount: 500 |
| · | Percent to Sales: 3% |
33
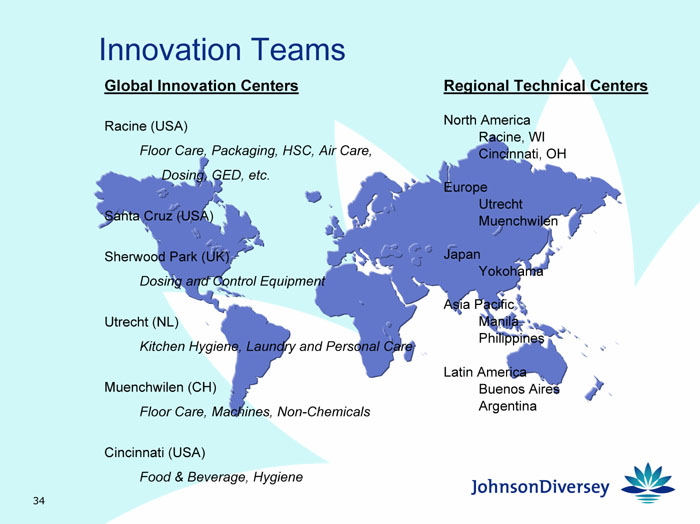
Innovation Teams
Global Innovation Centers
Racine (USA)
Floor Care, Packaging, HSC, Air Care, Dosing, GED, etc.
Santa Cruz (USA)
Sherwood Park (UK)
Dosing and Control Equipment
Utrecht (NL)
Kitchen Hygiene, Laundry and Personal Care
Muenchwilen (CH)
Floor Care, Machines, Non-Chemicals
Cincinnati (USA)
Food & Beverage, Hygiene
Regional Technical Centers
North America
Racine, WI
Cincinnati, OH
Europe
Utrecht
Muenchwilen
Japan
Yokohama
Asia Pacific
Manila
Philippines
Latin America
Buenos Aires
Argentina
[GRAPH]
34
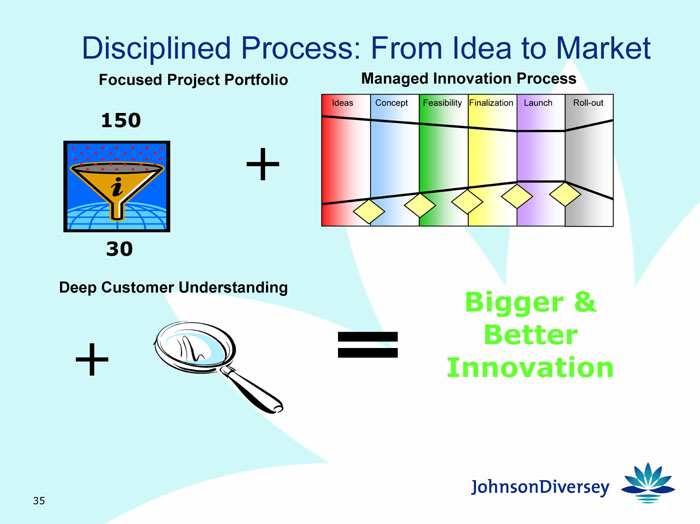
Disciplined Process: From Idea to Market
Focused Project Portfolio
[GRAPH]
Managed Innovation Process
[GRAPH]
Deep Customer Understanding
[GRAPH]
Bigger & Better Innovation
35
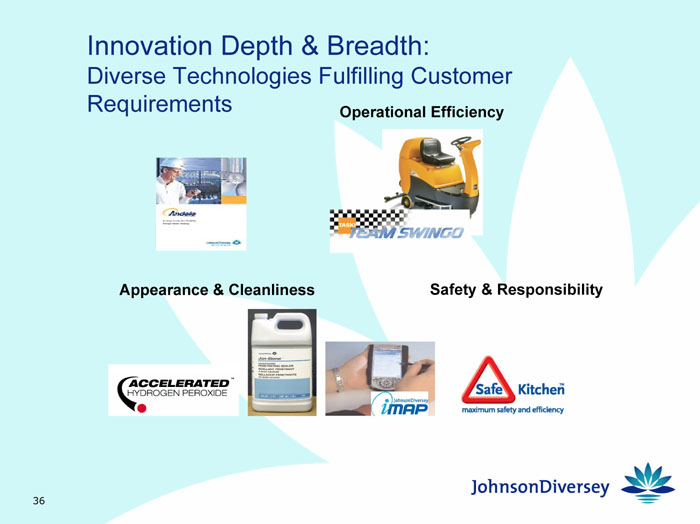
Innovation Depth & Breadth:
Diverse Technologies Fulfilling Customer Requirements
[GRAPH]
Operational Efficiency
[GRAPH]
Appearance & Cleanliness
[GRAPH]
Safety & Responsibility
[GRAPH]
36
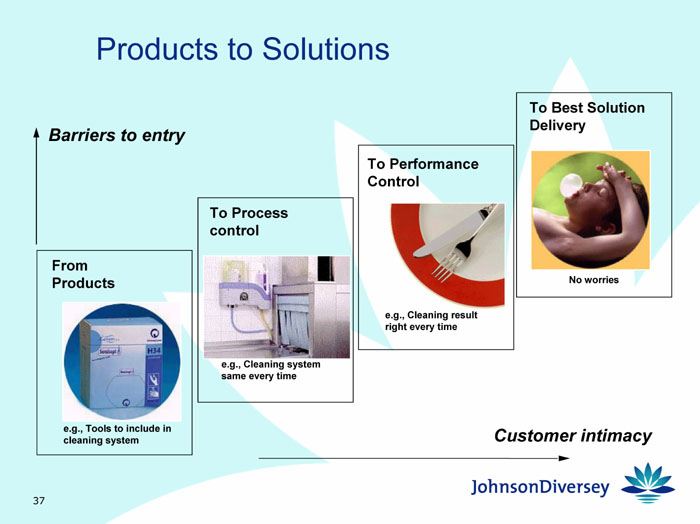
Products to Solutions
Barriers to entry
From Products
[GRAPH]
e.g., Tools to include in cleaning system
To Process control
[GRAPH]
e.g., Cleaning system same every time
To Performance Control
[GRAPH]
e.g., Cleaning result right every time
To Best Solution Delivery
[GRAPH]
No worries
Customer intimacy
37
Summary
Clean is Just the Beginning…
Heritage
Commitment
Process
Depth & Breadth
Total Solutions
[GRAPH]
38
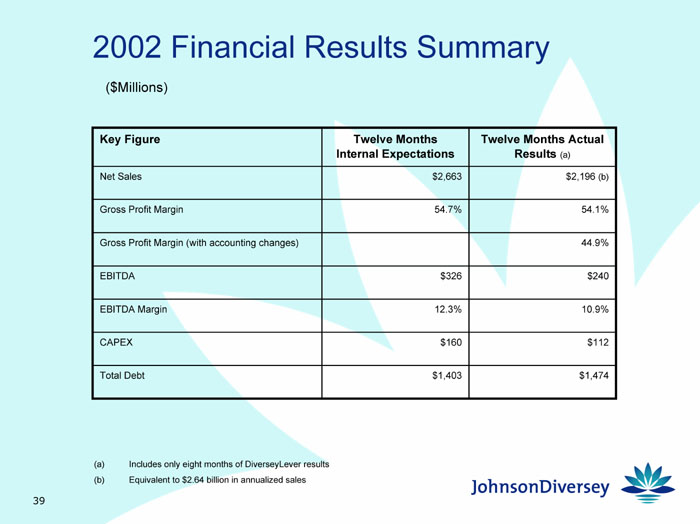
2002 Financial Results Summary
($Millions)
Key Figure | Twelve Months Internal Expectations | Twelve Months Actual Results (a) | ||
Net Sales | $2,663 | $2,196 (b) | ||
Gross Profit Margin | 54.7% | 54.1% | ||
Gross Profit Margin (with accounting changes) | 44.9% | |||
EBITDA | $326 | $240 | ||
EBITDA Margin | 12.3% | 10.9% | ||
CAPEX | $160 | $112 | ||
Total Debt | $1,403 | $1,474 |
| (a) | Includes only eight months of DiverseyLever results |
| (b) | Equivalent to $2.64 billion in annualized sales |
39
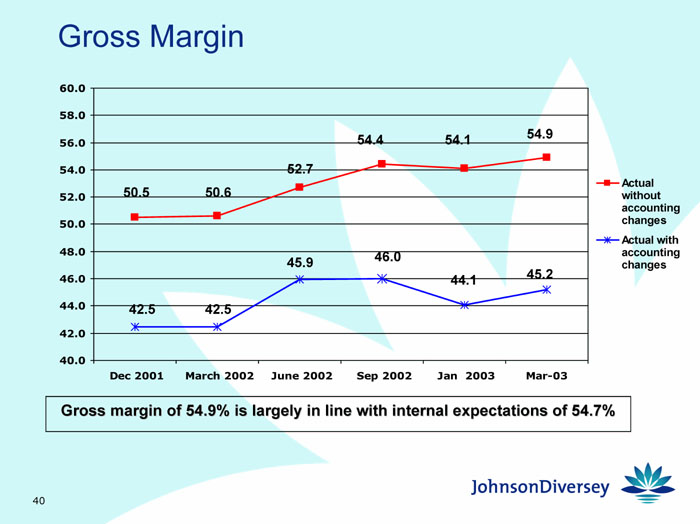
Gross Margin
[GRAPH]
Gross margin of 54.9% is largely in line with internal expectations of 54.7%
40
EBITDA
| • | First quarter 2003 EBITDA margin of 12.5% (excluding restructuring charges and other one-time costs) |
| • | Quarter reflected month-to-month improvements in each month of the quarter |
| • | EBITDA margins improved from pre-acquisition levels of the combined businesses |
| • | Long-term target after synergy realization is best-in-class EBITDA margins |
41
Capital Expenditures
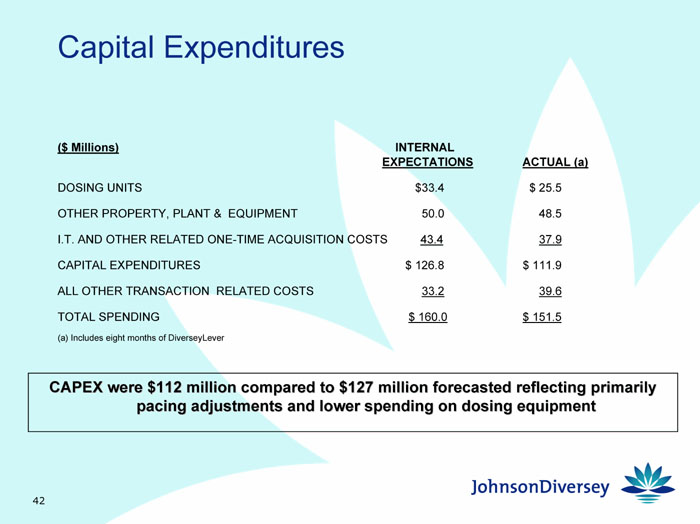
($Millions) | INTERNAL EXPECTATIONS | ACTUAL (a) | ||
DOSING UNITS | $33.4 | $25.5 | ||
OTHER PROPERTY, PLANT & EQUIPMENT | 50.0 | 48.5 | ||
I.T. AND OTHER RELATED ONE-TIME ACQUISITION COSTS | 43.4 | 37.9 | ||
CAPITAL EXPENDITURES | $126.8 | $111.9 | ||
ALL OTHER TRANSACTION RELATED COSTS | 33.2 | 39.6 | ||
TOTAL SPENDING | $160.0 | $151.5 |
| (a) | Includes eight months of DiverseyLever |
CAPEX were $112 million compared to $127 million forecasted reflecting primarily
pacing adjustments and lower spending on dosing equipment
42

Johnson Polymer 2002 Operating Performance
| • | Net sales increased 9.1% led by a 16% growth in shipments to Europe. |
| • | The key printing & packaging segment recorded double-digit growth in sales, volume, and operating profits. |
| • | Operating profit was 38% over 2001 as a result of stronger sales, lower raw material costs, a stronger euro, and proceeds from the divestiture of the adhesive business. |
| • | Cash flow increased to $27.2 million driven by higher profitability, as well as lower working capital requirements and CAPEX. |
| • | Continued focus on key printing & packaging and coatings businesses, both of which are growing at double-digit rates. |
43
JohnsonDiversey 1Q03 Financial Results Summary
| • | Net sales increased 4.2% over 1Q02 on a comparable basis |
| • | All regions contributed to top line growth driven by new customer wins and a broader combined product and services offering |
| • | Gross profit margin was 45.2%, up from 42.5% for the comparable period in 2002 and 44.9% for FY 2002 |
| • | Integration work delivered synergy savings of $26 million, 17% ahead of plan |
| • | EBITDA was $72.5 million for the quarter, $14 million higher than plan excluding the favorable one-time spend, EBITDA was $5 million above budget |
| • | EBITDA margin, before restructuring charges and other one-time costs of $15 million, improved to 12.5% |
44
Johnson Polymer 1Q03 Financial Results Summary
| • | Net sales, including inter-company sales, increased 16.5% over 1Q02 due to increased volumes primarily in Europe and Asia-Pacific |
| • | Net sales to the top ten customers were 19.1% ahead of last year |
| • | Higher raw material costs being offset through incremental sales opportunities and over $3.0 million reduction in functional expenses and other manufacturing costs. |
| • | Operating profit was $13.5 million, nearly 13% higher than 1Q02 and favorable to plan due to continued sales growth and tight control of operating expenses. |
| • | Cash flow was $7.8 million, favorable to plan, due largely to further improvements in working capital. |
45
Financial Measurements Summary
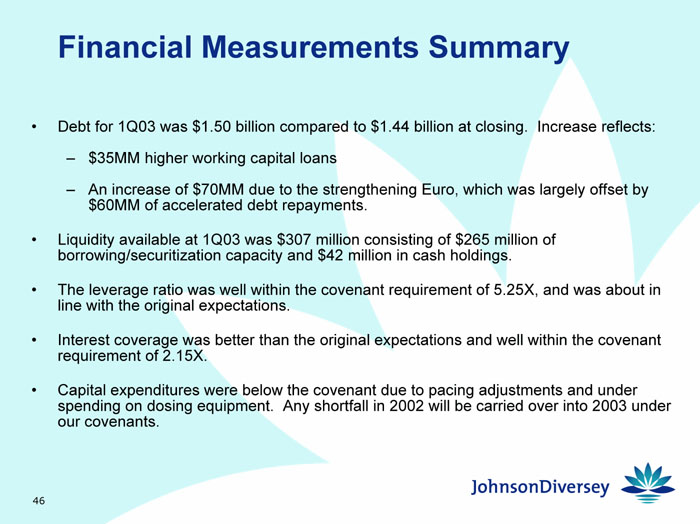
| • | Debt for 1Q03 was $1.50 billion compared to $1.44 billion at closing. Increase reflects: |
| — | $35MM higher working capital loans |
| — | An increase of $70MM due to the strengthening Euro, which was largely offset by $60MM of accelerated debt repayments. |
| • | Liquidity available at 1Q03 was $307 million consisting of $265 million of borrowing/securitization capacity and $42 million in cash holdings. |
| • | The leverage ratio was well within the covenant requirement of 5.25X, and was about in line with the original expectations. |
| • | Interest coverage was better than the original expectations and well within the covenant requirement of 2.15X. |
| • | Capital expenditures were below the covenant due to pacing adjustments and under spending on dosing equipment. Any shortfall in 2002 will be carried over into 2003 under our covenants. |
46
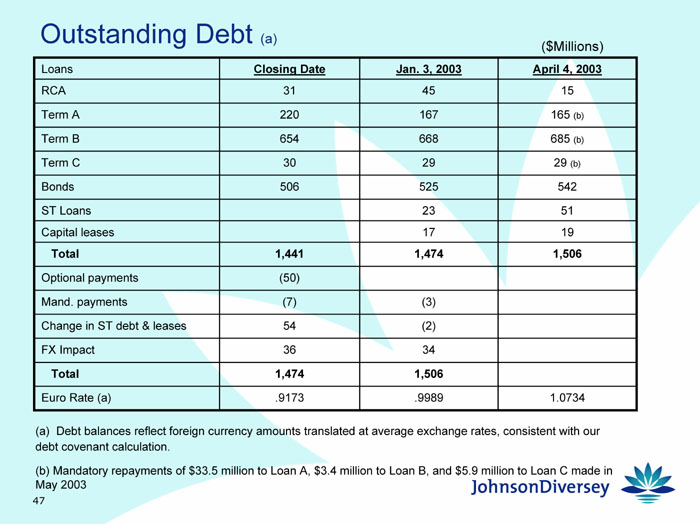
Outstanding Debt (a)
($Millions)
Loans | Closing Date | Jan. 3, 2003 | April 4, 2003 | |||
RCA | 31 | 45 | 15 | |||
Term A | 220 | 167 | 165 (b) | |||
Term B | 654 | 668 | 685 (b) | |||
Term C | 30 | 29 | 29 (b) | |||
Bonds | 506 | 525 | 542 | |||
ST Loans | 23 | 51 | ||||
Capital leases | 17 | 19 | ||||
Total | 1,441 | 1,474 | 1,506 | |||
Optional payments | (50) | |||||
Mand. payments | (7) | (3) | ||||
Change in ST debt & leases | 54 | (2) | ||||
FX Impact | 36 | 34 | ||||
Total | 1,474 | 1,506 | ||||
Euro Rate (a) | .9173 | .9989 | 1.0734 |
(a) Debt balances reflect foreign currency amounts translated at average exchange rates, consistent with our debt covenant calculation.
(b) Mandatory repayments of $33.5 million to Loan A, $3.4 million to Loan B, and $5.9 million to Loan C made in May 2003
47
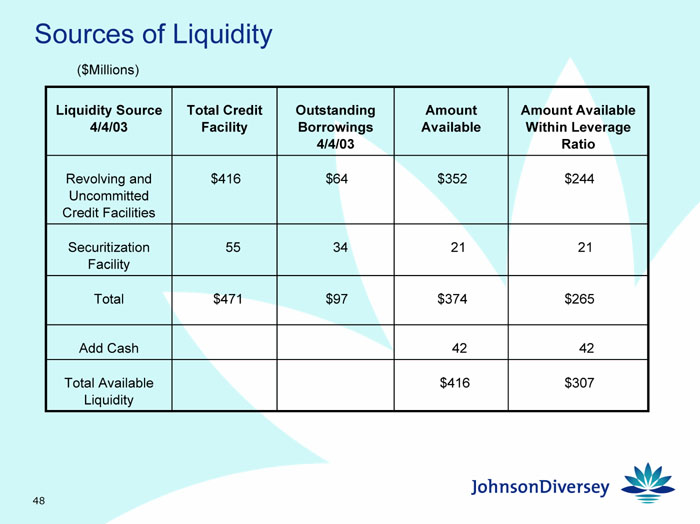
Sources of Liquidity
($Millions)
Liquidity Source4/4/03 | Total Credit Facility | Outstanding Borrowings 4/4/03 | Amount Available | Amount Available Within Leverage Ratio | ||||
Revolving and Uncommitted Credit Facilities | $416 | $64 | $352 | $244 | ||||
Securitization Facility | 55 | 34 | 21 | 21 | ||||
Total | $471 | $97 | $374 | $265 | ||||
Add Cash | 42 | 42 | ||||||
Total Available Liquidity | $416 | $307 |
48
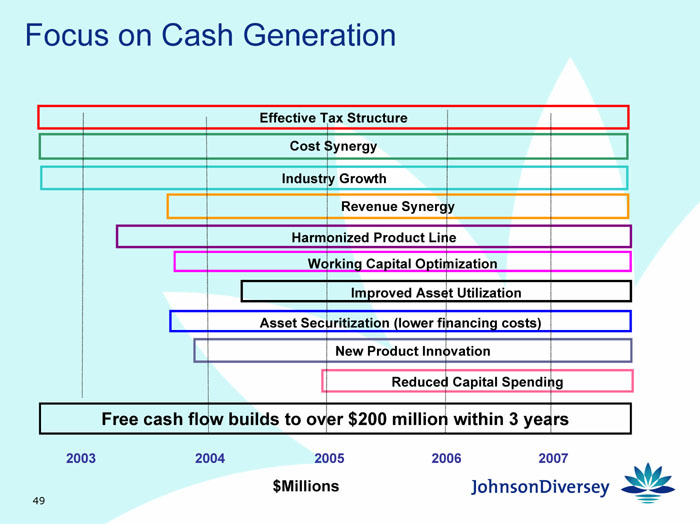
Focus on Cash Generation
Effective Tax Structure
Cost Synergy
Industry Growth
Revenue Synergy
Harmonized Product Line
Working Capital Optimization
Improved Asset Utilization
Asset Securitization (lower financing costs)
New Product Innovation
Reduced Capital Spending
Free cash flow builds to over $200 million within 3 years
2003 2004 2005 2006 2007
$Millions
49
Amendments to Senior Secured Credit Agreement
| • | Amendments to the Senior Secured Credit Agreement to be solicited by end of May 2003 |
| • | Proposed amendments largely administrative |
| • | No impact expected on debt repayment as contracted |
| • | Post-Closing settlements with Unilever for pension liabilities are still ongoing |
| • | Company expects support of bank group in light of positive financial results to date |
50
We define EBITDA as net income before minority interests, plus the provision for income taxes, net interest expense and depreciation and amortization expense and define EBITDA Margin as EBITDA plus restructuring charges and other one-time costs over Net Sales. EBITDA and, as a result, EBITDA Margin are non-GAAP financial measures, and you should not consider EBITDA and the related calculation of EBITDA Margin as an alternative to (a) operating profit (loss) or net income (loss) as a measure of our operating performance or (b) cash flows provided by operating, investing and financing activities (as determined in accordance with GAAP) as a measure of our ability to meet cash needs.
Our management considers EBITDA and EBITDA Margin to be useful tools for managing the operations of our business. In addition, various financial covenants contained in our senior secured credit facilities are based on EBITDA, as adjusted pursuant to the provisions of the facilities, and various financial covenants contained in the indentures for our senior subordinated notes are based on consolidated cash flows, which is a non-GAAP financial measure calculated similarly to EBITDA. Our management also considers EBITDA to be useful in assessing our debt servicing ability.
We also believe that EBITDA and EBITDA Margin are measures commonly reported and widely used by investors and other interested parties as a measure of a company’s operating performance and debt servicing ability because it assists in comparing performance on a consistent basis without regard to depreciation and amortization, which can vary significantly depending upon accounting methods or non-operating factors (such as historical cost). Accordingly, we believe that the reporting of EBITDA and EBITDA Margin permit a more comprehensive analysis of our operating performance relative to other companies and of our debt servicing ability. Because all companies do not calculate EBITDA identically, the presentation of EBITDA and EBITDA Margin herein may not be comparable to similarly titled measures of other companies.
We believe that net income is the financial measure calculated and presented in accordance with GAAP that is most directly comparable to EBITDA. The following table reconciles EBITDA to net income for each of the periods for which EBITDA is presented herein.
(000’s) | Fiscal Year Ended January 3, 2003 | Quarter Ended April 4, 2003 (unaudited) | ||||||
Net income | $ | 29,568 |
| $ | 3,182 |
| ||
Minority interests |
| (315 | ) |
| (1 | ) | ||
Provision for income taxes |
| 16,662 |
|
| 1,791 |
| ||
Interest expenses, net |
| 84,496 |
|
| 31,533 |
| ||
Depreciation and amortization expenses |
| 109,348 |
|
| 36,018 |
| ||
EBITDA | $ | 239,759 |
| $ | 72,523 |
| ||
The following table reconciles EBITDA before one-time costs to net income for Johnson Polymer for the fiscal year ended January 3, 2003:
Johnson Polymer (000’s) | Fiscal Year Ended January 3, 2003 | ||
Net income | $ | 22,111 | |
Minority interests |
| — | |
Provision for income taxes |
| 10,250 | |
Interest expenses, net |
| 442 | |
Depreciation and amortization expenses |
| 8,396 | |
EBITDA |
| 41,199 | |
Employee termination payment |
| 1,000 | |
Fees associated with asset securitization program |
| 1,896 | |
EBITDA before one-time costs | $ | 44,095 | |
51
The following table reflects the calculation of EBITDA Margin for the period for which EBITDA Margin is presented herein.
(000’s) | Quarter Ended April 4, 2003 (unaudited) | |||
EBITDA | $ | 72,523 |
| |
Restructuring costs charged to income |
| 6,509 |
| |
One-time period costs classified as cost of sales or marketing administrative and general expenses |
| 8,450 |
| |
EBITDA before one-time costs |
| 87,482 |
| |
Net sales | $ | 697,504 |
| |
EBITDA margin before one-time costs |
| 12.5 | % | |
52